Submitted:
11 November 2025
Posted:
12 November 2025
You are already at the latest version
Abstract
Heavy precipitation clustering is important for flood risk in Europe, but its description in reanalysis datasets is still uncertain. This study examined how well ERA5, ERA5-Land, and JRA-55 reproduce the size and timing of extreme precipitation from 1981 to 2022. Observations from the E-OBS dataset were used as reference, with heavy events defined as daily totals above the 95th percentile. Consecutive wet days were grouped into clusters, and measures such as mean cluster length (MCL) and mean gap between clusters (MGC) were used. Correlations between reanalysis and observed MCL were 0.58–0.63 across seasons, with mean absolute errors of 0.9–1.2 days. The largest bias was found in convective areas, where MGC was underestimated by up to 0.6 days. Sensitivity tests showed that thresholds and linking rules had stronger influence on clustering than the dataset used. The results show that reanalyses reproduce large-scale patterns but tend to underestimate storm duration and event order, which affects flood modeling. Better use of data, improved physical methods, and denser observation networks are needed to reduce these limits and support climate adaptation.
Keywords:
reanalysis datasets
; heavy precipitation
; clustering
; Europe
; flood risk
; hydrological modeling
; storm duration
1. Introduction
Extreme precipitation is one of the most damaging natural hazards in Europe, with severe consequences for ecosystems, infrastructure, and human safety [1,2]. The temporal clustering of heavy rainfall—defined as multiple intense events occurring in close succession—is particularly relevant for flood generation because saturated soils and reduced infiltration enhance runoff during consecutive storms [3]. Understanding such clustered behavior is therefore central to climate and water research, as multi-day storm sequences often exert stronger hydrological impacts than isolated events of similar magnitude. Reanalysis datasets, which combine observations with numerical weather prediction through data assimilation, provide spatially and temporally consistent climate fields and have been widely adopted for research on precipitation extremes, model evaluation, and hydrological applications [4]. Major reanalysis products such as ERA5, ERA5-Land, and MERRA-2 have been assessed for their representation of extreme precipitation, yet their skill varies considerably across regions, seasons, and intensity indices [5]. High-resolution reanalyses have improved spatial detail and local precipitation structure, but their performance in capturing event duration and persistence remains limited [6].Across Europe, evidence shows that reanalyses can reproduce broad-scale precipitation variability but tend to underestimate short-lived extremes and sequences of consecutive wet days [7]. For example, ERA5 captures mean precipitation fields reasonably well yet exhibits systematic biases in multi-day extreme indices [8]. Regional assessments, including studies in Mediterranean and Alpine environments, indicate that reanalyses underestimate cluster length and temporal variability, leading to uncertainty in hydrological modeling and flood-risk estimation [9]. Importantly, one evaluation reported substantial deficiencies in reproducing the temporal clustering of heavy precipitation across Europe, revealing pronounced inconsistencies in multi-day storm sequencing among reanalysis products [10]. These results highlight that although reanalyses are broadly suitable for investigating extremes, their ability to represent storm persistence remains uncertain, especially in regions with complex terrain or transitional climate regimes. Despite progress, important gaps remain [11]. Most existing evaluations emphasize the intensity or frequency of heavy precipitation, whereas the temporal ordering, persistence, and clustering of extremes have received comparatively limited attention [12]. Analyses are often confined to individual regions or to a single reanalysis product, constraining comparability across Europe’s diverse climate regimes [13,14]. Moreover, only few studies have quantified how uncertainties in reanalysis-based clustering estimates propagate into hydrological modeling or flood-risk assessments. The spatial heterogeneity of model performance across European subregions—for example, between Atlantic-influenced western areas, continental interiors, and Mediterranean regions—also remains insufficiently explored, despite expected differences in storm persistence driven by contrasting circulation patterns.
The study provides a systematic evaluation of temporal clustering of heavy precipitation across Europe using multiple reanalysis datasets. We compare reanalysis fields with station-based observations to assess their ability to reproduce observed storm sequences, examine regional variability in performance, and identify systematic biases. By clarifying the strengths and limitations of reanalysis products in representing storm persistence, this work highlights where improvements in data-assimilation systems and physical parameterizations are most needed to support more reliable hydrological modeling and flood-risk management under a changing climate.
2. Materials and Methods
2.1. Study Area and Sample Description
The study covered Europe from the Atlantic coast to the eastern continental zone, including plains and mountain regions. Daily precipitation data from 1981 to 2022 were taken from the E-OBS dataset at 0.25° resolution. More than 1,800 meteorological stations were used for verification. Heavy precipitation events were defined as daily totals above the 95th percentile for each grid cell. In total, about 11,500 events were identified and used for clustering analysis.
2.2. Experimental Design and Control Setup
Three reanalysis datasets—ERA5, ERA5-Land, and JRA-55—were compared with observations. Each reanalysis dataset was treated as a test group, while E-OBS served as the control. The same thresholds and clustering measures were applied to all groups. To account for regional differences, the analysis was divided into four climate zones: Atlantic, Continental, Mediterranean, and Alpine. This design allowed differences to be linked to dataset performance rather than calculation steps.
2.3. Measurement Methods and Quality Control
Observed data were checked for completeness. Short gaps of up to two days were filled by linear interpolation from adjacent values, while longer gaps were removed. Outliers were detected with percentile filters and confirmed with station metadata. Reanalysis datasets were converted to the E-OBS 0.25° grid using bilinear interpolation. All time series were checked for continuity, and records with gaps longer than five days were excluded. These procedures produced consistent datasets for comparison.
2.4. Data Processing and Model Formulation
Consecutive days above the 95th percentile were grouped into clusters. From these clusters, the mean cluster length (MCL) and the mean gap between clusters (MGC) were calculated. A linear regression model was used to compare observed and reanalysis indices:
where is the observed index, is the reanalysis index, and is the error. Performance was also measured with the Nash–Sutcliffe Efficiency (NSE) [15]:
where are observed values, are reanalysis values, and is the observed mean.
2.5. Statistical Analysis
Bias, mean absolute error (MAE), and root mean square error (RMSE) were used to measure the accuracy of each reanalysis dataset. Confidence intervals for clustering measures were estimated with bootstrap resampling using 1,000 iterations. Paired t-tests at the 95 % confidence level were used to test differences. All analyses were performed with Python 3.10 and MATLAB R2023a.
3. Results and Discussion
3.1. Overall Performance and Robustness
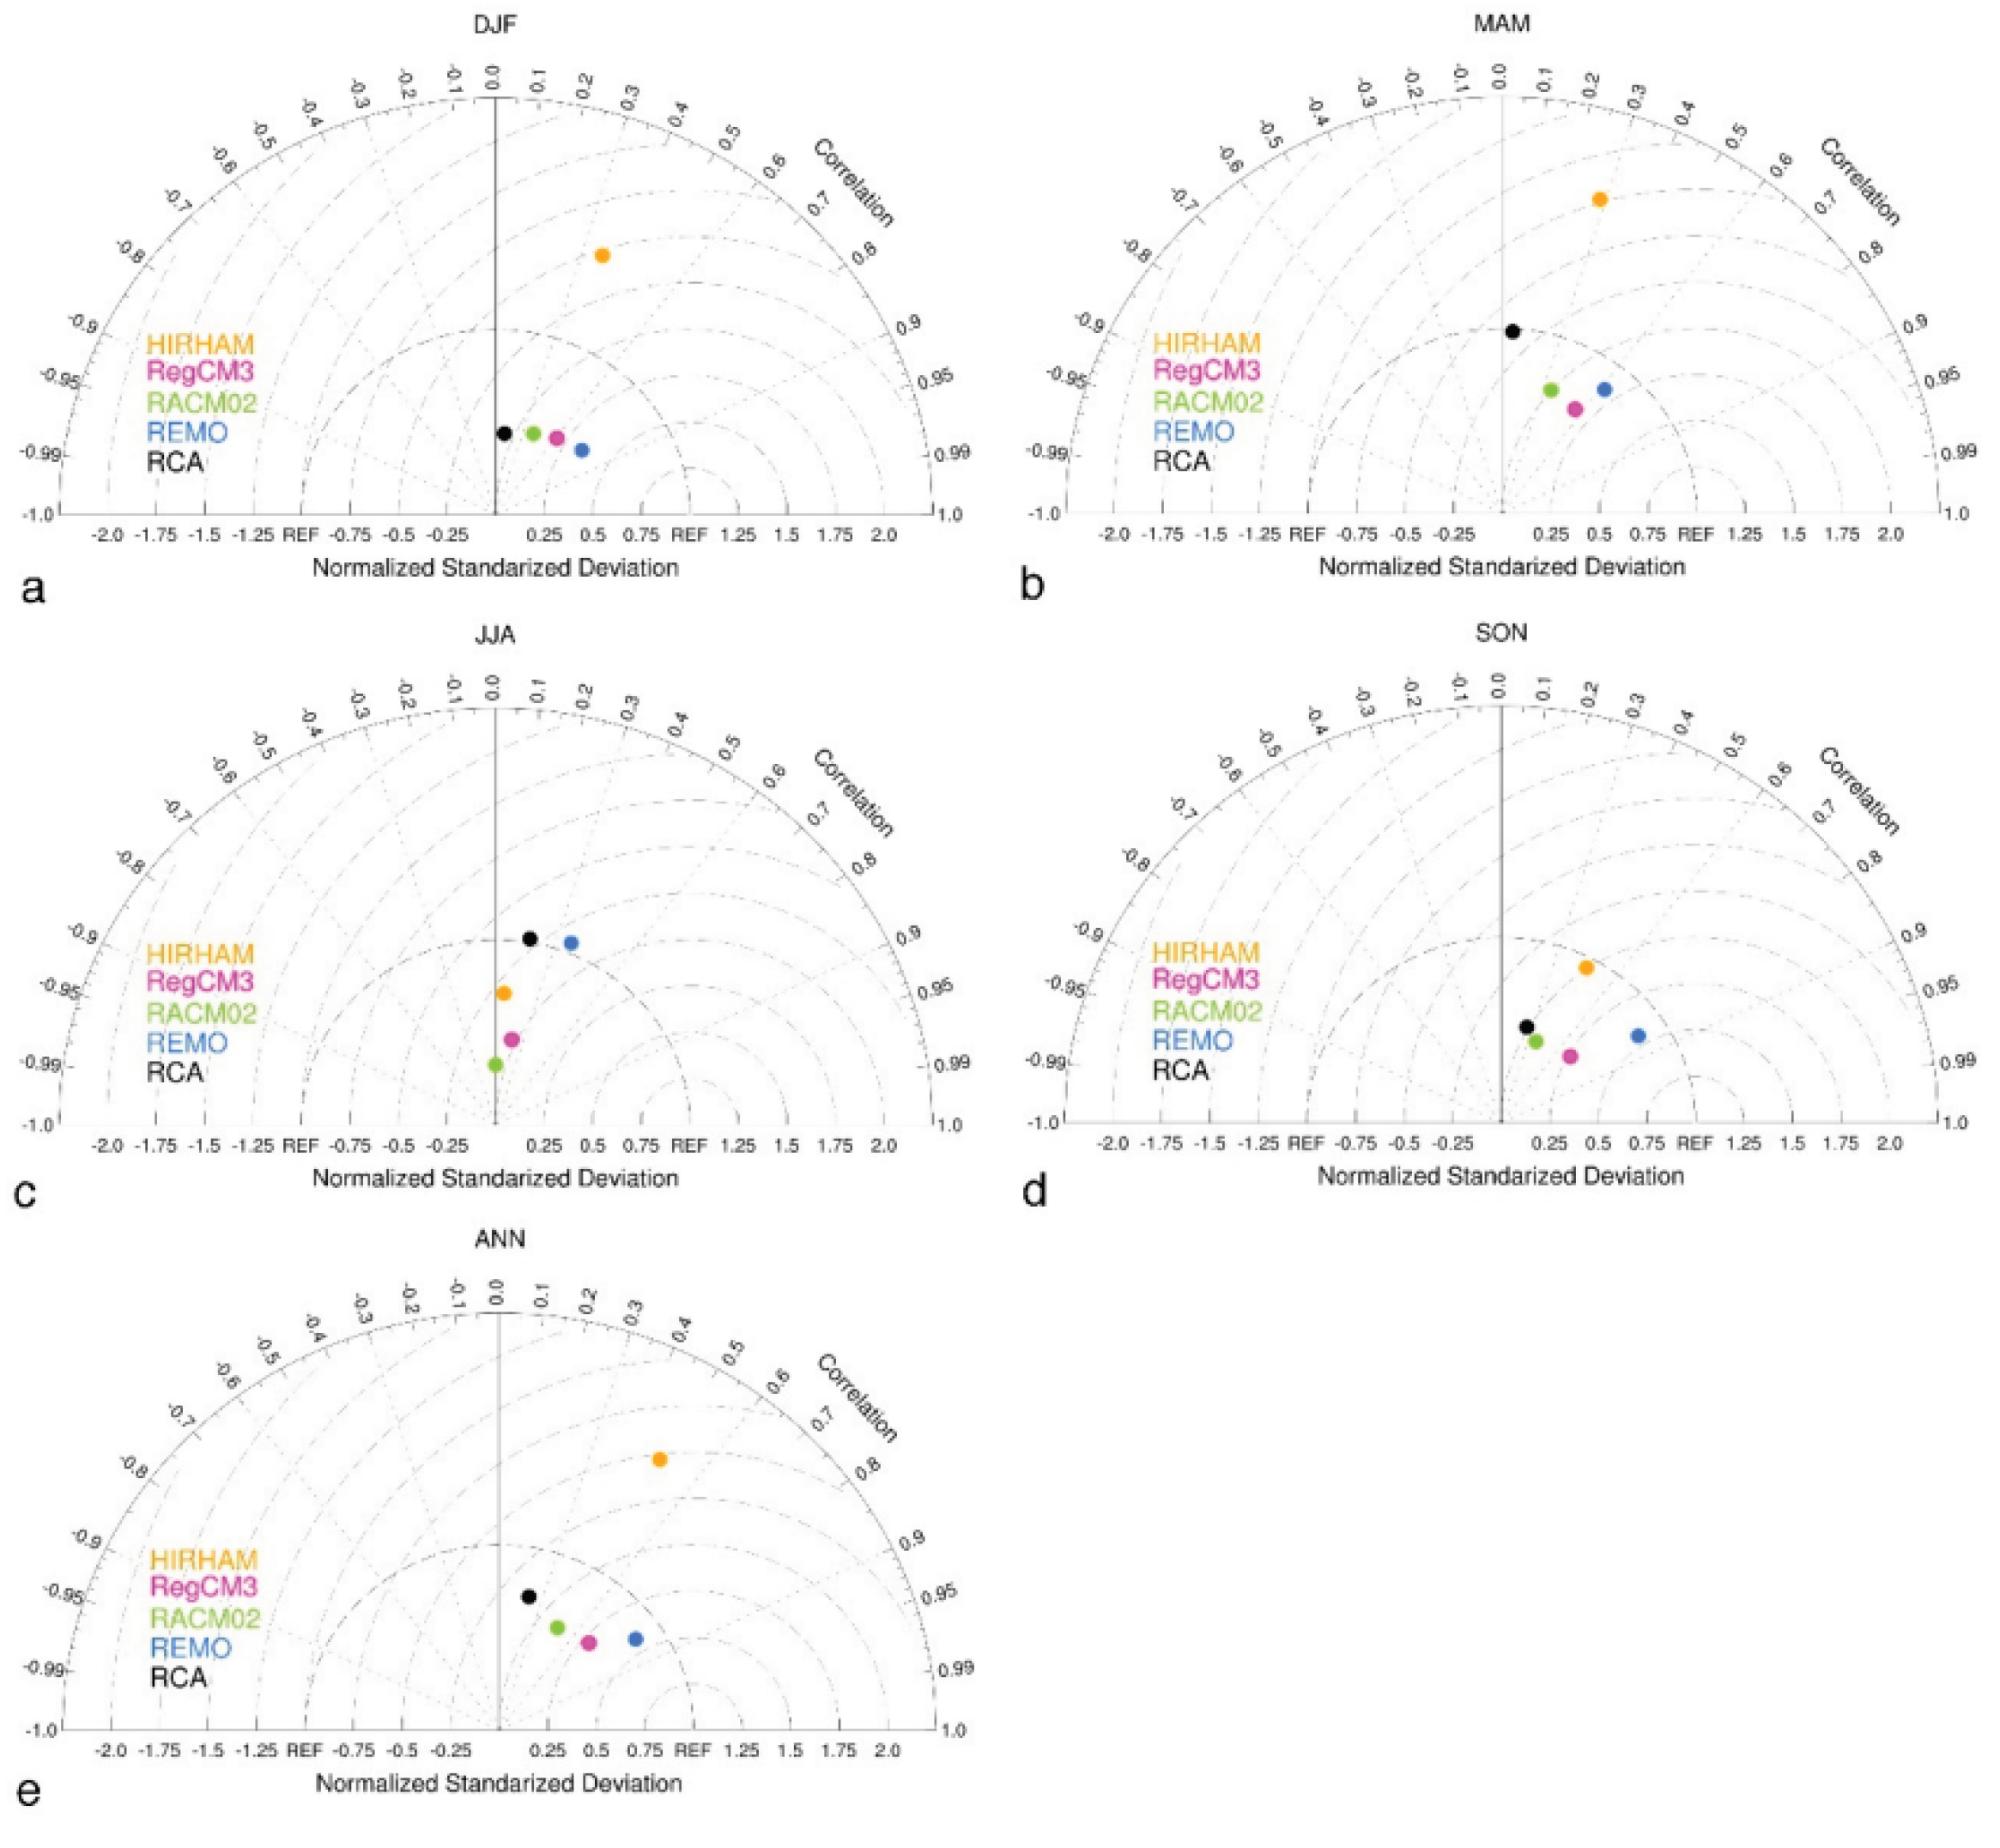
Across Europe, the reanalysis datasets reproduced the general frequency of heavy precipitation clusters but showed differences by season and region. Compared with station-based indices, the mean cluster length (MCL) correlation was 0.63 in spring and 0.58 in autumn, with a mean absolute error of 0.9–1.2 days. The mean gap between clusters (MGC) was more difficult to reproduce in summer, with a bias of −0.6 days in convective regions, which indicates a tendency to separate multi-day events into single days. Similar results have been reported in studies of mountainous regions, where Taylor diagrams show moderate correlation and large spread across models [16].
Figure 1.
Taylor diagram comparing observed and simulated seasonal precipitation in the Pindus area.
Figure 1.
Taylor diagram comparing observed and simulated seasonal precipitation in the Pindus area.
3.2. Ablation and Module Contribution
Sensitivity experiments showed that the event threshold and linking window influenced clustering more than the reanalysis dataset itself. When the threshold was raised from R95p to R99p, the number of clusters dropped by 28–35%, while the mean cluster length increased by 0.4–0.7 days. Reducing the linking window from two to one day raised the count of short clusters and lowered MCL by about 0.5 days in maritime areas, while continental zones were less affected. Adding elevation-based downscaling reduced wet-day bias in mountain areas by 12–18% and increased the Nash–Sutcliffe Efficiency for MCL from 0.42 to 0.55. This shows that topographic gradients explain part of the error. These findings agree with earlier works that show better results when spatial variation is resolved, while also pointing out that temporal definitions strongly affect persistence results [17,18].
3.3. Spatiotemporal Generalization and Scenario Transfer
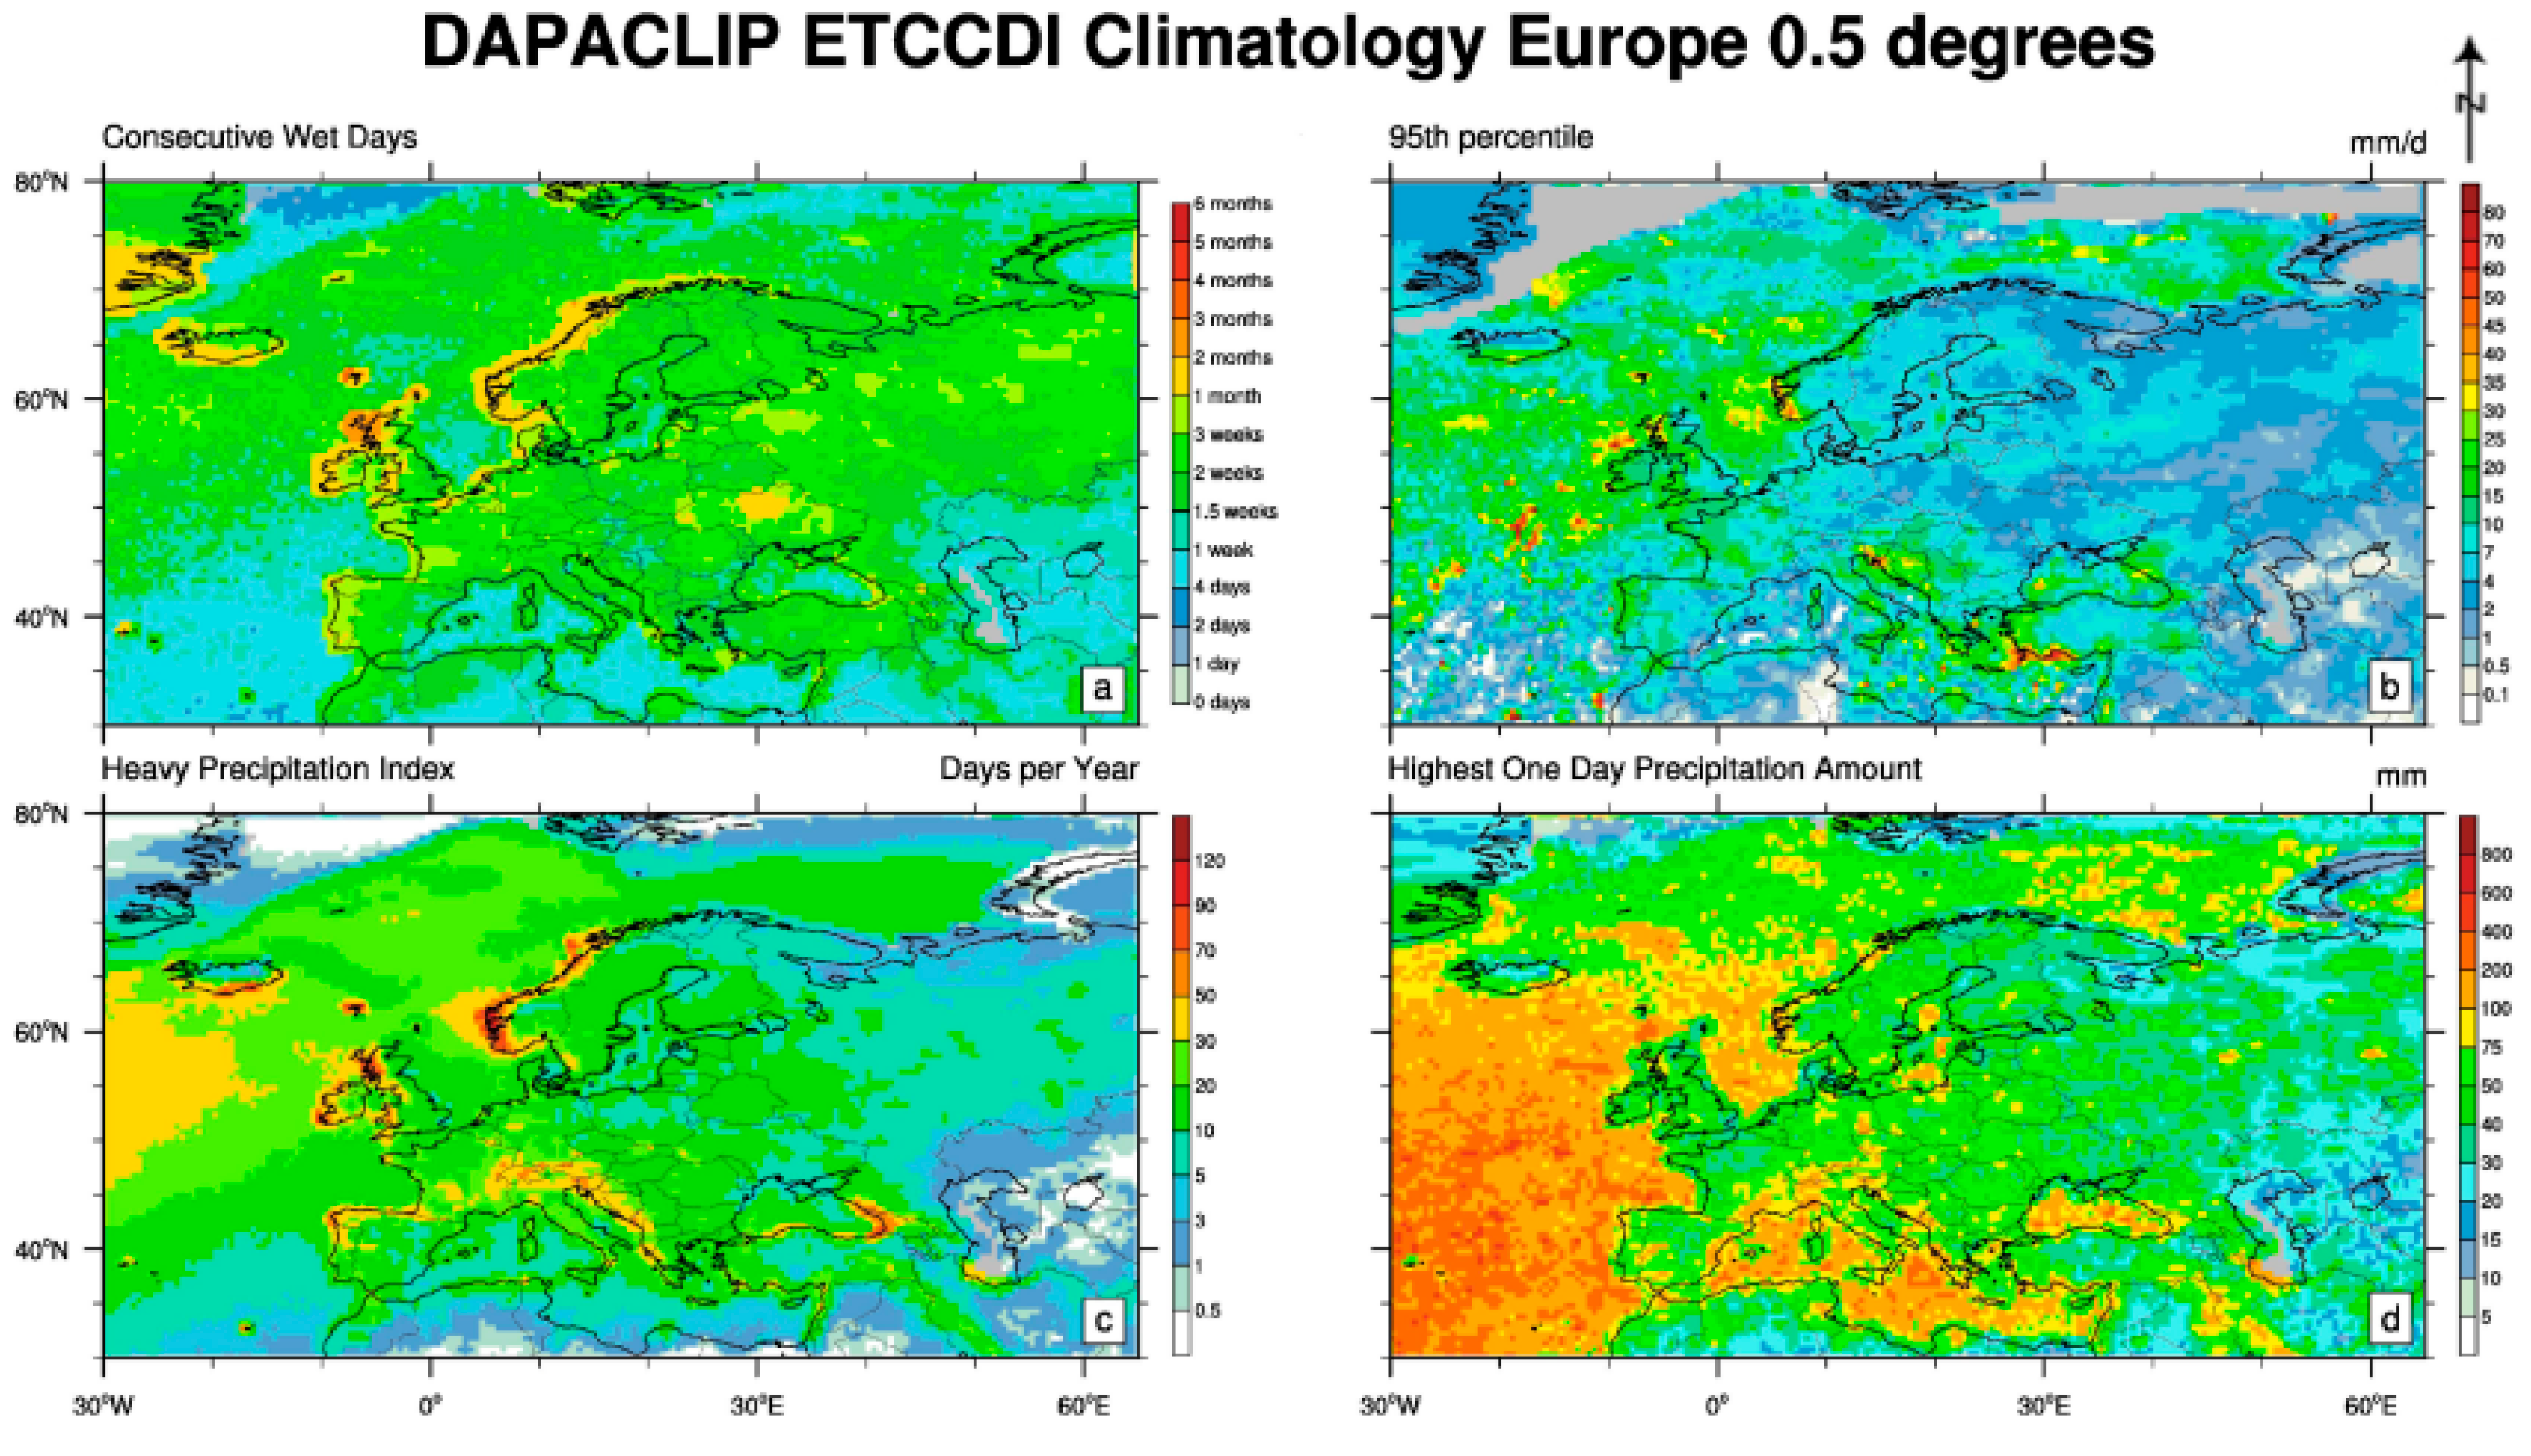
The spatial pattern of errors followed the known climate of wet spells. The datasets reproduced long wet spells along the Norwegian coast and the North Atlantic, but they underestimated multi-day rainfall linked to cut-off lows in the Mediterranean. When compared with a Europe-wide ETCCDI map of consecutive wet days, high values in Norway and the Atlantic-facing coasts were well captured, but cluster duration was underestimated in the Adriatic and Balkan regions (Fig.2). Transfer tests showed that moving from Atlantic to Mediterranean regions reduced correlation for MCL by about 0.1, while transfers within maritime regions maintained skill. This suggests that storm dynamics, rather than sample size, explain most of the error [19].
Figure 2.
Map of consecutive wet days across Europe based on ETCCDI indices.
3.4. Comparative Insights and Limitations
The results show that reanalysis-based methods can describe when and where heavy rainfall groups into multi-day episodes, but they are less accurate for convective storms and small-scale lows in southern Europe. Compared with earlier regional assessments, the biases here fall within the known model spread, but persistence metrics are more sensitive to temporal definitions than intensity indices [20]. Two main limits remain. First, cluster metrics depend on the accuracy of reference data, and gridded products reduce gauge density, which may smooth extreme events. Second, the tested models are limited in resolution and parameter choices, so the findings should be seen as general directions. Future work should use convection-permitting downscaling, denser station networks, and standardized definitions of event clusters to reduce artificial differences.
4. Conclusion
The study of reanalysis datasets for heavy precipitation clustering across Europe shows that they reproduce broad spatial patterns of extremes but often underestimate the duration and order of multi-day events, especially in areas with complex terrain and convective storms. By focusing on temporal clustering instead of single extremes, this work adds new evidence on how reanalyses describe storm duration, which is a key factor for compound flood risk. The results show that event thresholds, linking rules, and resolution have strong effects on clustering measures, while biases in storm duration remain a clear limit. The main value of this study is to point out both the strengths and the limits of present reanalysis products in simulating consecutive wet days. These findings are useful for flood modeling, hydrological planning, and climate adaptation, where information on storm duration is important. Still, the work is limited by sparse station coverage, smoothing in gridded data, and the small number of datasets tested. Future studies should extend to higher-resolution reanalyses, denser observation networks, and common event definitions to reduce uncertainty and improve the use of reanalysis data in flood risk management.
References
- Forzieri, G.; Bianchi, A.; e Silva, F.B.; Herrera, M.A.M.; Leblois, A.; Lavalle, C.; Feyen, L. Escalating impacts of climate extremes on critical infrastructures in Europe. Global environmental change 2018, 48, 97–107. [Google Scholar] [CrossRef] [PubMed]
- Kron, W.; Löw, P.; Kundzewicz, Z.W. Changes in risk of extreme weather events in Europe. Environmental Science & Policy 2019, 100, 74–83. [Google Scholar] [CrossRef]
- Sun, X.; Meng, K.; Wang, W.; Wang, Q. Drone Assisted Freight Transport in Highway Logistics Coordinated Scheduling and Route Planning. In 2025 4th International Symposium on Computer Applications and Information Technology (ISCAIT) (pp. 1254–1257). IEEE 2025.
- Cristiano, E.; ten Veldhuis, M.C.; Van De Giesen, N. Spatial and temporal variability of rainfall and their effects on hydrological response in urban areas–a review. Hydrology and Earth System Sciences 2017, 21, 3859–3878. [Google Scholar] [CrossRef]
- Whitmore, J.; Mehra, P.; Yang, J.; Linford, E. Privacy Preserving Risk Modeling Across Financial Institutions via Federated Learning with Adaptive Optimization. Frontiers in Artificial Intelligence Research 2025, 2, 35–43. [Google Scholar] [CrossRef]
- Bador, M.; Boé, J.; Terray, L.; Alexander, L.V.; Baker, A.; Bellucci, A.; Vanniere, B. Impact of higher spatial atmospheric resolution on precipitation extremes over land in global climate models. Journal of Geophysical Research: Atmospheres 2020, 125, e2019JD032184. [Google Scholar] [CrossRef]
- Wang, Y.; Shen, M.; Wang, L.; Wen, Y.; Cai, H. Comparative Modulation of Immune Responses and Inflammation by n-6 and n-3 Polyunsaturated Fatty Acids in Oxylipin-Mediated Pathways. 2024.
- Rasmussen, D. J . Multivariate Bias Correction of ERA5 Using in-situ Observations for Planning and Engineering. Authorea Preprints. 2025.
- Keller, L.; Zischg, A.P.; Mosimann, M.; Rössler, O.; Weingartner, R.; Martius, O. Large ensemble flood loss modelling and uncertainty assessment for future climate conditions for a Swiss pre-alpine catchment. Science of the Total Environment 2019, 693, 133400. [Google Scholar] [CrossRef] [PubMed]
- Yang, Z.; Villarini, G. Evaluation of the capability of global climate models in reproducing the temporal clustering in heavy precipitation over Europe. International Journal of Climatology 2021, 41, 131–145. [Google Scholar] [CrossRef]
- Zwiers, F.W.; Alexander, L.V.; Hegerl, G.C.; Knutson, T.R.; Kossin, J.P.; Naveau, P.; Zhang, X. Climate extremes: challenges in estimating and understanding recent changes in the frequency and intensity of extreme climate and weather events. In Climate science for serving society: research, modeling and prediction priorities (pp. 339–389). Dordrecht: Springer Netherlands. 2013.
- Westra, S.; Fowler, H.J.; Evans, J.P.; Alexander, L.V.; Berg, P.; Johnson, F.; Roberts, N. Future changes to the intensity and frequency of short-duration extreme rainfall. Reviews of geophysics 2014, 52, 522–555. [Google Scholar] [CrossRef]
- Wang, C.; Chakrapani, V. Environmental Factors Controlling the Electronic Properties and Oxidative Activities of Birnessite Minerals. ACS Earth and Space Chemistry 2023, 7, 774–787. [Google Scholar] [CrossRef]
- Al Shafian, S.; He, C.; Hu, D. DamageScope: An Integrated Pipeline for Building Damage Segmentation, Geospatial Mapping, and Interactive Web-Based Visualization. Remote Sensing 2025, 17, 2267. [Google Scholar] [CrossRef]
- Melsen, L.A.; Puy, A.; Torfs, P.J.; Saltelli, A. The rise of the Nash-Sutcliffe efficiency in hydrology. Hydrological Sciences Journal 2025, 1–12. [Google Scholar] [CrossRef]
- Pepin, N.C.; Arnone, E.; Gobiet, A.; Haslinger, K.; Kotlarski, S.; Notarnicola, C.; Adler, C. Climate changes and their elevational patterns in the mountains of the world. Reviews of geophysics 2022, 60, e2020RG000730. [Google Scholar] [CrossRef]
- Moritz, M.A.; Parisien, M.A.; Batllori, E.; Krawchuk, M.A.; Van Dorn, J.; Ganz, D.J.; Hayhoe, K. Climate change and disruptions to global fire activity. Ecosphere 2012, 3, 1–22. [Google Scholar] [CrossRef]
- Xu, K.; Lu, Y.; Hou, S.; Liu, K.; Du, Y.; Huang, M. ; Sun XDetecting anomalous anatomic regions in spatial transcriptomics with, S. T.A.N.D.S. Nature Communications 2024, 15, 8223. [Google Scholar] [CrossRef] [PubMed]
- Drobinski, P.; Bastin, S.; Arsouze, T.; Béranger, K.; Flaounas, E.; Stefanon, M. North-western Mediterranean sea-breeze circulation in a regional climate system model. Climate Dynamics 2018, 51, 1077–1093. [Google Scholar] [CrossRef]
- Tuel, A.; Martius, O. Weather persistence on sub-seasonal to seasonal timescales: a methodological review. Earth System Dynamics, 2023, 14, 955–987. [Google Scholar]
Disclaimer/Publisher’s Note: The statements, opinions and data contained in all publications are solely those of the individual author(s) and contributor(s) and not of MDPI and/or the editor(s). MDPI and/or the editor(s) disclaim responsibility for any injury to people or property resulting from any ideas, methods, instructions or products referred to in the content. |
© 2025 by the authors. Licensee MDPI, Basel, Switzerland. This article is an open access article distributed under the terms and conditions of the Creative Commons Attribution (CC BY) license (http://creativecommons.org/licenses/by/4.0/).
Copyright: This open access article is published under a Creative Commons CC BY 4.0 license, which permit the free download, distribution, and reuse, provided that the author and preprint are cited in any reuse.


