Submitted:
10 November 2025
Posted:
11 November 2025
You are already at the latest version
Abstract
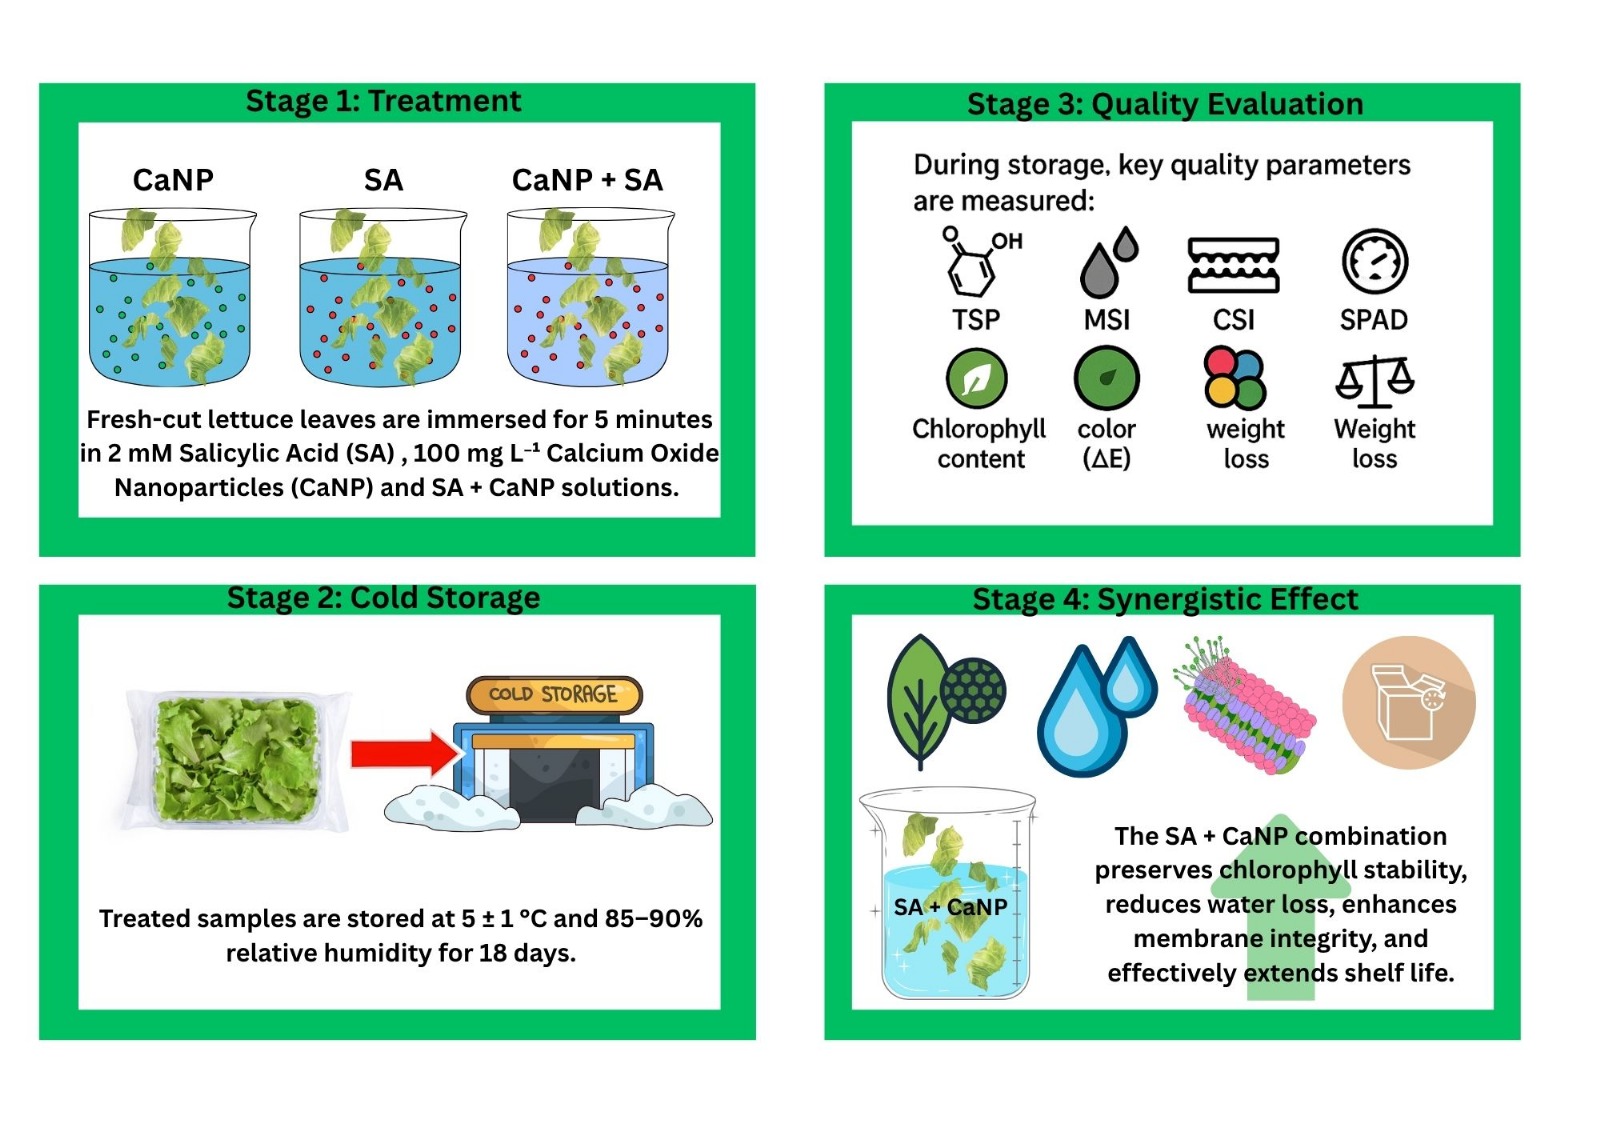
Fresh-cut lettuce rapidly deteriorates during storage, and developing safe strategies to maintain its quality is critical. This study evaluated the effects of 2 mM salicylic acid (SA), 100 mg L⁻¹ calcium oxide nanoparticles (CaNP), and their combination (CaNP + SA) on the physiological and biochemical quality of fresh-cut Lactuca sativa L. var. crispa stored for 18 days at 5 ± 1 °C. Treatments were assessed through measurements of total soluble phenolics (TSP), membrane stability index (MSI), chlorophyll components (Chl a, Chl b, Total Chl), chlorophyll stability index (CSI), SPAD, weight loss (WL), cutting resistance (CR), and color parameters. Both SA and CaNP + SA significantly delayed senescence and oxidative degradation compared with the control. The CaNP + SA combination showed the most comprehensive protection, exhibiting the lowest WL (3.91%) and the highest MSI and CSI values, indicating enhanced membrane integrity and pigment stability. SA alone maintained elevated TSP, SPAD, and chlorophyll contents, supporting its antioxidative and metabolic regulatory roles. Correlation analysis revealed strong positive relationships among MSI, CSI, SPAD, and chlorophyll variables, while WL and CR were negatively associated with these traits. PCA clearly separated treatments, with SA and CaNP + SA clustering with stability-related parameters. Overall, CaNP + SA effectively preserved membrane function, pigment structure, and water balance, representing a promising postharvest strategy for extending the shelf life of fresh-cut lettuce.
Keywords:
chlorophyll stability
; cold storage
; fresh-cut lettuce
; Lactuca sativa
; membrane integrity
; phenolic compounds
; postharvest quality
; water losses
1. Introduction
The fresh-cut fruit and vegetable industry has experienced remarkable economic expansion in recent years, showing an annual growth rate of approximately 5–10% over the past decade. Lettuce-based products alone account for nearly 50% of this market segment. However, tissue browning remains one of the most critical physiological disorders limiting the visual quality and consumer acceptance of fresh-cut lettuce [1] (Charles et al., 2018). Although enzymatic discoloration at cut surfaces is part of the plant’s natural wound-healing response, the development of pink or brown hues is perceived by consumers as a visual defect and a sign of deterioration [2] (Peng and Simko, 2023).
Cutting operations trigger the oxidation of phenolic compounds by polyphenol oxidase (PPO), resulting in tissue browning and rapid quality degradation. Mechanical injury accelerates respiration and enzymatic activity, significantly shortening shelf life. To mitigate browning and preserve postharvest quality, several chemical and physical strategies have been explored, including reducing agents, enzyme inhibitors, modified atmosphere packaging (MAP) systems [3] (Choi et al., 2021), heat treatments, ultraviolet (UV) irradiation, and continuous or intermittent light exposure. In recent years, environmentally sustainable alternatives such as salicylic acid (SA) and calcium (Ca) treatments have gained increasing attention due to their effectiveness and low chemical residue concerns.
Salicylic acid is a naturally occurring phenolic signaling molecule that plays a pivotal role in regulating plant growth, development, and defense responses to both biotic and abiotic stresses [4] (Morillo et al., 2025). During the postharvest period, SA has been shown to delay senescence and softening by modulating multiple physiological and biochemical pathways and enhancing antioxidant activity [5] (Abdelkader et al., 2022). Nawarathna and Eeswara [6] (2025) reported that applying 100 mg L⁻¹ SA to lettuce effectively maintained higher levels of phenolic compounds and reduced deterioration after seven days of storage at 4°C.
Similarly, exogenous calcium treatments are widely used to preserve tissue firmness in fresh-cut produce. Calcium strengthens cell wall integrity by cross-linking pectin molecules in the middle lamella, forming calcium pectates that maintain cellular cohesion. Consequently, calcium application helps preserve firmness, minimize chlorophyll and protein degradation, and delay tissue senescence during storage [7] (De Corato, 2020). Morillo et al. [4] (2025) further demonstrated that applying 2% CaCl₂ + 2 mM SA significantly reduced weight loss in minimally processed lettuce, whereas CaCl₂ alone effectively delayed the decline in total Chl and vitamin C content.
Recently, nano-sized calcium formulations have emerged as promising alternatives to conventional calcium salts. Cid-López et al. [8] (2021) reported that calcium nanoparticles (CaNPs) enhanced surface brightness, reduced weight loss, and maintained the physicochemical and visual quality of cucumber fruits. Similarly, the combined application of 2 mM CaNPs and SA minimized weight loss and electrolyte leakage, thereby maintaining overall postharvest quality [5] (Abdelkader et al., 2022). Despite these advances, studies examining the effects of SA and CaNPs on fresh-cut lettuce remain limited, and no research has yet investigated their combined effects.
The present study aimed to evaluate the individual and synergistic effects of salicylic acid and calcium nanoparticles on the visual and biochemical quality attributes of fresh-cut lettuce during storage at 5°C. This work represents one of the first attempts to elucidate the combined influence of SA and CaNPs on minimally processed lettuce and provides novel insights into their potential to enhance quality retention and extend shelf life in fresh-cut vegetables.
2. Materials and Methods
Plant Material
In this study, the curly lettuce (Lactuca sativa L. var. crispa) cultivar was used as the plant material. The lettuce plants were grown under soilless culture conditions using the deep flow technique (DFT) hydroponic system. A nutrient solution specifically formulated for lettuce, whose composition is presented in Table 1, was used throughout the cultivation period. During the experiment, the pH of the nutrient solution was maintained at 6.5 by adjusting with diluted hydrochloric acid (HCl).
Chemicals Used
In this study, calcium oxide nanoparticles (CaNP) with a purity of 99.95% and a particle size range of 10–70 nm were obtained from PARS Chemical Co. (Turkiye). Salicylic acid (SA) with 99% purity (CAS No: 69-72-7; EC No: 200-712-3) was used for the treatments.
Fresh-Cutting Process and Treatments
After harvest, the lettuce heads were immediately transported to the laboratory. The outer yellowish leaves at the basal part of the plants were carefully removed (Figure 1a). Subsequently, the outer leaves surrounding the developing inner leaves were transversely cut at approximately 4 cm intervals (Figure 1b). Following the cutting process, the lettuce leaves were subjected to the treatments described below and then air-dried at room temperature (Figure 1c).

Table 2.
Description of postharvest treatments applied to fresh-cut lettuce samples prior to cold storage.
Table 2.
Description of postharvest treatments applied to fresh-cut lettuce samples prior to cold storage.
| Treatment | : | Description |
| Control (C) | : | Fresh-cut lettuce leaves were immersed in tap water for 5 min and then air-dried at room temperature. |
| Salicylic acid (SA) | : | Fresh-cut lettuce leaves were immersed in 2 mM SA solution for 5 min and then air-dried at room temperature. |
| Calcium Nanoparticle (CaNP) | : | Fresh-cut lettuce leaves were immersed in 100 mg L⁻¹ CaNP solution for 5 min and then air-dried at room temperature. |
| SA+CaNP | : | Fresh-cut lettuce leaves were immersed in a combined solution containing 2 mM SA and 100 mg L⁻¹ CaNP for 5 min and then air-dried at room temperature |
Packaging and Cold Storage Conditions
After air-drying at room temperature, fresh-cut lettuce leaves from all treatments were placed into lidded PET containers (dimensions: 8.5×9.0×6.5 cm), each containing 50 g of sample (Figure 2). The containers were then stored in a cold room at 5±1°C and 85–90% relative humidity for 18 days. During the storage period, samples were taken on days 0, 3, 6, 9, 12, 15, and 18 for subsequent quality analyses.
Total Soluble Phenolic Content (TSP)
After extracting the juice from the lettuce leaves, 150 µL of the extract was mixed with 2400 µL of distilled water and 150 µL of Folin–Ciocalteu reagent (1:10 dilution). The mixture was vortexed for 30–40 s and allowed to stand for 4 min. Subsequently, 300 µL of 1 N sodium carbonate (Na₂CO₃) was added, and the samples were incubated for 2 h at room temperature in the dark. The absorbance was measured at 725 nm using a UV–Vis spectrophotometer. The total phenolic content was expressed as mg caffeic acid equivalent (CAE) per 100 mL of extract [10] (Chavez-Santiago et al., 2021).
Membrane Stability Index (MSI)
The Membrane Stability Index (MSI) was determined to assess the degree of cell membrane injury caused by freezing–thawing stress, based on the method described by Nabati et al. [11] (2023). Leaf discs were taken from each treatment and rinsed twice with 50 mL of distilled water. The samples were then incubated in 50 mL of distilled water for 2 h at room temperature, and the initial electrical conductivity (C₁) was recorded. Subsequently, the samples were frozen at –18°C for 24 h, thawed at room temperature, and when the solution temperature exceeded 18°C, the second conductivity (C₂) was measured. The MSI (%) was calculated using the following formula:
The obtained MSI values were evaluated as an indicator of membrane permeability. Higher MSI values indicate better preservation of membrane integrity, while lower values correspond to increased membrane injury. All measurements were conducted in triplicate, and the results are presented as mean ± standard deviation (SD).
Cutting Resistance (N)
To evaluate the effect of treatments on maintaining leaf turgor at the beginning and throughout the storage period, the cutting resistance of fresh-cut lettuce leaves was measured. For each replicate, three leaf samples were analyzed using a texture analyzer (Shimadzu EZ-LX, Shimadzu Corp., Japan) equipped with a Warner–Bratzler cutting blade. The force required to cut the leaf surface was recorded in Newtons (N) and used as an indicator of tissue firmness or crispness.
Weight Loss (%)
Weight measurements were performed on the same samples at each sampling interval for all treatments. The percentage of weight loss during storage was calculated using the following equation:
where W₀ is the initial sample weight and Wₜ is the sample weight at each storage interval.
Total Soluble Solids (TSS) Content
For the determination of total soluble solids (TSS), juice extracted from lettuce leaves of each treatment group was analyzed using a digital refractometer (Atago Co., Ltd., Japan). The TSS content was expressed as a percentage (%).
Chlorophyll a, b, and Total Chlorophyll Content
Fresh lettuce samples (0.5 g) were homogenized with 10 mL of 80% acetone. The homogenate was centrifuged at 10,000 rpm for 15 min at 4°C, and the supernatant was collected for analysis. Absorbance was measured at 645 nm and 663 nm using a spectrophotometer, and the chlorophyll a, chlorophyll b, and total chlorophyll contents were calculated using the equations described by Ngcobo et al. [12] (2024).
The chlorophyll (chl-a, chl-b and total chl) concentration (mg g⁻¹ FW) was calculated using the absorbance readings obtained from the spectrophotometer according to the following equation:
where: C represents the chlorophyll (Chl) a, Chl b, and total Chl content (mg g⁻¹ FW), V is the volume of extract (L), and FW denotes the fresh weight of the sample (g).
Chlorophyll Stability Index (CSI, %)
The Chlorophyll Stability Index (CSI) was determined to evaluate the extent of degradation of chlorophyll pigments during the postharvest storage period, following the method of Ngcobo et al. [12] (2024). The CSI was calculated based on the difference between the chlorophyll content of freshly cut samples and those measured at each storage interval (3, 6, 9, 12, 15, and 18 days). A higher CSI value indicates greater chlorophyll stability and, consequently, better maintenance of green color during storage.
Relative Chlorophyll Content (SPAD)
The relative chlorophyll content of fresh-cut lettuce was determined using a SPAD-502 Plus chlorophyll meter (Konica Minolta, Inc., Osaka, Japan). Measurements were taken from one point on each of five leaves per replicate, and the mean SPAD value was recorded for each treatment.
Color Measurements
The surface color of lettuce leaves was measured using a colorimeter (Minolta CR-400, Minolta Co., Osaka, Japan). Measurements were taken from the adaxial surface of five leaf samples per replicate, and color parameters were expressed as L* (lightness), a* (red–green), and b* (yellow–blue) values. Based on these primary color coordinates, hue angle (°), Chroma (C), total color difference (ΔE), and yellowness index (YI) were calculated using the following equation:
where: L* (lightness), a* (red–green), and b* (yellow–blue) values.
Statistical Analysis
The experiment was conducted in a completely randomized design (CRD) with three replicates. For each replicate, three packages of fresh-cut lettuce were used, and each package contained a constant weight of 50 g of lettuce leaves. The obtained data were subjected to analysis of variance (ANOVA) using SPSS software version 16.0 (SPSS Inc., Chicago, IL, USA). Differences among treatment means were determined using Duncan’s Multiple Range Test (DMRT) at a significance level of p<0.05. Additionally, Principal Component Analysis (PCA) and Pearson correlation analyses were performed using Python software (v.3.13) to evaluate the relationships among quality parameters and treatment effects throughout the storage period.
3. Results and Discussion
According to the analysis of variance (ANOVA), treatment, storage duration, and their interaction significantly affected most of the physicochemical and physiological parameters of fresh-cut lettuce (p<0.001) (Table 3). Notable differences were observed particularly in total soluble phenolics (TSP), membrane stability index (MSI), chlorophyll components (Chl-a, Chl-b, total chlorophyll), and chlorophyll stability index (CSI). Storage duration was identified as the main determinant of quality deterioration, while treatments substantially influenced the rate and extent of these changes. The application of SA (2 mM) and the combined treatment of CaNP (100 mg/L) + SA were the most effective in maintaining chlorophyll stability and membrane integrity throughout storage. PCA and correlation analyses supported these findings, revealing positive associations of MSI, CSI, and chlorophyll parameters, and negative correlations with weight loss and cutting resistance.
3.1. Total Soluble Fenolic Content (TSP)
The effects of SA, CaNP, and their combination (CaNP+SA) on the TSP of fresh-cut lettuce are presented in Table 4. Both treatment and storage duration showed significant differences (p<0.001), and the interaction between treatment and time was also significant. Among the treatments, the highest TSP values were recorded in lettuce treated with SA, followed by the control (261.6 mg/100 mL), CaNP+SA (254.9 mg/100 mL), and CaNP (243.4 mg/100 mL). The enhanced TSP in SA-treated samples can be attributed to the stimulation of the phenylpropanoid pathway, which activates key enzymes such as phenylalanine ammonia-lyase (PAL) and chalcone synthase (CHS), promoting phenolic biosynthesis ([13] Sharma et al., 2019; [14] Ramos-Sotelo et al., 2023). This reflects the role of SA as an elicitor that enhances antioxidant metabolism and oxidative stress tolerance. A dynamic trend was observed throughout storage: TSP increased during the early storage period, peaking on day 9 (366.4 mg/100 mL), and subsequently declined. This biphasic pattern is consistent with wound-induced activation of phenolic metabolism in fresh-cut produce, where the initial increase results from PAL activation, and the later decline reflects phenolic oxidation and polymerization mediated by polyphenol oxidase (PPO) and peroxidase (POD). Similar trends have been reported in fresh-cut lettuce and spinach by Teng et al. [15] (2019) and Singh et al. [16] (2023). The treatment × time interaction indicated that SA-treated samples maintained the highest TSP values particularly between days 3 and 12 (e.g., 331.1 and 401.0 mg/100 mL on days 3 and 9, respectively), confirming a pronounced elicitor effect during mid-storage. In contrast, CaNP-treated samples exhibited generally lower TSP values, suggesting that CaNP enhanced membrane stability and reduced stress signaling, thereby limiting phenolic synthesis. Calcium-based nanoparticles are known to strengthen cellular membranes and mitigate oxidative stress, leading to moderated phenolic accumulation [17] (Aliniaeifard et al., 2025).
Interestingly, the combined CaNP+SA treatment induced a more moderate increase in phenolics compared to SA alone. This suggests that CaNP’s stabilizing effect counterbalanced the SA-induced metabolic activation, potentially preventing excessive phenolic accumulation and enzymatic browning. This interpretation aligns with the color analysis results, where the combination treatment showed slower changes in ΔE and yellowness index values, indicating delayed discoloration. Furthermore, correlation and PCA analyses supported these findings. Samples exhibiting higher Membrane Stability Index (MSI) and Chlorophyll Stability Index (CSI) values also showed elevated Total Chlorophyll (Total-chl), SPAD, and TSP levels, while weight loss (WL) and ΔE were negatively correlated. This pattern suggests that maintaining membrane and pigment stability contributes to balanced phenolic metabolism and effective control of oxidative stress. The CaNP+SA treatment clustered closely with these stability-related parameters in the PCA biplot, indicating its effectiveness in preserving color, pigment, and phenolic integrity during cold storage.
3.2. Membrane Stability Index (MSI)
The effects of treatment and storage duration on the membrane stability index (MSI) of fresh-cut lettuce were found to be significant (p<0.05) (Table 5). MSI is a key physiological indicator reflecting the resistance of cell membranes to electrolyte leakage and, consequently, the integrity of cellular structure during storage [18] (Lin et al., 2022). At the beginning of the experiment, all treatments exhibited similar MSI values (97.7%), showing no significant differences; however, a sharp decline was recorded on day 3. This reduction is likely attributed to post-cutting stress, which induces the accumulation of reactive oxygen species (ROS), leading to increased lipid peroxidation and ion leakage across membranes (([19] Iturralde-García et al., 2022; [20] Quandoh & Albornoz, 2025). As storage progressed, distinct differences among treatments became evident, particularly after day 9. The highest MSI values were observed in the SA (98.93%) and CaNP + SA (98.51%) treatments. These increases suggest activation of antioxidant defense systems, repair of membrane lipids, and partial restoration of cellular homeostasis ( [21] Dawood et al., 2023). Afterward, MSI values slightly decreased and stabilized between 95–97% during the later stages of storage, indicating that tissues were able to maintain redox balance to a certain extent. Similarly, Yang et al. [22] (2024) reported an initial membrane stress response in fresh-cut lettuce followed by an adaptive recovery phase during prolonged storage. According to treatment means, control (C), SA, and CaNP + SA belonged to the same statistical group, whereas CaNP alone showed significantly lower MSI values. This demonstrates that SA and CaNP + SA preserved membrane stability and supported cellular integrity, while CaNP alone was insufficient to prevent membrane permeability loss. The inclusion of SA (2 mM) and CaNP (100 mg L⁻¹) provided an effective but limited degree of protection, suggesting that these concentrations may represent a hormetic plateau, where moderate stress induces partial protection, but stronger responses may occur at slightly lower (0.5–1 mM) or higher (3 mM) SA doses ([23]Chen et al., 2023). The lower MSI values observed in CaNP-treated samples, particularly on days 3 and 15, may be related to transient osmotic stress caused by high ionic strength or nanoparticle aggregation (([24]Rasheed et al., 2024). In contrast, the CaNP + SA combination exhibited a synergistic response, where SA’s antioxidant and membrane-protective effects complemented CaNP’s cell wall stabilization properties. Consistent with these findings, Abdelkader et al. [5] (2022) reported that combined CaNP + SA treatment (2 mM) improved membrane stability, reduced ion leakage, and prolonged quality retention in cucumber. Correlation analysis revealed that MSI was positively correlated with CSI (r = 0.81), total Chl (r = 0.62), and SPAD (r = 0.58), but negatively correlated with weight loss (r = –0.65) and cutting resistance (r = –0.72). These relationships suggest that higher MSI values are associated with lower water loss and more desirable leaf texture (greater crispness and elasticity). PCA further supported this pattern, showing that MSI, CSI, and SPAD variables were loaded in the same direction, with CaNP + SA samples clustering strongly along this axis, indicating superior balance in membrane integrity and pigment stability. Conversely, CaNP alone aligned with the CR and WL vectors, suggesting a link between membrane injury, tissue hardening, and dehydration.
3.3. Cutting Resistance (CR)
According to the analysis of variance (ANOVA), treatment, storage duration, and their interaction significantly affected the cutting resistance (CR) of fresh-cut lettuce (p<0.05) (Table 6). At the beginning of storage, CR values were 13.8 N across all treatments. However, as the storage period progressed, a general decreasing trend was observed. Between days 3 and 9, CR values declined, indicating that the lettuce leaves remained crisp and fresh during this period. Conversely, in the control group, CR values increased notably on days 15 and 18, suggesting that leaf tissues had lost turgidity due to water loss and became more elastic and less crisp. Based on treatment averages, the lowest CR values were recorded in the CaNP group (9.9 N), followed by CaNP + SA (11.5 N) and SA (12.1 N). This indicates that CaNP application improved cell wall stability and reduced water loss, while SA delayed tissue senescence, contributing to the maintenance of crispness. The PCA results further supported this pattern, as CR was positioned in the same loading direction as weight loss (WL) but opposite to MSI, CSI, and SPAD. This distribution confirms that higher CR values are typically associated with increased dehydration and reduced cellular stability, whereas lower CR values (indicative of fresh and crisp texture) correspond to higher MSI, CSI, and SPAD values, reflecting better physiological integrity. The PCA biplot showed that CaNP + SA samples clustered closely with MSI, CSI, and SPAD vectors, demonstrating that this combined treatment simultaneously preserved both textural and physiological stability. In addition, the correlation matrix revealed a strong positive relationship between TPC and MSI (r = 0.75) in the CaNP + SA treatment, suggesting that phenolic compounds contributed to membrane stabilization through their antioxidant properties, indirectly supporting tissue integrity. Furthermore, the increasing CR values observed in the control group during late storage stages were positively correlated with WL (r = 0.64), indicating that water loss caused loss of elasticity and higher resistance to cutting. Salicylic acid mitigates this process by inhibiting ethylene biosynthesis and reducing the activities of cell wall–degrading enzymes such as polygalacturonase, pectin methylesterase, and β-galactosidase, thereby improving water retention capacity ([25]Wang et al., 2022; [26]Asrey et al., 2024). In contrast, CaNP reinforces Ca²⁺–pectate bridges within the cell wall matrix, enhancing structural firmness ([27]Chinnaswamy et al., 2020; [28] Singh et al., 2024). The combined SA + CaNP treatment amplified this effect by integrating SA-induced activation of stress signaling with CaNP-mediated ionic stabilization, resulting in synergistic reinforcement of cell wall integrity. This interaction reduced cell wall deformation during storage and helped maintain crispness. Overall, these findings emphasize the interrelationship between phenolic metabolism, water balance, and membrane stability, highlighting that the combined application of SA and CaNP offers superior protection for both structural and physiological quality during storage.
3.4. Weight Loss (WL)
The changes in weight loss (WL) of fresh-cut lettuce during storage are presented in Figure 3. Weight loss significantly increased with storage duration across all treatments (p<0.001). However, clear differences were observed among treatments; notably, salicylic acid (SA) and the CaNP + SA combination exhibited substantially lower WL compared with the control. By day 18, the mean WL in control samples exceeded 5%, whereas the CaNP + SA treatment maintained losses around 3.91%. These results indicate that both compounds contributed to the reduction of water loss during storage. SA is known to limit transpiration by promoting stomatal closure and regulating cell membrane permeability, thereby maintaining tissue water content ([29]Khan et al., 2015). Similarly, calcium oxide nanoparticles (CaNP) strengthen cell wall integrity by enhancing the formation of calcium pectate cross-links, delaying tissue collapse, and improving water retention ([30] Ranjbar et al., 2018). When applied together, SA and CaNP acted synergistically—combining membrane stabilization with the modulation of stress metabolism—resulting in the most effective reduction in WL. According to the correlation matrix (Figure 2), WL exhibited strong negative correlations with SPAD (r = –0.58), MSI (r = –0.52), and CSI (r = –0.39), indicating that increased water loss coincided with declines in chlorophyll content and membrane/chlorophyll stability. Conversely, a strong positive correlation was detected between WL and total soluble phenolics (TSP) (r = 0.76). This suggests that enhanced WL triggers phenolic accumulation as a physiological stress response (([31]Albergaria et al., 2020). Therefore, weight loss can be regarded not only as a physical quality indicator but also as a biochemical stress marker reflecting tissue senescence. The PCA results (Figure 3) further supported these relationships. The first three principal components explained 59.18% of the total variance. In PC1, WL, TSP, and color change (ΔE) loaded positively, while SPAD, MSI, and CSI loaded negatively. This distribution illustrates that physiological deterioration and water loss were accompanied by pigment degradation and reduced membrane stability. In the PCA biplot, the CaNP + SA treatment clustered closely with SPAD, MSI, and CSI vectors, emphasizing its role in maintaining both textural and physiological stability. In contrast, the control group was positioned along the WL and ΔE vectors, reflecting its association with water loss and discoloration. These findings confirm that CaNP and SA exert complementary and synergistic effects in reducing WL and preserving postharvest quality. Similarly, Morillo et al. [4] (2025) reported that combined SA and calcium coatings reduced WL by 35% and preserved tissue elasticity in fresh-cut lettuce. MR Elshawa et al. [32] (2023) also demonstrated that nano-calcium applications reduced surface permeability and enhanced water retention in rose petals, with the effect being more pronounced when combined with SA. Overall, the present study demonstrates that the CaNP + SA combination effectively minimizes water loss and maintains both physiological and biochemical stability in fresh-cut lettuce during cold storage. Correlation and PCA analyses consistently revealed an inverse relationship between WL and membrane/chlorophyll stability, highlighting the potential of integrating nanotechnological and elicitor-based approaches for enhancing postharvest quality retention.
3.5. Total Soluble Solids (TSS)
Slight fluctuations were observed in the total soluble solids (TSS) values of fresh-cut lettuce during storage (Figure 4). According to the analysis of variance, the treatment factor had a statistically significant effect on TSS (p<0.01), whereas the effect of storage duration was marginally significant (p ≈ 0.059). This indicates that the variations in TSS were primarily treatment-dependent. During the 3rd and 6th days of storage, salicylic acid (SA) treatment exhibited the highest TSS values (approximately 3.1–3.2%), while the control and CaNP groups showed lower levels (2.6–2.8%), and the CaNP + SA combination maintained intermediate values. These findings may be attributed to the regulatory role of SA in carbohydrate metabolism. SA enhances the activities of invertase and sucrose phosphate synthase, promoting sugar accumulation (([33]Zhao et al., 2021a; ([34]Zhao et al., 2021b). This activity contributes to maintaining an available energy source under postharvest stress conditions. The fact that CaNP alone did not significantly increase TSS suggests that calcium primarily acts by stabilizing cell walls and reducing membrane permeability, rather than directly modulating carbohydrate metabolism (([35] Hocking et al., 2016; [36]Thor, 2019). However, the values observed in the CaNP + SA combination being similar to those of SA alone imply that the two treatments synergistically enhanced both sugar metabolism and membrane integrity. According to the correlation matrix (Figure 3), TSS was positively correlated with TSP (r = 0.61) and WL (r = 0.62), indicating that sugar accumulation was associated with both phenolic metabolism and moisture loss during storage. This pattern suggests that carbon flow may be redirected toward phenylpropanoid biosynthesis in response to stress (([37]Wang et al., 2024). In contrast, negative correlations were found between TSS and SPAD (r = –0.04) and MSI (r = –0.52), implying that while sugar content increases, leaf senescence and membrane deterioration also progress. The PCA analysis (Figure 4) further supports these relationships. TSS loaded in the same direction as TSP and WL on the PC1 axis, representing interrelated physiological processes influencing postharvest quality. In the PCA biplot, SA-treated samples clustered in the positive region of PC1, indicating an association with higher TSS and phenolic compound contents. This pattern confirms the metabolic-sustaining and antioxidative role of SA during storage. In summary, SA treatment effectively preserved sugar content in fresh-cut lettuce during storage, thereby minimizing quality losses. While CaNP alone did not induce significant changes, its combination with SA contributed to sugar stabilization by reinforcing membrane structure and maintaining metabolic homeostasis. Both correlation and PCA analyses revealed that these effects are closely linked to phenolic metabolism and water balance, suggesting that the SA + CaNP combination may serve as a promising strategy for stabilizing postharvest carbon metabolism and extending the shelf life of fresh-cut produce.
3.6. Chlorophyll Content (Chl a, Chl b, Total Chl), Chlorophyll Stability Index (CSI), and Relative Chlorophyll (SPAD)
The chlorophyll content (Chl a, Chl b, and total Chl), chlorophyll stability index (CSI), and SPAD values of fresh-cut lettuce significantly decreased during cold storage (Table 7). The degradation of chlorophyll pigments became more pronounced after day 12, resulting in highly significant differences among treatments (p<0.001). Both SA and CaNP + SA treatments maintained higher Chl a and Chl b levels compared with the control and CaNP alone. The highest mean total Chl content (0.891 mg g⁻¹ FW) was observed in the CaNP + SA combination, indicating a synergistic protective effect. The improved pigment retention under SA treatment can be attributed to its inhibitory effect on chlorophyll catabolic enzymes such as chlorophyllase, Mg-dechelatase, and pheophorbide a oxygenase, which delay chlorophyll degradation (([38]Zhang et al., 2019; [39]Tanaka & Ito, 2025). Similarly, CaNP treatment slowed pigment loss by enhancing membrane stability and reducing reactive oxygen species (ROS) accumulation (([40]Abdel-Kader et al., 2023; [41]Hussan et al., 2024). However, the strongest effect was obtained under CaNP + SA, where SA-induced antioxidant activation and CaNP-mediated structural stabilization acted synergistically to protect pigment integrity. Significant differences were also found among treatments in terms of CSI (p<0.001). The highest CSI values (103–106%) were recorded on day 9 across all treatments, followed by a gradual decline thereafter. The CaNP + SA combination maintained the highest mean CSI (96.6%), suggesting delayed disruption of cell membranes and improved resistance of chlorophyll structures to oxidative degradation. Correlation analysis revealed strong positive relationships between CSI and Chl-a (r = 0.75), Chl-b (r = 0.74), and Total Chl (r = 0.62), confirming that CSI directly reflects pigment stability and that chlorophyll degradation is tightly linked to membrane deterioration. A similarly strong positive correlation was found between CSI and MSI (r = 0.73), indicating that membrane and pigment stability evolve in parallel, supporting earlier findings by [42] Maghsoudi et al. (2016). SPAD values also declined significantly during storage (p<0.001), with the control group dropping to 21.1 by day 18. In contrast, SA and CaNP + SA treatments maintained higher SPAD values (24.9 and 24.2, respectively), suggesting effective protection against chlorophyll degradation and senescence-related pigment loss. The PCA analysis further supported these relationships: SPAD, Chl-a, Chl-b, Total Chl, CSI, and MSI clustered closely in the same direction of the loading plot, revealing similar variation patterns and strong interdependence among these physiological parameters. The CaNP + SA treatment was positioned near these vectors, highlighting its superior ability to preserve pigment stability, chlorophyll content, and membrane integrity throughout storage.
3.7. Color Parameters
Significant changes were observed in the color parameters (L, Hue°, ΔE, Chroma, and Yellowness Index, YI*) of fresh-cut lettuce throughout the storage period (Table 8). As storage progressed, L and Hue° values generally decreased, while ΔE and YI increased, indicating darkening and yellowing of the leaves. Treatment differences were statistically significant (p<0.001). The CaNP + SA combination maintained the highest L (53.03), Hue° (119.3), and Chroma (33.8) values during storage, thereby preserving color brightness and saturation. In contrast, the control group showed a sharp decline in L and Hue°, accompanied by marked increases in ΔE and YI, highlighting accelerated discoloration and senescence. These findings confirm the synergistic effect of CaNP and SA in maintaining color stability. The decrease in L after day 12 reflected accelerated chlorophyll degradation and phenolic oxidation. SA treatment delayed this decline, maintaining higher brightness compared with the control. This effect is consistent with reports showing that SA suppresses the expression of Mg-dechelatase and pheophorbide a oxygenase, key enzymes in chlorophyll catabolism ([38]Zhang et al., 2019). In terms of ΔE, the CaNP + SA treatment showed the lowest mean color difference (ΔE = 2.40), confirming its strong efficacy in preserving visual quality. Although Hue° values declined across all treatments, the decrease was minimal in CaNP + SA, indicating a slower yellowing rate. Higher Hue° values correspond to better retention of green coloration and delayed senescence ( [43] Xu et al., 2016). Chroma values, representing color saturation, decreased gradually during storage but remained significantly higher in SA and CaNP + SA treatments (p<0.05), suggesting preserved pigment integrity and limited color fading. Analysis of YI revealed that the control exhibited pronounced yellowing (decreasing from 83.2 to 77.9), while the CaNP + SA combination maintained higher values (80.6). This indicates that CaNP mitigated oxidative yellowing, while SA delayed chlorophyll degradation, resulting in improved visual stability. Correlation analysis revealed positive relationships between L and CSI (r = 0.59) as well as MSI (r = 0.55), suggesting that color brightness is directly linked to cellular and pigment stability. Conversely, ΔE and YI showed strong negative correlations with Chl-a, Chl-b, and Total Chl (r = –0.79 to –0.83), indicating that color deterioration coincided with chlorophyll loss. The PCA results (Figure 3) further supported these observations: L, Hue°, and Chroma vectors loaded in the same direction as the CaNP + SA treatment, confirming that this combination was most effective in maintaining leaf greenness and brightness. In contrast, ΔE and YI were aligned with the control samples, indicating their association with advanced discoloration and pigment degradation. Collectively, these results demonstrate that the CaNP + SA combination effectively preserves visual quality in fresh-cut lettuce by maintaining pigment stability, limiting oxidative browning, and delaying chlorophyll degradation.
3.8. Multivariate Analysis (PCA & Correlation)
The multivariate analysis comprehensively revealed the effects of 2 mM salicylic acid (SA) and 100 mg L⁻¹ calcium oxide nanoparticles (CaNP) on the quality parameters of fresh-cut lettuce.
3.8.1. Principal Component Analysis (PCA)
Three principal components (PC1, PC2, and PC3) explained 59.18 % of the total variance (Figure 5). PC1, PC2, and PC3 accounted for 18.8 %, 20.2 %, and 14.1 %, respectively, indicating that the measured quality variables were well separated according to treatment effects. On the PCA loading plot, SPAD, Chl a, Chl b, Total Chl, chlorophyll stability index (CSI), and membrane stability index (MSI) loaded in the same direction, highlighting the strong interdependence between pigment stability and membrane integrity. In contrast, weight loss (WL) and cutting resistance (CR) vectors were oriented oppositely, signifying that increased water loss and tissue stiffness were inversely related to chlorophyll retention and cell-membrane stability. The distribution of treatment groups was clearly differentiated within the PCA model. Samples treated with SA and CaNP + SA clustered toward the vectors of SPAD, CSI, and MSI, confirming that these treatments effectively maintained pigment and membrane stability. CaNP alone applied samples were aligned with WL and CR vectors, indicating greater moisture loss and higher tissue rigidity. The control group exhibited a broader dispersion, reflecting greater fluctuations in quality attributes during storage.
3.8.2. Principal Component Analysis (PCA)
The correlation analysis supported the PCA findings, revealing consistent interrelationships among physiological and biochemical quality parameters of fresh-cut lettuce (Figure 6). Strong positive correlations (r > 0.70) were detected among SPAD, Chl-a, Chl-b, Total-Chl, MSI, and CSI, confirming that pigment retention is tightly linked to the maintenance of membrane integrity. In particular, the positive correlation between CSI and MSI (r = 0.73) demonstrates that chlorophyll stability and membrane durability develop concurrently during cold storage. Similarly, the high correlations between SPAD and both Chl-a and Chl-b (r > 0.80) confirm that the greenness of lettuce leaves directly depends on chlorophyll content. Conversely, weight loss (WL) showed negative correlations with SPAD (r = –0.58), CSI (r = –0.60), and MSI (r = –0.52), indicating that increasing water loss led to reductions in pigment stability and cell-membrane integrity. The negative relationship between cutting resistance (CR) and MSI supports the interpretation that increased tissue rigidity is associated with cellular water imbalance and membrane leakage. In contrast, total soluble phenolics (TSP) exhibited positive correlations with both MSI and CSI (r ≈ 0.75), suggesting that phenolic compounds contribute to the attenuation of oxidative stress during storage and help preserve membrane stability. Taken together, the correlation and PCA results indicate that SA and CaNP + SA treatments mitigated water loss while maintaining membrane stability, chlorophyll pigments, and phenolic compounds, whereas CaNP alone had a limited protective effect. This multivariate approach demonstrates that the combined application of salicylic acid and calcium oxide nanoparticles exerts complementary and synergistic effects on preserving the physiological quality of fresh-cut lettuce during storage.
4. Conclusions
This study demonstrated that the application of 2 mM salicylic acid (SA) and 100 mg L⁻¹ calcium oxide nanoparticles (CaNP) effectively preserved the physiological and biochemical quality of fresh-cut lettuce during 18 days of cold storage. Treatments with SA and CaNP + SA maintained higher total soluble phenolic contents, thereby limiting oxidative degradation, while preserving chlorophyll pigments, SPAD values, and the chlorophyll stability index (CSI) to ensure color integrity and photosynthetic stability. The CaNP + SA combination showed the lowest weight loss and the highest membrane stability index (MSI), indicating improved membrane integrity and reduced cellular water loss. Positive correlations among SPAD, CSI, and MSI, along with their negative correlations with weight loss and cutting resistance, confirmed that these treatments maintained tissue elasticity and water balance throughout storage. Overall, the combined use of SA and CaNP effectively supported membrane stabilization, pigment preservation, and water retention, slowing postharvest deterioration in fresh-cut lettuce. This combination emerges as a promising postharvest strategy to extend shelf life and maintain both the visual and physiological quality of minimally processed leafy vegetables.
The findings of this study clearly demonstrate that the application of 2 mM SA and 100 mg L⁻¹ CaNP, either individually or in combination, effectively preserved the physiological, biochemical, and visual quality of fresh-cut lettuce during 18 days of cold storage at 5±1 °C.Both SA and CaNP+SA treatments markedly reduced postharvest senescence and oxidative damage by maintaining higher levels of TSP, which are closely associated with the antioxidant defense system and phenylpropanoid metabolism. The combination of both treatments (CaNP+SA) provided the most balanced protection, reflected by the lowest weight loss, the highest MSI, and the greatest CSI, suggesting enhanced cellular integrity and delayed pigment degradation.
Strong positive correlations among SPAD, CSI, and MSI, coupled with their negative correlations with weight loss and cutting resistance, confirmed that these treatments maintained tissue elasticity, water retention, and pigment stability throughout storage. The synergistic interaction between CaNP and SA appears to strengthen membrane structure and reduce electrolyte leakage, thereby improving the lettuce’s ability to resist chilling-induced oxidative stress. Principal component analysis (PCA) supported these findings, showing that SA and CaNP+SA treatments clustered together near variables related to pigment stability and antioxidant capacity, whereas CaNP alone was associated more closely with mechanical resistance parameters.
Overall, the combined use of SA and CaNP successfully delayed chlorophyll degradation, mitigated water loss, and preserved phenolic integrity, leading to prolonged shelf life and improved postharvest performance. This integrated treatment strategy may represent a practical and eco-friendly approach to maintaining the physiological and sensory quality of minimally processed leafy vegetables, offering promising potential for sustainable postharvest management in the fresh-cut produce industry.
Author Contributions
“Conceptualization, R.K. and M.U.K; methodology, R.K.; M.U.K. and H.S. software, R.K; validation, R.K., H.S.; formal analysis, Y.G., M.D.; investigation, R.K., Y.G. M.D.; resources, Y.G., M.D., R.K., M.U.K. and H.S.; data curation, R.K.; writing—original draft preparation, R.K.; writing—review and editing, R.K., M.U.K. and H.S.; visualization, R.K.; supervision, R.K., M.U.K and H.S.; project administration, R.K. All authors have read and agreed to the published version of the manuscript.”
Data Availability Statement
The data supporting the findings of this study are available from the corresponding author upon reasonable request. No publicly archived datasets have been deposited at this time.
Acknowledgments
The authors would like to acknowledge the administrative and technical support provided by the Department of Horticulture at Kocaeli University. The contributions of the laboratory staff during sample preparation and analytical measurements are gratefully appreciated. During the preparation of this manuscript, the authors used OpenAI ChatGPT (GPT-5) for language refinement and improvement of textual clarity. The authors have reviewed and edited all generated content and take full responsibility for the final version of this publication.
Conflicts of Interest
The authors declare no conflicts of interest.
References
- Charles, F.; Nilprapruck, P.; Roux, D.; Sallanon, H. Visible light as a new tool to maintain fresh-cut lettuce post-harvest quality. Postharvest Biol Technol 2018, 2018. 135, 51–56. [Google Scholar] [CrossRef]
- Peng, H.; Simko; I. Extending lettuce shelf life through integrated technologies. Curr Opin Biotechnol 2023, 81, 102951. [Google Scholar] [CrossRef]
- Choi, I.L.; Lee, J.H.; Choi, D.H.; Wang, L.X.; Kang, H.M. Evaluation of the storage characteristics in maintaining the overall quality of whole and fresh-cut romaine lettuce during MA storage. Horticulturae, 2021, 7, 461. [Google Scholar] [CrossRef]
- Morillo, D.M.C.; Delgado, E.T.; Flórez, L.F.V.; Vásquez, L.L.; Escobar, D.T.; España, D.F.M. Minimally processed lettuces: extending shelf life through packaging and treatment with salicylic acid and sodium chloride solutions. Braz. J. Food Technol 2025, 28, 1–13. [Google Scholar] [CrossRef]
- Abdelkader, M.F.; Mahmoud, M.H. Lo’ay, A.A.; Abdein, M.A.; Metwally, K.; Ikeno, S.; Doklega, S.M. The Effect of combining post-harvest calcium nanoparticles with a salicylic acid treatment on cucumber tissue breakdown via enzyme activity during shelf life. Molecules 2022, 27, 3687. [Google Scholar] [CrossRef] [PubMed]
- Nawarathna, H.M.K.C.; Eeswara, J.P. The effect of salicylic acid on shelf life and bio-active compounds in lettuce (Lactuca sativa L.). Ceylon J. Sci. [CrossRef]
- De Corato, U. Improving the shelf-life and quality of fresh and minimally-processed fruits and vegetables for a modern food industry: A comprehensive critical review from the traditional technologies into the most promising advancements. Crit Rev Food Sci Nutr 2020, 60, 940–975. [Google Scholar] [CrossRef]
- Cid-López, M.L.; Soriano-Melgar, L.D.A.A.; García-González, A.; Cortéz-Mazatán, G.; Mendoza-Mendoza, E.; Rivera-Cabrera, F.; Peralta-Rodríguez, R.D. The benefits of adding calcium oxide nanoparticles to biocompatible polymeric coatings during cucumber fruits postharvest storage. Sci Hortic 2021, 287, 110285. [Google Scholar] [CrossRef]
- Hoagland, D.R. ; Arnon. D.I. The water-culture method for growing plants without soil. Circular, 1950. [Google Scholar]
- Chavez-Santiago, J.O.; Rodríguez-Castillejos, G.C.; Montenegro, G.; Bridi, R.; Valdes-Gomez, H.; Alvarado-Reyna, S.; Castillo-Ruiz, O; Santiago-Adame, R. Phenolic content, antioxidant and antifungal activity of jackfruit extracts (Artocarpus heterophyllus Lam.). Food Sci. Technol (Campinas) 2021, 42, e02221. [Google Scholar] [CrossRef]
- Nabati, J.; Nezami, A.; Hasanfard, A.; Nemati, Z.; Kahrom, N. Prolonged exposure to freezing stress reduces the ability of chickpea seedlings to effectively tolerate extremely low temperatures. Front Plant Sci 2023, 14, 1239008. [Google Scholar] [CrossRef] [PubMed]
- Ngcobo, S.; Bada, S.O.; Ukpong, A.M.; Risenga, I. Optimal chlorophyll extraction conditions and postharvest stability in Moringa (M. oleifera) leaves. Food Meas Charact 2024, 18, 1611–1626. [Google Scholar] [CrossRef]
- Sharma, A.; Shahzad, B.; Rehman, A.; Bhardwaj, R.; Landi, M.; Zheng, B. Response of phenylpropanoid pathway and the role of polyphenols in plants under abiotic stress. Molecules, 2019, 24, 2452. [Google Scholar] [CrossRef]
- Ramos-Sotelo, H.; Figueroa-Pérez, M.G. Use of salicylic acid during cultivation of plants as a strategy to improve its metabolite profile and beneficial health effects. Ital. J. Food Sci 2023, 35, 79–90. [Google Scholar] [CrossRef]
- Teng, Z.; Luo, Y.; Bornhorst, E.R.; Zhou, B. , Simko, I.; Trouth, F. Identification of romaine lettuce (Lactuca sativa var. longifolia) cultivars with reduced browning discoloration for fresh-cut processing. Postharvest Biol Technol 2019, 156, 110931. [Google Scholar] [CrossRef]
- Singh, S. Salicylic acid elicitation improves antioxidant activity of spinach leaves by increasing phenolic content and enzyme levels. Food Chem Adv 2023, 2, 100156. [Google Scholar] [CrossRef]
- Aliniaeifard, S.; Esmaeili, S. ; Eskandarzade; P., *!!! REPLACE !!!*, Sharifani, M., Eds.; Lastochkina, O. Nanotechnology in Regulation of Growth and Stress Tolerance in Vegetable Crops. In Growth Regulation and Quality Improvement of Vegetable Crops: Physiological and Molecular Features, Singapore: Springer Nature Singapore.2025; pp. 653–690. [Google Scholar]
- Lin, Y.; Zhan, L.; Shao, P.; Sun, P. Phase-change materials and exogenous melatonin treatment alleviated postharvest senescence of Agaricus bisporus by inhibiting browning and maintaining cell membrane integrity. Postharvest Biol Technol 2022, 192, 112009. [Google Scholar] [CrossRef]
- Iturralde-García, R.D.; Cinco-Moroyoqui, F.J.; Martínez-Cruz, O.; Ruiz-Cruz, S.; Wong-Corral, F.J.; Borboa-Flores, J. , Cornejo-Ramirez, Y.I; Bernal-Mercado, A.T.; Del-Toro-Sánchez, C. L. Emerging technologies for prolonging fresh-cut fruits’ quality and safety during storage. Horticulturae. [CrossRef]
- Quandoh, E.; Albornoz, K. Fresh-cut watermelon: postharvest physiology, technology, and opportunities for quality improvement. Fron Genet 2025, 16, 1523240. [Google Scholar] [CrossRef] [PubMed]
- Dawood, M.F; Tahjib-Ul-Arif, M.; Sohag, A.A.M.; Abdel Latef, A.A.H. Role of acetic acid and nitric oxide against salinity and lithium stress in Canola (Brassica napus L.). Plants 2023, 13, 51. [Google Scholar] [CrossRef] [PubMed]
- Yang, J.; Song, J.; Liu, J.; Dong, X.; Zhang, H.; Jeong, B.R. Prolonged post-harvest preservation in lettuce (Lactuca sativa L.) by reducing water loss rate and chlorophyll degradation regulated through lighting direction-induced morphophysiological improvements. Plants. [CrossRef]
- Chen, C.; Sun, C.; Wang, Y.; Gong, H.; Zhang, A.; Yang, Y.; Guo, F.; Cui, K.; Fan, X.; Li, X. The preharvest and postharvest application of salicylic acid and its derivatives on storage of fruit and vegetables: A review. Sci Hortic 2023, 312, 111858. [Google Scholar] [CrossRef]
- Rasheed, Y.; Khalid, F.; Ashraf, H.; Asif, K.; Maqsood, M.F.; Naz, N.; Shahbaz, M; Zulfiqar, U. ; Rana, S. Enhancing plant stress resilience with osmolytes and nanoparticles. J Soil Sci Plant Nutr 2024, 24, 1871–1906. [Google Scholar] [CrossRef]
- Wang, J.; Allan, A.C.; Wang, W.Q.; Yin, X.R. The effects of salicylic acid on quality control of horticultural commodities. N Z J Crop Hortic Sci 2022, 50, 99–117. [Google Scholar] [CrossRef]
- Asrey, R.; Vinod, B.R.; Menaka, M.; Ahamed, S.; Kumar, A. Recent trends in postharvest treatments for fruits and vegetables. In Advances in postharvest and analytical technology of horticulture crops, Singapore: Springer Nature Singapore. 2024; pp. 35–64.
- Chinnaswamy, S.; Rudra, S.G.; Sharma, R.R. Texturizers for fresh-cut fruit and vegetable products. In Fresh-Cut Fruits and Vegetables, Academic Press 2020; pp. 121–149.
- Singh, A.; Upadhyay, P.; Rami, E.; Singh, S.K. Nanotechnology interventions for sustainable plant nutrition and biosensing. J Soil Sci Plant Nut 2024, 24, 1775–1798. [Google Scholar] [CrossRef]
- Khan, M.I.R.; Fatma, M.; Per, T.S.; Anjum, N.A.; Khan, N.A. Salicylic acid-induced abiotic stress tolerance and underlying mechanisms in plants. Front Plant Sci 2015, 6, 462. [Google Scholar] [CrossRef] [PubMed]
- Ranjbar, S.; Rahemi, M.; Ramezanian, A. Comparison of nano-calcium and calcium chloride spray on postharvest quality and cell wall enzymes activity in apple cv. Red Delicious. Sci Hortic 2018, 240, 57–64. [Google Scholar] [CrossRef]
- Albergaria, E.T.; Oliveira, A.F.M.; Albuquerque, U.P. The effect of water deficit stress on the composition of phenolic compounds in medicinal plants. S Afr J Bot 2020, 131, 12–17. [Google Scholar] [CrossRef]
- MR Elshawa, G.R.; Ibrahim, F.A.; Arafat, L.A. Effect of nano calcium, calcium chloride, and salicylic acid on bent neck in cut roses. J Hortic Sci Biotechnol 2023, 98, 233–245. [Google Scholar] [CrossRef]
- Zhao, Y.; Song, C.; Brummell, D.A.; Qi, S.; Lin, Q.; Bi, J.; Duan, Y. Salicylic acid treatment mitigates chilling injury in peach fruit by regulation of sucrose metabolism and soluble sugar content. Food Chem 2021, 358, 129867. [Google Scholar] [CrossRef]
- Zhao, Y.; Song, C.; Qi, S; Lin, Q. ; Duan, Y. Jasmonic acid and salicylic acid induce the accumulation of sucrose and increase resistance to chilling injury in peach fruit. J Sci Food Agric 2021, 101, 4250–4255. [Google Scholar] [CrossRef]
- Hocking, B.; Tyerman, S.D.; Burton, R.A.; Gilliham, M. Fruit calcium: transport and physiology. Front Plant Sci, 2016, 7, 569. [Google Scholar] [CrossRef]
- Thor, K. Calcium—nutrient and messenger. Front Plant Sci 2019, 10, 440. [Google Scholar] [CrossRef] [PubMed]
- Wang, H.; Huang, J.; Zhang, C.; Li, Y.; Gou, H.; Liang, G. . & Chen, B. Glucose enhanced lignin accumulation in grapevine stems via promoting phenylpropanoid biosynthesis. Chem Biol Technol Agric 2024, 11, 152. [Google Scholar] [CrossRef]
- Zhang, H.; Wang, R.; Wang, T.; Fang, C.; Wang, J. Methyl salicylate delays peel yellowing of ‘Zaosu’pear (Pyrus bretschneideri) during storage by regulating chlorophyll metabolism and maintaining chloroplast ultrastructure. J Sci Food Agric 2019, 99, 4816–4824. [Google Scholar] [CrossRef] [PubMed]
- Tanaka, A.; Ito, H. Chlorophyll degradation and its physiological function. Plant Cell Physiol 2025, 66, 139–152. [Google Scholar] [CrossRef] [PubMed]
- Abdel-Kader, H.A.; Yousef, N.; Hossain, M.A.; Dawood, M.F. Lipid Production, Oxidative Status, Antioxidant Enzymes and Photosynthetic Efficiency of Coccomyxa chodatii SAG 216-2 in Response to Calcium Oxide Nanoparticles. Phyton, 2023. [Google Scholar] [CrossRef]
- Hussan, M.U.; Hussain, S.; Hafeez, M.B.; Ahmed, S.; Hassan, M.U.; Jabeen, S.; Yan, M; Wang, Q. Comparative role of calcium oxide nanoparticles and calcium bulk fertilizer to alleviate cadmium toxicity by modulating oxidative stress, photosynthetic performance and antioxidant-defense genes expression in alfalfa. Plant Physiol Biochem 2024, 215, 109002. [Google Scholar] [CrossRef] [PubMed]
- Maghsoudi, K.; Emam, Y.; Pessarakli, M. Effect of silicon on photosynthetic gas exchange, photosynthetic pigments, cell membrane stability and relative water content of different wheat cultivars under drought stress conditions. J Plant Nutr 2016, 39, 1001–1015. [Google Scholar] [CrossRef]
- Xu, F.; Tang, Y.; Dong, S.; Shao, X.; Wang, H.; Zheng, Y.; Yang, Z. Reducing yellowing and enhancing antioxidant capacity of broccoli in storage by sucrose treatment. Postharvest Biol Technol 2016, 112, 39–45. [Google Scholar] [CrossRef]
Figure 1.
Appearance of lettuce samples: (a) Harvesting, (b) Cutting process, (c) Air-drying process.
Figure 1.
Appearance of lettuce samples: (a) Harvesting, (b) Cutting process, (c) Air-drying process.
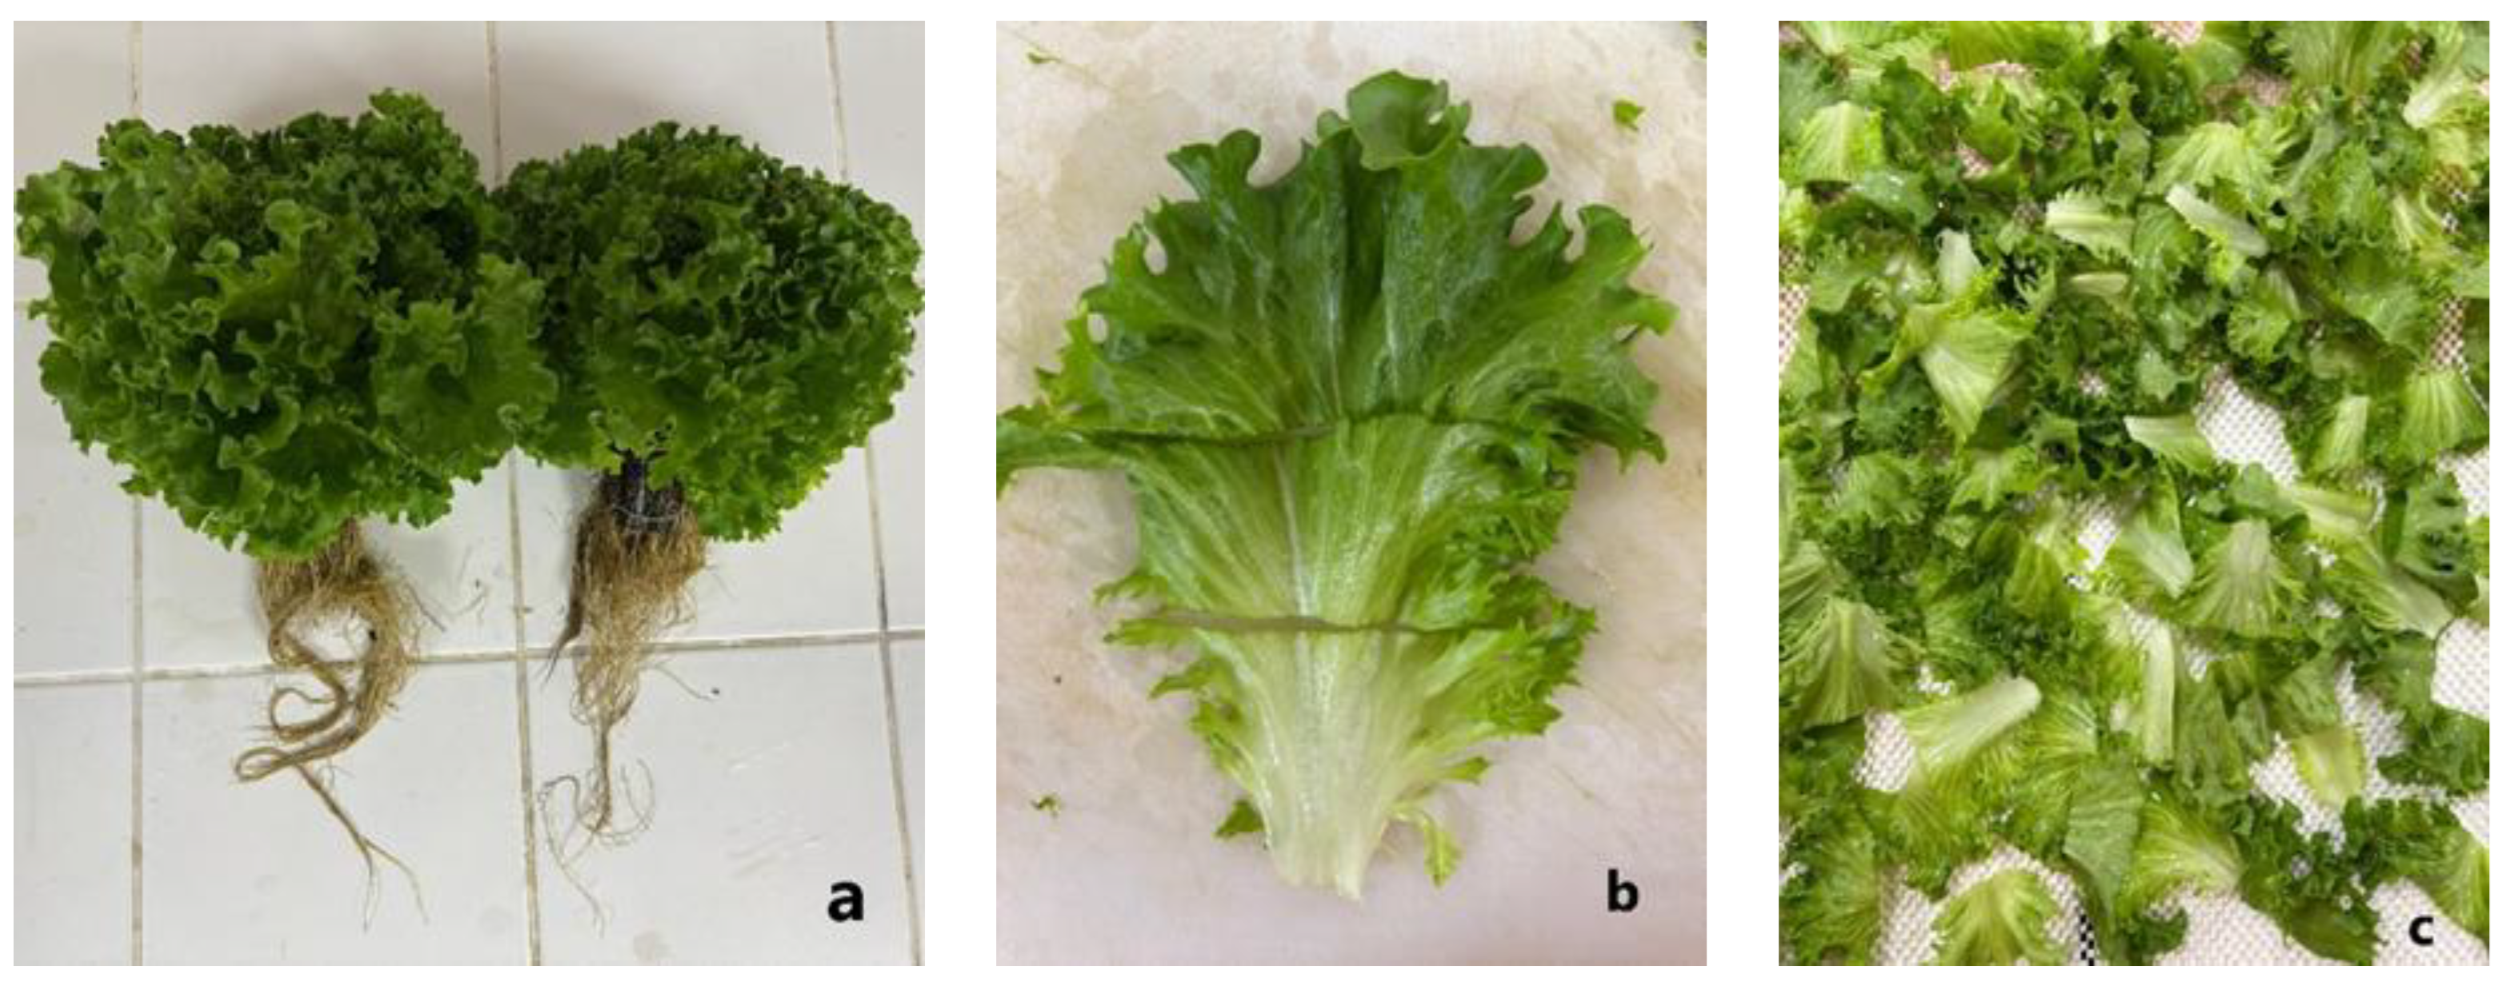
Figure 2.
Packaging of fresh-cut lettuce samples in lidded PET containers prior to cold storage.
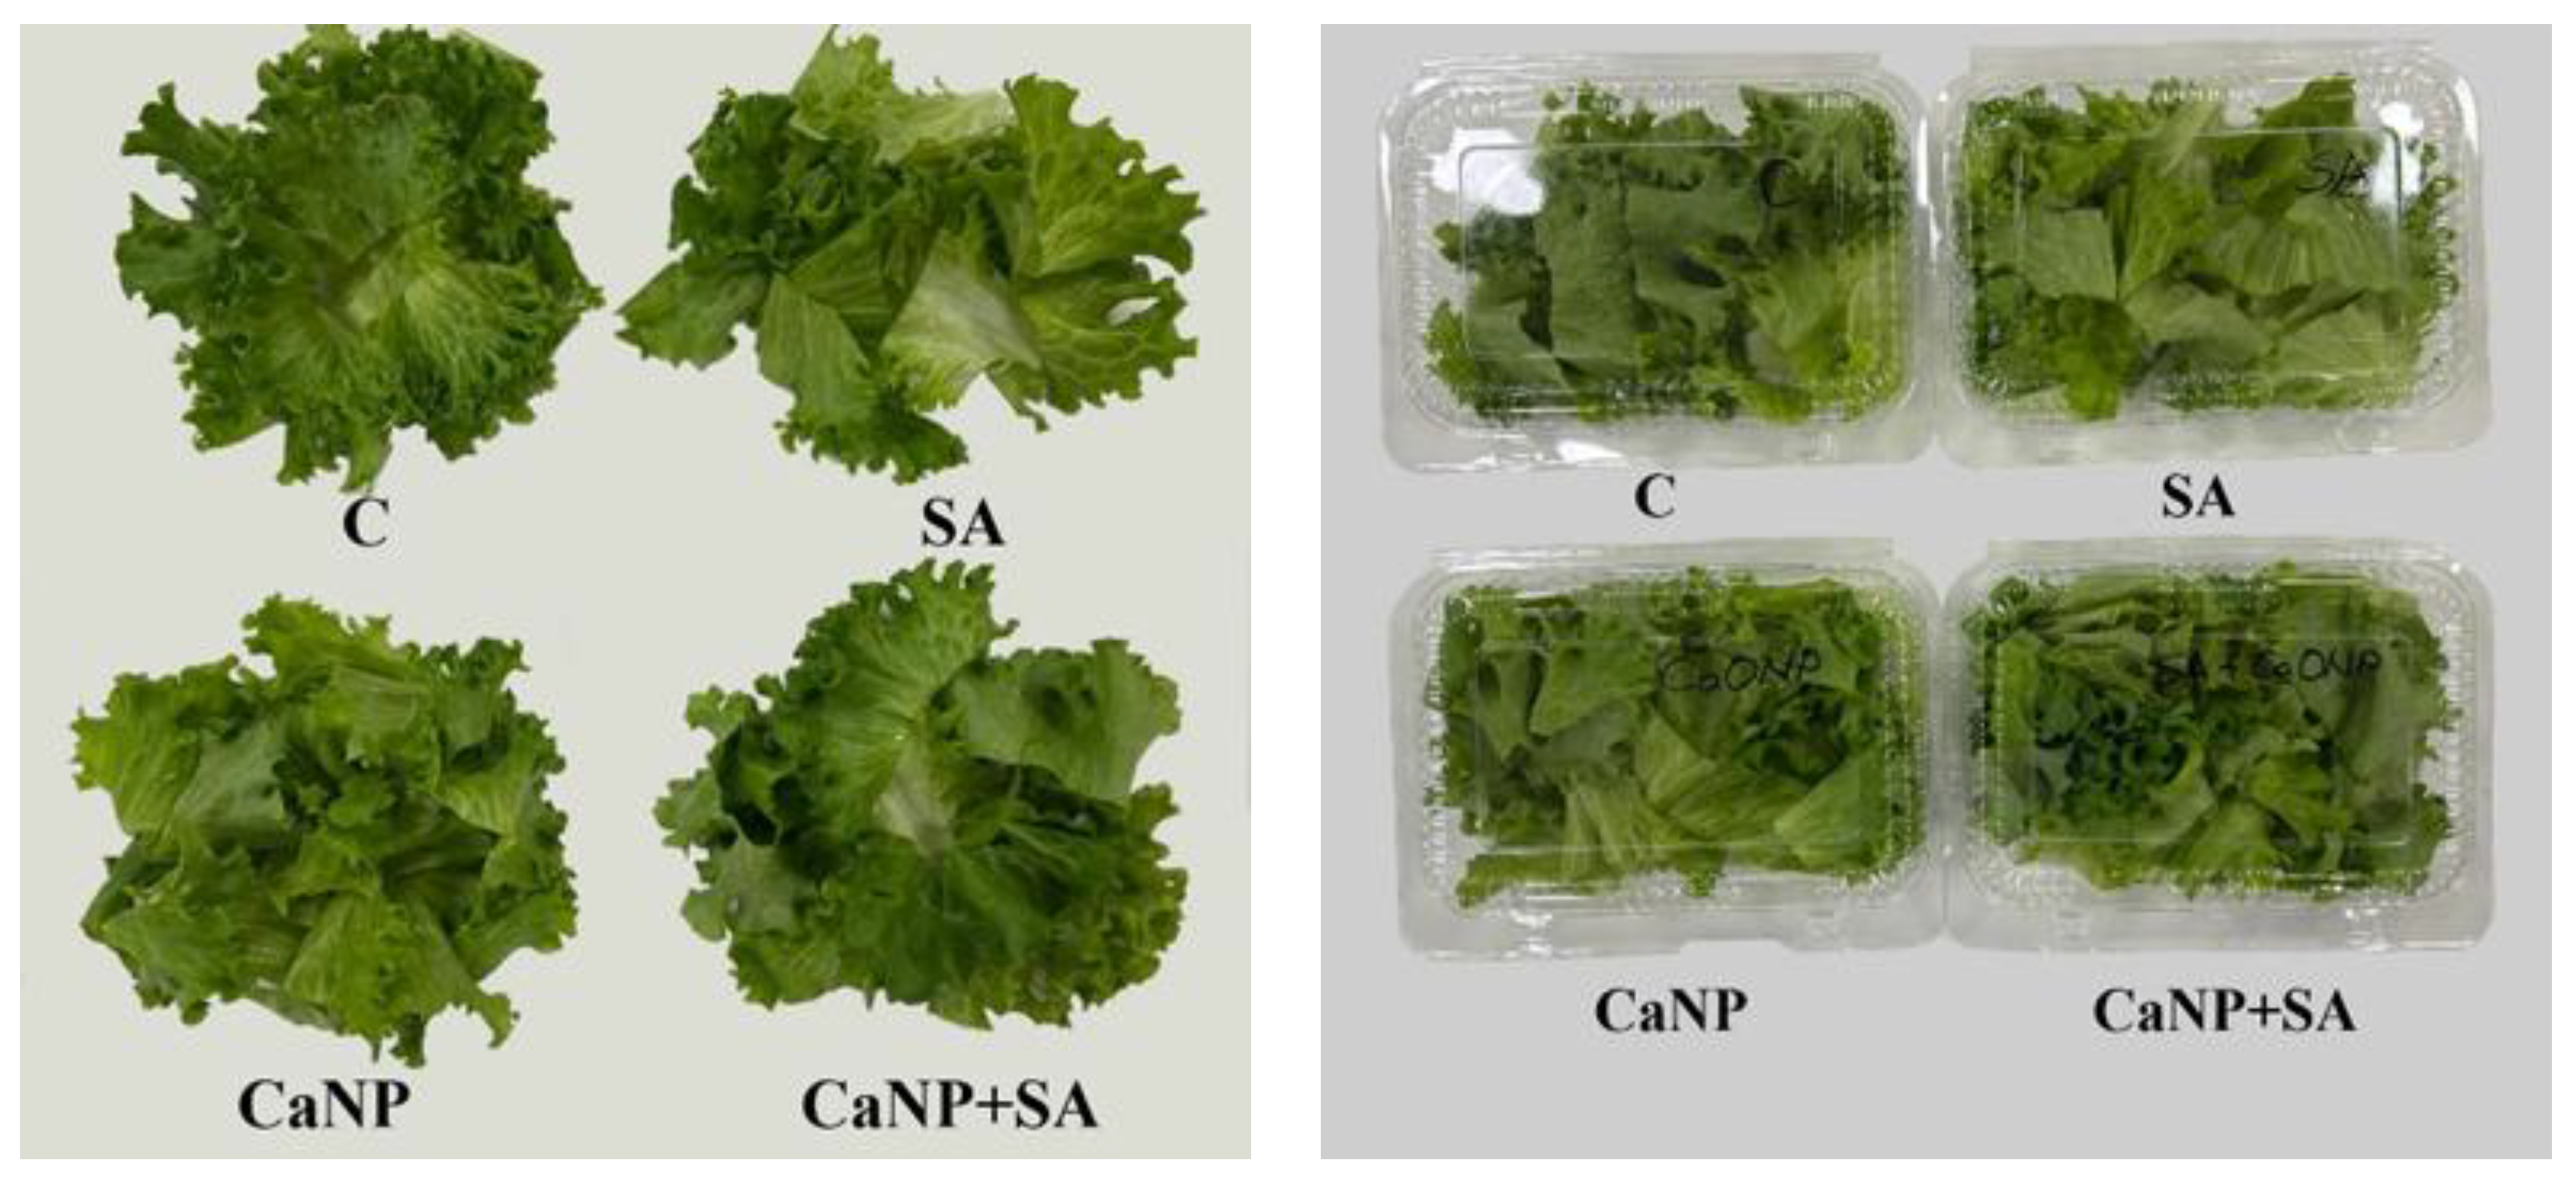
Figure 3.
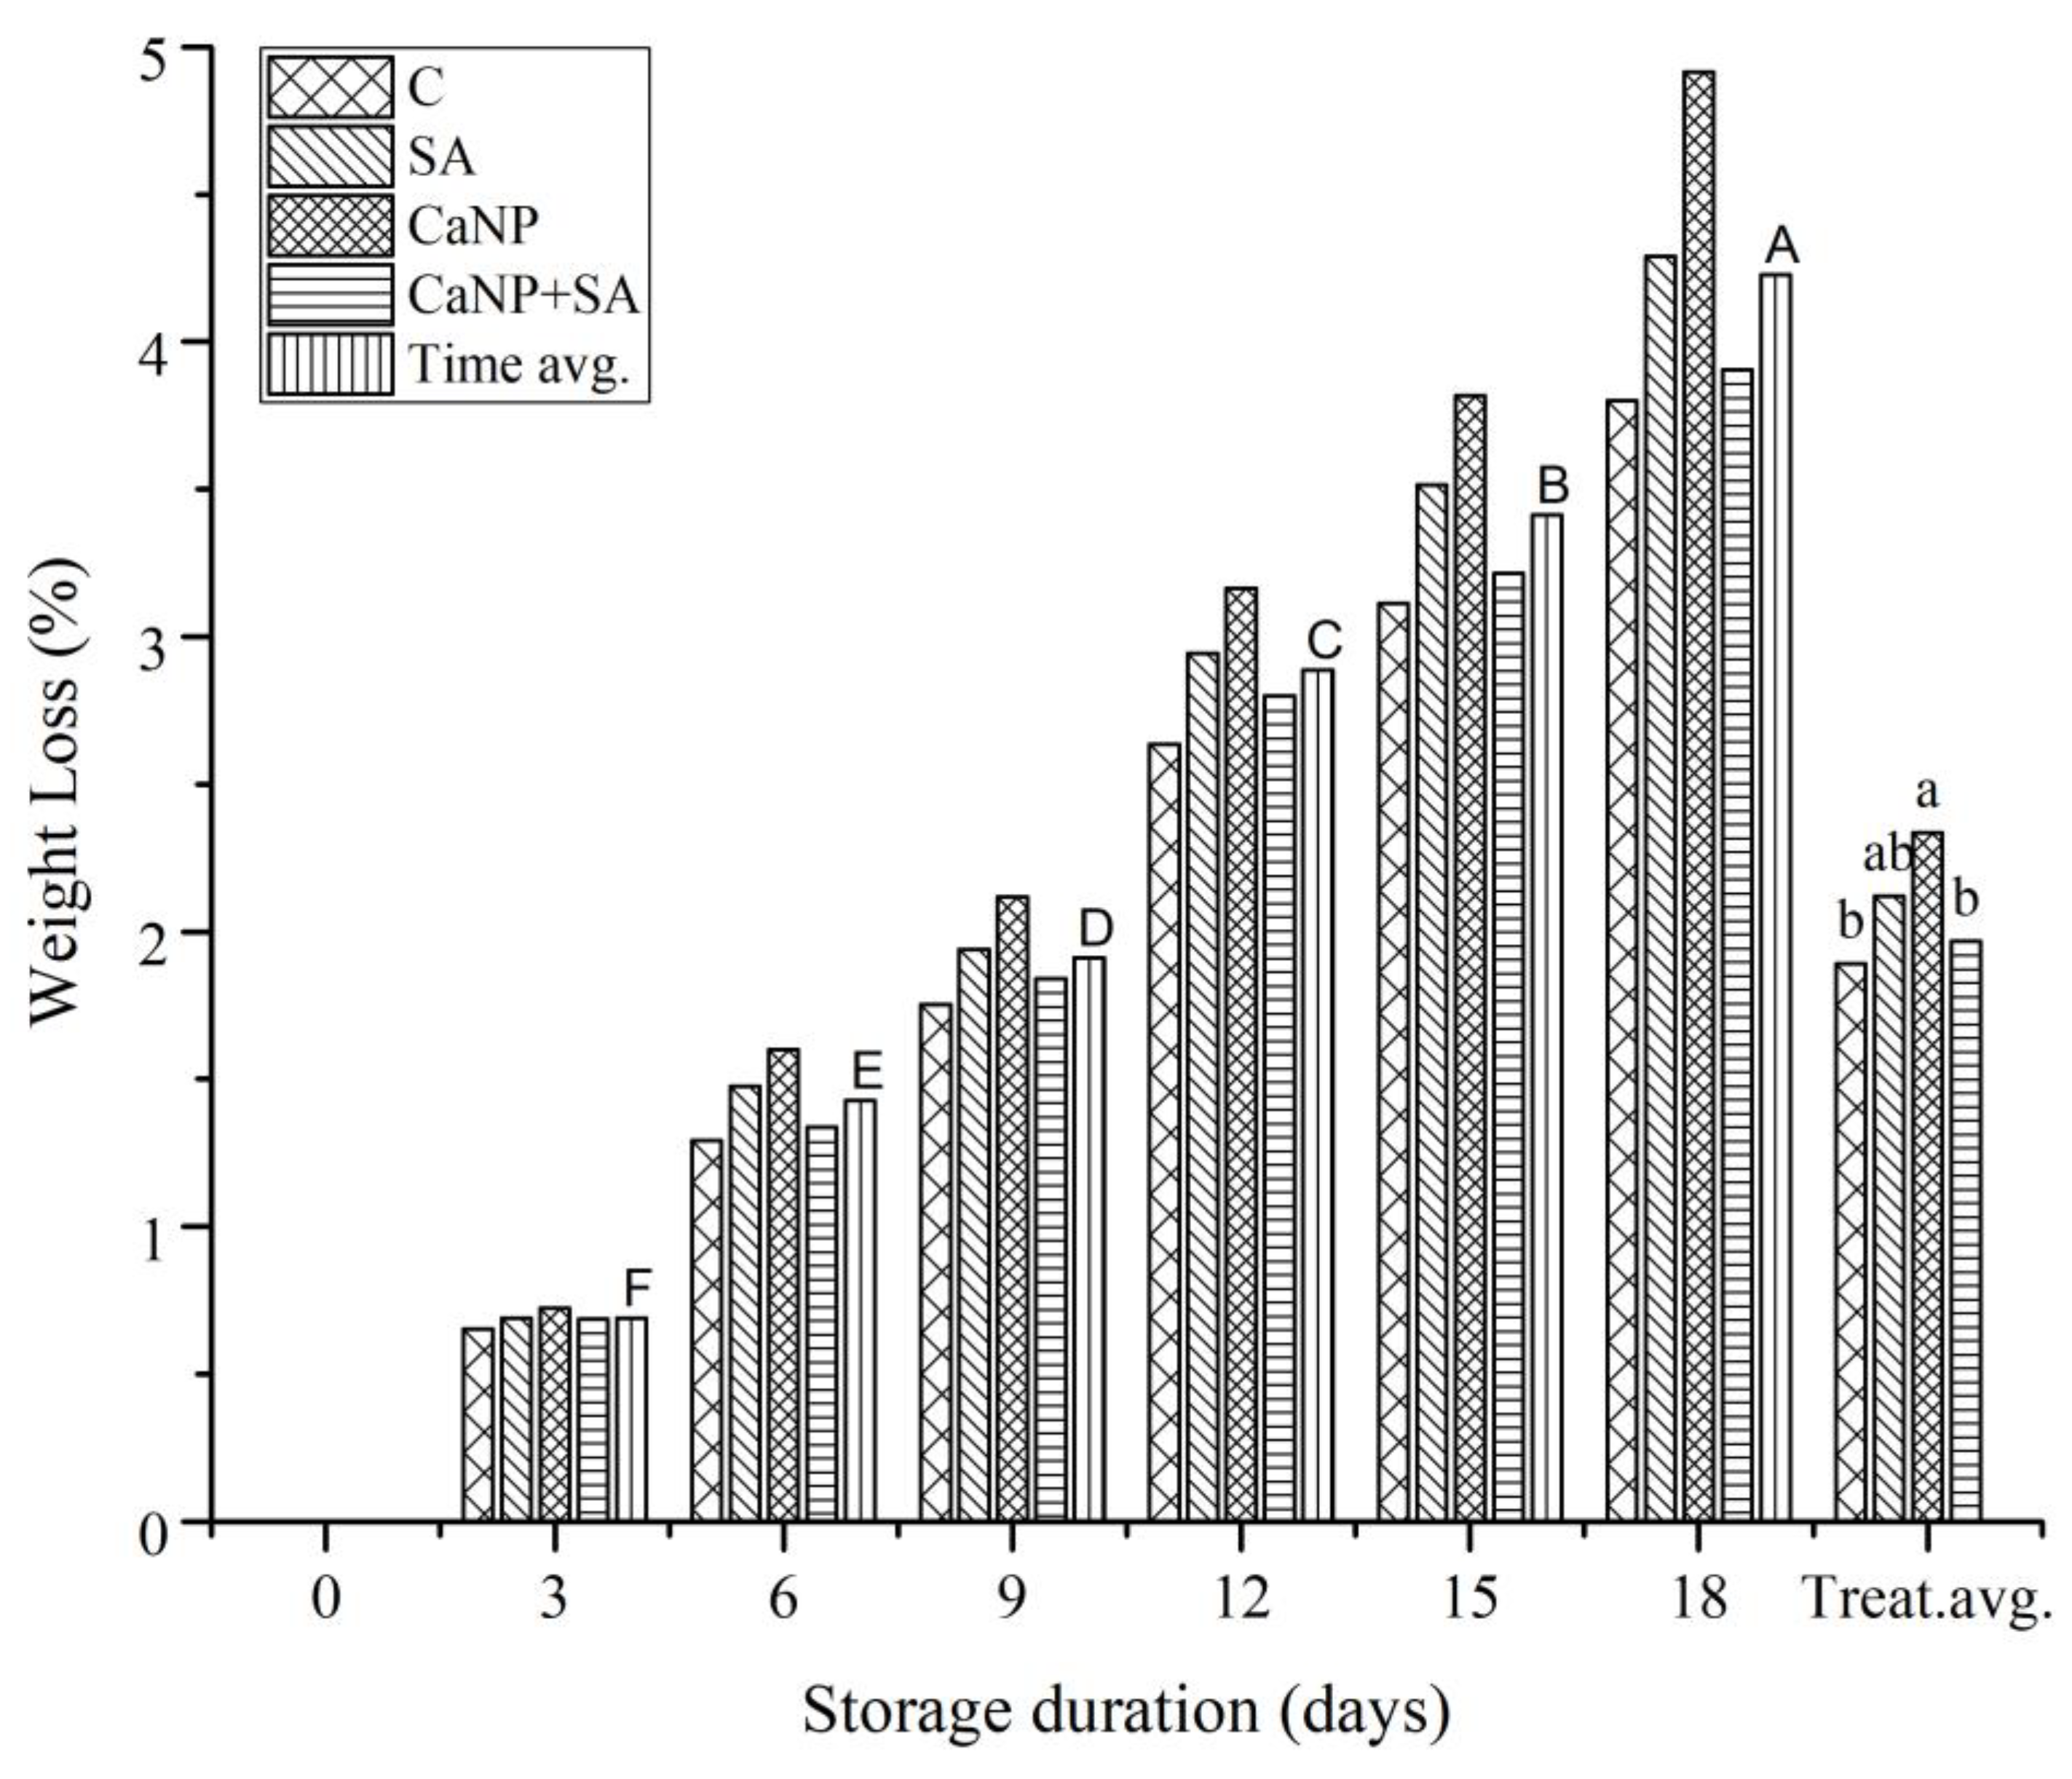
Figure 4.
Changes in TSS (%) of fresh-cut lettuce as influenced by calcium nanoparticles (CaNP) and salicylic acid (SA) treatments during cold storage (4±1 °C). Different uppercase letters indicate significant differences among storage days (p<0.05), and different lowercase letters indicate significant differences among treatments (p<0.05) according to DMRT (n = 3).
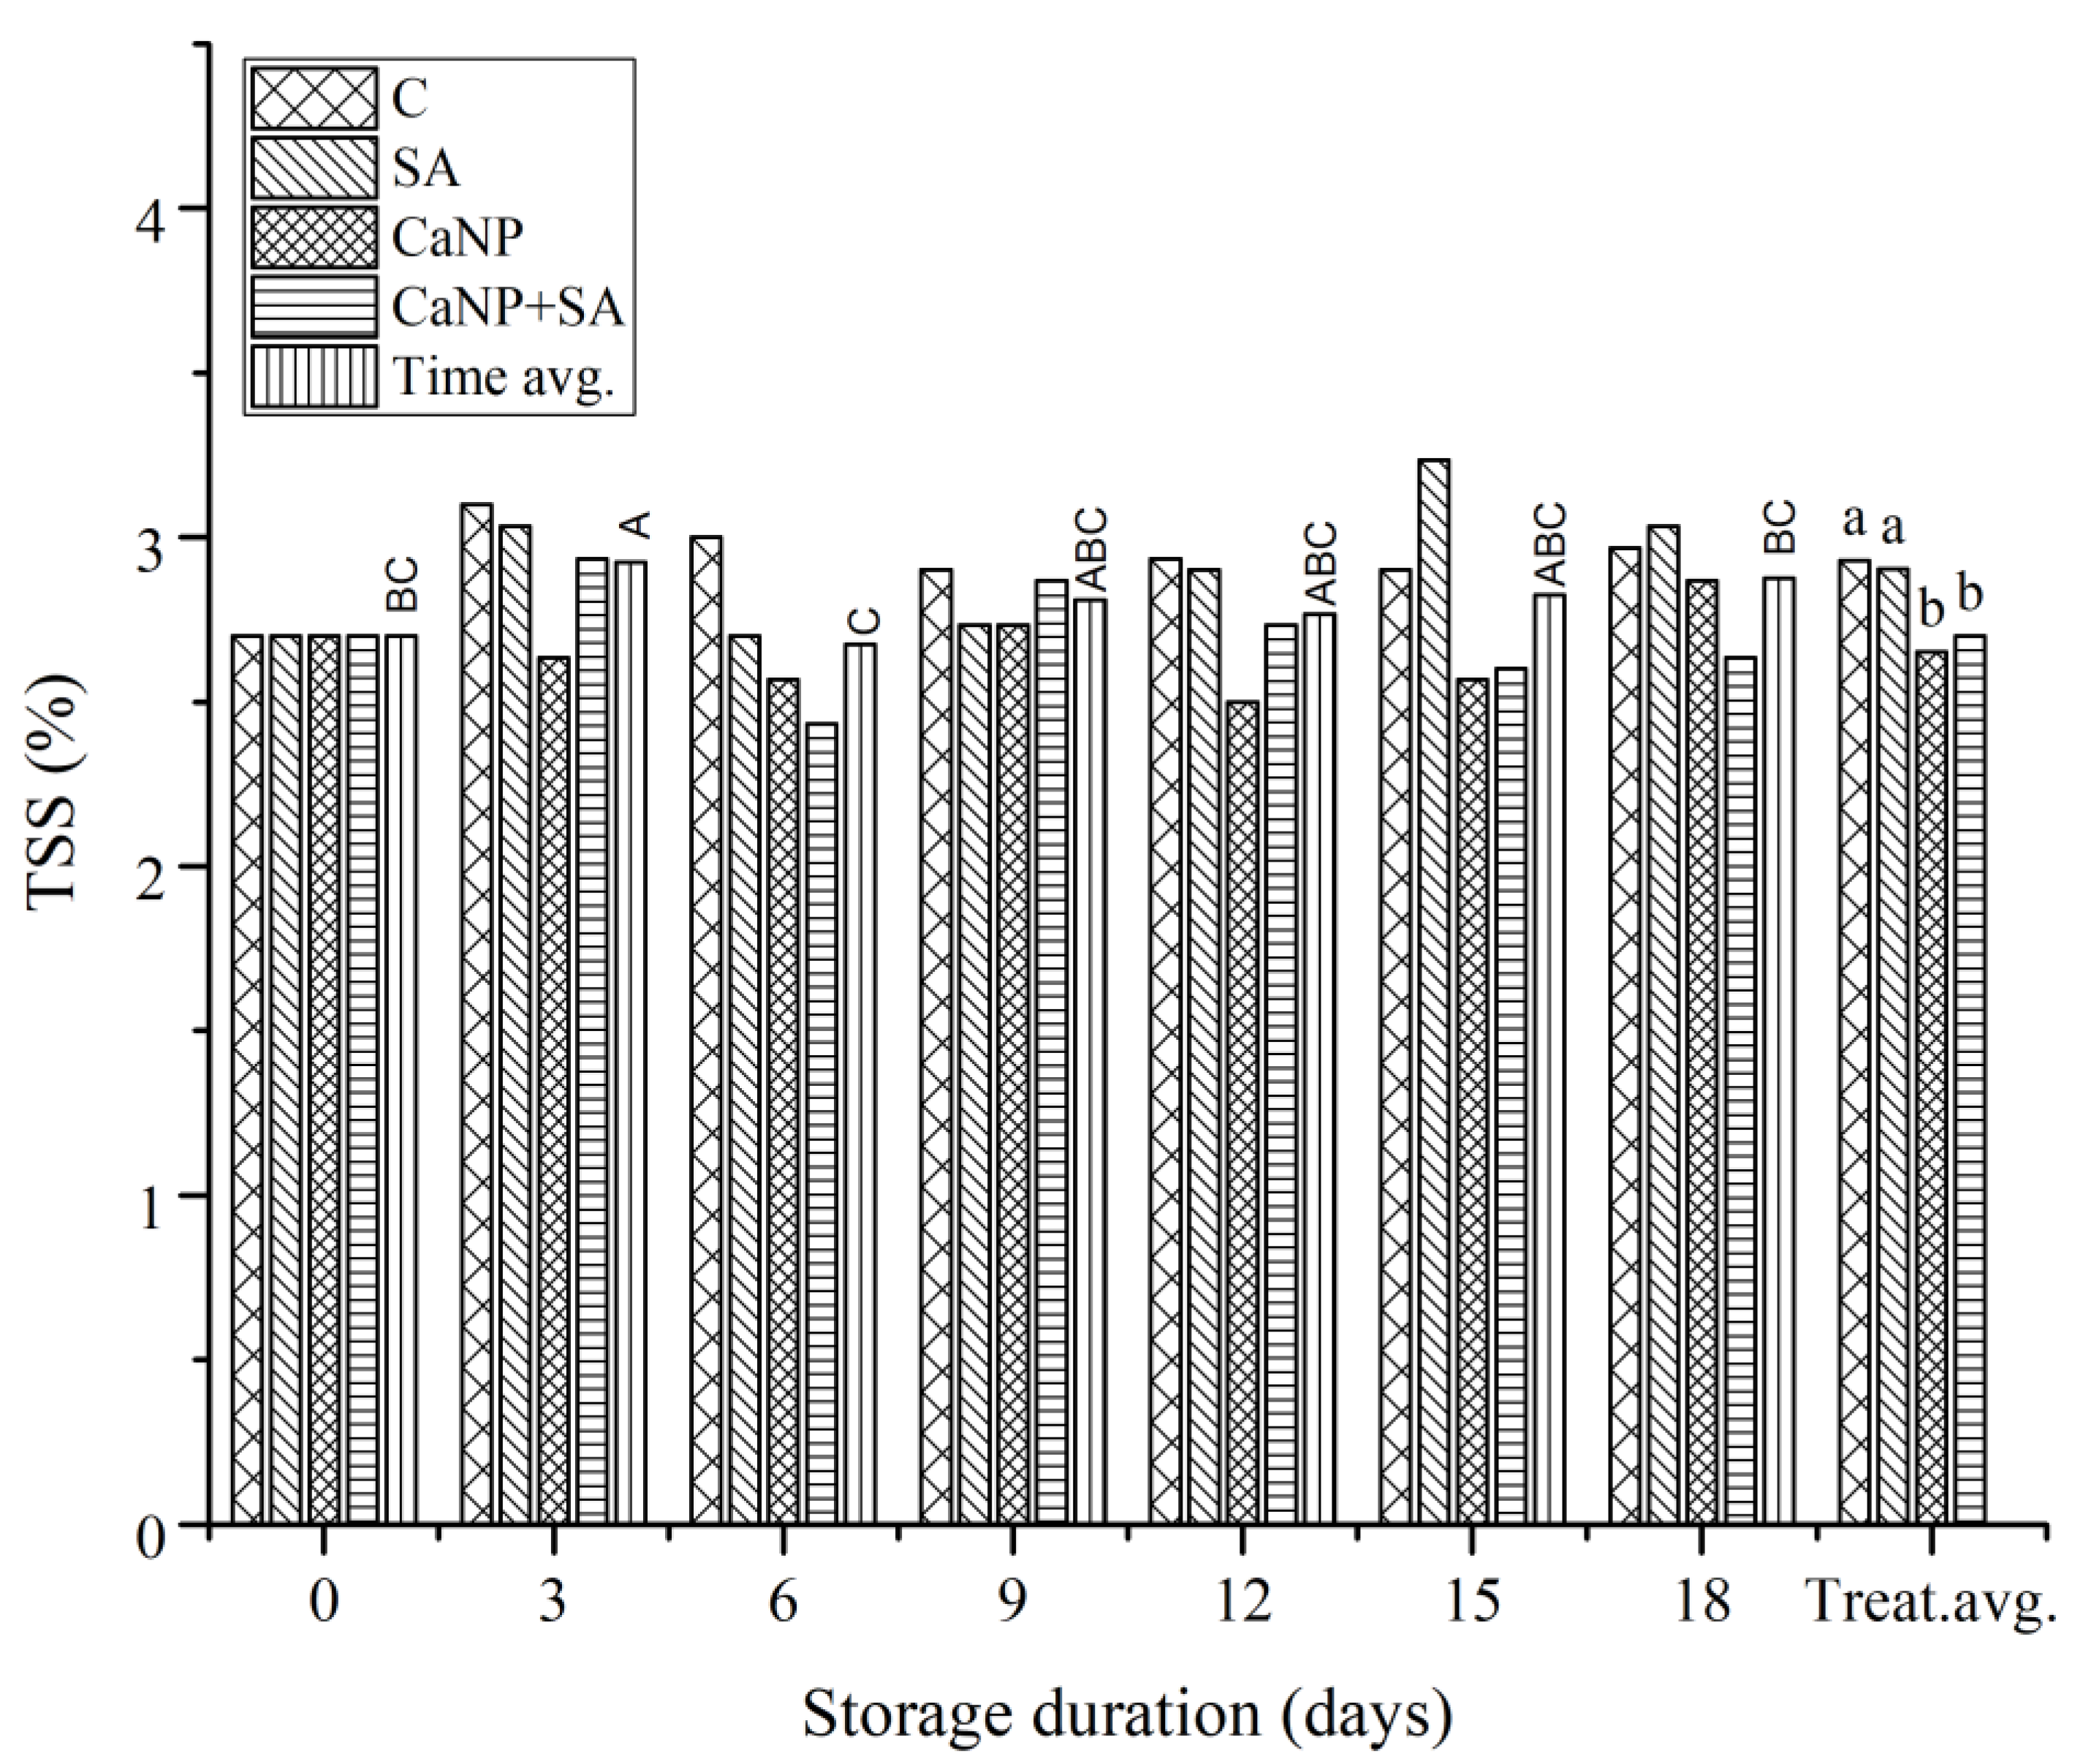
Figure 5.
Principal Component Analysis (PCA) biplot showing the relationships among quality parameters of fresh-cut lettuce subjected to different treatments (Control, SA, CaNP, CaNP+SA) during 18 days of cold storage. The PCA model explained 59.18% of the total variance (PC1: 24.8%, PC2: 20.2%, PC3: 14.1%). Vectors pointing in the same direction indicate strong positive correlations among variables such as SPAD, Chl a, Chl b, Total Chl, CSI, and MSI, while opposite directions represent negative relationships with weight loss (WL) and cutting resistance (CR). SA and CaNP+SA treatments were clustered close to stability-related parameters, indicating improved pigment and membrane integrity compared to other treatments.
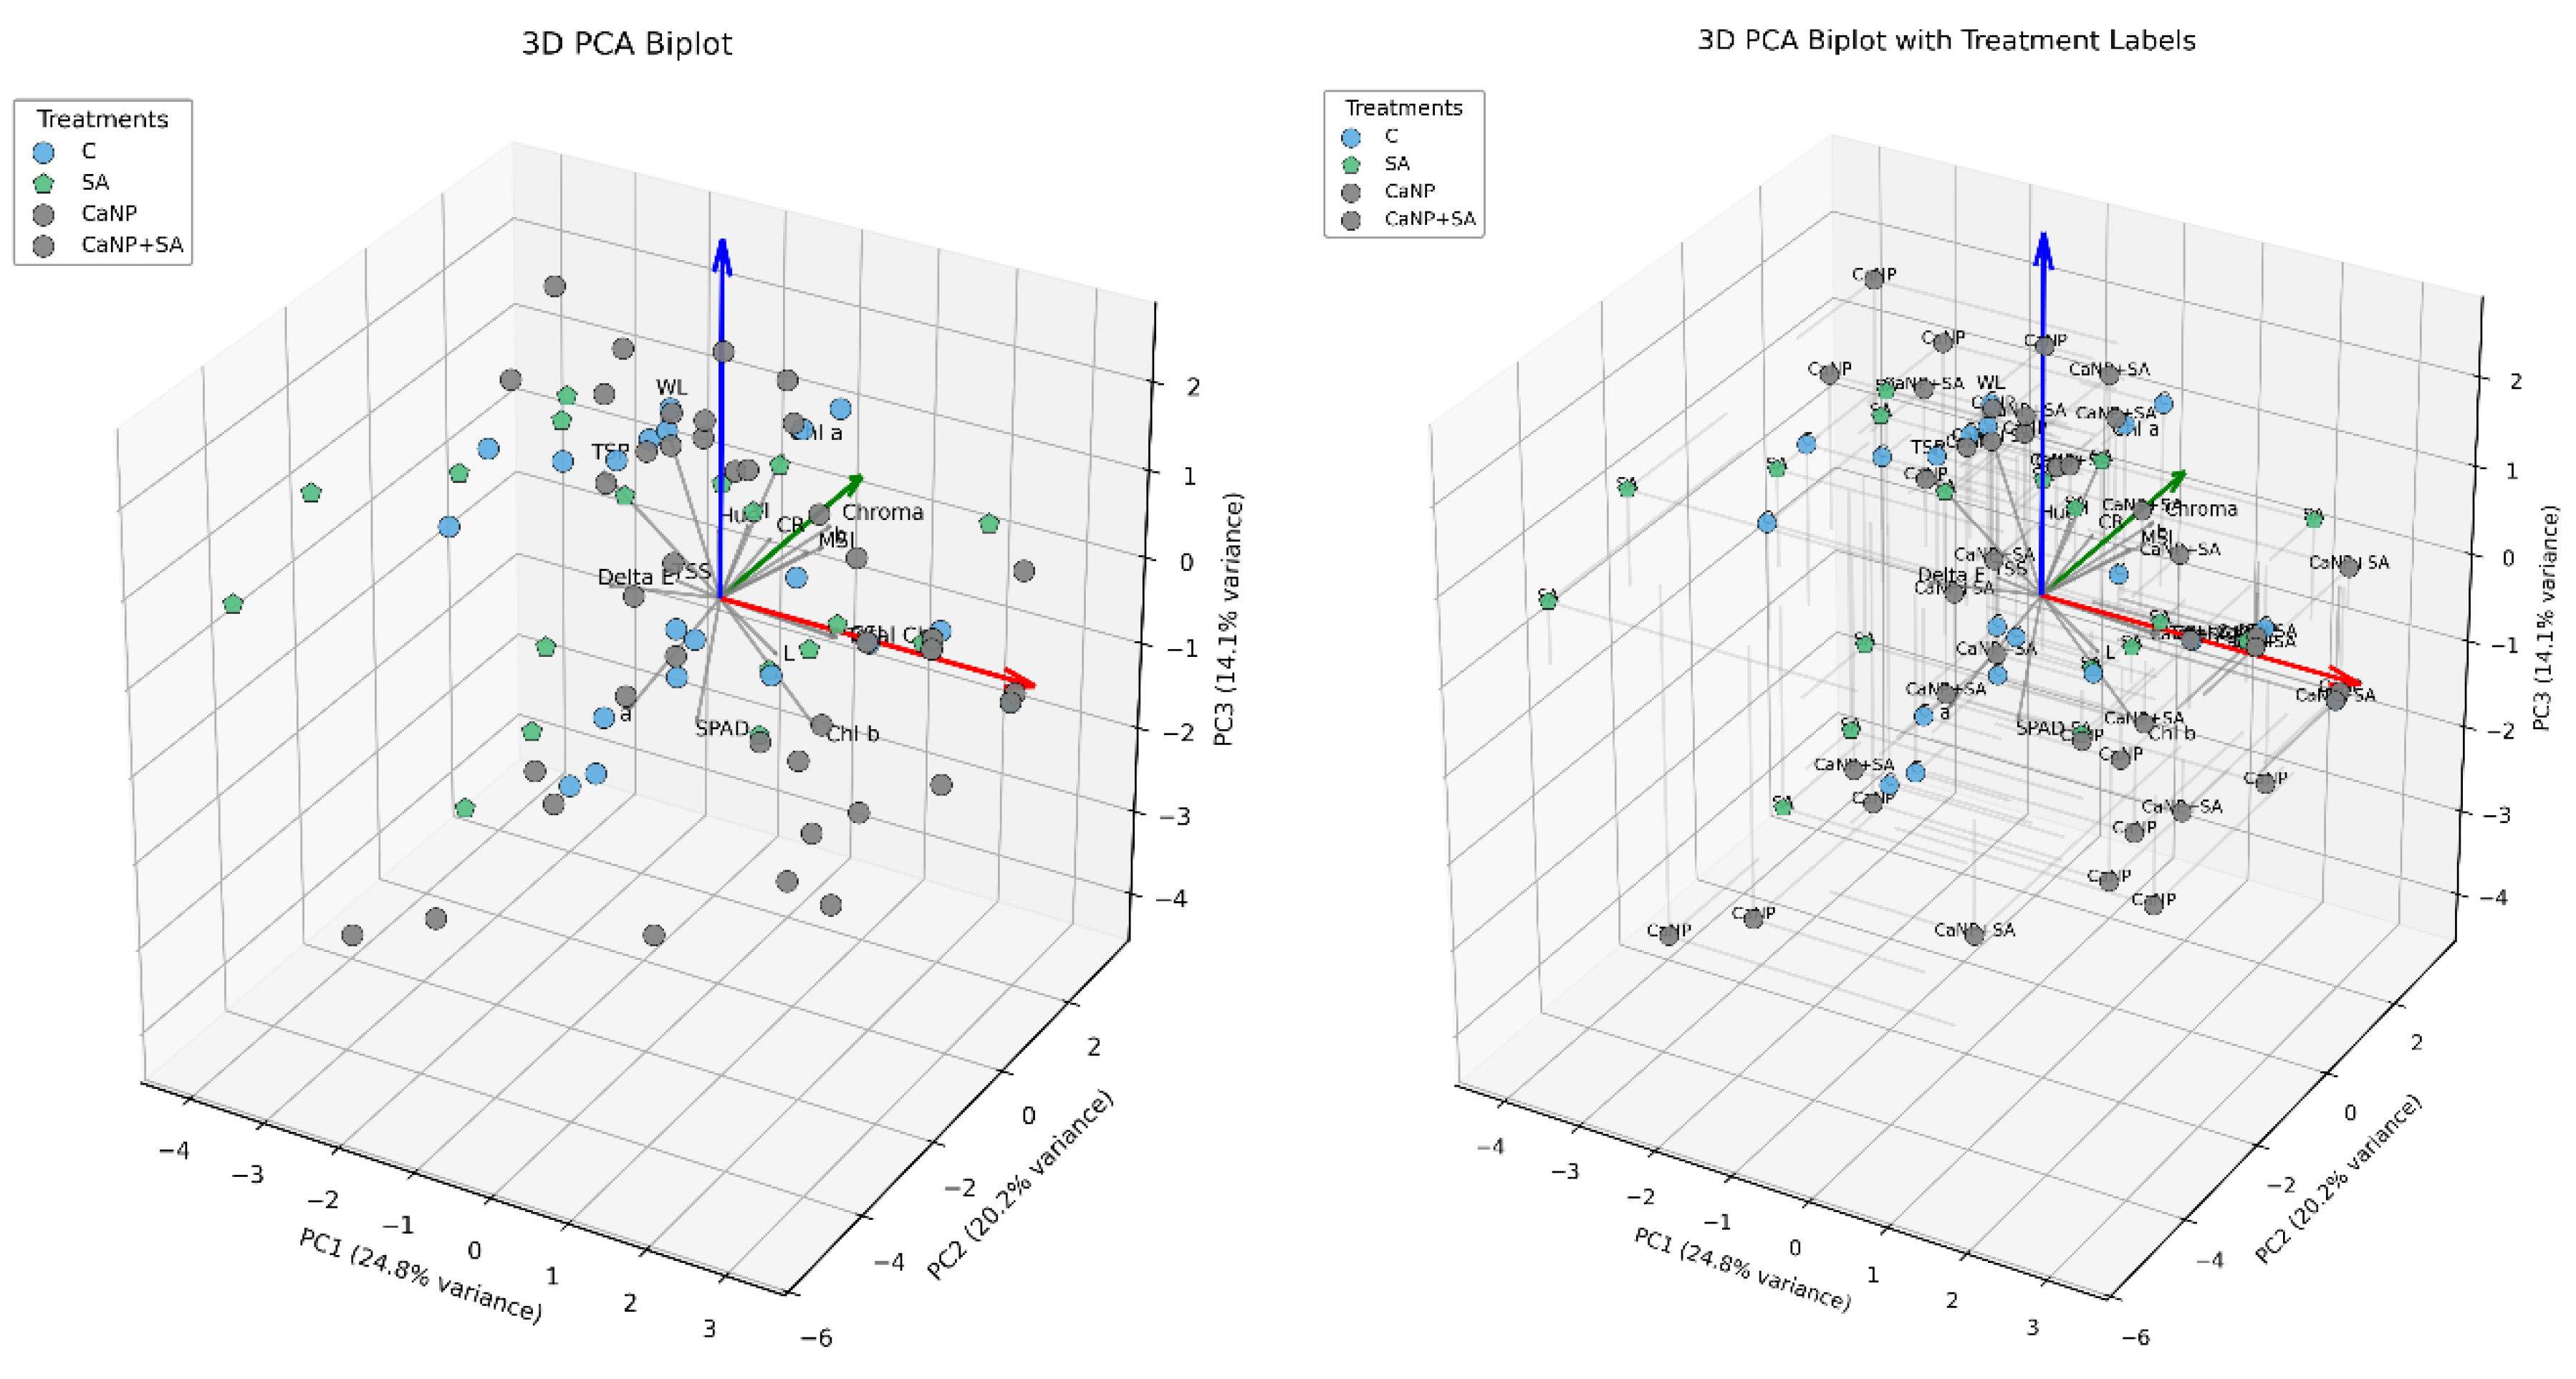
Figure 6.
Correlation matrix (bubble plot) illustrating Pearson correlation coefficients among physicochemical and physiological parameters of fresh-cut lettuce stored for 18 days under different treatments. Positive correlations are indicated in red and negative in blue. Strong positive associations were observed among SPAD, Chl-a, Chl-b, Total-chl, CSI, and MSI (r > 0.70), whereas weight loss (WL) and cutting resistance (CR) showed significant negative correlations with these parameters (r < –0.50). The results confirm the consistency between PCA and correlation analysis in identifying the synergistic effects of SA and CaNP+SA treatments on maintaining leaf quality.
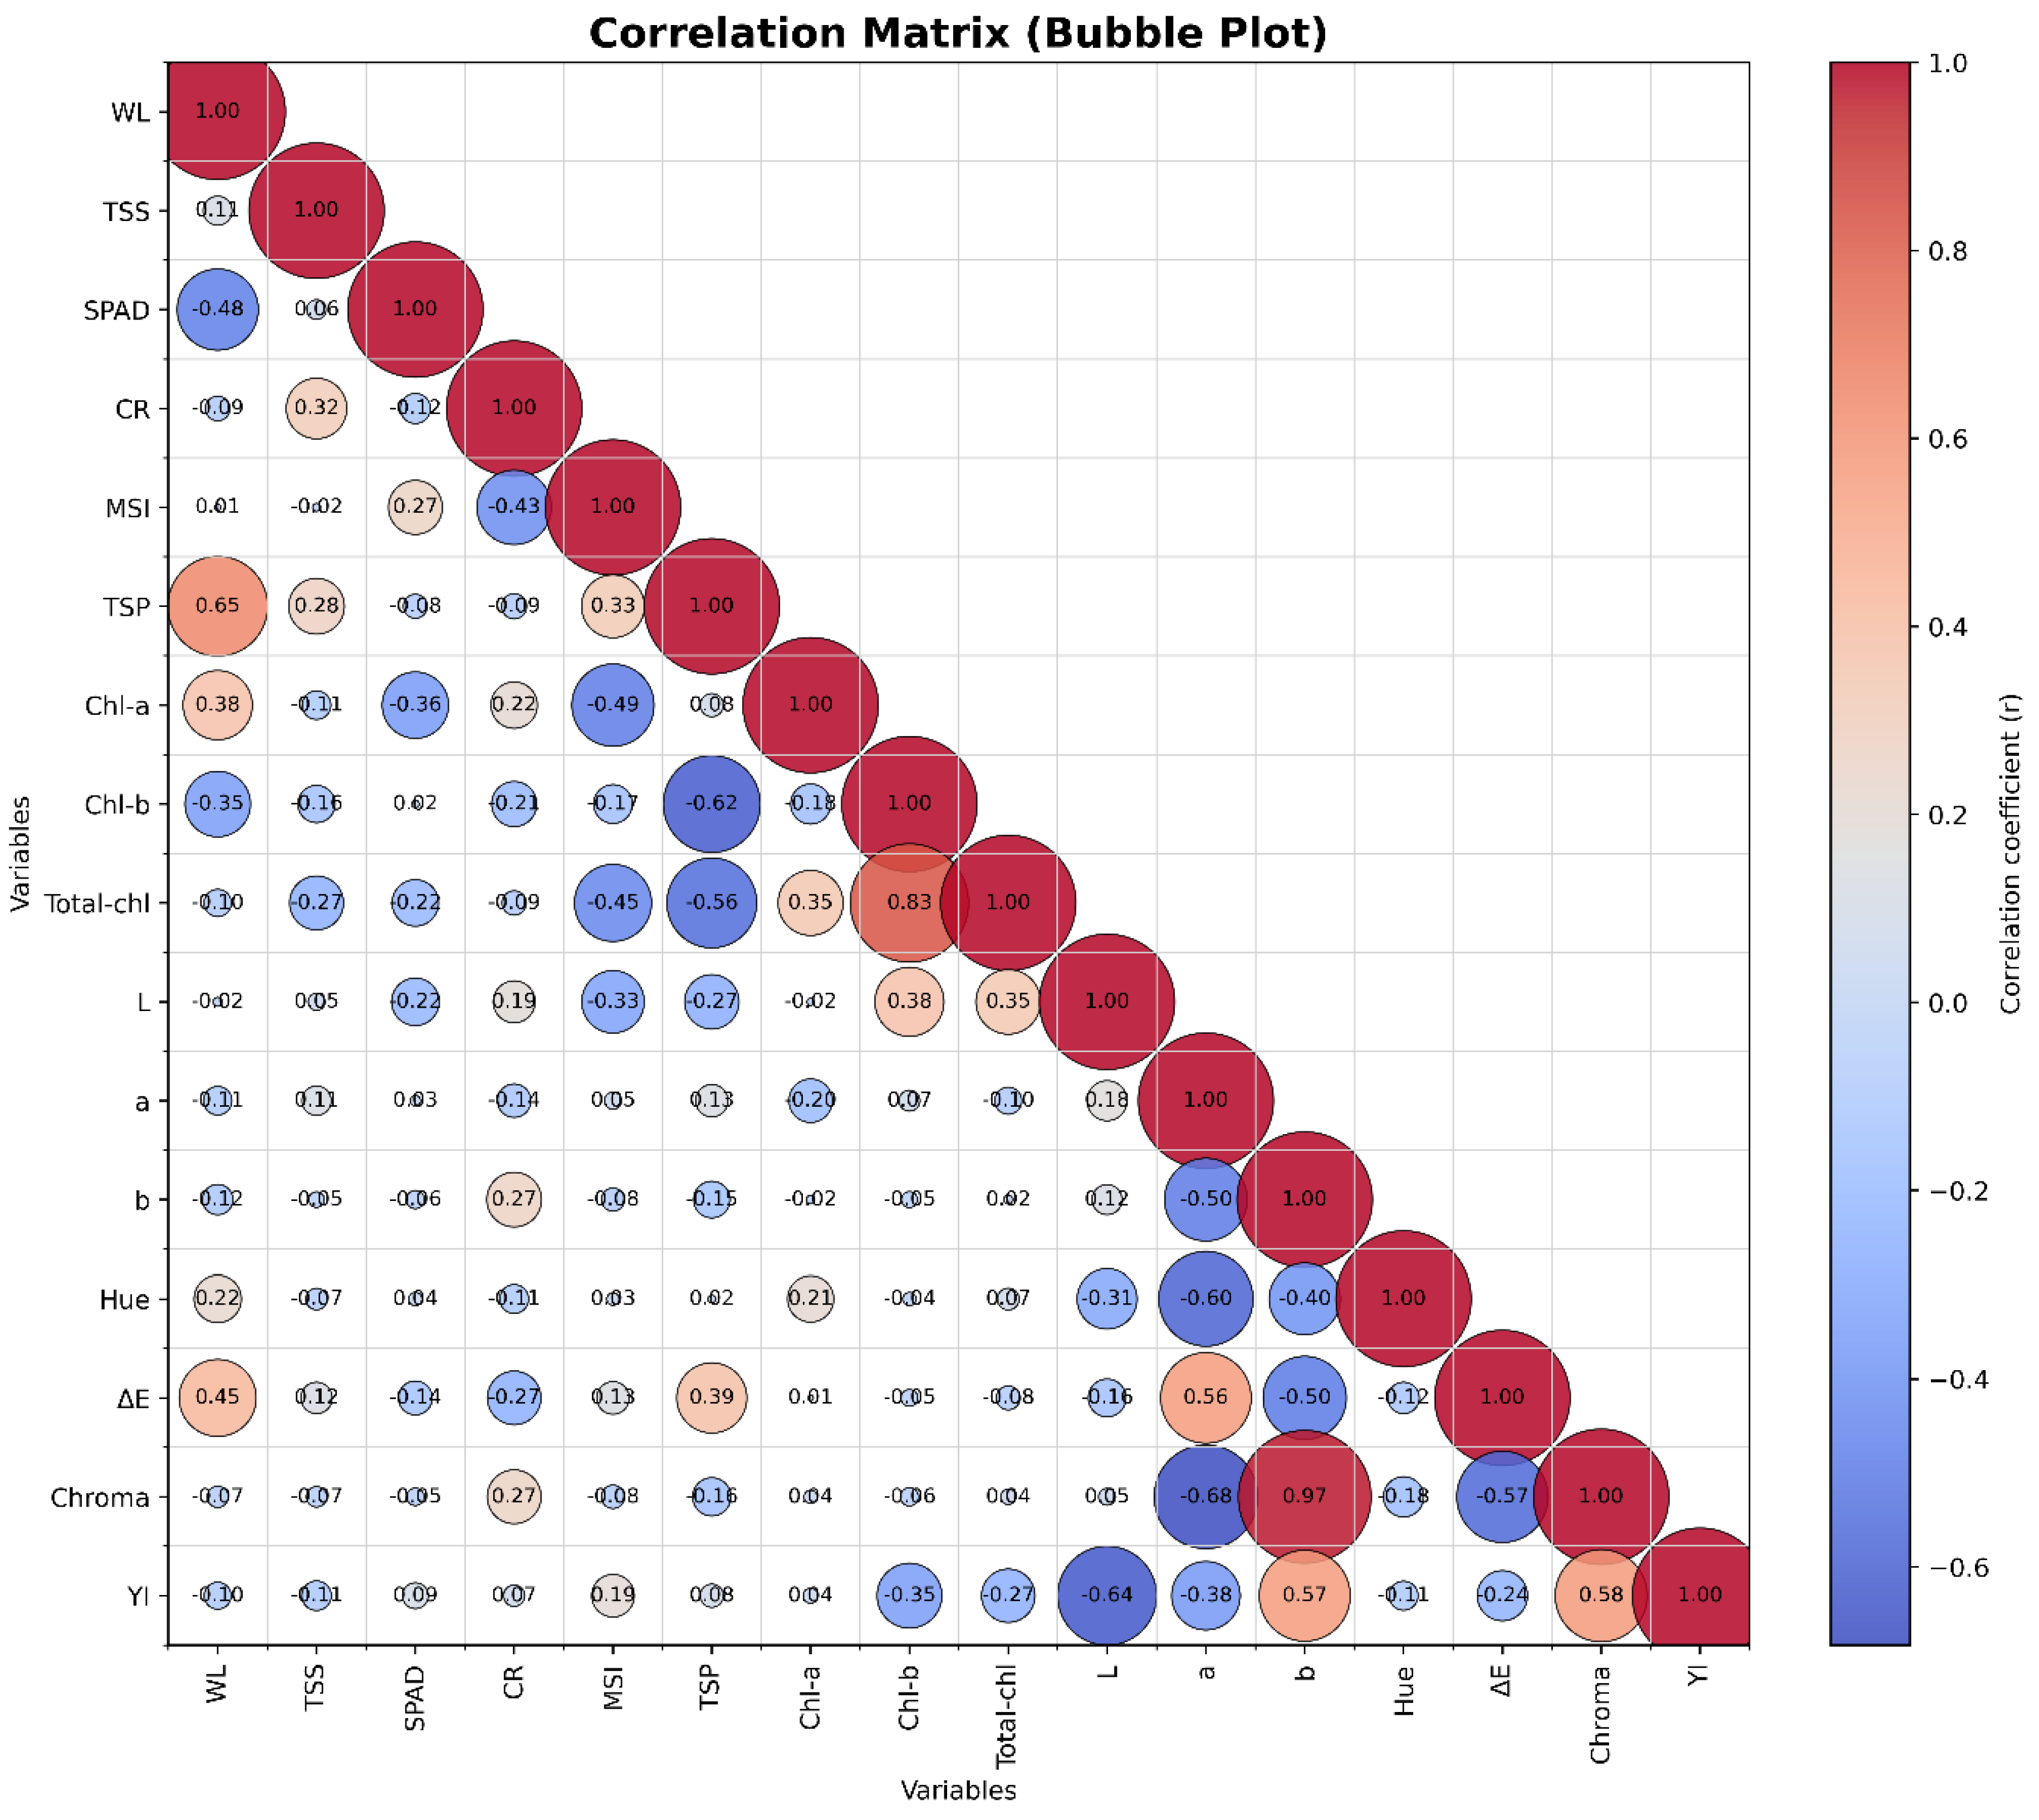
Table 1.
The chemical composition and concentrations of the nutrient solution used for hydroponic lettuce cultivation under deep flow technique (DFT) conditions [9] (Hoagland and Arnon, 1954).
Table 1.
The chemical composition and concentrations of the nutrient solution used for hydroponic lettuce cultivation under deep flow technique (DFT) conditions [9] (Hoagland and Arnon, 1954).
| Concentration | Source |
| 5 mM | Calcium nitrate tetrahydrate [Ca(NO₃)₂·4H₂O] |
| 5 mM | Potassium nitrate (KNO₃) |
| 2 mM | Magnesium sulfate heptahydrate (MgSO₄·7H₂O) |
| 1 mM | Potassium dihydrogen phosphate (KH₂PO₄) |
| 45.5 µM | Boric acid (H₃BO₃) |
| 44.7 µM | Ferrous sulfate heptahydrate (FeSO₄·7H₂O) |
| 30.0 µM | Sodium chloride (NaCl) |
| 9.1 µM | Manganese sulfate monohydrate (MnSO₄·H₂O) |
| 0.77 µM | Zinc sulfate heptahydrate (ZnSO₄·7H₂O) |
| 0.32 µM | Copper sulfate pentahydrate (CuSO₄·5H₂O) |
| 0.10 µM | Ammonium molybdate tetrahydrate [(NH₄)₆Mo₇O₂₄·4H₂O] |
| 54.8 µM | Disodium EDTA dihydrate (Na₂EDTA·2H₂O) |
Table 3.
Analysis of variance (ANOVA) for the effects of treatment, storage time, and their interaction (Treatment × Time) on the physicochemical and physiological quality parameters of fresh-cut lettuce during 18 days of cold storage.
Table 3.
Analysis of variance (ANOVA) for the effects of treatment, storage time, and their interaction (Treatment × Time) on the physicochemical and physiological quality parameters of fresh-cut lettuce during 18 days of cold storage.
| Parameter | Treatment | Time | Treatment × Time |
| Total soluble phenolics (TSP) | 100.236*** | 4318.678*** | 61.724*** |
| Membrane stability index (MSI) | 17.099*** | 43.033*** | 2.876** |
| Cutting resistance (CR) | 22.30*** | 9.108** | 1.733ns |
| Weight loss (WL) | 5.731**4 | 197.426*** | 0.665ns |
| Total soluble solids content (TSS) | 9.265*** | 2.171ns | 1.533ns |
| Chlorophyll a (Chl a) | 5.572** | 176.179*** | 8.617*** |
| Chlorophyll b (Chl b) | 5.844** | 34.946*** | 3.088*** |
| Total Chlorophyll (Total Chl) | 8.895*** | 41.024*** | 4.917*** |
| Chlorophyll stability index (CSI) | 5.944** | 764.772*** | 2.886** |
| Relative chlorophyll content (SPAD) | 25.176*** | 107.225*** | 17.844*** |
| Color coordinates (L, a, b) | 13.189*** | 20.797*** | 7.653*** |
| Hue angle (hue) | 2.944* | 2.215* | 1.326* |
| Color difference (ΔE) | 2.646ns | 13.583*** | 5.082*** |
| Color saturation (Choma) | 1.930ns | 3.504** | 2.043* |
| Yellowing index (YI) | 1.964ns | 46.491*** | 20.061*** |
(1): represents F values. Significance levels are indicated as follows: p <0.05 (*), p <0.01 (**), and p <0.001 (***); ns: not significant.
Table 4.
Changes in total soluble phenolic content (mg GAE 100 g⁻¹ FW) of fresh-cut lettuce as influenced by treatments and storage duration at 4 ± 1 °C.
Table 4.
Changes in total soluble phenolic content (mg GAE 100 g⁻¹ FW) of fresh-cut lettuce as influenced by treatments and storage duration at 4 ± 1 °C.
| Storage Duration (Days) | ||||||||
| Treartments | 0 | 3 | 6 | 9 | 12 | 15 | 18 | Treat Avg. |
| C | 136.8 ± 2.71ns | 298.9 ± 5.83b | 168.1 ± 5.37b | 199.1 ± 2.13a | 386.6 ± 5.56b | 311.7 ± 5.52c | 330.0 ± 5.82a | 261.6 b |
| SA | 136.8 ± 2.71ns | 331.1 ± 5.95a | 157.0 ± 4.83c | 187.0 ± 5.72b | 401.0 ± 4.90a | 340.8 ± 2.89a | 313.2 ± 3.42b | 266.7 a |
| CaNP | 136.8 ± 2.71ns | 238.3 ± 4.18c | 191.6 ± 5.17a | 191.8 ± 5.44ab | 330.4 ± 3.35d | 314.5 ± 4.20c | 300.5 ± 5.43c | 243.4 d |
| CaNP+SA | 136.8 ± 2.71ns | 308.2 ± 5.68b | 175.2 ± 3.32b | 199.2 ±1.71a | 347.6 ± 5.87c | 323.7 ± 4.58b | 293.6 ± 5.61c | 254.9 c |
| Time avg. | 136.8 F | 294.1 D | 173.0 F | 194.3 E | 366.4 A | 322.7 B | 309.3 C | |
Values are expressed as mean ± standard deviation (n = 3). Different lowercase letters within the same column indicate significant differences among treatments (p<0.05), while different uppercase letters within the same row indicate significant differences among storage days (p<0.05) according to Duncan’s multiple range test.
Table 5.
Effects of salicylic acid (SA, 2 mM) and calcium nanoparticles (CaNP, 100 mg L⁻¹) on the membrane stability index (MSI, %) of fresh-cut lettuce during 18 days of cold storage (4 ± 1 °C).
Table 5.
Effects of salicylic acid (SA, 2 mM) and calcium nanoparticles (CaNP, 100 mg L⁻¹) on the membrane stability index (MSI, %) of fresh-cut lettuce during 18 days of cold storage (4 ± 1 °C).
| Storage Duration (days) | ||||||||
| Treatments | 0 | 3 | 6 | 9 | 12 | 15 | 18 | Treat avg. |
| C | 97.71 ± 0.59ns | 94.70 ± 0.79a | 97.33 ± 0.76a | 97.05 ± 0.78b | 96.68 ± 1.19ns | 95.98 ± 0.63a | 97.37 ± 0.33a | 96.69 a |
| SA | 97.71 ± 0.59ns | 93.12 ± 1.29ab | 97.22 ± 0.44a | 98.93 ± 0.04a | 97.07 ± 0.55ns | 96.71 ± 0.52a | 97.27 ± 0.67ab | 96.86 a |
| CaNP | 97.71 ± 0.59ns | 90.90 ± 1.90b | 95.37 ± 0.15b | 97.49 ± 0.50b | 96.82 ± 0.75ns | 93.59 ± 1.59b | 94.42 ± 0.18 c | 95.18 b |
| CaNP+SA | 97.71 ± 0.59ns | 93.96 ± 1.71a | 96.55 ± 0.76a | 98.51 ± 0.31a | 96.22 ± 0.87ns | 96.14 ± 0.50a | 96.34 ± 0.66 b | 96.49 a |
| Time avg. | 97.71 A | 93.17 D | 96.62 B | 97.99 A | 96.70 B | 95.61 C | 96.35 B | |
Values represent mean ± standard deviation (n = 3). Different lowercase letters in the same column indicate significant differences among treatments on the same storage day (p<0.05), while different uppercase letters in the same row indicate significant differences among storage days within each treatment (p<0.05) according to DMRT. ns: non-significant.
Table 6.
Effect of salicylic acid (SA) and calcium oxide nanoparticles (CaNP) on cutting resistance (N) of fresh-cut lettuce during cold storage.
Table 6.
Effect of salicylic acid (SA) and calcium oxide nanoparticles (CaNP) on cutting resistance (N) of fresh-cut lettuce during cold storage.
| Storage Dluration (days) | ||||||||
| Treatments | 0 | 3 | 6 | 9 | 12 | 15 | 18 | Treat avg. |
| C | 13.8 ± 0.94ns | 12.5 ± 1.28a | 11.7 ± 1.48ab | 12.8 ± 1.84a | 13.8 ± 1.73a | 12.2 ± 1.71ns | 14.7 ± 1.30a | 13.1 a |
| SA | 13.8 ± 0.94ns | 11.6 ± 1.32ab | 12.8 ± 1.35a | 11.8 ± 0.91a | 10.7 ± 1.44ab | 12.2 ± 1.56ns | 11.9 ± 1.27b | 12.1 b |
| CaNP | 13.8 ± 0.94ns | 8.5 ± 0.78c | 7.8 ± 0.58c | 8.5 ± 1.46b | 10.7 ± 1.35b | 9.7 ± 0.59ns | 10.9 ± 0.28b | 9.9 c |
| CaNP+SA | 13.8 ± 0.94ns | 9.9 ± 1.04bc | 10.7 ± 0.88b | 11.5 ± 1.22a | 12.2 ± 1.99ab | 10.5 ± 1.56ns | 12.6 ± 1.91ab | 11.5 b |
| Time avg. | 13.8 A | 10.6 C | 10.7 C | 11.1 C | 11.7 BC | 11.2 C | 12.5 B | |
Values represent mean ± standard deviation (n = 3). Different lowercase letters within the same column indicate significant differences between treatments on the same day (p<0.05), while different uppercase letters within the same row indicate significant differences between storage periods according to DMRT (p<0.05). ns: non-significant.
Table 7.
Effect of salicylic acid (SA) and calcium oxide nanoparticles (CaNP) on Chl a, chl b, total Chl, CSI and SPAD values of fresh-cut lettuce during cold storage.
Table 7.
Effect of salicylic acid (SA) and calcium oxide nanoparticles (CaNP) on Chl a, chl b, total Chl, CSI and SPAD values of fresh-cut lettuce during cold storage.
| Treatments | Storage Duration (days) | Treat Avg. | |||||||
| 0 | 3 | 6 | 9 | 12 | 15 | 18 | |||
| Chl a | C | 0.461 ± 0.007ns | 0.379 ±0.018ns | 0.366 ± 0.35b | 0.458 ± 0.001ns | 0.471 ± 0.002a | 0.446 ± 0.010b | 0.447 ± 0.008b | 0.433 b |
| SA | 0.459 ± 0.007ns | 0.348 ± 0.018ns | 0.446 ± 0.005a | 0.456 ± 0.002ns | 0.464 ± 0.000b | 0.459 ± 0.002a | 0.454 ± 0.001ab | 0.441 a | |
| CaNP | 0.460 ± 0.007ns | 0.351 ±0.012ns | 0.438 ± 0.000a | 0457 ± .002ns | 0.463 ± 0.001b | 0.460 ± 0.002a | 0.461 ± 0.001a | 0.442 a | |
| CaNP+SA | 0.459 ± 0.007ns | 0.364 ±0.017ns | 0.424 ± 0.002a | 0457 ± 0.000ns | 0.465 ± 0.001b | 0.459 ± 0.002a | 0.459 ± 0.003a | 0.444 a | |
| Time avg. | 0.460 AB | 0.361 D | 0.424 C | 0.457 AB | 0.465 A | 0.456 B | 0.455 | ||
| Chl b | C | 0.460 ± 0.042ns | 0.414 ± 0.011ns | 0.397 ± 0.025c | 0.473 ± 0.020ns | 0.328 ± 0.011ns | 0.351 ± 0.009ns | 0.458 ± 0.015a | 0.412 b |
| SA | 0.458 ± 0.042ns | 0.424 ± 0.045ns | 0.485 ± 0.022b | 0.494 ± 0.030ns | 0.349 ± 0.024ns | 0.382 ± 0.050ns | 0.448 ± 0.022ab | 0.434 a | |
| CaNP | 0.459 ± 0.044ns | 0.439 ± 0.020ns | 0590 ± 0.011a | 0.531 ± 0.068ns | 0.374 ± 0.026ns | 0.359 ± 0.041ns | 0.401 ± 0.029b | 0.450 a | |
| CaNP+SA | 0.459 ± 0.043ns | 0.438 ± 0.044ns | 0.498 ± 0.040b | 0.524 ± 0.015ns | 0.353 ± 0.029ns | 0.417 ± 0.034ns | 0.436 ± 0.030ab | 0.447 a | |
| Time avg. | 0.459 B | 0.429 C | 0.493 A | 0.505 A | 0.351 D | 0.377 D | 0.436 BC | ||
| Total Chl | C | 0.921 ± 0.035ns | 0.793 ± 0.029ns | 0.763 ± 0.026c | 0.930 ± 0.019ns | 0.800 ± 0.009ns | 0.797 ± 0.016b | 0.905 ± 0.018ns | 0.844 b |
| SA | 0.918 ± 0.038ns | 0.772 ± 0.063ns | 0.931 ± 0.017b | 0.950 ± 0.028ns | 0.813 ± 0.024ns | 0.841 ± 0.046ab | 0.902 ± 0.021ns | 0.875 a | |
| CaNP | 0.919 ± 0.040ns | 0.790 ± 0.030ns | 1.028 ± 0.011a | 0.988 ± 0.066ns | 0.837 ± 0.025ns | 0.820 ± 0.039ab | 0.862 ± 0.028ns | 0.892 a | |
| CaNP+SA | 0.918 ± 0.039ns | 0.803 ± 0.060ns | 0.94 ± 0.039b | 0.981 ± 0.015ns | 0.817 ± 0.029ns | 0.876 ± 0.032a | 0.896 ± 0.027ns | 0.891 a | |
| Time avg. | 0.919 B | 0.789 D | 0.917 B | 0.962 A | 0.817 CD | 0.834 C | 0.891 B | ||
| CSI | C | 100 ± 0 | 85.92 ± 5.50ns | 83.61 ± 4.57b | 99.85 ± 4.13ns | 86.86 ± 3.20ns | 86.62 ± 4.10ns | 97.14 ± 0.75ns | 91.43 b |
| SA | 100 ± 0 | 84.34 ± 2.88ns | 100.13 ± 5.91a | 103.02 ± 5.62ns | 88.75 ± 4.86ns | 91.39 ± 8.02ns | 97.26 ± 5.40ns | 94.98 a | |
| CaNP | 100 ± 0 | 85.66 ± 5.12ns | 110.60 ± 3.64a | 106.65 ± 4.53ns | 90.35 ± 1.97ns | 88.68 ± 7.9ns | 93.19 ± 1.87ns | 96.45 a | |
| CaNP+SA | 100 ± 0 | 86.73 ± 2.51ns | 102.47 ± 6.80a | 105.97 ± 4.97ns | 88.77 ± 5.50ns | 95.15 ± 7.08ns | 97.13 ± 1.35ns | 96.60 a | |
| Time avg. | 100.00 B | 85.66 D | 99.20 B | 103.87 A | 88.68 CD | 90.46 C | 96.18 B | ||
| SPAD | C | 26.2 ± 0.46ns | 27.2 ± 0.86bc | 24.3 ± 0.61a | 23.2 ± 0.44b | 21.5 ±0.72c | 20.5 ± 0.87b | 21.1 ± 0.90c | 23.4 c |
| S | 26.2 ± 0.46ns | 26.1 ± 0.68c | 23.0 ± 0.31a | 22.2 ± 0.68b | 27.2 ± 0.67a | 25.7 ± 0.64a | 23.8 ± 0.70b | 24.9 a | |
| CNP | 26.2 ± 0.46ns | 29.4 ± 0.55a | 23.8 ± 0.87ab | 24.5 ± 0.64a | 26.5 ± 0.56a | 21.3 ± 0.91b | 23.5 ± 0.47b | 25.0 a | |
| CNP+S | 26.2 ± 0.46ns | 28.4 ± 0.93ab | 21.9 ±0.76b | 22.9 ± 0.60b | 24.2 ± 0.68b | 20.4 ± 0.72b | 25.2 ± 0.72a | 24.2 b | |
| Time avg. | 26.2 B | 27.8 A | 23.3 D | 23.2 D | 24.9 C | 22.0 E | 23.4 D | ||
Values represent mean ± standard deviation (n = 3). Different lowercase letters within the same column indicate significant differences between treatments on the same day (p<0.05), while different uppercase letters within the same row indicate significant differences between storage periods according to DMRT (p<0.05). ns: non-significant. .
Table 8.
Effect of salicylic acid (SA) and calcium oxide nanoparticles (CaNP) on color parameters of fresh-cut lettuce during cold storage.
Table 8.
Effect of salicylic acid (SA) and calcium oxide nanoparticles (CaNP) on color parameters of fresh-cut lettuce during cold storage.
| Storage Duration (days) | |||||||||
| Treatments | 0 | 3 | 6 | 9 | 12 | 15 | 18 | Treat avg. | |
| L values | C | 52.4 ± 0.84ns | 52.9 ± 1.05ns | 53.56 ± 1.19a | 53.5 ± 1.28b | 54.1 ± 1.21a | 53.5 ± 0.36a | 54.3 ± 1.54ns | 53.47 a |
| SA | 52.4 ± 0.84ns | 51.7 ± 1.38ns | 51.1 ± 1.03b | 53.9 ± 1.12b | 46.4 ± 1.60b | 50.8 ± 1.65b | 54.2 ± 1.24ns | 51.49 b | |
| CaNP | 52.4 ± 0.84ns | 51.8 ± 0.86ns | 53.3 ± 1.15b | 55.4 ± 1.42ab | 51.4 ± 1.70a | 46.4 ± 1.57c | 53.5 ± 1.10ns | 52.02 b | |
| CaNP+SA | 52.4 ± 0.84ns | 51.0 ± 0.75ns | 51.8 ± 0.67ab | 57.0 ± 1.28a | 52.2 ± 0.88a | 52.7 ± 0.34ab | 54.1 ± 0.79ns | 53.03 a | |
| Time avg. | 52.39 C | 51.87 CD | 52.45 C | 54.94 A | 51.02 DE | 50.82 E | 54.01 B | ||
| Hue | C | 118.4 ± 1.25 | 115.2 ± 1.88 | 117.9 ± 0.71 | 118.5 ± 1.48 | 117.6 ± 0.89 | 118.0 ± 0.61 | 118.8 ± 1.72 | 117.8 b |
| SA | 118.4 ± 1.25 | 117.36 ± 0.64 | 118.9 ± 1.58 | 119.0 ± 0.61 | 119.3 ± 0.72 | 118.6 ± 1.59 | 119.9 ± 0.31 | 118.8 a | |
| CaNP | 118.4 ± 1.25 | 119.5 ± 1.29 | 118.7 ± 0.21 | 117.4 ± 1.71 | 118.8 ± 0.58 | 118.3 ± 1.73 | 119.1 ± 0.97 | 118.6 a | |
| CaNP+SA | 118.4 ± 1.25 | 118.2 ± 0.59 | 118.7 ± 0.39 | 116.6 ± 2.88 | 118.4 ± 0.41 | 118.1 ± 0.78 | 119.3 ± 0.71 | 118.2 ab | |
| Time avg. | 118.4 AB | 117.6 B | 118.5 AB | 117.9 B | 118.5 AB | 118.2 AB | 119.3 A | ||
| Delta E | C | 0 | 2.68 ± 1.66ns | 2.82 ± 1.12ns | 2.51 ± 0.63bc | 3.47 ± 1.96b | 2.05 ± 0.66b | 4.08 ± 1.62ns | 2.52 b |
| SA | 0 | 2.84 ± 1.63ns | 3.05 ± 0.36ns | 2.09 ± 1.11c | 7.74 ± 2.43a | 2.53 ± 1.71b | 3.20 ± 1.27ns | 3.06 ab | |
| CaNP | 0 | 3.77 ± 1.55ns | 2.63 ± 1.57ns | 4.57 ± 0.97ab | 2.32 ± 0.57b | 6.23 ± 1.24a | 3.82 ± 2.24ns | 3.33 a | |
| CaNP+SA | 0 | 2.29 ± 1.07ns | 2.40 ± 0.31ns | 5.64 ± 1.70a | 1.03 ± 0.79b | 1.01 ± 0.37b | 4.45 ± 0.51ns | 2.40 b | |
| Time avg. | 0 | 2.89 AB | 2.72 B | 3.70 AB | 3.64 AB | 2.95 AB | 3.89 A | ||
| Chroma | C | 34.7 ± 0.60ns | 34.9 ± 1.77a | 33.1 ± 1.56ns | 33.1 ± 0.97ns | 32.2 ± 1.81ab | 33.2 ± 0.75ns | 34.3 ± 1.48ns | 33.6 ab |
| SA | 34.7 ± 0.60ns | 32.9 ± 1.75ab | 32.3 ± 0.76ns | 33.8 ± 1.2ns | 29.9 ± 1.68b | 33.4 ± 0.74ns | 33.2 ± 0.72ns | 32.9 b | |
| CaNP | 34.7 ± 0.60ns | 31.2 ± 1.92b | 32.3 ±1.41ns | 32.4 ± 1.25ns | 34.1 ± 0.90a | 34.0 ± 1.64ns | 34.5 ± 1.61ns | 33.3 ab | |
| CaNP+SA | 34.7 ± 0.60ns | 34.0 ± 1.82ab | 34.4 ± 1.90ns | 32.1 ± 1.75ns | 34.0 ± 0.40a | 34.4 ± 0.97ns | 33.2 ± 1.94ns | 33.8 a | |
| Time avg | 34.7 A | 33.2 B | 33.0 A | 32.8 B | 32.6 B | 33.8 AB | 33.8 AB | ||
| YI | C | 83.2 ± 1.15ns | 85.2 ± 1.44a | 77.9 ± 1.47bc | 77.7 ± 1.84a | 75.3 ± 1.04b | 78.3 ± 1.68c | 79.1 ± 1.93ab | 79.54 b |
| SA | 83.2 ± 1.15ns | 80.5 ± 1.69b | 79.1 ± 1.43b | 78.3 ± 1.29a | 80.4 ± 1.66a | 82.6 ± 1.49b | 75.9 ± 1.78b | 80.02 ab | |
| CaNP | 83.2 ± 1.15ns | 74.9 ± 1.85c | 76.1 ± 1.24c | 74.1 ± 1.57b | 83.0 ± 1.68a | 92.6 ± 1.29a | 80.4 ± 1.76a | 80.62 a | |
| CaNP+SA | 83.2 ± 1.15ns | 84.0 ± 1.69a | 83.2 ± 1.08a | 71.8 ± 1.51b | 81.9 ± 1.26a | 82.4 ± 1.99b | 75.8 ± 1.52b | 80.33 ab | |
| Time avg. | 83.24 A | 81.16 B | 79.10 C | 75.49 E | 80.15 BC | 83.96 A | 77.80 D | ||
Values represent mean ± standard deviation (n = 3). Different lowercase letters within the same column indicate significant differences between treatments on the same day (p<0.05), while different uppercase letters within the same row indicate significant differences between storage periods according to DMRT (p<0.05). ns: non-significant.
Disclaimer/Publisher’s Note: The statements, opinions and data contained in all publications are solely those of the individual author(s) and contributor(s) and not of MDPI and/or the editor(s). MDPI and/or the editor(s) disclaim responsibility for any injury to people or property resulting from any ideas, methods, instructions or products referred to in the content. |
© 2025 by the authors. Licensee MDPI, Basel, Switzerland. This article is an open access article distributed under the terms and conditions of the Creative Commons Attribution (CC BY) license (http://creativecommons.org/licenses/by/4.0/).
Copyright: This open access article is published under a Creative Commons CC BY 4.0 license, which permit the free download, distribution, and reuse, provided that the author and preprint are cited in any reuse.


