
Submitted:
11 November 2025
Posted:
11 November 2025
You are already at the latest version
Abstract
This work demonstrates that simple calibration procedures can reduce the error in de-termining relative humidity with a psychrometer by up to 75 times. The psychrometer uses two temperature transducers to measure relative humidity. The calibration consists of comparing both transducers before assembling the psychrometer. A psychrometer assembly is presented, built from readily available parts, which provides temperature data for comparison with a theoretical model. The results are compared against a refer-ence psychrometer to assess errors with and without calibration. A twenty-two-fold de-crease in error was observed for a relative humidity of 62%.
Keywords:
psychrometer
; error
; Arduino
; LM35
1. Introduction
A psychrometer determines relative humidity (RH) from two temperatures: the dry-bulb temperature () and the wet-bulb temperature () [1,2]. The dry-bulb measures the ambient air temperature, while the wet-bulb, covered with a moistened wick, registers a lower temperature due to water evaporation. The rate of evaporation depends on both temperature and RH: as RH increases, the evaporation rate decreases, causing to rise and the psychrometric depression () to approach zero. In air saturated with water vapor (RH = 100%), the evaporation rate equals the condensation rate, and the wet-bulb temperature converges to the dry-bulb temperature, so that . The psychrometer can measure RH only up to 100%; values above 100% indicate that the condensation rate exceeds the evaporation rate, meaning the wet-bulb temperature would exceed the dry-bulb temperature. In such cases, psychrometer equations are generally not applicable. A more detailed description of psychrometers and relative humidity can be found in the work of Araújo [3].
For an ambient temperature of 292.15 K, a relative humidity of 66.8%, and a pressure of 101,325 Pa, an uncertainty of ±1 K in the temperature measurements of the transducers can lead to a maximum absolute error in relative humidity () of up to 15.6%. This work demonstrates that, by performing a simple calibration procedure of one temperature transducer relative to the other, it is possible to reduce the error in determining RH by up to 75× for temperatures in the range 274.15 K < T < 334.15 K and relative humidities of 10% < RH < 90%.
To calculate the air RH (Eq. 1), it is necessary to know the ratio between the saturation vapor pressure () and the partial vapor pressure (). Both pressures are determined empirically; however, knowing an expression for the latent heat makes it possible to obtain using the Clausius-Clapeyron relationship [4]. Several empirical equations exist in the literature to calculate and ; Araújo [3] present 56 relations to obtain RH. In this work, the equations of Tetens[5] and the British United Turkeys [6] are used.
Just as represents the error in relative humidity, corresponds to the temperature error of the wet-bulb transducer; that is, is equal to the temperature indicated by the wet-bulb transducer minus the true wet-bulb temperature. Similarly, represents the temperature error of the dry-bulb transducer.
A decrease in the wet-bulb temperature indicates an increase in the rate of energy demand, which may correspond to an increase in the rate of evaporation due to a decrease in RH. Therefore, readings of the wet-bulb shifted to lower values () result in relative humidity readings shifted to lower values (). Conversely, dry-bulb readings shifted to higher values () also indicate lower relative humidity readings.
In the case of a transducer with wet-bulb readings shifted to higher values (), the environment captures less energy from the evaporation of water at the wet-bulb, resulting in relative humidity readings shifted to higher values (). Similarly, a transducer with dry-bulb readings shifted to lower values () again leads to relative humidity readings shifted to higher values.
Disregarding other sources of error, the magnitude and direction of and define the magnitude and direction of . While the individual influences of temperature uncertainties on the relative humidity error were discussed above, in a more general case must be considered as the result of the combined effects of and , since one contributes in a direction opposite to the other. If both errors are in the same direction, the effect of one can partially offset the interference of the other.In this context, the present work proposes a simple procedure to minimize through the calibration of one transducer relative to the other, ensuring that both have the same direction and magnitude of error.
The variation in pressure has a small influence on the determination of RH compared to the variation in temperature. For example, an uncertainty of ±1 kPa may correspond to an error in RH determination of up to 0.15% [3], whereas an uncertainty of ±1 K can generate an of up to 30.5% within the temperature and relative humidity ranges mentioned previously.
2. Materials and Methods
2.1. Propagation of Temperature Error in Determining Relative Humidity
To evaluate the contribution of and in the determination of RH, RH values were estimated both without uncertainty and with an uncertainty of ±1 K in the dry- and wet-bulb temperatures. The calculations were performed using Scilab [7]. In the theoretical simulation, the Tetens equation (2) was used for in saturated humid air, and the British United Turkeys equation (3) was used for [8]. The relative humidity errors () were computed as the difference between RH values with explicit uncertainties and the exact RH values. The uncertainties applied to and were −1 K, 0 K, and +1 K. By combining these three uncertainty values for the two thermometers, eight different scenarios were obtained, which are analyzed below and presented in Table 1.
The relative humidity, with and without error, was calculated by providing and values with and without uncertainty to the equations described above (Table 1). For the calculations, the initial wet-bulb temperature ( K) was set, and all dry-bulb temperatures () were varied from 274.15 K to 334.15 K in increments of 1.00 K, resulting in 60 corresponding RH values. Then, was increased by 1.00 K, and all values were recalculated, continuing this process up to the final value of 334.15 K.
At the end of this procedure, two RH datasets were generated: one with error and one without error. The error was then obtained by subtracting these two datasets, generating a third list containing the relative humidity error () values. Restricted conditions were applied to avoid computing errors in cases where RH > 100% or RH < 0%.
The results obtained in the eight analyzed cases are summarized in Table 1. From left to right, the first column presents the error imposed on the dry-bulb temperature () in Kelvin; the second column shows the error imposed on the wet-bulb temperature () in Kelvin; the third column presents the simulation result at 10% relative humidity () in percentage; and the last column lists the values at different relative humidities, indicated in parentheses. The values in the and columns are approximate results of the difference between the simulated relative humidity values with uncertainty and those without uncertainty. For example, in the first row, where K and K, the simulation yields at 10% nominal humidity, while the reference (without uncertainty, and ) gives . This results in a relative humidity error of (). In the last column, the error for a relative humidity of 70% is , and similar calculations apply to the remaining values.
Figure 1 illustrates the case corresponding to the first row of Table 1, where K, which produced the largest relative humidity error in the simulation. Figure 2 presents the case corresponding to the sixth row of Table 1, where both thermometers exhibit the same error, K. Each point in the graphs represents a value of , and the blue shaded region represents all possible values within the analyzed range, from 10% to 90% RH.
The range was restricted because the simulation diverges near 0% and 100% RH. This restriction does not compromise the analysis of the propagation of temperature errors in the relative humidity error, since the objective is solely to distinguish the cases resulting from different combinations of dry-bulb and wet-bulb transducer errors.
When analyzing the plots in Figure 1 and Figure 2, it is possible to observe multiple values corresponding to the same relative humidity. This occurs because a given RH value can result from different combinations of dry-bulb () and wet-bulb () temperatures. Consequently, the relative humidity error () varies as a function of both and , producing a range of values for the same nominal RH. The blue shaded region in Figure 1 and Figure 2 represents the phase space between and RH.
It can be observed in Figure 1 and Figure 2, as well as in Table 1, that the relative humidity error ( is larger for lower RH values. The relative errors at (third column of Table 1) range from 0.3 to 1.7, whereas those in the fourth column range from 0.004 to 0.4. For example, in the sixth row of Table 1 — corresponding to the graph shown in Figure 2 — the relative error is 0.32 at , while at it is only 0.004. Therefore, greater care should be taken when measuring low RH values with a psychrometer.
The worst cases found in Table 1 correspond to the first and last rows, where and have uncertainties in opposite directions. Conversely, the best results are presented in the third and sixth rows, where and exhibit errors of the same magnitude and direction. In practice, the transducer errors are generally unknown, and the ideal approach is to calibrate both sensors against a highly accurate reference — which is not always feasible. Nevertheless, these results support the hypothesis proposed in the introduction: calibrating one transducer relative to the other, ensuring , minimizes the error in relative humidity measurement using the psychrometer. This behavior can be observed experimentally, as shown in the following section. Furthermore, according to the fourth and fifth rows of Table 1, it is evident that having one accurate transducer and another with an error typically produces worse results than having both transducers with the same systematic error.
2.2. Experimental Setup
In the construction of the ventilated psychrometer, readily available electronic components were used. The LM35D temperature transducer was selected due to its ease of use and market availability. This sensor offers an accuracy of ±0.9 K and a linearity of 0.25 K over its operating range of 273.15 K to 373.15 K [9,10]. A total of seven LM35D sensors from four different manufacturing batches—National Semiconductors 9403E, 3246N, 32CVV, and 32KLY—were employed: four as dry-bulb transducers (labeled S1d, S2d, S3d, and S4d) and three as wet-bulb transducers (labeled S5w, S6w, and S7w).
As a reference standard, a psychrometer was equipped with two Pt100 Class AA sensors (model F2020-100-1/3B), previously calibrated against a Pt100 Class AAA (model 1PT100KN1515CL1/10), both manufactured by OMEGA Engineering. This setup ensured an overall measurement accuracy better than ±0.05 K. Data acquisition was performed using an open-source electronic platform, the Arduino Mega [11], connected to an IBM PC running ExtraPuTTY [12],an open-source terminal software used for data logging.
The overall assembly is shown in Figure 3. The LM35D transducers were connected to the analog input pins A0 through A6 of the Arduino Mega, with the internal voltage reference set to 1.1 V, providing a temperature resolution of 0.108 K. The Pt100 sensors were connected to an auxiliary front-end board developed in-house, which incorporated a 24-bit analog-to-digital converter (ADS1248) [13] interfaced to the Arduino via SPI [3]. The ADS reading code was implemented with the assistance of the ADS124X library.
Two additional sensors, the SHT75 [14] and the SHT31 [10,15,16], were included to provide an independent and reliable reference for relative humidity, used as a qualitative monitoring parameter. The SHT75 features an uncertainty of ±1.8%, while the SHT31 has an uncertainty of ±2.0%, resulting in a combined uncertainty of ±1.34%. The SHT75 communicates with the Arduino using its proprietary two-wire protocol, whereas the SHT31 employs the I2C interface. The reading code for both sensors was written based on the open-access Adafruit library [17]. A prior characterization of these sensors is presented at the end of this work.
3. Results and Analysis
The data collected comprise two sets, with durations of 60 and 63 hours, respectively, conducted in a closed laboratory room throughout both collection periods. The sampling rate of the reference Pt100 transducers was approximately 2 Hz, with 24-bit resolution provided by the ADS1248 converter. Each data point transmitted from the Arduino to the PC corresponded to a simple average of ten samples.
For the LM35D transducers, measurements were performed using the Arduino’s internal 10-bit ADC, with each transmitted point representing the simple average of 1,000 samples. The data transfer rate from the Arduino to the PC was 0.088 Hz. Subsequently, an additional average of 100 points was applied for graph construction and psychrometer error analysis. Each point in Figure 4 and Figure 5, referring to any psychrometer equipped with LM35D transducers, corresponds to a relative humidity value calculated from the average of 100,000 dry-bulb and 100,000 wet-bulb readings. For the reference psychrometer using Pt100 sensors, each point represents an average of 1,000 readings.
The observed humidity range was approximately 62 % to 82 %, calculated using Equations (2), (1), and (3), for temperatures between 288.65 K and 292.15 K, and under a constant local pressure of 98,000.88 Pa.
Calibration of the LM35D temperature transducers was performed over the range of 280 K to 307 K in a thermostatic bath using four controlled temperature setpoints, aimed at obtaining the data points used to generate the calibration curves. Each point consisted of the average of several hundred measurements at each temperature level. A summary of the results is presented in Table 2 for the dry-bulb transducers and Table 3 for the wet-bulb transducers.
The columns labeled Pt100m in Table 2 and Table 3 represent the average temperatures measured by two Pt100 Class AA sensors at the four temperature setpoints, which are the same Pt100 sensors used in the reference psychrometer assembly (PsyPt).
Using the data from Table 2 and Table 3, the temperature errors of transducers S1d to S7w were calculated by averaging the four temperature steps and referencing the results to the Pt100 measurements. Table 4 summarizes the errors obtained for the LM35D sensors. These absolute errors are not used directly in the calibration procedure proposed for the psychrometer; rather, they serve to indicate the absolute deviation of the transducers relative to an accurate reference. The proposed calibration method involves calibrating one transducer relative to the other—for example, the dry-bulb sensor with respect to the wet-bulb sensor.
Each dry-bulb sensor (S1d, S2d, S3d, and S4d) was paired with each wet-bulb sensor (S5w, S6w, and S7w), resulting in twelve psychrometer combinations. The thermal calibration of these twelve psychrometers was carried out in two modes: the first using linear regression adjustments, and the second applying a simple offset correction between the dry-bulb and wet-bulb transducers.
In the first calibration mode, linear adjustment, four calibration curves were generated: dry-bulb versus wet-bulb, wet-bulb versus dry-bulb, and both versus their mean, using the average values from the calibration setpoints listed in Table 2 and Table 3.
In the second mode, the differences between the dry-bulb and wet-bulb transducers were determined based on the absolute errors presented in Table 4. These differences were then applied as correction factors for the dry-bulb relative to the wet-bulb, for the wet-bulb relative to the dry-bulb, and for both using the mean of the differences. It is worth noting that comparison with a reference sensor is not required; the calibration can be performed simply by subtracting the mean readings of one transducer from the other.
Since the LM35D transducers exhibit good linearity (typically ±0.25 K), as confirmed by the collected data, it can be concluded that both calibration approaches are equivalent. However, because the second approach is simpler to implement, it is adopted for the subsequent analyses. It should be emphasized that the equivalence between the two methods depends on the linearity of the transducers used
Table 5 summarizes the values of for two regions: Low, representing relative humidity in the range of 61–63%, and High, representing 79–81%, based on the 123 hours of data collected from the two datasets. From left to right, the first column identifies the psychrometers; the tenth and unit at most left column (the 1st) indicate the dry-bulb and wet-bulb transducers, respectively. For example, Psy15 consists of transducers S1d (dry-bulb) and S5w (wet-bulb).
The second and third columns present the errors of the psychrometers without applying any correction to the temperature transducers, i.e., without implementing any of the suggested thermal calibration procedures. The fourth and fifth columns show the errors after applying corrections to both dry- and wet-bulb transducers using their average as a reference. The sixth and seventh columns display the errors obtained when only the wet-bulb transducer is corrected using the dry-bulb as a reference.
Among the twelve psychrometers, two representative cases, Psy35 and Psy25, were selected for detailed analysis. The results for Psy35, composed of S3d (dry-bulb) and S5w (wet-bulb), are shown in Figure 4. The six relative humidity curves in Figure 4, from bottom to top, correspond to Psy350 (purple upward triangle), representing the uncorrected psychrometer; PsyPt (red ‘X’), the reference psychrometer using Pt100 sensors; Psy355 (magenta downward triangle), the dry-bulb corrected psychrometer with S3d corrected relative to S5w; Psy35m (blue circle), the psychrometer corrected using the mean of S3d and S5w; Psy353 (green square), the wet-bulb corrected psychrometer with S5w corrected relative to S3d; and the SHT average (black ‘Y’), representing the average of the SHT75 and SHT31 sensors, with the vertical bars indicating their combined uncertainty.
The psychrometer Psy35 without correction (curve Psy350 in Figure 4) exhibited a relative humidity difference of approximately −7.6% compared to the reference psychrometer, PsyPt. Among the corrected versions, the Psy355 curve most closely matched the reference, followed by Psy35m and Psy353. It is noted that throughout the measurement interval, all curves tracked the relative humidity variations indicated by the SHT75 and SHT31 sensors. According to Table 5, the improvement in measurement accuracy for Psy35 using the calibration based on the average (Psy35m) was approximately 25× for the lowest recorded humidity values (RH = 62 ± 1%) and 18× for the highest values (RH = 80 ± 1%).
Figure 4 also shows that there are no significant differences between the three correction methods. The case of Psy35 corresponds to the scenario presented in the last row of Table 1 from the theoretical simulation, in which the dry-bulb transducer error is positive while the wet-bulb transducer error is negative, resulting in a negative relative humidity error, maintaining the appropriate amplitude proportions.
Figure 5 shows Psy25, composed of sensors S2d and S5w, with respective errors of −0.85 ± 0.15 K and −0.71 ± 0.08 K. In this case, although the transducer errors are significant, they do not substantially affect the psychrometer error because the errors have the same sign (negative) and similar magnitude relative to the reference. For this reason, applying corrections to the LM35D transducers - whether based on the dry-bulb, wet-bulb, or their average - reduces the relative humidity error by 1.25%, corresponding to an approximate 5× improvement in at RH = 70%. Thus, the proposed correction method also enhances the psychrometer’s performance.
The humidity sensors SHT31 and SHT75, manufactured by Sensirion, were evaluated against four saturated reference solutions, and the results are summarized in Table 6.
The results presented in Table 6 are consistent with the error specifications provided in the datasheets, except for the temperature errors of the SHT75 sensor. The saturated solutions were prepared using reagents with a purity greater than 97%, with a mass of 10 g, dissolved in distilled and deionized water at a mass ratio of 0.25 to 0.35 (water to reagent). Glass containers with plastic lids and silicone rubber seals, having a volume of 630 cm3 and a base area of 126 cm2, were used. The values in Table 6 represent the statistical analysis of 3,365 to 10,704 data points collected over 1–5 hours, depending on the solution. Temperature stability ranged from ±0.025 K to ±0.05 K depending on the solution, in accordance with ASTM E104-20 standards [19]. The RH values of the saturated solutions in Table 6 were adapted from Greenspan [13]. With the exception of the NaOH solution, the remaining solutions—MgCl2, NaCl, and KCl—correspond to Humidity Fixed Points (HPF) HPF33, HPF75, and HPF85, respectively, as defined in ASTM E104-20
4. Conclusions
The absolute error in relative humidity measurements with a psychrometer can be significantly reduced by calibrating the two temperature transducers, dry-bulb and wet-bulb, either one relative to the other or both against their average, without requiring an external reference. The improvement depends on the uncertainty of the transducers; for instance, with ±1.0 K transducers, an enhancement of up to 75× is possible, depending on the ambient RH. Notably, having one accurate transducer and another with an error is generally worse than having both with the same error. In the practical cases studied, the greatest error reduction observed was 25× at RH = 62%. These results demonstrate that a reliable and affordable psychrometer (Arduino + LM35D) can be implemented, provided one of the proposed calibration procedures is applied, without the need for a third calibrated transducer.
Author Contributions
Conceptualization, E.K.; J.A; D.F. and F.F.; methodology, E.K.; J.A; D.F. and F.F.; validation, K.E. and P.K.; formal analysis, E.K. and P.K.; investigation, ; J.A; D.F. and F.F.; data curation, E.K.; J.A; D.F. and F.F.; writing—original draft preparation, E.K.; J.A; D.F.; P.K. and F.F.; writing—review and editing, E.K.; J.A; D.F.; P.K. and F.F.; visualization,E.K. and P.K.; supervision,E.K.; project administration, E.K.
All authors have read and agreed to the published version of the manuscript.”
Funding
This research received partial financial support from PIBID/UNIPAMPA-CAPES (grant no. 061/2013) and CNPq (project no. 405472/2015-3).
Data Availability Statement
The original contributions presented in this study are included in the article. Further inquiries can be directed to the corresponding author.
Acknowledgments
The authors would like to thank PIBID/UNIPAMPA-CAPES (grant no. 061/2013) for partial financial support, the CNPq project 405472/2015-3, and the undergraduate student Charles Magnus
Conflicts of Interest
The authors declare no conflicts of interest.
References
- H. -Y. Chen, C.-C. Chen, An Empirical Equation for Wet-Bulb Temperature Using Air Temperature and Relative Humidity. Atmosphere 2022, 13, 1765. [Google Scholar] [CrossRef]
- P.R. Wiederhold, Water vapor measurement: methods and instrumentation, CRC press, 2012.
- J.W.B. Araújo, O Erro Na Medição Da Umidade Através De Um Psicrômetro Aspirado, Undergraduate Program in Physics Teaching, Universidade Federal do Pampa, Bagé, RS, Brazil, 2018, pp. 160.
- H. Farahani, R. Wagiran, M.N. Hamidon, Humidity Sensors Principle, Mechanism, and Fabrication Technologies: A Comprehensive Review. Sensors 2014, 14, 7881–7939. [Google Scholar] [CrossRef]
- Tetens, Uber einige meteorologische Begriffe. Z. geophys 1930, 6, 297–309.
- J. Chen, C. Chen, Uncertainty Analysis in Humidity Measurements by the Psychrometer Method. Sensors 2017, 17, 368. [Google Scholar] [CrossRef] [PubMed]
- L. Ma, F. Xia, Z. Peng, Integrated Design and Implementation of Embedded Control Systems with Scilab. Sensors 2008, 8, 5501–5515. [Google Scholar] [CrossRef] [PubMed]
- S. Sherif, Overview of psychrometrics. ASHRAE journal 2002, 44, 33. [Google Scholar]
- B.C.T. Sensor, F.-R.C.T. Sensor, LM35 Precision Centigrade Temperature Sensors, Texas Instruments, (1999).
- B. Oyebola, O. Toluwani, LM35 Based digital room temperature meter: a simple demonstration. Equatorial Journal of Computational and Theoretical Science 2017, 2. [Google Scholar]
- ARDUINO, Disponível em, https://www. arduino. cc/en/Main/Software>, Acessado em Outubro de, (2019).
- J. Nikhila, Web based environmental monitoring system using raspberry pi, 2017 International Conference on Current Trends in Computer, Electrical, Electronics and Communication (CTCEEC), IEEE, 2017, pp. 1074-1080.
- T. Instruments, ADS1248 Data Sheet, ADS1278 Quad/Octal, Simultaneous Sampling, 24-Bit Analogto-Digital Converters, (2008).
- W. Yue, F. Fang, Z. Wei, C. Wei, The temperature and humidity measurement and control system for radon chamber based on SHT75, (2008).
- Kuzmenkov, D. Kuvshinov, S.Y. Buryachenko, A. Kaychenov, I. Karachentseva, Z. Voronin, Monitoring system for temperature and relative humidity of the experimental building, Journal of Physics: Conference Series, IOP Publishing, 2021, pp. 052070.
- P. Nikovski, N. Doychinov, A Prediction Model of Humidity Sensor Response, 2021 XXX International Scientific Conference Electronics (ET), IEEE, 2021, pp. 1-4.
- M. Rimmer, Lady Ada: Limor Fried, Adafruit industries, intellectual property and open source hardware. Journal of Intellectual Property Law and Practice 2021, 16, 1047–1061. [Google Scholar] [CrossRef]
- L. Greenspan, Humidity fixed points of binary saturated aqueous solutions, Journal of research of the National Bureau of Standards. Section A. Physics and chemistry 1977, 81, 89. [Google Scholar]
- E. Astm, Standard practice for maintaining constant relative humidity by means of aqueous solutions. ASTM designation E 1985, 104-85, 790–795. [Google Scholar]
Figure 1.
Simulation of the propagation of the temperature error in the determination of RH, using the equations of Tetens and British United Turkeys from reference [5] and [6]. With an uncertainty of -1K in the dry-bulb and an uncertainty +1K in the wet-bulb, the error in determining RH varies from approximately 2.5 to 30.5 in units of RH (%), in the range from 10% to 90% of RH.
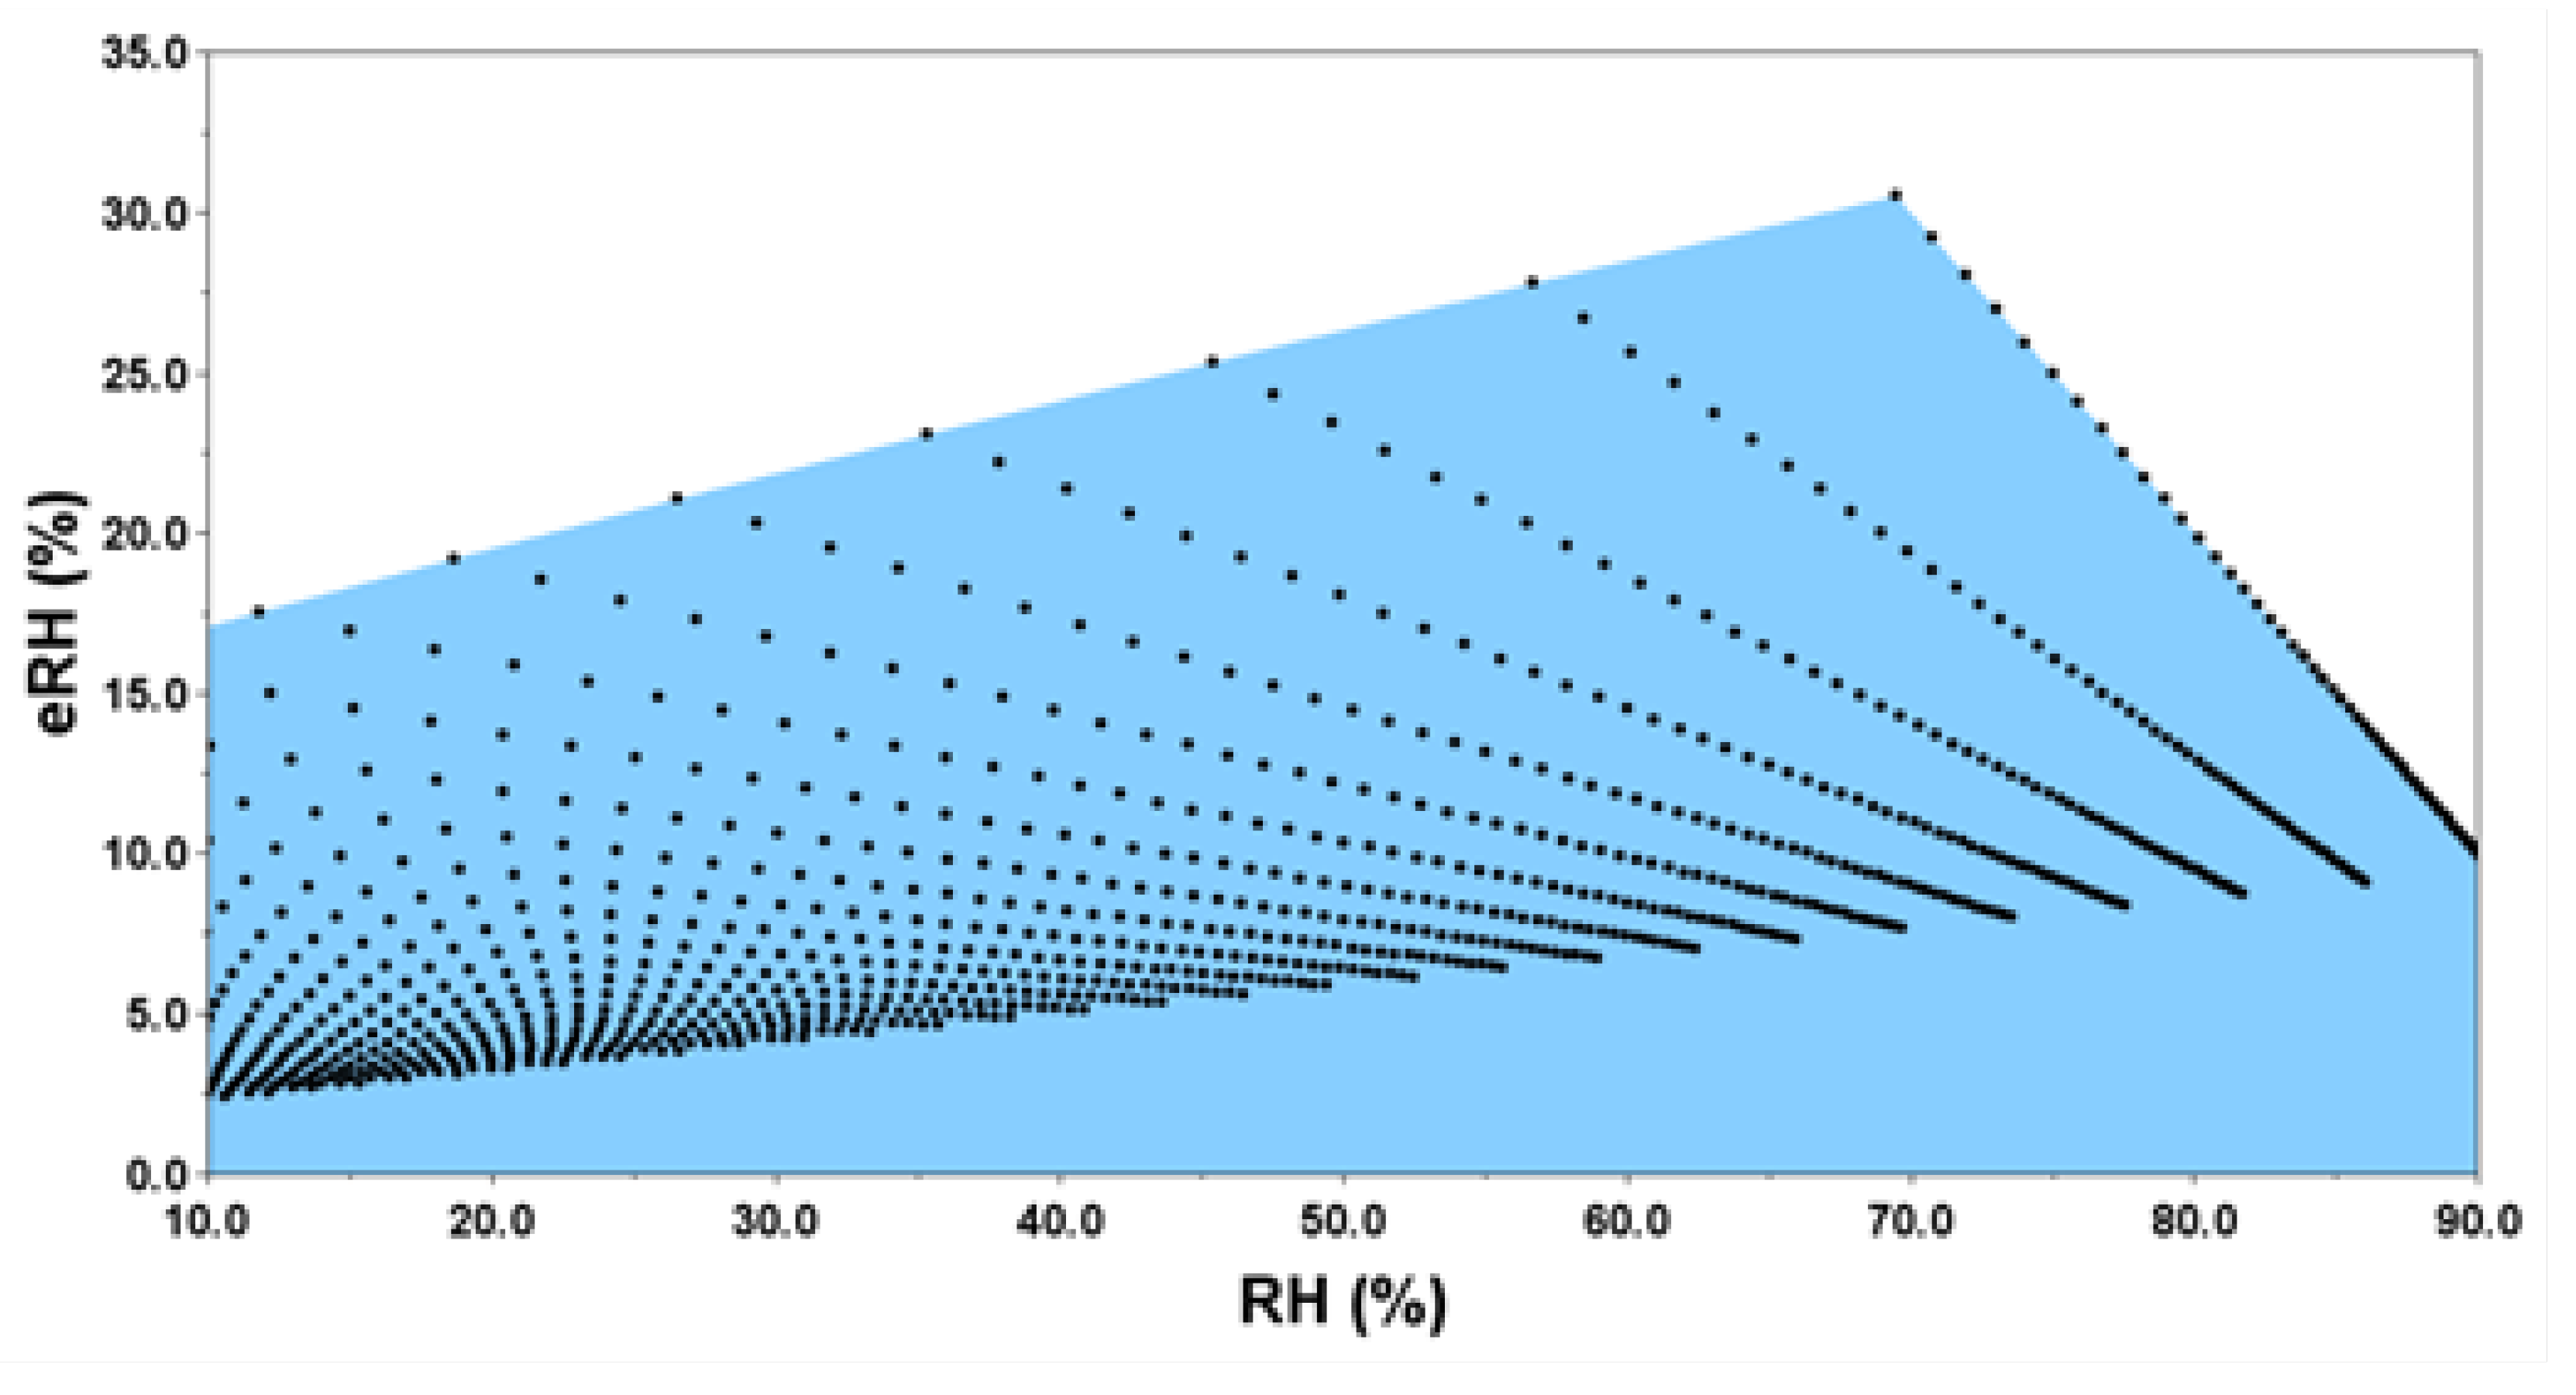
Figure 2.
Simulation of the propagation of the temperature error in the determination of RH, using the equations of Tetens and British United Turkeys. With an uncertainty of +1K in the dry-bulb and an uncertainty +1K in the wet-bulb, the error in determining the RH can vary approximately from 3.2 to 0.1 in units of RH (%), in the range of 10% to 90% of RH.
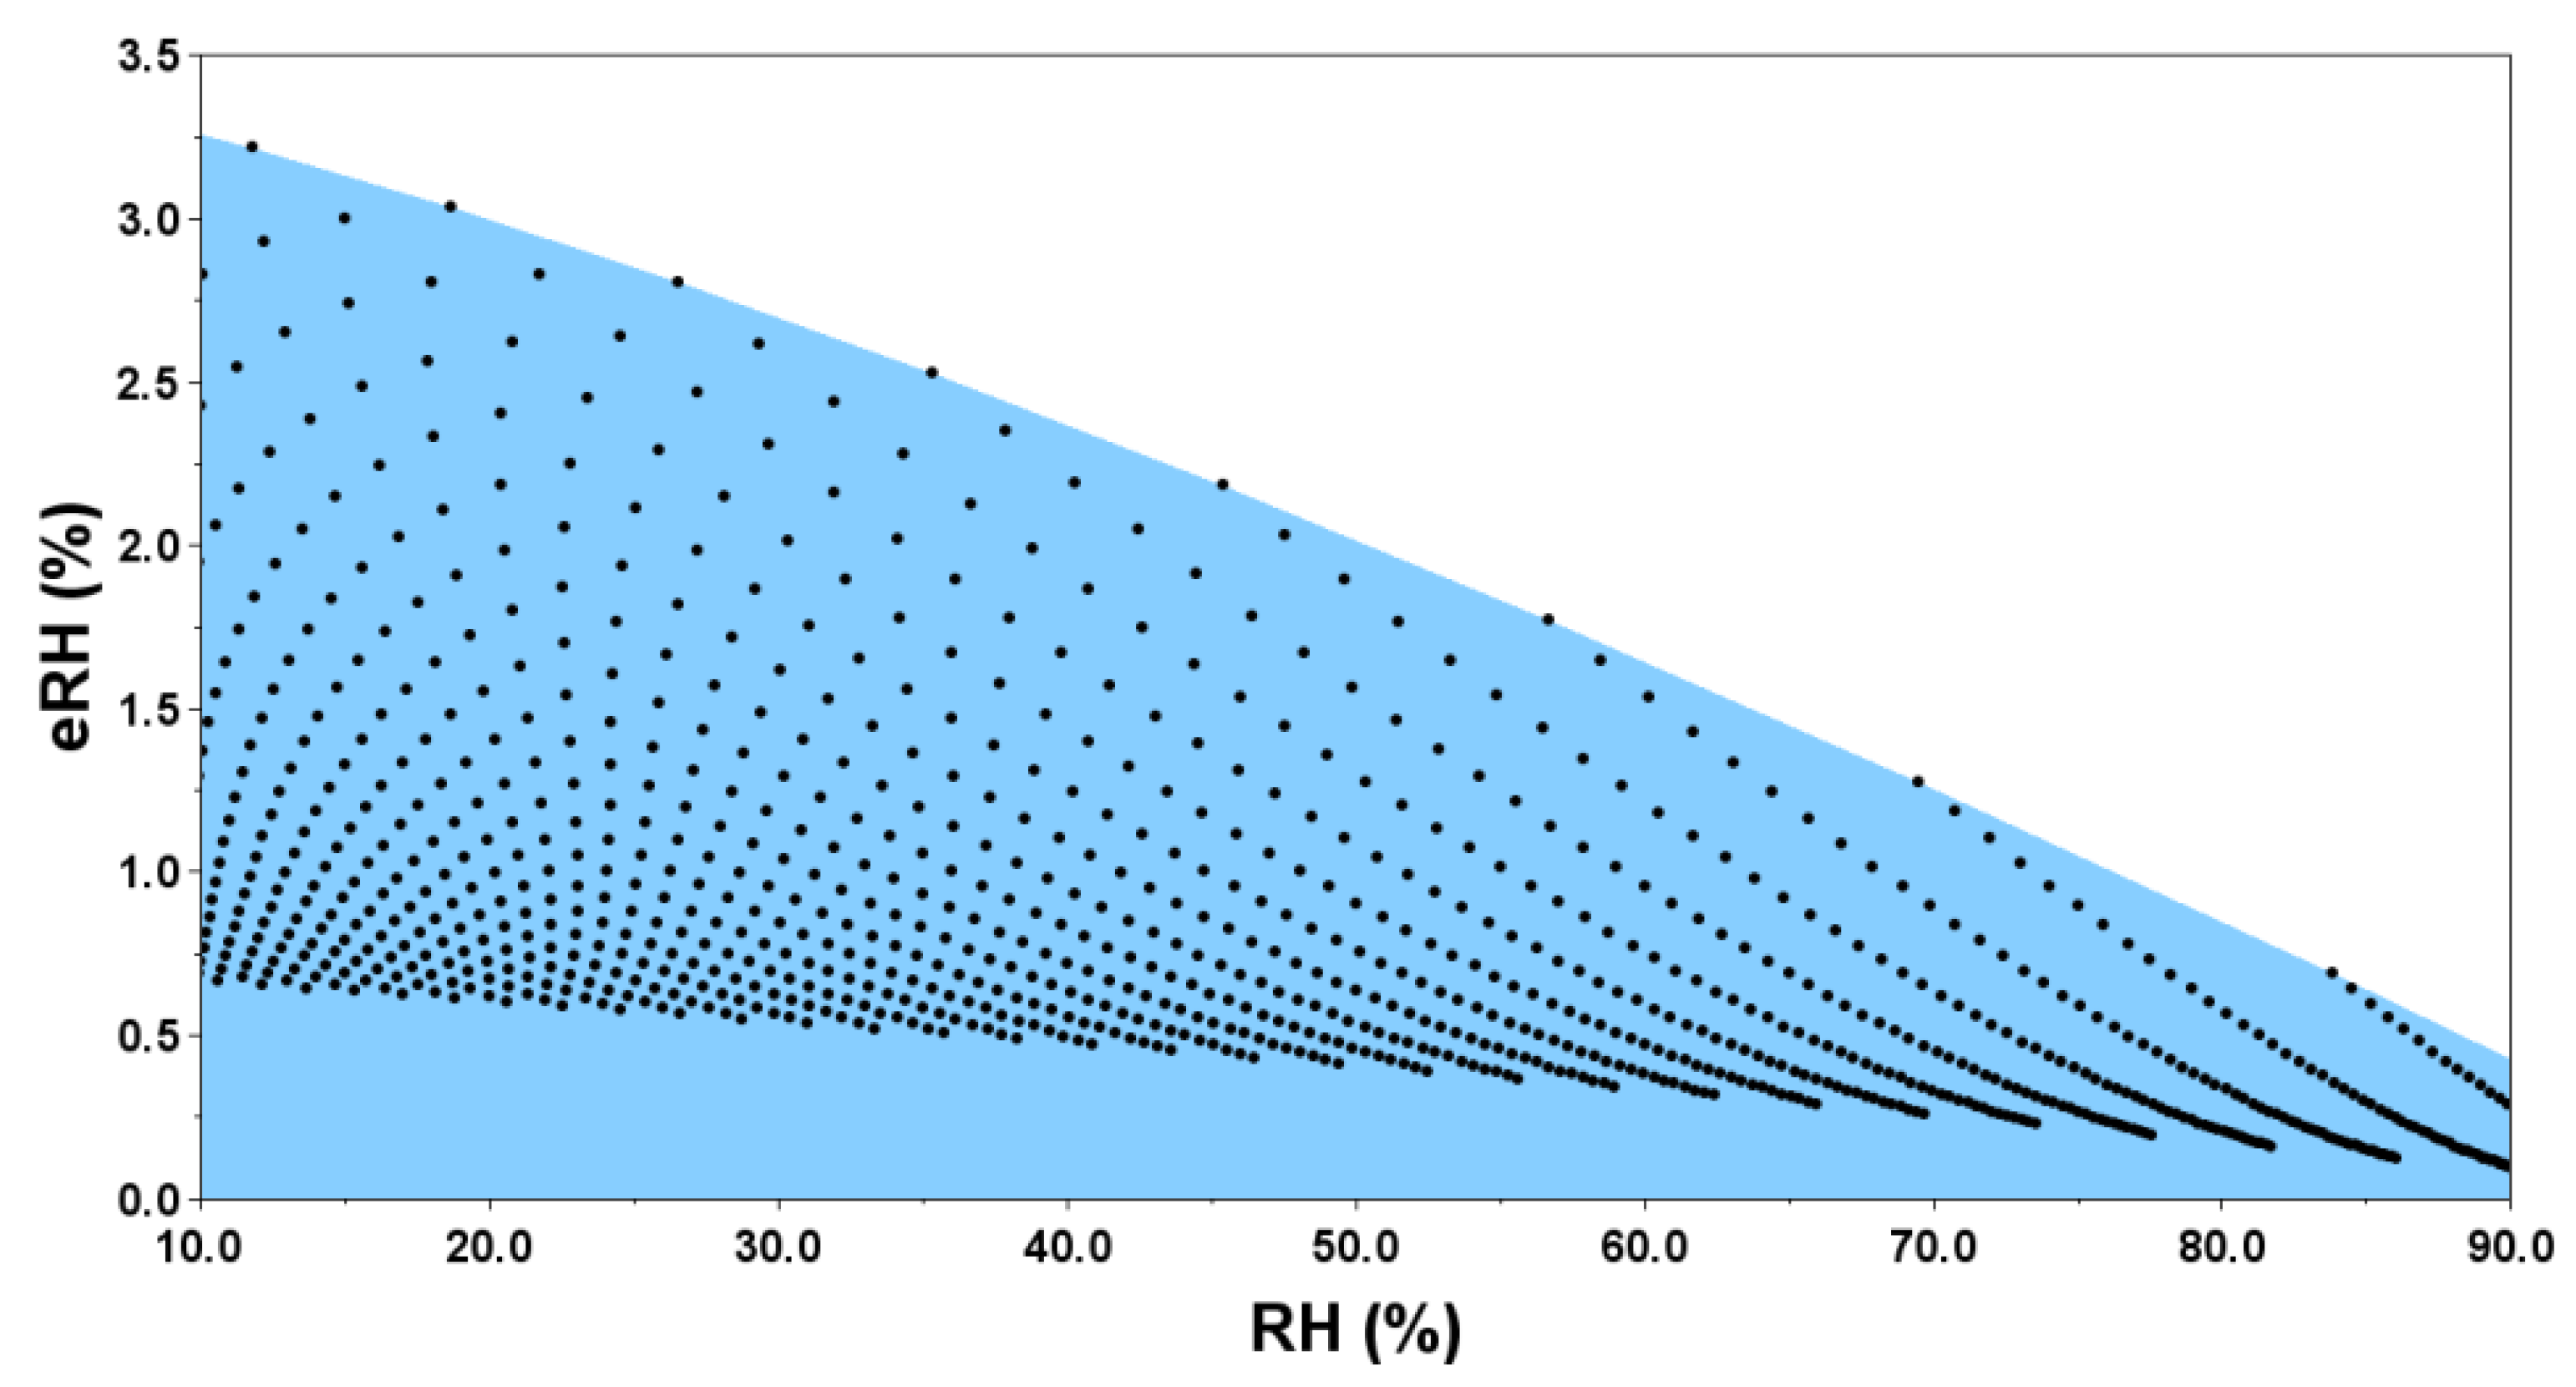
Figure 3.
Block diagram of experimental setup for psychrometer error measurement.
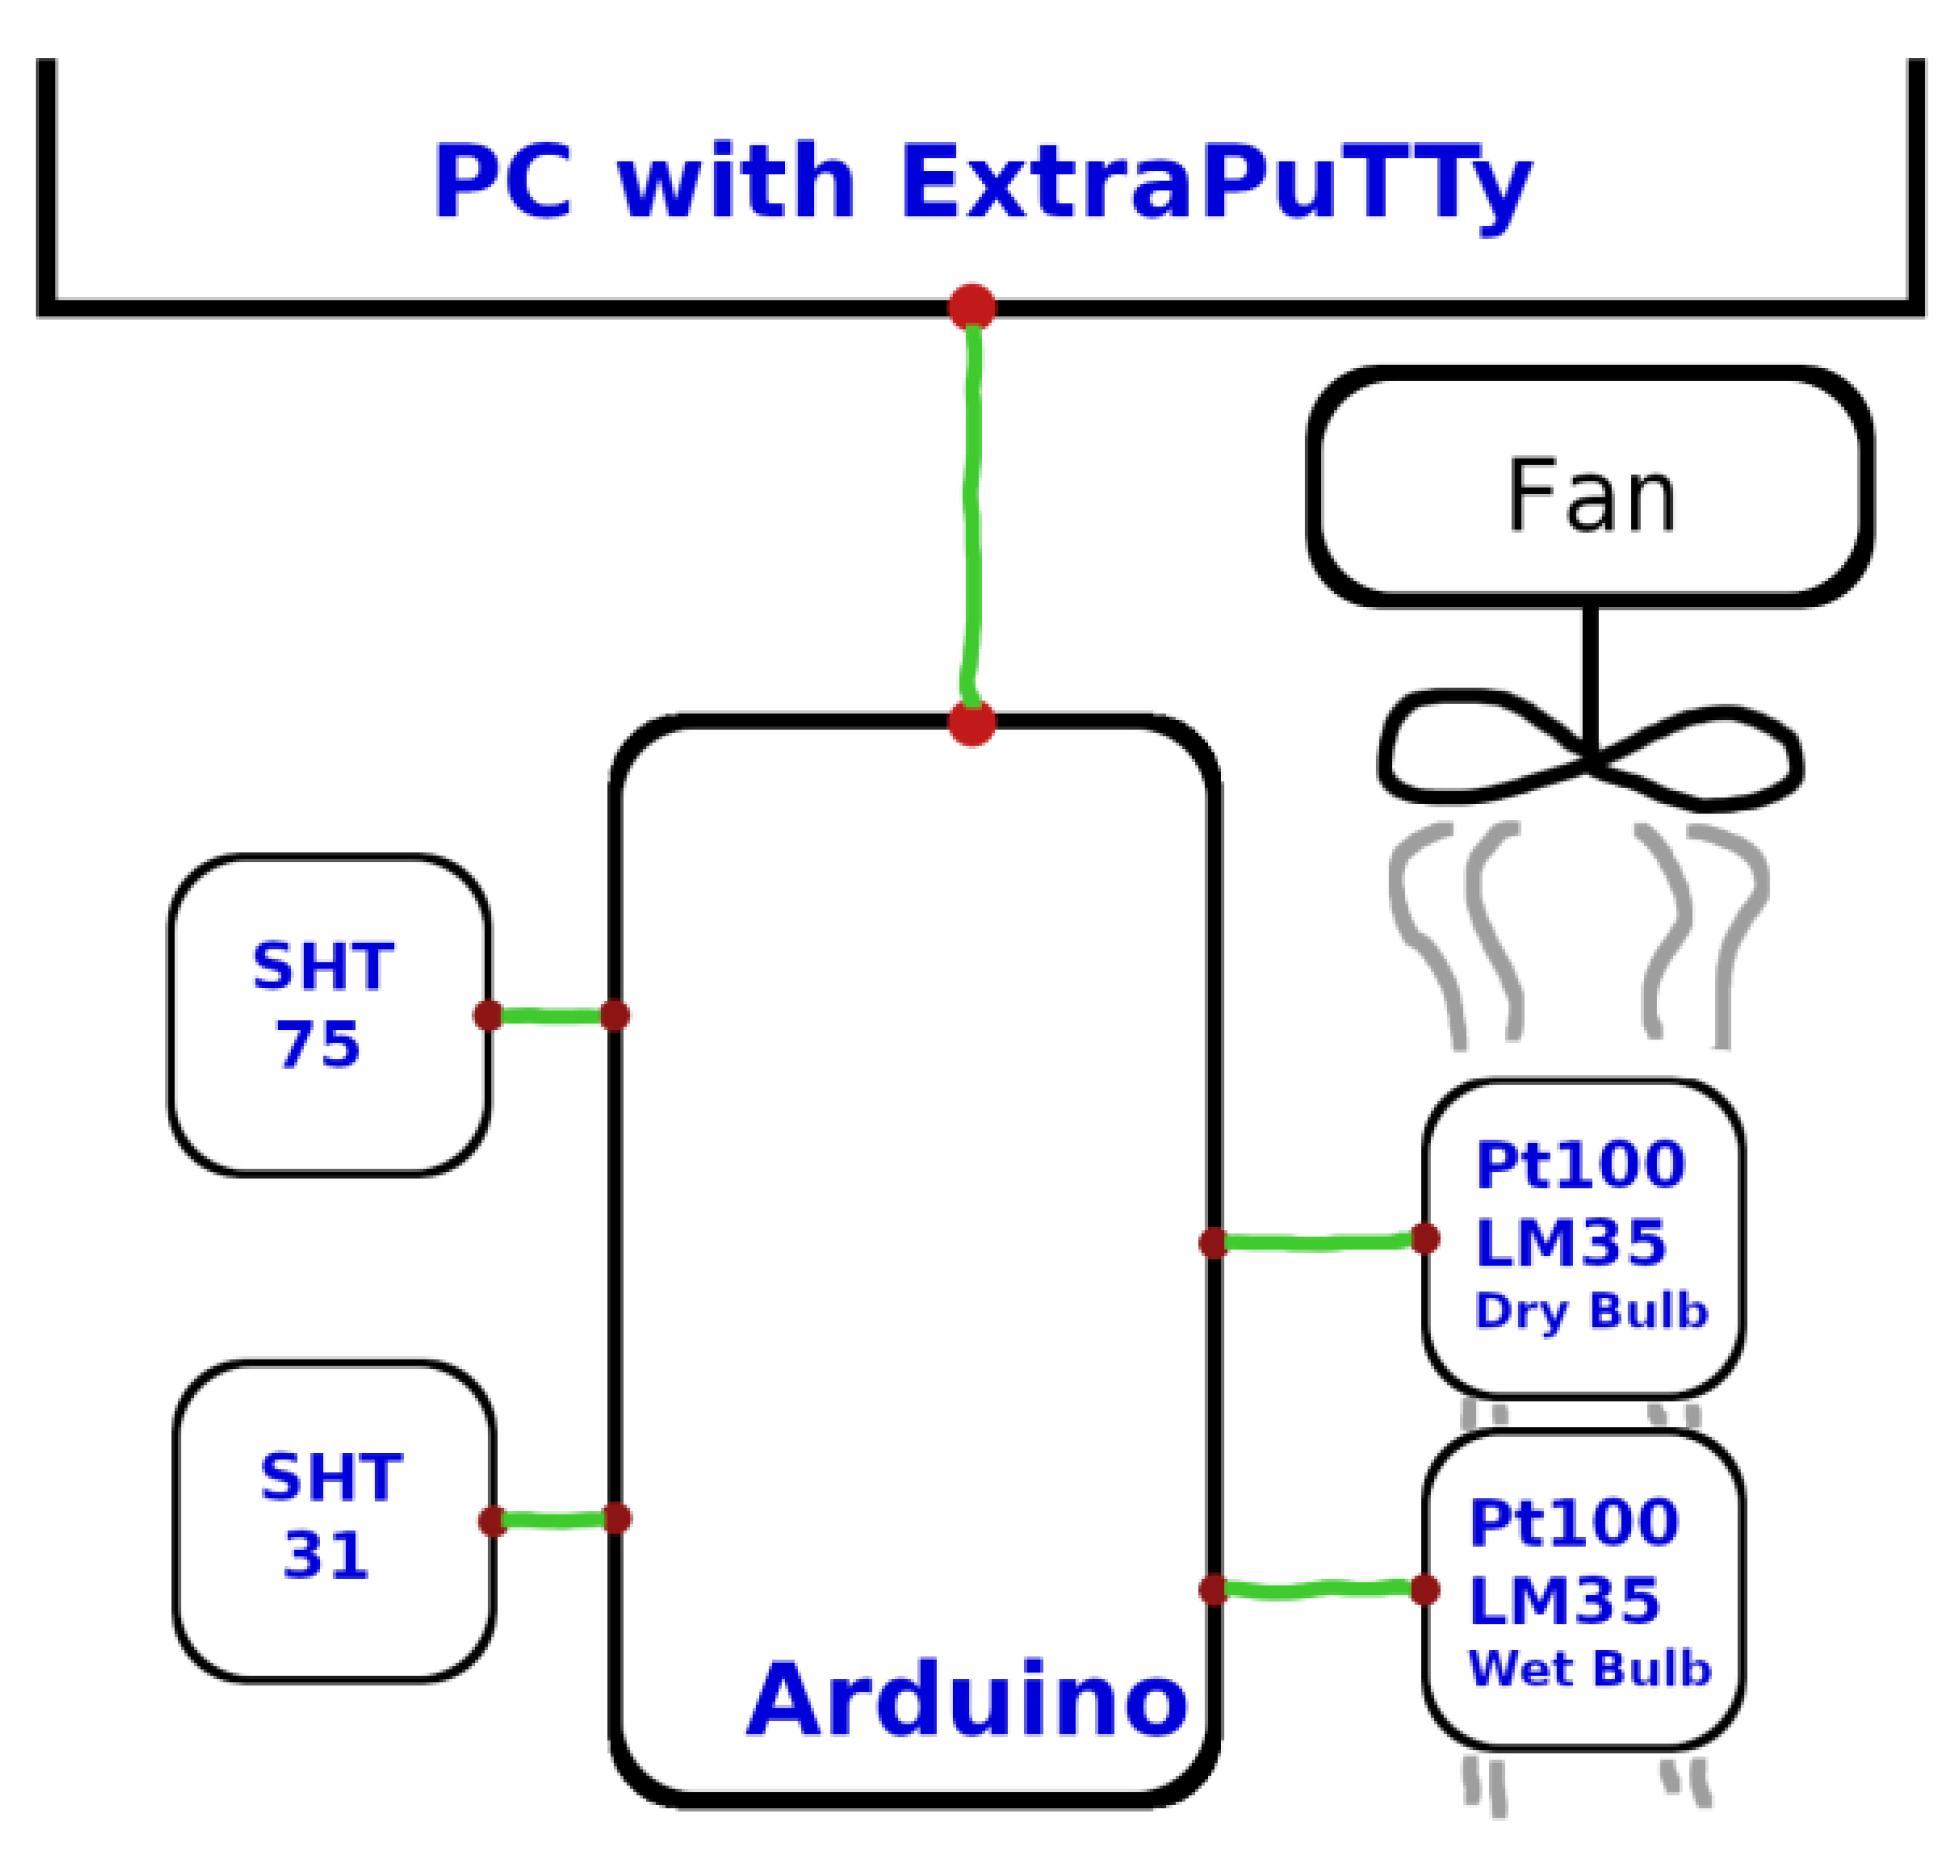
Figure 4.
Psychrometer graph Psy35, without thermal transducer correction, Psy350, and with correction, Psy353, Psy355 and Psy35m, in addition to the reference curves, SHT and Psy Pt, along 63h.
Figure 4.
Psychrometer graph Psy35, without thermal transducer correction, Psy350, and with correction, Psy353, Psy355 and Psy35m, in addition to the reference curves, SHT and Psy Pt, along 63h.
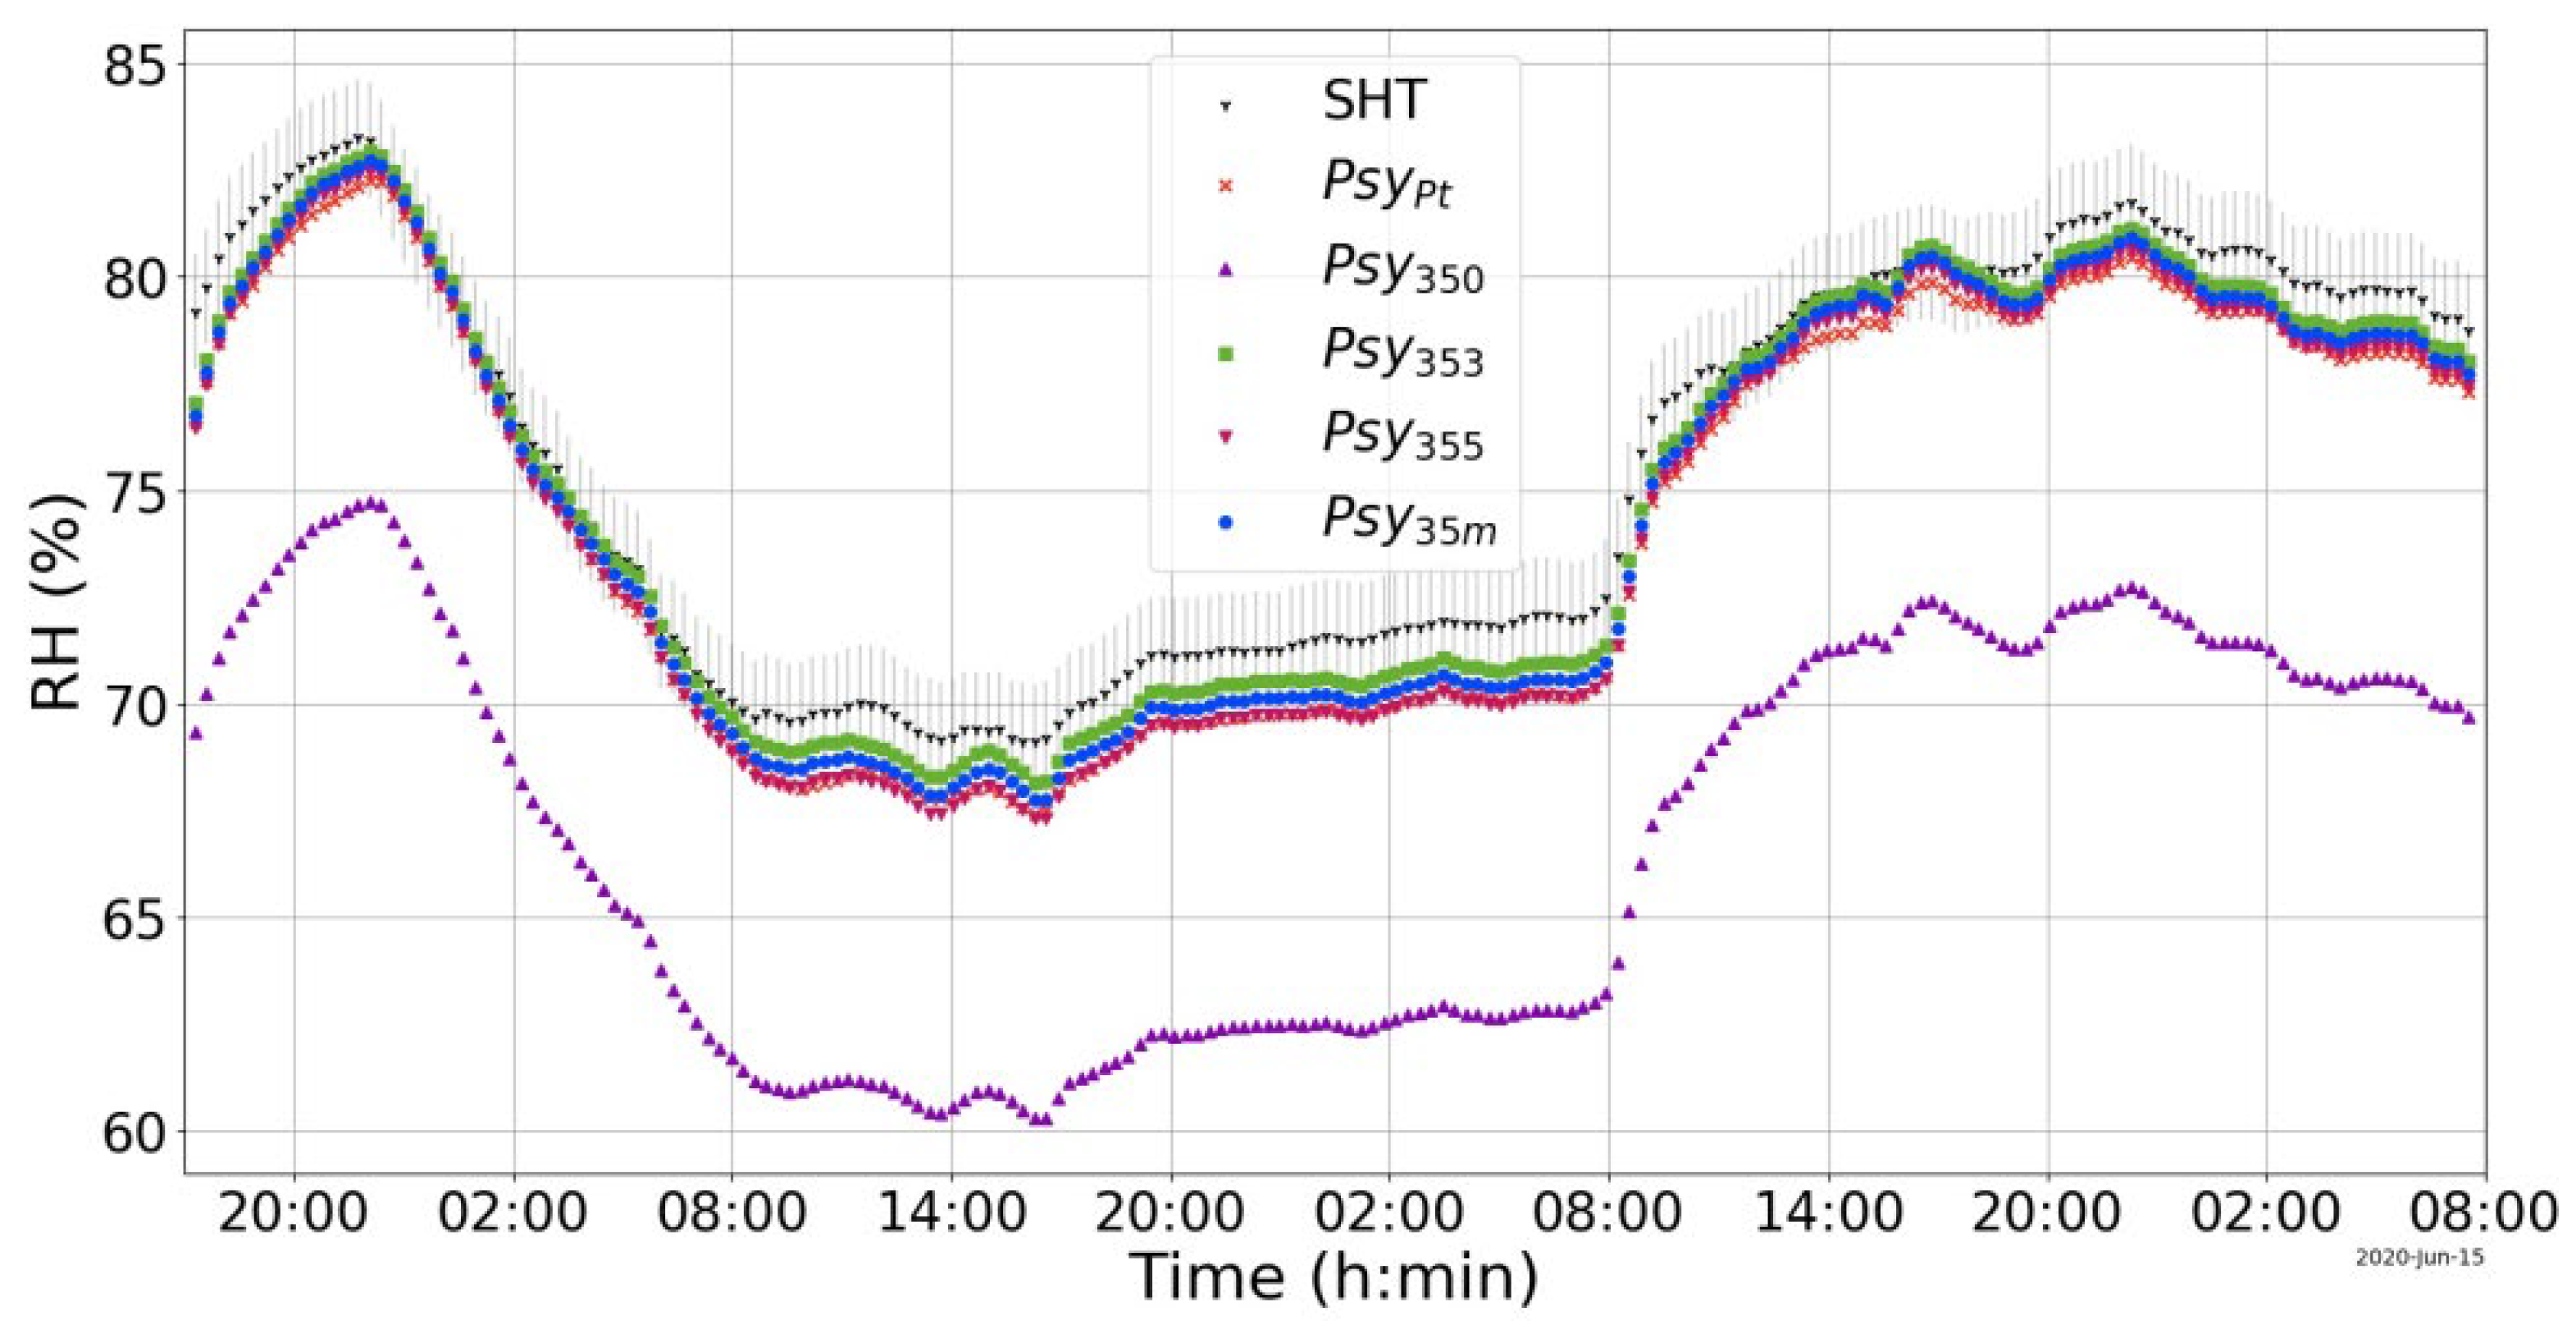
Figure 5.
Psychrometer graph Psy25, without thermal transducer correction, Psy250, and with correction, Psy252, Psy255 and Psy25m, in addition to the reference curves, SHT and PsyPt, along 63h.
Figure 5.
Psychrometer graph Psy25, without thermal transducer correction, Psy250, and with correction, Psy252, Psy255 and Psy25m, in addition to the reference curves, SHT and PsyPt, along 63h.
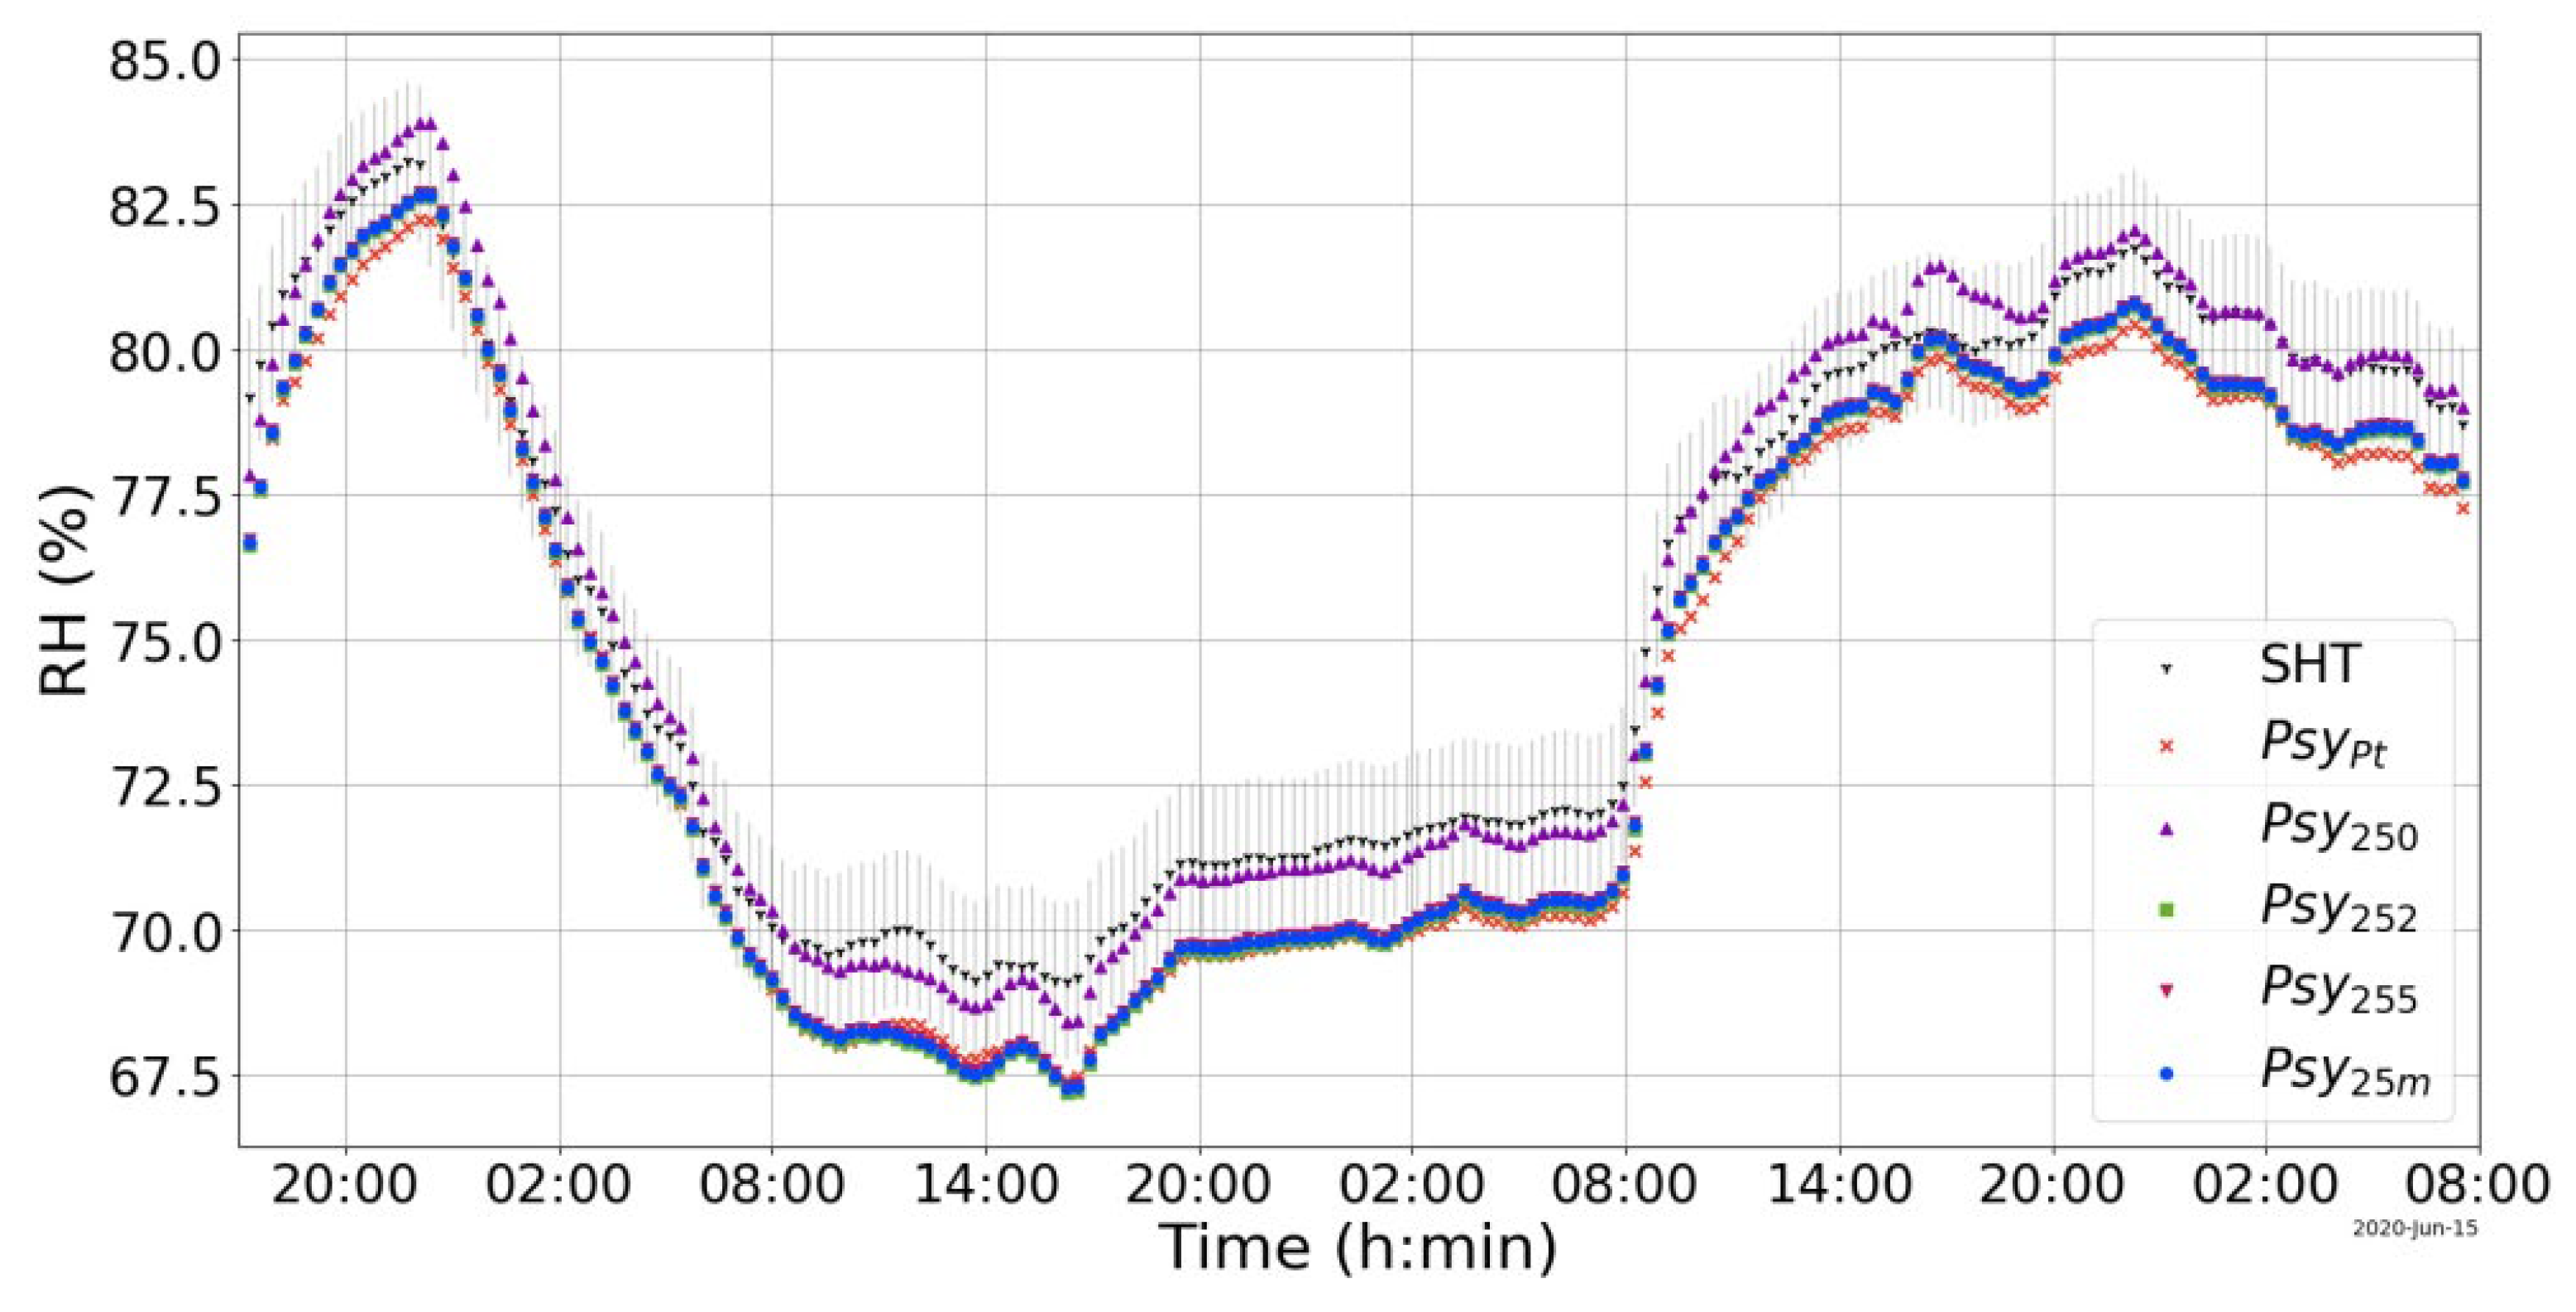

Table 1.
Summary of the simulation results. eTd represents the error imposed on the dry-bulb temperature, eTw represents the error imposed on the wet-bulb temperature, eRH10 corresponds to the error computed for a relative humidity (RH) of 10%, and eRHx corresponds to the error computed for a relative humidity of x%.
| eTd (K) | eTw (K) | eRH10 (%) | eRHx (%) |
|---|---|---|---|
| -1 | +1 | +17 | +30.5 (70%) |
| -1 | 0 | +6.5 | +16.0 (84%) |
| -1 | -1 | -3.5 | -0.50 (90%) |
| 0 | +1 | +9.5 | +16.0 (84%) |
| 0 | -1 | -9.0 | -16.0 (90%) |
| +1 | +1 | +3.2 | +0.40 (90%) |
| +1 | 0 | -6.0 | -15.0 (90%) |
| +1 | -1 | -10 | -30.0 (90%) |
Table 2.
Checkpoints of the LM35D transducers, used in the dry-bulb, referenced to the average of Pt100, the uncertainty is expressed in ±2 sigma.
Table 2.
Checkpoints of the LM35D transducers, used in the dry-bulb, referenced to the average of Pt100, the uncertainty is expressed in ±2 sigma.
| Pt100m (K) | S1d (K) | S2d (K) | S3d (K) | S4d (K) |
|---|---|---|---|---|
| 280.77 ± 0.07 | - | 279.86 ± 0.05 | 281.00 ± 0.05 | 280.72 ± 0.06 |
| 288.69 ± 0.00 | 288.41 ± 0.02 | 287.80 ± 0.01 | 288.90 ± 0.02 | 288.43 ± 0.01 |
| 293.36 ± 0.02 | - | 292.53 ± 0.03 | 293.61 ± 0.03 | 293.11 ± 0.03 |
| 307.07 ± 0.06 | - | 306.34 ± 0.06 | 307.38 ± 0.04 | 306.77 ± 0.06 |
Table 3.
Checkpoints for the LM35 transducers, used in the wet-bulb, referenced to the average of Pt100, the uncertainty is expressed in ±2 sigma.
Table 3.
Checkpoints for the LM35 transducers, used in the wet-bulb, referenced to the average of Pt100, the uncertainty is expressed in ±2 sigma.
| Pt100m (K) | S5w (K) | S6w (K) | S7w (K) | Pt100m (K) |
|---|---|---|---|---|
| 280.77 ± 0.07 | 280.10 ± 0.06 | 281.17 ± 0.05 | 280.15 ± 0.06 | 280.77 ± 0.07 |
| 288.69 ± 0.00 | 287.96 ± 0.02 | 288.89 ± 0.02 | 288.10 ± 0.02 | 288.69 ± 0.00 |
| 293.36 ± 0.02 | 292.65 ± 0.03 | 293.56 ± 0.02 | 292.81 ± 0.03 | 293.36 ± 0.02 |
| 307.07 ± 0.06 | 306.35 ± 0.06 | 307.22 ± 0.07 | 306.57 ± 0.05 | 307.07 ± 0.06 |
Table 4.
Errors of thermal transducers, LM35, referenced to the average of two Pt100, the uncertainty is expressed in ±2 sigma.
Table 4.
Errors of thermal transducers, LM35, referenced to the average of two Pt100, the uncertainty is expressed in ±2 sigma.
| Error on dry-bulb transductor, eTd | |||
| S1d | S2d | S3d | S4d |
| - 0.29 | - 0.85 ± 0.15 | + 0.24 ± 0.10 | 0.23 ± 0.19 |
| Error on wet-bulb transductor, eTw | |||
| S4w | S6w | S7w | |
| 0.71 ± 0.08 | + 0.22 ± 0.19 | 0.57 ± 0.11 | |
Table 5.
Summary of relative humidity errors, eRH, of the twelve mounted psychrometers, from Psy15 to Psy47, uncertainty is expressed in ±2 sigma.
Table 5.
Summary of relative humidity errors, eRH, of the twelve mounted psychrometers, from Psy15 to Psy47, uncertainty is expressed in ±2 sigma.
| Psy Id. |
eRH (%) Low |
eRH (%) High |
eRHm (%) Low |
eRHm (%) High |
eRHd (%) Low |
eRHd (%) High |
|---|---|---|---|---|---|---|
| 15 | -3.77±0.16 | -3.53±0.22 | -0.38±0.20 | +0.14±0.16 | -0.62±0.20 | +0.02±0.16 |
| 16 | +5.17±0.28 | +5.39±0.64 | +1.01±0.32 | +0.89±0.50 | +1.27±0.32 | +1.02±0.50 |
| 17 | -2.45±0.30 | -2.01±0.54 | -0.17±0.30 | +0.46±0.62 | -0.33±0.30 | +0.38±0.62 |
| 25 | +0.47±0.20 | +1.57±0.18 | -0.68±0.18 | +0.32±0.18 | -0.60±0.18 | +0.36±0.18 |
| 26 | +9.74±0.26 | 10.8±0.86 | +0.72±0.34 | +1.07±0.56 | 1.30±0.32 | +1.35±0.58 |
| 27 | +1.84±0.24 | +3.15±0.74 | -0.47±0.24 | +0.64±0.66 | -0.31±0.24 | +0.72±0.66 |
| 35 | -7.68±0.12 | -7.60±0.26 | -0.31±0.12 | +0.42±0.20 | -0.84±0.12 | +0.16±0.20 |
| 36 | +0.94±0.34 | +1.03±0.64 | +1.06±0.34 | +1.16±0.66 | +1.05±0.34 | +1.16±0.66 |
| 37 | -6.41±0.32 | -6.13±0.56 | -0.11±0.28 | +0.74±0.76 | -0.56±0.28 | +0.52±0.76 |
| 45 | -4.36±0.12 | -3.82±0.12 | -0.52±0.16 | +0.36±0.12 | +0.80±0.16 | +0.23±0.14 |
| 46 | +4.53±0.30 | +5.08±0.74 | +0.86±0.34 | +1.10±0.62 | +1.10±0.34 | +1.22±0.62 |
| 47 | -3.05±0.30 | -2.30±0.64 | -0.32±0.30 | +0.68±0.74 | -0.51±0.30 | +0.58±0.74 |
Table 6.
Measurement of the SHT75 and SHT31 transducers referenced standard saturation solutions and a Pt100 AA. Values of RH for the standard solutions taken from Greenspan [18].
Table 6.
Measurement of the SHT75 and SHT31 transducers referenced standard saturation solutions and a Pt100 AA. Values of RH for the standard solutions taken from Greenspan [18].
| Solution | Table Value (% RH) |
Temperature PT100 (K) |
SHT31 (% RH) |
SHT75 (% RH) |
SHT31 (K) |
SHT75 (K) |
|---|---|---|---|---|---|---|
| NaOH | 8.8±2.4 | 293.95±0.04 | 12.21±0.07 | 13.05±0.06 | 293.86±0.04 | 293.28±0.04 |
| MgCl2 | 32.9±0.17 | 295.17±0.03 | 39.23±0.06 | 38.10±0.02 | 295.09±0.04 | 294.68±0.04 |
| NaCl | 75.40±0.13 | 295.76±0.04 | 77.66±0.08 | 76.28±0.1 | 295.67±0.05 | 295.27±0.04 |
| KCl | 85.43±0.31 | 291.36±0.05 | 85.97±0.23 | 85.05±0.18 | 291.27±0.05 | 290.88±0.05 |
Disclaimer/Publisher’s Note: The statements, opinions and data contained in all publications are solely those of the individual author(s) and contributor(s) and not of MDPI and/or the editor(s). MDPI and/or the editor(s) disclaim responsibility for any injury to people or property resulting from any ideas, methods, instructions or products referred to in the content. |
© 2025 by the authors. Licensee MDPI, Basel, Switzerland. This article is an open access article distributed under the terms and conditions of the Creative Commons Attribution (CC BY) license (http://creativecommons.org/licenses/by/4.0/).
Copyright: This open access article is published under a Creative Commons CC BY 4.0 license, which permit the free download, distribution, and reuse, provided that the author and preprint are cited in any reuse.


