
Submitted:
27 January 2025
Posted:
28 January 2025
You are already at the latest version
Abstract
The publication presents the results of research on air humidity in the cabin of a passenger aircraft and develops a simplified model of absolute humidity during an aircraft flight as a function of time, number of passengers, aircraft cabin volume, number of air changes, moisture generated by passengers, initial air humidity and supply air humidity. Based on the measurement results and the developed model, the humidity generated by a single passenger was estimated at 35 g/h, while the number of air changes in the aircraft cabin ranged from 10 1/h to 19 1/h. In order to increase the humidity in the aircraft cabin, it was proposed to modify the ventilation system by adding a humidifier chamber to the supply duct, a controller with the developed model implemented, and a humidity sensor in the aircraft cabin and the supply duct. The value of absolute humidity of the air supplied behind the humidifier chamber can be determined based on the presented algorithm. The developed model based on the humidity balance in the cabin of a passenger aircraft can be used in algorithms for automatic regulation of ventilation in passenger aircraft.
Keywords:
humidity
; passenger aircraft
; humidity modeling
; IAQ
1. Introduction
Air humidity is an important air parameter that significantly affects the air quality and comfort in closed rooms [1,2]. Research results in publications [3,4] indicate that air humidity may have a significant impact on the transmission of diseases through the air. The cabin of a typical passenger plane is usually characterized by a small volume in relation to the number of people in the cabin, and passengers are usually in a sitting position, therefore air humidity has a significant impact on the comfort of air travel. During a flight, there are specific conditions in the aircraft cabin, such as low pressure and low relative humidity [5,6,7,8,9] which cause a number of symptoms such as irritation of the eyes, nose and throat [10]. Minimum relative humidity values most often occur during long-haul flights [11]. The increase in relative humidity in the aircraft cabin can be increased by greater air recirculation in the aircraft cabin, as humidity emissions caused by passengers become less diluted by the dry air outside [12].
Humidity in an aircraft cabin can be predicted using computer simulations. Mass and heat transfer modeling can be divided according to the space dimension criterion: one-dimensional, two-dimensional and three-dimensional models. Three-dimensional models are based on numerical methods such as the finite element method or the finite volume element method, require complex spatial meshes and are most often determined using commercial programs such as AnsysFluent or Comsol. The results of three-dimensional modeling in the cabin of a passenger aircraft are most often velocity fields [13,14,15,16] streamlines [14,15] temperature fields [15,16,17] vorticity distributions [13] and pollutant distributions and relative humidity fields [16]. The results of calculations of air parameters in the cabin of a passenger aircraft allow for modifications to the existing ventilation systems in the cabin of a passenger aircraft. Two-dimensional problems are not used to simulate air parameters due to the lack of axisymmetricity in the aircraft cabin geometry. One-dimensional models are used to determine average air parameters [18,19,20]. There are few one-dimensional models in the literature intended for determining air humidity in the cabin of a passenger aircraft. In publication [5] a quite complicated model for determining relative humidity in the cabin of a passenger aircraft was developed, based on the steady-state conditions, which requires iterative calculations.
The aim of the work is to conduct research and analyze air humidity in the cabin of a passenger aircraft and to develop a simplified model of air humidity based on the parameters of the supply air, the number of passengers, the cubic capacity of the aircraft cabin, the number of air changes and moisture generated by passengers. The developed simplified model of absolute humidity can be implemented in controllers intended to regulate air humidity in the cabin of a passenger aircraft, e.g. by using humidification chambers to increase air humidity. It should be noted that the air in the cabins of passenger aircraft is characterized by too low relative humidity.
2. Materials and Methods
According to the technical documentation of the Boeing 737 passenger aircraft [21] 50% of the volume flow of air supplied during the flight is taken from outside and 50% of the volume flow is recirculated air, which is filtered by HEPA filters. Ventilation operates continuously during the flight. During the flight, external air is taken from the engine compressors in front of the combustion chamber [21] so that exhaust gases do not enter the aircraft cabin. It is assumed that the external air taken at cruising altitude is very clean and dry. Due to low pressure and low temperature (-37°C), the external air at cruise altitude is compressed and the temperature is raised to the required value. The air in the aircraft cabin is blown through vents in the ceiling of the aircraft cabin (Figure 1) and through additional supply vents with the possibility of adjusting the flow of air supplied individually by individual passengers (an example vent marked with a red circle in Figure 1). Air is removed from the aircraft cabin through exhaust vents located in the lower part of the cabin.
Measurements of relative air humidity and temperature were made using Testo type 175H1 recorders [22]. Measurements were taken in the front and center of the aircraft. The sensor was located on the side wall of the cabin. The measurement range and accuracy of the temperature of the TESTO recorder is 20 to +55 °C ±0.4 °C, while in the case of relative humidity the measurement accuracy is ±2%RH (2 to 98%RH). The measurement of relative humidity and temperature of the air supplied from the diffuser was performed every 5 minutes by applying a sleeve with a diameter of 30 mm and a height of 50 mm with a centrally mounted humidity and temperature sensor to the diffuser marked with a red line in Figure 1. The adopted method of measuring humidity and temperature was modeled on measuring sleeves from Testo [22]. It should be noted that during an airplane flight it is not possible to measure the parameters of the air supplied inside the ventilation ducts. To measure absolute pressure, a Testo recorder with an absolute pressure probe with an accuracy of ±3 hPa was used [22].
Fourteen measurement series of flights were tested during the research. The stages of travel on an airplane have been divided into three periods: the first period is the time from boarding the plane to the moment the plane takes off (the time spent on the plane before the plane takes off), the second period is the flight time and the third period is the time from the moment the plane lands on the airport runway to passengers exiting. Table 1 contains basic data of airplane flights for fourteen measurement series: plane model, flight date, route length, time spent on the plane, time spent on the plane divided into periods and the number of passengers. The length of the flight route was determined based on data from the FlightAware website [23].
Figure 2 shows the relationship between the total time spent on the plane and the duration of the flight depending on the route length (Table 1). Both the total time spent on the plane and the flight time are very strongly correlated with the route length, as indicated by the R2 coefficients, which are equal to 0.935 and 0.961, respectively.
3. Results and Discussion
In order to assess the air quality inside the cabin of a passenger aircraft in terms of temperature and air humidity, the measurement results were averaged. Table 2 shows the average temperatures and relative humidity for fourteen measurement series for the periods before the plane takes off, during the flight, after landing and during the entire stay of passengers on the plane. Arithmetic mean value relative humidity and temperature from all measurement series were 22.76% and 26.18°C, respectively. The average temperature values before the flight, during the flight and after landing are similar and are approximately 26°C. In the case of relative humidity, the lowest average values occur during the flight (17.75%), while the highest relative humidity values were observed in the period before the plane took off (36.17%). The lowest relative humidity extremes and the highest relative humidity extremes were 7.3% and 68%, respectively. Figure 3 shows a comparison of the minimum, average and maximum relative humidity values from fourteen measurement series with the test results in publications [5,9]. Airplane flight is characterized by low atmospheric pressure inside the cabin of a passenger plane [8]. The average absolute pressure values for measurement series 1-14 during the airplane flight were, respectively: 790.81 hPa, 782.23 hPa, 827.99 hPa, 832.88 hPa, 835.53 hPa, 839.69 hPa, 807.34 hPa, 827.64 hPa, 789.88 hPa, 796.49 hPa , 823.37 hPa, 838.41 hPa, 812.55 hPa and 814.12 hPa.
Figure 4 presents the relationship between the average temperature and relative humidity in the cabin of a passenger aircraft during the flight depending on the number of passengers. The average temperature in the aircraft cabin for fourteen measurement series ranged from 24.55°C to 26.98°C and was poorly correlated with the number of passengers (R2=0.0014). In the case of relative humidity, which for fourteen measurement series during the flight ranged from 11.9% to 26.46%, an average correlation (R2 = 0.432) with the number of passengers can be observed.
The psychometric chart (Figure 5) generated using the program 25 shows the average values of temperatures and relative humidity in the aircraft cabin for all measurement series. The marked green area is the comfort zone according to ASHRAE 1. The following assumptions were made to calculate the comfort field: average air speed equal to 0.1 m/s, clothing: trousers, business shirt, shoes (0.65 clo), seated position of passengers with little activity (1.40 metre) and mean radiant temperature equal to 25.6°C. The arithmetic mean value of absolute pressure from all flights (series 1-14) was assumed for calculations, equal to 815.64 hPa. All points of the average temperature and relative humidity values of measurement series 1-14 are located outside the comfort zone.
In publication [24], based on the combination of temperature and relative humidity in rooms where people stay, the air was categorized into "Good", "Intermediate" and "Bad". The air quality assessment based on the literature [24] is presented in Table 3. From the point of view of this categorization and average temperatures and relative humidity, the most frequently occurring assessment was the "Intermediate" assessment. The "Bad" rating appeared in measurement series no. 2 and 9 during the period when passengers were in the aircraft cabin before take-off and in measurement series 4 and 6 after the plane landed. The reasons for the "Bad" ratings were too high a temperature in relation to the relative humidity (series 2, 4 and 6) and too low a relative humidity in relation to the temperature (series 9).
It should be emphasized here that according to the literature [25], the minimum relative humidity for a temperature of 20°C should not be less than 30%, while according to the design standard PN-EN 13779:2007 [26], in winter the recommended relative humidity should not be less than 40% for a room temperature 26 °C. In the case of recommendations from the literature [25] and the PN-EN 13779:2007 standard [26], the air in the cabin of a passenger aircraft did not meet the above-mentioned conditions in most measurement series [25,26] due to too low relative air humidity.
Figure 6 shows an exemplary course of changes in the altitude of the aircraft (series 10) based on data from the website FlightAware [23] and the measured courses of temperature, relative and absolute humidity in the aircraft cabin at the same time. Changes in air humidity trends in the aircraft cabin can be divided into several stages. The first characteristic trend of humidity changes starts from the moment of entering the plane and ends until the ventilation volume flow increases (stage 0-1 marked in Chart 2). This period of several minutes (0-1, Figure6) is characterized by an increase in relative and absolute humidity. Determining the value of humidity generated by a single passenger during this period is complicated because the physical activity of passengers is complex and involves taking seats and storing luggage in lockers. During this period, the doors to the plane are open. The second distinguishing stage is the period from increasing the ventilation volume flow to the start of taxiing of the aircraft and reducing the ventilation volume flow (1-2, Figure 6). In the second period, a decrease in air humidity can be noticed, which is related to the nominal ventilation operation. The third stage (2-3, Figure 6) is the period during aircraft take-off from reducing the ventilation volume flow to increasing the ventilation volume flow. In the third stage, reducing the ventilation volume flow causes an increase in the air humidity content. The fourth period (3-4, Figure 6) is the time of take-off of the plane and the simultaneous increase in the ventilation volume flow, which causes a decrease in air humidity in the aircraft cabin. The fifth period (4-5, Figure6) is the time of climb and flight of the aircraft at a constant flight altitude. In the fifth period, a decrease in relative and absolute humidity can be observed, followed by a period of stabilization of the moisture content in the air. During this time, passengers sleep or perform minor physical activity, such as reading a book or eating a meal. The humidity generated by an individual person can be assumed based on data from sleeping and minor physical activity. When increasing the altitude of the aircraft, fluctuations in relative humidity can be noticed, which are caused by the variable humidity outside the aircraft occurring at an altitude of up to one kilometer [27]. The sixth period (5-6, Figure 6) is the time from the moment the plane lowers its altitude to the moment the plane lands and stops at the airport. When the aircraft stops, the value of the ventilation volume flow decreases or the ventilation is completely turned off, which causes an increase in the moisture content in the aircraft cabin. The seventh period (6-7, Figure 2) is the time interval from the moment the plane stops until the passengers leave the plane. Due to the high activity of passengers (getting up from their seats and taking their luggage from the shelves) and reducing or turning off the ventilation, a significant increase in humidity in the aircraft cabin can be observed in the sixth period.
4. Modeling humidity in the cabin of a passenger plane
The developed one-dimensional model of absolute humidity in the cabin of a passenger plane is designed for the period from the plane's take-off to the moment of landing (period 4-5 in Figure 6). In the case of the period of passengers staying in the aircraft cabin before take-off and after landing, determining the boundary conditions is difficult due to the complicated activity of passengers during this time. The humidity model in the aircraft cabin is based on the moisture balance, which takes into account the humidity generated by passengers Qg [g/h] and the humidity supplied from the supply air system or discharged through the exhaust ventilation Qn [g/h]:
where ω [g/m3] is the absolute humidity in the cabin of a passenger aircraft, t [h] is time, and V [m3] is the volume of the cabin of a passenger aircraft. For the calculations, the volume of the passenger aircraft cabin was assumed to be 203 m3, in accordance with the Boeing documentation [28].
Humidity supplied from the supply ventilation or removed from the aircraft cabin by the exhaust ventilation systems, described by the following formula:
where: ωa [g/m3] is the absolute humidity supplied from the supply air installation, ωi [g/m3] is the absolute humidity inside the aircraft cabin, and n is the number of air changes in the cabin of a passenger aircraft.
The absolute humidity supplied from the supply installation was determined based on humidity measurements from the supply vent, then the results were interpolated with the following rational function (Figure7):
where t [min] is the time, and a, b, c, d, e, f, g are the coefficients of formula (3), which are presented in Table 4. Figure 7 shows the results of absolute humidity measurements at the outlet air vent from the moment the plane takes off and a formula interpolating the obtained test results. The Pearson coefficient is R2 = 0.863.
Humidity generated by passengers in the aircraft cabin is described by the following relationship:
where qg [g/(h*person)] is the humidity emitted by a single airplane passenger. The amount generated by a single passenger depends primarily on the passenger's physical activity. During an airplane flight, passengers are in a seated position and their main activity is sleeping, eating meals, reading books or using applications on smartphones or tablets. Based on the literature [29,30], light activity and sleeping were assumed, where the estimated humidity emitted by a single person was 35 g/h.
After taking into account dependencies (2) and (4) in formula (1), and then integrating equation (1), the following model of absolute humidity in the cabin of a passenger plane was obtained:
where: ωt=0 is the initial absolute humidity at the moment of take-off, adopted on the basis of the experiment, and presented in Table 3 for individual measurement series.
Figure 8, Figure 9, Figure 10 and Figure 11 present a graphical comparison of the results of absolute humidity determined from model (5) with experimental results for fourteen measurement series. The relative error of model (5) was determined from the following relationship [31]:
where: ωexp are the values of absolute humidity from the experiment, while ωinside is the absolute humidity determined from formula (5). The average relative error of model (6) determined according to formula (6) for individual measurement series is presented in Tab. 5.
According to the recommendations [32] of Boeing experts, the recommended number of air changes in the cabin of a passenger aircraft ranges from 10 to 20 1/h. This condition was met in all measurement series (Table 5). The minimum number of air changes was 10 1/h, and the maximum was 19 1/h.
The developed model (5) of absolute humidity can be used to regulate air humidity in the aircraft cabin in automatic air ventilation controllers. The intake of dry air from outside during a flight is associated with a decrease in air humidity in the aircraft cabin and most often occurs when the aircraft reaches cruise altitude. The problem of too low air humidity in passenger aircraft cabins was reported in many publications [5,6,7,8], which was also confirmed in this work. One way to increase humidity may be to use a chamber to humidify the air supplied to the aircraft cabin, which can be mounted on the supply system (Figure 12). The purpose of the humidification chamber is to increase the supply humidity ωsupply in the supplied air, which will increase the humidity ωinside inside the passenger aircraft cabin. The humidification chamber is controlled by the regulator (Figure 12), in which the model (5) is implemented.
The value of the required absolute humidity ωsupply of the supply air ωsupply can be determined directly from the transformed formula (5):
where ωinside is the absolute air humidity read from the humidity sensor mounted inside the aircraft cabin (Figure 12). Absolute air humidity sensors inside the cabin can be installed in the locations presented in the publication [16]. If the air humidity ωinside in the cabin read from the air humidity sensor mounted on the cabin wall is too low, the controller determines, based on equation (7), the required absolute humidity ωsupply of the supply air, which is achieved by switching on the humidification chamber (Figure 12). Humidity is controlled ωsupply using a humidity sensor installed in the supply duct behind the humidification chamber. In order to reduce the humidity ωinside in the aircraft cabin, the humidification chamber is turned off and the volume flow of dry external air in the mixing chamber increases.
5. Conclusions
The results of research on air humidity in the cabin of a passenger plane indicate three characteristic periods of people staying in the cabin of a passenger plane during air travel. The first period from the moment of boarding the plane to the moment of take-off is characterized by a large fluctuation in relative humidity, which is mainly due to the large variability of the physical activity of passengers. In the second period, from the moment the plane takes off to the moment the plane lands, the value of relative humidity depends on the altitude of the plane. The relative humidity in the cabin of a passenger plane stabilizes when the plane reaches its full cruising altitude. In the third period, from the moment the plane lands until the passengers leave the aircraft cabin, the relative humidity increases rapidly, which is associated with increased physical activity and a reduction in the volume flow of supply ventilation.
Based on the research conducted and the developed model of air humidity in the cabin of a passenger aircraft, it can be assumed that the average value of humidity generated by a single passenger is 35 g/h. The number of air changes in the cabin of a passenger aircraft for fourteen measurement series ranged from 10 to 19 1/h.
During an airplane flight, the relative humidity is low (below 30%), which also confirms the relative humidity results from previous known studies in the literature. In this work, a simplified model of absolute air humidity in the cabin of a passenger aircraft was developed, which can be used to regulate air humidity in the aircraft using an air humidification chamber installed in the supply duct. The proposed ventilation scheme in an airplane with a humidification chamber, together with the developed model, may contribute to increasing the humidity in the airplane cabin and thus increasing the comfort of air travel.
Author Contributions
Conceptualization, T.J.T. methodology, T.J.T.; software, T.J.T.; validation, T.J.T.; formal analysis, K.G.F.; investigation, T.J.T.; resources, K.G.F.; writing—original draft preparation, T.J.T.; writing—review and editing, T.J.T.; visualization, T.J.T.; supervision, T.J.T.; project administration, K.G.F. All authors have read and agreed to the published version of the manuscript.
Funding
The study has been executed with resources of the statutory work financed by the Ministry of Science and Higher Education in Poland (WZ/WB-IIŚ/8/2023 and Institute of Environmental Engineering, Warsaw University of Life Sciences (SGGW)).
Institutional Review Board Statement
Not applicable.
Informed Consent Statement
Not applicable.
Data Availability Statement
The data generated and analyzed during this study are available on request from the corresponding author. The data are not publicly available due to ongoing research and analysis.
Conflicts of Interest
The authors declare no conflicts of interest.
Nomenclature
| m | number of passengers in the cabin of a passenger plane (person) |
| n | air change rate m (h-1) |
| qg | internal moisture generated by an aircraft passenger (g/(h*person)) |
| Qg | the internal sum of moisture emitted by all passengers in an airliner (g/h) |
| Qn | moisture added or removed by mechanical ventilation (g/h) |
| Tavg | average temperature in the cabin of a passenger plane (oC) |
| t | time (min) or (h) |
| V | passenger aircraft cabin volume (m3) |
| Greek symbols | |
| ωavg | average relative humidity in the cabin of a passenger plane (%) |
| ωinside | internal absolute humidity in the cabin of a passenger aircraft determined using equation (5) |
| ωsupply | absolute humidity of the air supplied from the supply ventilation (g/m3) |
| ωt=0 | initial value of absolute humidity in the cabin of a passenger aircraft at the moment of take-off (g/m3) |
References
- ASHRAE Standard. Thermal Environmental Conditions for Human Occupancy, ASHRAE Standard 55, Rev. 2017.
- Dumała, S. M.; Guz, Ł.; Badora, A. Indoor Air Quality in Schools Located in Poland, Lublin Province. J. Ecol. Eng. 2024, 25, 17–26. [Google Scholar] [CrossRef] [PubMed]
- Sterling, E.M.; Arundel, A.; Sterling, T.D. Criteria for Human Exposure to Humidity in Occupied Buildings. Ashrae Trans. 1985, 91, 611–622. [Google Scholar]
- Yang, W.; Elankumaran, S.; Marr, L.C. Relationship between Humidity and Influenza A Viability in Droplets and Implications for Influenza's Seasonality. PLoS ONE 2012, 7, e46789. [Google Scholar] [CrossRef] [PubMed]
- Giaconia, C.; Orioli, A.; Di Gangi, A. Air quality and relative humidity in commercial aircrafts: An experimental investigation on short-haul domestic flights. Build. Environ. 2013, 67, 69–81. [Google Scholar] [CrossRef]
- Gładyszewska-Fiedoruk, K. Indoor Air Quality in the Cabin of an Airliner, J. Air Transp. Manag. 2012, 20, 28–30. [Google Scholar] [CrossRef]
- F. Haghighat, F. Allard, A. C. Megri, P. Blondeau, R. Shimotakahara, Masurement of thermal comfort and indoor air quality aboard 43 flights on commercial airlines. Indoor Built Environ., 8 (1999), pp. 58–66. [CrossRef]
- da Silva, M.C.G.; Broday, E.E.; Ruivo, C.R. Indoor Climate Quality Assessment in civil aircraft cabins: a field study. Therm. Sci. Eng. Prog. 2023, 37, 101581. [Google Scholar] [CrossRef]
- Yu, Z.; Xiao, G.; Zhang, C.; Gui, Y.; Du, Y. Numerical Study of Air Distribution and Evolution Characteristics in Airliner Cabin. Processes 2022, 10, 2621. [Google Scholar] [CrossRef]
- Chen, Q.; Jones, B.W.; Loo, S.M.; Nazaroff, W.W.; Overfelt, R.A.; Spengler, J.D.; et al. Report to the FAA on the Airliner Cabin Environment. Report No. RITE-ACERCoE-2010-1. National Air Transportation Center of Excellence for Research in the Intermodal Transport Environment (RITE) - Airliner Cabin Environmental Research (ACER) Program; 2010.
- Lee, S.; Poon, C.; Li, X.; Luk, F. Indoor air quality investigation on commercial aircraft. Indoor Air 1999, 9, 180e7. [Google Scholar] [CrossRef] [PubMed]
- Norrefeldt, V.; Mayer, F.; Herbig, B.; Ströhlein, R.; Wargocki, P.; Lei, F. Effect of Increased Cabin Recirculation Airflow Fraction on Relative Humidity, CO2 and TVOC. Aerospace 2021, 8, 15. [Google Scholar] [CrossRef]
- Yu, N.; Zhang, Y.; Zhang, M.; Li, H. Thermal Condition and Air Quality Investigation in Commercial Airliner Cabins. Sustainability 2021, 13, 7047. [Google Scholar] [CrossRef]
- Wang, C.; Zhang, J.; Chao, J.; Yang, C.; Chen, H. Evaluation of dynamic airflow structures in a single-aisle aircraft cabin mockup based on numerical simulation. Indoor Built Environ. 2022, 31, 398–413. [Google Scholar] [CrossRef]
- Zhang, T.; Chen, Q.Y. ; Lin, Optimal Sensor Placement for Airborne Contaminant Detection in an Aircraft Cabin. HVAC&R Research 2007, 13, 683–696. [Google Scholar] [CrossRef]
- Zhang, T.; Yin, S.; Wang, S. An under-aisle air distribution system facilitating humidification of commercial aircraft cabins. Build. Environ. 2010, 45, 907–915. [Google Scholar] [CrossRef] [PubMed]
- Danca, P.; Coşoiu, C.I.; Nastase, I.; Bode, F.; Georgescu, M.R. Personalized Ventilation as a Possible Strategy for Reducing Airborne Infectious Disease Transmission on Commercial Aircraft. Appl. Sci. 2022, 12, 2088. [Google Scholar] [CrossRef]
- Siedlecki, M.; Ziółkowski, A.; Ratajczak, K.; Bednarek, M.; Jagielski, A.; Igielska-Kalwat, J. Analysis of the Impact of the Comfort Systems in Sport Utility Vehicles on the Exhaust Emissions Measured under Worldwide Harmonized Light Vehicles Test Cycles Conditions. J. Ecol. Eng. 2024, 25, 93–105. [Google Scholar] [CrossRef]
- Farian, E.; Wójcik-Fatla, A. Mycological contamination of cabin filters as a potential source of air pollution inside passenger vehi-cles. Air Qual. Atmos. Health 2024. [Google Scholar] [CrossRef]
- Boeing A, Aviation Experts Resource Room, Cabin Air Contaminants, Cabin Air & Bleed Air Contaminants, https://787updates.newairplane.com/Aviation-Experts; https://787updates.newairplane.com/getmedia/0a6b6209-6b19-4dce-9afb-81ba391102de/Cabin-Air-Contaminants-Boeing-backgrounder, May 3, 2023.
- Testo https://www.testo.com/en-US/testovent-415/p/0554-0415 November 17, 2023.
- Psychrometric Chart, https://drajmarsh.bitbucket.io/psychro-chart2d.html November 17, 2022 - May 3, 2023.
- FlightAware, www.flightaware.com November 17, 2022.
- Szczurek, A.; Maciejewska, M. Categorisation for air quality assessment in car cabin. Transp. Res. D: Transp. Environ. 2016, 48, 161–170. [Google Scholar] [CrossRef]
- Recknagel, H.; Sprenger, E.; Schramek, E.R. Taschenbuch für Heizung + Klimatechnik 07/08: Taschenbuch für Heizung + Klimatechnik.
- PN-EN 13779:2007 Ventilation for non-residential buildings. Performance requirements for ventilation and room-conditioning systems (PN-EN 16798-3:2017-09 Energy performance of buildings - Ventilation for buildings - Part 3: For non-residential buildings - Performance requirements for ventilation and room-conditioning systems (Modules M5-1, M5-4) - in this current standard, the analyzed parameters are not discussed).
- Barrera-Verdejo, M.; Crewell, S.; Löhnert, U.; Orlandi, E.; Girolamo, P. Ground Based Lidar and Microwave Radiometry Synergy for High Vertical Resolution Absolute Humidity Profiling. Atmos. Meas. Tech. 2016, 9, 1–29. [Google Scholar] [CrossRef]
- Boeing B, https://www.businessairnews.com/hb_aircraftpage.html?recnum=B737 January 19, 2023.
- Johansson, P.; Pallin, S.; Shahriari, M. Risk Assessment Model Applied on Building Physics: Statistical Data Acquisition and Stochastic Modeling of Indoor Moisture Supply in Swedish Multi-family Dwellings. IEA Annex 55 RAP-RETRO, Copenhagen meeting October 25–27 (2010).
- Zemitis, J.; Borodinecs, A.; Frolova, M. Measurements of moisture production caused by various sources. Energy Build. 2016, 127, 884–891. [Google Scholar] [CrossRef]
- Weremijewicz, K.; Gajewski, A. Measurement Uncertainty Estimation for Laser Doppler Anemometer. Energies 2021, 14, 3847. [Google Scholar] [CrossRef]
- Boeing C, Aviation Experts Resource Room, Cabin Air Contaminants, Air change rates in planes, trains and buildings, https://787updates.newairplane.com/Aviation-Experts; https://787updates.newairplane.com/getmedia/88faa01a-d578-4e1a-be44-3a177c8ef50f/Air-change-rates-inplanes May 3, 2023.
Figure 1.
Air vents located in the ceiling of the aircraft cabin. The location of measurement of supply air parameters using the Testo recorder is marked in red.
Figure 1.
Air vents located in the ceiling of the aircraft cabin. The location of measurement of supply air parameters using the Testo recorder is marked in red.
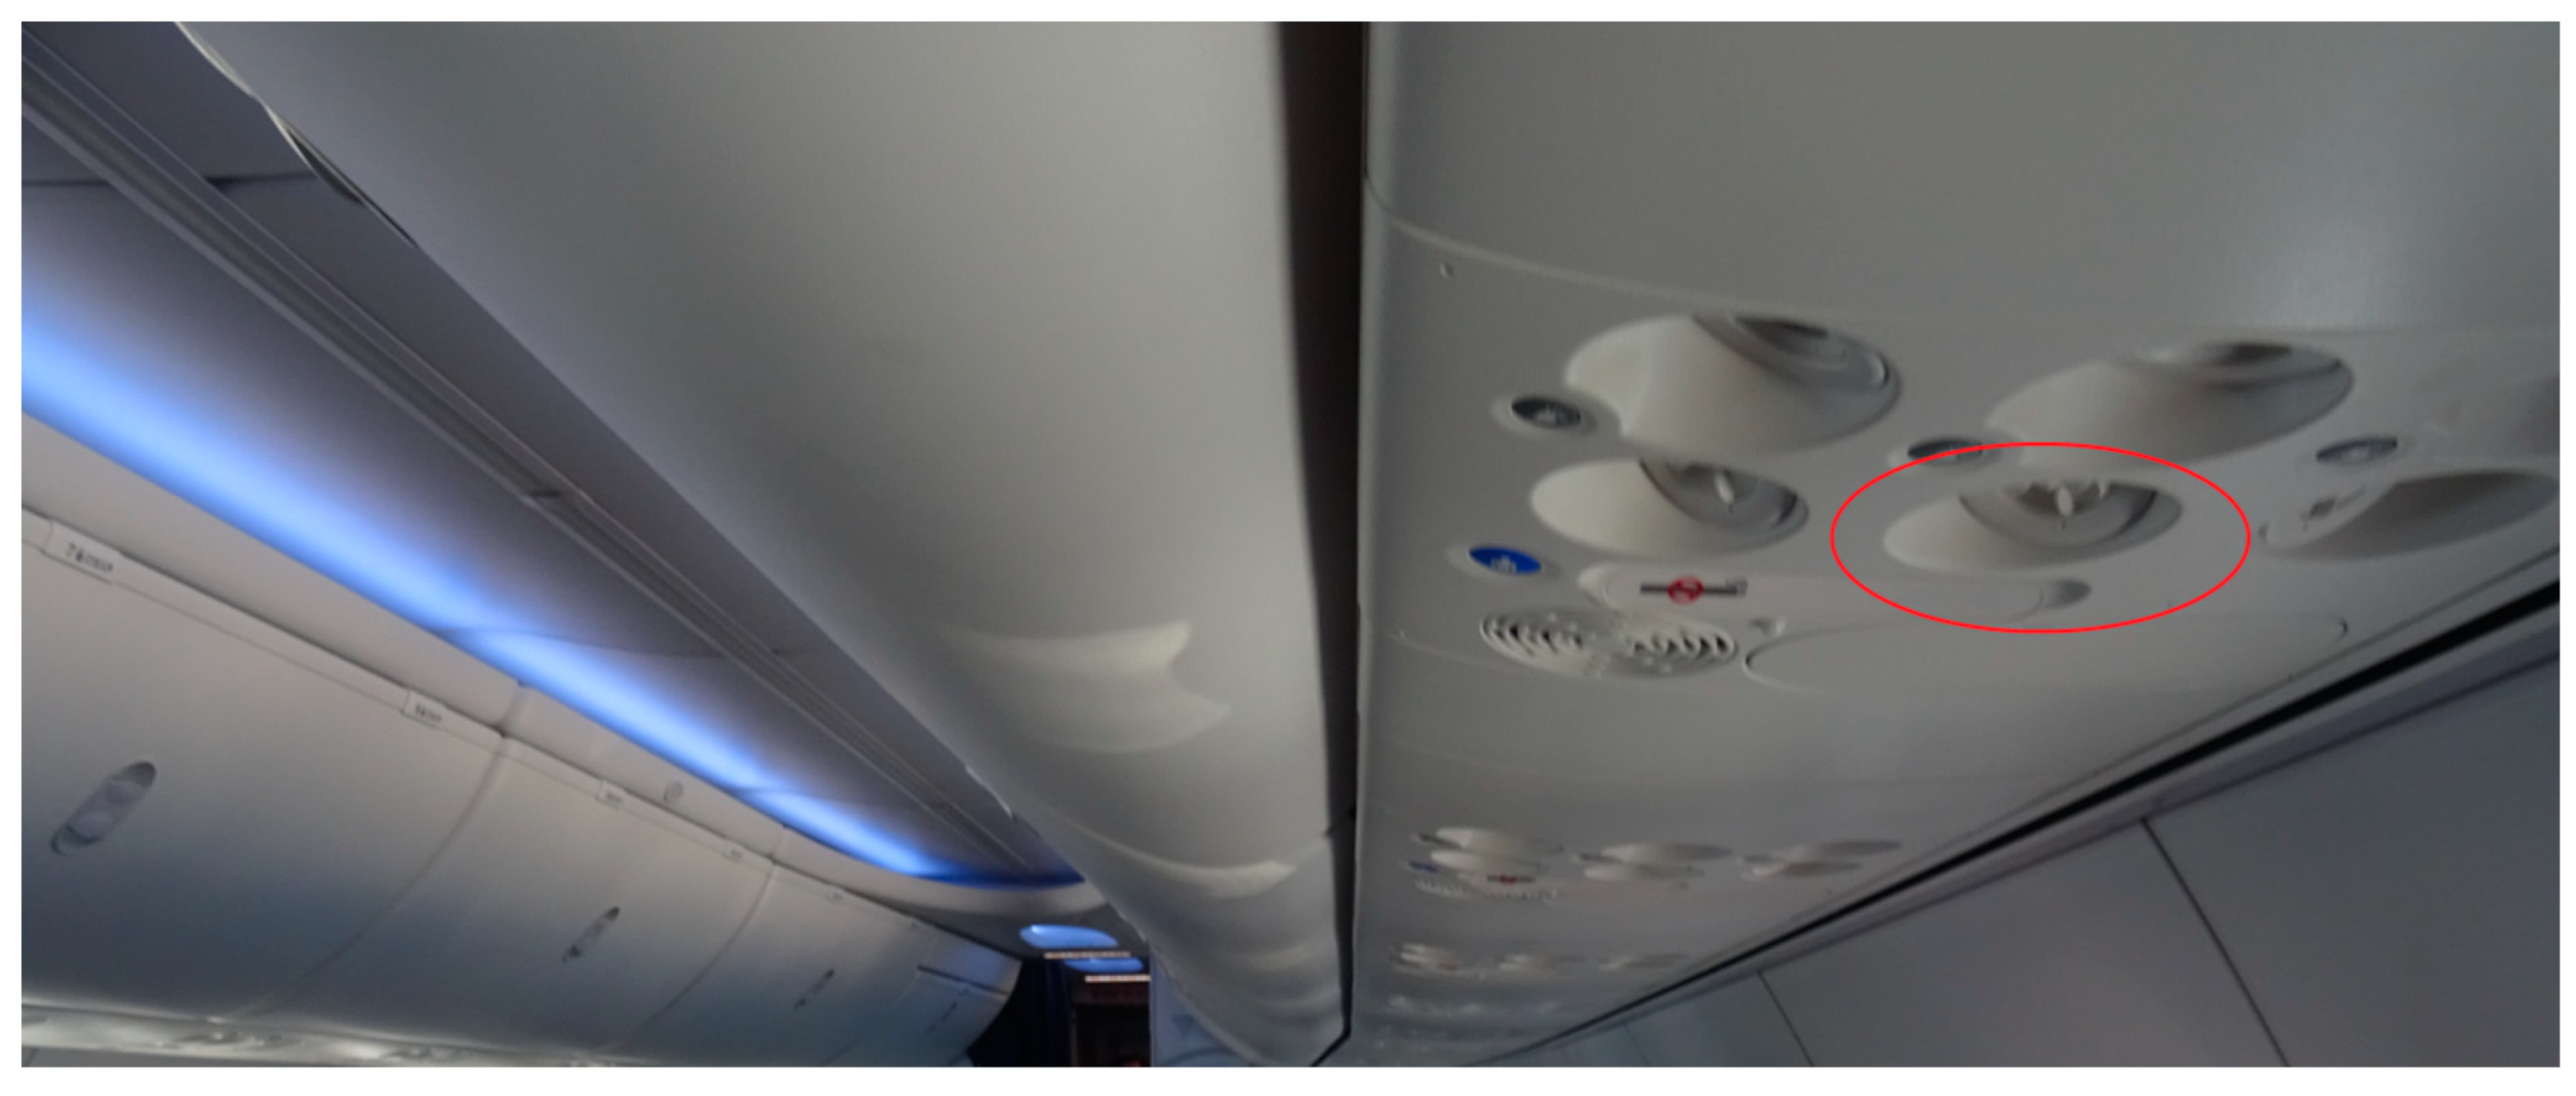
Figure 2.
Dependence of the total time spent on the plane and the duration of the flight depending on the length of the passenger plane route for fourteen measurement series.
Figure 2.
Dependence of the total time spent on the plane and the duration of the flight depending on the length of the passenger plane route for fourteen measurement series.
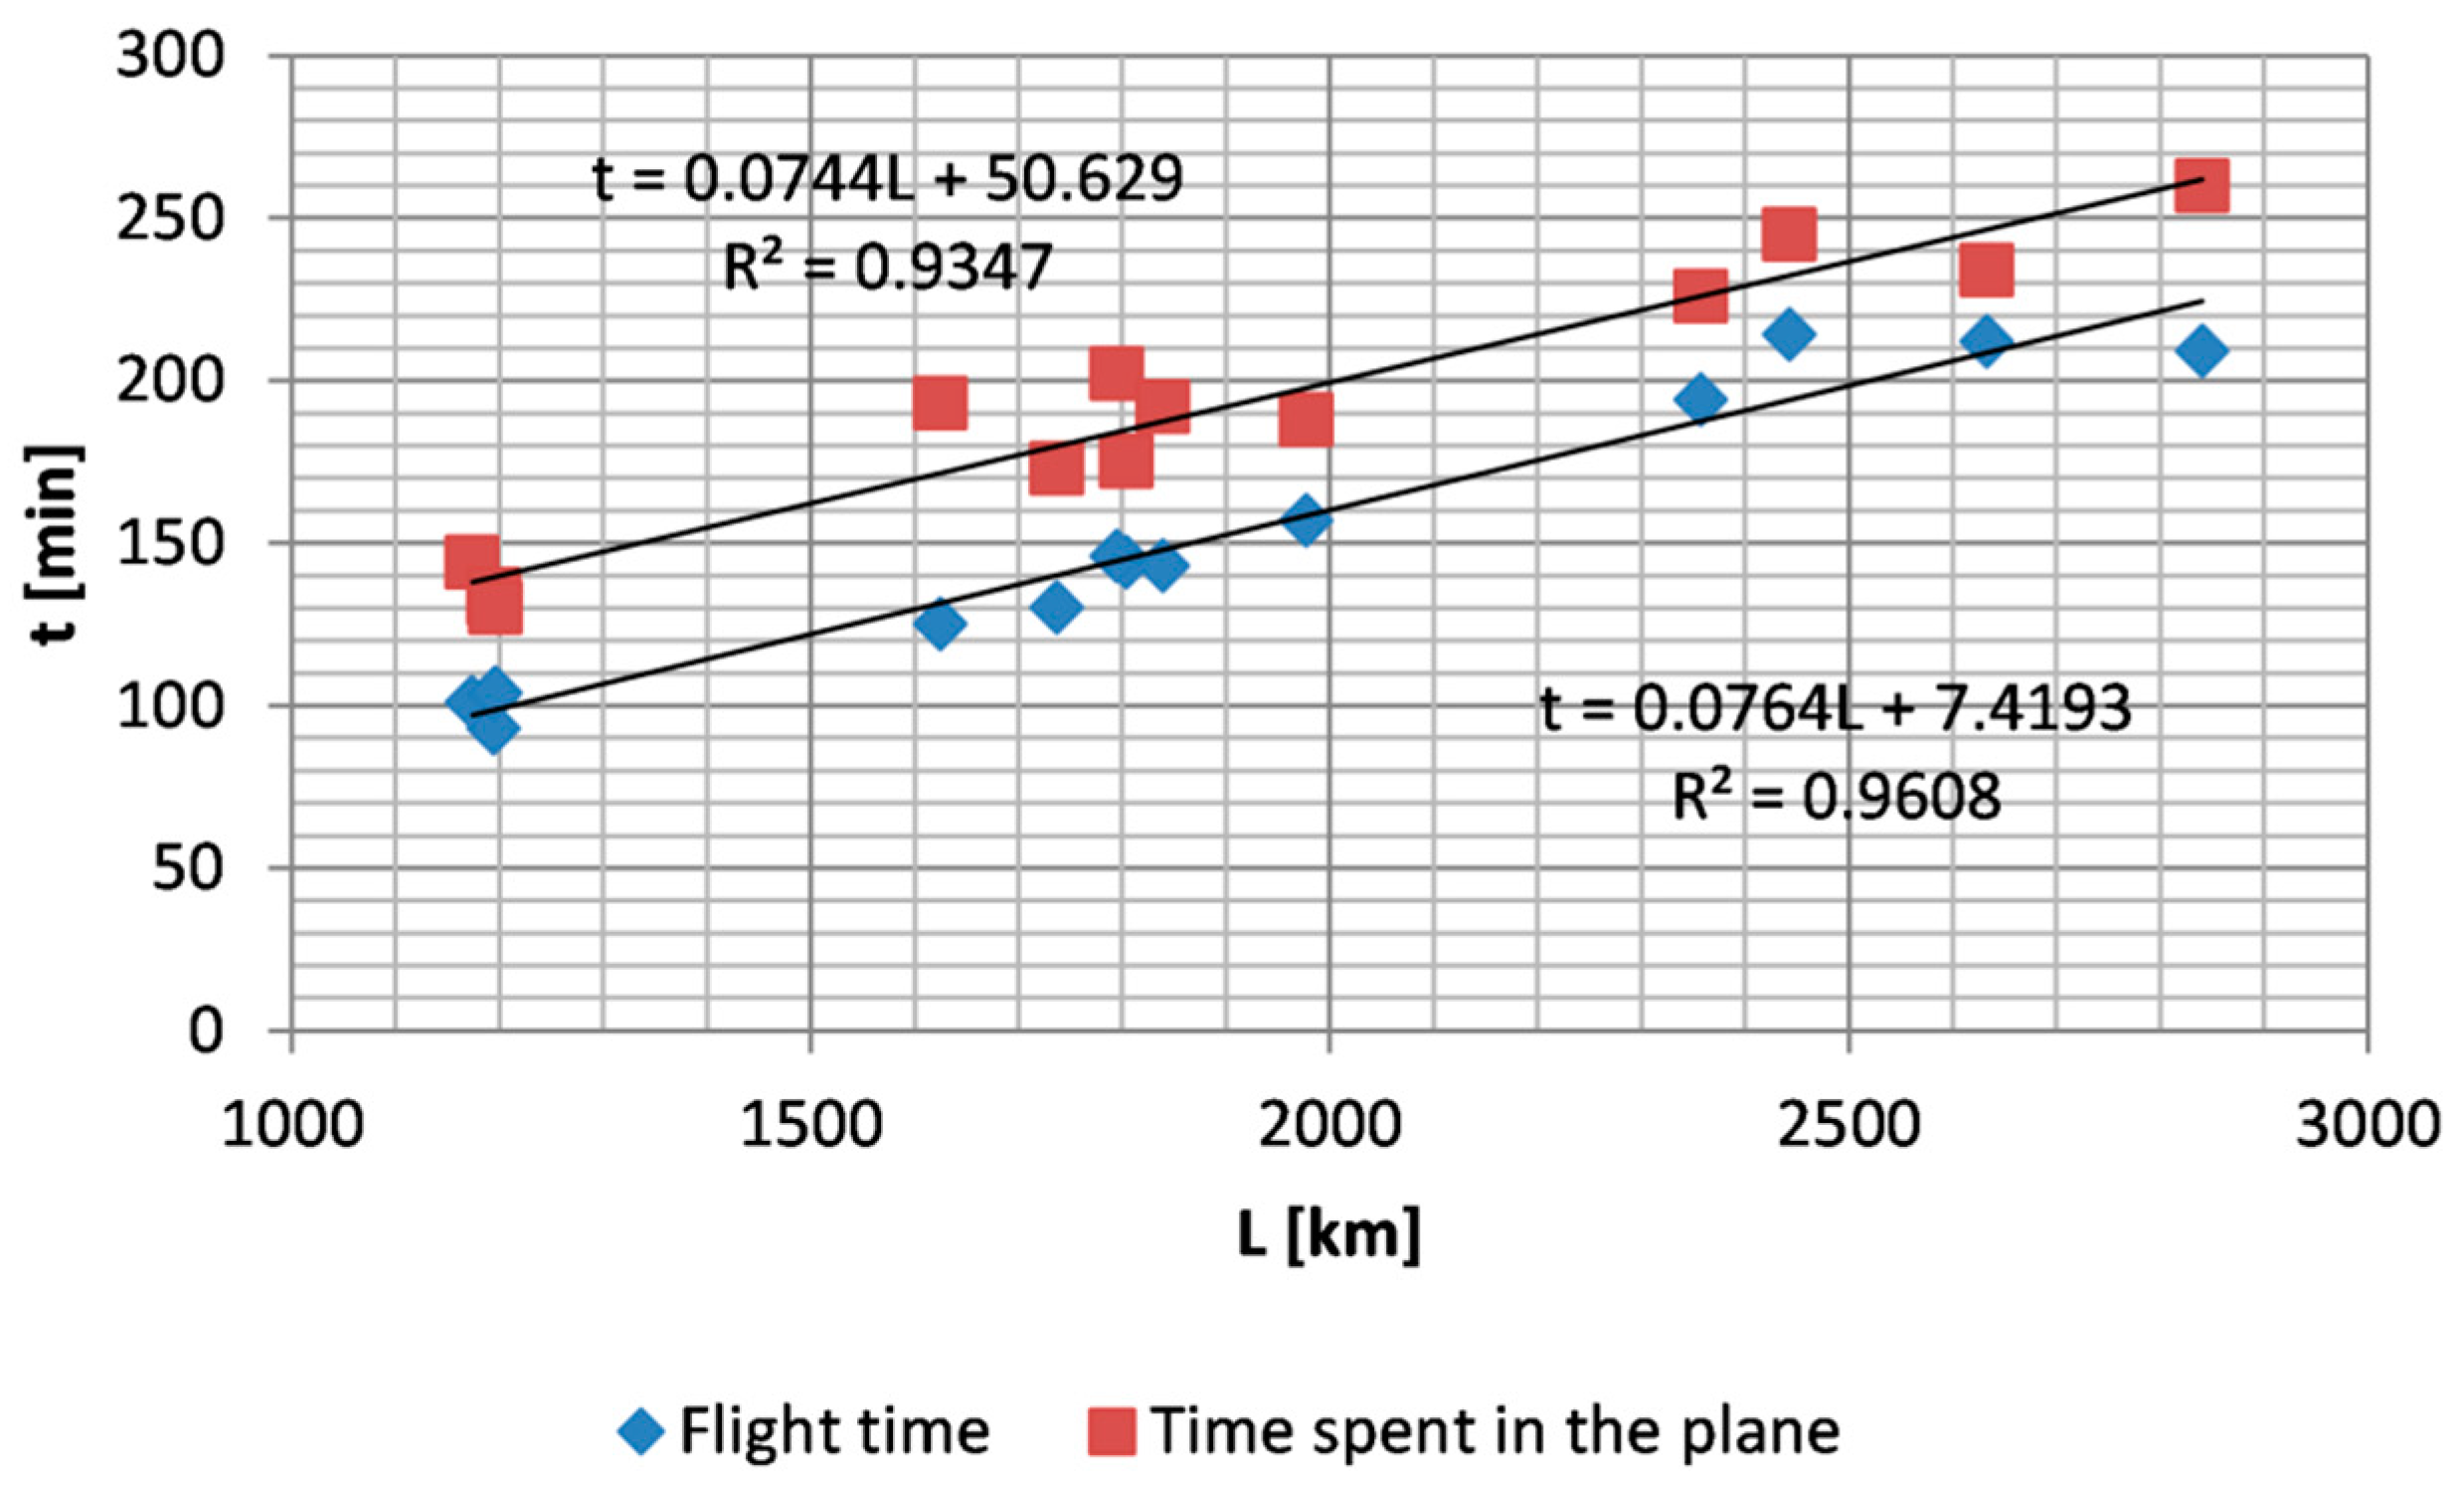
Figure 3.
Comparison of minimum, average and maximum values of relative humidity in the cabin of a passenger aircraft with the literature [5,6,7,8].
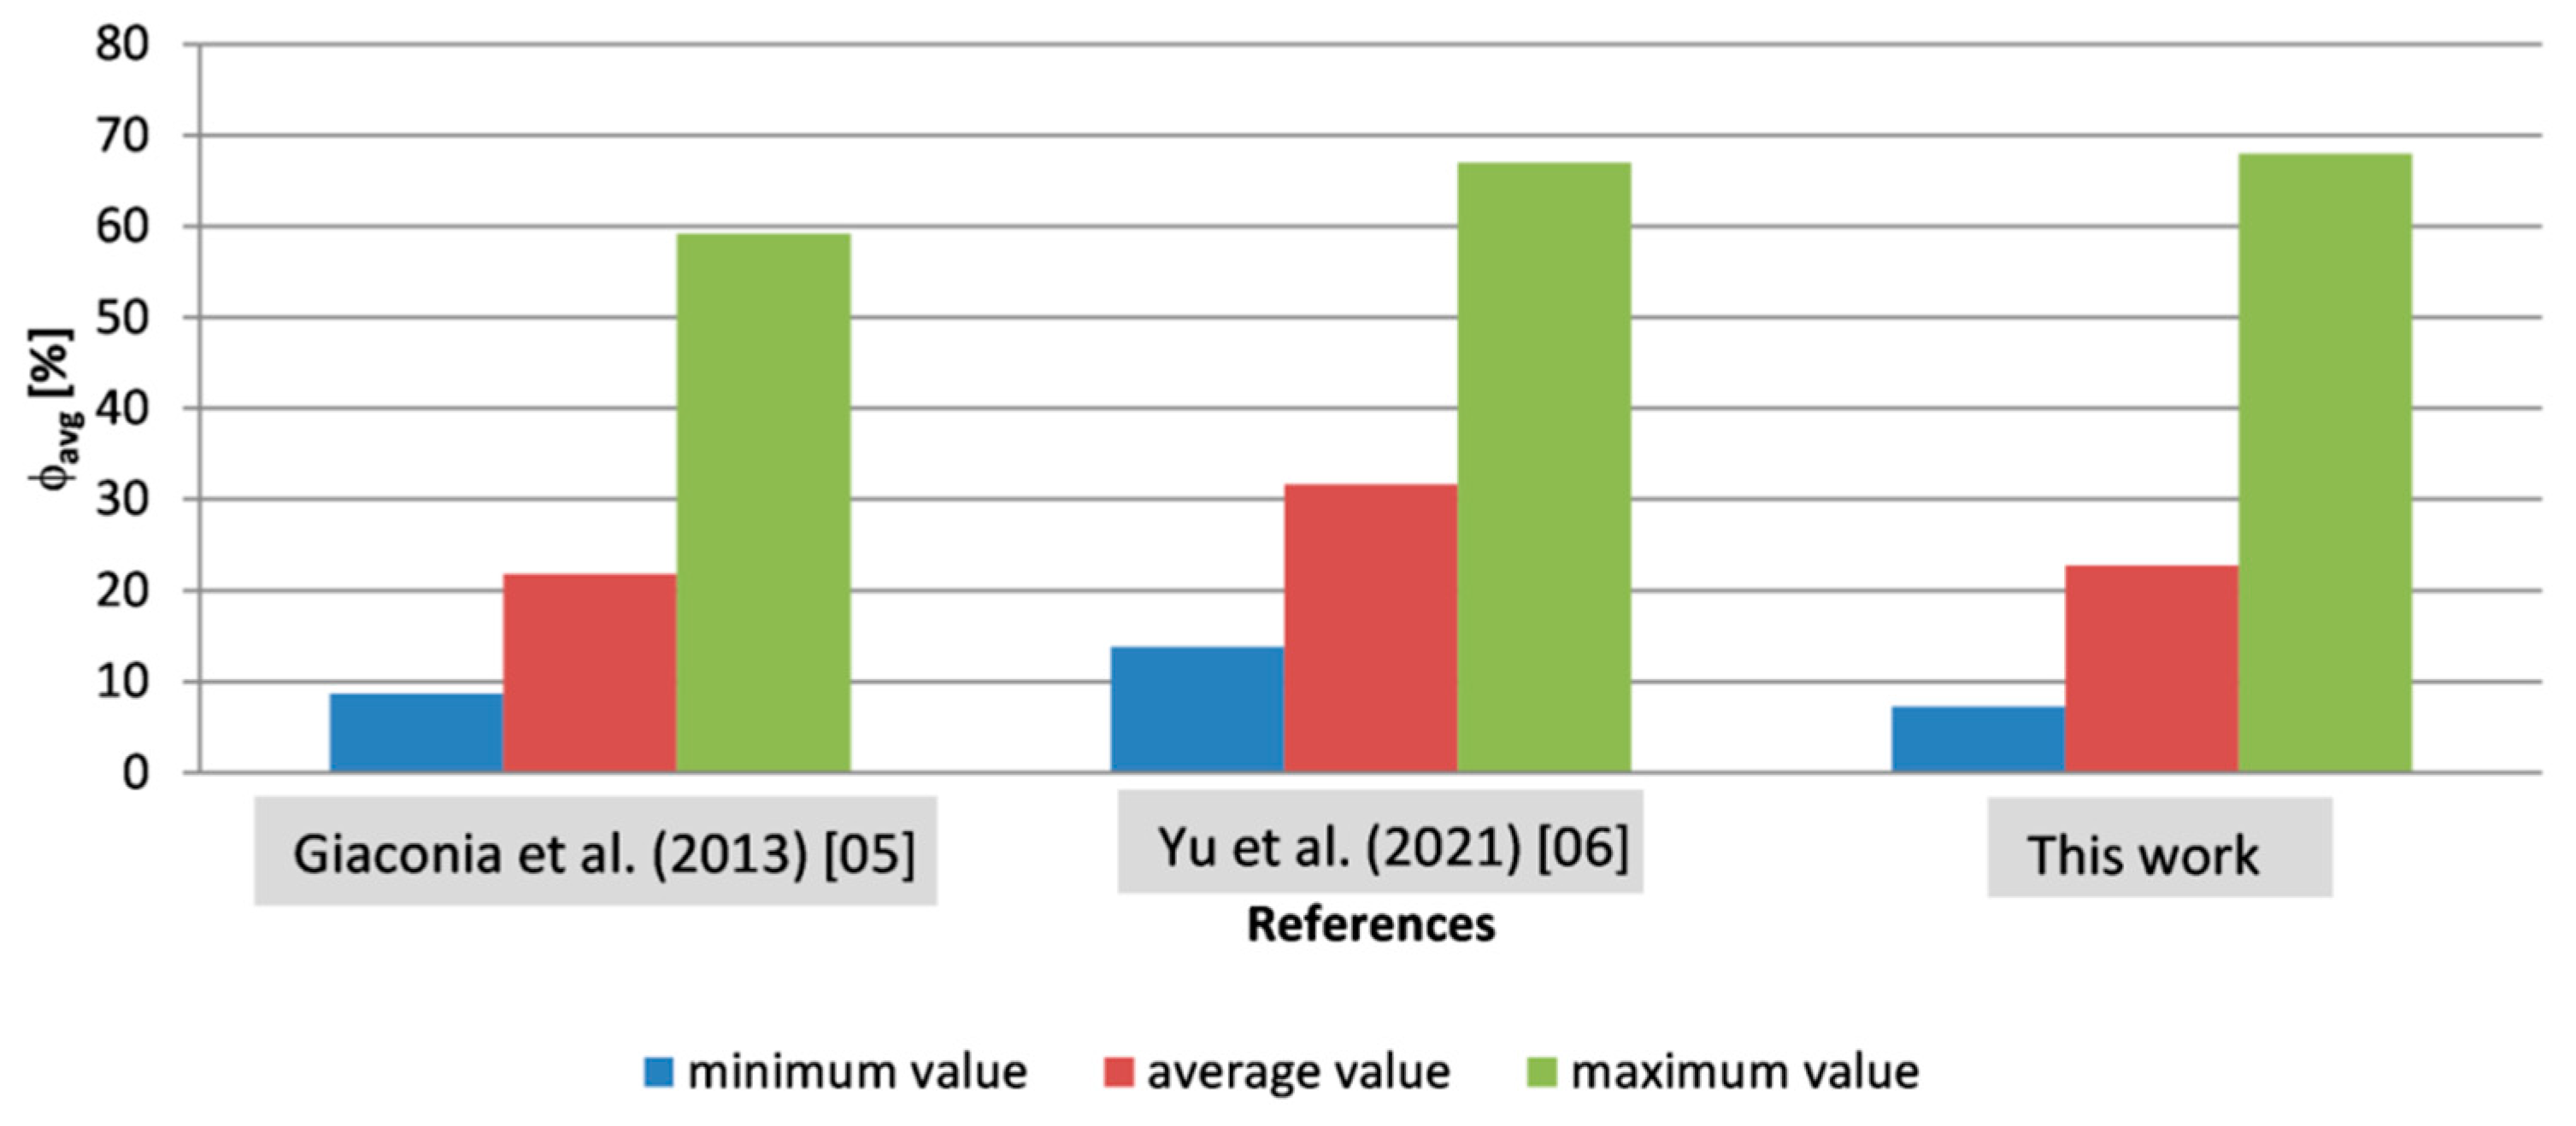
Figure 4.
Dependence of the average temperature and average relative humidity during the flight as a function of the number of passengers.
Figure 4.
Dependence of the average temperature and average relative humidity during the flight as a function of the number of passengers.
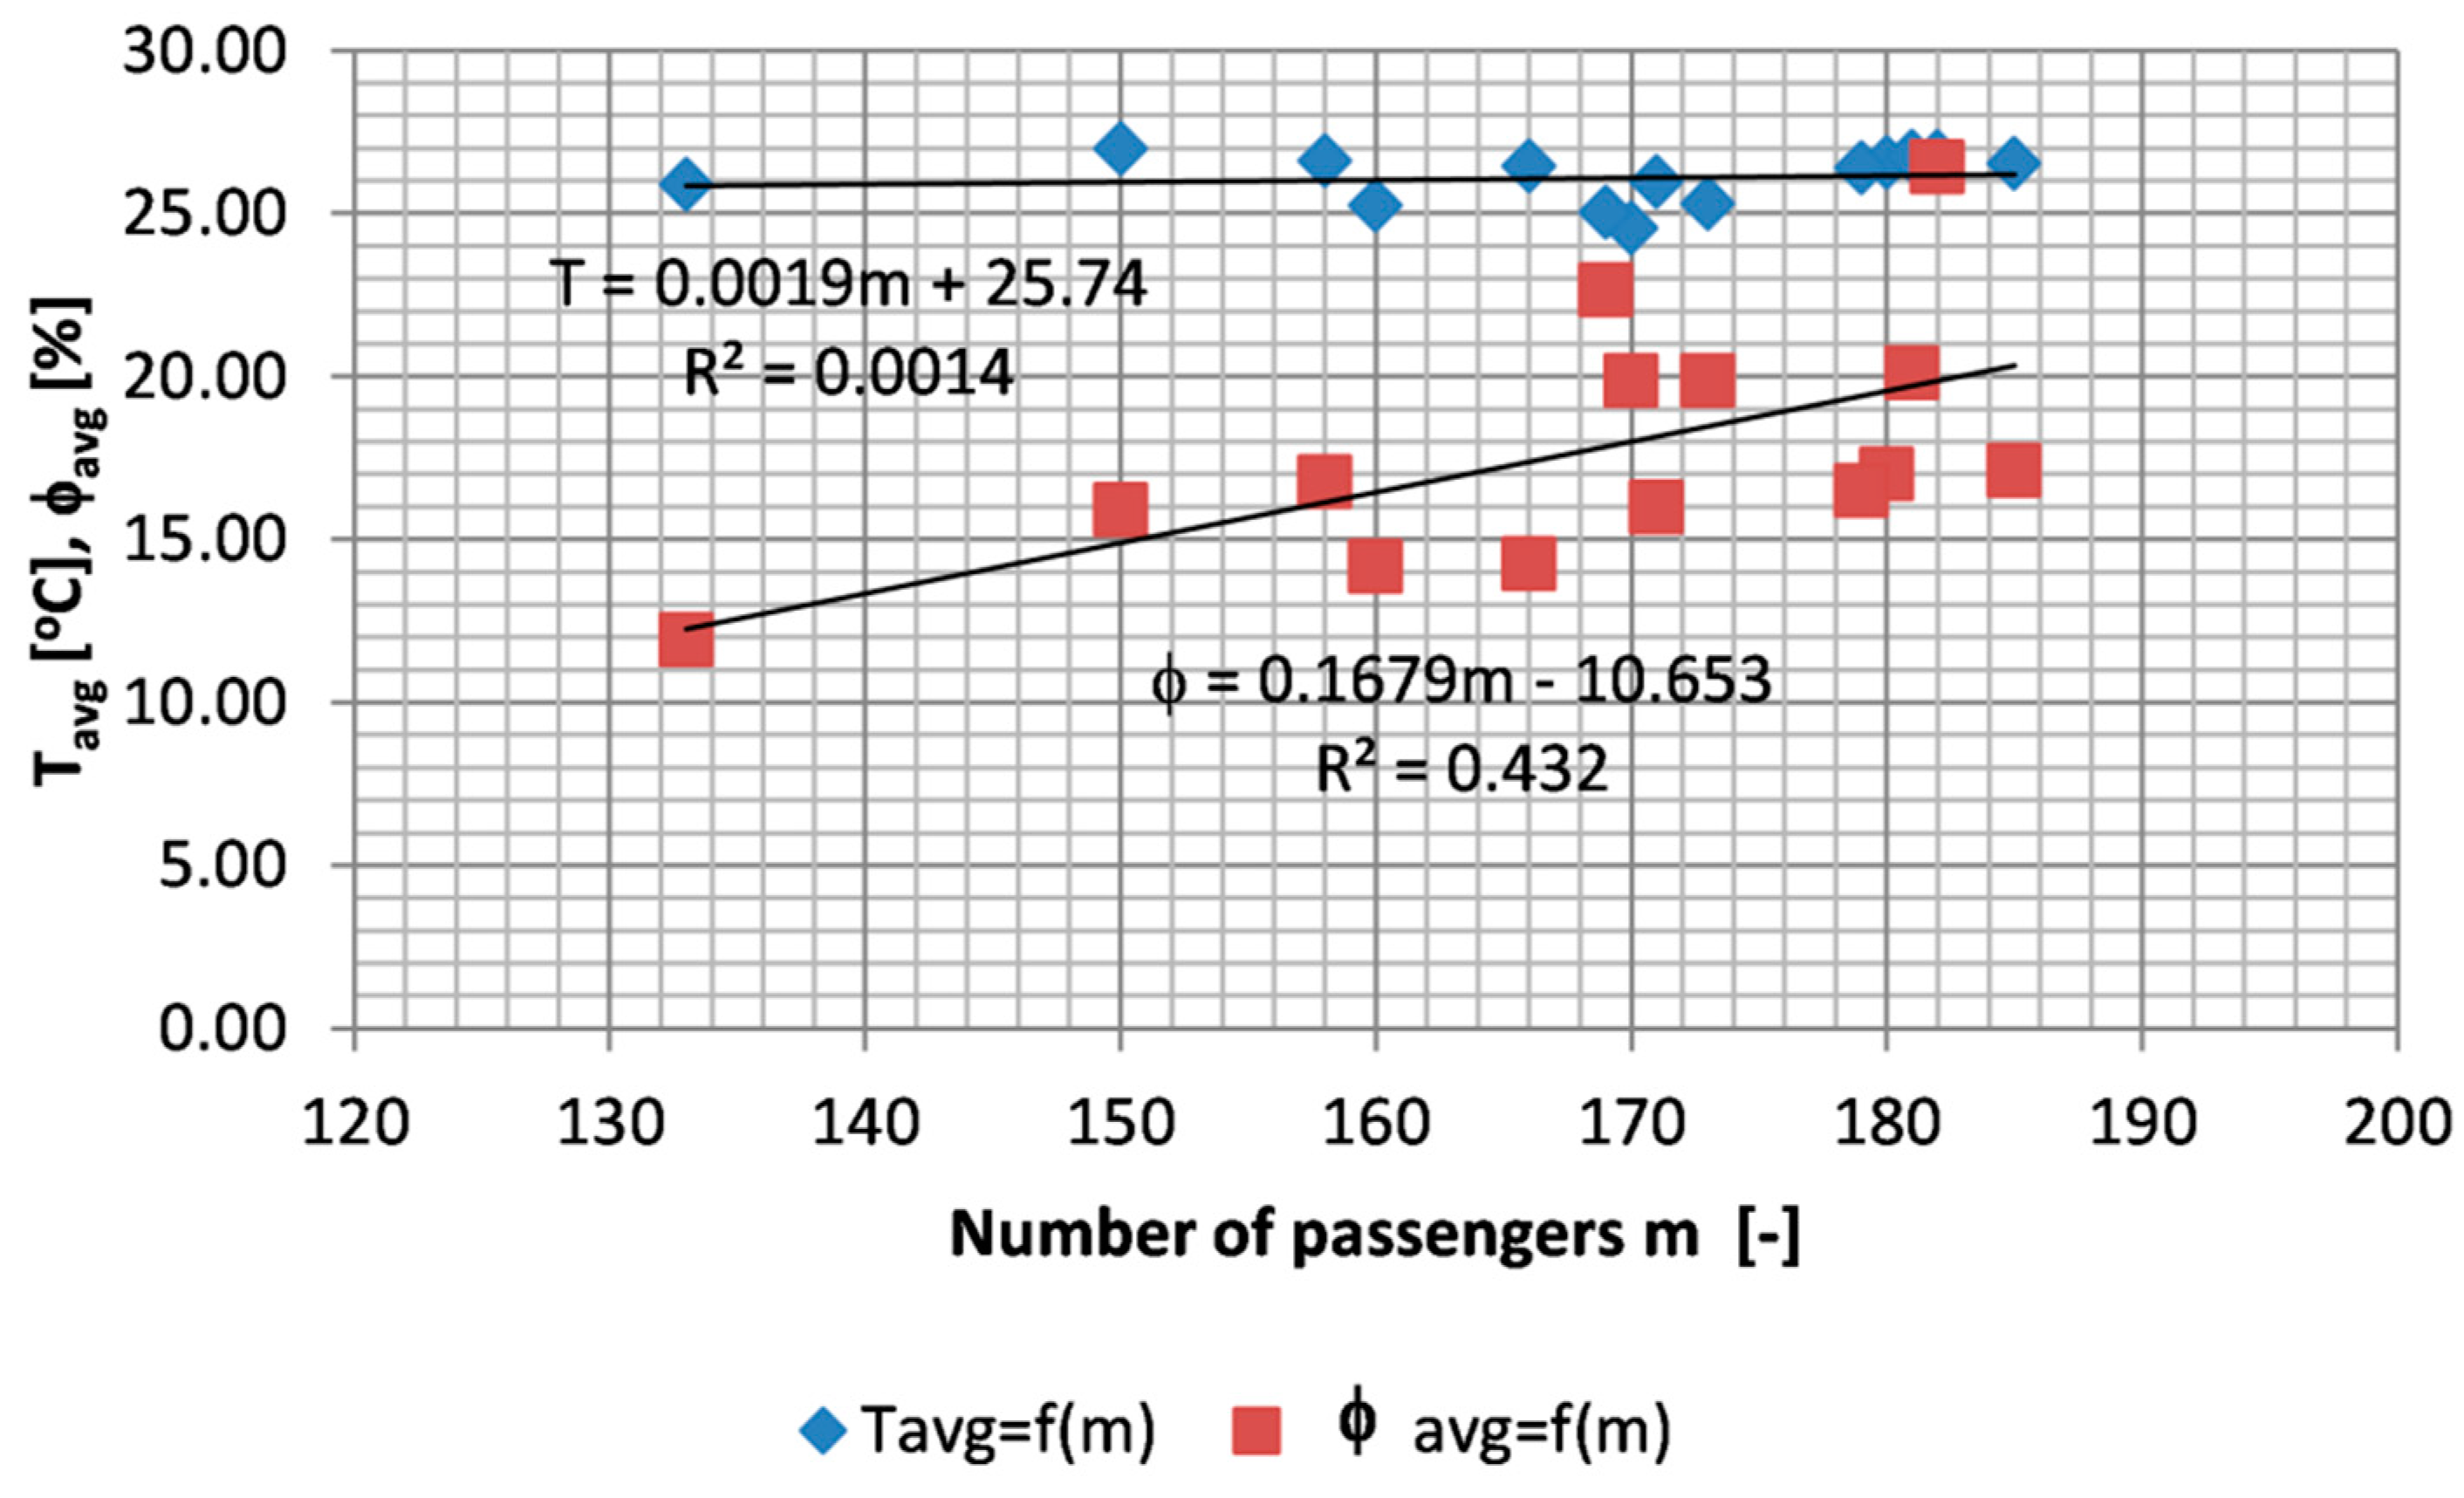
Figure 5.
Psychometric chart with marked points of average temperatures and relative humidity for all measurement series along with the designated comfort area according to ASHRAE [1], generated using the program [22].
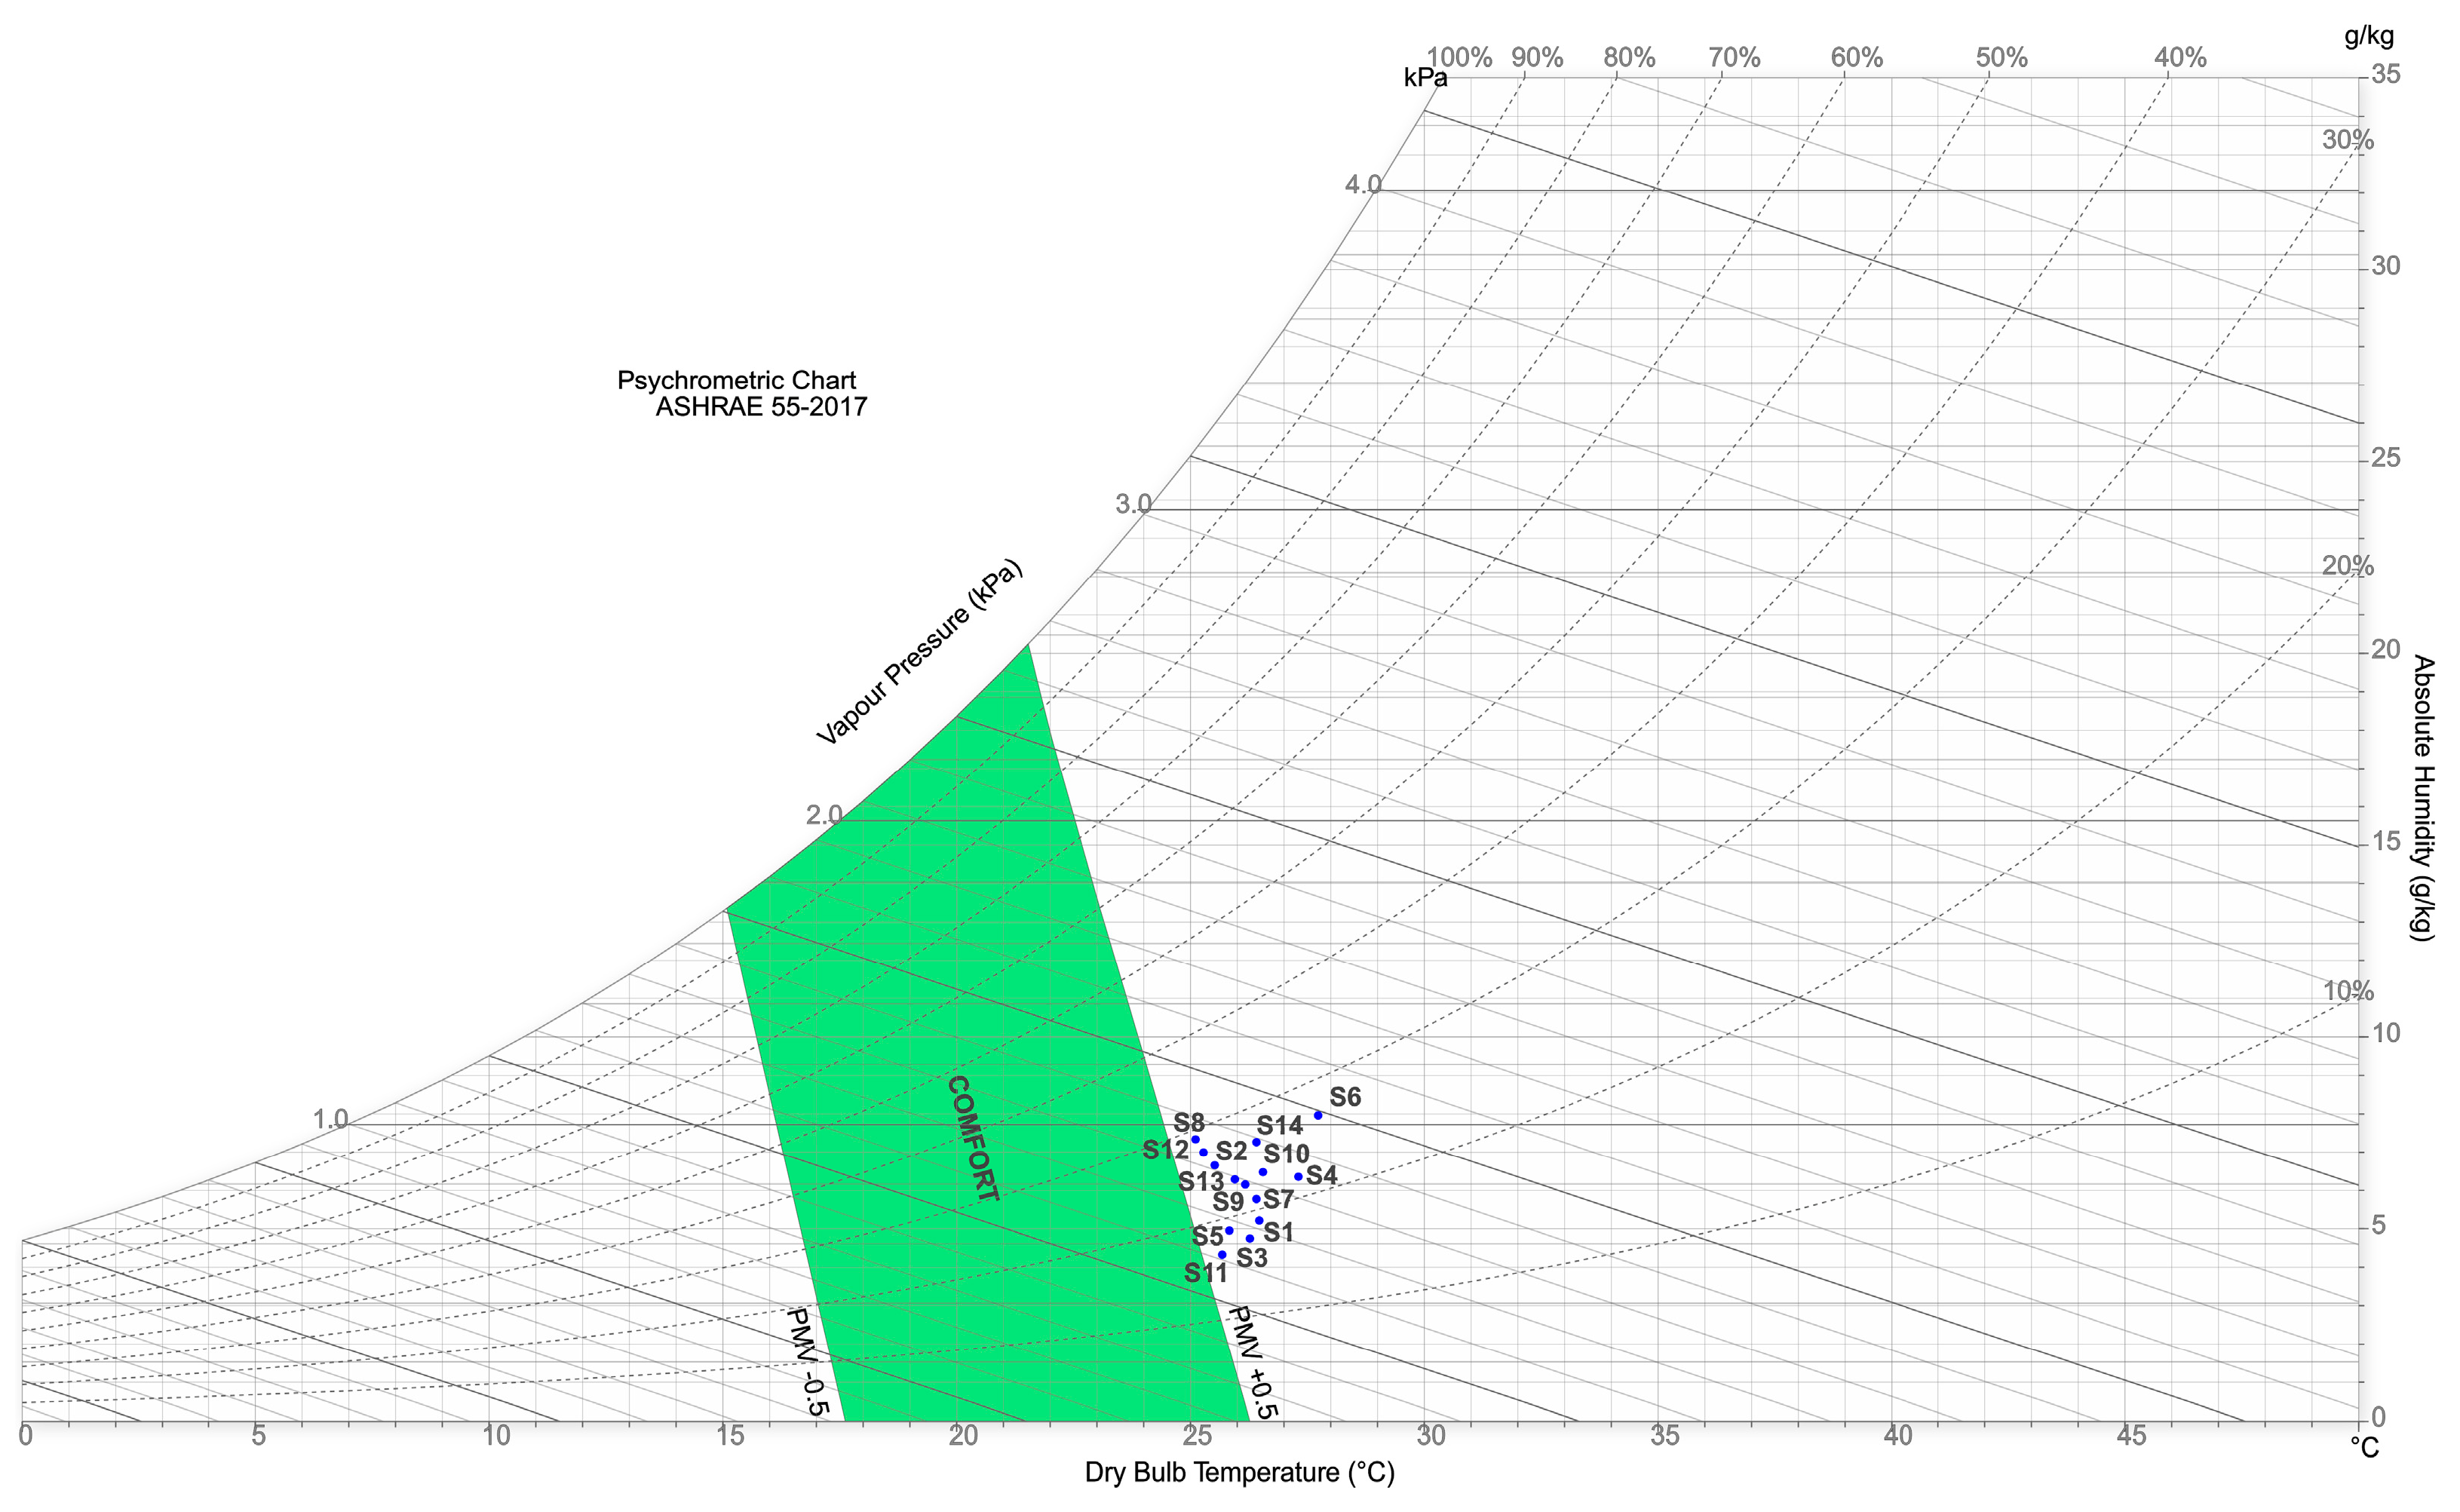
Figure 6.
An example of the course of changes in the altitude of the aircraft (series 10) based on data from FlightAware [23] and the measured courses of temperature, relative and absolute humidity in the aircraft cabin.
Figure 6.
An example of the course of changes in the altitude of the aircraft (series 10) based on data from FlightAware [23] and the measured courses of temperature, relative and absolute humidity in the aircraft cabin.
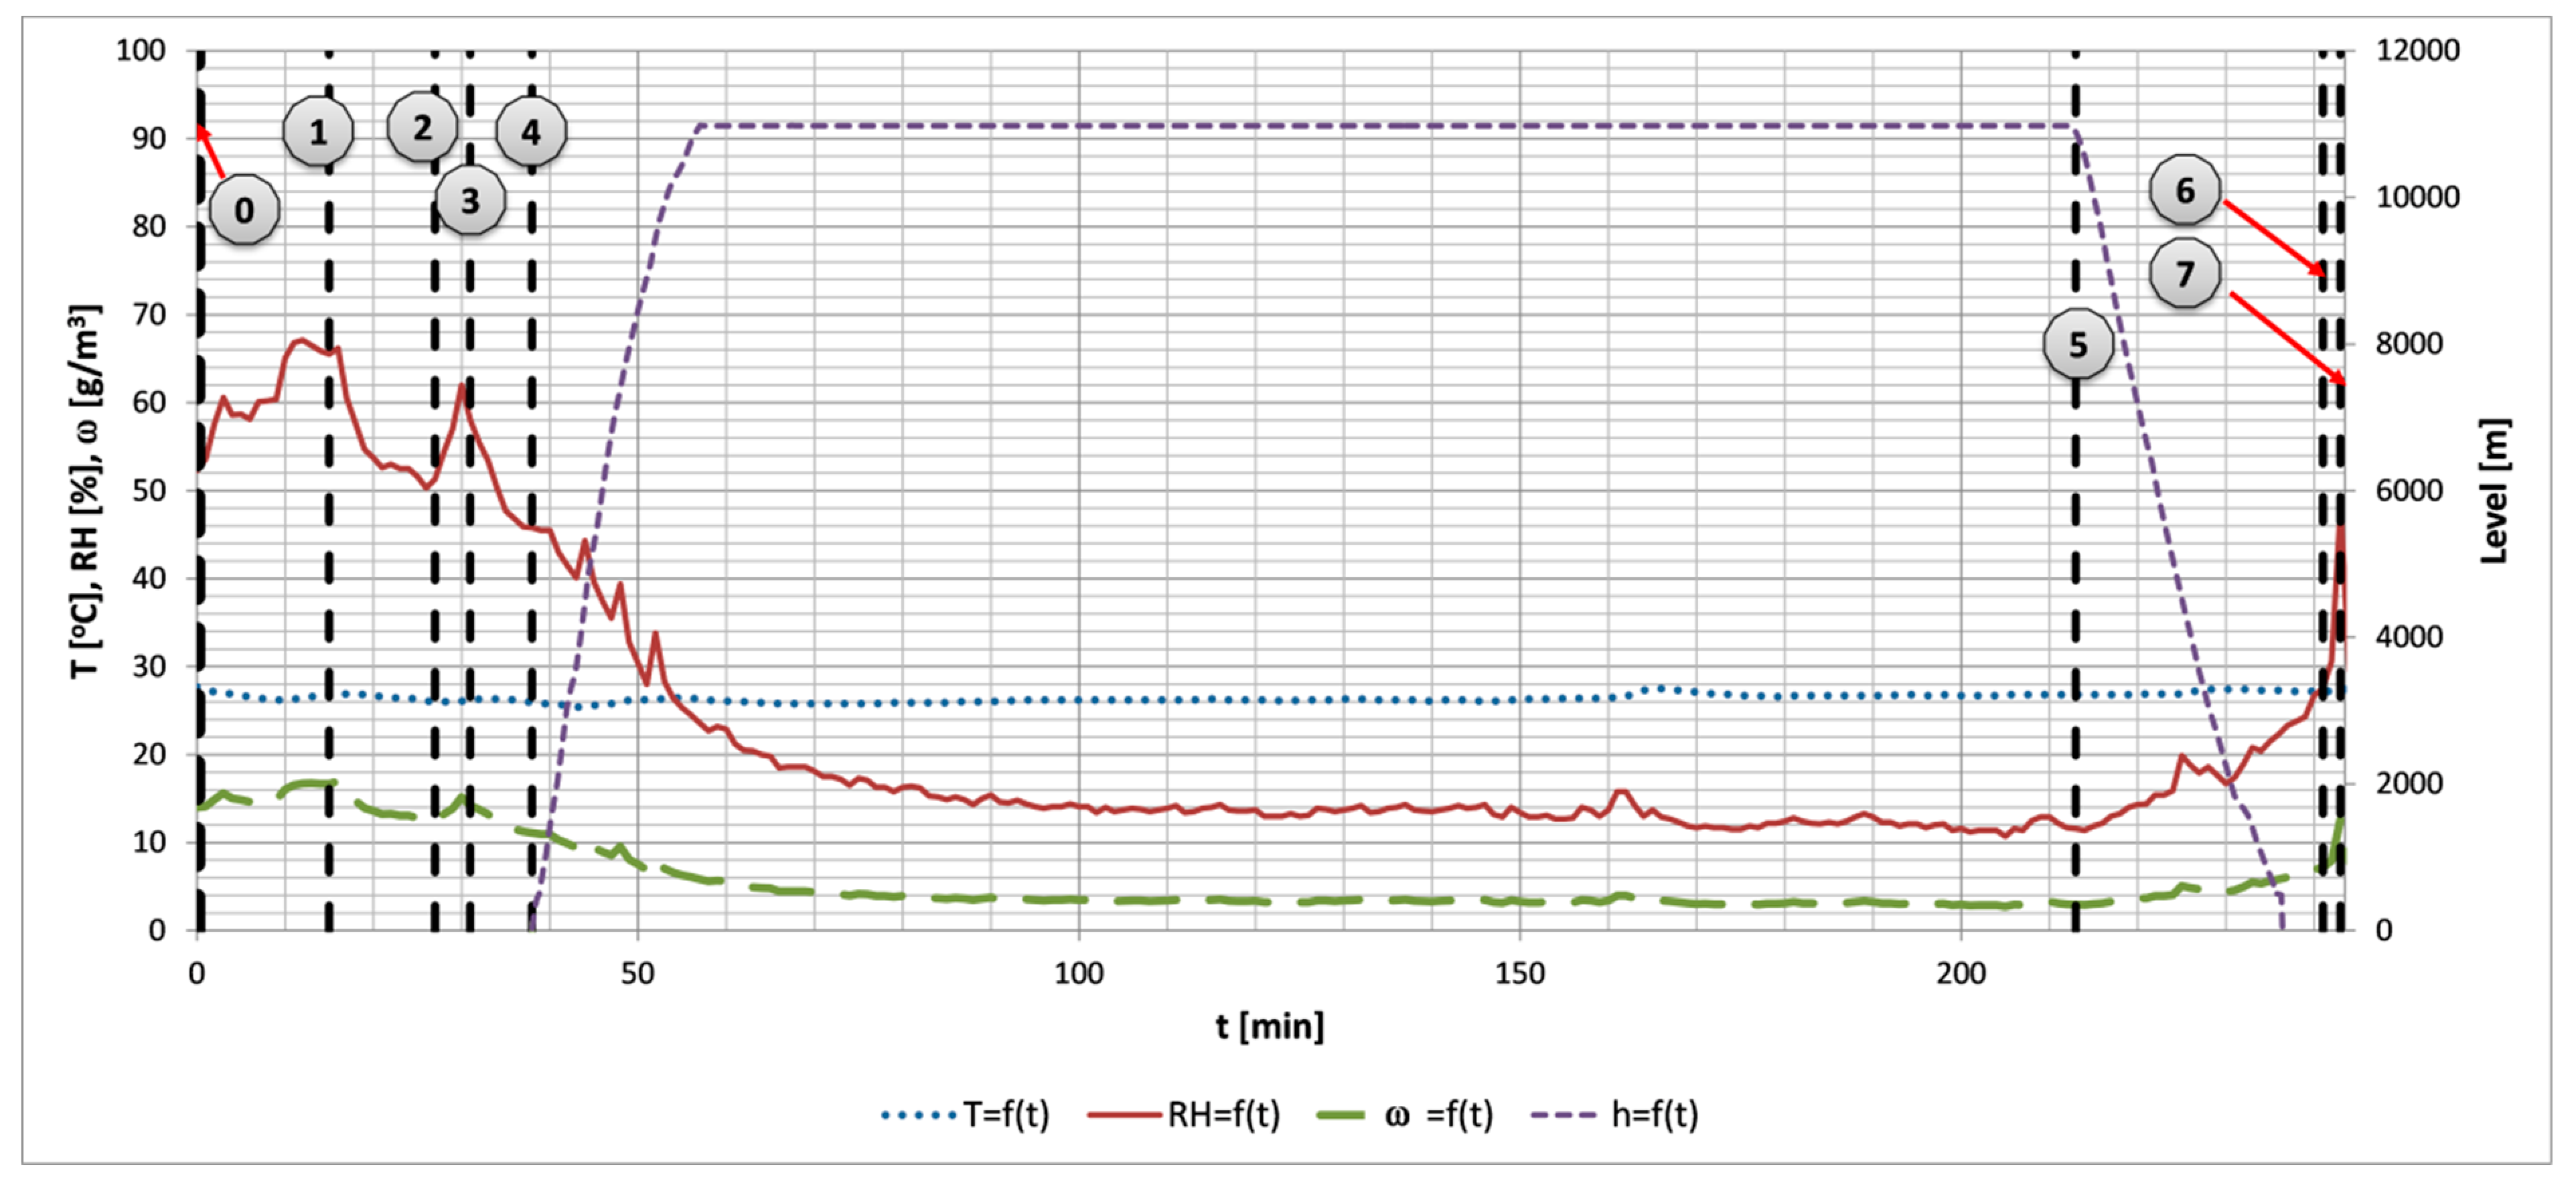
Figure 7.
Absolute humidity in the supply air vent.
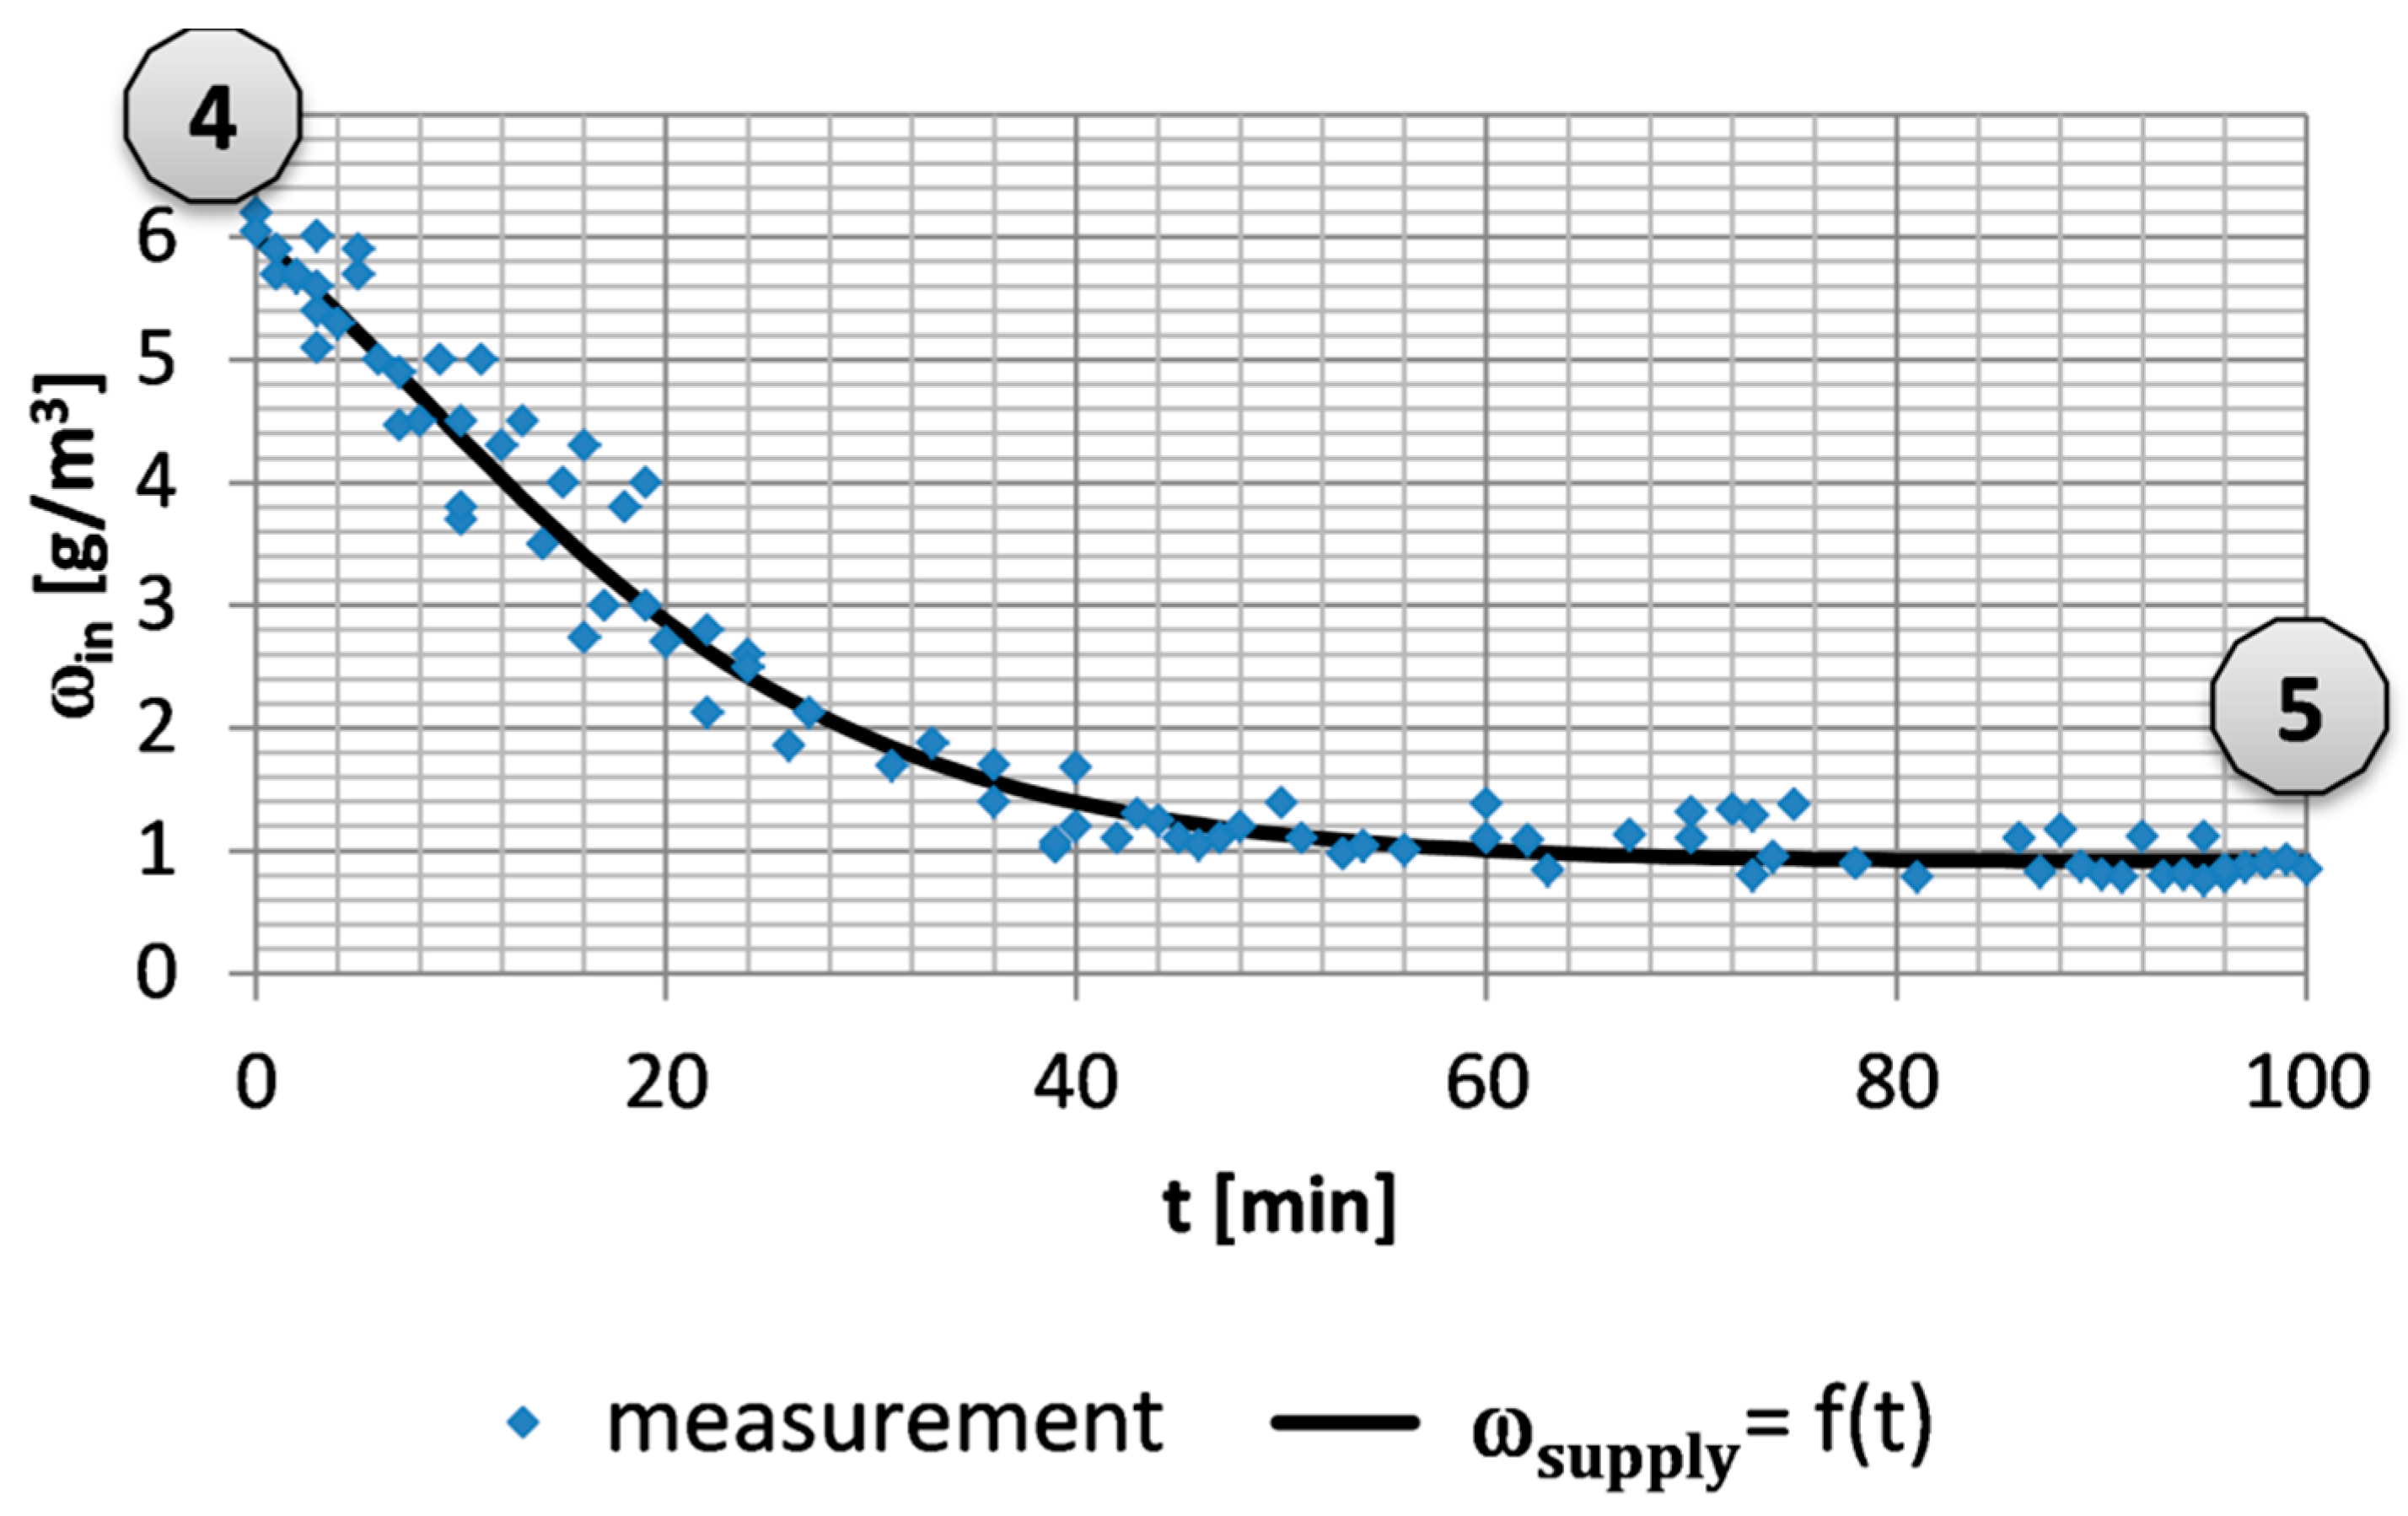
Figure 8.
Absolute humidity as a function of time in the airplane cabin from the moment of take-off to the moment of landing for measurement series no. 1, 11, 12 – comparison with the developed humidity model.
Figure 8.
Absolute humidity as a function of time in the airplane cabin from the moment of take-off to the moment of landing for measurement series no. 1, 11, 12 – comparison with the developed humidity model.
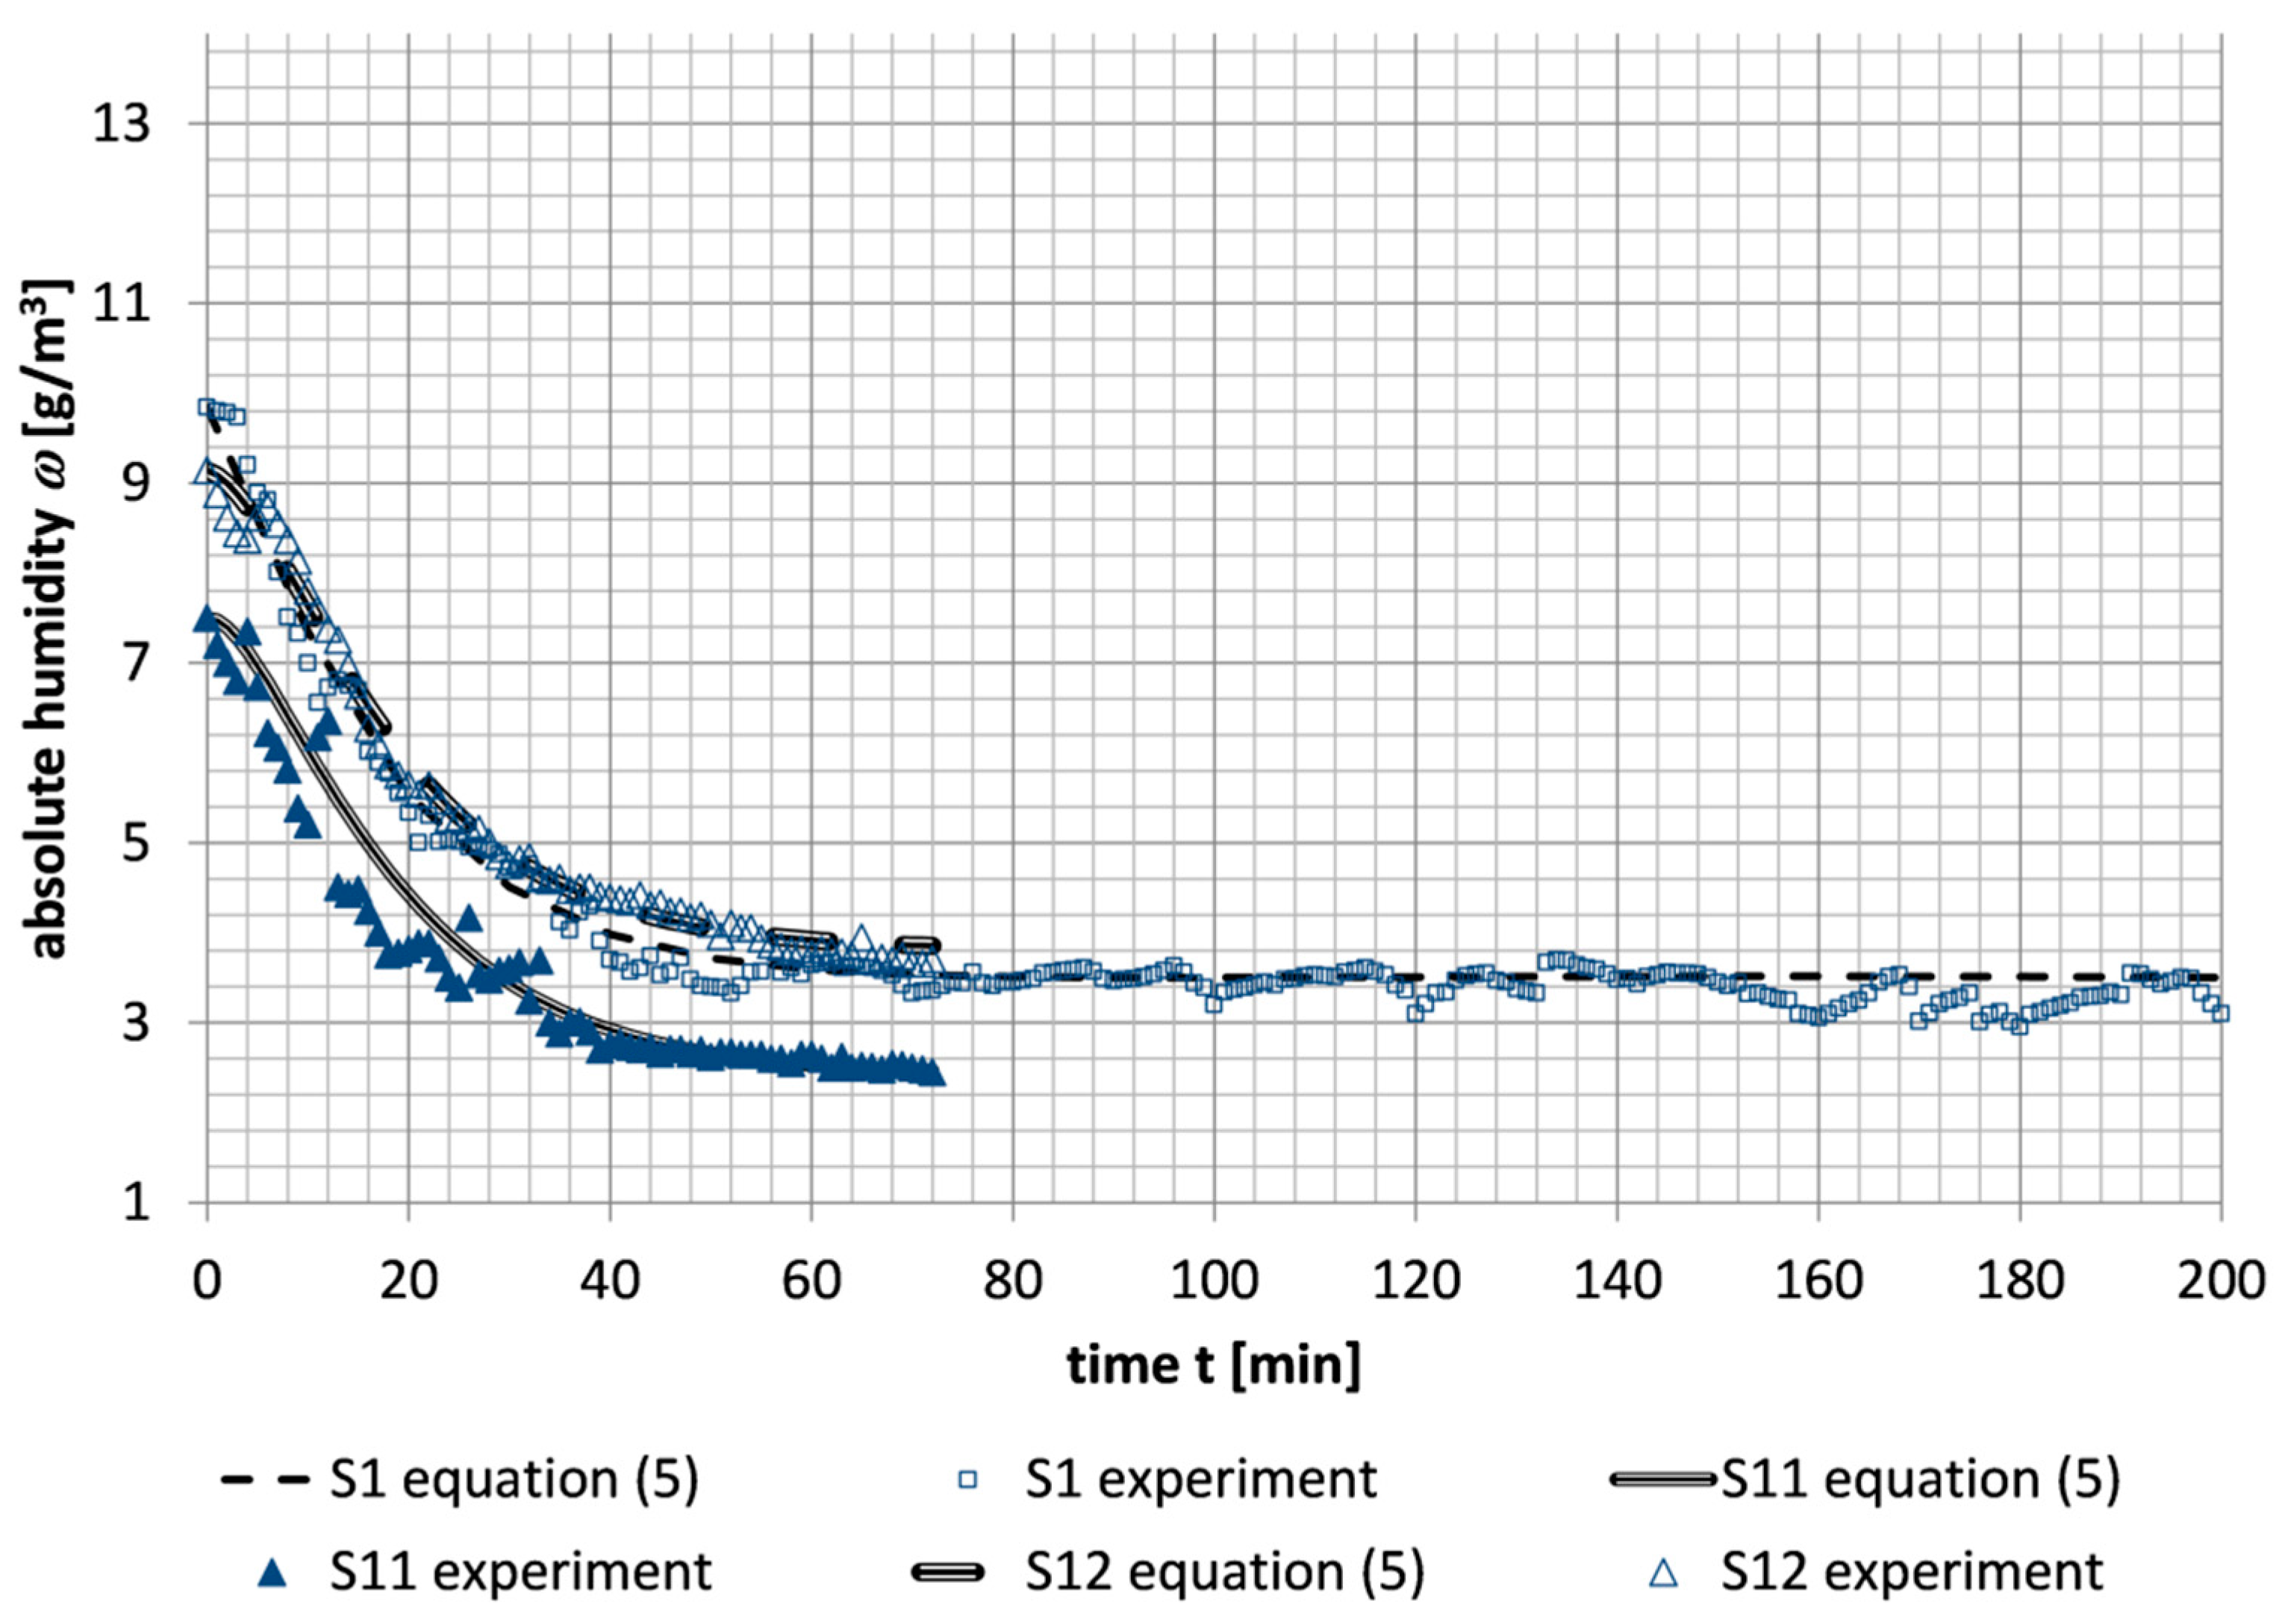
Figure 9.
Absolute humidity as a function of time in the airplane cabin from the moment of take-off to the moment of landing for measurement series no. 2, 3, 10, 14 – comparison with the developed humidity model.
Figure 9.
Absolute humidity as a function of time in the airplane cabin from the moment of take-off to the moment of landing for measurement series no. 2, 3, 10, 14 – comparison with the developed humidity model.
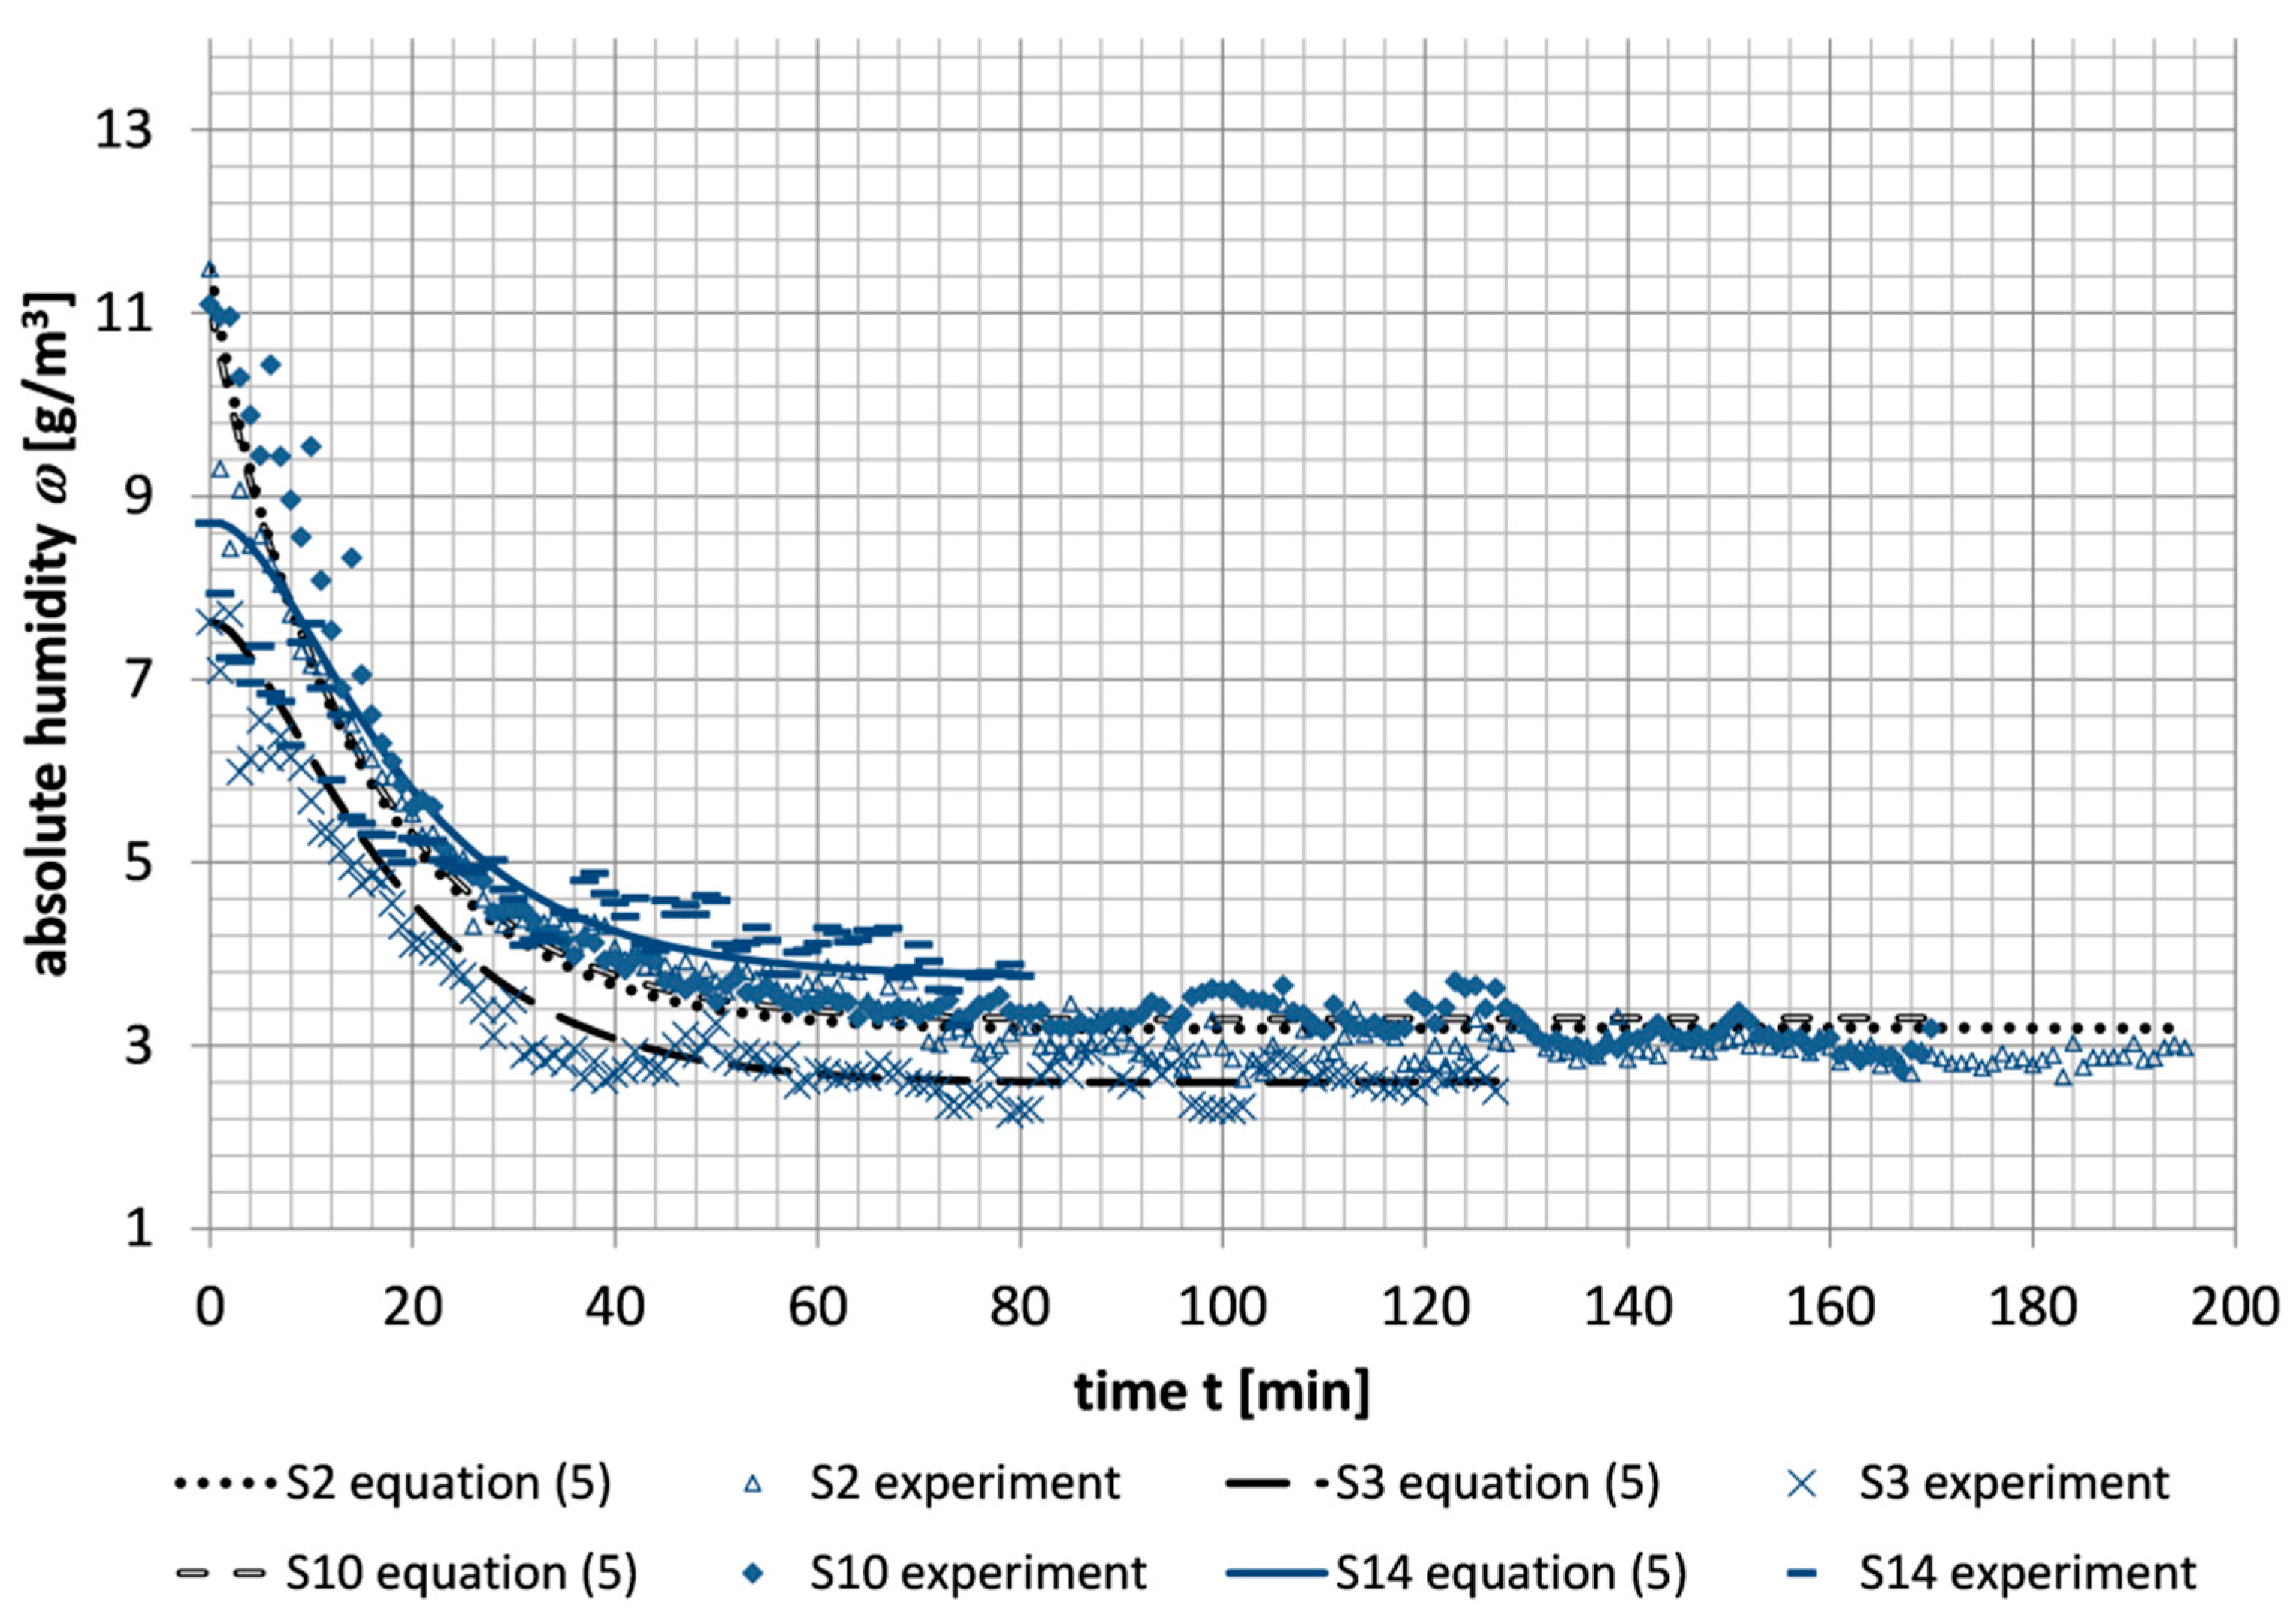
Figure 10.
Absolute humidity as a function of time in the airplane cabin from the moment of take-off to the moment of landing for measurement series no. 4, 6, 7 – comparison with the developed humidity model.
Figure 10.
Absolute humidity as a function of time in the airplane cabin from the moment of take-off to the moment of landing for measurement series no. 4, 6, 7 – comparison with the developed humidity model.
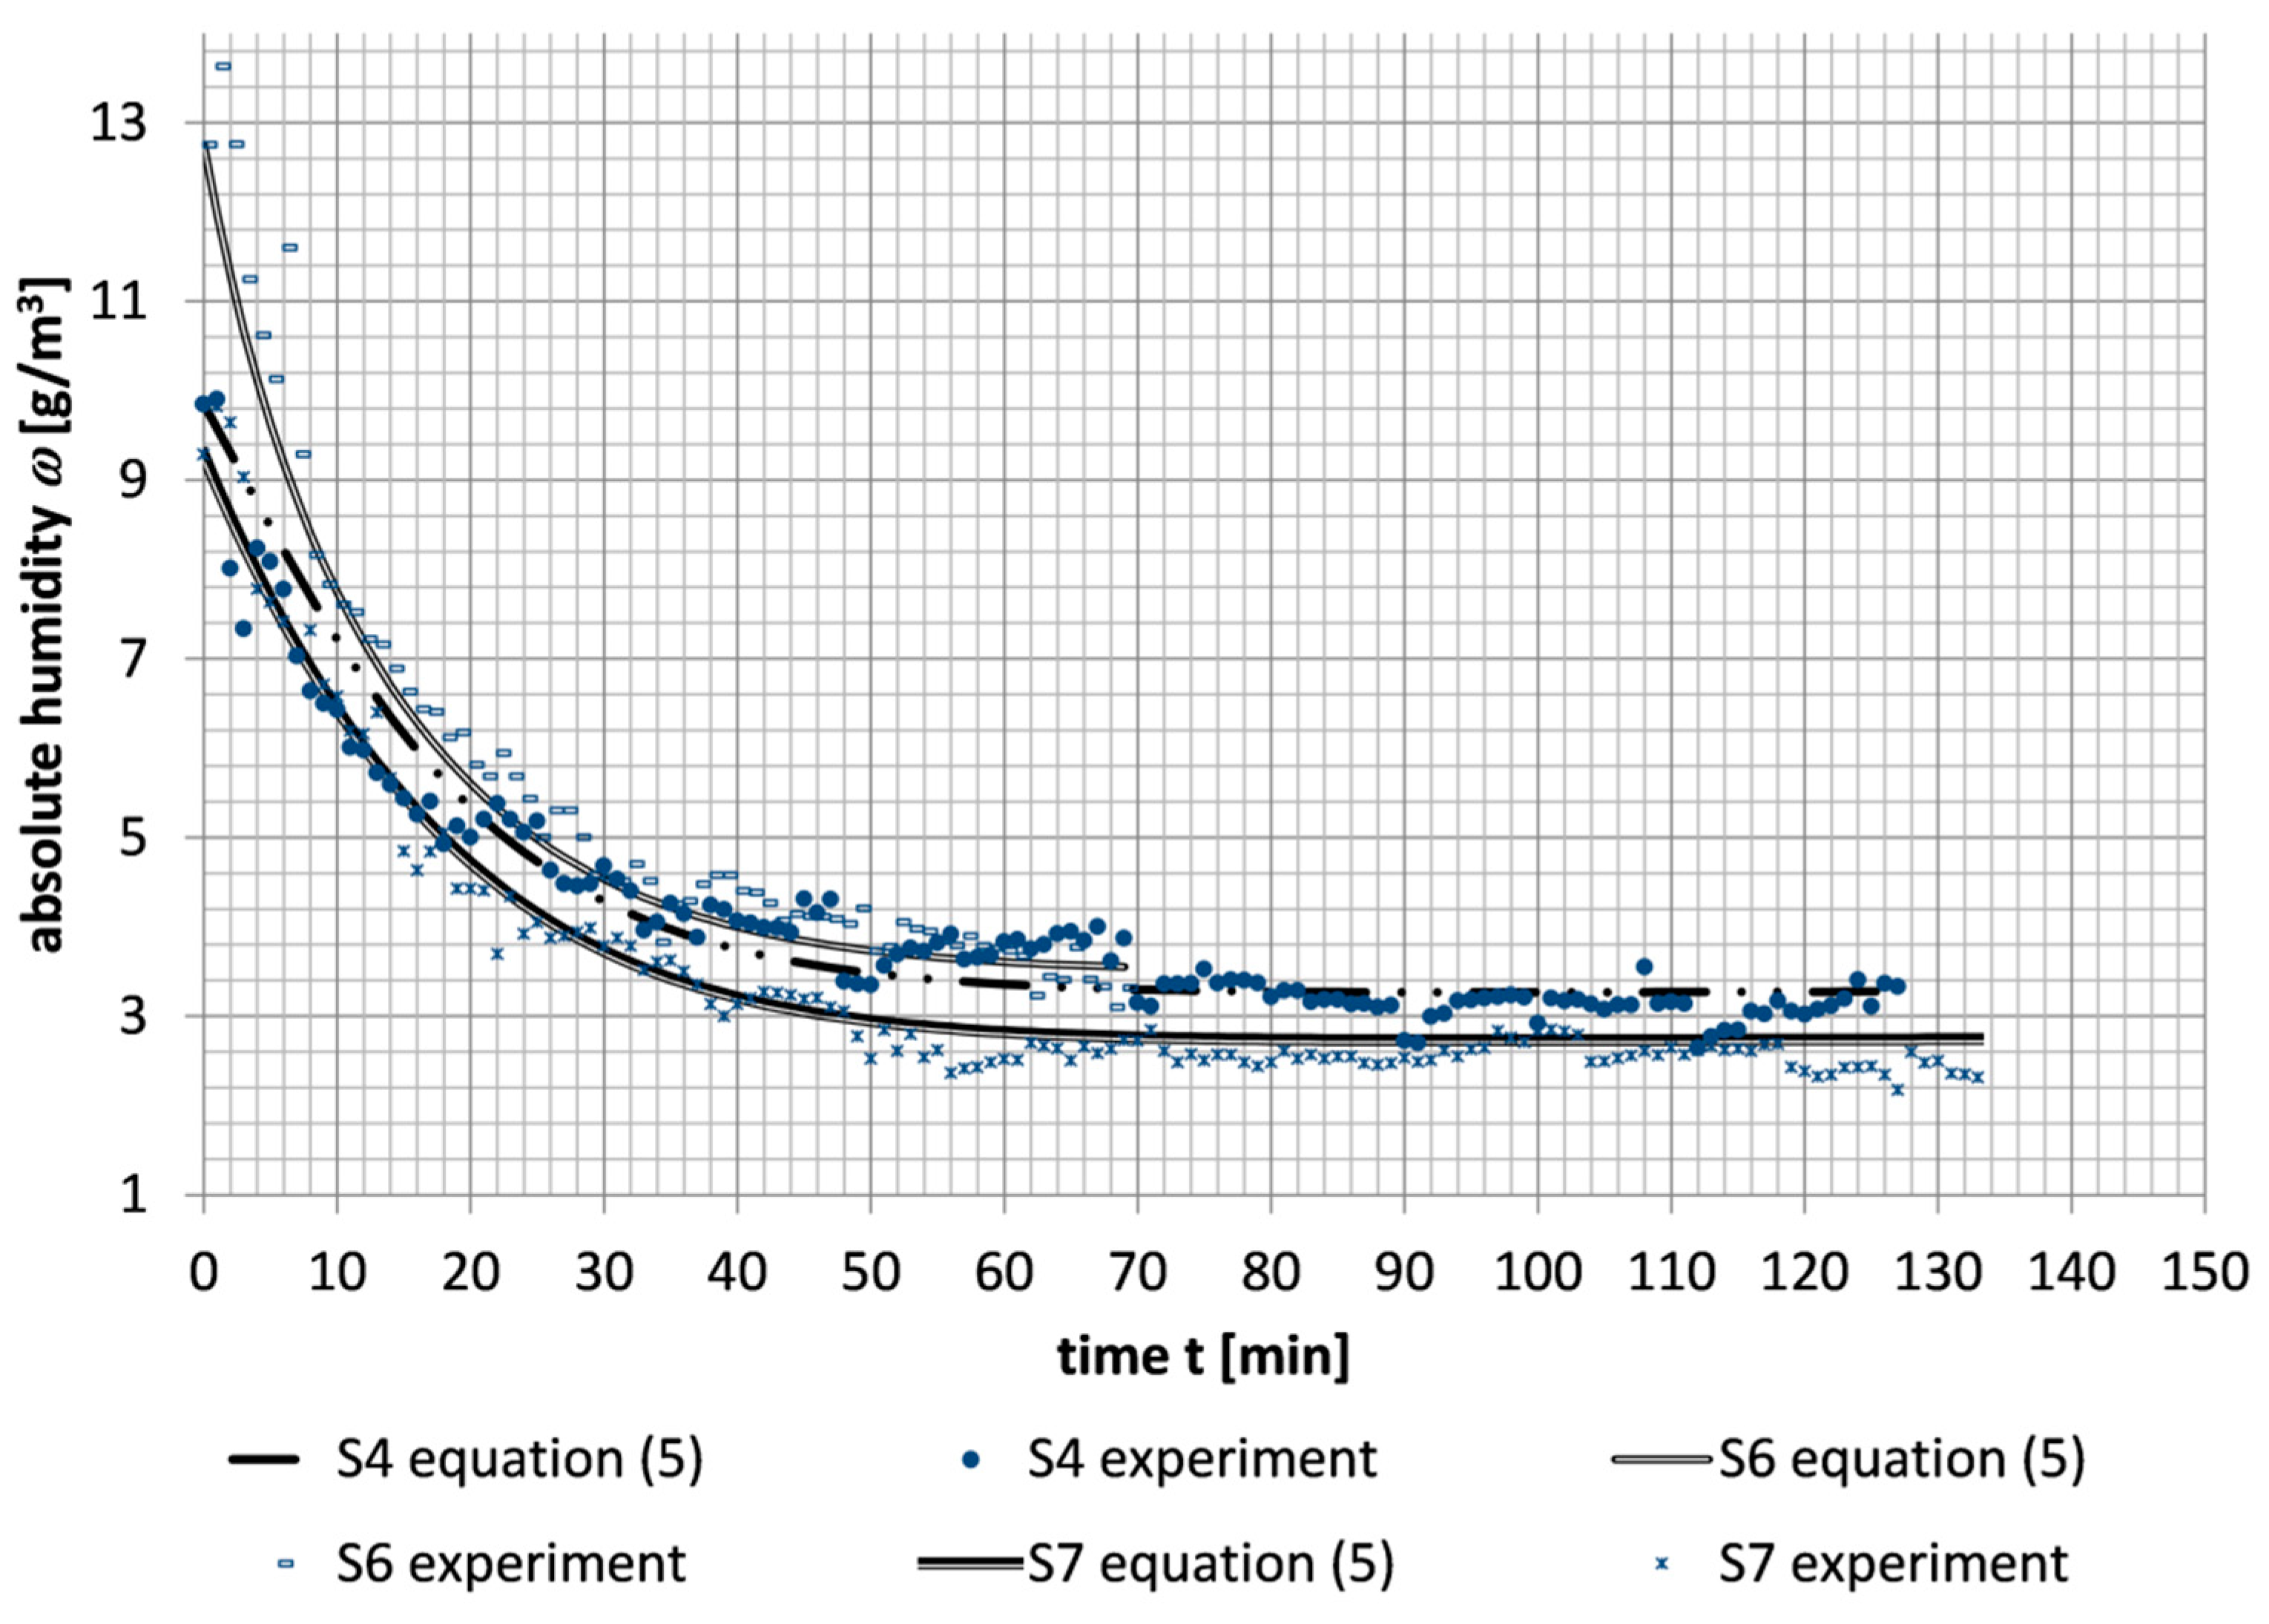
Figure 11.
Absolute humidity as a function of time in the airplane cabin from the moment of take-off to the moment of landing for measurement series no. 5, 8, 9, 13 – comparison with the developed humidity model.
Figure 11.
Absolute humidity as a function of time in the airplane cabin from the moment of take-off to the moment of landing for measurement series no. 5, 8, 9, 13 – comparison with the developed humidity model.
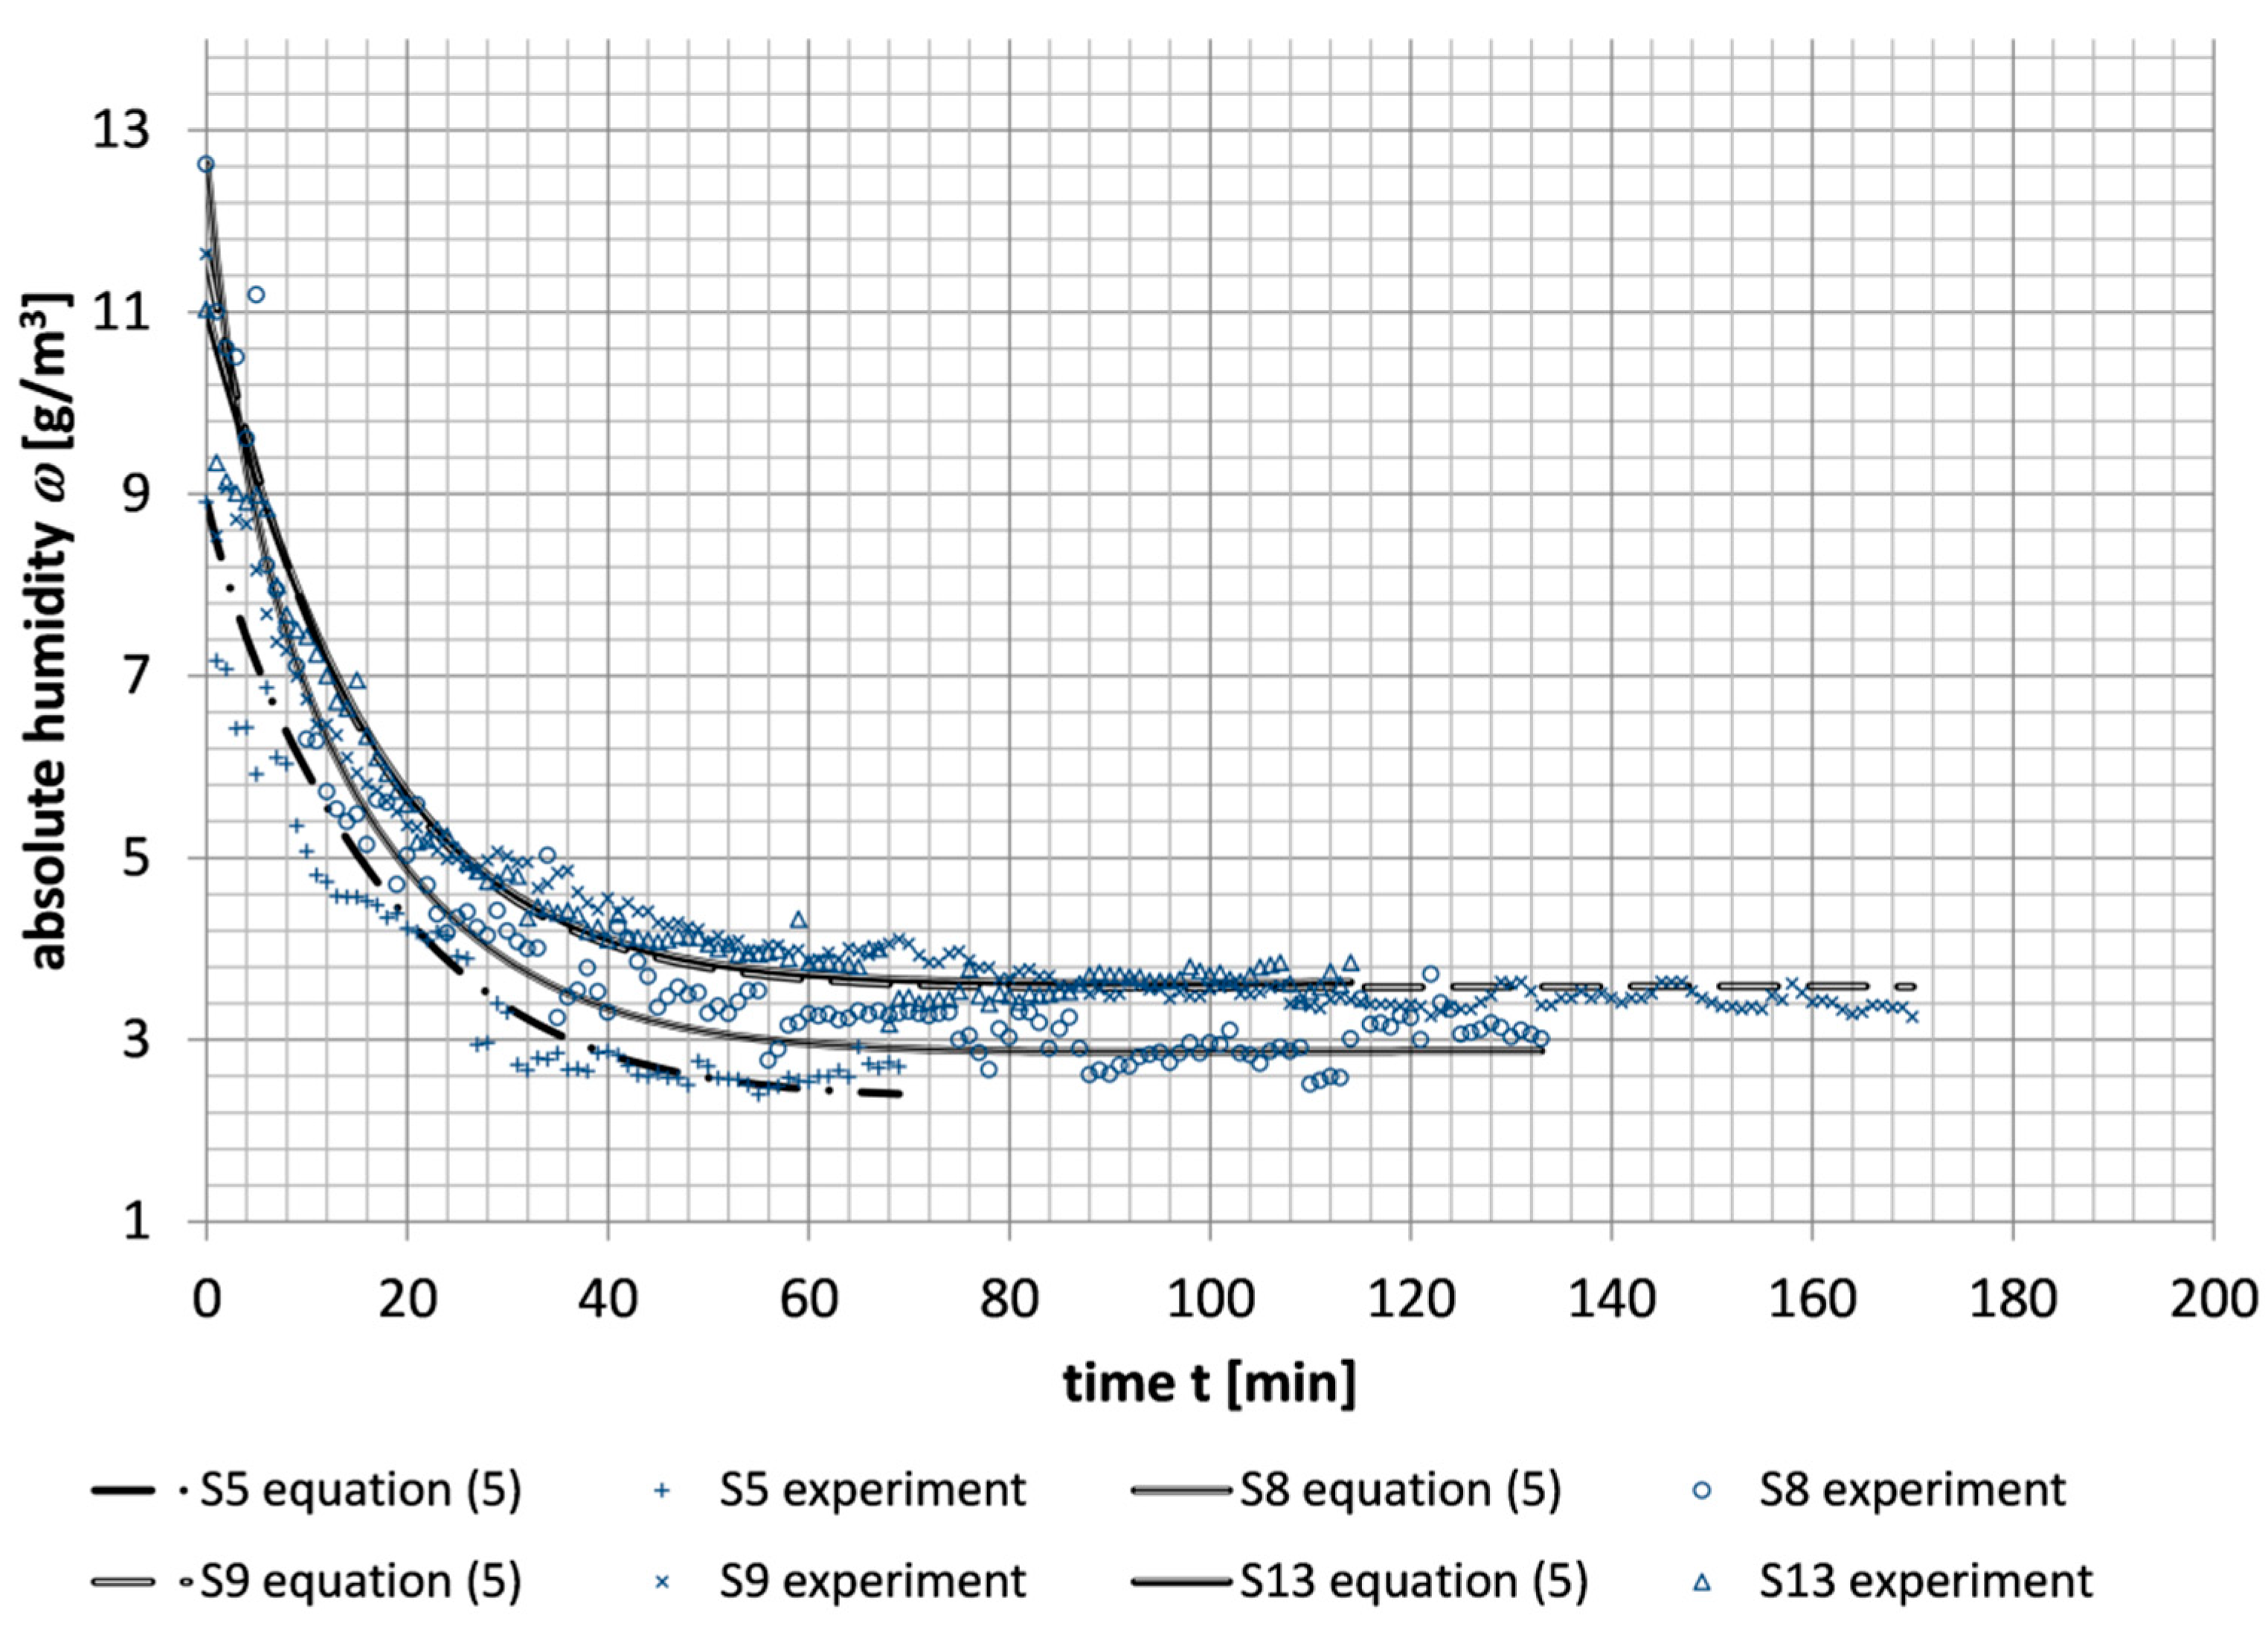
Figure 12.
An example of a cross-sectional diagram of a passenger aircraft cabin of a technical solution for increasing air humidity by using an air humidification chamber.
Figure 12.
An example of a cross-sectional diagram of a passenger aircraft cabin of a technical solution for increasing air humidity by using an air humidification chamber.
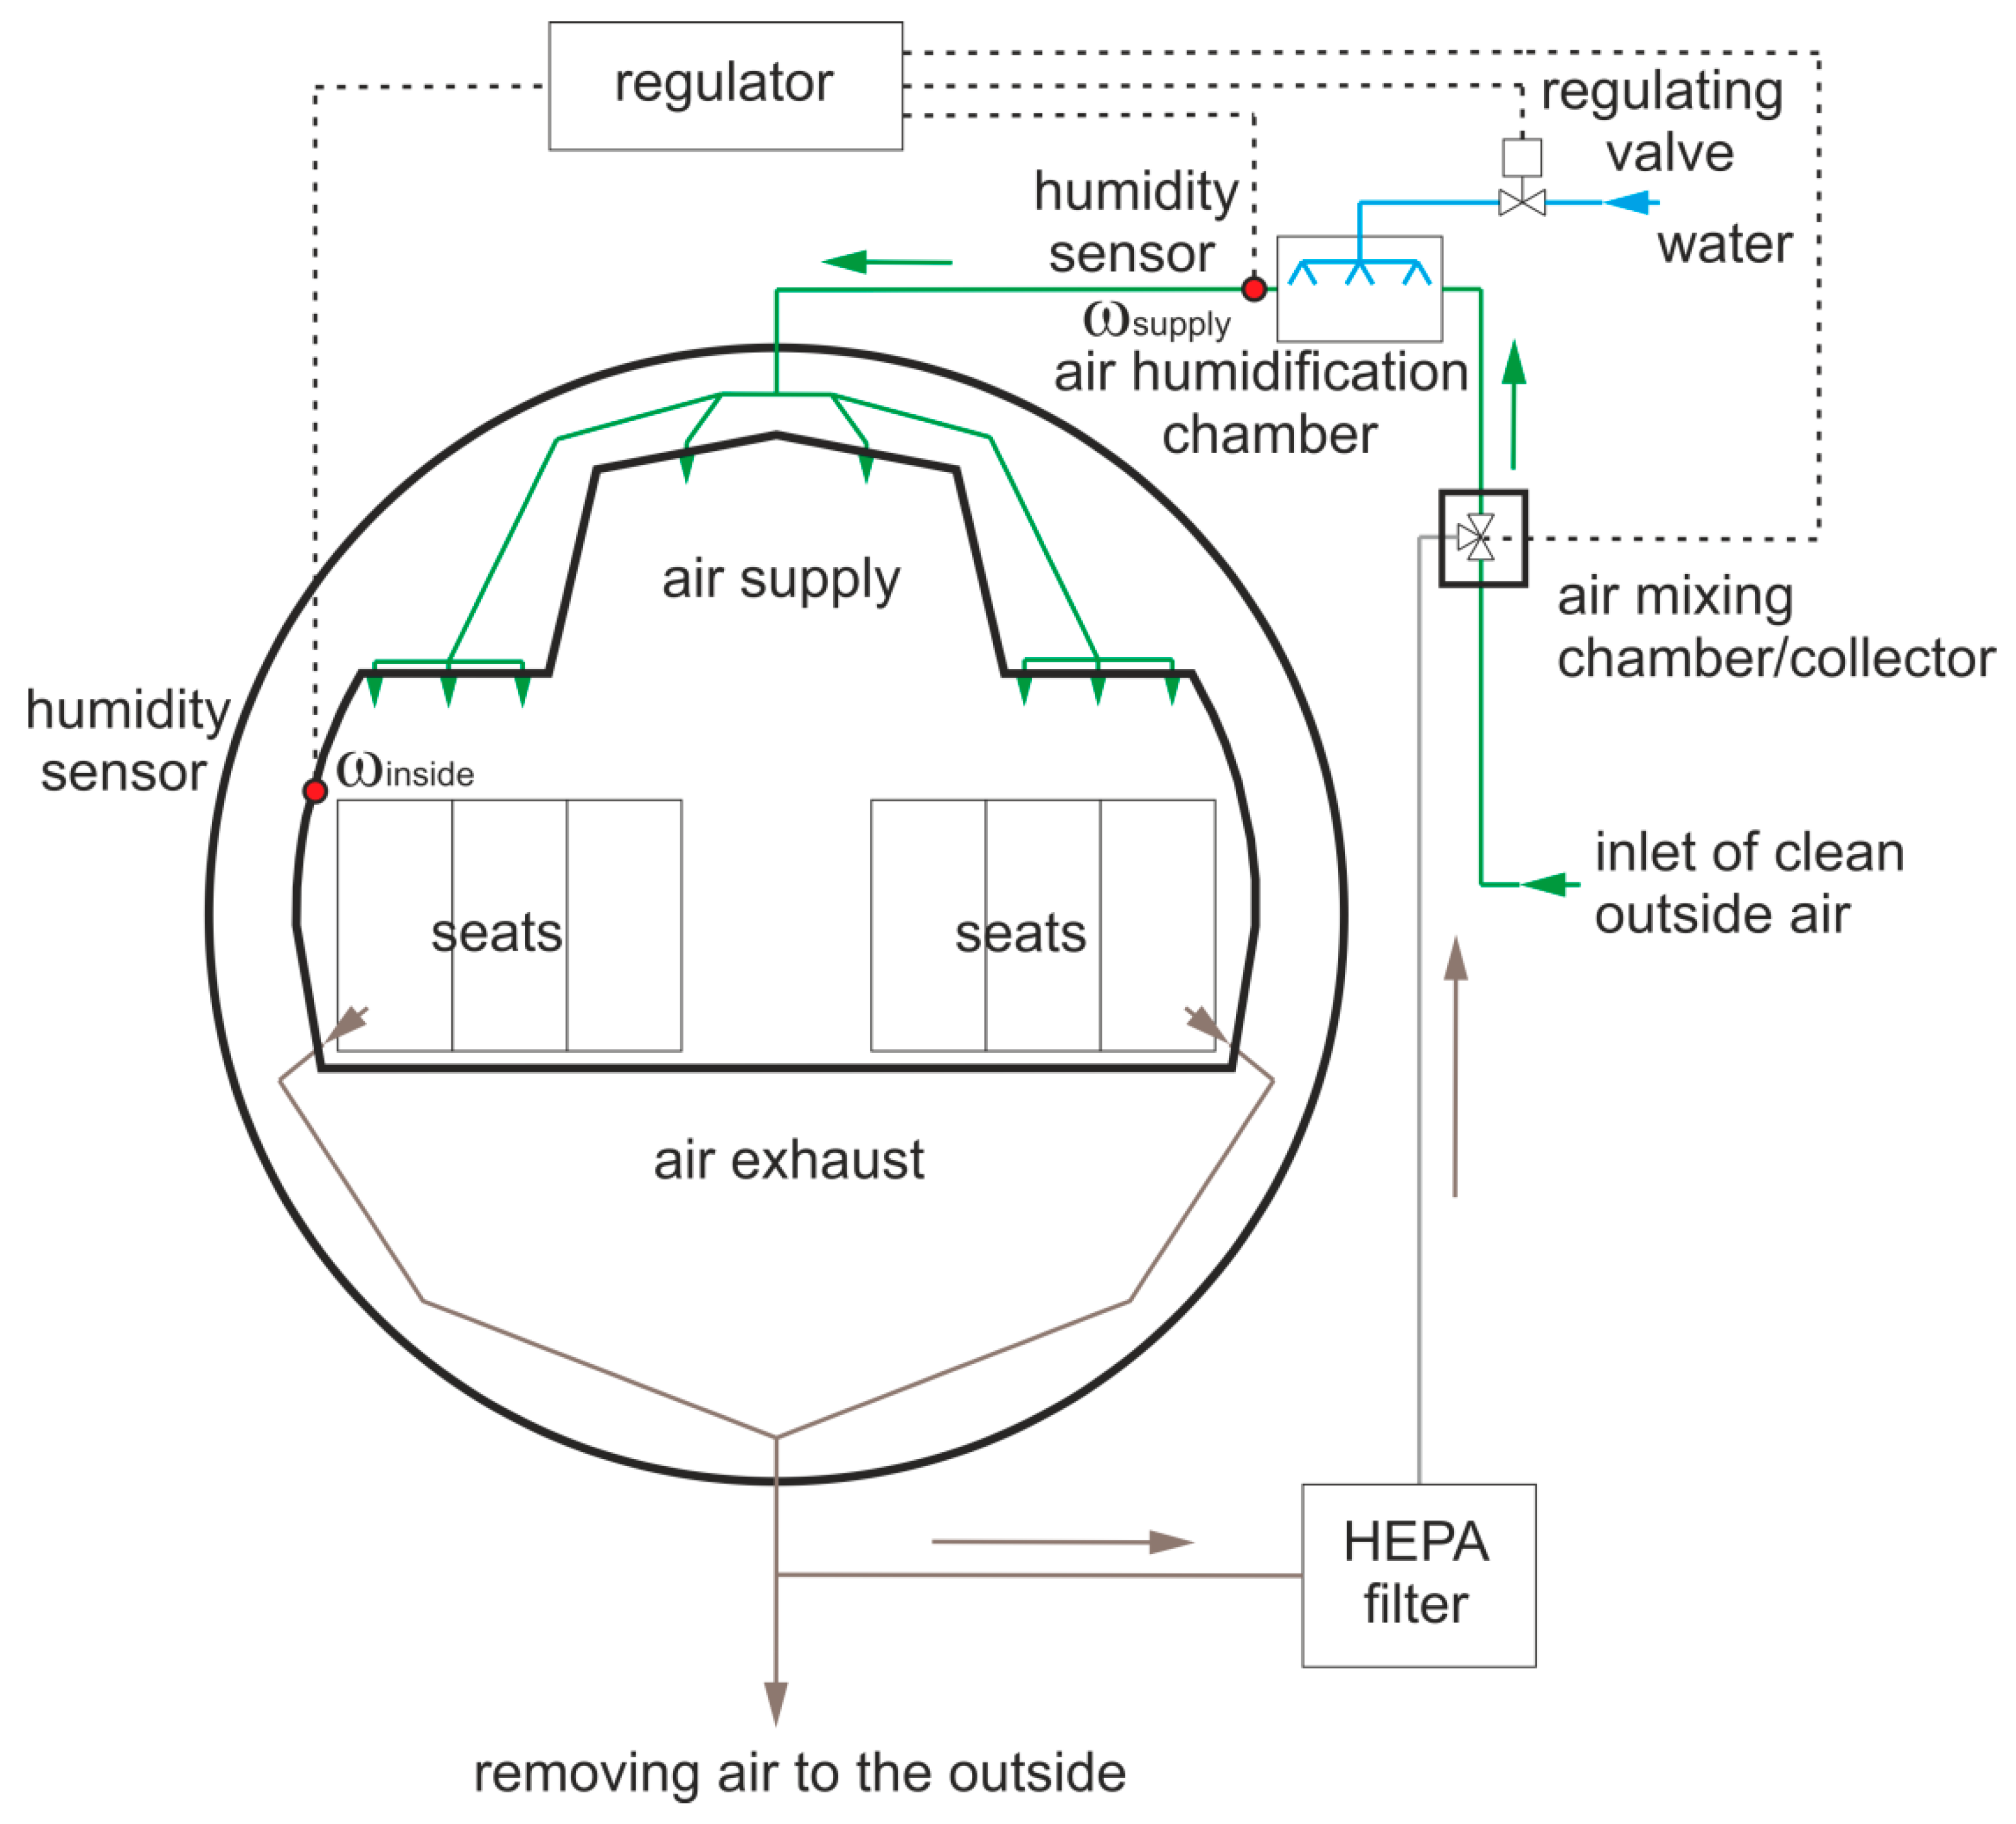

Table 1.
Basic data of airplane flights for fourteen measurement series: plane mode, route length, time spent on the plane, time spent on the plane divided into periods, number of passengers.
Table 1.
Basic data of airplane flights for fourteen measurement series: plane mode, route length, time spent on the plane, time spent on the plane divided into periods, number of passengers.
| No. series | Air route | Plane model | Date | Route length | Time spent in the plane | Time spent in the plane before the flight | Flight time | Time spent in the plane after landing | Number of passengers m |
|---|---|---|---|---|---|---|---|---|---|
| S1 | Modlin-Málaga | Boeing 737-800 | Nov. 2021 | 2633 | 234 | 10 | 212 | 12 | 180 |
| S2 | Malaga-Modlin | Boeing 737-800 | Nov. 2021 | 2840 | 260 | 40 | 209 | 11 | 171 |
| S3 | Modlin-Catania | Boeing 737-800 | Mar. 2022 | 1804 | 175 | 25 | 144 | 6 | 166 |
| S4 | Catania-Modlin | Boeing 737-800 | Mar. 2022 | 1795 | 202 | 39 | 146 | 17 | 150 |
| S5 | Modlin-Bologna | Boeing 737-800 | May 2022 | 1195 | 133 | 30 | 93 | 10 | 160 |
| S6 | Bologna-Modlin | Boeing 737-800 | May 2022 | 1174 | 144 | 34 | 101 | 9 | 181 |
| S7 | Warsaw-Kos | Boeing 737-800 | Jul. 2022 | 1978 | 188 | 28 | 157 | 3 | 158 |
| S8 | Kos- Warsaw |
Boeing 737-800 | Aug. 2022 | 1839 | 192 | 41 | 143 | 8 | 170 |
| S9 | Modlin-Alicante | Boeing 737-800 | Nov. 2022 | 2358 | 226 | 26 | 194 | 6 | 185 |
| S10 | Alicante-Modlin | Boeing 737-800 | Nov. 2022 | 2443 | 245 | 27 | 214 | 4 | 179 |
| S11 | Modlin-Bolonia | Boeing 737-800 | Dec. 2022 | 1195 | 134 | 26 | 103 | 5 | 133 |
| S12 | Bolonia-Modlin | Boeing 737-800 | Dec. 2022 | 1196 | 130 | 19 | 104 | 7 | 169 |
| S13 | Warsaw-Zahyntos | Boeing 737 MAX 8 | Aug. 2022 | 1737 | 173 | 38 | 130 | 5 | 173 |
| S14 | Zahyntos-Warsaw | Boeing 737 MAX 8 | Aug. 2022 | 1625 | 193 | 49 | 125 | 19 | 182 |
Table 2.
Average temperatures and relative air humidity in the cabin of a passenger plane.
| No. series | Average temperature in airplane cabin | Average relative humidity in airplane cabin | ||||||
| Before the plane takes off | In flight | After the plane lands | During the entire stay in the aircraft cabin | Before the plane takes off | In flight | After the plane lands | During the entire stay in the aircraft cabin | |
| Tavg | Tavg | Tavg | Tavg | φavg | φavg | φavg | φavg | |
| - | oC | oC | oC | oC | % | % | % | % |
| S1 | 23.10 | 26.55 | 26.10 | 26.47 | 49.60 | 17.01 | 30.70 | 18.94 |
| S2 | 27.54 | 25.96 | 26.10 | 25.95 | 51.14 | 15.98 | 30.42 | 23.57 |
| S3 | 24.73 | 26.43 | 26.10 | 26.27 | 33.19 | 14.24 | 28.67 | 17.42 |
| S4 | 27.97 | 26.98 | 26.10 | 27.28 | 42.61 | 15.90 | 26.34 | 21.91 |
| S5 | 27.67 | 25.23 | 26.20 | 25.83 | 31.29 | 14.17 | 28.29 | 18.68 |
| S6 | 30.36 | 26.73 | 26.20 | 27.70 | 43.52 | 20.11 | 33.04 | 26.40 |
| S7 | 25.48 | 26.60 | 26.60 | 26.41 | 43.73 | 16.74 | 32.70 | 21.00 |
| S8 | 26.97 | 24.55 | 26.40 | 25.09 | 59.37 | 19.85 | 34.93 | 28.87 |
| S9 | 22.95 | 26.53 | 26.50 | 26.17 | 22.95 | 17.11 | 34.52 | 22.75 |
| S10 | 26.51 | 26.40 | 26.50 | 26.44 | 26.51 | 16.50 | 30.81 | 23.16 |
| S11 | 24.67 | 25.89 | 26.60 | 25.68 | 24.67 | 11.90 | 22.57 | 16.49 |
| S12 | 25.37 | 25.03 | 26.60 | 25.28 | 25.37 | 22.63 | 30.00 | 27.35 |
| S13 | 26.21 | 25.29 | 26.50 | 25.52 | 26.21 | 19.85 | 29.82 | 25.63 |
| S14 | 25.96 | 26.75 | 26.60 | 26.41 | 25.96 | 26.41 | 37.51 | 26.41 |
| Average | values | |||||||
| - | 26.11 | 26.07 | 26.36 | 26.18 | 36.15 | 17.74 | 30.74 | 22.76 |
Table 3.
Assessment of air quality based on a combination of average values of temperature and relative air humidity in the cabin of a passenger aircraft based on the literature [24].
Table 3.
Assessment of air quality based on a combination of average values of temperature and relative air humidity in the cabin of a passenger aircraft based on the literature [24].
| No. series | Measurement period | |||
|---|---|---|---|---|
| Before the plane takes off | In flight | After the plane lands | During the entire stay in the aircraft cabin | |
| S1 | Intermediate | Intermediate | Good | Intermediate |
| S2 | Bad | Intermediate | Good | Intermediate |
| S3 | Good | Intermediate | Intermediate | Intermediate |
| S4 | Intermediate | Intermediate | Intermediate | Bad |
| S5 | Intermediate | Intermediate | Intermediate | Intermediate |
| S6 | Intermediate | Intermediate | Good | Bad |
| S7 | Good | Intermediate | Good | Intermediate |
| S8 | Intermediate | Intermediate | Good | Intermediate |
| S9 | Bad | Intermediate | Good | Intermediate |
| S10 | Intermediate | Intermediate | Good | Intermediate |
| S11 | Intermediate | Intermediate | Intermediate | Intermediate |
| S12 | Intermediate | Intermediate | Intermediate | Intermediate |
| S13 | Intermediate | Intermediate | Intermediate | Intermediate |
| S14 | Intermediate | Intermediate | Good | Intermediate |
| Average values | ||||
| Good | Intermediate | Good | Intermediate | |
Table 4.
Coefficients of equation (3).
| a | b | c | d | e | f | g |
|---|---|---|---|---|---|---|
| 6 | -0.13 | 0.002 | 1 | 0.002 | 0.001 | 0.000003 |
Table 5.
Initial value of absolute humidity at the moment of take-off, the determined number of air changes based on the developed model and the average relative error of the model for individual measurement series.
Table 5.
Initial value of absolute humidity at the moment of take-off, the determined number of air changes based on the developed model and the average relative error of the model for individual measurement series.
| No. series | The initial value of absolute humidity at the moment of take-off of the plane | Number of air changes | Relative error of absolute humidity according to (9) |
|---|---|---|---|
| ωt=0 | n | δωinside | |
| - | g/m3 | 1/h | % |
| S1 | 9.84 | 12 | 6.67 |
| S2 | 11.48 | 13 | 7.86 |
| S3 | 7.62 | 17 | 7.38 |
| S4 | 9.85 | 11 | 7.48 |
| S5 | 8.91 | 19 | 7.95 |
| S6 | 12.75 | 12 | 5.75 |
| S7 | 9.28 | 15 | 7.12 |
| S8 | 12.62 | 15 | 7.57 |
| S9 | 11.64 | 12 | 6.15 |
| S10 | 11.09 | 13 | 5.84 |
| S11 | 7.50 | 15 | 6.20 |
| S12 | 9.14 | 10 | 2.63 |
| S13 | 11.03 | 11 | 3.83 |
| S14 | 8.71 | 11 | 8.39 |
Disclaimer/Publisher’s Note: The statements, opinions and data contained in all publications are solely those of the individual author(s) and contributor(s) and not of MDPI and/or the editor(s). MDPI and/or the editor(s) disclaim responsibility for any injury to people or property resulting from any ideas, methods, instructions or products referred to in the content. |
© 2025 by the authors. Licensee MDPI, Basel, Switzerland. This article is an open access article distributed under the terms and conditions of the Creative Commons Attribution (CC BY) license (http://creativecommons.org/licenses/by/4.0/).
Copyright: This open access article is published under a Creative Commons CC BY 4.0 license, which permit the free download, distribution, and reuse, provided that the author and preprint are cited in any reuse.


