
Submitted:
18 December 2025
Posted:
19 December 2025
You are already at the latest version
Abstract
This study introduces the Three-Line Heuristic Framework (TLHF) as a descriptive, multi-actor lens for AI-enabled smart-tourism governance. It conceptualizes three recurring trajectories: (i) government credibility rises once transparency becomes visible, (ii) firm-side trust stabilizes as efficiency gains taper, and (iii) user confidence accumulates through familiar, low-friction use. Satisficing Equilibrium (SE) denotes a mid–high adequacy band in which participation and perceived trust cluster once minimum transparency and usability thresholds are perceived as “good enough,” without implying optimality, causality, or a game-theoretic solution. A mixed-method design integrates a cross-national online survey (N = 1,590; replication = 1,840) and 35 institutional interviews. Kernel-density and LOESS diagnostics visualize distributional concentration, while binary logit with Average Marginal Effects (AME) summarizes associative patterns. Information Control Level (ICL) is treated as a formative composite with low local VIFs (≈ 1.03–1.10). Results are consistent with the TLHF/SE interpretation: the Positive Index is positively associated with safe-platform preference (Q8) (p < 0.05; AME ≈ +3.2 pp), whereas privacy concern and AI-use breadth are not significantly negative once visibility cues are included. The mid–high adequacy concentration remains visually robust under ±25% smoothing and across both datasets. The dataset is Asia-anchored and China-dominant (≈84%); findings are therefore descriptive and bounded. Overall, the evidence suggests that sustainable AI governance in tourism may be supported less by maximal regulation than by credible transparency, dependable service quality, and low-friction usability, with implications for SDGs 8, 12, and 17.
Keywords:
TLHF
; satisficing equilibrium
; adequacy band
; transparency visibility
; nonparametric density
; KDE
; LOESS
; AME
; smart tourism
1. Introduction
Artificial intelligence (AI) is reshaping governance and industry, and tourism is among the most digitalized sectors. AI-enabled services—from forecasting and navigation to personalization—are associated with efficiency gains and improved user experience, while GenAI, NLP, and IoT are increasingly discussed in sustainable destination management [1,2,3,34]. At the same time, privacy leakage, algorithmic bias, and opaque accountability can be linked to reduced confidence, making trust a practical condition for sustained AI uptake in tourism [1,2,3]. The coexistence of privacy concern and continued reliance—the privacy paradox—captures a recurring tension between information control and everyday dependence [4,5,29,40].
Sustainable tourism governance therefore faces the task of balancing innovation with accountability. This concern is aligned with SDGs 8, 12, and 17 (decent work; responsible consumption/production; multi-actor partnership) [35,36,37]. Yet existing scholarship often analyzes trust through single-actor lenses (user adoption, institutional assurance, or system design in isolation) within bounded contexts. Less clarity remains on how governments, firms, and users jointly shape trust-relevant outcomes when governance arrangements are integrated, and on how these relations may appear non-monotonic in descriptive distributions rather than uniformly increasing across the range. Related reviews in HCI trust and AI-trust measurement also emphasize construct plurality and contextual dependency, supporting a multi-cue view rather than a single reflective scale [26,33].
To address this gap, we introduce two descriptive organizers.
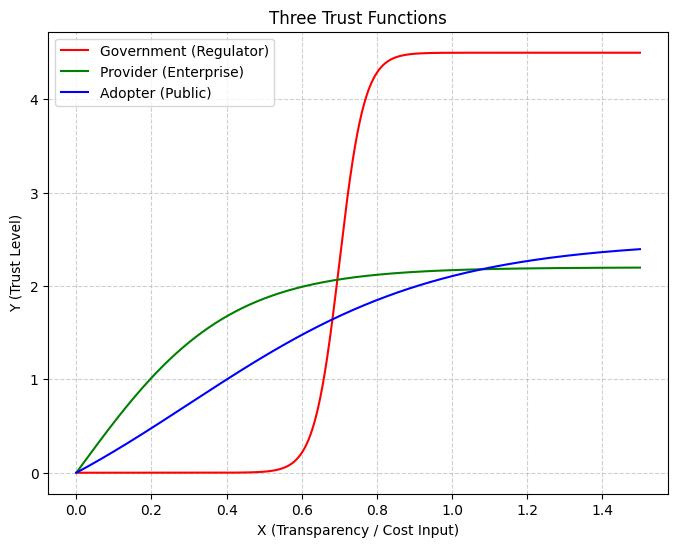
First, the Three-Line Heuristic Framework (TLHF) is a nonparametric, multi-actor lens that places three recurring trajectories side-by-side in AI-enabled tourism governance:
- Visibility threshold (government): trust-relevant outcomes appear higher when transparency becomes salient at the point of decision; cross-national evidence is consistent with shifts in government trust in response to transparency signals [28].
- Efficiency plateau (firms): improvements associated with operational efficiency may show tapering in trust-relevant outcomes at higher adequacy levels; users’ smart-tourism technology experiences are reported to translate into intentions but do not increase without bound [27].
TLHF differs from single-actor adoption or institution-only perspectives by organizing these trajectories in parallel without imposing a specific functional form or additivity constraint.
Second, Satisficing Equilibrium (SE) is defined as a mid–high adequacy band in which participation and trust-related proxies cluster once minimum transparency and usability conditions are perceived as “good enough.” SE here is descriptive rather than a solved game-theoretic equilibrium; it aligns with bounded-rational satisficing logic whereby actors pursue adequacy under constraints rather than global optimization [21,25]. Throughout, we avoid causal claims and do not estimate structural parameters; instead, we use distributional diagnostics to summarize regularities consistent with TLHF and an SE-like adequacy-band interpretation [11,12,13,23].
Research questions. We ask: (1) How do trust–information-control relations differ across governments, firms, and users? (2) Can a unified heuristic organize cross-actor concentration patterns without imposing a specific functional form? (3) Do observed mid–high concentration patterns persist under alternative encodings, smoothing perturbations, and sample expansion, supporting an adequacy-band interpretation?
Empirical design. We combine a baseline survey (N = 1,590), 35 semi-structured interviews, and a replication sample (N = 1,840) (Appendices D–E). The survey used an authenticated platform to reduce duplicate entries, which may restrict international participation; the resulting sample is East-Asia-concentrated (China-dominant), so generalization is bounded. Methodologically, we apply KDE and LOESS as descriptive diagnostics of distributional shape and concentration, and use binary logit with Average Marginal Effects (AME) to summarize marginal associations under stated controls; model summaries and fit indices appear in Appendix D [11,12,13,15,23]. Visual sensitivity panels (alternative Q5 coding; ±25% smoothing perturbations; sample expansion) are provided in Appendices D–E, and qualitative triangulation is summarized in Appendix F. Within this Asia-anchored design, analyses are descriptive and scope-bounded rather than causal. For terminology consistency, we use safe-platform preference (Q8) as the binary dependent variable throughout, while Q3–Q4 serve as trust-related proxies for descriptive visualization.
Contributions.
- ✧
- ✧
- ✧
- Practical — Highlight operational levers—credible transparency visibility and low-friction usability—that may be consistent with and could support sustainable tourism programs aligned with SDGs 8, 12, and 17 (e.g., visible disclosure checkpoints; routine task flows that avoid disproportionate friction) [35,36,37,27,28,34].
2. Literature Review
Artificial intelligence (AI) increasingly underpins smart tourism through forecasting, navigation, and personalized recommendation, being associated with efficiency-oriented digitalization and potential links to sustainability goals such as service accessibility and reduced coordination costs [1,2,3,34,42]. In tourism, however, “sustainable” AI is not merely a performance issue: it depends on governance conditions that make data use accountable, transparent, and socially legitimate. Trust therefore functions as a practical prerequisite for ethical and sustainable deployment. Risks such as data overcollection, algorithmic bias, and opaque accountability may undermine confidence, while the privacy paradox—continued participation despite explicit concern—illustrates a recurring tension between information control and habitual reliance [4,5,29,40].
Multi-actor governance as the missing integrator.
Trust-related outcomes in smart-tourism governance arise from interactions among governments, firms, and users rather than user attitudes alone. Governments shape public-facing visibility and accountability; firms manage efficiency–responsibility trade-offs; and users develop confidence through repeated, low-friction interaction. Although prior studies have identified adoption and perception patterns, few have explicitly connected institutional arrangements, organizational operation, and user experience within a unified comparative frame [1,2,3,27,28,33,42,43].
To integrate these strands, this study employs the Three-Line Heuristic Framework (TLHF) and Satisficing Equilibrium (SE) as descriptive conceptual organizers—avoiding structural estimation and not assuming any pre-specified functional form. This nonparametric perspective enables examination of empirical distributional shapes rather than relying solely on parametric coefficients.
Positioning relative to prior lenses. Classic research in automation trust, HRI, and AI-tourism behavior emphasizes three logics:
- ➢
- ➢
- ➢
Yet empirical studies have often relied on parametric specifications for tractability, summarizing mean effects while overlooking shape variation (e.g., concentration zones, nonlinear thresholds). TLHF instead juxtaposes three actor-linked trajectories and treats shape itself as descriptive evidence rather than an assumed linear path [26,33].
TLHF as organizer; SE as descriptive adequacy band.
TLHF arranges three descriptive trajectories central to AI tourism governance:
SE complements this structure as a mid–high adequacy band in which participation and trust-related indicators cluster once transparency and usability are perceived as “good enough.” This descriptive logic aligns with bounded-rational satisficing, in which actors pursue adequacy under constraints rather than optimization [21,25]. The analytical focus is not to maximize trust but to identify the conditions under which trust stabilizes at sustainable levels despite persistent risk awareness [4,5,29].
Figure 1.
a. TLHF trajectories and the descriptive SE adequacy band (schematic).
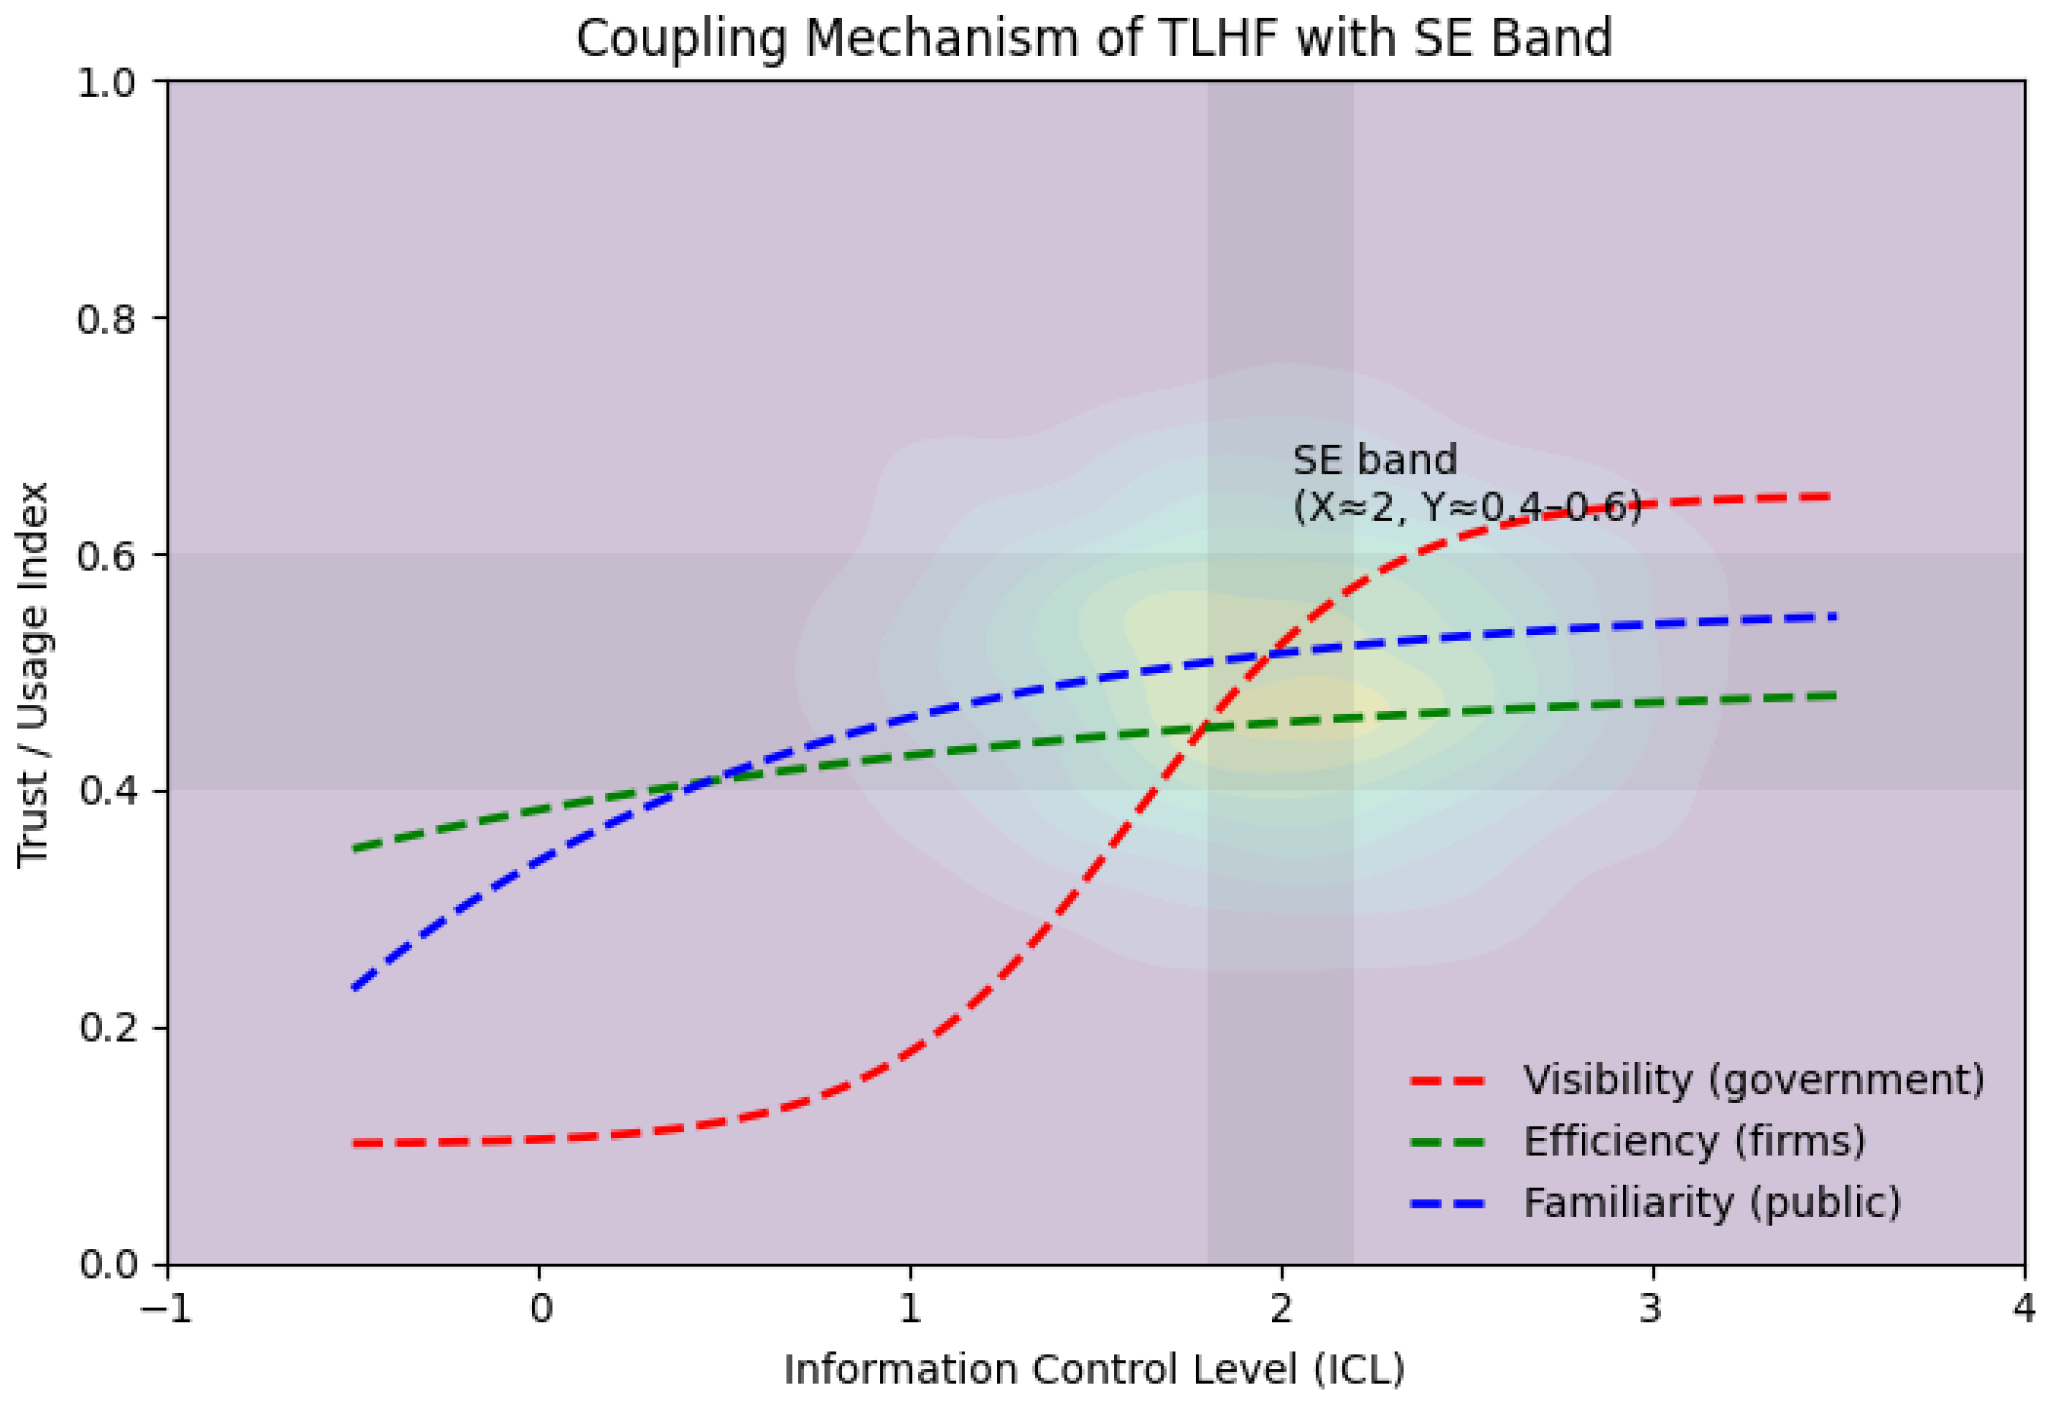
Note Figure 1a organizes the conceptual logic. The SE adequacy band denotes a descriptive mid–high region (X ≈ 2, Y ≈ 0.4–0.6) where trust-related outcomes concentrate. The three trajectories—visibility (government), efficiency (firms), and familiarity (users)—are schematic, not estimated curves. The figure structures propositions P1–P3, later assessed via KDE/LOESS and logit-AME diagnostics.
Figure 1.
b. Non-causal concept map linking TLHF lines to the SE adequacy band and downstream outcomes.
Figure 1.
b. Non-causal concept map linking TLHF lines to the SE adequacy band and downstream outcomes.
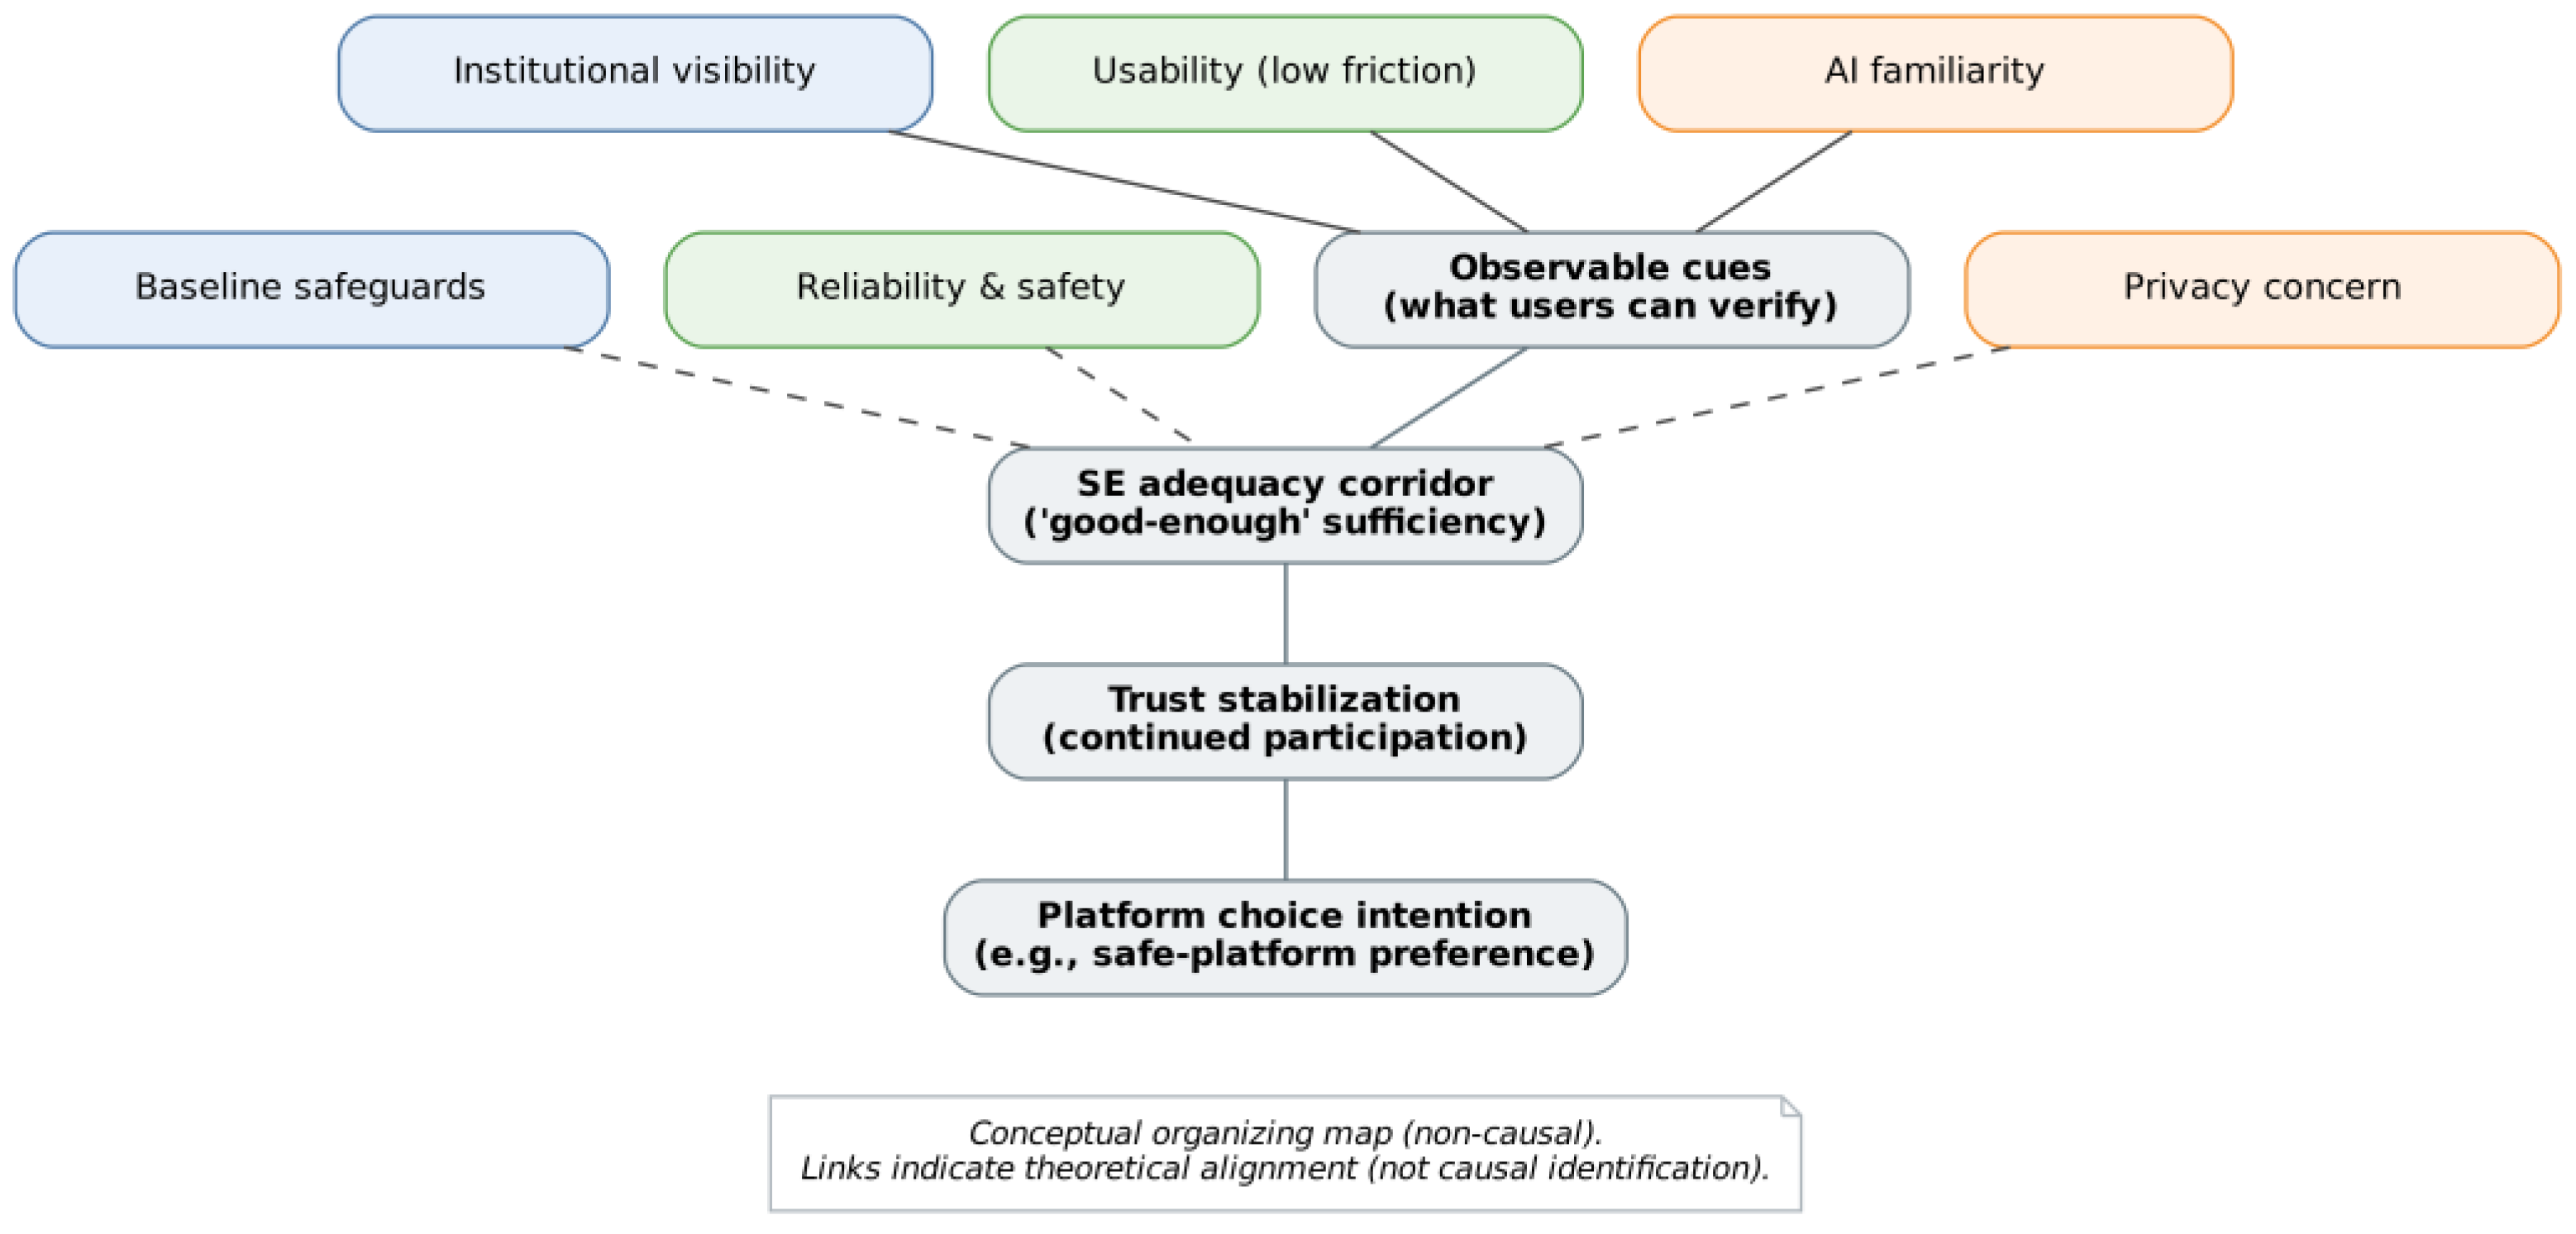
Note. Figure 1b depicts theoretical alignment only. The mapping connects governance visibility, operational adequacy, and user familiarity into observable cues forming an SE-like adequacy band that is associated with trust and safe-platform preference. No causal direction or magnitude is implied.
What remains under-specified in prior work.
Despite extensive research on user perceptions and design cues, three descriptive gaps remain for multi-actor synthesis:
- Triadic coordination rarely appears within a unified comparative frame combining government visibility, firm efficiency/usability, and user familiarity.
- Distributional shape (thresholds, plateaus, accumulations) is seldom examined directly as empirical evidence.
Mapping to the present study.
The literature is synthesized through an Information-Control-Level–Trust (ICL–T) linkage: information-control cues co-varying with trust outcomes across actors. KDE/LOESS visualize shape and concentration, while Logit-AME captures marginal associations under controls. These diagnostics evaluate whether observed data exhibit descriptive patterns consistent with TLHF/SE:
- visibility-linked shifts;
- efficiency-linked tapering;
When mid–high clustering appears, it is interpreted as descriptive adequacy emerging once minimum transparency and usability thresholds are satisfied.
Summary.
Taken together, Table 1 and Table 2 specify how TLHF/SE operates in this study: TLHF provides a nonparametric tri-actor organizer, while SE marks a mid–high adequacy band where trust outcomes stabilize once transparency and usability reach sufficiency. Empirically, we summarize shape and concentration via KDE/LOESS and infer marginal patterns using Logit-AME, treating all findings as descriptive evidence consistent with bounded rationality rather than causal or equilibrium claims [21,25,26,33,34,42,43].
Within the present Asia-anchored sample (≈84% China), the scope remains descriptive and modest (AME ≈ +3.2 pp; AUC = 0.68), aligning with an adequacy—not optimization—interpretation.
3. Research Methods
3.1. Data Sources and Sample Characteristics
Design.
This study adopts a mixed-method design integrating an online survey and 35 semi-structured interviews to examine multi-actor trust in AI-enabled tourism governance. TLHF is used as a descriptive organizer that places three actor-relevant trajectories—visibility (government), efficiency (firms), and familiarity (users)—side-by-side to interpret distributional patterns. Satisficing Equilibrium (SE) is interpreted as a descriptive adequacy band, referring to mid–high concentration regions observed in the empirical profiles rather than a fitted equilibrium. Accordingly, the study does not claim causal identification, structural estimation, or a game-theoretic equilibrium solution.
The Information Control Level (ICL) is treated as a formative composite assembled from conceptually distinct components rather than a reflective latent scale; therefore internal-consistency coefficients such as Cronbach’s α are not used as validity criteria (α ≈ 0.29 reported for documentation only) [38,39]. In the main analysis, the ICL-related components are visibility/exposure (Q5), privacy concern (Q6), and accountability expectation (Q7); full operational definitions and coding rules are provided in Appendix C (C1–C5) [16]. For transparency, a main-text mini-summary of the three item wordings and coding is provided in Table 3a (full bilingual wording archived in Appendix C).
Formative check (local VIF).
To empirically support the formative specification of ICL, we compute local VIF by regressing each ICL component (Q5 visibility exposure, Q6 privacy concern, Q7 accountability expectation) on the other two only, using ordinal coding (A=0, B=1, C=2, D=3). Diagnostics appear in Table 3 (coding details in Appendix C2; “any_seen” vs. “strict_seen” for Q5 are documented there).

Table 3.
Pairwise Correlations and Local VIF among ICL Components (Q5–Q7).
| Component | Q5 (Visibility Exposure) | Q6 (Privacy Concern) | Q7 (Accountability Expectation) | VIF |
| Q5 | 1.000 | −0.005 | 0.167 | 1.031 |
| Q6 | −0.005 | 1.000 | 0.252 | 1.071 |
| Q7 | 0.167 | 0.252 | 1.000 | 1.101 |
Note. Low inter-item correlations (|r| ≤ 0.25) and VIF ≈ 1.0–1.1 indicate that Q5–Q7 capture distinct, non-interchangeable governance cues, consistent with a formative composite [38]. VIF is computed as 1/(1−R²) from local regressions (each item on the other two) with ordinal coding (A=0, B=1, C=2, D=3) and listwise deletion over Q5–Q7. Q5 encodings follow Appendix C2 (“any_seen” main; “strict_seen” for sensitivity).
Table 3.
a. Information Control Level (ICL)—Exact Items and 0–3 Coding (Main-Text Summary).
| Item | Exact English wording | Options | Score assigned |
|---|---|---|---|
| Q5 (Visibility at decision time) |
Have you paid attention to the platform’s data-usage statement or privacy tips when using such services? | A. Clearly see and read ; B. Prompted, but didn’t see it ; C. No hint ; D. Forgot |
A = 3, B = 2, C = 1, D = 0 |
| Q6 (Privacy concern; reverse) |
Are you concerned that AI platforms may excessively collect or misuse your personal information? | A. Very worrying ; B. General concern ; C. Not too worried ; D. Not worried at all |
A = 0, B = 1, C = 2, D = 3 (reverse-coded) |
| Q7 (Accountability expectation) | If the recommendation algorithm has bias (e.g., price/gender bias), should the platform take responsibility for explaining it? | A. Should publicly disclose algorithm ; B. Appeal/feedback is enough ; C. No special responsibility ; D. Doesn’t matter |
A = 3, B = 2, C = 1, D = 0 |
Note. ICL is the equal-weight average of Q5, Q6 (reverse-coded), and Q7 on the 0–3 ordinal scale above (higher = greater perceived information control/visibility/accountability). The construct is formative, so a low Cronbach’s α (≈0.29) is expected and non-diagnostic. Pairwise correlations and local VIF appear in Table 3; full bilingual (EN–CN) wording and coding details are in Appendix C. All reported relations are descriptive associations.
Integrated design logic.
Figures 6a–6b summarize the mixed-method workflow: Figure 6a presents the analytical pipeline (survey + interviews → KDE/LOESS → logit-AME → robustness), whereas Figure 6b provides a compact radial overview that highlights the parallel quantitative/qualitative tracks and their convergence at TLHF integration.
- (1)
- Survey.
The online survey (May–September 2025) was implemented via Tencent Survey (China). Authentication via QQ/WeChat/mainland mobile accounts helps reduce duplicate submissions but may constrain participation for some international users. After screening, 1,590 valid responses were retained; an expanded dataset (N = 1,840) is used for cross-sample replication of the main descriptive patterns under the same coding rules (Appendices D–E). The baseline dataset includes 67 under-18 respondents; the expanded dataset includes 85 under-18 respondents, all completing the survey only with documented legal-guardian consent/supervision per the start-screen notice. Bilingual harmonization preceded analysis [16,17,18]. The exposure/visibility item Q5 is dual-coded (“any_seen” vs. “strict_seen”) for sensitivity checks (Appendix C2; Appendix E). KDE/LOESS outputs are treated as descriptive diagnostics, while logit-AME results are interpreted as associational summaries under stated controls and diagnostics (Appendix D) [15,23].
Geographic coverage.
Respondents were concentrated in East and Southeast Asia, with China as the dominant source and Korea as the second-largest group. In the baseline sample (N = 1,590), China accounts for 1,371 responses (86.2%) and Korea for 154 (9.7%), with the remaining countries contributing 65 responses in total (4.1%). In the expanded sample (N = 1,840), China contributes 1,547 responses (84.1%) and Korea 225 (12.2%), with all other countries combined contributing 68 responses (3.7%). The largest non-Asia counts are Germany (21) and the United States (baseline 7; expanded 9), while other countries contribute only small numbers (mostly ≤6 each). Cross-national comparisons are therefore treated as exploratory rather than representative. Open-ended responses (N ≈ 50; 15 overseas countries plus five Chinese cities) provide qualitative context for privacy sensitivity and trust-related perceptions (Appendix F), and country-level heterogeneity is interpreted cautiously and discussed as a limitation. A full country-by-country breakdown for both datasets is available upon request.
- (2)
- Interviews.
Thirty-five semi-structured interviews (15–60 min) covered institutional actors: 24 officials (tourism bureaus and regulators) and 11 enterprise/technical staff (OTAs, smart-destination operators, AI-service providers). Interview evidence is organized under TLHF dimensions—visibility-related governance cues, efficiency/maintenance trade-offs, and familiarity/usability mechanisms—to triangulate with survey patterns; coding categories and representative excerpts are reported in Appendix F.
Design rationale.
The qualitative strand provides mechanism-oriented context (e.g., visibility, capacity, maintenance constraints), whereas the quantitative survey summarizes perceptions and intentions at scale. This two-track structure supports triangulation while maintaining a non-causal interpretation and acknowledging sampling and access constraints.
- (3)
- Key variables and two-track strategy (operational measures, not latent scales).
To avoid construct conflation, measures are reported in two analytic tracks:
- ■
- Nonparametric track (KDE/LOESS, descriptive):
- (1)
- Trust-related proxies (Q3–Q4) → adoption breadth (Q3 usage_count) and perceived benefit (Q4 performance_mean);
- (2)
- Exposure/visibility (Q5) as mechanism-side reference, dual-coded for robustness (Appendix C2, E);
- (3)
- Display and robustness logic → Appendix C5, E.
- ■
- Inferential track (Logit + AME):
- (1)
- Binary outcome safe-platform preference (Q8);
- (2)
- Positive Index (Q4: efficiency, ease, personalization, labor saving);
- (3)
- Privacy concern (Q6) and accountability expectation (Q7) as ICL components (Appendix C2–C4).
- (4)
Sample profile.
Respondents were mainly 18–29 years old (≈54%) and traveled 1–2 times/year (≈55%). AI service use was highest for voice navigation (≈57%), AI customer service (≈52%), and recommendation systems (≈50%). About 72% reported perceived efficiency gains (Table 4).
Two-track strategy and ethics.
KDE/LOESS visualizations summarize distributional patterns, while Q8 is used for logit-AME estimation [11,12,13,15,23]. All survey and interview participation was voluntary with electronic informed consent under formal IRB approval by the Youngsan University Institutional Review Board (Protocol ID: YSUIRB-202511-HR-194-01; approval date: 28 November 2025; expedited review). For participants under 18, completion was permitted only with legal-guardian consent/supervision as stated on the survey start screen. No directly identifying information was stored for analysis. Ethical handling and data-transparency boundaries are detailed in Appendix B.
Missingness and case handling. Invalid responses (e.g., duplicates, incomplete surveys, or submissions completed in under 30 seconds) were screened out prior to analysis (screening rate ≈15.3%, resulting in N = 1,590 valid cases after removing 287 invalid entries). Within the analytic sample, item-level missingness on Q3–Q8 was negligible (<1%), and complete-case proportions are shown in Table 4. This two-step handling (screening before analysis, listwise deletion within models) ensured consistent sample quality across robustness checks. No formal Little’s MCAR test was conducted, as the minimal and apparently random missingness is unlikely to affect substantive conclusions (robustness confirmed in Appendices D–E).
3.2. Analytical Methods and Models
For consistency, the dependent variable safe-platform preference (Q8) (=1 for A/B responses) is used throughout. Q3 (AI Use Index) and Q4 (Positive Index) are treated as trust-related proxies used for visualization and interpretation.
This study integrates descriptive statistics, nonparametric visualization, and a binary logit model with Average Marginal Effects (AME) to examine associations between information-control cues and trust-relevant outcomes and to assess whether profiles appear to concentrate in a mid–high SE adequacy band. Analyses were conducted in Python 3.11 (statsmodels, numpy, matplotlib). Variable encoding and index construction follow Appendix C. Quantitative outputs are supported by regression tables for the baseline (N = 1,590) and expanded (N = 1,840) survey datasets (Appendix D) and by visual robustness panels (Appendix E). Figures 1a–1b are conceptual organizers (Section 2) used to structure the empirical workflow and are not fitted models.
ICL component redundancy check. To evaluate distinctiveness among ICL components, we report correlations and local VIF for Q5–Q7 in Section 3.1 (Table 3), consistent with a formative, non-interchangeable specification [38,39].
Nonparametric visualization.
Kernel Density Estimation (KDE) and locally weighted regression (LOESS) summarize distributional shape and concentration without imposing a parametric functional form [11,12,13]. ICL-related cues are constructed from operational items (Q5–Q7; Appendix C). Trust-related proxies rely on observed usage and perceived benefit measures (e.g., Q3 usage_count and Q4 Positive Index; Appendix C). The SE adequacy band is treated as a descriptive concentration zone (X ≈ 2, Y ≈ 0.4–0.6) where outcomes visually cluster in the displayed surfaces; it is not defined as an optimum or a game-theoretic equilibrium. Visualizations are interpreted as diagnostic descriptions rather than causal estimates; bandwidth perturbations and alternative codings are used as sensitivity checks (Appendix E). KDE uses a Gaussian kernel and LOESS adopts tricube weighting; baseline smoothing balances bias–variance, with robustness assessed via ±25% perturbations as documented in Appendix E.
Visual robustness.
Robustness is evaluated via (i) smoothing perturbations (−25%, baseline, +25%) and (ii) cross-sample comparison between the baseline (N = 1,590) and expanded (N = 1,840), assessing whether the main concentration pattern is sensitive to display settings or sample expansion (Appendix E). For harmonization, Q3/Q4 multi-response items in the baseline dataset were recoded as indices consistent with the expanded dataset specification (Appendix C; Appendix D1 note).
Binary logit and marginal effects.
To complement the descriptive visualization, a binary logit model is estimated for safe-platform preference (Q8; 1 = Yes, 0 = otherwise). AME are reported as changes in predicted probability for interpretability; standard errors are heteroskedasticity-robust (sandwich) [15,23]. The baseline specification follows Appendix C4 (Positive Index, AI Use Index, Privacy Concern, Never-Used-AI), with age group and travel frequency as controls. Model fit indicators (AIC, pseudo-R², AUC) are reported for transparency (Appendix D), and multicollinearity checks for ICL components appear in Table 3. Results are reported for N = 1,590 and compared against N = 1,840 as a cross-sample alignment check (direction and approximate magnitude), not as formal equivalence testing (Appendix D). Where helpful for interpretation and method triangulation, we reference explainability/diagnostic practices [24].
Table 5.
Baseline Binary Logit Model with Coefficients and Average Marginal Effects (AME).
| Variable | Coefficient (β) | Std. Error |
p- value |
AME(Δ Probability) | Interpretation |
| Positive Index | 0.124 | 0.053 | 0.020 | +0.032 | Positively associated with the probability of safe-platform preference. |
| AI Use Index (0–5) |
−0.049 | 0.052 | 0.344 | −0.019 | Not statistically distinguishable from zero in this specification. |
| Privacy Concern (0–3) |
0.071 | 0.062 | 0.249 | +0.007 | Weak, non-significant association once visibility/benefit cues are included. |
| Never-Used-AI (dummy) | −0.301 | 0.191 | 0.115 | −0.091 | Directionally negative, not conventionally significant. |
| Constant | −0.456 | 0.184 | 0.013 | — | Baseline probability for neutral users. |
Note. Dependent variable = 1 (safe-platform preference, Q8). Reported diagnostics (AIC, pseudo-R², AUC) are model-summary indicators and do not establish causality or model uniqueness. ICL multicollinearity is addressed via Table 3 (Section 3.1). Additional robustness and cross-sample alignment are reported in Appendix D–E [11,12,13,15,23,24].
Descriptive propositions under TLHF/SE (linked to Figure 1a).
Empirical patterns are organized as three descriptive propositions and assessed via visual profiles and associational summaries rather than causal identification:
- ✧
- P1 (Visibility threshold). Trust-relevant proxies show higher concentration once transparency/visibility becomes salient (government–visibility line), evaluated via KDE/LOESS stratified by Q5 exposure and the strict_seen sensitivity display (Appendix E), with Q7 treated as a supporting governance cue.
- ✧
- P2 (Efficiency plateau). As perceived service benefits increase (Q4 Positive Index), incremental changes appear to taper rather than rise indefinitely (firm–efficiency line), evaluated via nonparametric flattening tendencies and the sign/magnitude of the Positive Index AME (Appendix D), interpreted as a marginal association rather than an identified saturation mechanism.
- ✧
- P3 (Familiarity accumulation). Trust-related proxies (Q3–Q4) tend to increase gradually with broader and repeated low-friction use (e.g., Q3 usage_count / AI Use Index), evaluated via nonparametric profiles and stability under smoothing perturbations and sample expansion (Appendix E). In the Q8 logit specification, familiarity-related terms may be weak once benefit/governance cues are included—consistent with accumulation being more evident in descriptive usage profiles than in the binary choice model [33,42,43].
Summary.
KDE/LOESS diagnostics and logit-AME summaries provide convergent descriptive evidence consistent with TLHF/SE as heuristic organizers: visibility-linked thresholding, tapering/plateau tendencies for benefit cues, and gradual familiarity accumulation, with outcome concentration observed in a mid–high adequacy band rather than an estimated optimum [11,12,13,15,23,24]. Visual sensitivity panels are reported in Appendix E, and regression tables for both samples are reported in Appendix D.
4. Results
4.1. Survey Patterns and Distributional Features
The survey patterns indicate a persistent concern–action gap. About 39.1% of respondents reported reading privacy notices, while roughly 70% expressed medium–high privacy concern, about 90% indicated accountability expectations, and 86.4% reported a preference for well-rated platforms. This configuration is consistent with a privacy-paradox pattern—valuing protection in principle while continuing to rely on AI-enabled services when perceived risks remain tolerable [4,5,29,40].
Guided by the conceptual organizers in Figure 1a–1b, we first present visibility-linked distributional profiles and then summarize associational evidence. Nonparametric visualizations (Figure 2 and Figure 3) display three recurring descriptive features: (i) lower trust-related proxies under low visibility-related exposure; (ii) a more pronounced rise as transparency becomes perceptible; and (iii) weaker marginal change at higher exposure levels. These displays are KDE/LOESS concentration profiles rather than fitted functional relations [11,12,13,20,22].
In the 3-D density surface (Figure 3), outcome mass clusters around X ≈ 2 and Y ≈ 0.4–0.6. We refer to this as a mid–high SE adequacy band in a descriptive sense (i.e., a region where observations concentrate), without implying an identified threshold or an equilibrium solution. Robustness to smoothing perturbations, stricter Q5 coding, and sample expansion (N = 1,840) is documented in Appendix E.
Logit-AME results are reported as complementary associational summaries for the binary outcome safe-platform preference (Q8). In the baseline specification, the Positive Index (usability/efficiency-related experience) is positively associated with safe-platform preference (p < 0.05; AME ≈ +3.2 pp; Appendix D) [15,23]. Privacy Concern is not statistically distinguishable from zero in the same specification, and overall fit remains modest; accordingly, the model functions as a supportive association check rather than a definitive validation of TLHF constructs.
Cross-national open-ended responses (N ≈ 50 across 15 overseas countries plus China; Appendix F, Tables F1–F4) provide qualitative context. Respondents frequently noted privacy/data-protection salience and advertising fatigue (e.g., Germany, Korea, United States), affordability and usability expectations (e.g., Thailand, India, Malaysia), and concerns about targeting or misuse (e.g., Lebanon). These themes align with the organizing logic in Figure 1b (visibility, operational adequacy, routine interaction) and help contextualize why adequacy-style clustering may occur despite persistent risk awareness [42,43].
What to see: A clear rise-then-flatten concentration band peaking around X ≈ 2 and Y ≈ 0.4–0.6.Axes & variables: X = visibility-related exposure (Q5, dual-coded “any_seen/strict_seen”); Y = normalized trust-related proxies (0–1).
How to read (descriptive): Shows a non-monotonic “rise-and-plateau” adequacy pattern, not a causal or optimal function [11,12,13].
Robustness: Alternative smoothing (±25%) and stricter Q5 recoding yield similar shapes; see Appendix E and Figure 4.
What to see: A ridge-like high-density region around X ≈ 2 and Y ≈ 0.4–0.6 illustrates the SE adequacy band.
Axes: X = visibility-related exposure (Q5); Y = normalized trust-related proxies (0–1); Z = kernel-density value.
How to read (descriptive): The “SE band” denotes a descriptive adequacy zone, not an identified threshold.
Robustness: Stricter Q5 coding, bandwidth perturbations, and N = 1,840 replication confirm the same ridge structure (Appendix E, Figure 5).
4.2. Integrated Findings (Mechanism–Data Alignment)
This section aligns the conceptual organizers (Figure 1a–1b) with observed trust-related distributions and safe-platform preference (Q8), integrating nonparametric patterns, logit-AME associations, and qualitative triangulation. Evidence is interpreted as pattern-consistent alignment rather than causal identification.
- ① Choice intention and acceptance (Q8; associational summary).
Using Q8 as the binary outcome (Appendix C), the logit-AME model yields broadly similar directional patterns across the baseline and expanded samples. In the baseline specification, the Positive Index is positively associated with safe-platform preference (Q8) (AME reported in Appendix D). Other terms (e.g., AI Use Index, Privacy Concern) tend to attenuate and may not remain statistically distinguishable from zero across specifications, while Never-Used-AI remains directionally negative. Model diagnostics (AIC = 1,847.3; pseudo-R² = 0.18; AUC = 0.68) indicate modest explanatory power, consistent with the paper’s conservative scope [15,23]. Results from the expanded dataset (N = 1,840) show comparable directions and similar AME magnitudes and are treated as a cross-sample alignment check (Appendix D).
- ② Mechanism–data alignment (P1–P3; distributional diagnostics + qualitative triangulation).
KDE-based maps and smoothed profiles (Figure 2 and Figure 3) display a recurring configuration: lower concentration in trust-related proxies under low visibility-related exposure, a more pronounced rise as transparency becomes more perceptible, and weaker marginal change at higher exposure levels, with concentration in the same mid–high SE adequacy band (X ≈ 2; Y ≈ 0.4–0.6). Read through Figure 1b, this configuration aligns with three descriptive propositions:
- ♦ P1 (Visibility threshold; governance line). Concentration increases once visibility-related cues become salient (Q5 exposure), with similar patterns under strict_seen sensitivity displays (Appendix E). Experimental and public-administration evidence linking transparency and trust provides a consistent backdrop [28]. Qualitative materials repeatedly emphasize “what can be observed/verified” as a condition for confidence (Appendix F).
- ♦ P2 (Efficiency plateau; firm line). Benefits and low-friction usability co-occur with higher safe-platform preference (Q8) (Positive Index AME; Appendix D), while concentration profiles show weaker marginal change at higher adequacy levels. This is compatible with privacy-calculus and personalization–privacy paradox findings in tourism services [29,40].
- ♦ P3 (Familiarity accumulation; user line). Adoption breadth (usage_count / AI Use Index) aligns with gradual consolidation in descriptive usage profiles and remains stable under smoothing and sample expansion (Appendix E). In the Q8 logit specification, familiarity proxies may appear weak once benefit/governance cues are included—consistent with familiarity operating more clearly in intensity profiles than as a dominant driver of the binary choice outcome [33,42,43].
- ③ Robustness visualization (summary of Appendix E).
Figure 4 and Figure 5 summarize robustness patterns across datasets and smoothing settings. Density peaks and ridge-like structures remain concentrated in the same mid–high region under the tested perturbations (Appendix E, Figures E1–E12), supporting the stability of the SE adequacy-band description. The conceptual–empirical overlay (Figure E13) functions as a heuristic bridge and is not read as fitted evidence.
What to see: Across bandwidths (−25%, baseline, +25%) and datasets (top = N = 1,590; bottom = N = 1,840), density consistently peaks near X ≈ 2 and Y ≈ 0.4–0.6.
Design: Rows = datasets; columns = bandwidth settings.
How to read (descriptive): Stable peak concentration across parameter/sample variations supports the adequacy-band interpretation [11,12,13].
What to see: All surfaces retain a mid-high ridge or “plateau” regardless of bandwidth or dataset (N = 1,590 vs 1,840).
Design: Same datasets and bandwidth settings as Figure 4.
How to read (descriptive): Re-emergence of the mid-high ridge across conditions visually confirms the stability of the SE band (Appendix E).
Note. Pipeline: data collection (survey + interviews) → nonparametric visualization (KDE/LOESS) → inferential modeling (logit with AME). Robustness: alternative encodings (Q5 dual coding), smoothing perturbations, cross-sample check (N = 1,590 vs. 1,840). Interpretation: align empirical patterns with TLHF and frame governance implications (SDGs 8, 12, 17) [11,12,13,15,23].
Figure 6.
a. Integrated Analytical Workflow for TLHF and Satisficing Equilibrium (SE) Detection.
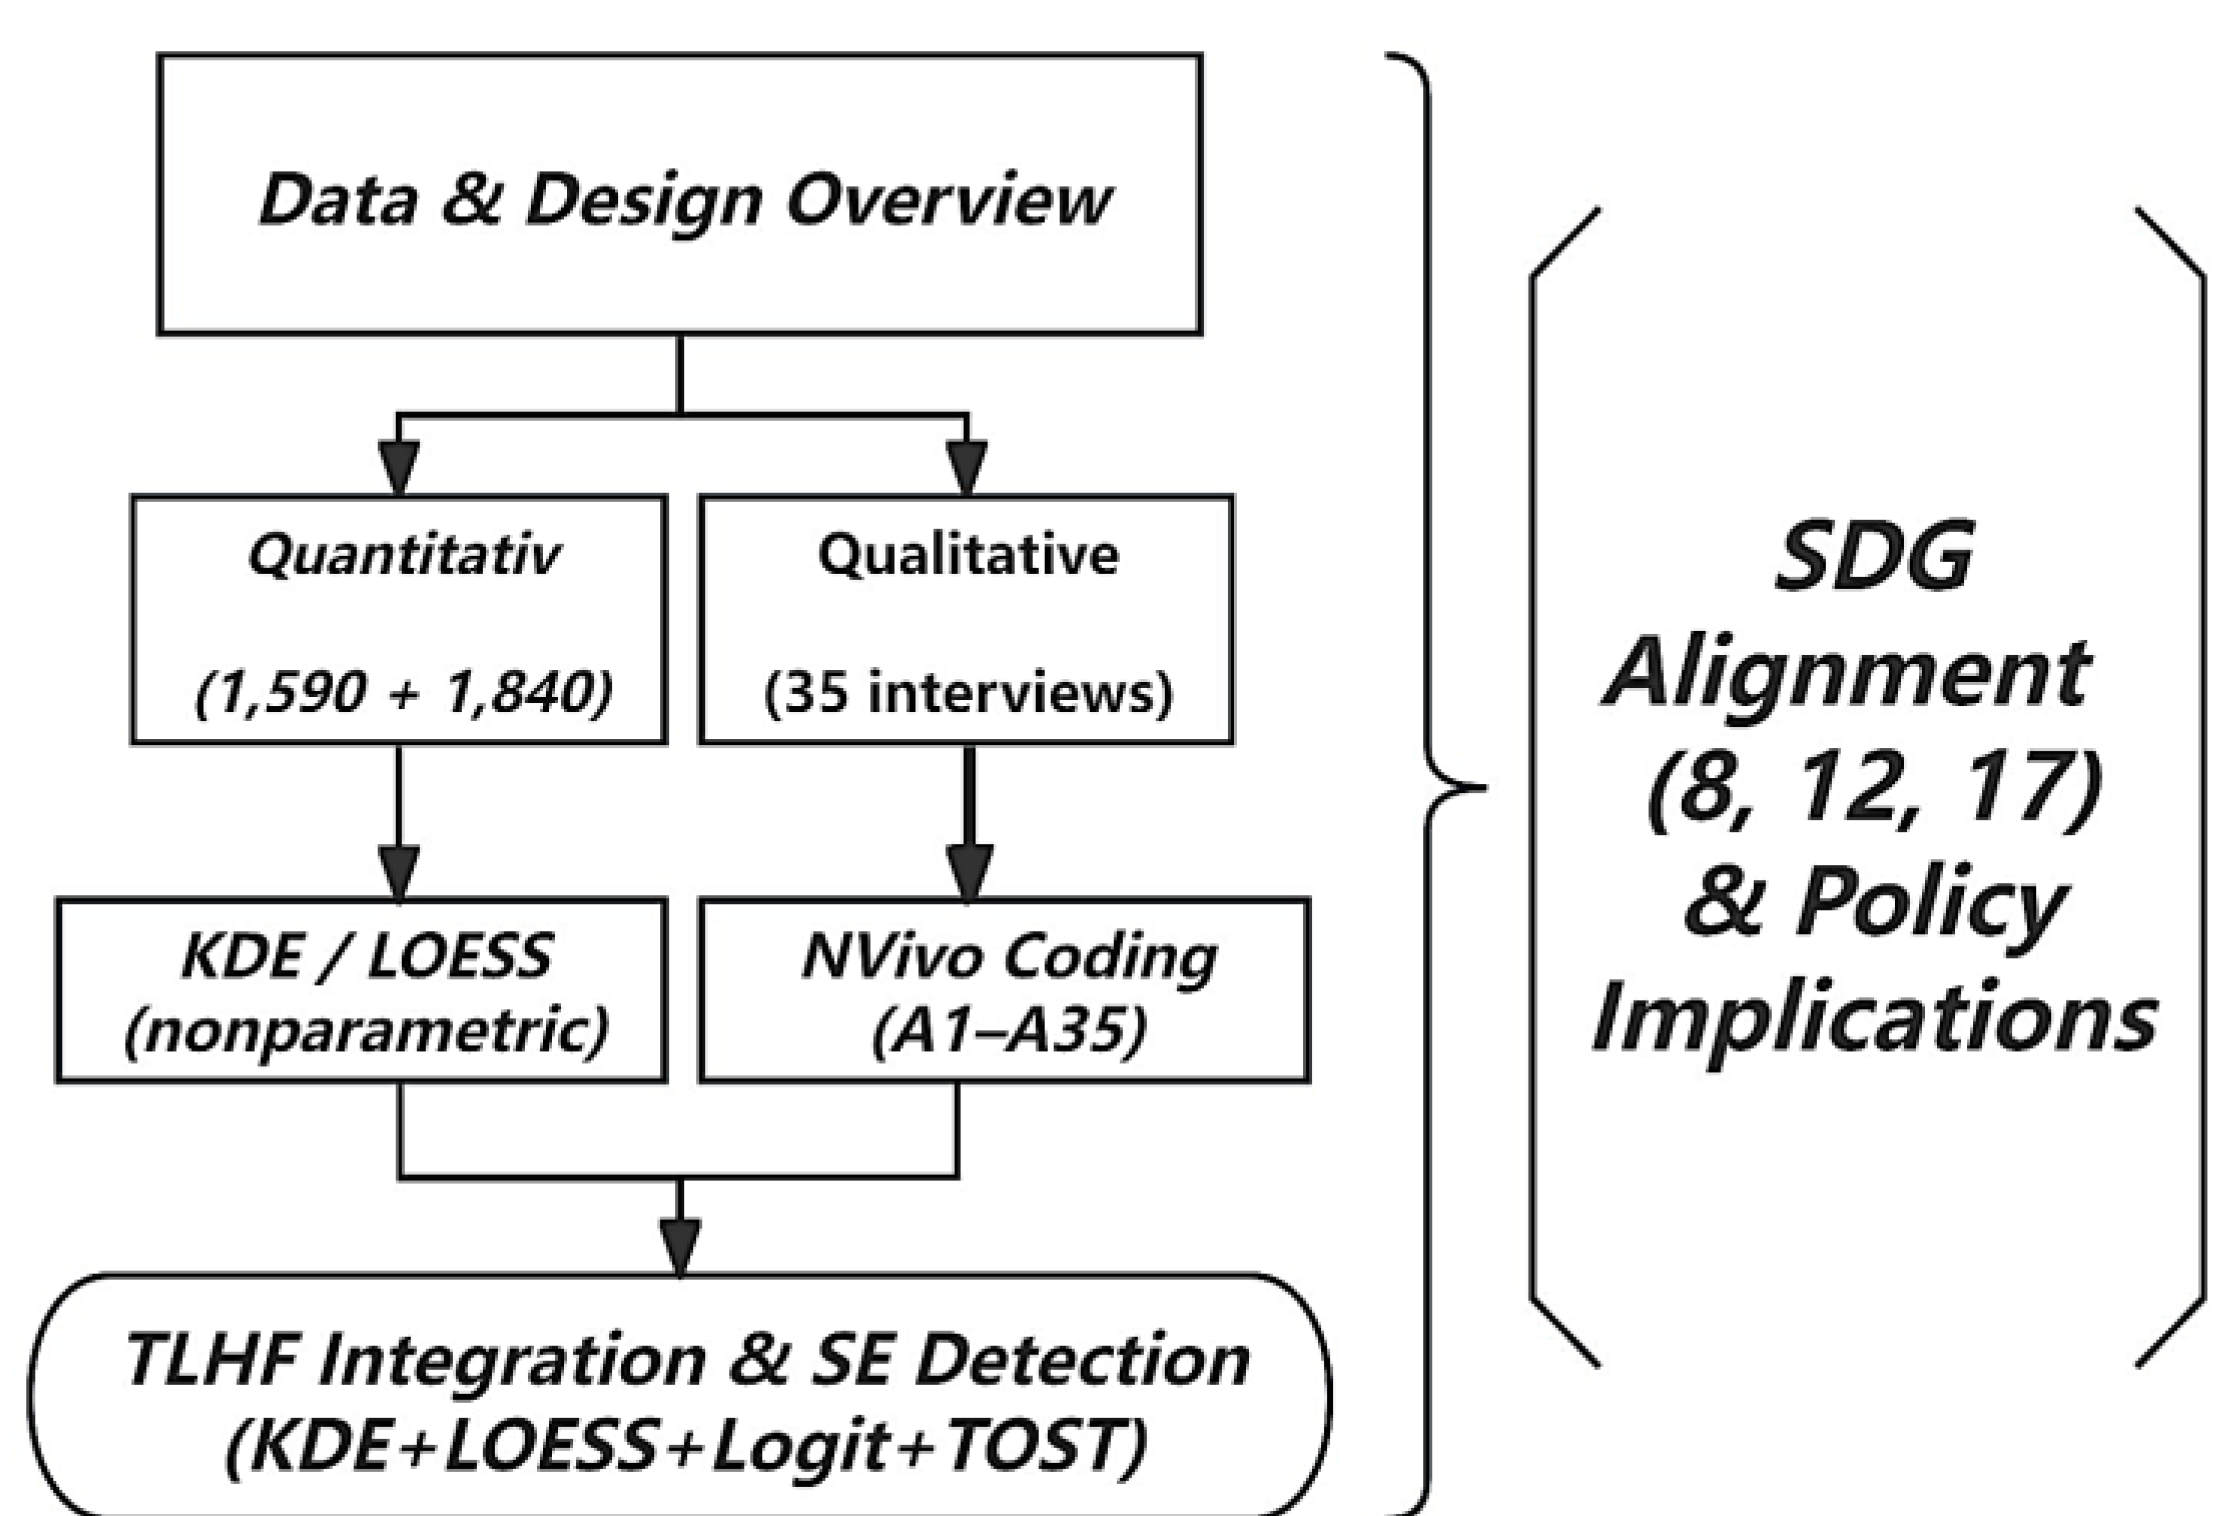
Figure 6.
b. Mixed-method design overview (radial TLHF/SE integration).
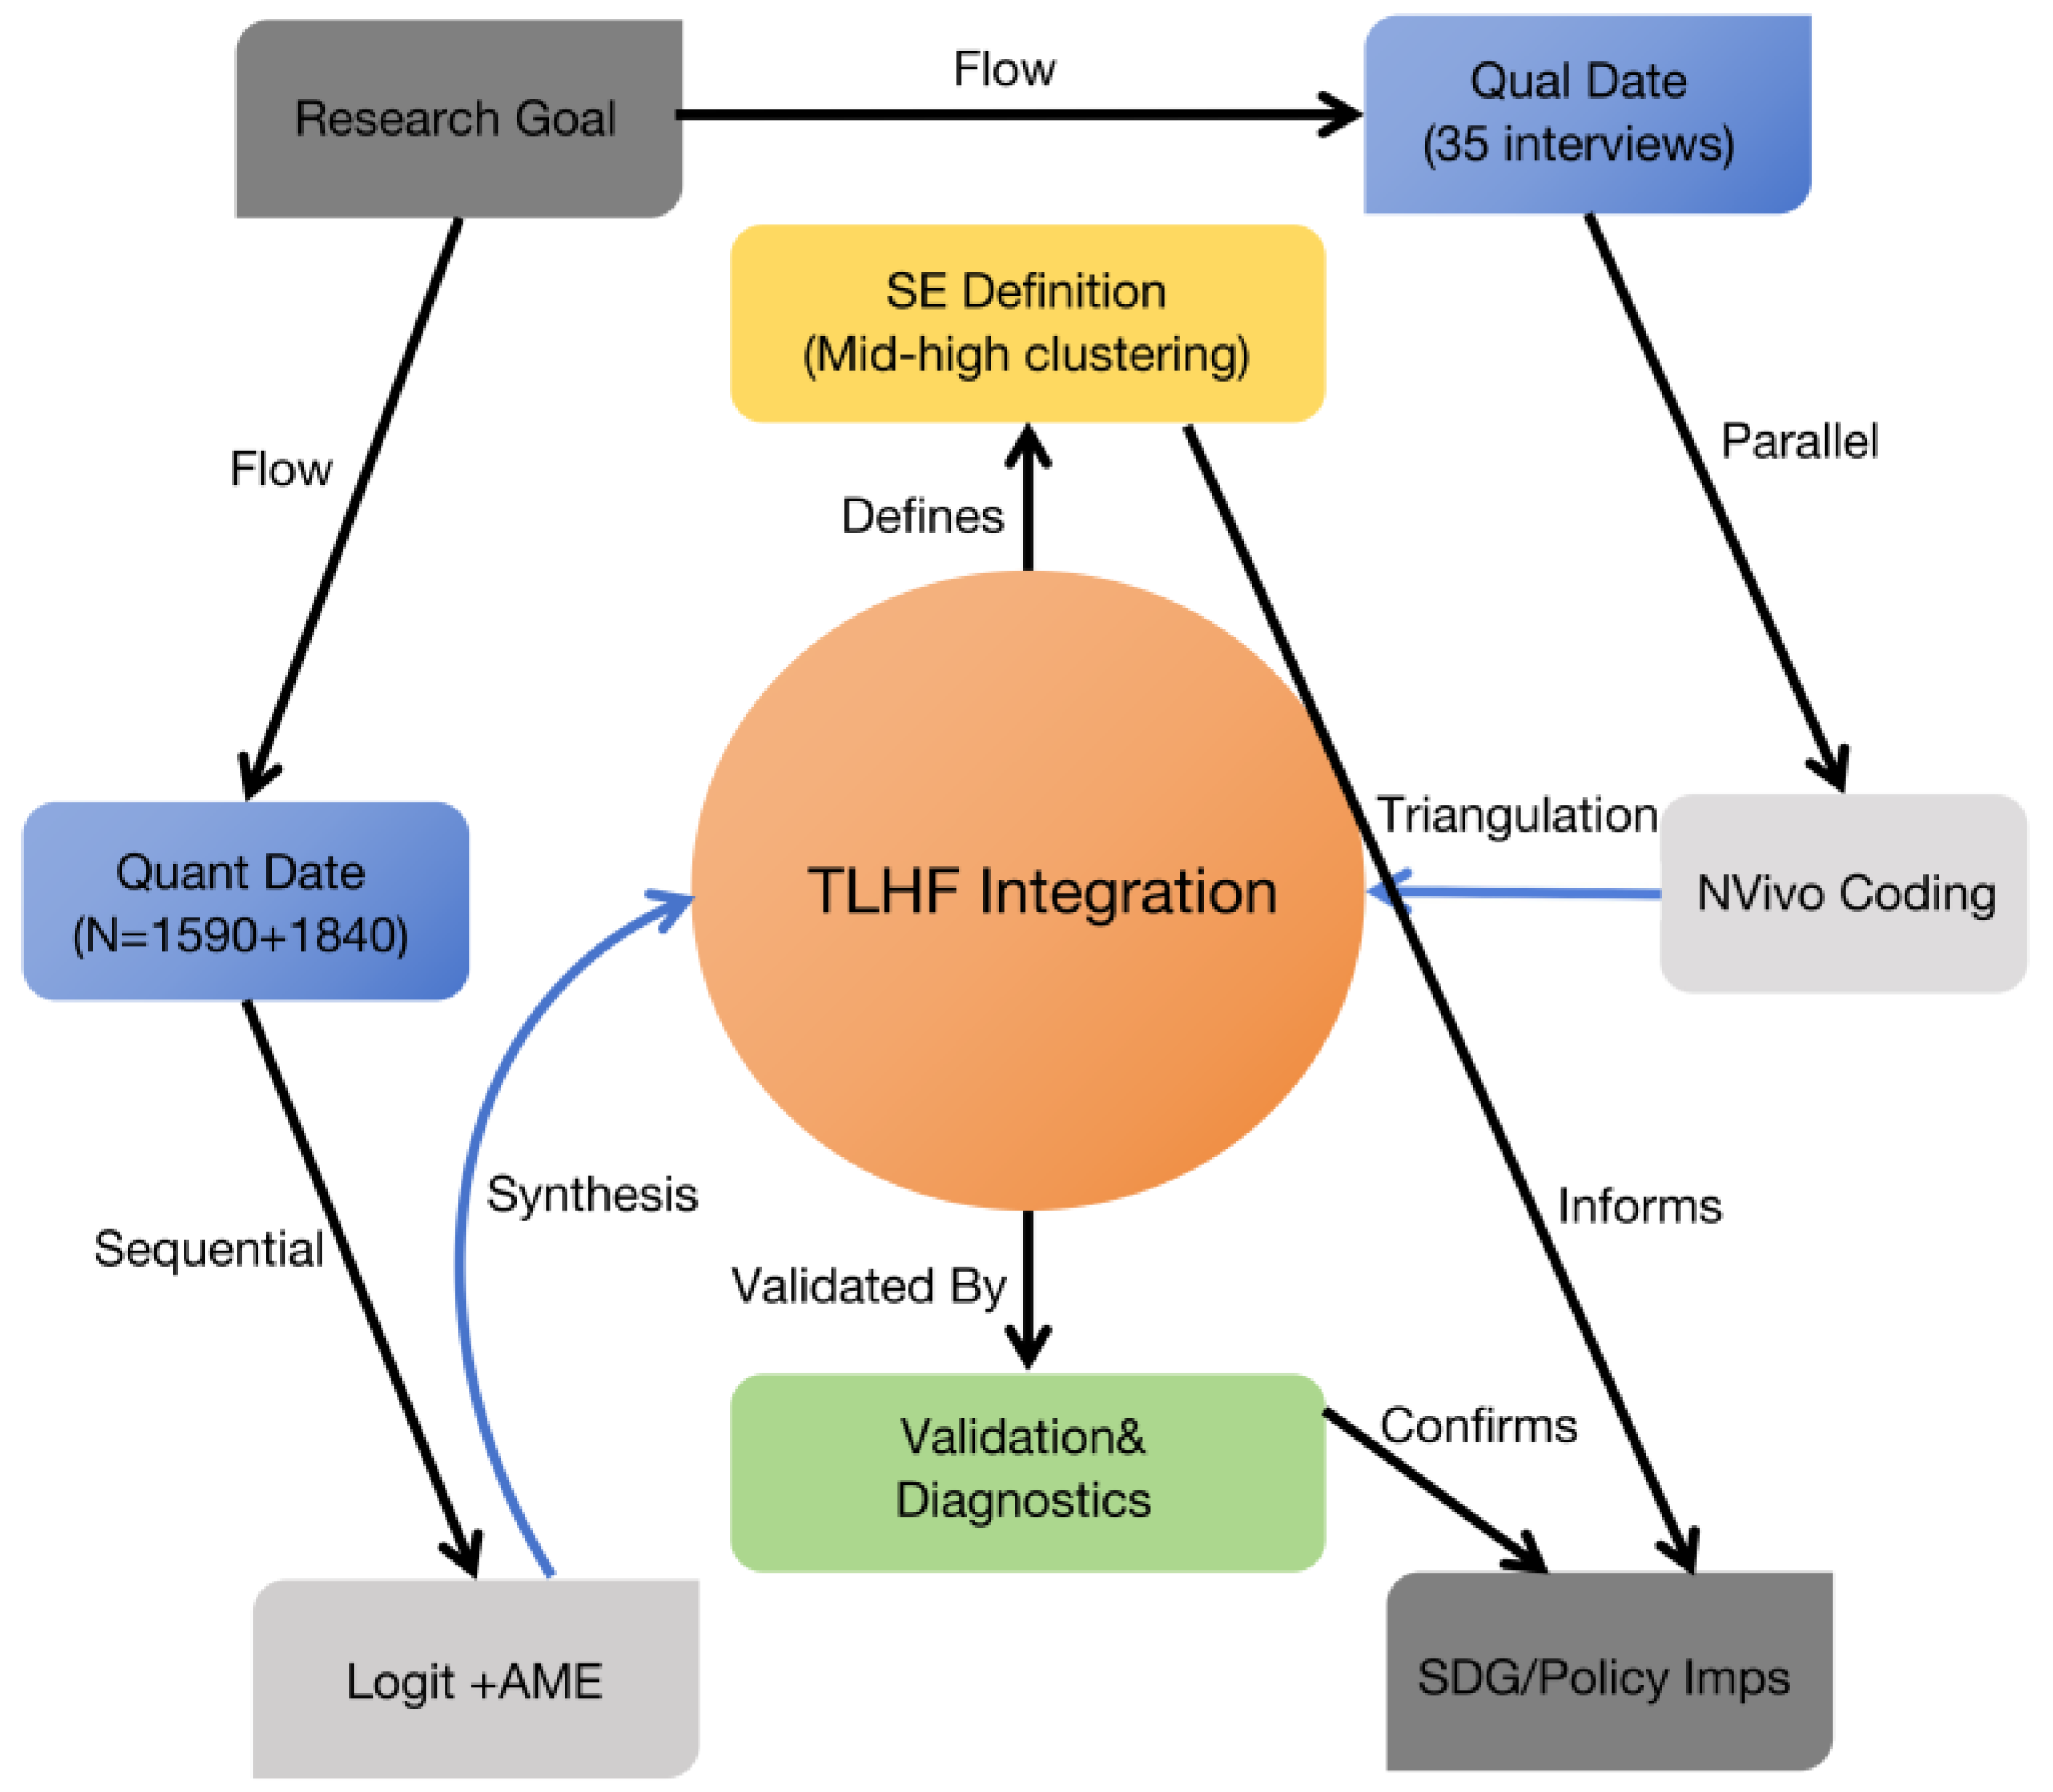
Note. The design proceeds along two parallel analytic tracks (quantitative survey; qualitative interviews) that converge at TLHF integration. The quantitative track summarizes distributional diagnostics and marginal associations (KDE/LOESS; logit-AME), while the qualitative track provides thematic coding (NVivo) for mechanism-oriented triangulation. The integrated reading supports the descriptive SE adequacy-band interpretation and informs SDG/policy implications.
5. Discussion
5.1. Theoretical and Empirical Integration
Within the present Asia-anchored, descriptive evidence (≈84% China), outcomes concentrate in a mid–high satisficing adequacy band rather than increase monotonically with information-control cues. SE here denotes a descriptive region where participation and trust-related proxies appear comparatively stable once decision-time visibility and low-friction usability feel “good enough,” reframing the privacy paradox as bounded-rational reliance under information/time/capacity constraints [4,5]. Profiles further indicate that, beyond the initial visibility-linked rise, additional rule cues or feature accretion show weaker marginal change—a satisficing-style flattening.
Contrast with additive/linear “trust-calculus” views. Instead of assuming monotone, additive determinants, TLHF/SE organizes three recurring regularities that may display thresholds, tapering, and accumulation without imposing functional forms:
- ➀
- P1 Visibility-linked rise (government). Concentration increases once public-facing transparency becomes salient. Example quote: “Transparency is the foundation of credibility.” — Interview A1.
- ➁
- P2 Efficiency plateau (firms). Gains associated with usability/operational adequacy tend to taper at higher levels. Example quote: “Steady operation matters more than constant upgrades.” — Interview A5.
- ➂
- P3 Familiarity accumulation (users). Routine, low-friction use aligns with gradual consolidation in trust-related proxies (Q3–Q4). Example quote: “Stable and unobtrusive systems encourage continued use.” — Interview A27.
Formation vs. stabilization (descriptive phases).
Formation occurs as visibility exposure grows and initial benefit or usability perceptions accumulate (KDE/LOESS patterns around Q5 and Q4; aligns with P1) [11,12,13].
Stabilization emerges as outcomes consolidate in a mid-high adequacy band, with smaller marginal change at higher adequacy levels (ridge/flattening structures around Q4–Q8; aligns with P2–P3).
Convergence checks (non-causal). Interview materials and open-ended responses (Appendix F) are consistent with these three trajectories: officials emphasize transparency for scaling, firms stress maintenance stability, and users highlight usability continuity. Cross-sample and bandwidth perturbations (N = 1,590 / 1,840; ±25%; strict vs. any-seen Q5) produce similar concentration structures (Appendix E), and logit-AME outputs preserve comparable directions across datasets (Appendix D). Together, these results support a conservative descriptive claim that the SE-band pattern is not driven by a single display choice or sample.
Measurement boundaries and construct clarity. ICL is treated as a formative composite, not a reflective latent construct: Q5 (visibility/exposure), Q6 (privacy concern), and Q7 (accountability expectation) are non-interchangeable. Their small correlations (|r| ≤ 0.25) and local VIF (≈ 1.03–1.10) confirm conceptual distinctness; Cronbach’s α (≈ 0.29) is reported for record only [38,39]. “Trust” refers to operational outcomes—usage and adequacy proxies (Q3–Q4) and behavioral preference (Q8)—rather than a psychometric latent trait. Evidence therefore supports pattern-level interpretation (concentration, rise, flattening, marginal associations) rather than latent-trait estimation or causal identification [15,23,24].
Adequacy vs. ethical complacency. A satisficing adequacy band can sustain stability without progress. To prevent ethical complacency, SE should operate with minimum visibility / accountability baselines, periodic auditing of transparency cues, and service-quality reassessment that can re-activate formation dynamics when adequacy drifts [6,21,25,34,42]. In sustainability terms, TLHF foregrounds coordination and maintainable adequacy—rather than maximal control—as practical governance conditions aligned with SDGs 8, 12, and 17 [35,36,37].
Theoretical contributions. This study extends a satisficing perspective in multi-actor AI-enabled tourism governance by:
- 1)
- Organizing government, firm, and user logics within a single heuristic structure (TLHF);
- 2)
- 3)
Together, these contributions clarify how trust stabilization in Asia-anchored smart-tourism governance may be understood as bounded-rational adequacy maintained through institutional visibility, operational sufficiency, and routine usability.
5.2. Practical Implications
Within the present Asia-anchored, descriptive evidence (≈84% China), the implications below are framed as monitoring guidance rather than prescriptive policy.
The concern–action gap observed in this study is consistent with bounded-rational satisficing: once transparency/visibility and low-friction usability are perceived as sufficient, users may rely on low-effort trust cues (e.g., recognizable ratings, certifications, predictable interfaces) rather than cognitively costly privacy statements whose interpretive burden exceeds perceived benefit [4,5,40,42,43]. In the reported specification, Privacy Concern is not statistically distinguishable from zero after accounting for visibility-related cues, whereas the Positive Index remains positively associated with safe-platform preference (Appendix D). Practically, this suggests that making trust cues legible at the point of choice and keeping safer behavior low-friction may be more feasible than adding rule layers without improving observability or usability.
Governance instruments by actor (TLHF trajectories).
- ■
- Government—Visibility (P1-like dynamics).
Emphasize decision-time visibility cues that are auditable and comparable across platforms (e.g., standardized at-a-glance disclosure, interoperable certification signals, time-bounded breach reporting with verifiable remediation records). Aim: increase the salience and credibility of what users can observe and verify when making platform decisions [9,28,42].
- ■
- Firms—Efficiency/Usability (P2-like dynamics).Favor maintenance-centric reliability over feature accumulation. Pair privacy-by-design with operational capabilities that sustain stability (continuous monitoring, rollback capacity, incident-response playbooks, post-incident validation). Under a tapering interpretation, extra features beyond sufficiency may yield limited incremental trust-related gains relative to maintenance and risk burden [7,34,41].Example quote (Interview A19, software technician): “Maintenance is difficult, workflows are complex, and local infrastructure remains incomplete.”
- ■
- Users—Familiarity/Routine (P3-like dynamics).Reduce friction for safer behavior by preserving predictable routines: stable onboarding, persistent consent settings, intelligible defaults. Safer choices should not be penalized by extra steps/time; otherwise, routine consolidation may favor convenience over safety [8,19,43].
Transferability beyond the present Asia-anchored sample: conditions and limits.
SE-style stabilization is most plausible when three enabling conditions are present: (1) visible minimums (audited cues are observable at decision time rather than buried in legal text), (2) usability parity (safer options do not require disproportionate steps/clicks/time), and (3) maintenance capacity (operators can monitor, patch, and periodically re-certify). Transferability weakens where liability is unclear, enforcement signals are not trusted, or infrastructures for maintaining visibility cues are thin. A conservative sequencing is: strengthen visibility first, normalize low-friction safe routines second, and expand functional features last—reducing the risk of “complexity without credibility” [35,36,37,42].
Guardrails against ethical complacency (monitorable checks).
Because an adequacy band can drift into “maintenance without improvement,” governance may institutionalize periodic audits of transparency/accountability baselines and connect audit results to accessible logs. Two tractable indicators are: visibility quality (coverage, recency, disclosure latency) and friction-adjusted safety uptake (safe-choice share interpreted alongside steps/clicks/time). Audit failures, incident spikes, or widening usability inequities can trigger re-audit and corrective action [6,21,25,34,42].
5.3. Behavioral and Mixed-Method Insights
Within the same Asia-anchored and non-causal scope, the behavioral and qualitative insights illustrate, rather than generalize, the TLHF/SE pattern.
Behavioral and qualitative materials illustrate how satisficing-style stability manifests in practice. Once minimum transparency and usability thresholds are met, both institutional and individual actors tend to consolidate around familiar routines—even under residual uncertainty. This pattern supports the SE interpretation as bounded rationality in action, rather than deliberate optimization.
Example quote (Interview A26, pharmaceutical firm representative): “Facial recognition for medical insurance is fully certified and traceable—safe, efficient, and compliant.”
Example quote (Interview A34, township governance center): “AI is obviously convenient—I still worry about data abuse or attacks, but I keep using it.”
Example quote (Interview A24/A25, telecom sales/customer service): “Customers still prefer human service; after promotions end, usage drops, and indoor AI cameras sell poorly due to privacy worries.”
These perspectives complement the quantitative results: efficiency and predictability encourage reliance, while transparency infrastructure anchors perceived safety. However, when maintenance capacity weakens or oversight signals lose salience, reliance may shift from informed confidence toward habitual convenience. In such cases, adequacy can erode without visible incidents, underscoring the need for recurring audits of transparency, usability parity, and remediation readiness [6,21,25,34,42].
For governance and sustainability alike, this behavioral evidence reinforces the necessity of balance—credibility should be maintained through transparent certification, and reassurance should not depend solely on routine. Continuous monitoring of visibility quality (coverage, recency, disclosure latency) and friction-adjusted safety uptake (safe-choice share, steps/clicks/time) offers actionable diagnostics to detect drift. Corrective mechanisms such as re-audit, re-labeling, and post-incident validation can help restore credibility and maintain the SE adequacy band [35,36,37,40,41,42,43].
Synthesis.
The TLHF + SE framework highlights three interdependent levers of sustainable digital trust: legible visibility signals, low-friction safety routines, and maintenance capacity. Where these conditions hold, multi-actor systems tend to cluster within a mid–high adequacy region that sustains participation while containing risk. Where they weaken, proportionate re-formation and audit mechanisms can be reactivated to re-establish credible visibility and usability parity, thereby supporting SDG-linked objectives of accountable innovation (SDG 8), responsible operation (SDG 12), and cooperative governance (SDG 17)[35,36,37,40,41,42,43].
6. Conclusion
In this Asia-anchored descriptive study (84–86% respondents from mainland China; N = 1,590 and replication N = 1,840), we observed modest associations (AME ≈ +3.2 percentage points, p < 0.05; AUC = 0.68) and a stable mid–high adequacy band in nonparametric diagnostics, consistent with a satisficing rather than optimizing interpretation of multi-actor trust in AI-enabled smart tourism.
6.1. Theoretical Implications
This study interprets trust stabilization in AI-enabled tourism governance as a Satisficing Equilibrium (SE): outcomes concentrate in a mid–high adequacy band once baseline visibility (transparency/accountability) and low-friction usability are perceived as sufficient. Read through TLHF, this stabilization is organized descriptively via three trajectories—visibility-linked thresholding (government), efficiency-oriented stabilization (firms), and familiarity accumulation (users) [6,21,25]. The perspective is context-bounded and non-causal. It aligns with evidence that decision-time transparency can be associated with higher institutional credibility [28], that privacy trade-offs can persist despite stated concerns [29], and that routinized use can reinforce reliance in smart-tourism contexts [27,33]. SE-style stability may co-exist with path dependence when “good-enough” adequacy and switching costs lock in behaviors [30], while evolving technical privacy risks (e.g., federated learning) motivate adaptive governance [31]. As a monitoring lens, SE complements measurement work that separates interface-observable cues from latent trust scales [26] and supports plural methods to surface divergent stakeholder expectations [32]. In our Asia-anchored, descriptive evidence, effects are modest (e.g., AME ≈ +3.2 pp; AUC = 0.68), consistent with an adequacy not optimization interpretation [11,12,13,15,23].
6.2. Managerial and Policy Implications
Scope.
Within the present Asia-anchored, descriptive evidence (≈ 84% China; AME ≈ +3.2 pp; AUC = 0.68; pseudo-R² = 0.18), we outline monitoring-oriented implications to maintain satisficing adequacy rather than prescriptive rules. The emphasis is on observable, replicable indicators aligned with SDGs 12 and 17. The items below are illustrative and mapped to our instrument; they are not computed metrics in this study.
SE-aligned, monitorable indicators.
Findings suggest that visible, low-friction, auditable trust cues are more likely to sustain adequacy than adding layers of rules or features.
- Friction parity (safe vs. unsafe paths) — relative steps/seconds to complete a safe action (e.g., verified/rated platform) versus a risky/uncertified one. Parity goal: safer options are no harder than unsafe ones. (Operationalization: track steps/seconds on canonical “safe” vs. “unsafe” paths; associational, non-causal.) Where parity holds, adequacy is more likely to stabilize [6,21,25,27,33].
Enabling conditions and sequencing.
SE is more plausible where: (1) transparency cues are auditable and visible at decision time; (2) safer choices are not slower; and (3) institutions can monitor, roll back, and re-certify. A conservative sequence is to strengthen visibility first, normalize low-friction safe routines second, and expand functions last, reducing the risk of “complexity without credibility” [35,36,37].
Governance perspective.
If visibility weakens, friction rises, or maintenance capacity declines, systems may drift from the adequacy band. Proportionate actions — re-audit, update labels, correct usability — may be preferable to feature expansion that adds complexity without improving trust [28,29,35,36,37]. This monitoring-oriented approach is consistent with responsible production (SDG 12) and cross-sector transparency partnerships (SDG 17).
6.3. Societal Implications
Framed through TLHF + SE, sustainable digital trust emphasizes maintainable adequacy over maximal control. Within institutional and cultural contexts similar to our sample, societies may benefit when decision-time transparency is legible, safer routines are not penalized by extra friction, and maintenance capacity keeps signals current and comparable across platforms. Such conditions can support decent work and inclusive participation (SDG 8) via predictable service quality, responsible consumption/production (SDG 12) via disciplined change-control and rollback, and partnerships for the goals (SDG 17) through interoperable certifications and auditable disclosure trails [35,36,37]. In our Asia-anchored context, these implications should be read as descriptive and bounded, highlighting conditions under which participation may cluster in a mid–high adequacy band rather than implying universal effects [28,29,27,33].
6.4. Limitations
This study is Asia-anchored and China-dominant. Despite international participation, the baseline sample (N = 1,590) includes 1,371/1,590 (86.2%) from China; the expanded dataset (N = 1,840) includes 1,547/1,840 (84.1%). This composition reflects platform constraints: Tencent Survey authentication can reduce duplicates but may restrict non-China access. Open-ended responses (N ≈ 50) offer cross-country context but cannot offset the regional imbalance; cross-national interpretations therefore remain exploratory and context-bounded. The study is cross-sectional and emphasizes descriptive regularities rather than causal identification. Additionally, some covariates (detailed digital literacy, AI familiarity beyond usage breadth, finer-grained cultural measures) were not captured; results should be read as associational and bounded. Given the highly imbalanced country composition (≈84% China), country-level interactions or subgroup regressions would be statistically unstable and risk spurious findings; cross-national interpretation thus remains exploratory.
6.5. Future Research Directions
Author Contributions
Conceptualization, S.H.; Methodology, S.H. and G.S.; Validation, G.S. and L.J.; Formal analysis, S.H.; Investigation, S.H. and L.J.; Data curation, L.J.; Writing—original draft, S.H.; Writing—review & editing, S.H. and G.S.; Visualization, S.H. and L.J.; Supervision, G.S.; Funding acquisition, L.J. All authors have read and agreed to the published version of the manuscript.
Funding
This research received no external funding.
Institutional Review Board Statement
The study was reviewed and approved by the Youngsan University Institutional Review Board (ID: YSUIRB-202511-HR-194-01; review type: expedited; decision: modification-then-approval; approval/notice date: 28 November 2025). The research involved no intervention, deception, or collection of directly identifiable data. Participation was voluntary with electronic informed consent. Minor participants were allowed only with legal-guardian consent and on-screen supervision, as specified in the approved protocol and displayed on the survey start page.
Informed Consent Statement
All participants provided electronic informed consent before participation and could withdraw at any time without penalty.
Data Availability Statement
Aggregated datasets and figure assets referenced in the Appendices (e.g., E1–E12 image panels and the two regression output tables) are included in the submission package. Analysis scripts and run logs are not included in this revision; additional materials are available from the corresponding author upon reasonable request and a signed data-use agreement.
Acknowledgments
The authors sincerely thank all 1,590 survey respondents and 35 interviewees for their voluntary participation, as well as the additional contributors to the expanded validation dataset (N = 1,840). Special appreciation is extended to the international participants who completed the survey despite technical or connectivity constraints, enriching the cross-cultural perspective on trust, usability, and transparency. The authors are also deeply grateful to Prof. Gilja So (소길자) for her ethical oversight and project supervision as the IRB principal investigator (Protocol ID: YSUIRB-202511-HR-194-01; expedited review), which ensured the study’s compliance and integrity.
Conflicts of Interest
The authors declare no conflict of interest.
References
- Suanpang, P.; Pothipassa, P. Integrating Generative AI and IoT for Sustainable Smart Tourism Destinations. Sustainability 2024, 16, 7435. [Google Scholar] [CrossRef]
- Florido-Benítez, L.; del Alcázar Martínez, B. How Artificial Intelligence (AI) Is Powering New Tourism Marketing and the Future Agenda for Smart Tourist Destinations. Electronics 2024, 13, 4151. [Google Scholar] [CrossRef]
- Siddik, A.B.; Forid, M.S.; Yong, L.; Du, A.M.; Goodell, J.W. Artificial intelligence as a catalyst for sustainable tourism growth and economic cycles. Technological Forecasting and Social Change 2025, 210, 123875. [Google Scholar] [CrossRef]
- Hirschprung, R.S. Is the Privacy Paradox a Domain-Specific Phenomenon? Computers 2023, 12, 156. [Google Scholar] [CrossRef]
- Arzoglou, E.; et al. The Role of Privacy Obstacles in the Privacy Paradox: A System Dynamics Perspective. Systems 2023, 11, 205. [Google Scholar] [CrossRef]
- Wilde, G.J.S. The Theory of Risk Homeostasis: Implications for Safety and Health. Risk Analysis 1982, 2, 209–225. [Google Scholar] [CrossRef]
- Gordon, L.A.; Loeb, M.P. The Economics of Information Security Investment. ACM Transactions on Information and System Security 2002, 5, 438–457. [Google Scholar] [CrossRef]
- Zajonc, R.B. Attitudinal Effects of Mere Exposure. Journal of Personality and Social Psychology 1968, 9, 1–27. [Google Scholar] [CrossRef]
- Lee, J.D.; See, K.A. Trust in Automation: Designing for Appropriate Reliance. Human Factors 2004, 46, 50–80. [Google Scholar] [CrossRef]
- Firmino de Souza, D.; Sousa, S.; Kristjuhan-Ling, K.; Dunajeva, O.; Roosileht, M.; Pentel, A.; Mõttus, M.; Özdemir, M.C.; Gratšjova, Ž. Trust and Trustworthiness from Human-Centered Perspective in Human–Robot Interaction (HRI)—A Systematic Literature Review. Electronics 2025, 14, 1557. [Google Scholar] [CrossRef]
- Cleveland, W.S. Robust Locally Weighted Regression and Smoothing Scatterplots. Journal of the American Statistical Association 1979, 74, 829–836. [Google Scholar] [CrossRef]
- Cleveland, W.S.; Devlin, S.J. Locally Weighted Regression: An Approach to Regression Analysis by Local Fitting. Journal of the American Statistical Association 1988, 83, 596–610. [Google Scholar] [CrossRef]
- Silverman, B.W. Density Estimation for Statistics and Data Analysis; Chapman & Hall: London, U.K., 1986. [Google Scholar]
- Jin, Z.; Wang, H.; Xu, Y. Artificial Intelligence as a Catalyst for Sustainable Tourism: A Case Study from China. Systems 2025, 13, 333. [Google Scholar] [CrossRef]
- Hosmer, D.W.; Lemeshow, S.; Sturdivant, R.X. Applied Logistic Regression, 3rd ed.; Wiley: Hoboken, NJ, USA, 2013. [Google Scholar] [CrossRef]
- Nardo, M.; Saisana, M.; Saltelli, A.; Tarantola, S.; Hoffmann, A.; Giovannini, E. Handbook on Constructing Composite Indicators: Methodology and User Guide; OECD Publishing: Paris, France, 2008. [Google Scholar] [CrossRef]
- Pagkalou, F.I.; Liapis, K.I.; Thalassinos, E.I. Defining the Total CSR Z-Score: A Methodological Approach. Sustainability 2024, 16, 10379. [Google Scholar] [CrossRef]
- Benlidayi, I.C.; Gupta, L. Translation and Cross-Cultural Adaptation: A Critical Step in Multi-National Survey Studies. Journal of Korean Medical Science 2024, 39(49), e336. [Google Scholar] [CrossRef]
- Wei, W.; Zhang, L.; Law, R. Smart tourism destination: developing and validating a measurement scale. Current Issues in Tourism 2024. [Google Scholar] [CrossRef]
- Zhang, H.; Liu, J.; Zhang, Y.; Wang, X. Evaluation of attraction and spatial pattern analysis of world heritage tourist destinations in China. PLoS ONE 2023, 18, e0289093. [Google Scholar] [CrossRef]
- Lilly, G. Bounded Rationality: A Simon-Like Explication. J. Econ. Dyn. Control 1994, 18(1), 205–230. [Google Scholar] [CrossRef]
- Yin, Z.; Huang, K.; Ying, S.; Huang, W.; Kang, Z. Modeling of Time Geographical Kernel Density Function under Network Constraints. ISPRS International Journal of Geo-Information 2022, 11, 184. [Google Scholar] [CrossRef]
- Mize, T.D. Best Practices for Estimating, Interpreting, and Presenting Average Marginal Effects. Sociological Science 2019, 6, 81–117. [Google Scholar] [CrossRef]
- Lundberg, S.M.; Erion, G.; Chen, H.; DeGrave, A.; Prutkin, J.M.; Nair, B.; Katz, R.; Himmelfarb, J.; Bansal, N.; Lee, S.-I. From Local Explanations to Global Understanding with Explainable AI for Trees. Nature Machine Intelligence 2020, 2, 56–67. [Google Scholar] [CrossRef]
- Simon, H.A. A Behavioral Model of Rational Choice. The Quarterly Journal of Economics 1955, 69, 99–118. [Google Scholar] [CrossRef]
- Aquilino, L.; Di Dio, C.; Manzi, F.; Massaro, D.; Bisconti, P.; Marchetti, A. Decoding Trust in Artificial Intelligence: A Systematic Review of Quantitative Measures and Related Variables. Informatics 2025, 12, 70. [Google Scholar] [CrossRef]
- Jeong, M.; Shin, H.H. Tourists’ Experiences with Smart Tourism Technology at Smart Destinations and Their Behavioral Intentions. Journal of Travel Research 2020, 59(8), 1467–1484. [Google Scholar] [CrossRef]
- Grimmelikhuijsen, S.G.; Porumbescu, G.A.; Hong, B.; Im, T. The Effect of Transparency on Trust in Government: A Cross-National Comparative Experiment. Public Administration Review 2013, 73(4), 575–586. [Google Scholar] [CrossRef]
- Acquisti, A.; Brandimarte, L.; Loewenstein, G. Privacy and Human Behavior in the Age of Information. Science 2015, 347(6221), 509–514. [Google Scholar] [CrossRef]
- Arthur, W.B. Competing Technologies, Increasing Returns, and Lock-In by Historical Events. The Economic Journal 1989, 99(394), 116–131. [Google Scholar] [CrossRef]
- Zhao, J.; Chen, X.; Wang, S.; et al. A Survey of Federated Learning Privacy Attacks, Defenses, and Challenges. ACM Computing Surveys 2025, 57(3), 68. [Google Scholar] [CrossRef]
- Nikraftar, T.; Jafarpour, E. Using Q-methodology for Analyzing Divergent Perspectives about Sustainable Tourism. Environment, Development and Sustainability 2021, 23(3), 5904–5919. [Google Scholar] [CrossRef]
- Gulati, S.; McDonagh, J.; Sousa, S.; Lamas, D. Trust Models and Theories in Human–Computer Interaction: A Systematic Literature Review. Computers in Human Behavior Reports 2024, 16, 100495. [Google Scholar] [CrossRef]
- Majid, G.M.; Ali, G.A.; Jermsittiparsert, K.; Rahman, M.; Salam, M.A. Intelligent automation for sustainable tourism: a systematic review. Journal of Sustainable Tourism 2023. [Google Scholar] [CrossRef]
- Pop, I.L.; Nițu, A.; Ionescu, A.; Gheorghe, I.G. AI-Enhanced Strategies to Ensure New Sustainable Destination Tourism Trends among the 27 European Union Member States. Sustainability 2024, 16(22), 9844. [Google Scholar] [CrossRef]
- UNWTO. Tourism and the Sustainable Development Goals—Journey to 2030, 2nd ed.; United Nations World Tourism Organization: Madrid, Spain, 2022. [Google Scholar] [CrossRef]
- Zeqiri, A.; Ben Youssef, A.; Maherzi Zahar, T. The Role of Digital Tourism Platforms in Advancing Sustainable Development Goals in the Industry 4.0 Era. Sustainability 2025, 17(8), 3482. [Google Scholar] [CrossRef]
- Hair, J.F.; Howard, M.C.; Nitzl, C. Assessing Measurement Model Quality in PLS-SEM Using Confirmatory Composite Analysis. Journal of Business Research 2020, 109, 101–110. [Google Scholar] [CrossRef]
- Dinev, T.; Hart, P. An Extended Privacy Calculus Model for E-Commerce Transactions. Information Systems Research 2006, 17(1), 61–80. [Google Scholar] [CrossRef]
- Lei, S.S.I.; Ye, S.; Law, R. Will tourists take mobile travel advice? Examining the personalization–privacy paradox and self-construal. Tourism Management Perspectives 2022, 41, 100949. [Google Scholar] [CrossRef]
- Skubis, I.; Jansone, I.; Losurdo, F.; et al. Humanoid Robots in Tourism and Hospitality—Exploring Managerial, Ethical, and Societal Challenges. Applied Sciences 2024, 14(24), 11823. [Google Scholar] [CrossRef]
- Elshaer, I.A.; Alyahya, M.; Azazz, A.M.S.; Ali, M.A.S.; Fathy, E.A.; Fouad, A.M.; Soliman, S.A.E.M.; Fayyad, S. Building Digital Trust and Rapport in the Tourism Industry: A Bibliometric Analysis and Detailed Overview. Information 2024, 15, 598. [Google Scholar] [CrossRef]
- Dinis, R.; Gomes, S.; Ferreira, J.; et al. The Use of Artificial Intelligence Systems in Tourism and Hospitality: The Tourists’ Perspective. Administrative Sciences 2024, 14(8), 165. [Google Scholar] [CrossRef]
Figure 2.
2-D KDE/LOESS distribution of trust-related proxies (Q3–Q4).
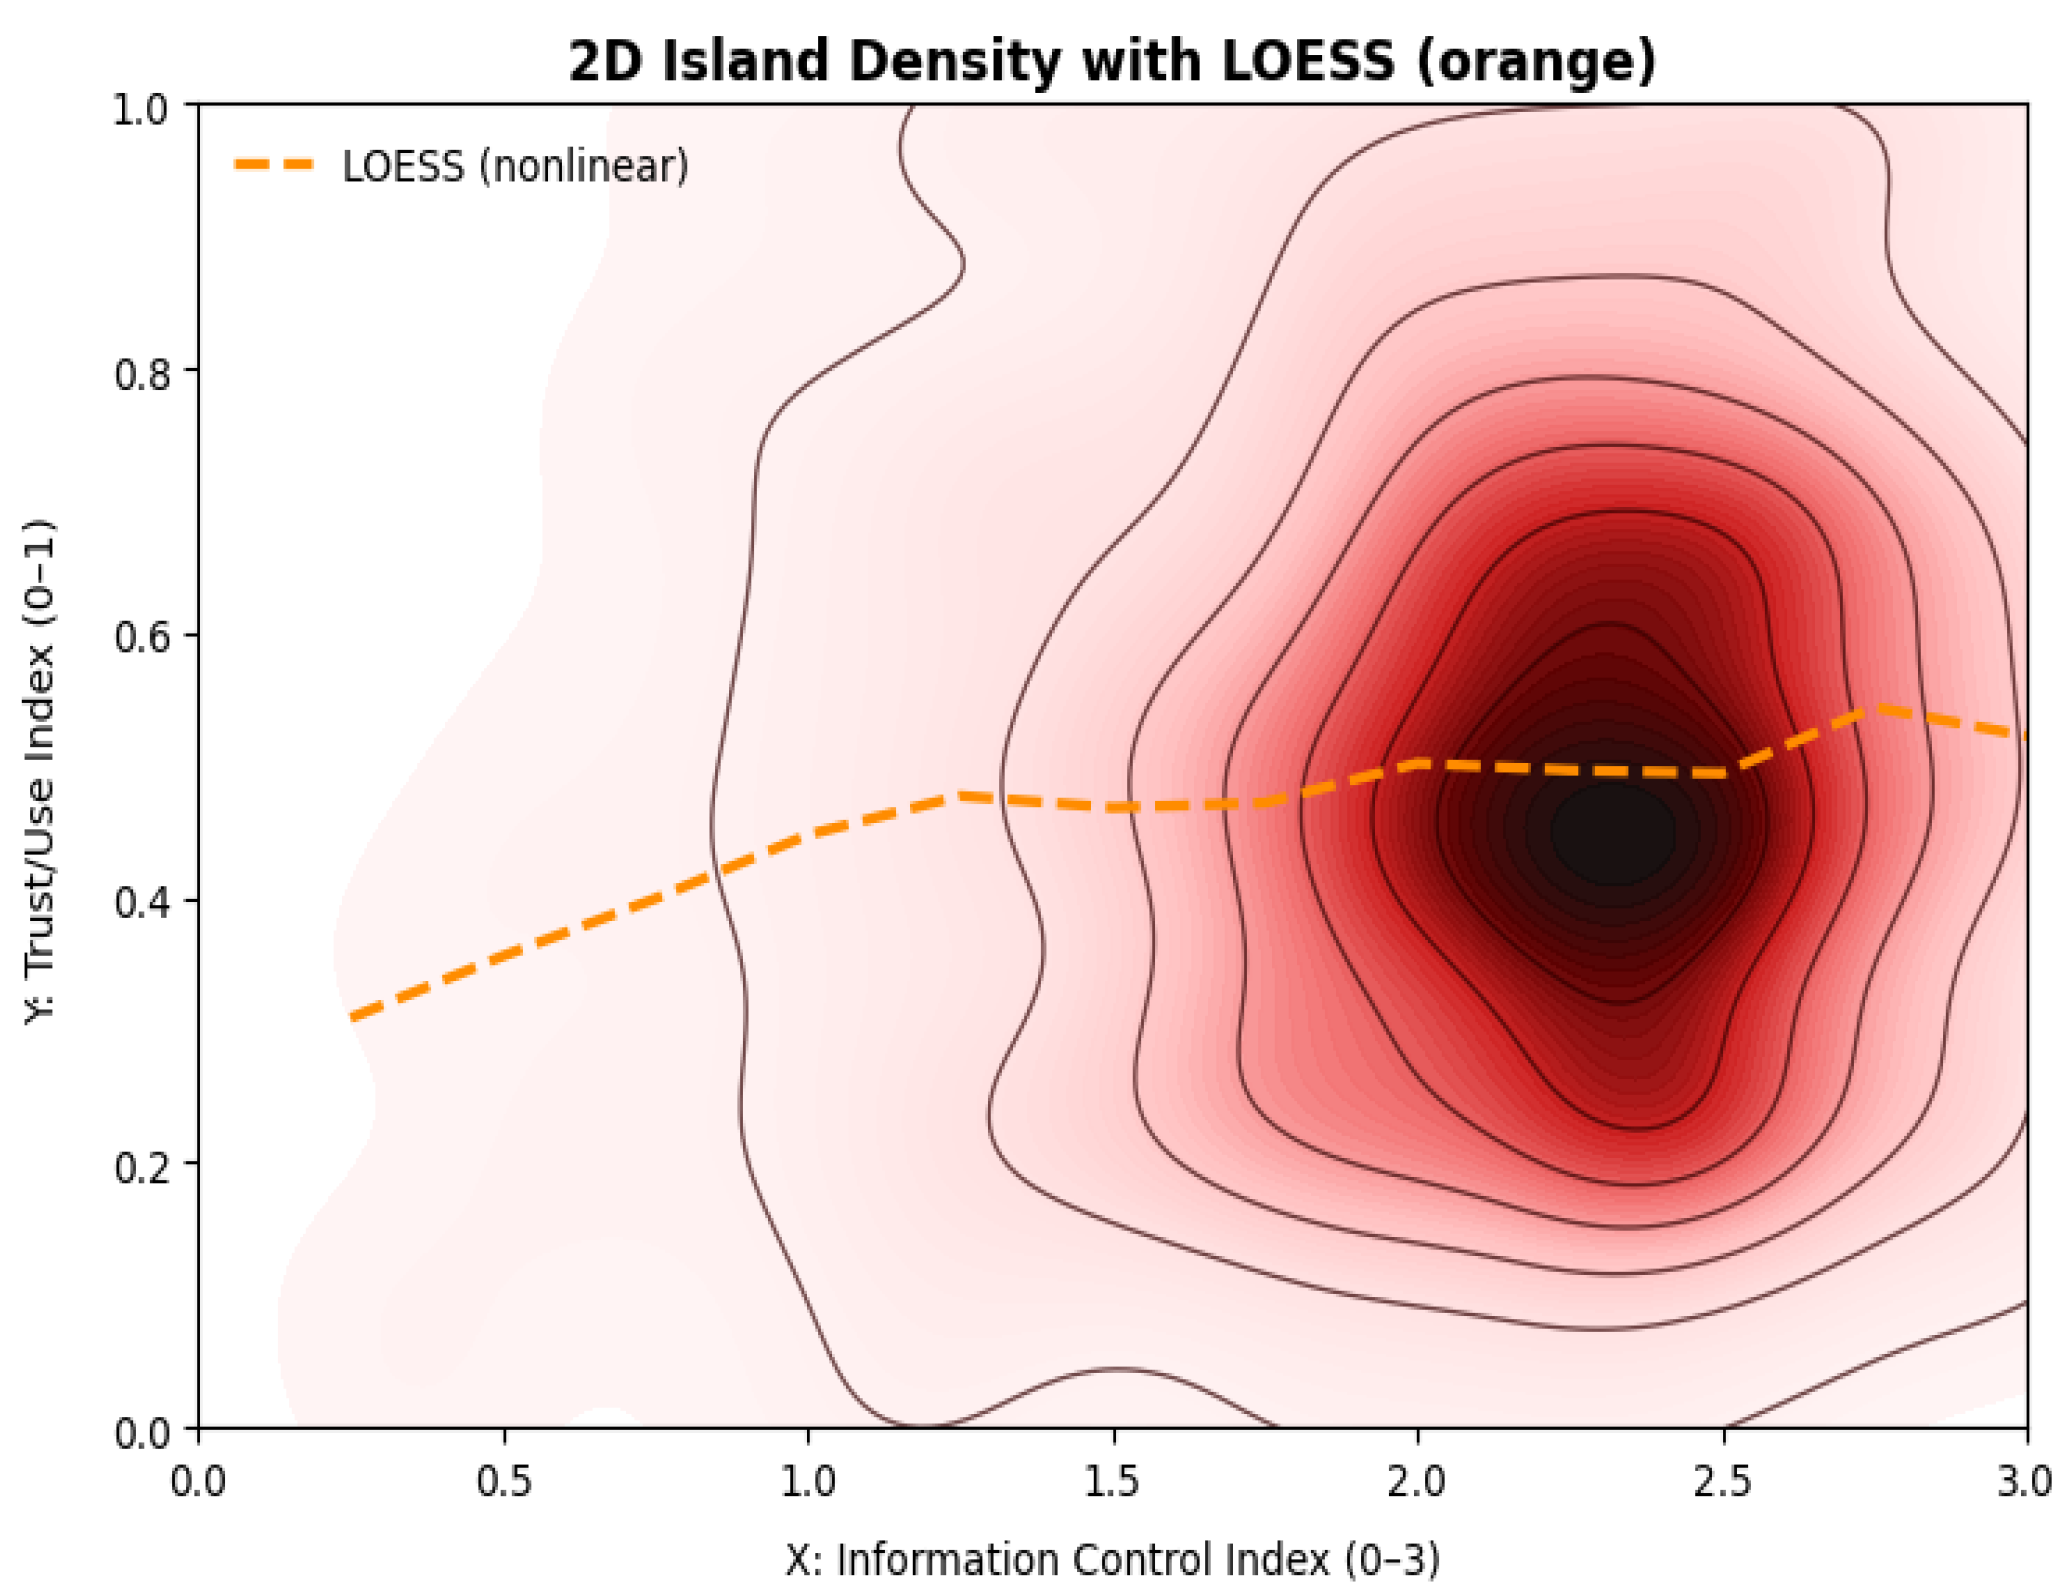
Figure 3.
3-D kernel-density surface highlighting the Satisficing Equilibrium (SE) band.
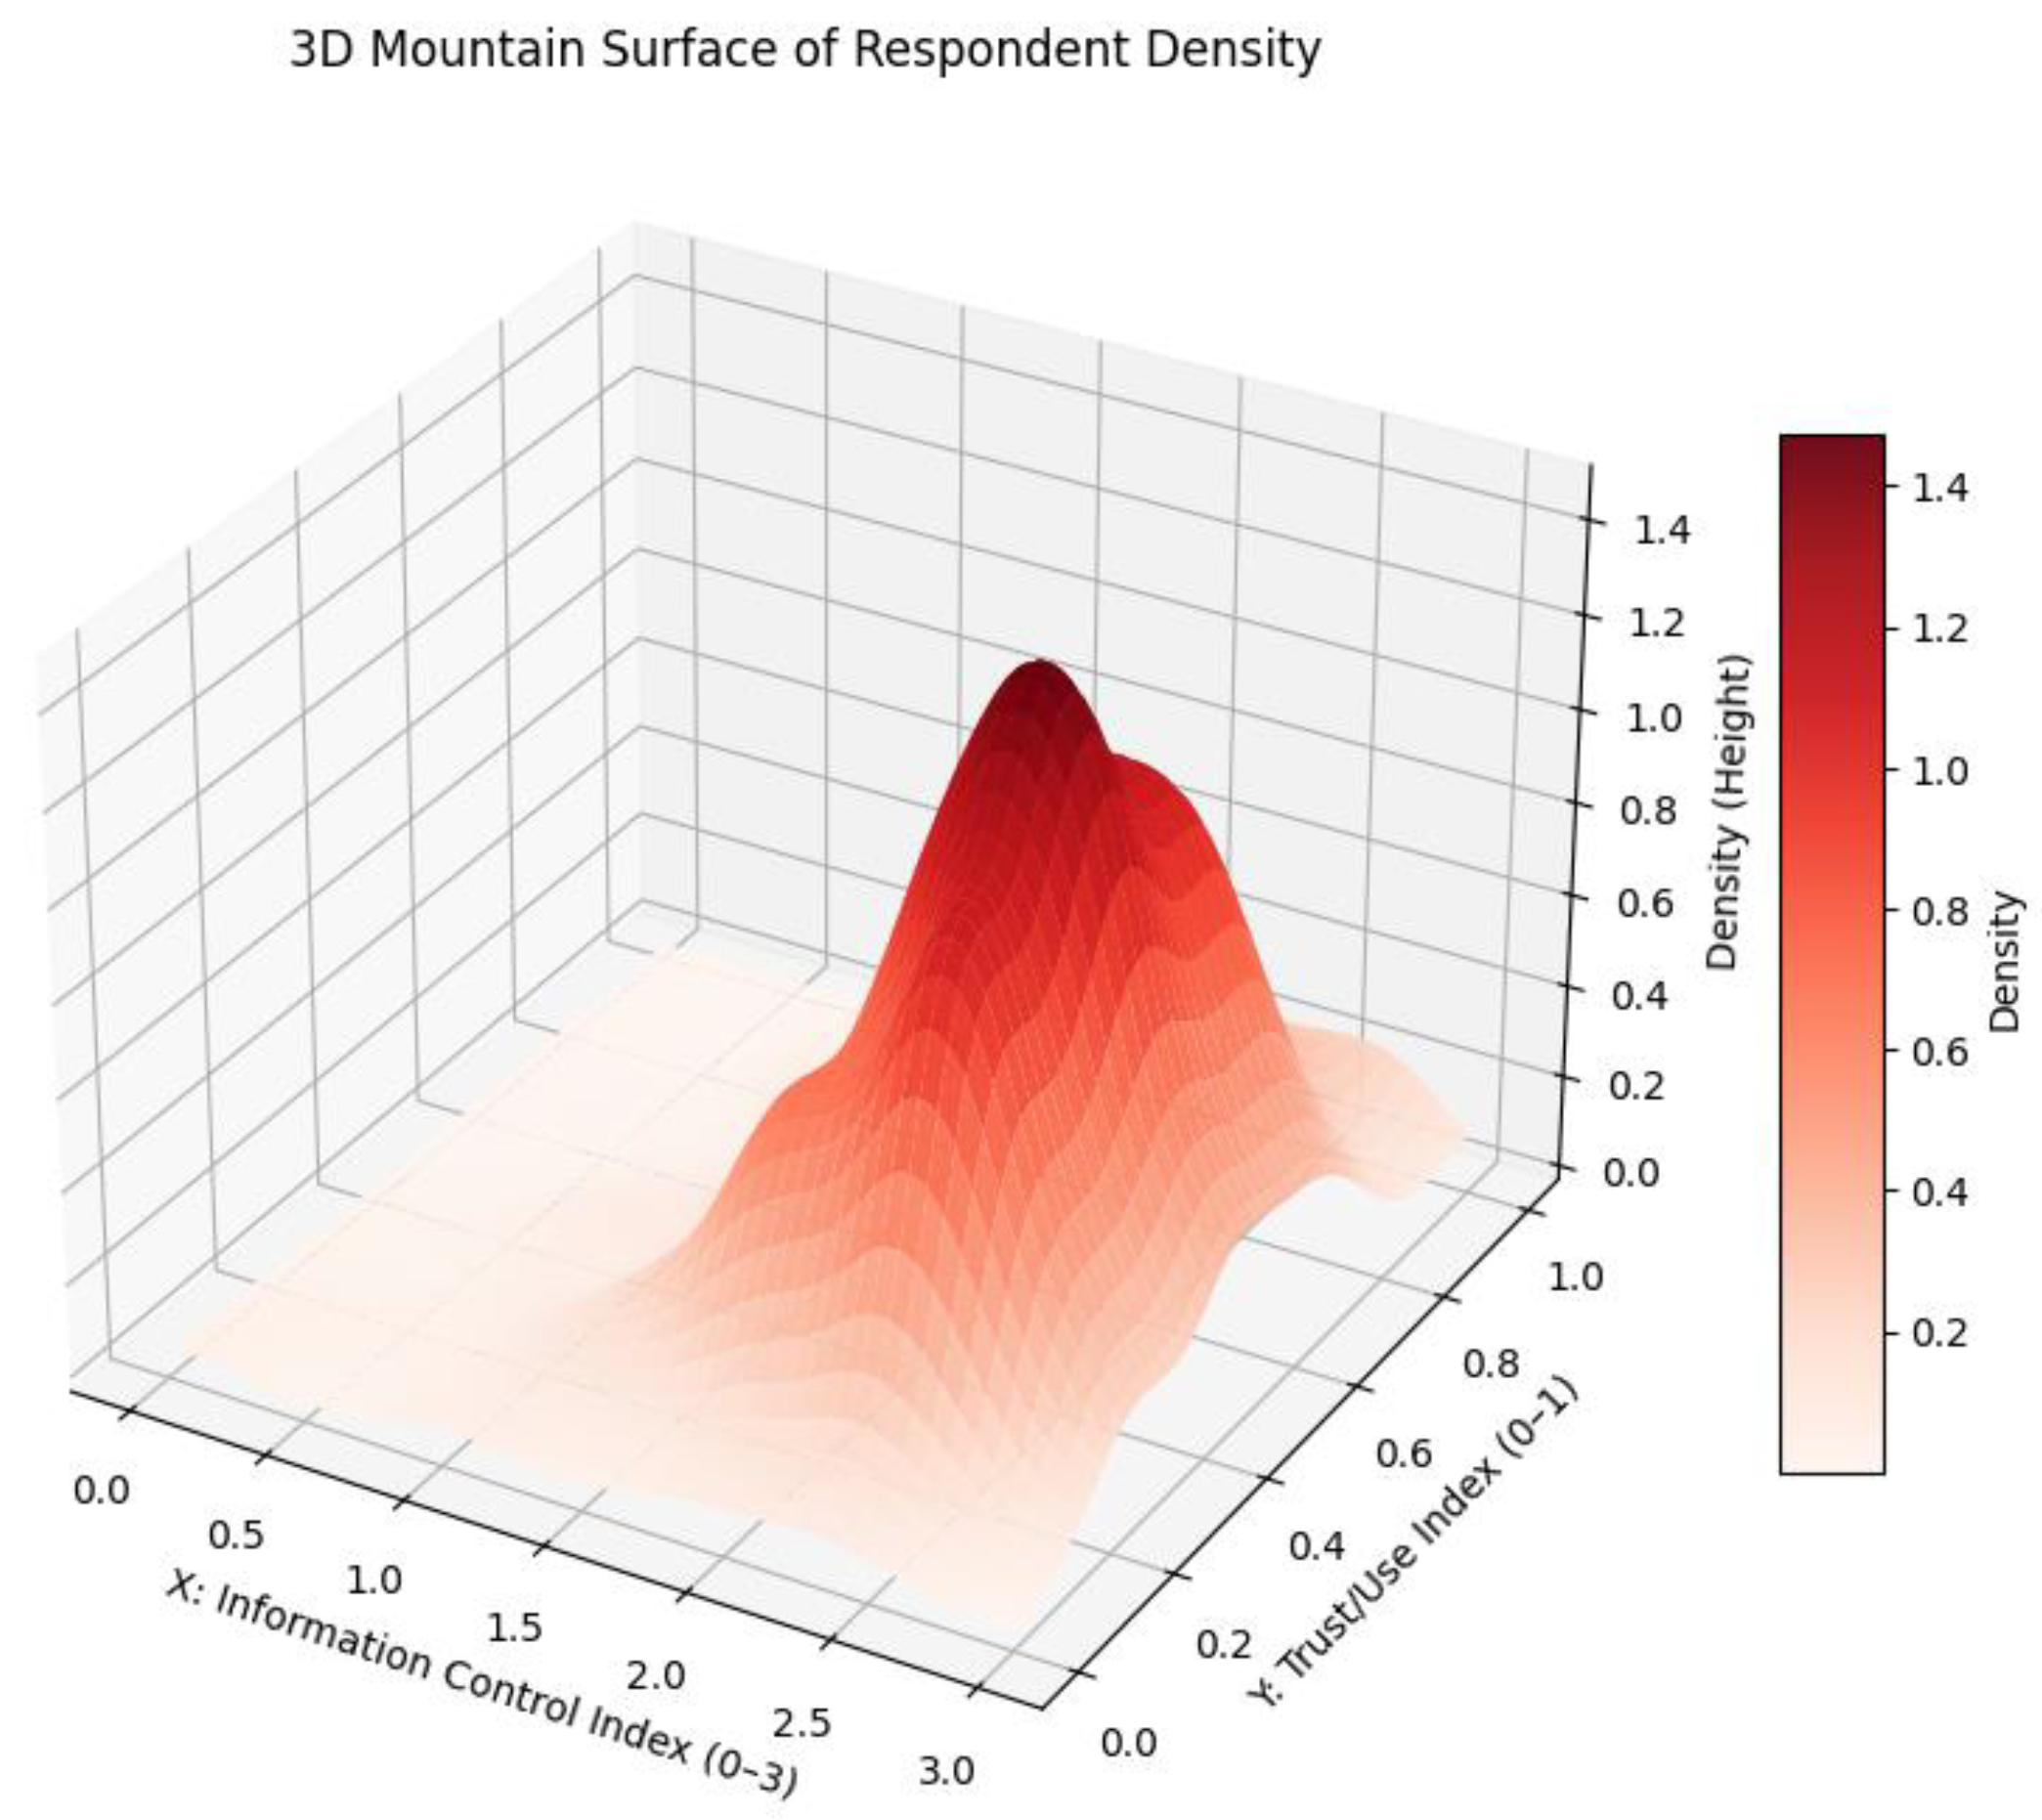
Figure 4.
2-D KDE robustness across bandwidths and samples.
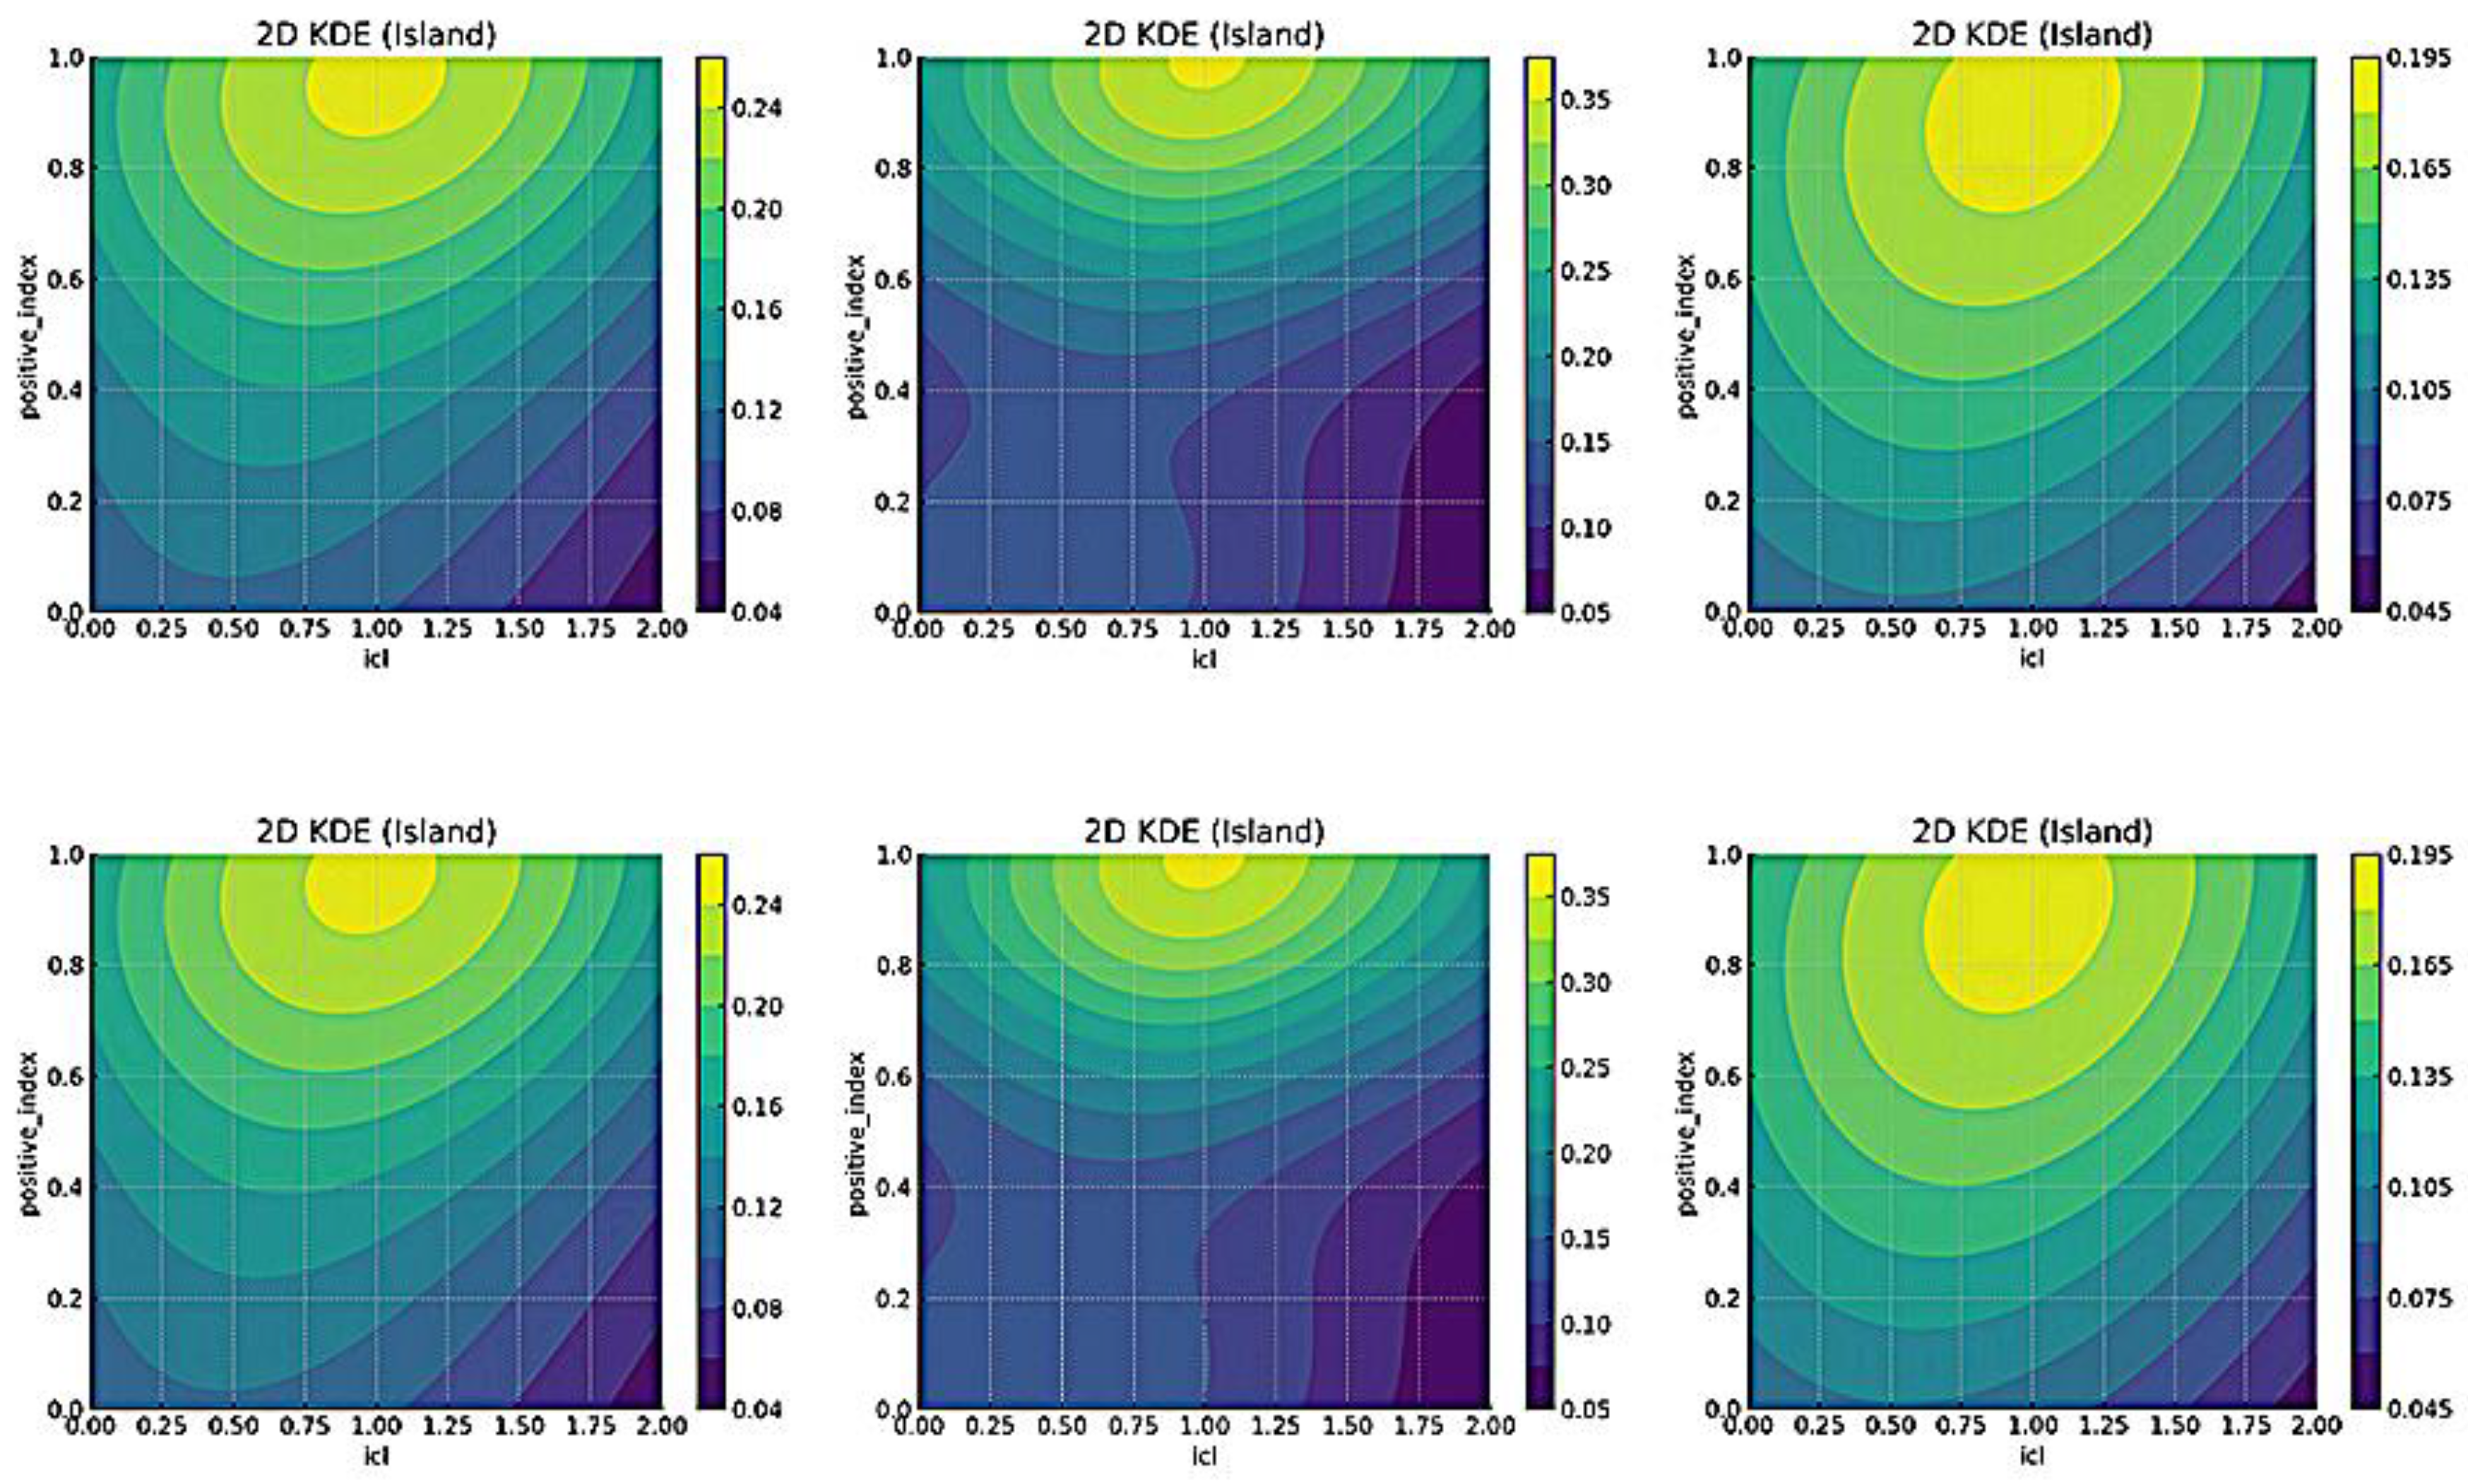
Figure 5.
3-D smoothed-surface robustness across bandwidths and samples.

Table 1.
TLHF/SE in relation to five anchor studies (plus the present study).
| Paper | Focus | Actors | Trust logic | Governance lever | Gap / Link to TLHF |
|---|---|---|---|---|---|
| Lee & See (2004) [9] | Trust in automation shapes reliance under uncertainty. | User–automation dyad. | Calibration prevents misuse and disuse. | Feedback and displays support appropriate reliance. | Prior scope: Dyadic human–automation trust/reliance. / Link to TLHF/SE (this study): Extends to government–firm–user coordination. |
| Florido-Benítez (2024) [2] | AI tourism marketing agenda: benefits, risks, directions. | Destinations, firms, platforms, users. | AI adoption is discussed through benefits–risks tensions including privacy/cybersecurity and data dependence. | Strategic adoption plus privacy/cybersecurity and compliance attention. | Prior scope: Agenda-style mapping of tourism AI opportunities/risks. / Link to TLHF/SE (this study): Adds “stabilization after adequacy/visibility” reading. |
| Suanpang et al. (2024) [1] | GenAI+NLP+IoT platform for smart-trip planning and sustainability. | Tourists and providers. | Personalization/service functions are linked to satisfaction and behavioral intention in system evaluation. | Sensing-to-recommendation service pipeline. | Prior scope: System/pipeline + user evaluation focus. / Link to TLHF/SE (this study): Re-anchors effects in governance thresholds/adequacy. |
| Siddik et al. (2025) [3] | ANN links AI adoption to tourism sustainability at macro scale. | Countries/destinations. | AI adoption is linked to efficiency/smart tourism capability and sustainability outcomes at destination level. | Policy guidance for AI-driven efficiency. | Prior scope: Macro destination-level adoption/outcomes. / Link to TLHF/SE (this study): Adds micro–meso trust stabilization interpretation. |
| Firmino de Souza et al. (2025) [10] | Review: trust vs trustworthiness definitions and measures in HRI. | Humans with robots/AI. | Trust/trustworthiness constructs vary; explicit framing and human-centered factors are emphasized. | Human-centered cues and measurement emphasis. | Prior scope: Human-centered construct/measurement synthesis in HRI. / Link to TLHF/SE (this study): Re-anchors cues in tourism governance triad. |
| TLHF/SE (Present) | Nonparametric TLHF: three lines converge to SE adequacy-band. | Government–firm–user triad. | “Good-enough” thresholds stabilize trust. | Tune visibility, efficiency, familiarity to stabilize the SE adequacy band. | Multi-actor nonlinear stabilization mechanism. |
Note. The first five rows summarize each cited study’s stated focus and emphasis. “Gap / Link to TLHF” reflects this study’s comparative positioning for synthesis (not verbatim claims of the cited works).
Table 2.
TLHF constructs: literature anchors, operationalization, and expected TLHF/SE reading.
| Construct | TLHF Line (Actor) | Prior Emphasis(Anchor) | Operationalization (This Study) | Expected TLHF/SE Reading (This Study) |
|---|---|---|---|---|
| Transparency/visibility exposure | Government—Visibility | Appropriate reliance is supported by interpretable information about purpose/process/performance. [9] | Q5 exposure (any_seen; strict_seen for robustness). | Threshold-like acceleration after “visible openness.” |
| Accountability/explanation expectation | Government—Visibility | HRI work emphasizes accountability-related cues/feedback and clear interaction framing in trust/trustworthiness. [10] | Q7 accountability expectation (0–2). | Stabilization once “good-enough” governance is perceived. |
| Privacy/security concern | Cross-actor constraint | Tourism AI marketing highlights reliance on personal data and cybersecurity/privacy protection needs. [2] | Q6 privacy concern (0–3). | Concern may persist while behavior stabilizes (privacy satisficing). |
| Efficiency/usability benefits | Firm—Efficiency | Tourism AI is framed around efficiency/service improvement and smart capability supporting sustainability outcomes. [2,3] | Q4 performance_mean (Positive Index: efficiency, ease, personalization, labor saving). | Positive experiences raise safe-choice; marginal gains taper (plateau). |
| Adoption breadth (use scope) | User—Familiarity | Smart-trip system evaluation links satisfaction/experience with usage-related factors (e.g., attention/interest/usage). [1] | Q3 usage_count (AI Use Index, 0–5). | Gradual accumulation; not necessarily linear in choice models. |
| Trust-related proxies (Q3–Q4) | Outcome (descriptive) | Trust is distinguished from reliance behavior; it relates to reliance under uncertainty. [9] | KDE/LOESS: Q3 usage_count and Q4 performance_mean. | Concentration into a mid–high SE adequacy band. |
| Safe-platform preference (Q8) | Outcome (inferential) | Trust calibration relates to reliance decisions under uncertainty (misuse/disuse as maladaptive outcomes). [9] | Logit-AME: Q8 (1 = Yes; 0 = Maybe/No). | Choice stabilizes once minimum conditions feel “good enough.” |
Note. Table 2 maps conceptual constructs to TLHF dimensions and survey operationalization (Q3–Q8). Privacy concern functions as a cross-actor constraint; transparency exposure and accountability expectation jointly represent governance visibility; efficiency/usability benefits reflect platform-side adequacy; adoption breadth proxies user familiarity. KDE/LOESS support visualization; Logit-AME supports inference. Robustness checks (strict_seen encoding; expanded N = 1,840) are detailed in Appendices D–E, [11,12,13,15,23].
Table 4.
Descriptive Statistics of the Survey Sample (N = 1,590).
| Variable | Obs. | Categories/Range | Top Category (%) | Mean | Std. Dev. |
|---|---|---|---|---|---|
| Age group | 1,590 | 4 | 18–29 (53.7%) | — | — |
| Travel frequency | 1,590 | 3 | 1–2 (55.1%) | — | — |
| AI customer service | 1,590 | Binary | Used/Agree | 0.52 | 0.50 |
| Voice navigation | 1,590 | Binary | Used/Agree | 0.57 | 0.49 |
| Personalized recommendation | 1,590 | Binary | Used/Agree | 0.50 | 0.50 |
| VR/AR features | 1,590 | Binary | Used/Agree | 0.22 | 0.42 |
| AI translator | 1,590 | Binary | Used/Agree | 0.23 | 0.42 |
| Perceived efficiency gain | 1,590 | Binary | Agree | 0.72 | 0.45 |
| Ease of use | 1,590 | Binary | Agree | 0.72 | 0.45 |
| Personalization helpful | 1,590 | Binary | Agree | 0.50 | 0.50 |
| Labor-cost reduction | 1,590 | Binary | Agree | 0.44 | 0.50 |
| No obvious improvement | 1,590 | Binary | — | 0.04 | 0.19 |
Note. Means for binary variables represent proportions coded 1. Variable definitions correspond to survey items (Q3–Q8). Robustness and dual-coding tests appear in Appendix E.
Disclaimer/Publisher’s Note: The statements, opinions and data contained in all publications are solely those of the individual author(s) and contributor(s) and not of MDPI and/or the editor(s). MDPI and/or the editor(s) disclaim responsibility for any injury to people or property resulting from any ideas, methods, instructions or products referred to in the content. |
© 2025 by the authors. Licensee MDPI, Basel, Switzerland. This article is an open access article distributed under the terms and conditions of the Creative Commons Attribution (CC BY) license (http://creativecommons.org/licenses/by/4.0/).
Copyright: This open access article is published under a Creative Commons CC BY 4.0 license, which permit the free download, distribution, and reuse, provided that the author and preprint are cited in any reuse.


