
Submitted:
10 November 2025
Posted:
11 November 2025
You are already at the latest version
Abstract
Resting-state functional connectivity (rsFC) provides insight into the intrinsic organization of brain networks and is increasingly recognized as a sensitive marker of age-related neural changes. Functional near-infrared spectroscopy (fNIRS) provides a portable and cost-effective approach to measuring rsFC, including in naturalistic environments. However, the sensitivity of fNIRS to age-related alterations in rsFC topology remains poorly characterized. Here, we applied graph-based analysis to fNIRS data acquired during rest from 57 healthy participants divided into two groups: 26 young adults (18-30 years) and 31 older adults (50-77 years). Despite observing significantly attenuated low-frequency oscillation (LFO) power in older adults (5-6 fold reduction, p < 0.001), network analysis revealed counterintuitively higher connectivity in this group. Specifically, older adults exhibited 50-86% greater degree density, 16-43% higher clustering coefficients, and 31-75% greater global efficiency compared to young adults. These patterns were consistent across all canonical resting-state networks (sensorimotor, auditory, visual, frontoparietal, default mode) and all hemoglobin contrasts. While network decay rates were slower in older adults, the coexistence of reduced oscillatory and increased connectivity may reflect vascular rather than purely neural contributions. Overall, our findings validate fNIRS as a sensitive tool for detecting age-related changes in network organization, while highlighting the importance of disentangling neural and vascular signal components in aging research.
Keywords:
resting sate
; fNIRS
; functional connectivity
; ageing
1. Introduction
The worldwide aging population is expanding rapidly, with individuals aged 65 and above expected to represent a substantial proportion of the global demographic by 2050 [1]. This demographic transition is accompanied by increased prevalence of cognitive decline, with conditions ranging from normal cognitive aging to mild cognitive impairment (MCI) and dementia [2,3]. Understanding the neural mechanisms underlying both normal and pathological aging has thus become a key scientific and socioeconomic priority. Aging is associated with progressive structural and functional changes that affect neuronal efficiency, synaptic plasticity, and large-scale brain network integration [4,5]. Conventional clinical assessments often detect impairment only after substantial neuronal and vascular deterioration, while structural brain changes typically manifest after earlier functional alterations have occurred [6].
Functional neuroimaging offers a means to investigate how aging affects brain function. In particular, functional connectivity characterizes the temporal correlation between spatially distributed brain regions, allowing the brain to be analyzed as an integrated network rather than isolated modules. When measured during rest, resting-state functional connectivity (rsFC) provides insight into the spontaneous low-frequency fluctuations that reflect the intrinsic functional architecture of the brain [7,8]. Resting-state approaches are particularly valuable for aging research because they do not rely on task performance, making them more suitable for older or cognitively impaired populations [9,10,11,12].
Previous rsFC studies using functional magnetic resonance imaging (fMRI) have shown that normal brain aging is typically accompanied by decreased connectivity within major brain networks and increased connectivity between networks, particularly within the frontoparietal, visual, and motor systems [13,14]. These findings suggest a shift from specialized to more distributed processing, which is often interpreted as dedifferentiation or compensatory reorganization in response to structural decline.
Functional near-infrared spectroscopy (fNIRS) is an alternative approach to fMRI that employs near-infrared light to provide a portable, affordable, and non-invasive means of assessing brain function [15,16,17,18]. Its higher temporal resolution, tolerance to movement, and suitability for naturalistic environments make it particularly advantageous for studying older adults in their own environment.
Despite this promise, resting-state fNIRS connectivity remains comparatively underexplored, with few studies published on aging to date [19,20,21]. The relatively low number of channels, sensitivity to extracerebral hemodynamics, and differences in hemodynamic specificity mean that rsFC metrics derived from fNIRS may not directly mirror those from fMRI. In addition, the high temporal and low spatial resolutions of fNIRS signals introduce unique confounds – but also opportunities to characterize novel physiological aspects of aging. Therefore, establishing how fNIRS-based network measures behave in healthy young and older adults is a relevant step toward validating this modality for lifespan and clinical studies.
In this work, we evaluated the feasibility and sensitivity of fNIRS for detecting age-related alterations in resting-state functional connectivity. In particular, we characterized how standard graph-theoretical metrics manifest in fNIRS-derived networks. By comparing healthy young and older adults, we examined whether these metrics capture consistent age-related differences and how such patterns relate to known physiological and methodological properties of fNIRS. Through this analysis, we aimed to establish a methodological foundation for future applications of fNIRS to study aging and functional network organization in age-related cognitive impairments.
2. Materials and Methods
2.1. Subjects and Experimental Protocol
A total of 57 participants with no self-reported history of neurological or psychiatric disorders were recruited for this study. Participants were divided into two age groups: young adults (YA; N = 26; age range: 18–30 years; 3 female) and older adults (OA; N = 31; age range: 50–77 years; 21 female). For data collection, each participant laid on a hospital bed and was instructed to close their eyes, remain seated and relaxed, and not focus on any specific task. Resting-state data were acquired over three runs of six minutes each. The study protocol was approved by the Research Ethics Committee of the University of Campinas, where the experiment was carried out, and all participants provided written informed consent prior to data collection.
2.2. fNIRS Acquisition and Processing
All optical measurements were acquired using a commercial continuous-wave fNIRS system (NIRScout, NIRx Medical Technologies, Berlin, Germany) with a sampling rate of 7.8 Hz. The probe configuration was designed to achieve coverage of the entire head and consisted of 16 light sources (each source contained two LEDs emitting at 760 nm and 850 nm) and 32 detectors. This setup resulted in a total of 64 source–detector pairs (channels) with an average source-detector separation of 3 cm (Figure 1).
The processing of the fNIRS data was performed using custom scripts based on the HOMER2 toolbox [22]. For each run, we excluded channels with a scalp-coupling index (SCI) below 0.7 from further analysis [23,24]. The remaining intensity time series were converted to optical density, and motion artifacts were corrected using a hybrid approach that combined spline interpolation followed by wavelet filtering [25]. Then, hemodynamic changes in oxy-hemoglobin (HbO) and deoxy-hemoglobin (HbR) concentrations were computed using the modified Beer–Lambert law with a differential pathlength factor of 6 for both wavelengths.
To minimize extra-cerebral contributions and isolate neural low-frequency oscillations (LFOs), each hemoglobin time series was band-pass filtered between 0.009 and 0.08 Hz using a third-order Butterworth filter [26,27,28]. Then, the first component was removed via Principal Component Analysis (PCA) to reduce systemic interference [29]. For analyses focusing on specific sub-bands of LFOs (Section 3.1), the data was band-pass filtered into two narrower frequency ranges: band V (0.010 – 0.027 Hz), associated with endothelial function and autoregulatory oscillations, and; band IV (0.027 – 0.073 Hz), associated with neurogenic vasomotion and local smooth muscle activity [30,31]. In all cases, the filtered HbO and HbR time series were pre-whitened to minimize serially correlated errors [32], and total hemoglobin (HbT) was calculated as the sum of HbO and HbR.
2.3. Functional Connectivity Analysis
Functional connectivity was quantified by computing pairwise Pearson correlation coefficients between all fNIRS channel time series for each hemoglobin contrast (HbO, HbR, and HbT). To reproduce the resting-state functional connectivity (rsFC) networks typically reported in the literature, we applied the Fisher z-transformation to the correlation matrix measured for each run. Subject-level matrices were averaged across the runs to obtain individual functional connectivity maps, which were then averaged across subjects within each group. The resulting group matrices were subsequently standardized using Z-scores for visualization purposes. A seed-based approach was utilized to identify rsFC networks corresponding to cortical regions covered by our fNIRS probe: sensorimotor, auditory, visual, fronto-parietal control (FPC), and default mode network (DMN). For each of these networks, a representative seed channel was selected based on anatomical localization derived from the AtlasViewer software [33]. Specifically, the sensorimotor network was localized to the left precentral gyrus, the auditory network to the left superior temporal gyrus, the visual network to the left cuneus gyrus, the FPC network to the left middle frontal gyrus, and the DMN to the left superior frontal gyrus.
For graph-based analysis, adjacency matrices were derived by thresholding the correlation matrices, so that all correlation coefficients below a given threshold were set to zero [34]. To assess the robustness of the network properties to this arbitrary choice, we varied the correlation threshold from 0.1 to 0.8 in increments of 0.1, which allowed us to analyze how the pattern varies as a function of the threshold [27,35]. In every case, we performed quantified the graph's key topological properties [36,37,38]. Specifically, we quantified network connectivity through degree density, defined as the ratio of observed edges to the maximum possible edges in the network. Functional segregation was evaluated using the average clustering coefficient, which measures the tendency of nodes to form locally interconnected groups. Functional integration was assessed through normalized global efficiency, calculated as the average inverse of the shortest path length across all node pairs and reflects the efficiency of information transfer across the network, while modularity was computed using the Newman–Girvan algorithm [39]. At the nodal level, hub regions were identified as nodes with the highest degree centrality [40]. All graph-theoretical analyses were performed using the Brain Connectivity Toolbox [34].
2.4. Statistical Analysis
Given the relatively low number of participants and deviations from normality observed in several measures, particularly within the older adult group, we opted to report results as median and interquartile range (IQR). When appropriate, between-group comparisons (younger vs. older adults) were conducted using the Mann-Whitney U test to compare the overall distributions between the two groups, and effect sizes were computed as the rank-biserial correlation (rrb) to account for non-normality, with standard interpretation (~0.1 small, 0.3 medium, and 0.5 large). In all cases, statistical significance was defined as p < 0.05 (two-tailed), and all statistical analyses were performed in Python (version 3.11) using the scipy.stats library.
3. Results
3.1. Power Spectrum of Low-Frequency Oscillations Is Attenuated for Older Adults
Across all frequency bands and chromophores, we observed that young adults consistently showed greater low-frequency oscillation (LFO) power than older adults (Figure 2, Table 1). For HbO, median power was markedly higher in young adults than in older adults in the resting-state and Band IV ranges (median [IQR] = 40.7 [17.9] vs. 8.3 [9.4]; and 31.8 [17.2] vs. 9.1 [14.7], both p < 0.001, effect size: 0.76-0.95). We also observed a similar pattern for HbR, where young adults showed higher power in Band IV (5.9 [2.5] vs. 1.4 [1.4], p < 0.001, effect size: 0.94) and in the resting-state range (10.7 [4.3] vs. 1.6 [2.2], p < 0.001, effect size: 0.97). Differences were also present for HbT, although with smaller effect sizes (Band IV: 37.6 vs. 10, p < 0.001, effect size: 0.70; Band V: 7.5 vs. 2.4, p < 0.001, effect size: 0.75). Across chromophores, HbO consistently showed the largest absolute differences, followed by HbT and HbR.
3.2. Resting-State fNIRS Connectivity and Global Network Properties
Despite lower LFO power, the overall spatial organization of fNIRS-based rsFC patterns was similar across age groups. The canonical resting-state networks (sensorimotor, auditory, visual, frontoparietal control, and default mode network) were reproducible in both young and older adults across all hemoglobin contrasts (Figure 3). However, older adults exhibited more spatially extended and stronger correlations, with approximately 13-16% more significantly connected channels, particularly within the sensorimotor and default-mode networks.
To characterize these age-related differences quantitatively, we examined how macroscopic graph properties varied as a function of the correlation threshold (Figure 4). As expected, increasing the threshold reduced overall connectivity, clustering, and global efficiency in both groups, reflecting more edges being pruned at higher thresholds and sparser connectivity. However, the rate of decay was substantially slower in older adults, indicating that their networks retained connections and topological organization across a broader threshold range.
Across all chromophores, the exponential decay for degree density was 30-40 % lower in older adults (3.3-5.3) than in young adults (5.1-7.2; Table 2). Similar trends were observed for the average clustering coefficient and global efficiency, which also declined more gradually in older adults (CC = 1.67-1.84; efficiency = 2.22-2.59) compared with young adults (CC = 1.85-2.26; efficiency = 2.63-3.10). These slower decay dynamics suggest that the older-adult networks were denser, more locally clustered, and more globally efficient, consistent with greater structural persistence across thresholds.
In addition, the standard deviation of the degree distribution was consistently higher in older adults across all hemoglobin contrasts, indicating a more heterogeneous network topology, with a broader range of nodal connectivity strengths. Combined with the observation of increased connectivity in this group, this suggests that the network in older adults contains proportionally more highly connected hub nodes relative to the rest of the network, showing an enhanced differentiation in nodal importance within an overall denser architecture.
Within the intermediate threshold range (0.3-0.5), typically used as cutoffs in the literature, older adults showed systematically higher global network measures than young adults (Table 3). Across all hemoglobin contrasts, we measured 50-86% greater degree density, 16-43% higher clustering coefficient, and 31-75% greater global efficiency in older adults. Modularity did not differ significantly, although young adults showed slightly higher HbO and HbT values, reflecting a more segregated network structure.
Considering the different hemoglobin types, HbT consistently showed the highest absolute connectivity and efficiency, while HbR yielded the lowest, likely due to its lower signal-to-noise ratio. On the other hand, HbO exhibited the largest relative group differences. Considering that this contrast is more sensitive to vascular and extracerebral components than HbR, the biggest difference suggests that these components may contribute to the observed age effects.
3.2. Network-Specific Topology
At the mesoscopic scale, the group differences seen in global metrics were mirrored within individual networks (Figure 5). Across all hemoglobin contrasts, older adults showed higher connectivity, clustering, and efficiency in the sensorimotor, auditory, visual, FPC, and DMN networks. The largest differences occurred in the primary sensorimotor and auditory regions, suggesting that age effects on network integration and segregation are widespread rather than confined to a single system.
At a threshold of 0.3 (Figure 6a), older adults exhibited markedly denser connectivity patterns, with 139, 79, and 155 edges for HbO, HbR, and HbT, respectively, compared with 74, 43, and 101 in the young group. Both age groups displayed hubs primarily in frontal and occipital cortices (Figure 6b). While the number of hubs was comparable, we found hemispheric asymmetries: young-adult networks were more left-lateralized, whereas older-adult networks showed greater right-hemisphere dominance, especially in occipital regions.
3.3. Influence of Global Signal Regression
To evaluate whether global systemic factors explained the enhanced connectivity observed in older adults, we examined the proportion of variance removed by the first principal component during preprocessing (Figure 7). However, the variance accounted for by this component did not differ significantly between groups, ranging from 27-30% in young adults to 25-27% in older adults. The similarity in efficacy of global signal regression across groups suggests that the age-dependent alterations in large-scale connectivity described above are not due to differences in the pipeline, although contributions from vascular and extracerebral sources cannot be entirely excluded.
4. Discussion
In this work, we aimed to demonstrate the feasibility of using fNIRS to reliably capture age-related alterations in resting-state functional connectivity (rsFC). Establishing standardized methods for quantifying network topology from fNIRS data is an essential first step toward enabling its use in longitudinal and clinical contexts. Because fNIRS is portable, affordable, and tolerant to movement, it offers a unique opportunity to extend rsFC research into naturalistic and less controlled environments such as patients’ homes, day-care centers, or hospices, which can expand ageing research and increase information beyond clinical targets. Developing reference ranges and characteristic patterns of fNIRS-based graph metrics across the lifespan will be critical for future studies of neurodegenerative conditions associated with aging, including mild cognitive impairment (MCI), Alzheimer’s disease, and vascular dementia.
A fundamental observation in our study was the attenuation of LFO amplitude with age. This finding, widely reported in both fNIRS and fMRI research, is commonly attributed to reduced neurovascular coupling efficiency, diminished hemodynamic responsiveness, and impaired vascular reactivity [41,42,43,44,45]. In our data, this reduction was most pronounced within the resting-state band (0.008–0.09 Hz), where LFO power in young adults was approximately five- to six-fold higher than in older adults. The effect was consistent across the narrower bands examined, suggesting that age-related changes affect both autoregulatory fluctuations and spontaneous vascular dynamics.
Despite this attenuation, older adults exhibited denser and more globally connected networks, reflected by a slower decay of global metrics across thresholds and higher degree density, clustering, and efficiency. This counterintuitive finding may arise because fNIRS captures a composite signal comprising both neural and systemic vascular components. Lower neuronal oscillatory power might coexist with stronger inter-regional correlations driven by more coherent systemic hemodynamics, such as blood-pressure oscillations or altered cerebrovascular autoregulation. Thus, the coexistence of reduced LFO power and increased network connectivity may represent a physiological coupling between systemic and neural components that becomes more pronounced with age. Future studies integrating concurrent physiological monitoring could help disentangle these contributions.
The reproducibility of the network architecture across all hemoglobin contrasts reinforces the capability of fNIRS to capture large-scale functional organization even with a sparse probe arrangement and limited spatial resolution, consistent with previous reports [29,46]. Although we were able to successfully retrieve all canonical rsFC networks that could be observed with fNIRS, their spatial distribution and relative strength differed from those typically observed with BOLD-fMRI. In fMRI, healthy aging is often characterized by reduced within-network connectivity and increased between-network coupling, particularly between the default mode (DMN) and frontoparietal control (FPC) networks [4,13,14]. In contrast, our fNIRS-based results revealed globally higher connectivity and efficiency in older adults, suggesting that fNIRS networks may emphasize vascular and systemic coherence more than the neuronal synchronization detected by fMRI. The limited number of channels and their concentration over superficial cortical regions likely contribute to these differences, as fNIRS does not probe subcortical or deep cortical regions typically involved in fMRI rsFC analyses.
Interestingly, similar hyperconnectivity has been reported in fNIRS studies of pathological aging. Individuals with Alzheimer’s disease or MCI often show increased network density and efficiency relative to healthy controls [47,48]. These patterns have been interpreted as compensatory or dedifferentiation responses to reduced neuronal specialization, possibly mediated by altered neurovascular coupling. Our results suggest that a comparable phenomenon may also be present in normal aging, indicating that fNIRS is sensitive to early or subclinical functional changes. When examined across multiple graph metrics, the networks of older adults decayed more slowly with increasing threshold and could be described as denser (higher degree density), more heterogeneous (greater degree variance), more locally integrated (higher clustering coefficient), and more globally efficient (higher global efficiency). These factors might suggest both increased redundancy and reduced network segregation. Together, these metrics provide a comprehensive description of fNIRS-derived network reorganization with aging.
Our findings also highlight important methodological considerations for interpreting fNIRS-based connectivity. Although principal component analysis (PCA) effectively reduced global systemic contributions, removing only the first component might have been insufficient, as it cannot entirely eliminate physiological confounds such as respiration, blood-pressure oscillations, or extracerebral hemodynamics [49,50]. The proportion of variance removed by the first component did not differ significantly between groups, suggesting that residual systemic effects alone do not explain the observed differences. Nevertheless, systemic physiology likely modulates network correlations differently across the lifespan, particularly given age-related vascular changes. Rather than viewing this solely as a limitation, such sensitivity may represent a unique advantage of fNIRS: the ability to capture both neural and vascular dimensions of connectivity, potentially enhancing its predictive value for diseases with mixed neurovascular pathology.
Importantly, it is unlikely that the absence of short-separation detectors substantially affected our main results. Previous work indicates that rsFC and graph metrics derived using PCA are comparable to those obtained with short-channel regression at the group level [29]. Moreover, recent studies employing multi-distance separations have reported similar overall increases in connectivity among cognitively impaired older adults [47,51]. Other design factors, such as sample size, sex distribution, and cortical coverage, may therefore have greater influence on generalizability. In particular, unequal gender representation could bias vascular responses, and the restricted coverage limits assessment of networks involving subcortical structures [41,52,53]. Future studies combining fNIRS with other neuroimaging modalities and/or physiological recordings could better isolate neuronal from systemic signals and extend coverage to subcortical regions. In addition, longitudinal designs are key to determining whether the observed network patterns predict cognitive decline or reflect compensatory reorganization.
5. Conclusions
Overall, our results provide evidence that fNIRS can detect reproducible age-related differences in the topology of resting-state networks. Older adults showed denser and more integrated fNIRS-based networks despite reduced oscillatory power, suggesting a complex interplay between neural and vascular factors. By characterizing how graph-theoretical metrics manifest in fNIRS data, we believe that this work contributes to laying the groundwork for using portable optical neuroimaging to monitor functional brain organization throughout the aging process and in neurodegenerative disease. Going forward, understanding the effects of fNIRS setups (e.g., channel density and location) on the variability of the network metrics will be key to ensuring reproducibility and comparability across fNIRS studies. In addition, larger normative datasets spanning different age groups can help define reference ranges for network density, clustering, and efficiency, serving as benchmarks for clinical research.
Author Contributions
Conceptualization, F.C., C.Y., and R.C.M.; methodology, R.C.M., R.F., and S.N.; formal analysis, V.S., A.C., and S.N.; data curation, A.C., A.Q., and S.N.; writing—original draft preparation, V.S.; writing—review and editing, R.C.M.; visualization, V.S. and R.C.M.; supervision, R.C.M., C.Y., and F.C.; project administration, R.C.M.; funding acquisition, R.C.M. and F.C. All authors have read and agreed to the published version of the manuscript.
Funding
This work was funded by the São Paulo Research Foundation (FAPESP), Brazil (Process #2013/07559-3 and #2012/02500-8). The authors also thank the Coordination for the Improvement of Higher Level Personnel (CAPES), Finance Code 001, for PhD funding.
Institutional Review Board Statement
The study was conducted in accordance with the Declaration of Helsinki, and approved by the Ethics Committee of the University of Campinas, where the experiments were carried out (protocol #56602516.2.0000.5404, approved on 07 February 2017).
Informed Consent Statement
Informed consent was obtained from all subjects involved in the study.
Data Availability Statement
Data and code are available upon request.
Acknowledgments
During the preparation of this manuscript/study, the author(s) used Grammarly for the purposes of text editing. The authors have reviewed and edited the output and take full responsibility for the content of this publication.
Conflicts of Interest
The authors declare no conflicts of interest.
Abbreviations
The following abbreviations are used in this manuscript:
| fNIRS | Functional Near-Infrared Spectroscopy |
| rsFC | Resting state functional connectivity |
| HbO | Oxy-hemoglobin |
| HbR | Deoxy-hemoglobin |
| HbT | Total-hemoglobin |
| LFO | Low frequency oscillation |
References
- W. H. Organization. "Ageing and health." World Health Organization. https://www.who.int/news-room/fact-sheets/detail/ageing-and-health (accessed October 1, 2025).
- W. Bai et al., "Worldwide prevalence of mild cognitive impairment among community dwellers aged 50 years and older: a meta-analysis and systematic review of epidemiology studies," Age and ageing, vol. 51, no. 8, p. afac173, 2022, doi: 10.1093/ageing/afac173. [CrossRef]
- N. Salari et al., "The global prevalence of mild cognitive impairment in geriatric population with emphasis on influential factors: a systematic review and meta-analysis," BMC geriatrics, vol. 25, no. 1, p. 313, 2025, doi: 10.1186/s12877-025-05967-w. [CrossRef]
- J. S. Damoiseaux, "Effects of aging on functional and structural brain connectivity," Neuroimage, vol. 160, pp. 32-40, 2017, doi: 10.1016/j.neuroimage.2017.01.077. [CrossRef]
- M. Fjell and K. B. Walhovd, "Structural brain changes in aging: courses, causes and cognitive consequences," Reviews in the Neurosciences, vol. 21, no. 3, pp. 187-222, 2010, doi: 10.1515/revneuro.2010.21.3.187. [CrossRef]
- L. L. Beason-Held et al., "Changes in brain function occur years before the onset of cognitive impairment," Journal of Neuroscience, vol. 33, no. 46, pp. 18008-18014, 2013, doi: 10.1523/JNEUROSCI.1402-13.2013. [CrossRef]
- J. D. Power, B. L. Schlaggar, and S. E. Petersen, "Studying brain organization via spontaneous fMRI signal," Neuron, vol. 84, no. 4, pp. 681-696, 2014, doi: 10.1016/j.neuron.2014.09.007. [CrossRef]
- M. P. van den Heuvel and H. E. H. Pol, "Exploring the brain network: A review on resting-state fMRI functional connectivity," European Neuropsychopharmacology, vol. 20, no. 8, pp. 519-534, Aug 2010, doi: 10.1016/j.euroneuro.2010.03.008. [CrossRef]
- L. Farras-Permanyer et al., "Age-related changes in resting-state functional connectivity in older adults," Neural regeneration research, vol. 14, no. 9, pp. 1544-1555, 2019, doi: 10.4103/1673-5374.255976. [CrossRef]
- N. Franzmeier et al., "Resting-state global functional connectivity as a biomarker of cognitive reserve in mild cognitive impairment," Brain imaging and behavior, vol. 11, no. 2, pp. 368-382, 2017, doi: 10.1007/s11682-016-9599-1. [CrossRef]
- Q. Lin, M. D. Rosenberg, K. Yoo, T. W. Hsu, T. P. O'Connell, and M. M. Chun, "Resting-state functional connectivity predicts cognitive impairment related to Alzheimer's disease," Frontiers in aging neuroscience, vol. 10, p. 94, 2018, doi: 10.3389/fnagi.2018.00094. [CrossRef]
- P. Ranasinghe and M. S. Mapa, "Functional connectivity and cognitive decline: A review of rs-fMRI, EEG, MEG, and graph theory approaches in aging and dementia," Exploration of Medicine, vol. 5, no. 6, pp. 797-821, 2024, doi: 10.37349/emed.2024.00256. [CrossRef]
- L. K. Ferreira and G. F. Busatto, "Resting-state functional connectivity in normal brain aging," Neuroscience & Biobehavioral Reviews, vol. 37, no. 3, pp. 384-400, 2013, doi: 10.1016/j.neubiorev.2013.01.017. [CrossRef]
- L. Geerligs, R. J. Renken, E. Saliasi, N. M. Maurits, and M. M. Lorist, "A brain-wide study of age-related changes in functional connectivity," Cerebral cortex, vol. 25, no. 7, pp. 1987-1999, 2015, doi: 10.1093/cercor/bhu012. [CrossRef]
- H. Ayaz et al., "Optical imaging and spectroscopy for the study of the human brain: status report," Neurophotonics, vol. 9, Aug 2022, doi: 10.1117/1.NPh.9.S2.S24001. [CrossRef]
- P. Pinti et al., "The present and future use of functional near-infrared spectroscopy (fNIRS) for cognitive neuroscience," Annals of the new York Academy of Sciences, vol. 1464, no. 1, pp. 5-29, 2020, doi: 10.1111/nyas.13948. [CrossRef]
- V. Quaresima and M. Ferrari, "A Mini-Review on Functional Near-Infrared Spectroscopy (fNIRS): Where Do We Stand, and Where Should We Go?," Photonics, vol. 6, no. 3, Sep 2019, Art no. 87, doi: 10.3390/photonics6030087. [CrossRef]
- C. Udina et al., "Functional near-infrared spectroscopy to study cerebral hemodynamics in older adults during cognitive and motor tasks: a review," Frontiers in aging neuroscience, vol. 11, p. 367, 2020, doi: 10.3389/fnagi.2019.00367. [CrossRef]
- L. Li et al., "Whole-cortical graphical networks at wakeful rest in young and older adults revealed by functional near-infrared spectroscopy," Neurophotonics, vol. 5, no. 3, pp. 035004-035004, 2018, doi: 10.1117/1.NPh.5.3.035004. [CrossRef]
- S. Jiang et al., "Functional connectivity and characteristics of cortical brain networks of elderly individuals under different motor cognitive tasks based on functional near-infrared spectroscopy," Frontiers in Human Neuroscience, vol. 19, p. 1563338, 2025, doi: 10.3389/fnhum.2025.1563338. [CrossRef]
- L. Blum et al., "Effects of aging on functional connectivity in a neurodegenerative risk cohort: Resting state versus task measurement using near-infrared spectroscopy," Scientific reports, vol. 12, no. 1, p. 11262, 2022, doi: 10.1038/s41598-022-13326-7. [CrossRef]
- T. J. Huppert, S. G. Diamond, M. A. Franceschini, and D. A. Boas, "HomER: a review of time-series analysis methods for near-infrared spectroscopy of the brain," Applied Optics, vol. 48, no. 10, pp. D280-D298, Apr 2009, doi: 10.1364/ao.48.00d280. [CrossRef]
- L. Pollonini, C. Olds, H. Abaya, H. Bortfeld, M. S. Beauchamp, and J. S. Oghalai, "Auditory cortex activation to natural speech and simulated cochlear implant speech measured with functional near-infrared spectroscopy," Hearing research, vol. 309, pp. 84-93, 2014, doi: 10.1016/j.heares.2013.11.007. [CrossRef]
- L. Pollonini, H. Bortfeld, and J. S. Oghalai, "PHOEBE: a method for real time mapping of optodes-scalp coupling in functional near-infrared spectroscopy," Biomedical optics express, vol. 7, no. 12, pp. 5104-5119, 2016, doi: 10.1364/BOE.7.005104. [CrossRef]
- S. L. Novi et al., "Functional near-infrared spectroscopy for speech protocols: characterization of motion artifacts and guidelines for improving data analysis," Neurophotonics, vol. 7, 1, p. 015001, 2020, doi: 10.1117/1.NPh.7.1.015001. [CrossRef]
- R. C. Mesquita, M. A. Franceschini, and D. A. Boas, "Resting state functional connectivity of the whole head with near-infrared spectroscopy," Biomedical Optics Express, vol. 1, no. 1, pp. 324-336, Aug 2010, doi: 10.1364/boe.1.000324. [CrossRef]
- S. L. Novi, R. Rodrigues, and R. C. Mesquita, "Resting state connectivity patterns with near-infrared spectroscopy data of the whole head," Biomedical Optics Express, vol. 7, no. 7, pp. 2524-2537, Jul 2016, doi: 10.1364/boe.7.002524. [CrossRef]
- B. R. White et al., "Resting-state functional connectivity in the human brain revealed with diffuse optical tomography," Neuroimage, vol. 47, no. 1, pp. 148-156, Aug 2009, doi: 10.1016/j.neuroimage.2009.03.058. [CrossRef]
- Abdalmalak et al., "Effects of Systemic Physiology on Mapping Resting-State Networks Using Functional Near-Infrared Spectroscopy," Frontiers in Neuroscience, vol. 16, Mar 2022, Art no. 803297, doi: 10.3389/fnins.2022.803297. [CrossRef]
- X. Quan et al., "Frequency-specific changes of amplitude of low-frequency fluctuations in patients with acute basal ganglia ischemic stroke," Neural plasticity, vol. 2022, no. 1, p. 4106131, 2022, doi: 10.1155/2022/4106131. [CrossRef]
- X.-N. Zuo et al., "The oscillating brain: complex and reliable," Neuroimage, vol. 49, no. 2, pp. 1432-1445, 2010, doi: 10.1016/j.neuroimage.2009.09.037. [CrossRef]
- J. W. Barker, A. Aarabi, and T. J. Huppert, "Autoregressive model based algorithm for correcting motion and serially correlated errors in fNIRS," Biomedical Optics Express, vol. 4, no. 8, pp. 1366-1379, Aug 2013, doi: 10.1364/boe.4.001366. [CrossRef]
- C. M. Aasted et al., "Anatomical guidance for functional near-infrared spectroscopy: AtlasViewer tutorial," Neurophotonics, vol. 2, no. 2, Apr-Jun 2015, Art no. 020801, doi: 10.1117/1.NPh.2.2.020801. [CrossRef]
- M. Rubinov and O. Sporns, "Complex network measures of brain connectivity: Uses and interpretations," NEUROIMAGE, vol. 52, no. 3, pp. 1059-1069, 2010-09-01 2010, doi: 10.1016/j.neuroimage.2009.10.003. [CrossRef]
- S. Achard and E. Bullmore, "Efficiency and cost of economical brain functional networks," PLoS computational biology, vol. 3, no. 2, p. e17, 2007, doi: 10.1371/journal.pcbi.0030017. [CrossRef]
- D. S. Bassett and O. Sporns, "Network neuroscience," Nature neuroscience, vol. 20, no. 3, pp. 353-364, 2017, doi: 10.1038/nn.4502. [CrossRef]
- E. Bullmore and O. Sporns, "Complex brain networks: graph theoretical analysis of structural and functional systems," Nature reviews neuroscience, vol. 10, no. 3, pp. 186-198, 2009, doi: 10.1038/nrn2575. [CrossRef]
- Fornito, Andrew Zalesky, and E. Bullmore, Fundamentals of brain network analysis. Academic press, 2016.
- M. E. Newman and M. Girvan, "Finding and evaluating community structure in networks," Physical review E, vol. 69, no. 2, p. 026113, 2004, doi: 10.1103/PhysRevE.69.026113. [CrossRef]
- R. Albert and A.-L. Barabási, "Statistical mechanics of complex networks," Reviews of modern physics, vol. 74, no. 1, p. 47, 2002, doi: 10.1103/RevModPhys.74.47. [CrossRef]
- C. Zhang, C. C. Dougherty, S. A. Baum, T. White, and A. M. Michael, "Functional connectivity predicts gender: Evidence for gender differences in resting brain connectivity," Human brain mapping, vol. 39, no. 4, pp. 1765-1776, 2018, doi: 10.1002/hbm.23950. [CrossRef]
- M. L. Schroeter, O. Schmiedel, and D. Y. von Cramon, "Spontaneous low-frequency oscillations decline in the aging brain," Journal of Cerebral Blood Flow & Metabolism, vol. 24, no. 10, pp. 1183-1191, 2004, doi: 10.1097/01.WCB.0000135231.90164.40. [CrossRef]
- S. Song et al., "Low-frequency oscillations in cerebrovascular and cardiovascular hemodynamics: Their interrelationships and the effect of age," Microvascular research, vol. 102, pp. 46-53, 2015, doi: 10.1016/j.mvr.2015.08.004. [CrossRef]
- M. D'Esposito, L. Y. Deouell, and A. Gazzaley, "Alterations in the BOLD fMRI signal with ageing and disease: a challenge for neuroimaging," Nature Reviews Neuroscience, vol. 4, no. 11, pp. 863-872, 2003, doi: 10.1038/nrn1246. [CrossRef]
- D. Kumral et al., "BOLD and EEG signal variability at rest differently relate to aging in the human brain," NeuroImage, vol. 207, p. 116373, 2020, doi: 10.1016/j.neuroimage.2019.116373. [CrossRef]
- S. L. Novi, A. C. Carvalho, R. M. Forti, F. Cendes, C. L. Yasuda, and R. C. Mesquita, "Revealing the spatiotemporal requirements for accurate subject identification with resting-state functional connectivity: a simultaneous fNIRS-fMRI study," Neurophotonics, vol. 10, no. 1, Jan 2023, Art no. 013510, doi: 10.1117/1.NPh.10.1.013510. [CrossRef]
- H. Li, X. Yang, and L. Gong, "Functional near-infrared spectroscopy for identifying mild cognitive impairment and Alzheimer's disease: a systematic review," Frontiers in Neurology, vol. 16, p. 1578375, 2025, doi: 10.3389/fneur.2025.1578375. [CrossRef]
- T. K. K. Ho et al., "Deep learning-based multilevel classification of Alzheimer’s disease using non-invasive functional near-infrared spectroscopy," Frontiers in aging neuroscience, vol. 14, p. 810125, 2022, doi: 10.3389/fnagi.2022.810125. [CrossRef]
- H. Santosa, X. Zhai, F. Fishburn, P. J. Sparto, and T. J. Huppert, "Quantitative comparison of correction techniques for removing systemic physiological signal in functional near-infrared spectroscopy studies," Neurophotonics, vol. 7, no. 3, pp. 035009-035009, 2020, doi: 10.1117/1.NPh.7.3.035009. [CrossRef]
- P. Lanka, H. Bortfeld, and T. J. Huppert, "Correction of global physiology in resting-state functional near-infrared spectroscopy," Neurophotonics, vol. 9, no. 3, pp. 035003-035003, 2022, doi: 10.1117/1.NPh.9.3.035003. [CrossRef]
- E. Butters et al., "Brain Network Analysis in Alzheimer’s Disease and Mild Cognitive Impairment using High-Density Diffuse Optical Tomography," bioRxiv, p. 2025.04. 28.651132, 2025, doi: 10.1101/2025.04.28.651132. [CrossRef]
- S. Weis, K. R. Patil, F. Hoffstaedter, A. Nostro, B. Yeo, and S. B. Eickhoff, "Sex classification by resting state brain connectivity," Cerebral cortex, vol. 30, no. 2, pp. 824-835, 2020, doi: 10.1093/cercor/bhz129. [CrossRef]
- D. Tomasi and N. D. Volkow, "Gender differences in brain functional connectivity density," Human brain mapping, vol. 33, no. 4, pp. 849-860, 2012, doi: 10.1002/hbm.21252. [CrossRef]
Figure 1.
Topographical layout of the fNIRS probe configuration. (a) The source-detector configuration included 16 sources (red) and 32 detectors (blue), resulting in a total of 64 source-detector pairs (i.e., channels, yellow lines) with a source-detector separation of approximately 3 cm. (b) The sensitivity profile of the regions measured by the optical probe layout, which was obtained through Monte Carlo simulation.
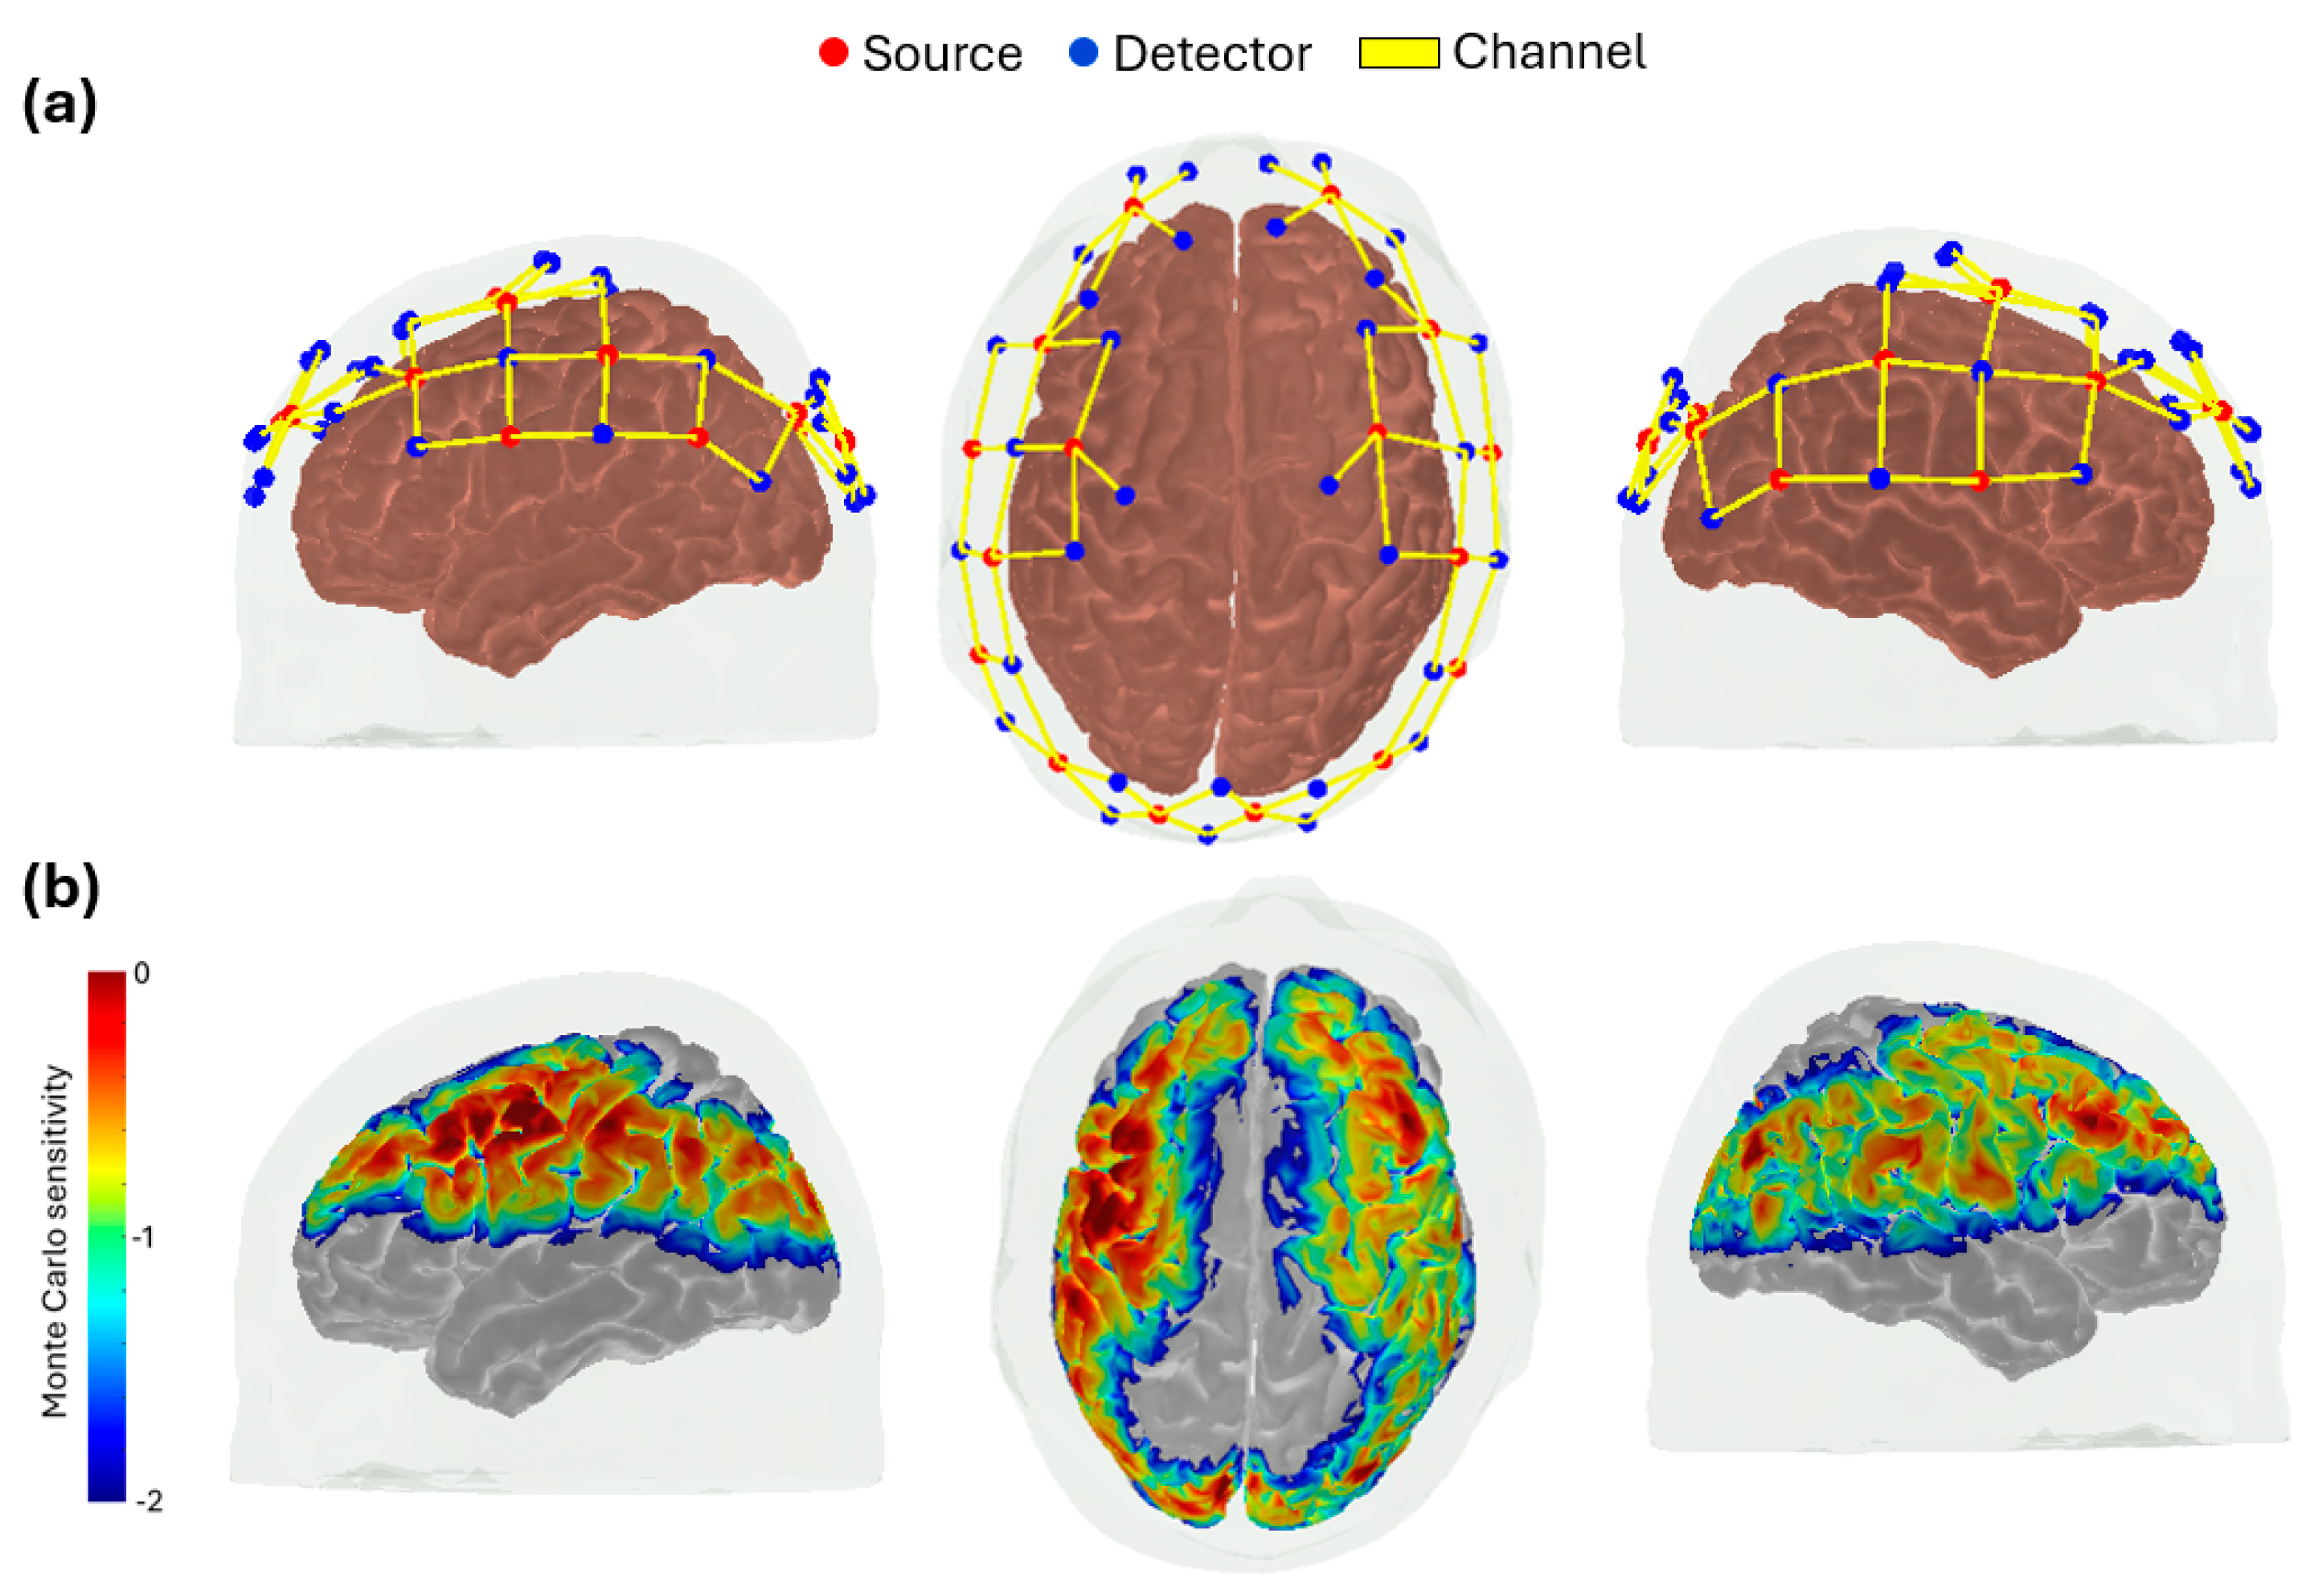
Figure 2.
Low-frequency oscillation (LFO) power for young adults (YA) and older adults (OA) across three frequency bands: (a) Band V (0.010-0.027 Hz), (b) Band IV (0.027-0.073 Hz), and (c) full resting-state LFO range (0.009-0.08 Hz). Results are shown separately for oxy-hemoglobin (HbO), deoxy-hemoglobin (HbR), and total hemoglobin (HbT).
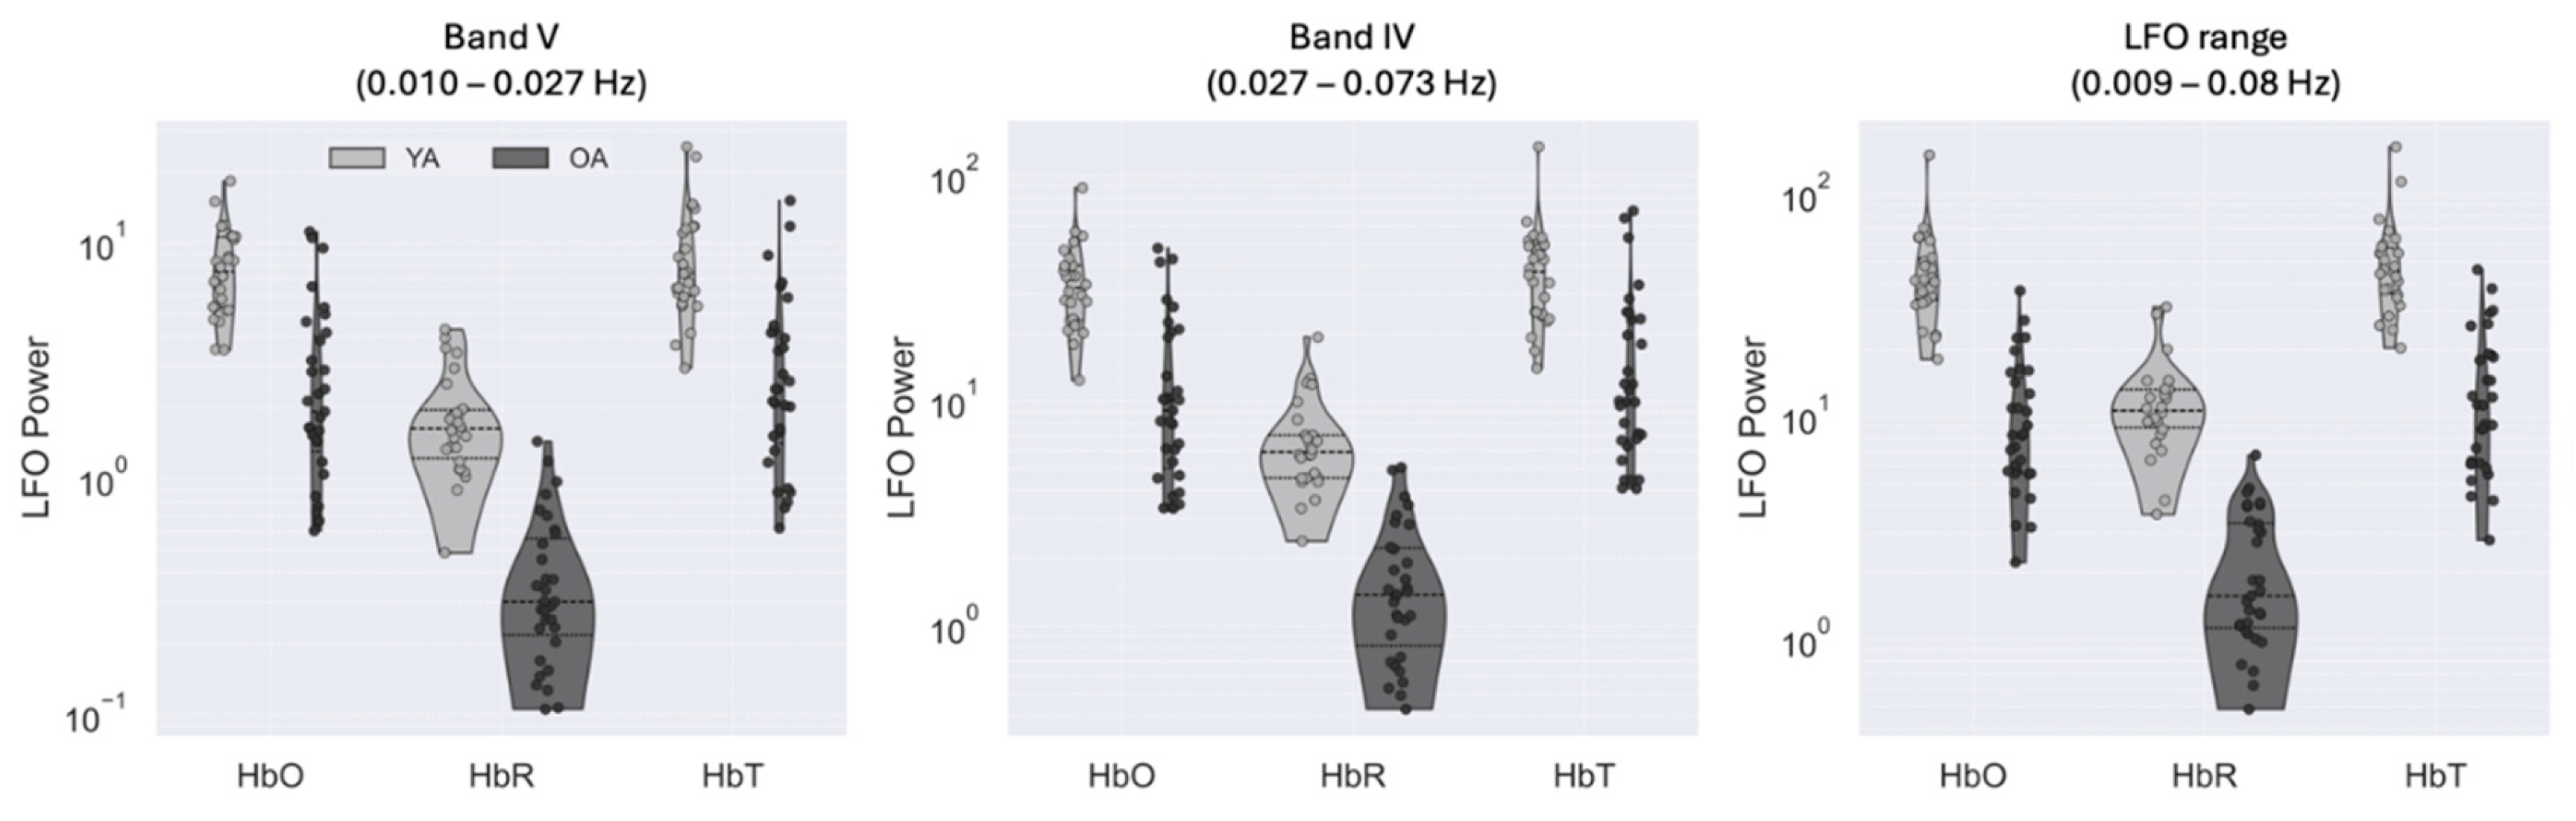
Figure 3.
Resting-state functional connectivity (rsFC) networks obtained with fNIRS for both young adults (YA) and older adults (OA), as well as the combined cohort (Y&O), across all hemoglobin contrasts. The top row shows the cortical projection of the fNIRS channel used as a reference (seed). (FPC: fronto-parietal control network; DMN: default-mode network.).
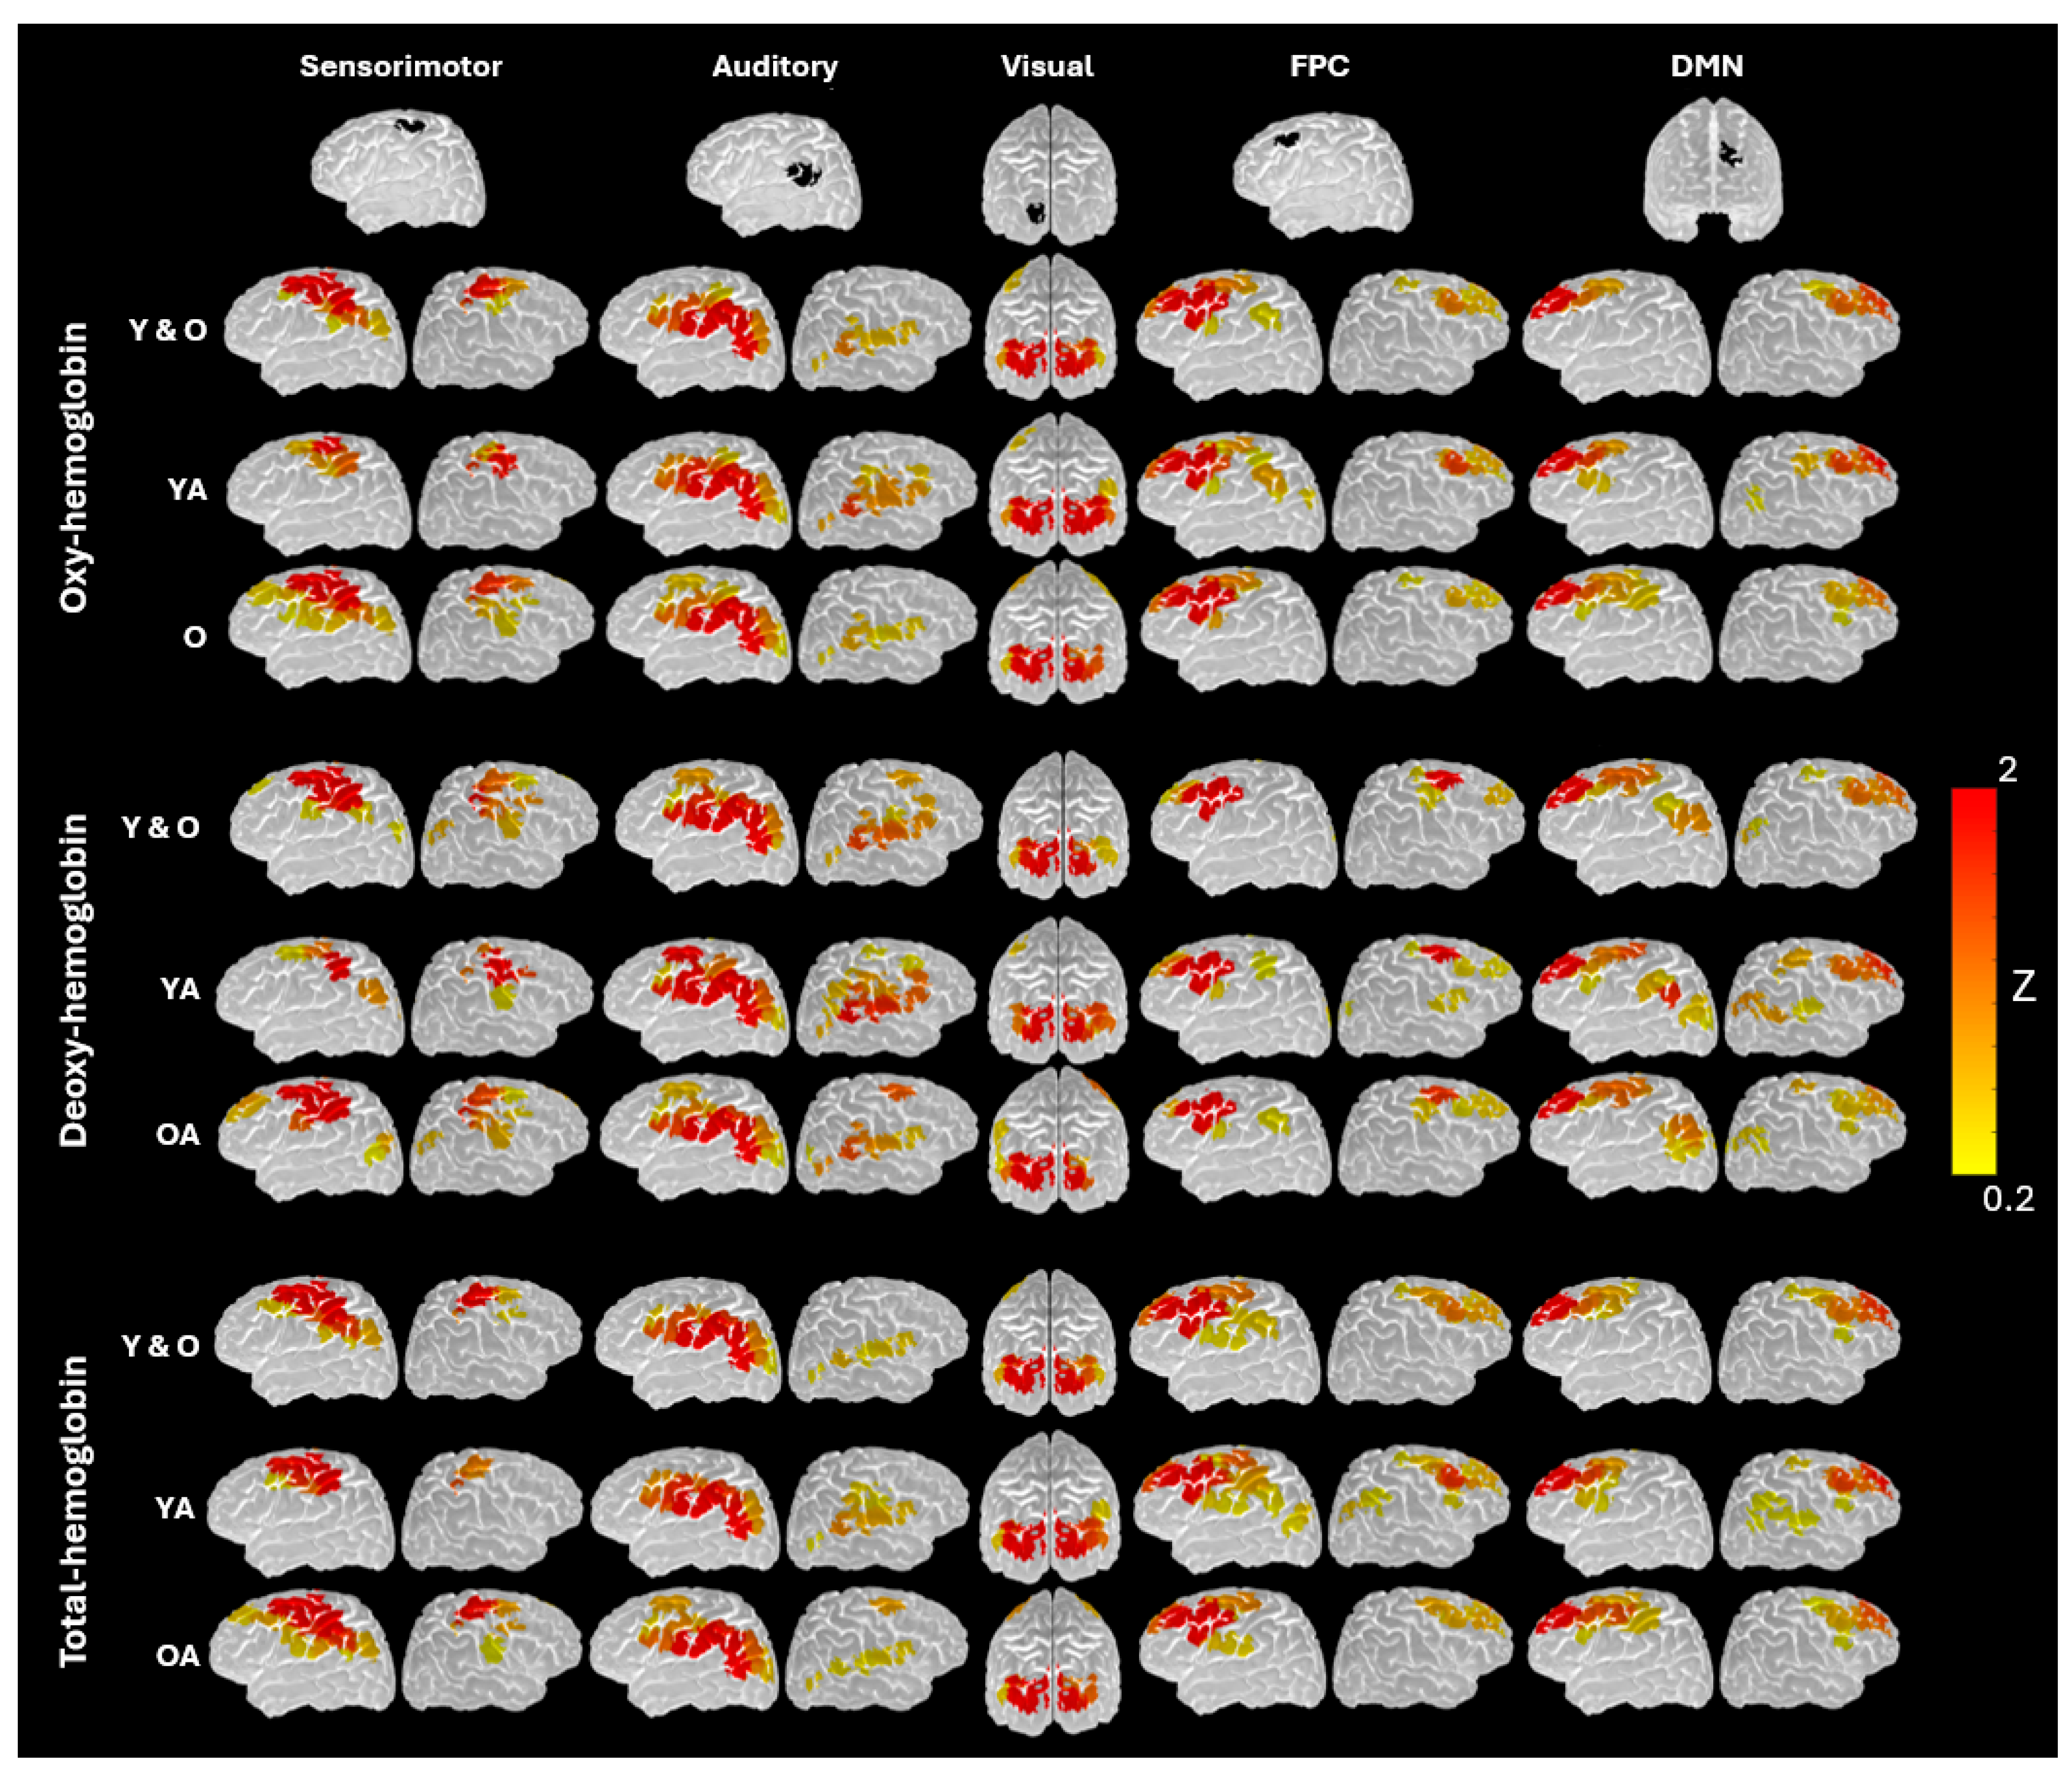
Figure 4.
Threshold-dependent evolution of global network topology. Macroscopic graph properties were derived from the network for each age group across different thresholds. Error bars represent the standard error across subjects, and the shaded area indicates the threshold range where the younger group's graph properties differ significantly from those of the older group.
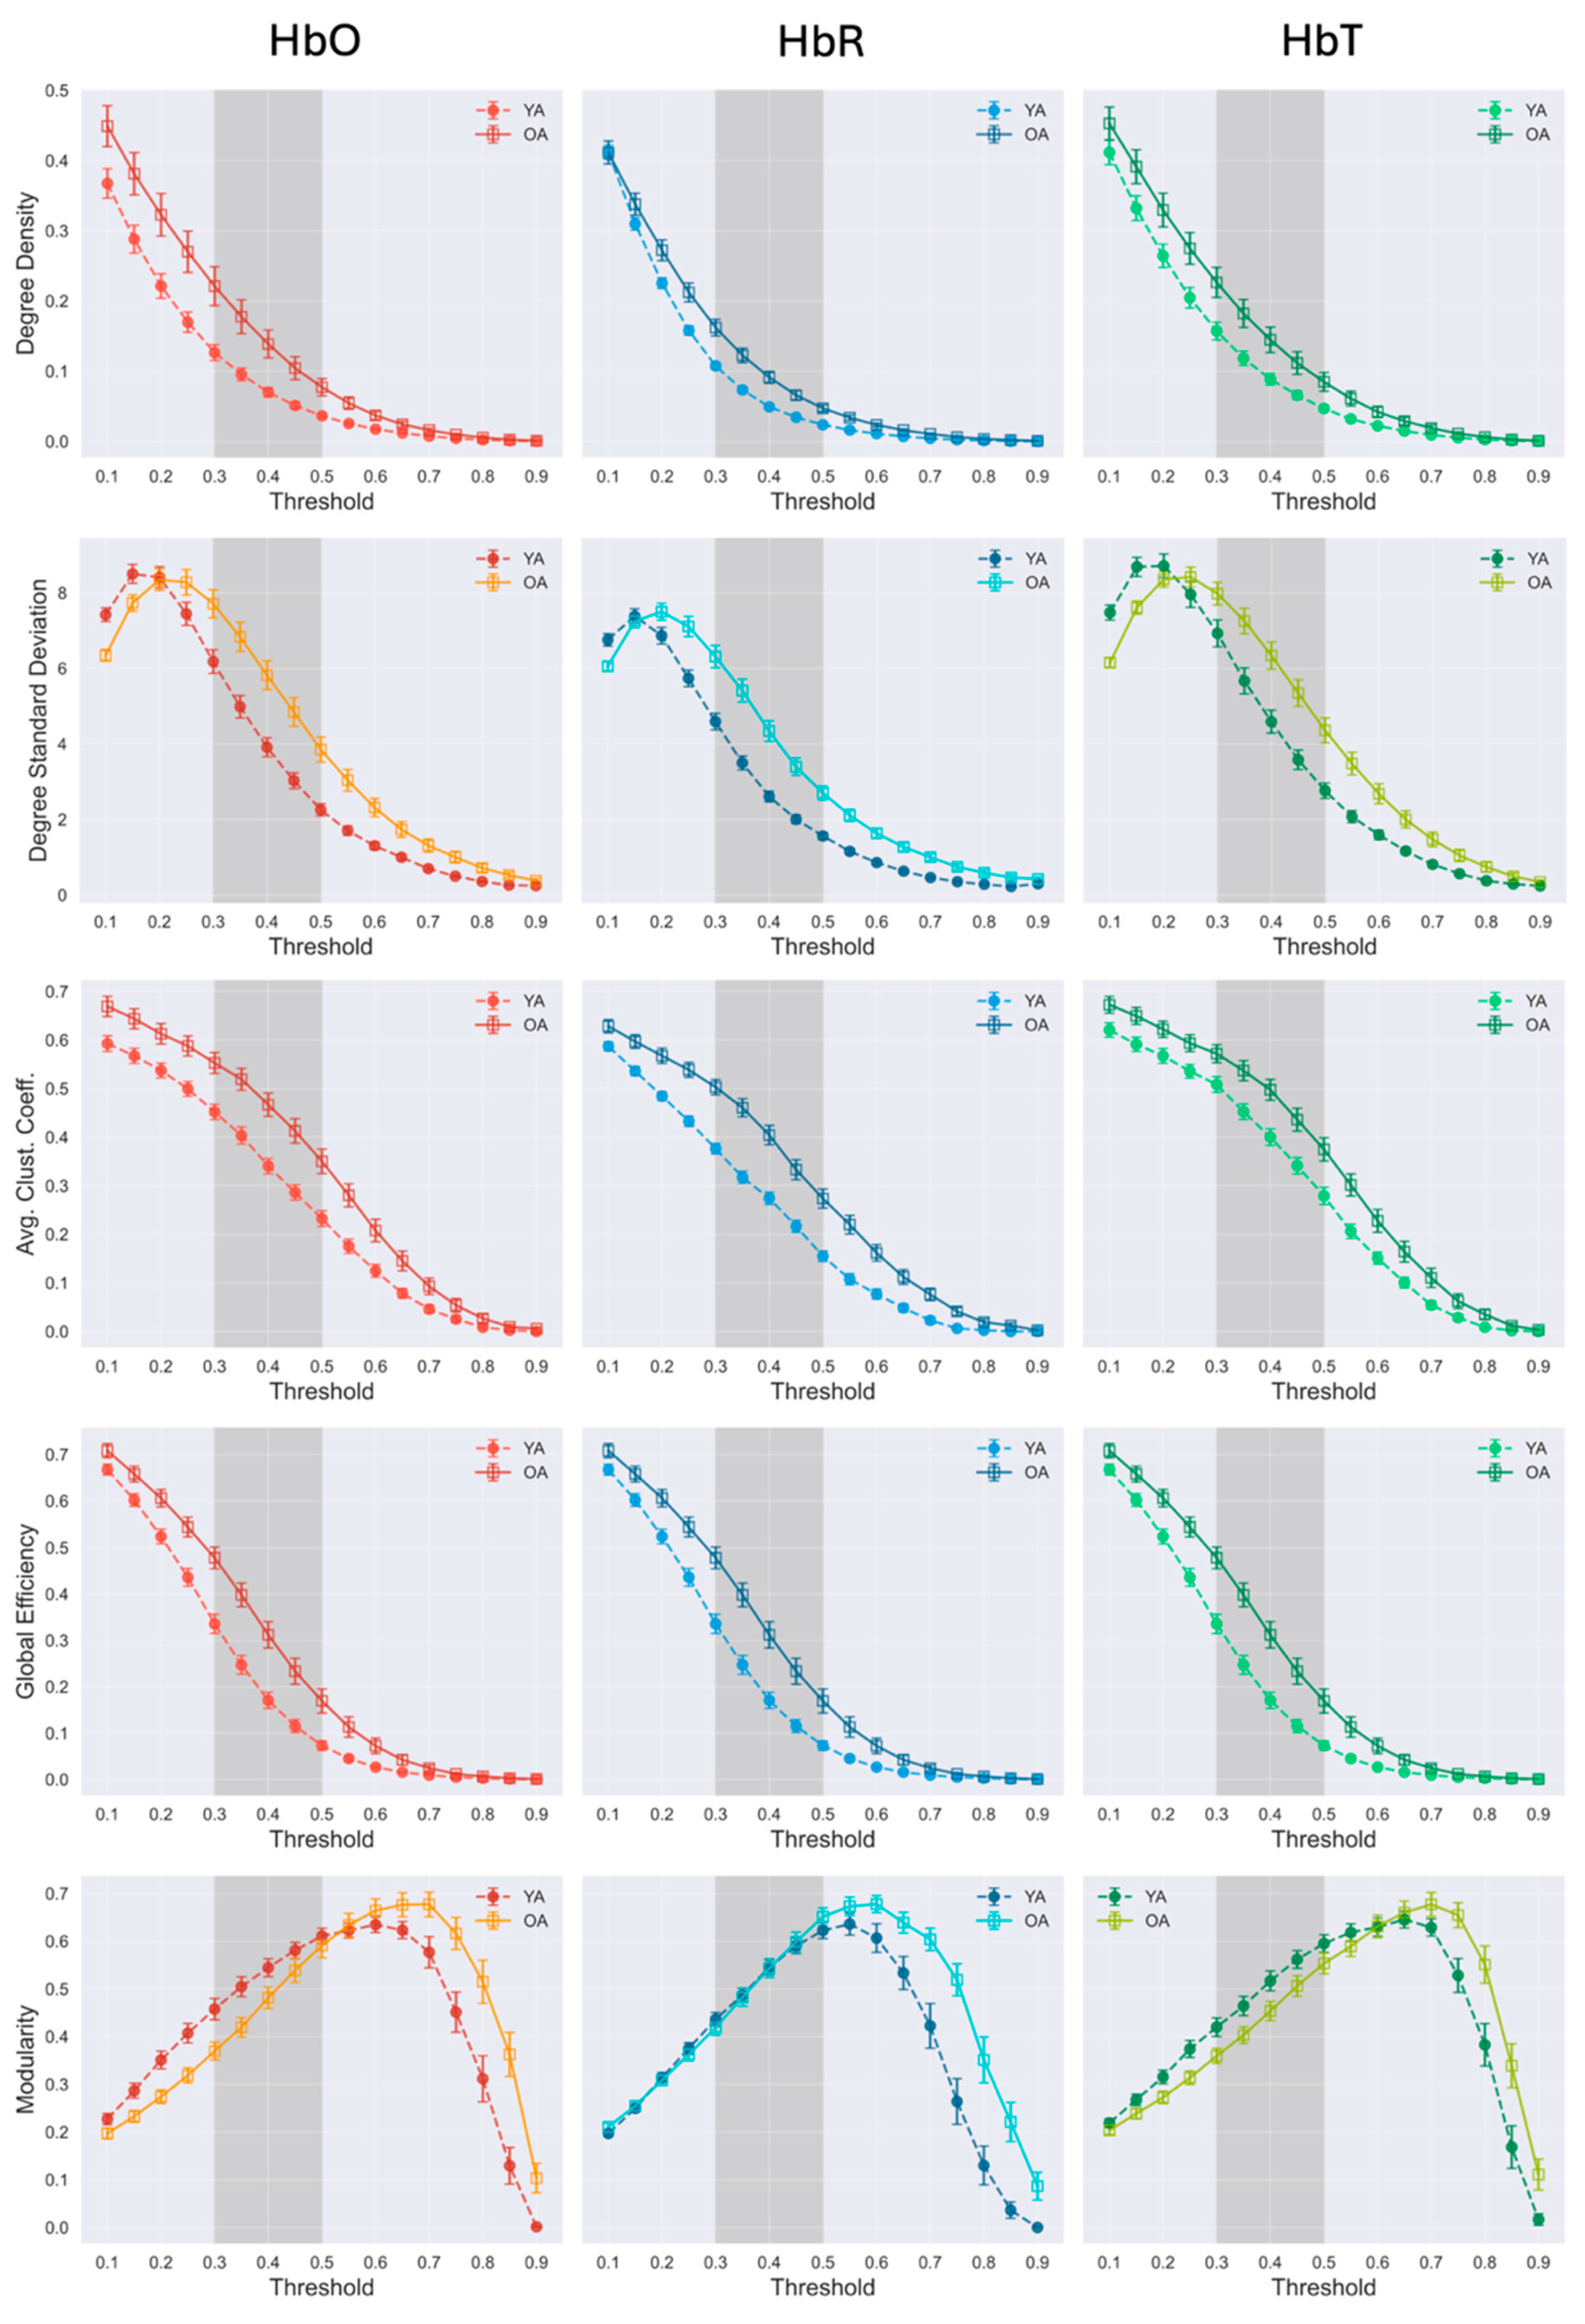
Figure 5.
Network-specific topology reveals widespread age-related increases in connectivity across canonical resting-state networks. All global metrics comparing young adults (YA) and older adults (OA) across five major rsFC networks: sensorimotor, auditory, visual, frontoparietal control (FPC), and default mode network (DMN). Each panel displays results for all three hemoglobin contrasts (HbO, HbR, HbT).
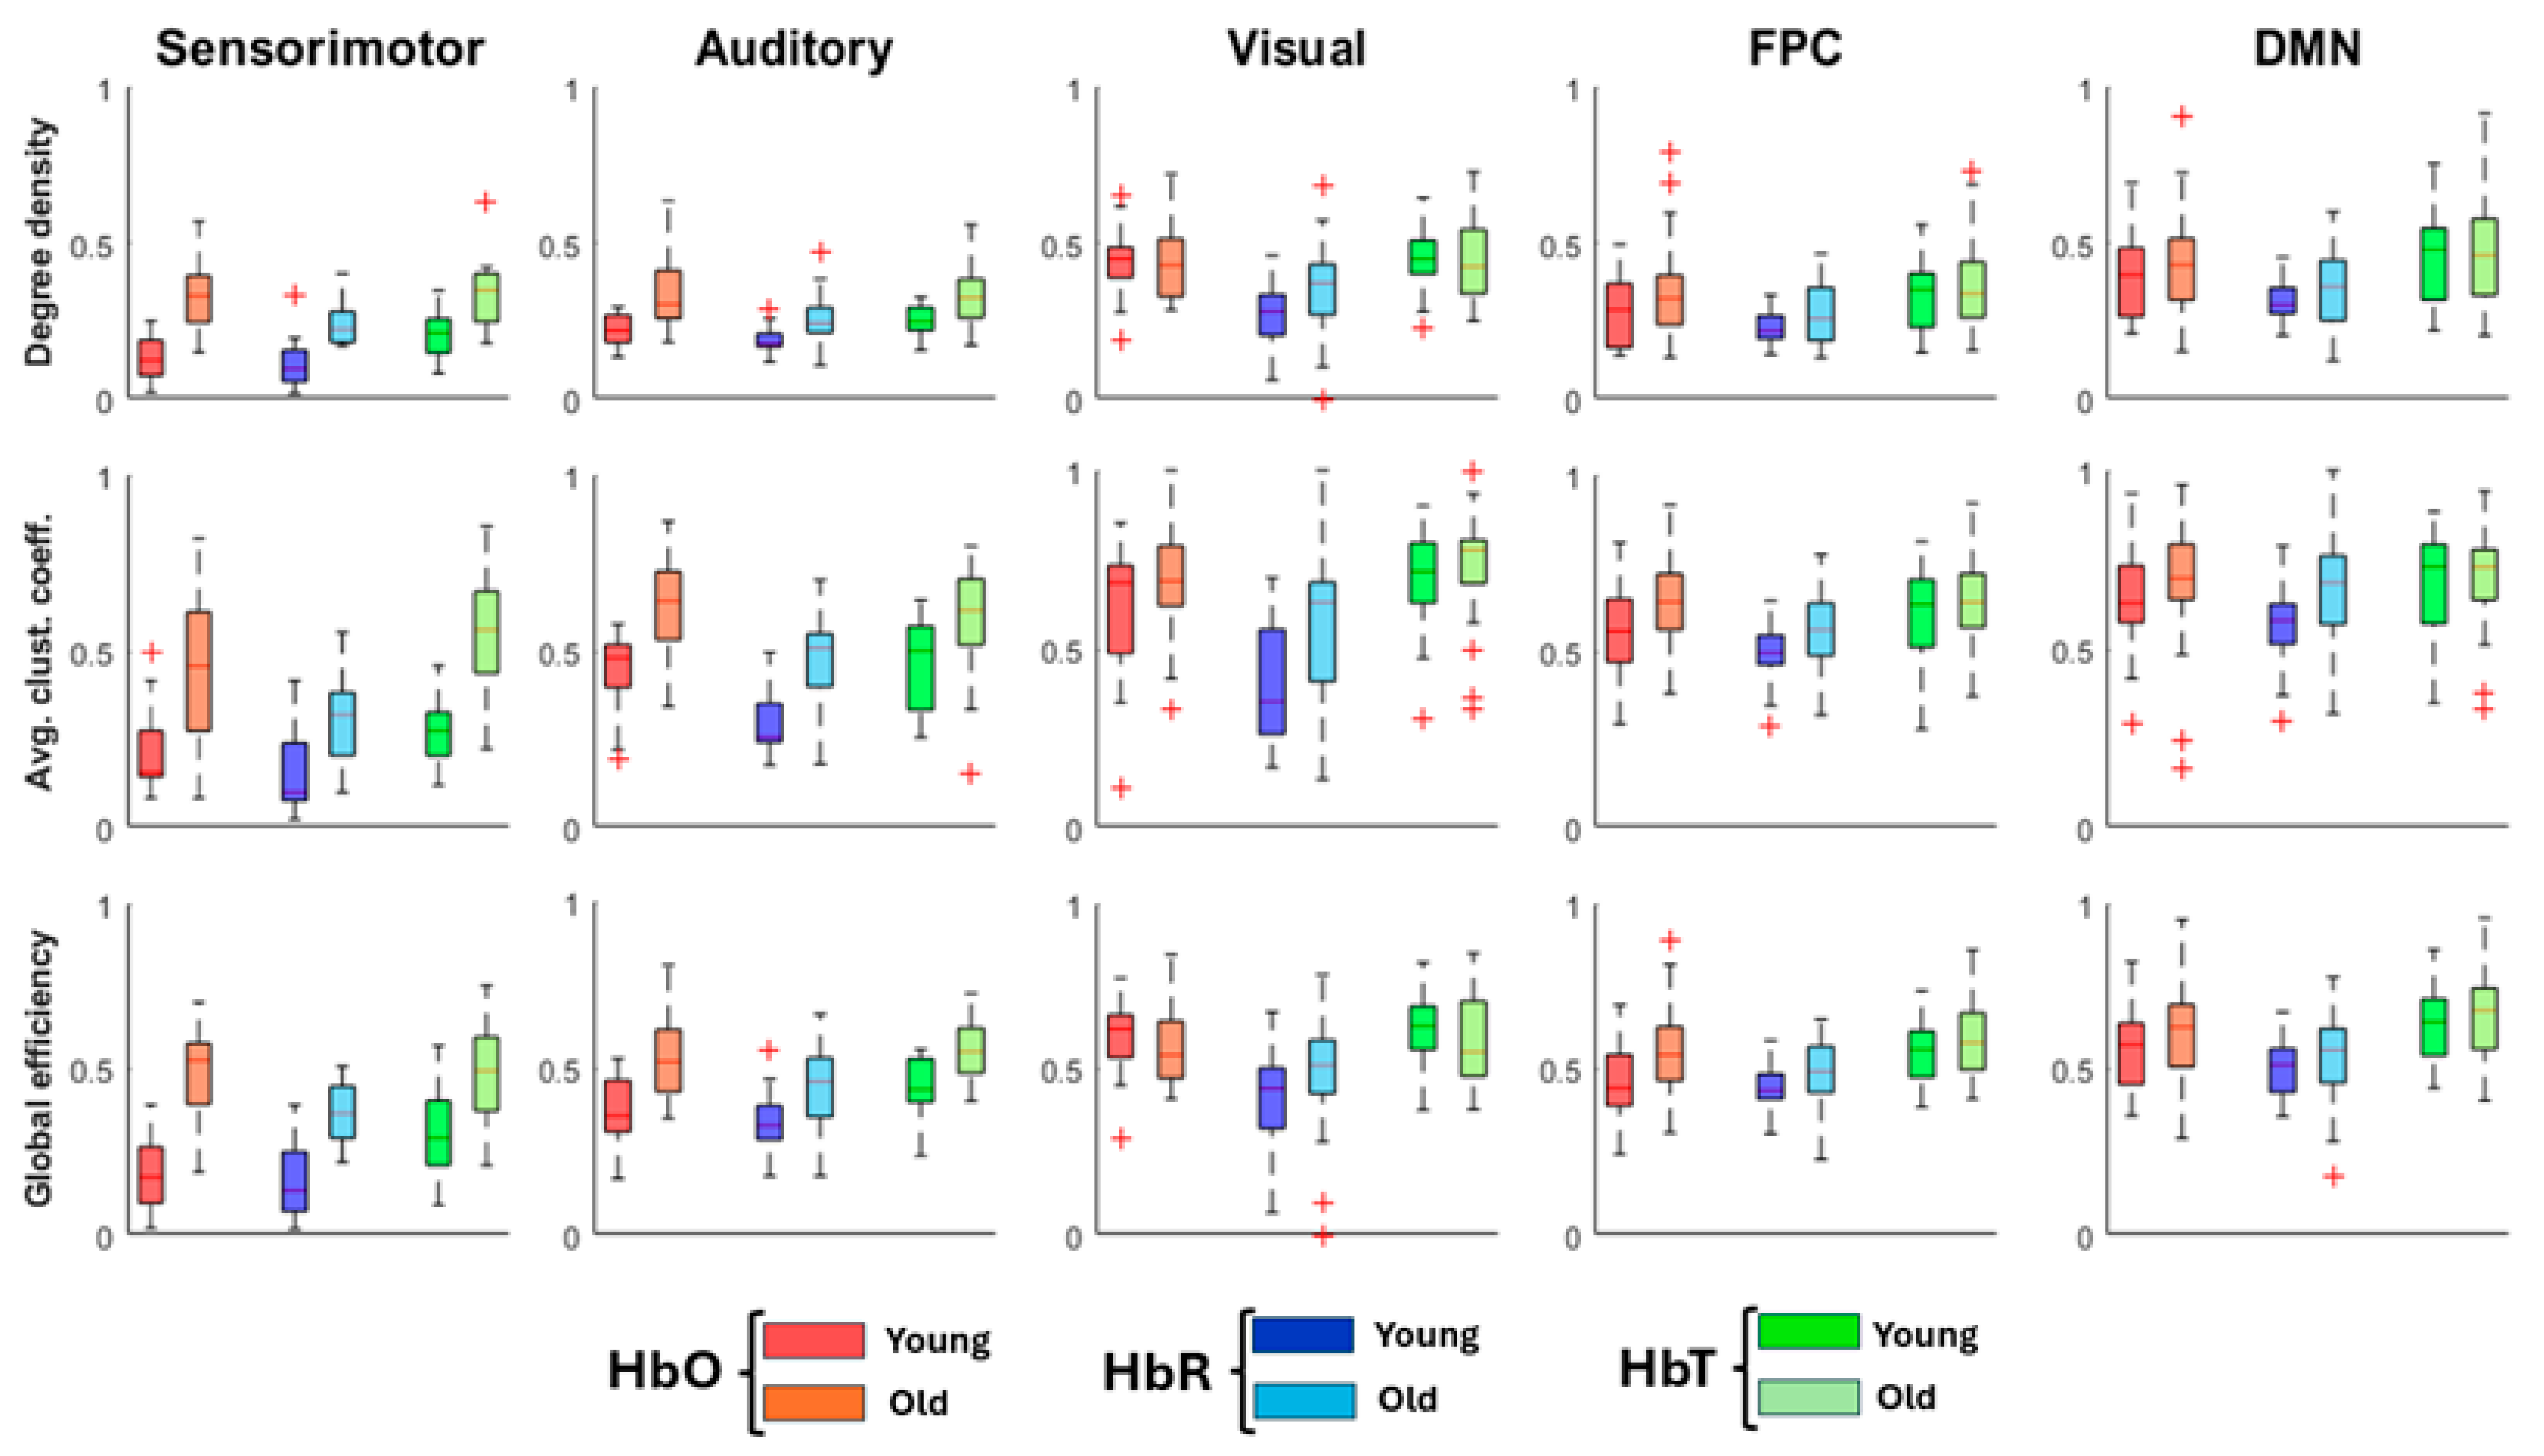
Figure 6.
(a) Adjacency matrices for age groups (young and old adults). 3D plots of the network, where the correlation coefficients are represented as links (red for HbO, blue for HbR, and green for HbT), considering 0.1 as the threshold and black points represent the nodes. (b) The brain maps show the spatial distribution of hubs across the networks for each hemoglobin type (HbO, HbR, and HbT) and age group (young and old adults). Nodes were considered Hubs if their connectivity (degree) is ≥ 1 standard deviation above the mean of the network. These nodes are visualized as colored points on the brain map.
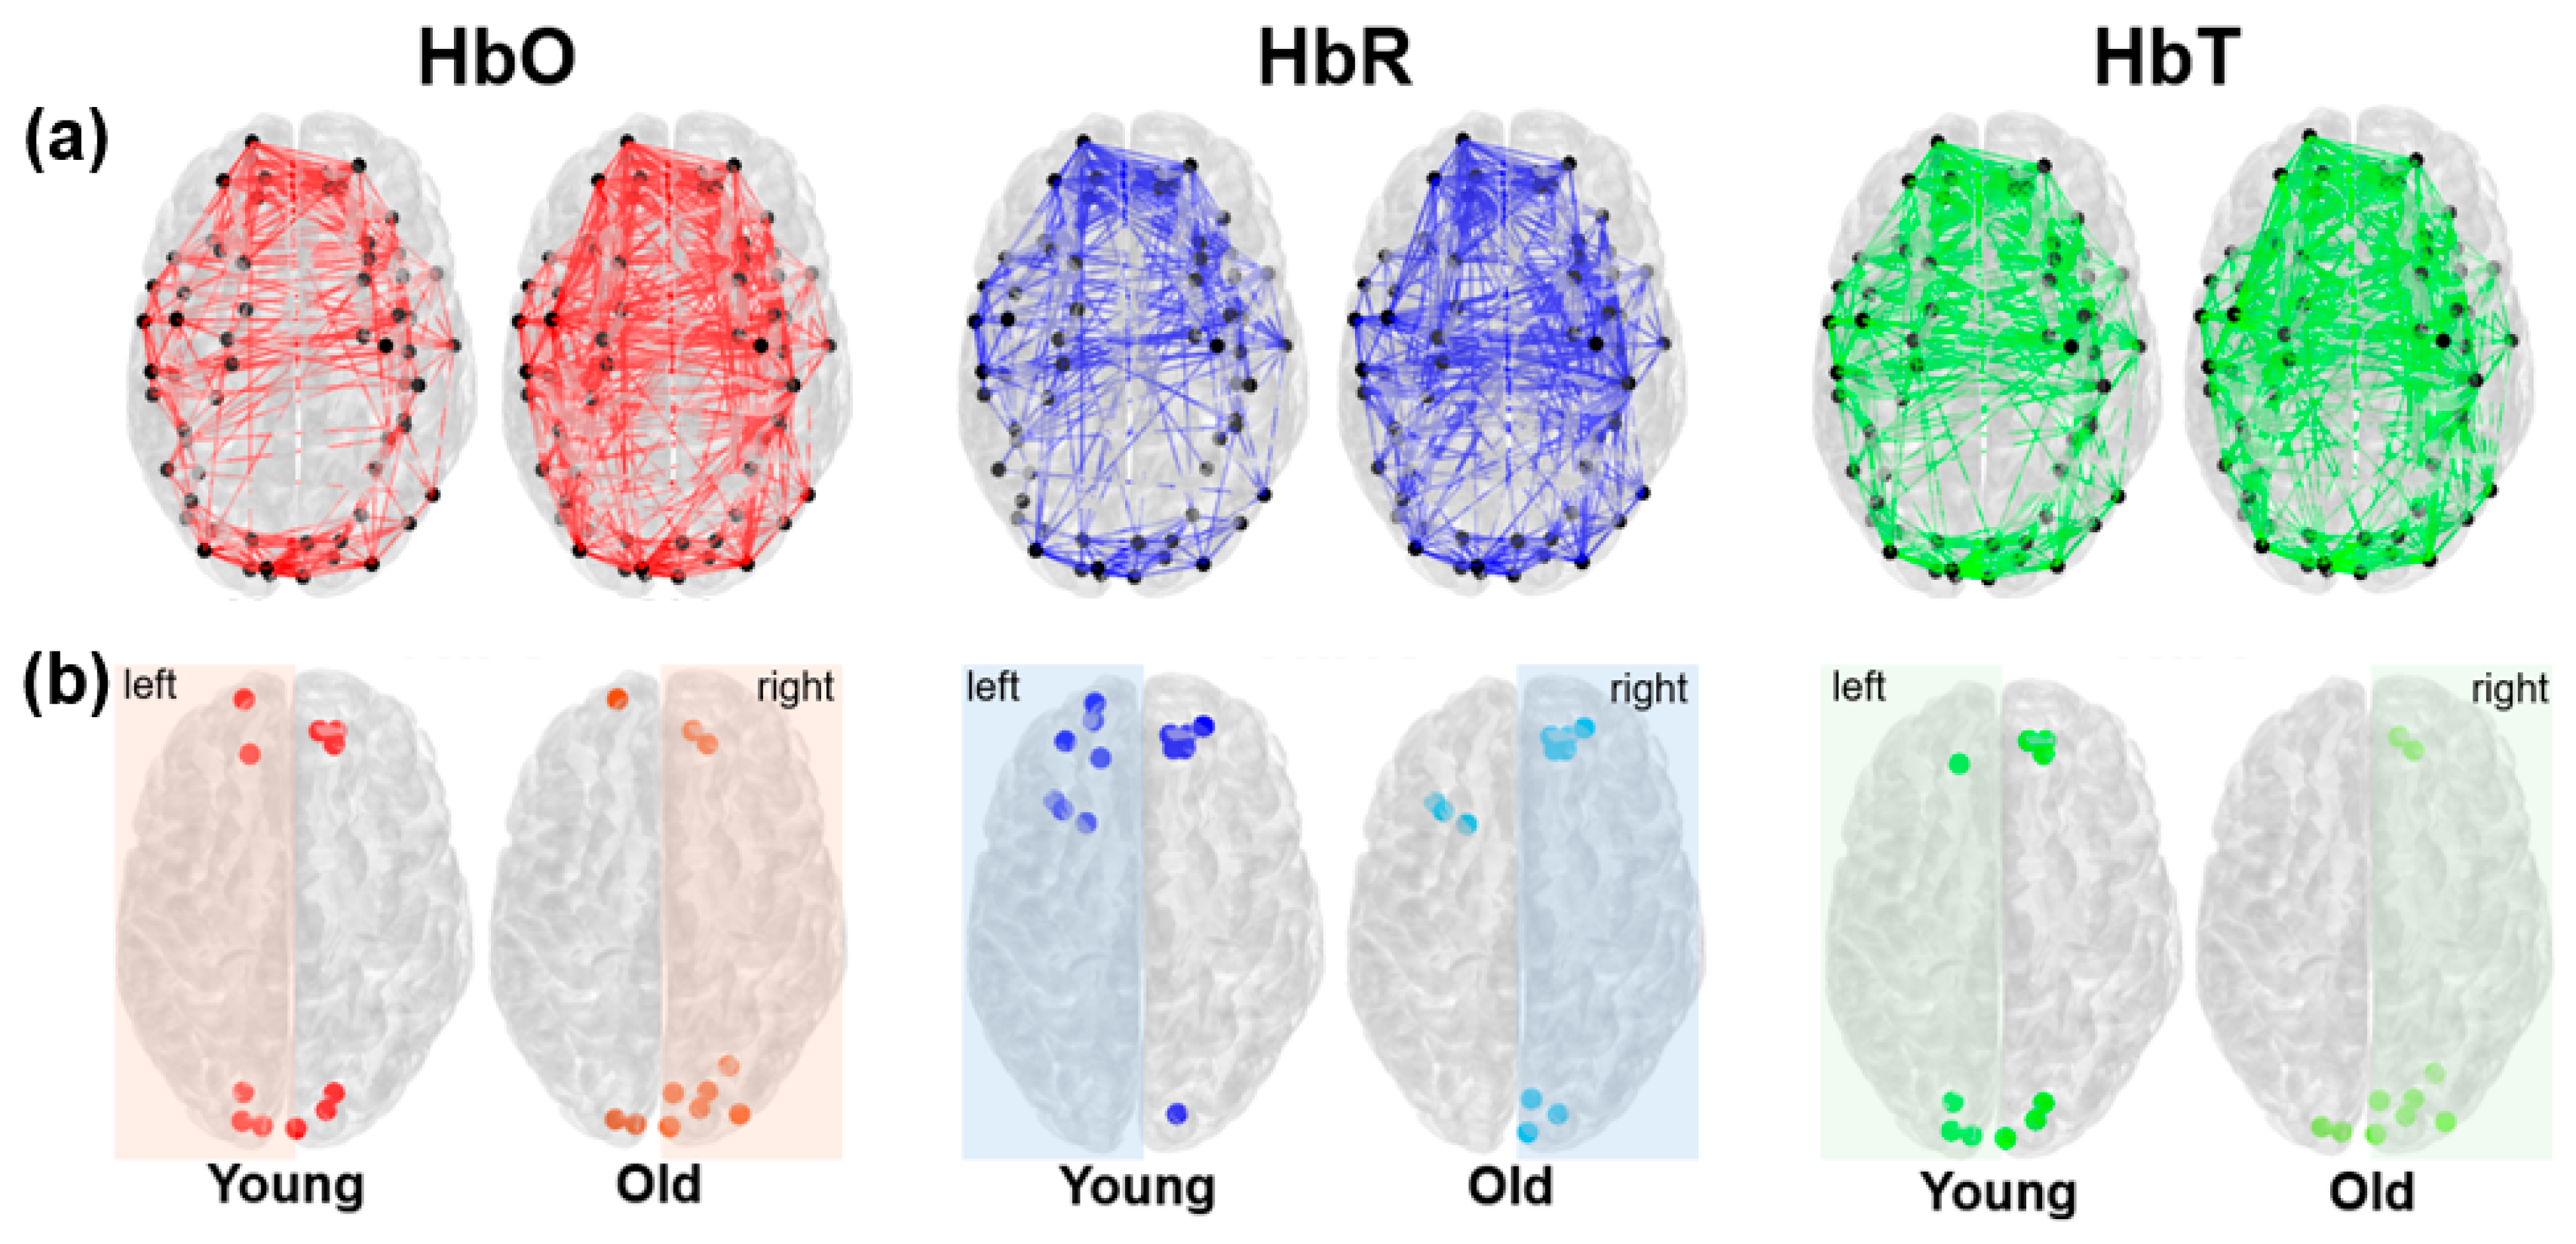
Figure 7.
Box plots showing the percentage of total signal variance explained by the first principal component (PC1) for each hemoglobin contrast in young adults (YA) and older adults (OA). PC1 was removed during preprocessing to reduce global systemic physiological interference. No significant between-group differences were observed, with PC1 accounting for 25-30% of variance in both groups.
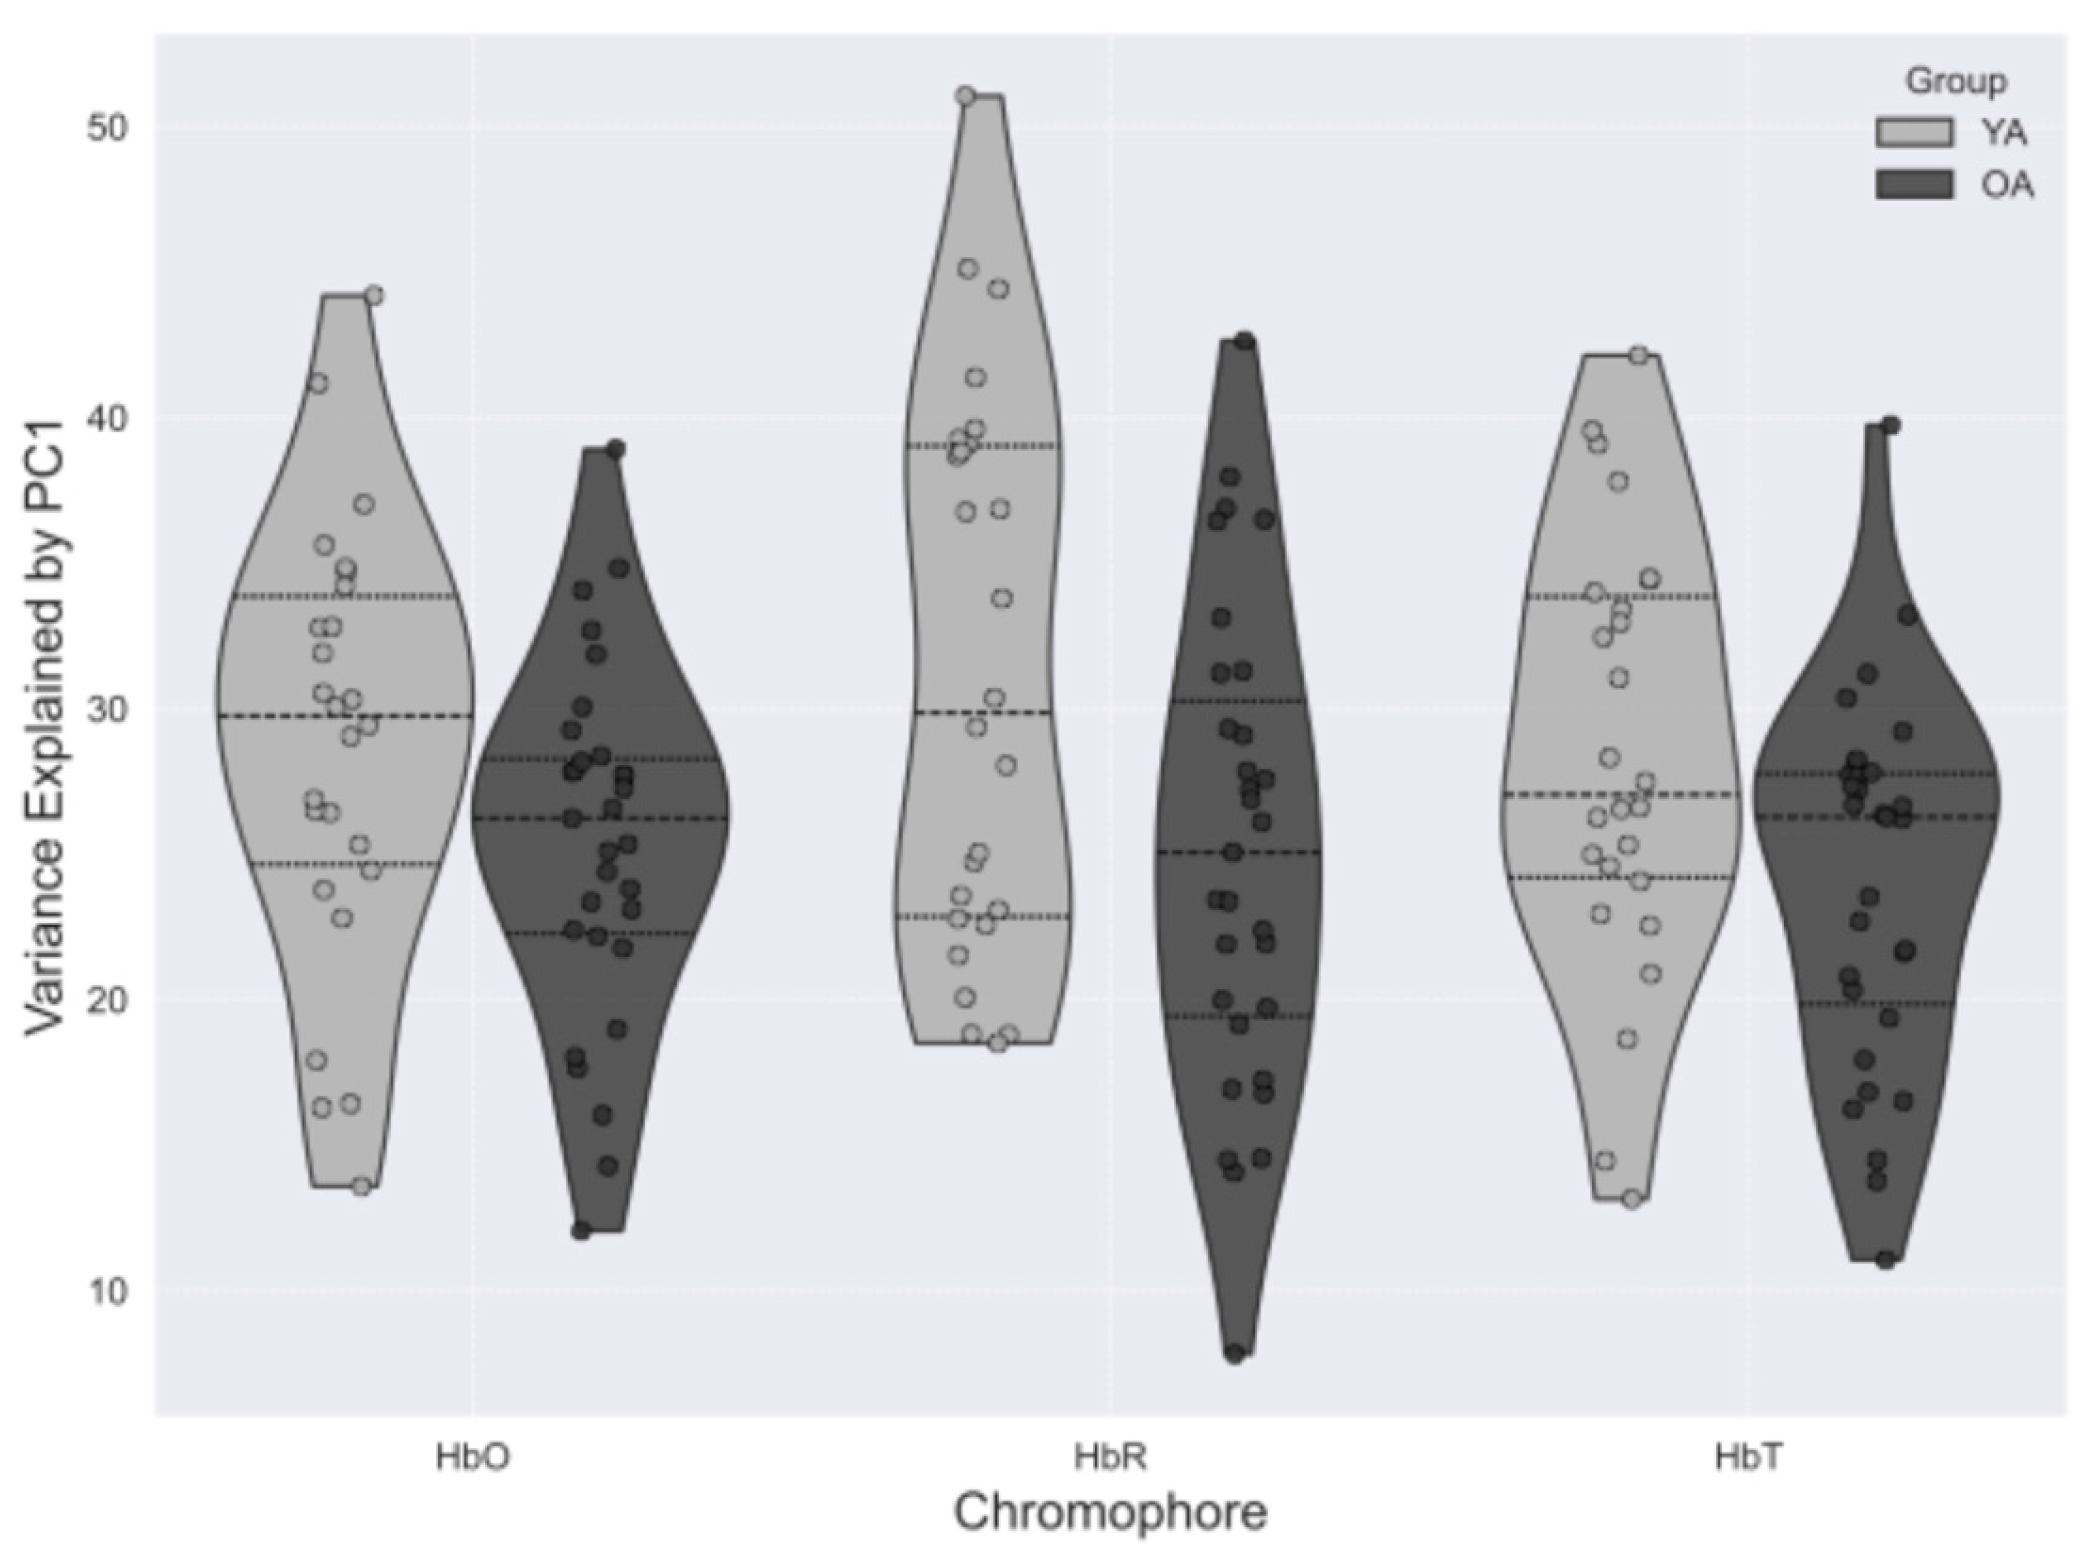

Table 1.
Low-frequency oscillation (LFO) power across different spectral ranges for both groups, separated by hemoglobin contrast. Values represent the median across all participants, along with the first and third percentiles.
Table 1.
Low-frequency oscillation (LFO) power across different spectral ranges for both groups, separated by hemoglobin contrast. Values represent the median across all participants, along with the first and third percentiles.
| Resting state | Band V | Band IV | |
| HbO | |||
| YA | 40.7 [33.6 – 51.5] | 7.6 [5.4–10.6] | 31.8 [22.9–40.1] |
| OA | 8.3 [5.6 – 15.1] | 1.9 [1.3–4.0] | 9.1 [5.0–19.7] |
| HbR | |||
| YA | 10.7 [8.9 – 13.3] | 1.6 [1.1 – 3.3] | 5.9 [4.6 – 7.1] |
| OA | 1.6 [ 1.1 – 3.3] | 0.30 [0.22 – 0.56] | 1.4 [ 0.82 – 2.2] |
| HbT | |||
| YA | 45.4 [35.9 – 57.3] | 7.5 [ 5.9 – 11.6] | 37.6 [24.4 – 49.3] |
| OA | 11.3 [ 6.2 – 18.8] | 2.4 [1.4 – 4.2] | 10.0 [6.7 – 23.1] |
Table 2.
Decay rates of the macroscopic graph properties as a function of the threshold for the curves measured in Figure 4. The degree density was fitted assuming an exponential decay, while the other properties were fitted using a Weibull function.
Table 2.
Decay rates of the macroscopic graph properties as a function of the threshold for the curves measured in Figure 4. The degree density was fitted assuming an exponential decay, while the other properties were fitted using a Weibull function.
| Degree density | Avg. CC | Global Efficiency | |
| HbO | |||
| YA | 5.4 [5.3 – 5.5] | 1.97 [1.96 – 1.99] | 2.94 [2.92 – 2.95] |
| OA | 3.4 [3.3 – 3.5] | 1.72 [1.70 – 1.73] | 2.29 [2.27 – 2.30] |
| HbR | |||
| YA | 7.2 [7.0 – 7.4] | 2.26 [2.24 – 2.29] | 3.10 [3.09 – 3.12] |
| OA | 5.3 [5.0 – 5.6] | 1.84 [1.83 – 1.85] | 2.59 [2.57 – 2.60] |
| HbT | |||
| YA | 5.1 [4.9 – 5.3] | 1.85 [1.84 –1.86] | 2.63 [2.62 – 2.64] |
| OA | 3.3 [3.2 – 3.4] | 1.67 [1.65 – 1.68] | 2.22 [2.21 – 2.23] |
Table 3.
Global topological properties averaged across the 0.3-0.5 threshold range for each group and hemoglobin contrast. Values represent the median across all participants, along with the first and third percentiles.
Table 3.
Global topological properties averaged across the 0.3-0.5 threshold range for each group and hemoglobin contrast. Values represent the median across all participants, along with the first and third percentiles.
| Graph Properties | ||||
| Degree density | Avg. CC | Global Efficiency | Modularity | |
| HbO | ||||
| YA | 0.07 [0.05 – 0.10] | 0.39 [0.31 – 0.43] | 0.20 [0.14 – 0.26] | 0.55 [0.51 – 0.58] |
| OA | 0.13 [0.09 – 0.18] | 0.49 [0.42 – 0.56] | 0.34 [0.27 – 0.41] | 0.48 [0.42 – 0.54] |
| HbR | ||||
| YA | 0.06 [0.05 – 0.08] | 0.30 [0.25 – 0.34] | 0.16 [0.13 – 0.22] | 0.55 [0.49 – 0.59] |
| OA | 0.09 [0.07 – 0.12] | 0.43 [0.37 – 0.51] | 0.28 [0.21 – 0.36] | 0.54 [0.48 – 0.60] |
| HbT | ||||
| YA | 0.09 [0.07 – 0.12] | 0.43 [0.36 – 0.48] | 0.29 [0.18 – 0.34] | 0.52 [0.46 – 0.56] |
| OA | 0.16 [0.10 – 0.18] | 0.50 [0.46 – 0.57] | 0.38 [0.28 – 0.45] | 0.45 [0.40 – 0.51] |
Disclaimer/Publisher’s Note: The statements, opinions and data contained in all publications are solely those of the individual author(s) and contributor(s) and not of MDPI and/or the editor(s). MDPI and/or the editor(s) disclaim responsibility for any injury to people or property resulting from any ideas, methods, instructions or products referred to in the content. |
© 2025 by the authors. Licensee MDPI, Basel, Switzerland. This article is an open access article distributed under the terms and conditions of the Creative Commons Attribution (CC BY) license (http://creativecommons.org/licenses/by/4.0/).
Copyright: This open access article is published under a Creative Commons CC BY 4.0 license, which permit the free download, distribution, and reuse, provided that the author and preprint are cited in any reuse.


