
Submitted:
10 November 2025
Posted:
11 November 2025
You are already at the latest version
Abstract
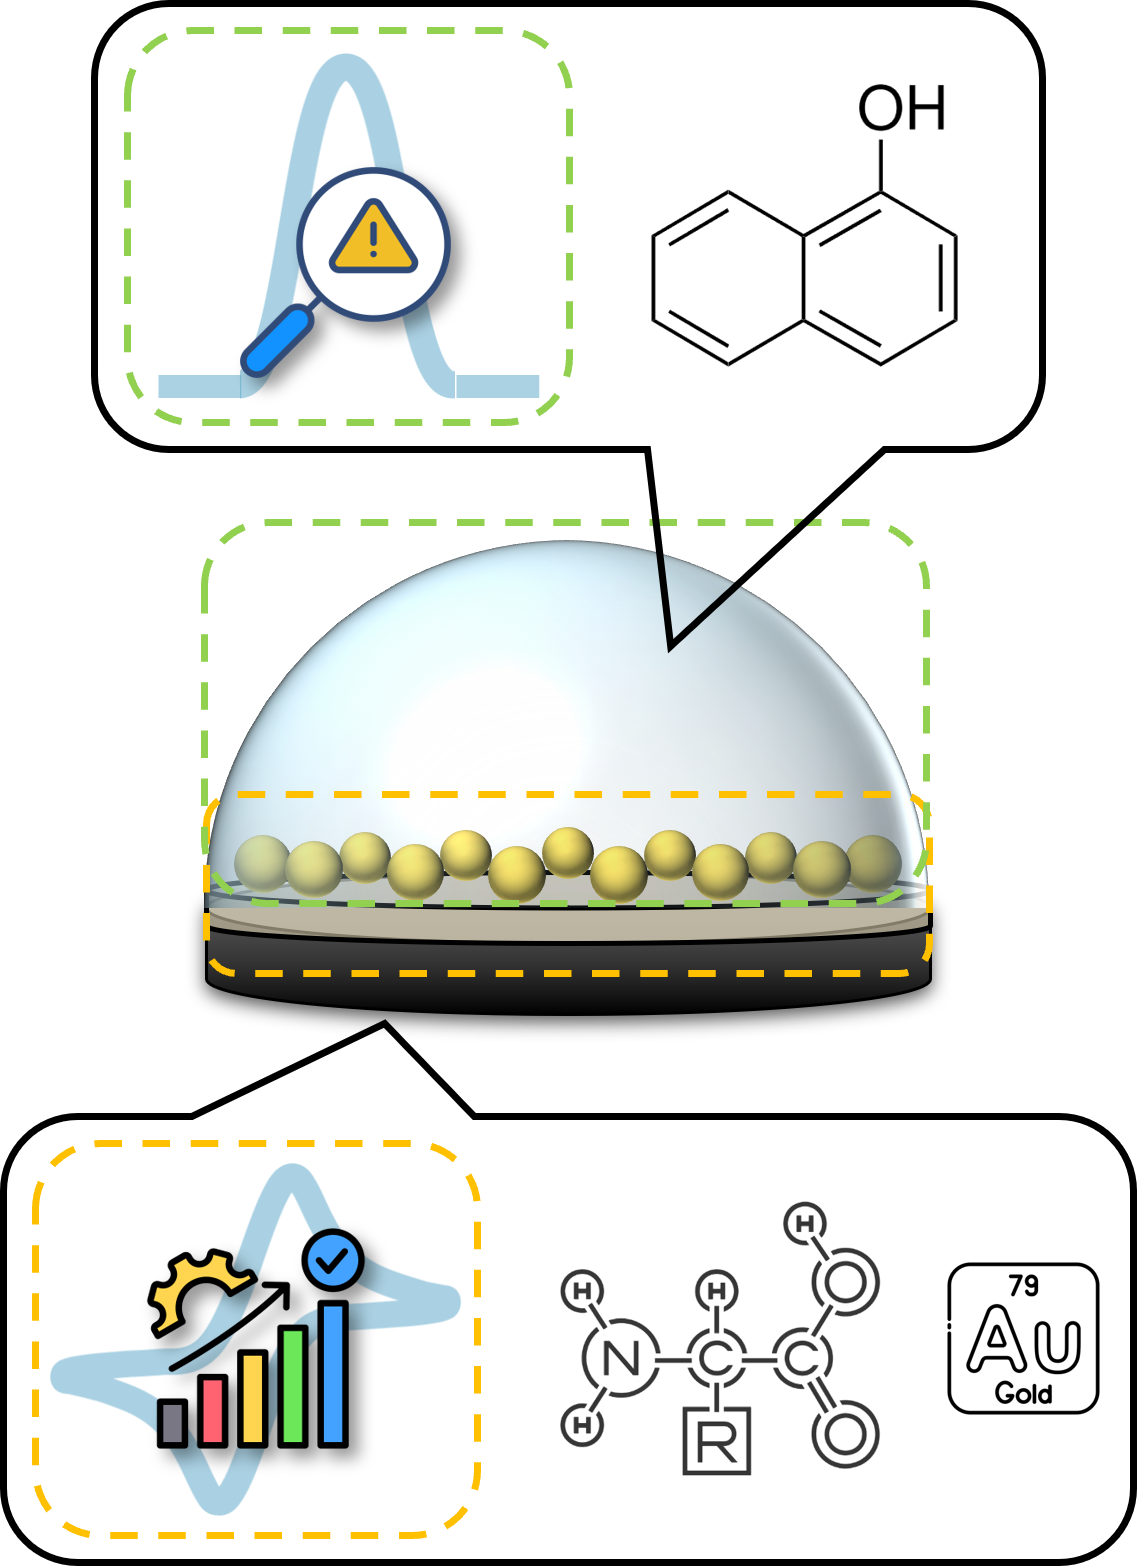
Poly(amino acids) and gold nanoparticles are stable and biocompatible materials with distinguishing features which can be used to build nanocomposite electrochemical platforms for sensing applications. This communication presents the optimization of the building steps of these nanocomposite platforms using cyclic voltammetry. Screen-printed graphite electrodes were first modified by electropolymerizing various L-amino acids and then by electrodepositing gold nanoparticles. The electroactive sur-face area was calculated for all platforms, which were then applied in the electro-chemical oxidation of 1-naphthol as a model analyte: oxidation peaks were observed in all cases, with the current peak height increasing with increasing analyte concentra-tion, thus demonstrating the potential of nanocomposite platforms for developing electrochemical sensors and biosensors.
Keywords:
poly(L-amino acids)
; gold nanoparticles
; screen-printed cells
; nanocomposite platform
Introduction
Poly(amino acids) (PAAs) are a biocompatible and biodegradable alternative to classical conducting polymers which have attracted much attention in recent years due to a set of advantages, first of all their non-toxicity [1,2,3]. Stable and uniform PAAs films with good adhesion properties can be obtained by simply electropolymerizing the monomers directly onto electrodic surfaces: these films can significantly improve the conductivity of the electrode and enhance the electroactivity of the analytes, while the presence of numerous active sites allows the PAAs to act synergistically with specific materials to improve the analytical performance of electrochemical sensors [4,5,6]. Moreover, these biomaterials can self-assemble into ordered and stable conformations, making them suitable materials in biomimetic structures and highly desirable matrices for immobilization of bioreceptors, which play a key role in the development of biosensing devices [7,8].
Gold-based nanomaterials such as gold nanoparticles (AuNPs) have been widely used as surface modifiers for carbon and graphite electrodes, as their peculiar properties, coupled with their easy synthesis (e.g., applying a constant negative potential for a fixed time or by varying the potential for a different number of cycles at an optimal scan rate [9,10,11,12]) have attracted particular attention in their application for the development of sensors and biosensors [13,14]. Exploiting the high affinity between gold and thiol groups has in many cases enabled a further modification of these surfaces by immobilizing a plethora of thiolated biorecognition elements, such as antibodies, DNA strands, enzymes, etc. Moreover, the inclusion of AuNPs in conductive polymers can enhance electron transfer through a direct or mediated mechanism with improved conductivity and higher stability [15,16,17].
Taking into account all the above considerations, this communication presents the optimization of multiple nanocomposite platforms, based on PAAs and AuNPs, to be applied in the development of electrochemical sensors and biosensors. Graphite-based screen-printed electrochemical cells were modified by cyclic voltammetry (CV), then the concentration of the precursors and the number of CV cycles for both modification steps (i.e., the electropolymerization of amino acids and the electrodeposition of AuNPs) were optimized. The resulting platforms were tested in the electrochemical oxidation of 1-naphthol, a redox molecule widely detected in electrochemical bioassays as an enzymatic product of phosphatases and thus chosen as a model analyte, by differential pulse voltammetry (DPV).
2. Materials and Methods
2.1. Chemicals
l-alanine (C3H7NO2), l-arginine hydrochloride (C6H14N4O2·HCl), l-aspartic acid (C4H7NO4), l-cysteine hydrochloride (C3H7NO2S·HCl), l-glutamic acid (C5H9NO4), l-glycine (C2H5NO2), l-histidine (C6H9N3O2), l-leucine (C6H13NO2), l-lysine hydrochloride (C6H14N2O2·HCl), l-proline (C5H9NO2), l-serine (C3H7NO3), l-tryptophan (C11H12N2O2), l-tyrosine (C9H11NO3), l-valine (C5H11NO2), tetrachloroauric acid (HAuCl4), sulphuric acid 97% (H2SO4), hydrochloric acid 37% (HCl), di-sodium hydrogen phosphate (Na2HPO4), sodium di-hydrogen phosphate di-hydrate (NaH2PO4·2H2O), sodium chloride (NaCl), potassium ferrocyanide (K4[Fe(CN)6]), potassium ferricyanide (K3[Fe(CN)6]), potassium chloride (KCl), 1-naphthol (C10H8O), diethanolamine (C4H11NO2), magnesium chloride hexahydrate (MgCl2·6H2O) were purchased from Merck (Milan, Italy). All chemicals were of analytical grade, and all solutions were prepared in deionized water (resistivity: 18 MΩ) from a Milli-Q system.
The buffer solutions used in this work were the following.
- -
- Polymerization buffer: 0.1 M phosphate buffer pH 6.0, containing 0.1 M NaCl (PBS). The buffer was prepared by mixing a 0.1 M Na2HPO4 solution with a 0.1 M NaH2PO4 solution, each one containing 0.1 M NaCl, until the desired pH was reached;
- -
- Detection buffer: 0.1 M diethanolamine buffer pH 9.6, containing 0.1 M KCl and 1 mM MgCl2 (DEA). The buffer was prepared by adding 2 M HCl to a 0.1 M DEA solution, containing 0.1 M KCl and 2 mM MgCl2, until the desired pH was reached.
2.2. Apparatus
The electrochemical measurements were performed with a PalmSens2 and a Sensit Smart portable potentiostat/galvanostats (PalmSens BV, Houten, The Netherlands) controlled by PSTrace 5.11 software for data acquisition and processing. The nanocomposite electrochemical platforms were developed on screen-printed cells (SPCs), composed of a 3 mm-diameter graphite working electrode, a graphite counter electrode and a silver pseudo-reference electrode on a plastic substrate (EcoBioServices and Researches, Sesto Fiorentino (FI), Italy). All the reported potentials refer to the pseudo-reference silver screen-printed electrode and all the measurements were carried out at room temperature.
Scanning electron microscopy (SEM) analysis was carried out using Gaia 3 microscope (Tescan a. s., Brno, Czech Republic). SEM images were acquired using an acceleration voltage of 5 kV for the bare graphite and of 10 kV for the nanostructured electrodes.
2.3. Development of the Nanocomposite Electrochemical Platforms
The graphite-based screen-printed working electrodes were progressively modified by the electropolymerization of l-amino acids in phosphate buffer and then by the electrodeposition of gold nanoparticles in sulphuric acid. Each deposition step was optimized in terms of concentration of the precursor and number of CV cycles.
2.3.1. Electropolymerization of l-Amino Acids
l-amino acids polymerization was performed by CV by dropping (50 μL) solutions of the monomers at different concentrations (1, 2, 5, 10 mM) in PBS onto the electrode surface and by scanning the potential between −1.5 V and +2.0 V at 100 mV/s. The modified electrodes were washed with Milli-Q water to remove excess monomers and free ions from the surface.
2.3.2. Electrodeposition of Gold Nanoparticles
The polymerized surfaces were further modified by the electrodeposition of gold nanoparticles using CV. Solutions of HAuCl4 at different concentrations (0.1, 0.2, 0.5, 1 mM) in 0.5 M H2SO4 were dropped (50 μL) on the modified cells and the potential was scanned between −0.2 V and +1.2 V at 100 mV/s, as previously reported [18,19,20,21]. The AuNPs/p(l-AA)-modified SPCs were then washed with Milli-Q water to remove residual precursors and free ions from the surface and then stored under dry conditions.
2.4. Electrochemical Characterization of the Nanocomposite Platforms
To gain insights into the nanostructures on the electrode surface, and especially into their influence on the electrochemical performance of the screen-printed cells, an electrochemical characterization of the developed sensing platforms was performed by CV and electrochemical impedance spectroscopy (EIS) techniques in presence (50 μL) of a solution containing 5 mM [Fe(CN)6]−4 and 5 mM [Fe(CN)6]−3 redox probes in 0.1 M KCl. For CV measurements, the potential was scanned from −0.5 V to + 0.8 V at different scan rates (25, 50, 75, 100, 125 and 150 mV/s). The current peak height (ip, in [A]) of both anodic and cathodic peaks was taken as the electrochemical signal and plotted vs. the square root of the scan rate (v1/2, in [V/s]). The obtained curves were fitted with the Randles-Sevcik equation [22]:
where n is the number of electrons transferred in the redox event (=1, in the case of Fe(II)/Fe(III) couple), A (in [cm2]) is the electroactive surface area, c (in [mol/cm3]) is the probe bulk concentration and D is the diffusion coefficient of the redox species (reported to be 6.67·10−6 cm2/s for [Fe(CN)6]−4 and 7.26·10−6 cm2/s for [Fe(CN)6]−3 [23]). For EIS measurements, the frequency was scanned in the range 100 kHz–10 mHz with an amplitude of 10 mV at a fixed DC potential of +0.13 V. After each CV measurement, the SPCs were discarded.
ip = (2.69∙105) n3/2 A c (D v)1/2,
2.5. 1-Naphthol Electrochemical Detection
The electrochemical performance of the nanocomposite platforms was assessed by detecting 1-naphthol by means of DPV. Solutions at different concentrations of 1-naphthol (0‒100 mg/L) in DEA buffer were dropped (50 μL) on different modified cells and the potential was scanned from −0.8 V to + 0.8 V at 5 mV/s (pulse potential: 70 mV, pulse time: 50 ms). After each DPV measurement, the SPCs were discarded.
3. Results and Discussion
The presented nanocomposite platforms were built by combining a polymeric layer of poly(l-amino acids) and AuNPs with the dual purpose of improving the electrochemical performance of graphite-based SPCs and to provide a scaffold for the immobilization of bioreceptors by exploiting, for instance, the affinity between gold and thiol moieties.
The fourteen amino acids used in this work were selected because they are the most commonly used in sensors and biosensors development [7].
3.1. Optimization of Amino Acids Electropolymerization
The concentration of the monomer and the number of CV cycles were optimized for each l-amino acid by considering parameters such as the average of the anodic and cathodic current peak heights (īp), their ratio (|ip,a/ip,c|), and the peak potential difference (ΔEp) related to the redox couple [Fe(CN)6]−4/−3. The results related to monomers’ concentration are shown in Figure 1 and Table 1.
The results related to CV cycles for the electropolymerization of amino acids are shown in Figure 2 and Table 2.
The appropriate monomer concentration of the monomers and the number of CV cycles for the electropolymerization were chosen taking into account firstly the highest value of īp and the closeness of |ip,a/ip,c| to 1, and secondly the lowest value of ΔEp, with the aim of selecting those polymerization conditions that provided (i) an increase in the electrochemical performance of the working electrode in oxidating and reducing the redox probe and (ii) an improvement in the reversibility of the redox reaction. The chosen values are reported in Table 3.
To address a possible enhancement of the electrochemical properties of the SPCs brought by the modification of the graphite working electrodes with the sole PAAs films, EIS measurements were performed: the resulting spectra, presented in the form of complex plane diagrams (i.e., Nyquist plots), are shown in Figure 3.
From the reported plots, it can be seen that the diameter of circular part of each graph, which is related to the charge transfer resistance (Rct), is lower for PAAs-modified surfaces than that of bare graphite, thus confirming that the electrochemical properties of SPCs are improved when a poly(amino acid) film is deposited onto the surface of the working electrodes. The only exception is the case of p(l-Trp), for which an increase in the Rct value can be observed with respect to bare graphite: this could be probably due to a hampering effect of the side chain of l-Trp on the electron transfer.
3.2. Optimization of Gold Nanoparticles Electrodeposition
A similar optimization procedure was applied in choosing the concentration of HAuCl4 and the number of CV cycles related to the electrodeposition of AuNPs on each poly(l-amino acid)-modified SPC. The results related to HAuCl4 concentration are shown in Figure 4 and in Table 4.
The results related to CV cycles for the electrodeposition of gold nanoparticles are shown in Figure 5 and in Table 5.
The most proper parameters were chosen according to the same criteria explained in the previous section and are reported in Table 6.
3.3. Calculation of the Electroactive Surface Area
After having optimized the experimental parameters related to the electropolymerization of l-amino acids and the electrodeposition of AuNPs, an electrochemical characterization of the resulting nanocomposite platforms was performed by means of CV in presence of the reversible redox couple [Fe(CN)6]−4/−3. From the angular coefficient of the linear regressions obtained by plotting ip vs. v1/2 for each platform, the electroactive surface area was calculated and compared with that of a bare graphite-based working electrode ((7.2 + 0.4) mm2). The obtained values are shown in Table 7.
Considering the obtained results, it can be stated that a general increase in the electroactive surface area was observed for each nanocomposite platform compared to the bare graphite electrode, with an average of approximately 8.4 mm2. The only exceptions are those containing l-Arg, l-Glu and l-Lys (average ≈ 9.6 mm2), l-His and l-Ser (average ≈ 7.9 mm2) and l-Trp (4.2 mm2).
3.4. Morphological Characterization
The morphology of GSPEs was investigated before and after the electrochemical modification of the working electrodes with a poly(amino acid) and gold nanoparticles (Figure 6).
The results show (i) a smoothing effect given by the presence of the polymer and (ii) the presence of gold nanoparticles, randomly and homogeneously distributed onto the entire surface of modified working electrode.
3.5. Electrochemical Performance of the Platforms Towards 1-Naphthol Oxidation
To evaluate the electrochemical performance of the resulting nanocomposite platforms, 1-naphthol was chosen as a model redox molecule and its detection was performed by DPV. This molecule is the enzymatic product of phosphatases, starting from 1-naphthyl phosphate as the enzymatic substrate. Phosphatases are widely used as labels with signal amplification purposes in biosensors and bioassays, thus, when the electrochemical transduction is exploited, as in this case, 1-naphthol is the molecule being electrochemically detected. Based on the above-mentioned considerations, the tested platforms were those with the highest electroactive surface areas, namely those containing l-Arg, l-Glu and l-Lys. The resulting DPV scans and calibration curves are shown in Figure 7.
The oxidation current of 1-naphthol increases with increasing its concentration in all cases. However, regarding the shape of the voltammetric curves, the nanocomposite platform containing poly(l-Glu) produced more uniform peaks than those obtained on the platforms containing poly(l-Arg) and poly(l-Lys), which are characterized by a lower degree of symmetry are represented by non-smooth lines. This lack of regularity is caused by the presence of multiple collateral shoulders and overlapping peaks, which was observed when 1-naphthol was detected on polymerized l-Arg ad l-Lys. This could probably be due to the interaction of intermediate products, deriving from the electrooxidation of 1-naphthol, with the amino residues of l-Arg and l-Lys: in fact, arginine residues in proteins can be revealed in presence of 1-naphthol [24], while 1-naphthol derivatives have the ability to selectively target lysine residues [25]. Moreover, the scans performed on the platform containing p(l-Glu) are also characterized by an enhanced reproducibility of the baseline among the different concentrations of 1-naphthol, which can be properly linked to the reproducibility of the modification processes themselves. To further confirm the optimized performance of the platforms with the highest electroactive surface, DPV analysis was performed again to compare the effect of both monomers (l-Arg, l-Glu, l-Lys) concentration and CV scan number on 1-naphthol detection, in the same way as presented in Section 3.1 and Section 3.2. The sensitivity values for 1-naphthol obtained under these conditions are reported in Table 8.
The obtained results for the detection of 1-naphthol show that the concentration and the number of CV cycles for the electropolymerization of the chosen l-AAs which yielded the highest sensitivity are in accordance with those presented in Table 3. Moreover, to definitely demonstrate the bio-affinity enhancement brought by the presence of the polymers on the nanocomposite platforms, 1-naphthol was also detected on AuNPs-modified graphite electrodes. The resulting DPV scans and calibration curve are shown in Figure 8.
The results show that the sensitivity towards 1-naphthol detection is lowered by approximately 60% respect to the AuNPs/p(l-Glu) platform when only AuNPs are present on the electrode surface, thus demonstrating the enhancement of bio-affinity given by the presence of PAAs as electrode modifiers in combination with gold nanoparticles.
4. Conclusions
This communication presents the optimization of multiple electrochemical platforms, based on poly(l-amino acids) and gold nanoparticles, to be applied in the development of sensors and biosensors. Both the building steps of the platforms were optimized in terms of precursors concentration and cyclic voltammetry (CV) scans. The optimized platforms were electrochemically characterized, and those with the highest electroactive surface area (i.e., those containing l-Arg, l-Glu and l-Lys) were applied in the electrochemical detection of 1-naphthol, taken as a model analyte. Oxidation peaks were observed at the nanocomposite platforms, with the current peak height increasing with increasing 1-naphthol concentration. The developed platforms showed themselves to be suitable for applications in the development of sensors and biosensors, especially those involving architectures with 1-naphthol as the final detection product.
Author Contributions
Conceptualization, G.S.; methodology, G.S.; investigation, G.S.; data curation, G.S.; writing—original draft preparation, G.S.; writing—review and editing, G.S., A.B., C.S., C.V., T.M., A.C., and G.M.; supervision, G.M., A.C., C.V. and T.M.; project administration, C.S., G.S. and A.B.; funding acquisition, C.S., G.S. and A.B. All authors have read and agreed to the published version of the manuscript.
Funding
This research was supported by European Union-Next Generation EU, UNIFI Young Independent Researchers Call – MuSC (Analysis and sensing of contaminants in agriculture: from Mulches to Soil and Crops).
Institutional Review Board Statement
Not applicable.
Informed Consent Statement
Not applicable.
Data Availability Statement
The original contributions presented in this study are included in the article/supplementary material. Further inquiries can be directed to the corresponding author.
Conflicts of Interest
The authors declare no conflicts of interest. The funders had no role in the design of the study; in the collection, analyses, or interpretation of data; in the writing of the manuscript; or in the decision to publish the results.
References
- Gohil, S.V.; Suhail, S.; Rose, J.; Vella, T.; Nair, L.S. Polymers and Composites for Orthopedic Applications. Mater. Devices Bone Disord. 2017, 349–403. [Google Scholar] [CrossRef]
- Zhang, X.; Peng, X.; Zhang, S.W. Biodegradable medical polymers: Fundamental sciences. Sci. Princ. Biodegrad. Bioresorbable Med. Polym. Mater. Prop. 2017, 1–33. [Google Scholar] [CrossRef]
- Gaspar, V.M.; Moreira, A.F.; de Melo-Diogo, D.; Costa, E.C.; Queiroz, J.A.; Sousa, F.; Pichon, C.; Correia, I.J. Multifunctional nanocarriers for codelivery of nucleic acids and chemotherapeutics to cancer cells. Nanobiomaterials Med. Imaging Appl. Nanobiomaterials 2016, 163–207. [Google Scholar] [CrossRef]
- Ma, Y.; Wei, X.; Xu, J.; Ji, S.; Yang, F.; Zeng, A.; Li, Y.; Cao, J.; Zhang, J.; Luo, Z.; Fu, Q. Development of double-layer poly (amino acid) modified electrochemical sensor for sensitive and direct detection of betamethasone in cosmetics. Talanta 2024, 273, 125855. [Google Scholar] [CrossRef] [PubMed]
- Al-Mhyawi, S.R.; Abdel-Hamied Abdel-Tawab, M.; El Nashar, R.M. A novel electrochemical hybrid platform for sensitive determination of the aminoglycoside antibiotic Kasugamycin residues in vegetables. Food Chem. 2023, 411, 135506. [Google Scholar] [CrossRef] [PubMed]
- Bolat, G.; Yaman, Y.T.; Abacı, S.; Seyyar, S. Poly-arginine/graphene oxide functionalized disposable sensor for monitoring fenitrothion pesticide residues in water and cucumber samples. Mater. Today Chem. 2023, 30, 101517. [Google Scholar] [CrossRef]
- Kordasht, H.K.; Hasanzadeh, M.; Seidi, F.; Alizadeh, P.M. Poly (amino acids) towards sensing: Recent progress and challenges. TrAC Trends Anal. Chem. 2021, 140, 116279. [Google Scholar] [CrossRef]
- Yuan, H.; Jiang, M.; Fang, H.; Tian, H. Recent advances in poly(amino acids), polypeptides, and their derivatives in drug delivery. Nanoscale 2025, 17, 3549–3584. [Google Scholar] [CrossRef]
- Campbell, F.W.; Compton, R.G. The use of nanoparticles in electroanalysis: An updated review. Anal. Bioanal. Chem. 2010, 396, 241–259. [Google Scholar] [CrossRef]
- Takahashi, Y.; Tatsuma, T. Electrodeposition of thermally stable gold and silver nanoparticle ensembles through a thin alumina nanomask. Nanoscale 2010, 2, 1494. [Google Scholar] [CrossRef]
- Chen, X.; Yi, Z.; Peng, G.; Yuan, Z.; Wang, R.; Li, Y. In-situ deposition of gold nanoparticles on screen-printed carbon electrode for rapid determination of Hg2+ in water samples. Int. J. Electrochem. Sci. 2024, 19, 100544. [Google Scholar] [CrossRef]
- Hezard, T.; Fajerwerg, K.; Evrard, D.; Collière, V.; Behra, P.; Gros, P. Influence of the gold nanoparticles electrodeposition method on Hg(II) trace electrochemical detection. Electrochim. Acta 2012, 73, 15–22. [Google Scholar] [CrossRef]
- Freestone, I.; Meeks, N.; Sax, M.; Higgitt, C. The Lycurgus Cup—A Roman nanotechnology. Gold Bull. 2007, 40, 270–277. [Google Scholar] [CrossRef]
- Arduini, F.; Micheli, L.; Moscone, D.; Palleschi, G.; Piermarini, S.; Ricci, F.; Volpe, G. Electrochemical biosensors based on nanomodified screen-printed electrodes: Recent applications in clinical analysis. Trends Anal. Chem. 2016, 79, 114–126. [Google Scholar] [CrossRef]
- Sassolas, A.; Prieto-Simón, B.; Marty, J.-L. Biosensors for Pesticide Detection: New Trends. Am. J. Anal. Chem. 2012, 03, 210–232. [Google Scholar] [CrossRef]
- Saberi, R.-S.; Shahrokhian, S.; Marrazza, G. Amplified Electrochemical DNA Sensor Based on Polyaniline Film and Gold Nanoparticles. Electroanalysis 2013, 25, 1373–1380. [Google Scholar] [CrossRef]
- Choi, E.J.; Drago, N.P.; Humphrey, N.J.; Van Houten, J.; Ahn, J.; Lee, J.; Kim, I.D.; Ogata, A.F.; Penner, R.M. Electrodeposition-enabled, electrically-transduced sensors and biosensors. Mater. Today 2023, 62, 129–150. [Google Scholar] [CrossRef]
- Selvolini, G.; Lazzarini, C.; Marrazza, G. Electrochemical Nanocomposite Single-Use Sensor for Dopamine Detection. Sensors 2019, 19, 3097. [Google Scholar] [CrossRef]
- Subak, H.; Selvolini, G.; Macchiagodena, M.; Ozkan-Ariksoysal, D.; Pagliai, M.; Procacci, P.; Marrazza, G. Mycotoxins aptasensing: From molecular docking to electrochemical detection of deoxynivalenol. Bioelectrochemistry 2021, 138, 107691. [Google Scholar] [CrossRef]
- Amor-Gutiérrez, O.; Selvolini, G.; Fernández-Abedul, M.T.; de la Escosura-Muñiz, A.; Marrazza, G. Folding-based electrochemical aptasensor for the determination of β-lactoglobulin on poly-l-lysine modified graphite electrodes. Sensors 2020, 20, 2349–2361. [Google Scholar] [CrossRef]
- Selvolini, G.; Băjan, I.; Hosu, O.; Cristea, C.; Săndulescu, R.; Marrazza, G. DNA-based sensor for the detection of an organophosphorus pesticide: Profenofos. Sensors 2018, 18, 2035–2046. [Google Scholar] [CrossRef] [PubMed]
- Elgrishi, N.; Rountree, K.J.; McCarthy, B.D.; Rountree, E.S.; Eisenhart, T.T.; Dempsey, J.L. A Practical Beginner’s Guide to Cyclic Voltammetry. J. Chem. Educ. 2018, 95, 197–206. [Google Scholar] [CrossRef]
- Konopka, S.J.; McDuffie, B. Diffusion coefficients of ferri- and ferrocyanide ions in aqueous media, using twin-electrode thin-layer electrochemistry. Anal. Chem. 1970, 42, 1741–1746. [Google Scholar] [CrossRef]
- Sakaguchi, S. ÜBER EINE NEUE FARBENREAKTION von PROTEIN UND ARGININ. J. Biochem. 1925, 5, 25–31. [Google Scholar] [CrossRef]
- Pérez-Ruiz, R.; Molins-Molina, O.; Lence, E.; González-Bello, C.; Miranda, M.A.; Jiménez, M.C. Photogeneration of Quinone Methides as Latent Electrophiles for Lysine Targeting. J. Org. Chem. 2018, 83, 13019–13029. [Google Scholar] [CrossRef] [PubMed]
Figure 1.
Average (īp) of anodic (ip,a) and cathodic (ip,c) current peak heights obtained for each poly(l-amino acid)-modified SPC at different concentrations of the monomer (number of CV cycles: 10). The maximum solubility for l-Tyr is 2 mM.
Figure 1.
Average (īp) of anodic (ip,a) and cathodic (ip,c) current peak heights obtained for each poly(l-amino acid)-modified SPC at different concentrations of the monomer (number of CV cycles: 10). The maximum solubility for l-Tyr is 2 mM.
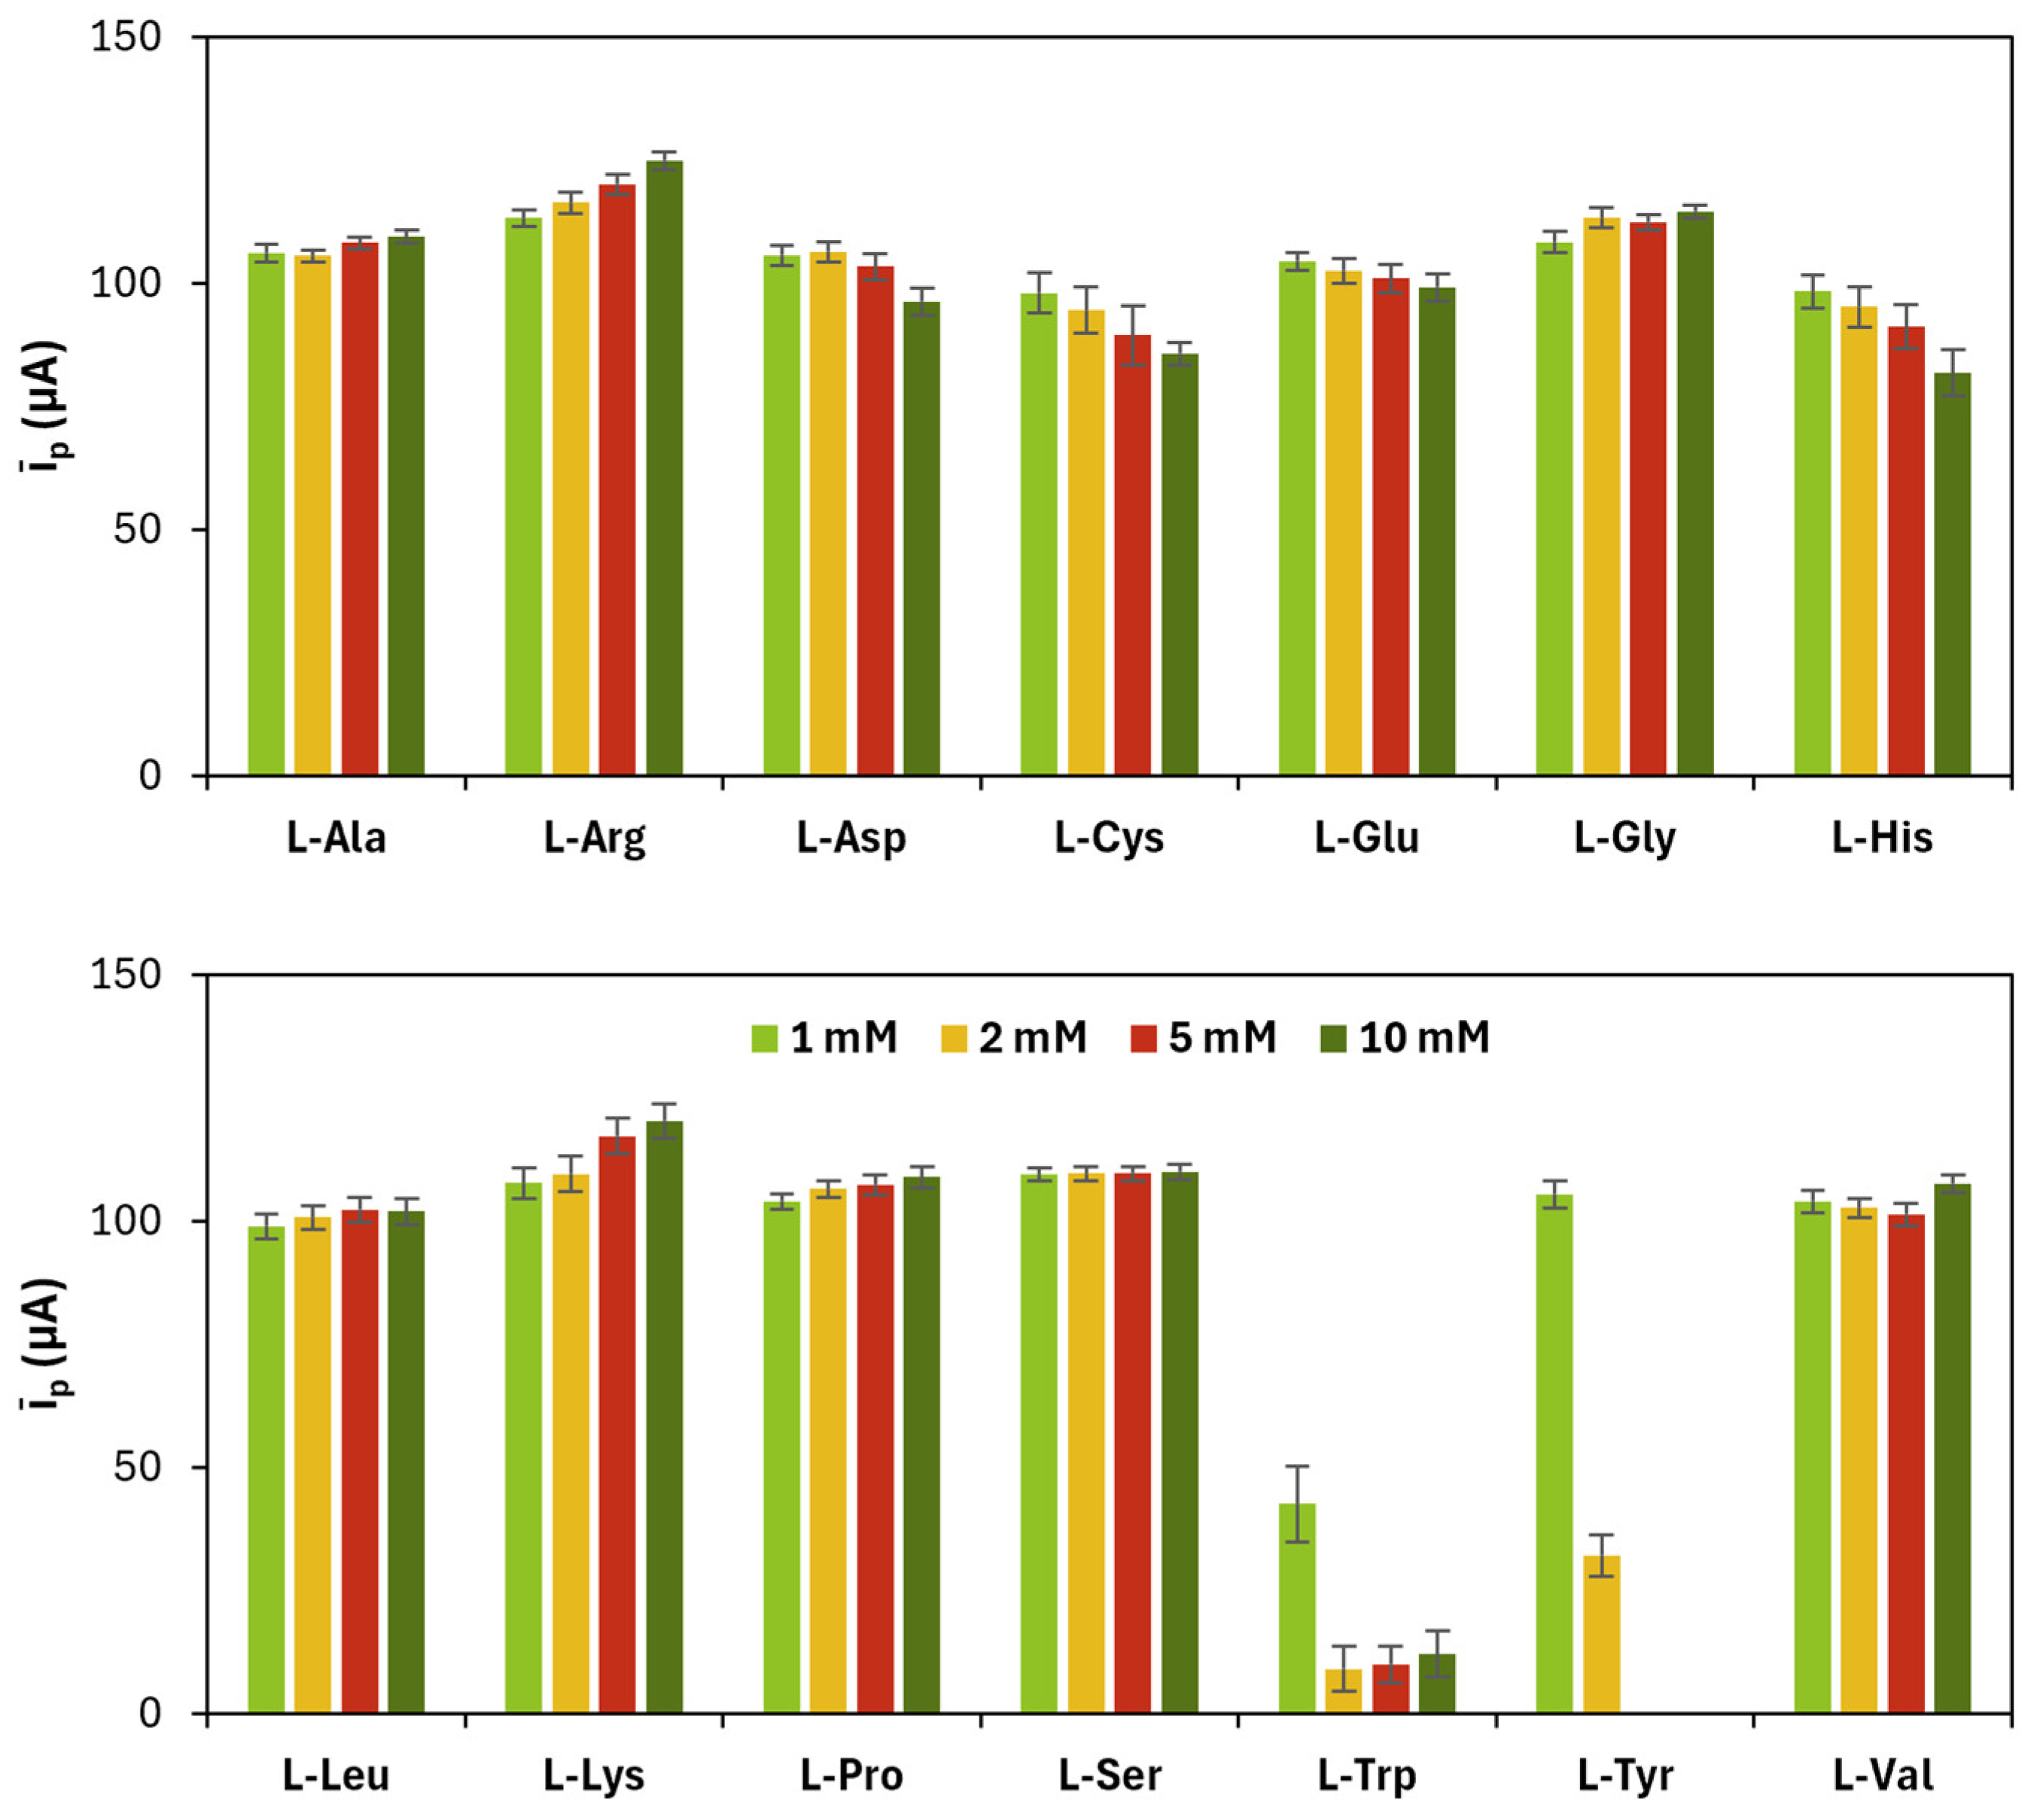
Figure 2.
Average (īp) of anodic (ip,a) and cathodic (ip,c) current peak heights obtained for each poly(l-amino acid)-modified SPC at a different number of CV cycles.
Figure 2.
Average (īp) of anodic (ip,a) and cathodic (ip,c) current peak heights obtained for each poly(l-amino acid)-modified SPC at a different number of CV cycles.
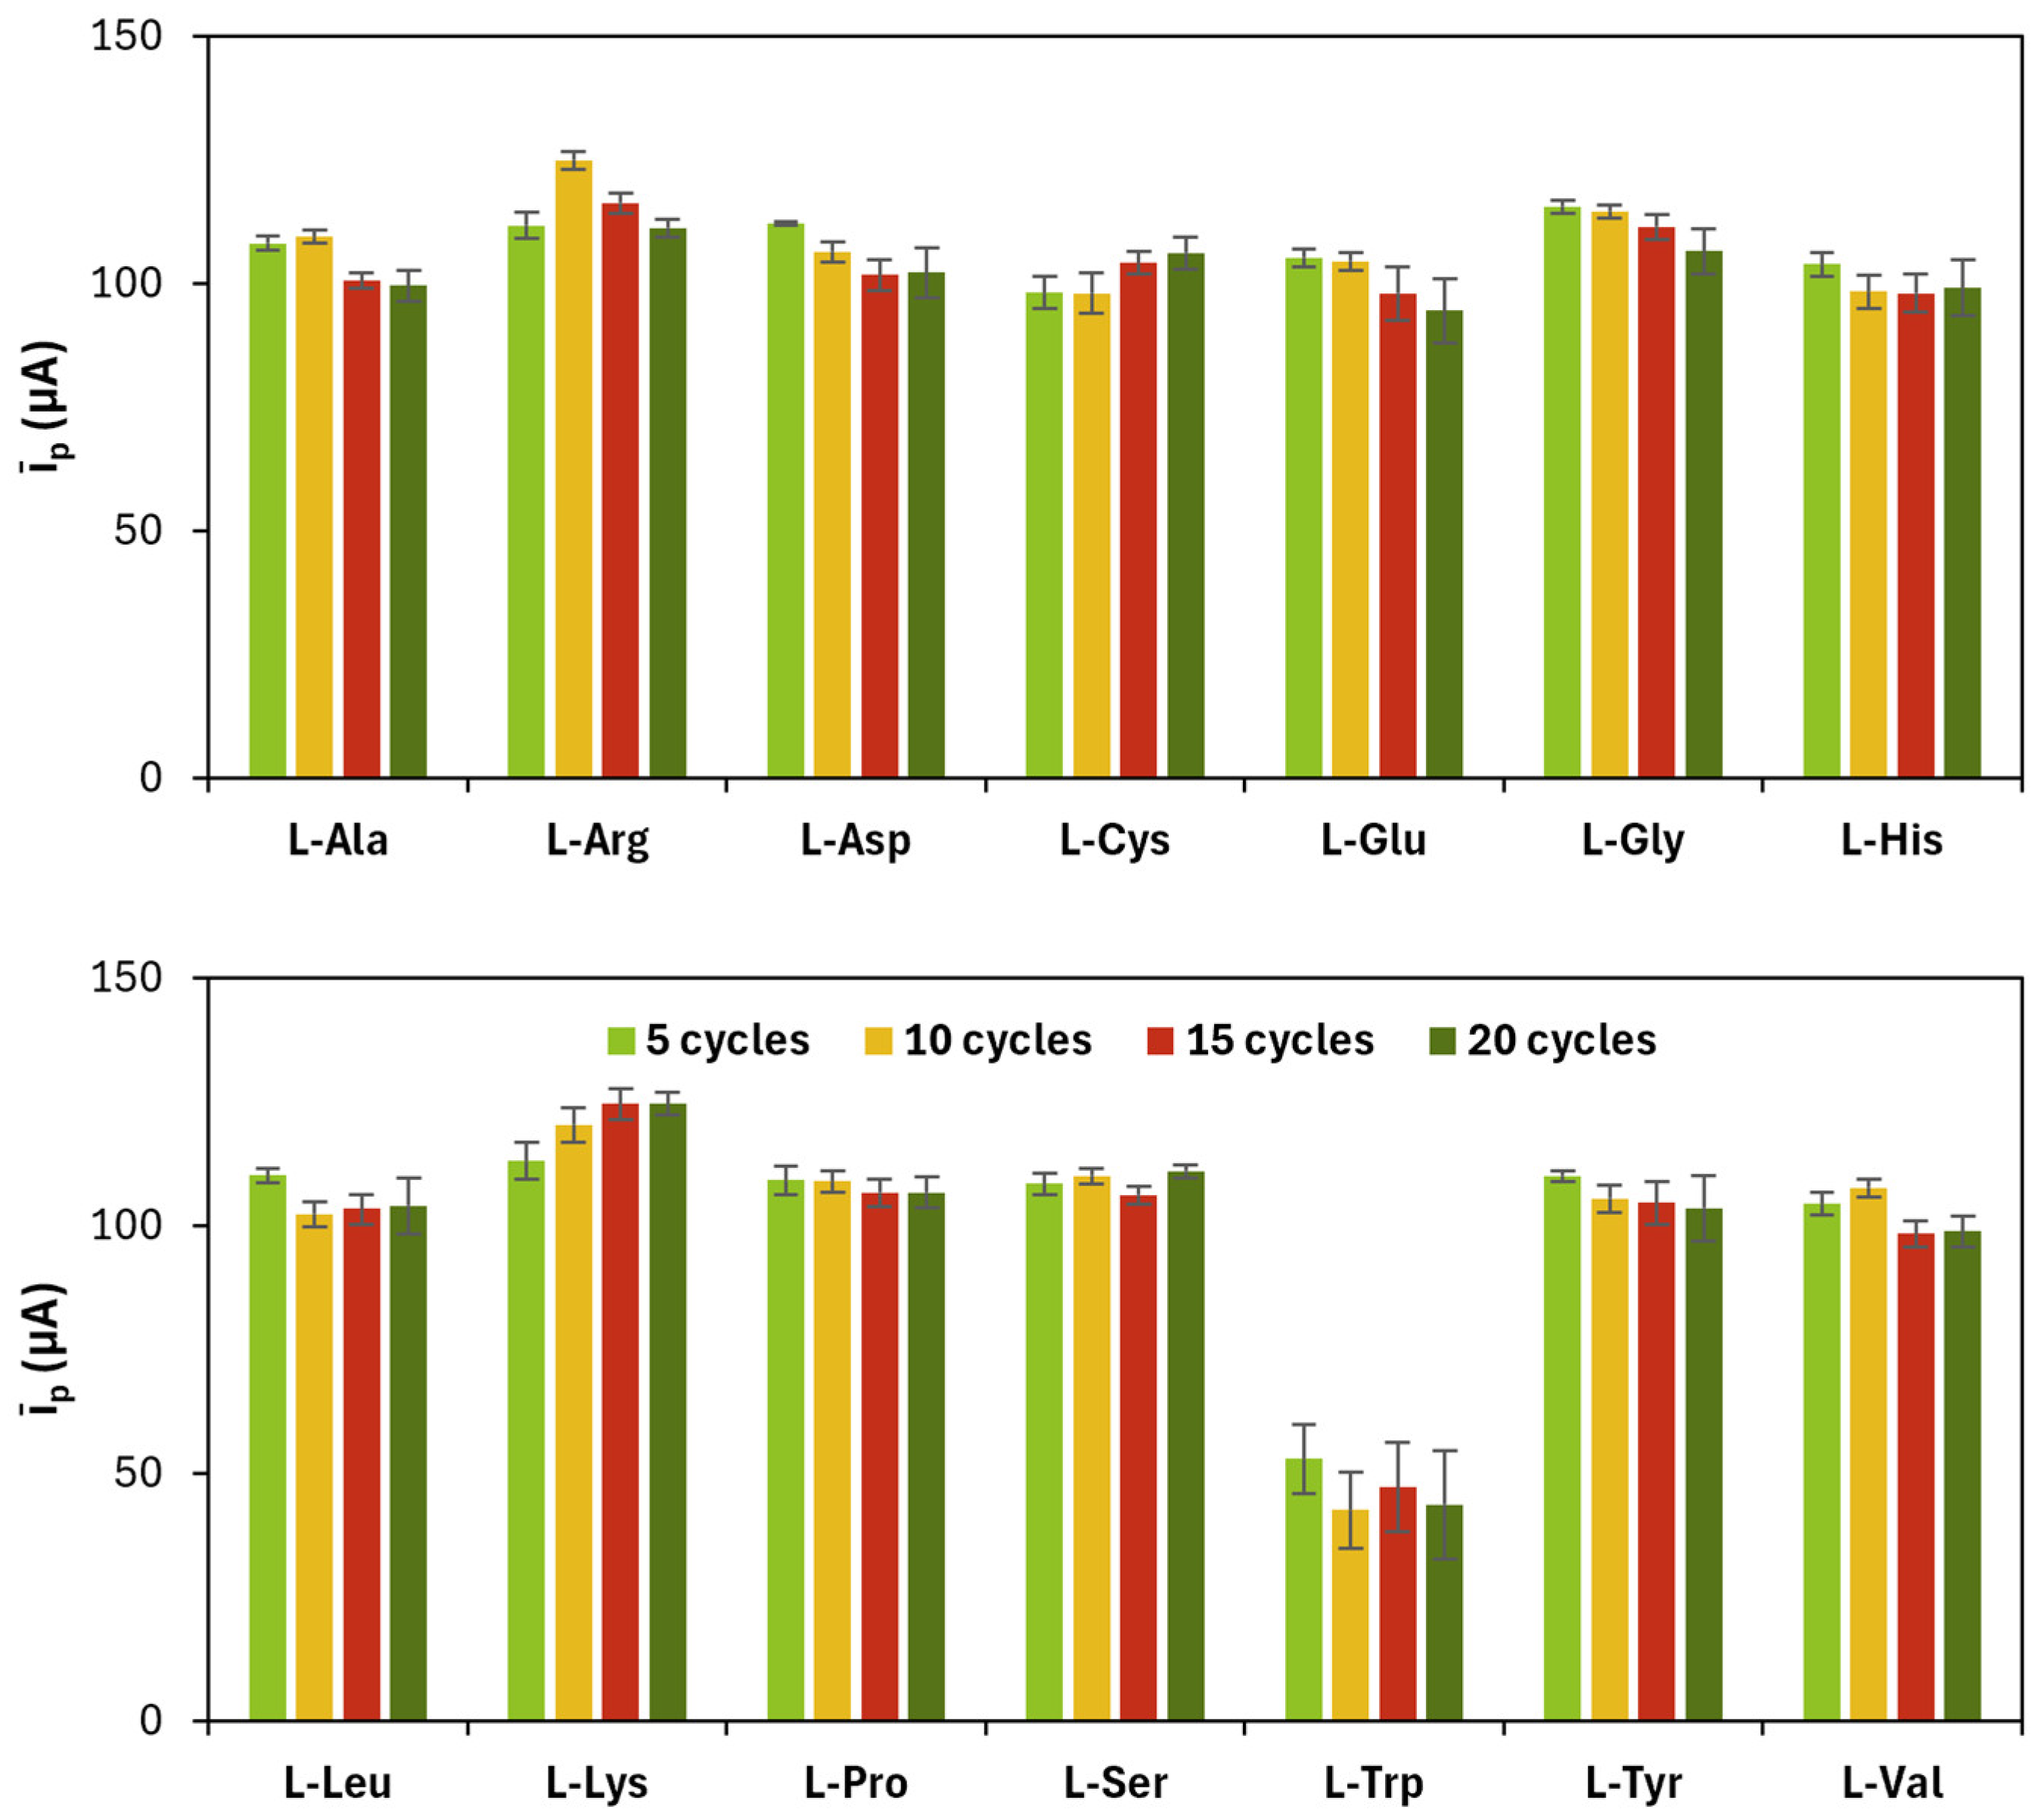
Figure 3.
Nyquist plots of bare and PAAs-modified graphite electrodes.
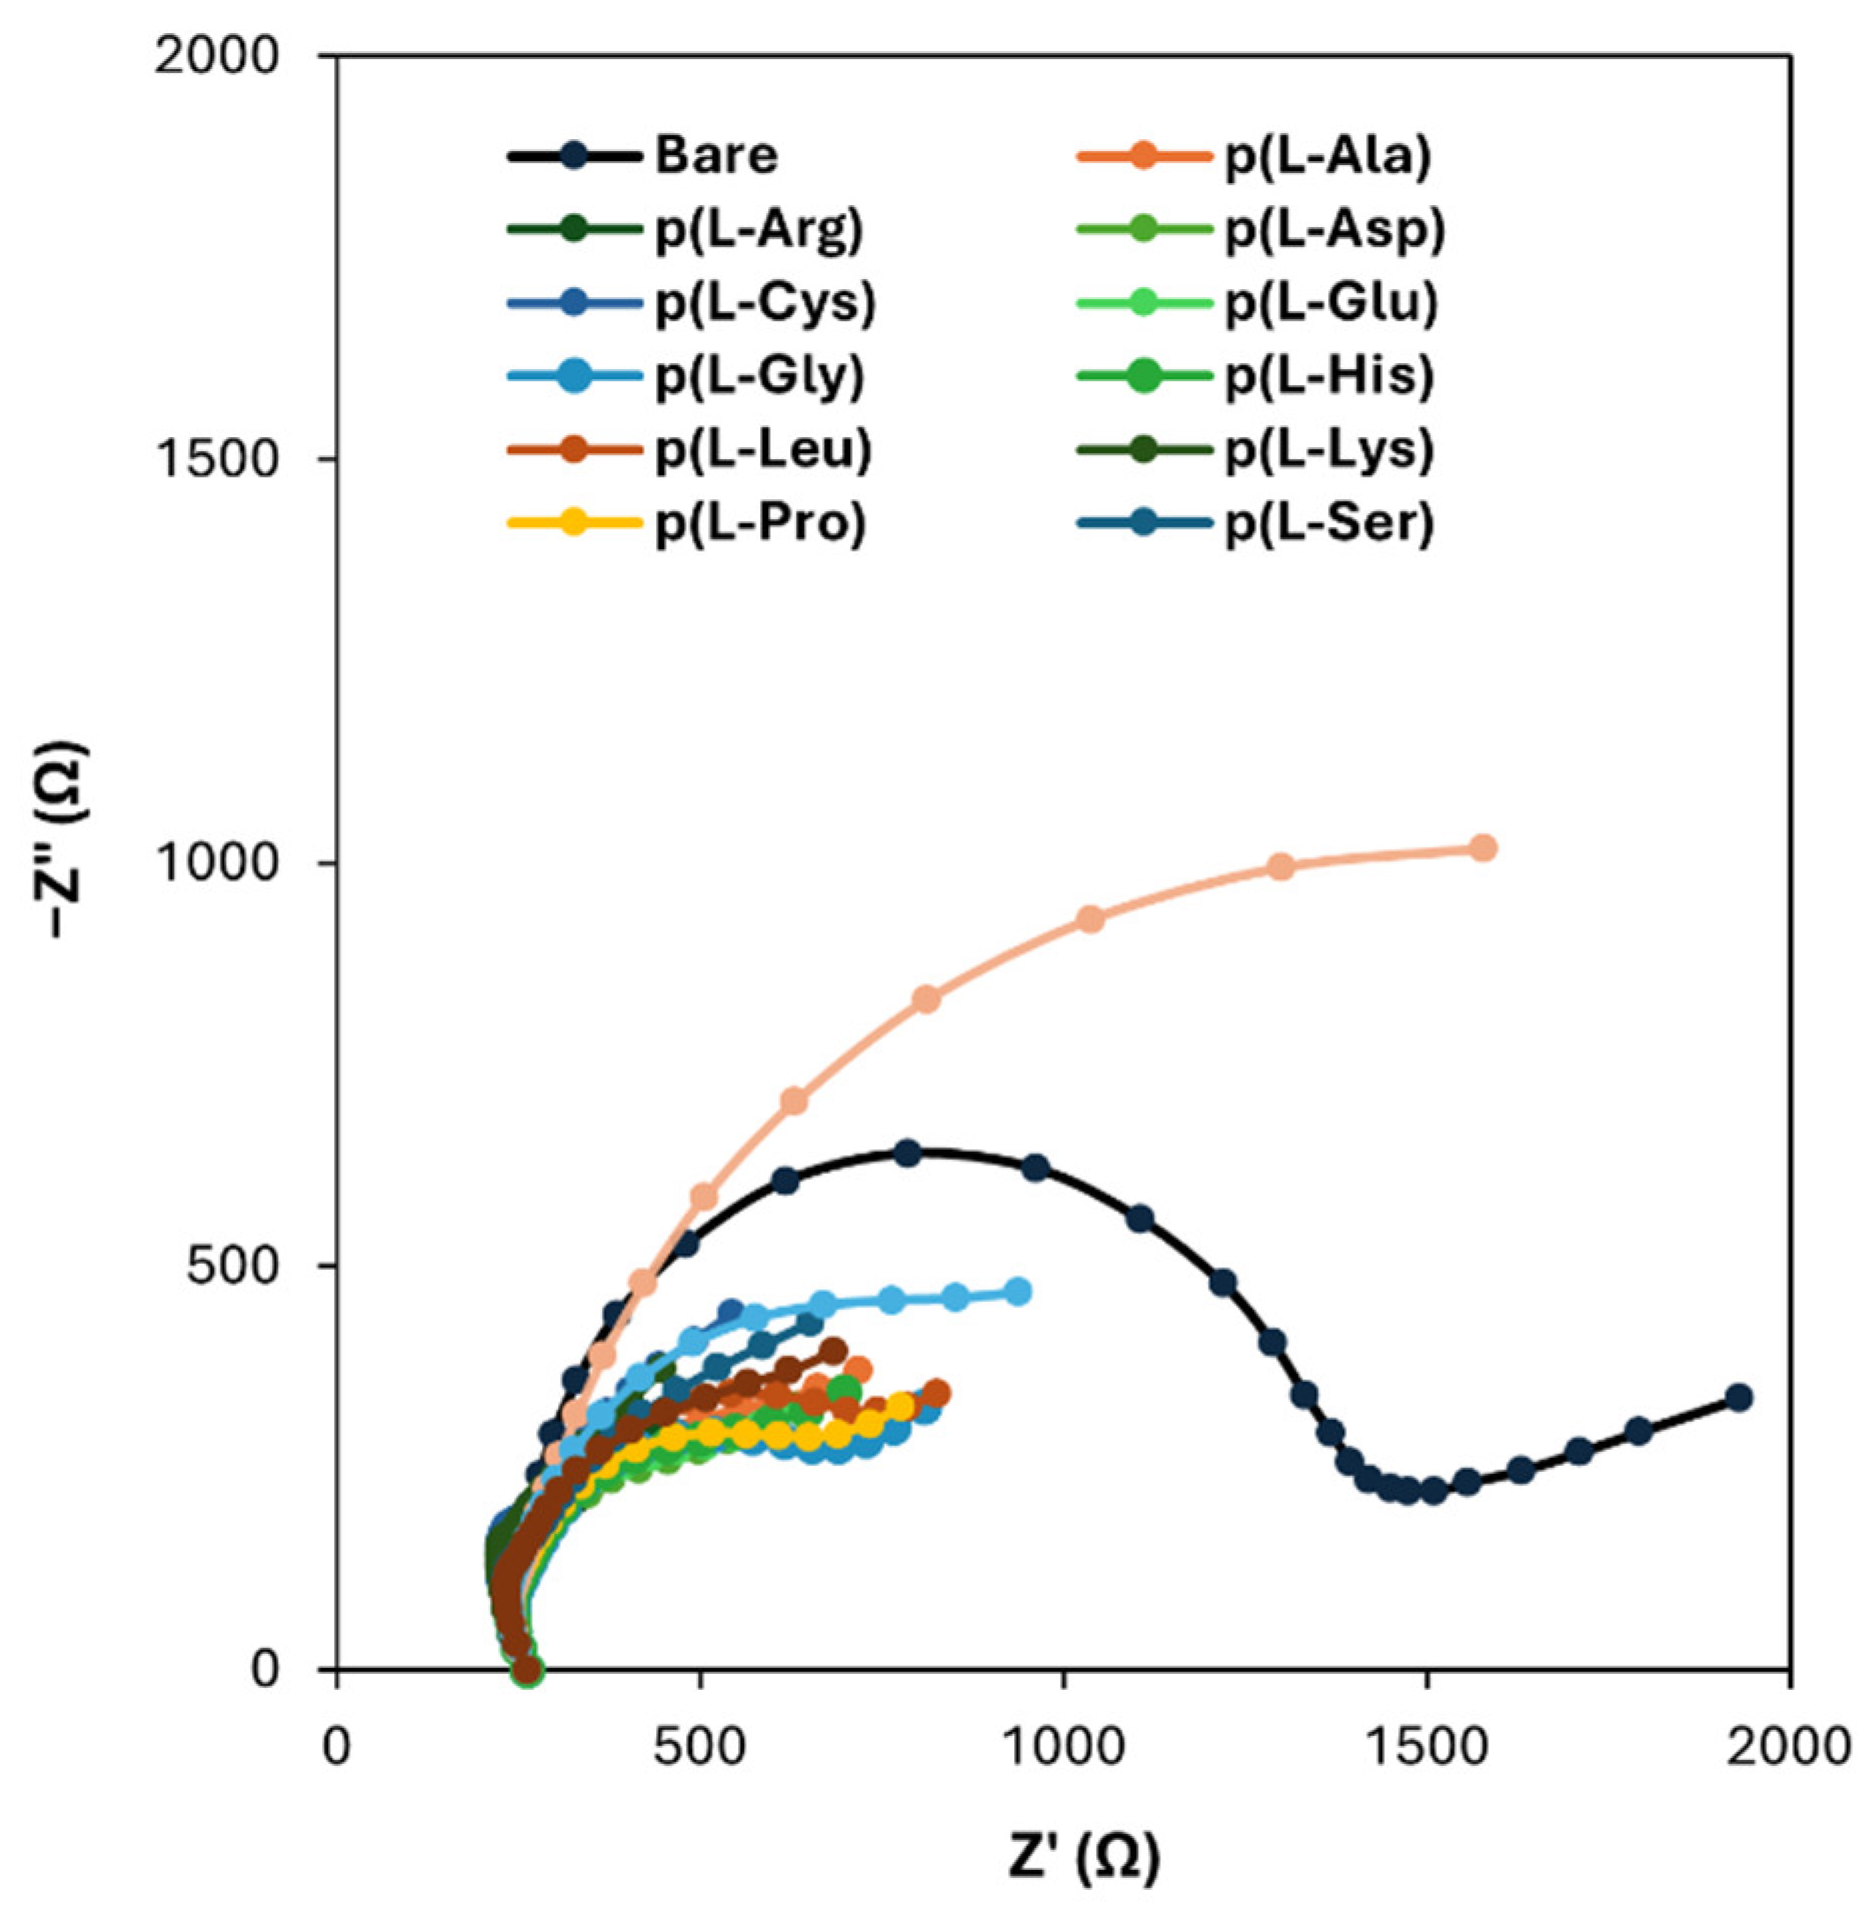
Figure 4.
Average (īp) of anodic (ip,a) and cathodic (ip,c) current peak heights obtained for each gold nanoparticles and poly(l-amino acid)-modified SPC at different concentrations of the precursor (number of CV cycles: 15).
Figure 4.
Average (īp) of anodic (ip,a) and cathodic (ip,c) current peak heights obtained for each gold nanoparticles and poly(l-amino acid)-modified SPC at different concentrations of the precursor (number of CV cycles: 15).
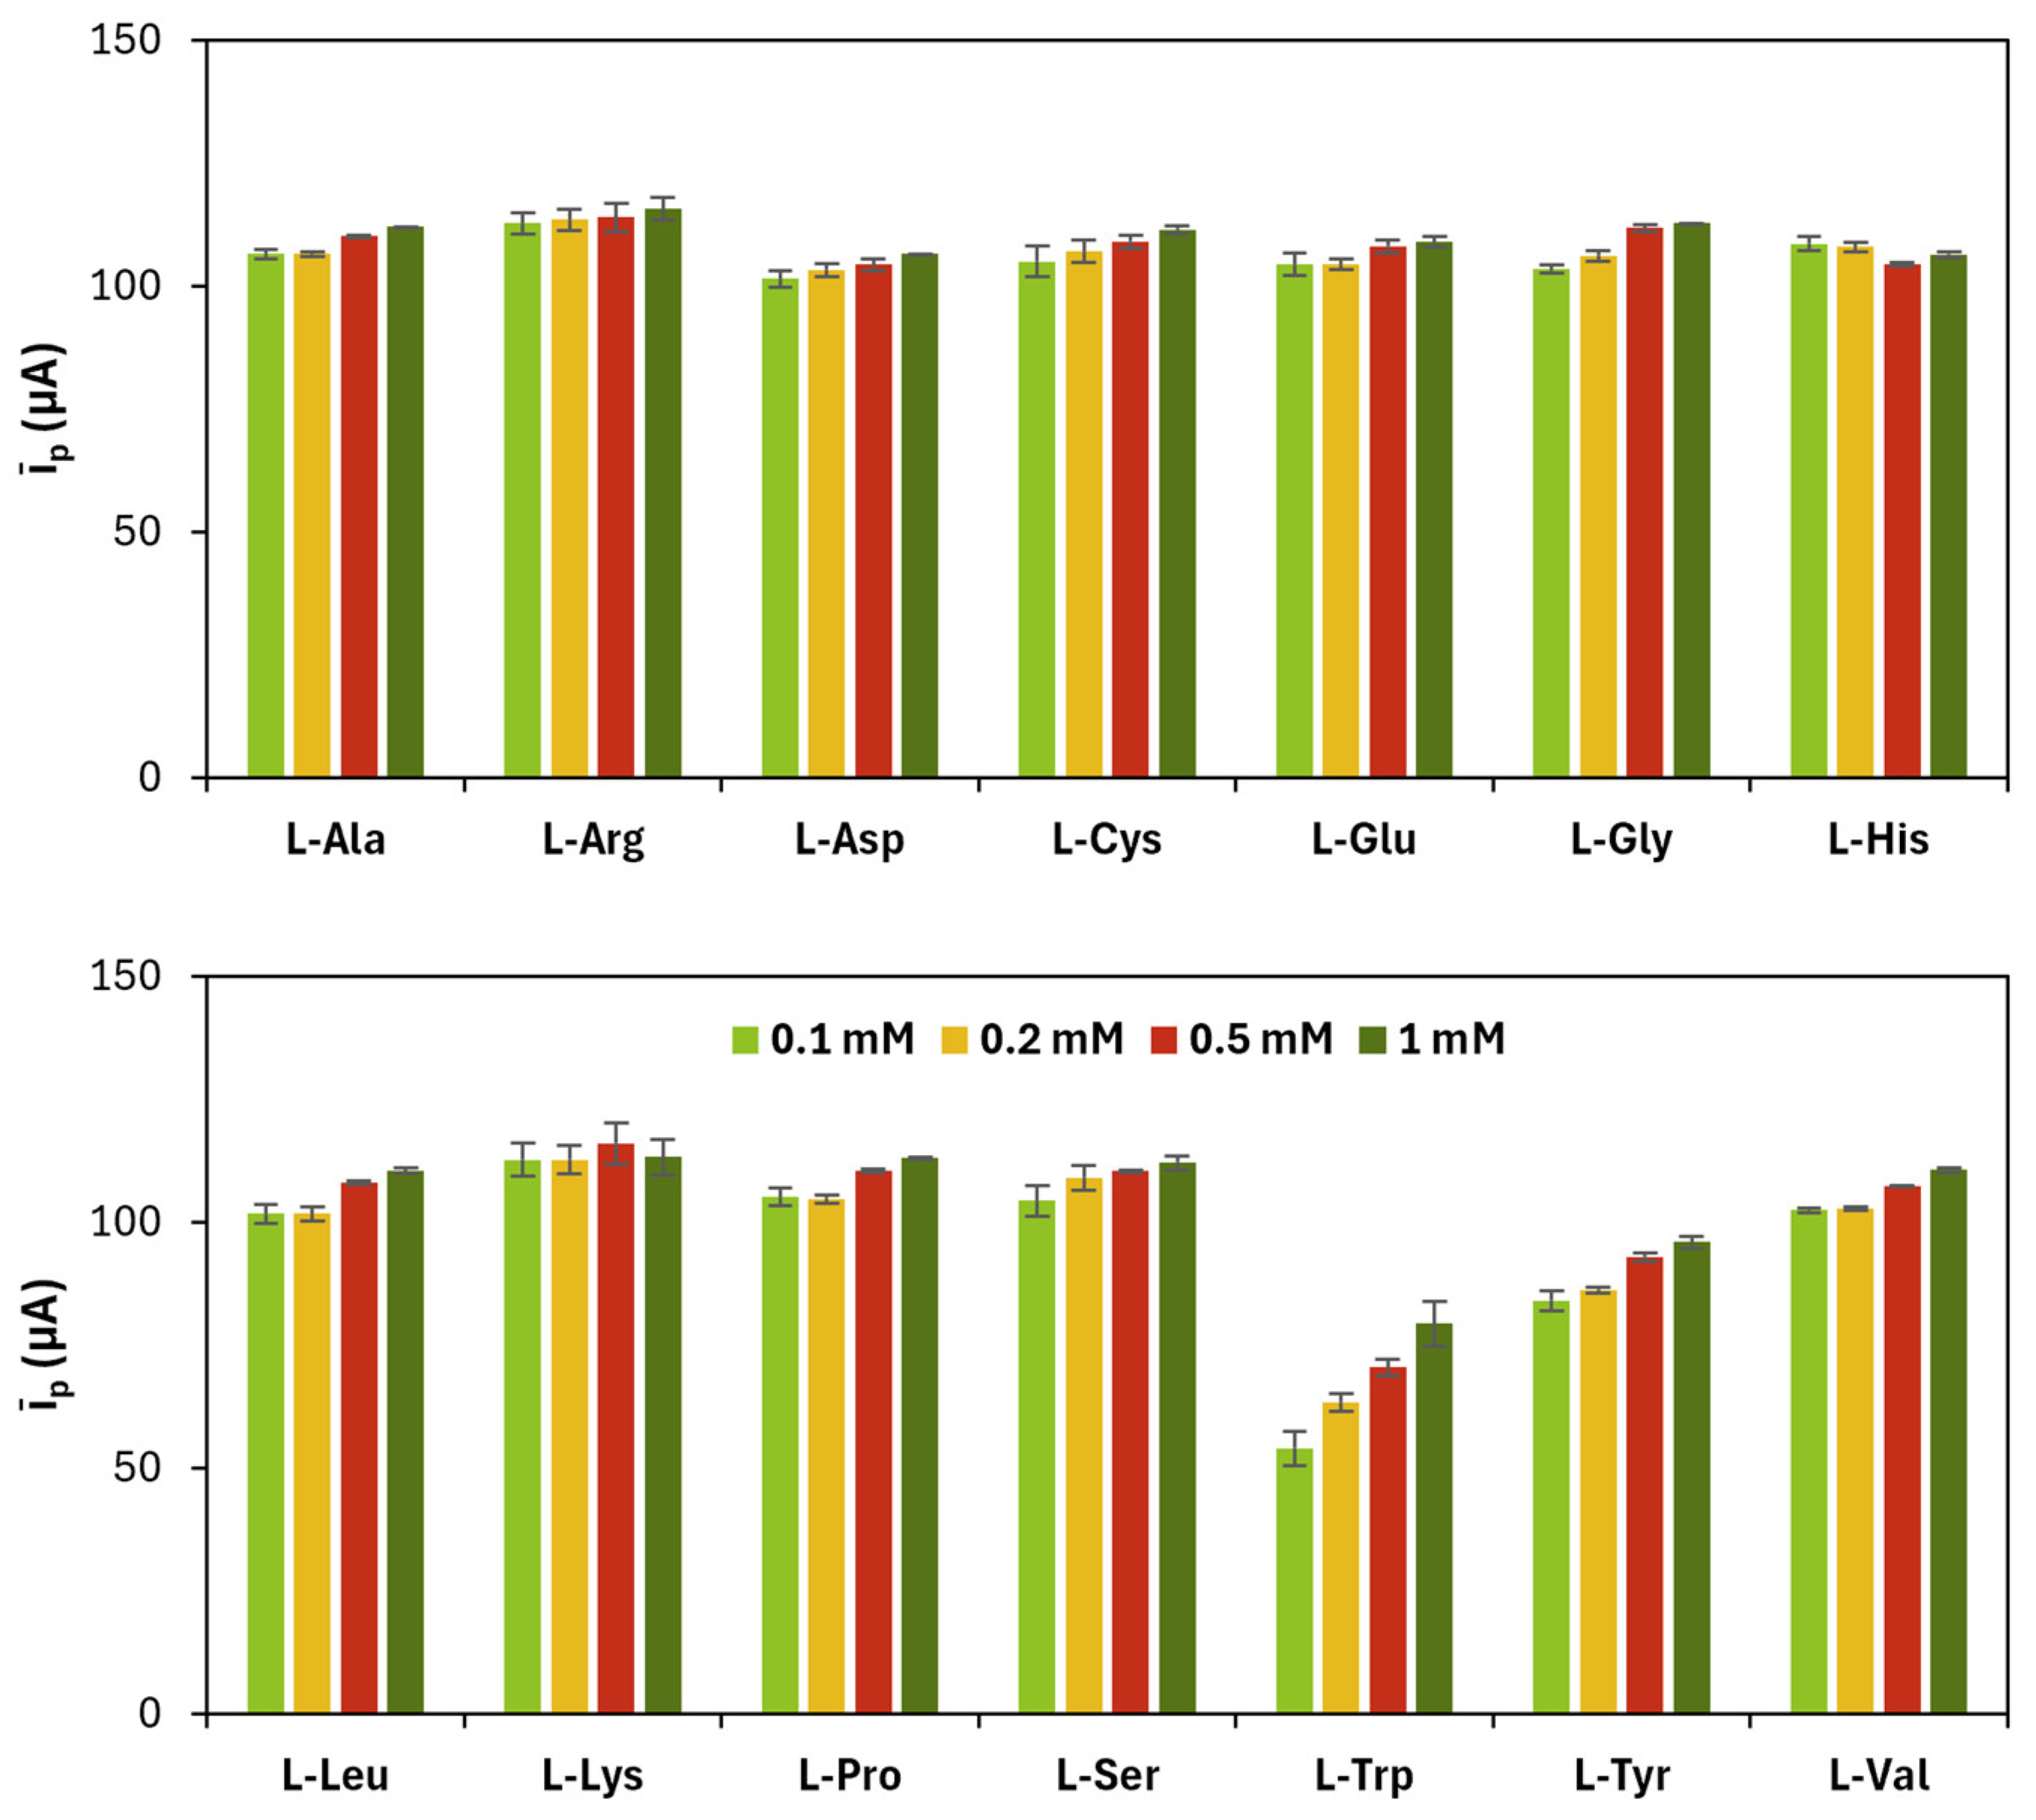
Figure 5.
Average (īp) of anodic (ip,a) and cathodic (ip,c) current peak heights obtained for each gold nanoparticles and poly(l-amino acid)-modified SPC at different number of CV cycles.
Figure 5.
Average (īp) of anodic (ip,a) and cathodic (ip,c) current peak heights obtained for each gold nanoparticles and poly(l-amino acid)-modified SPC at different number of CV cycles.
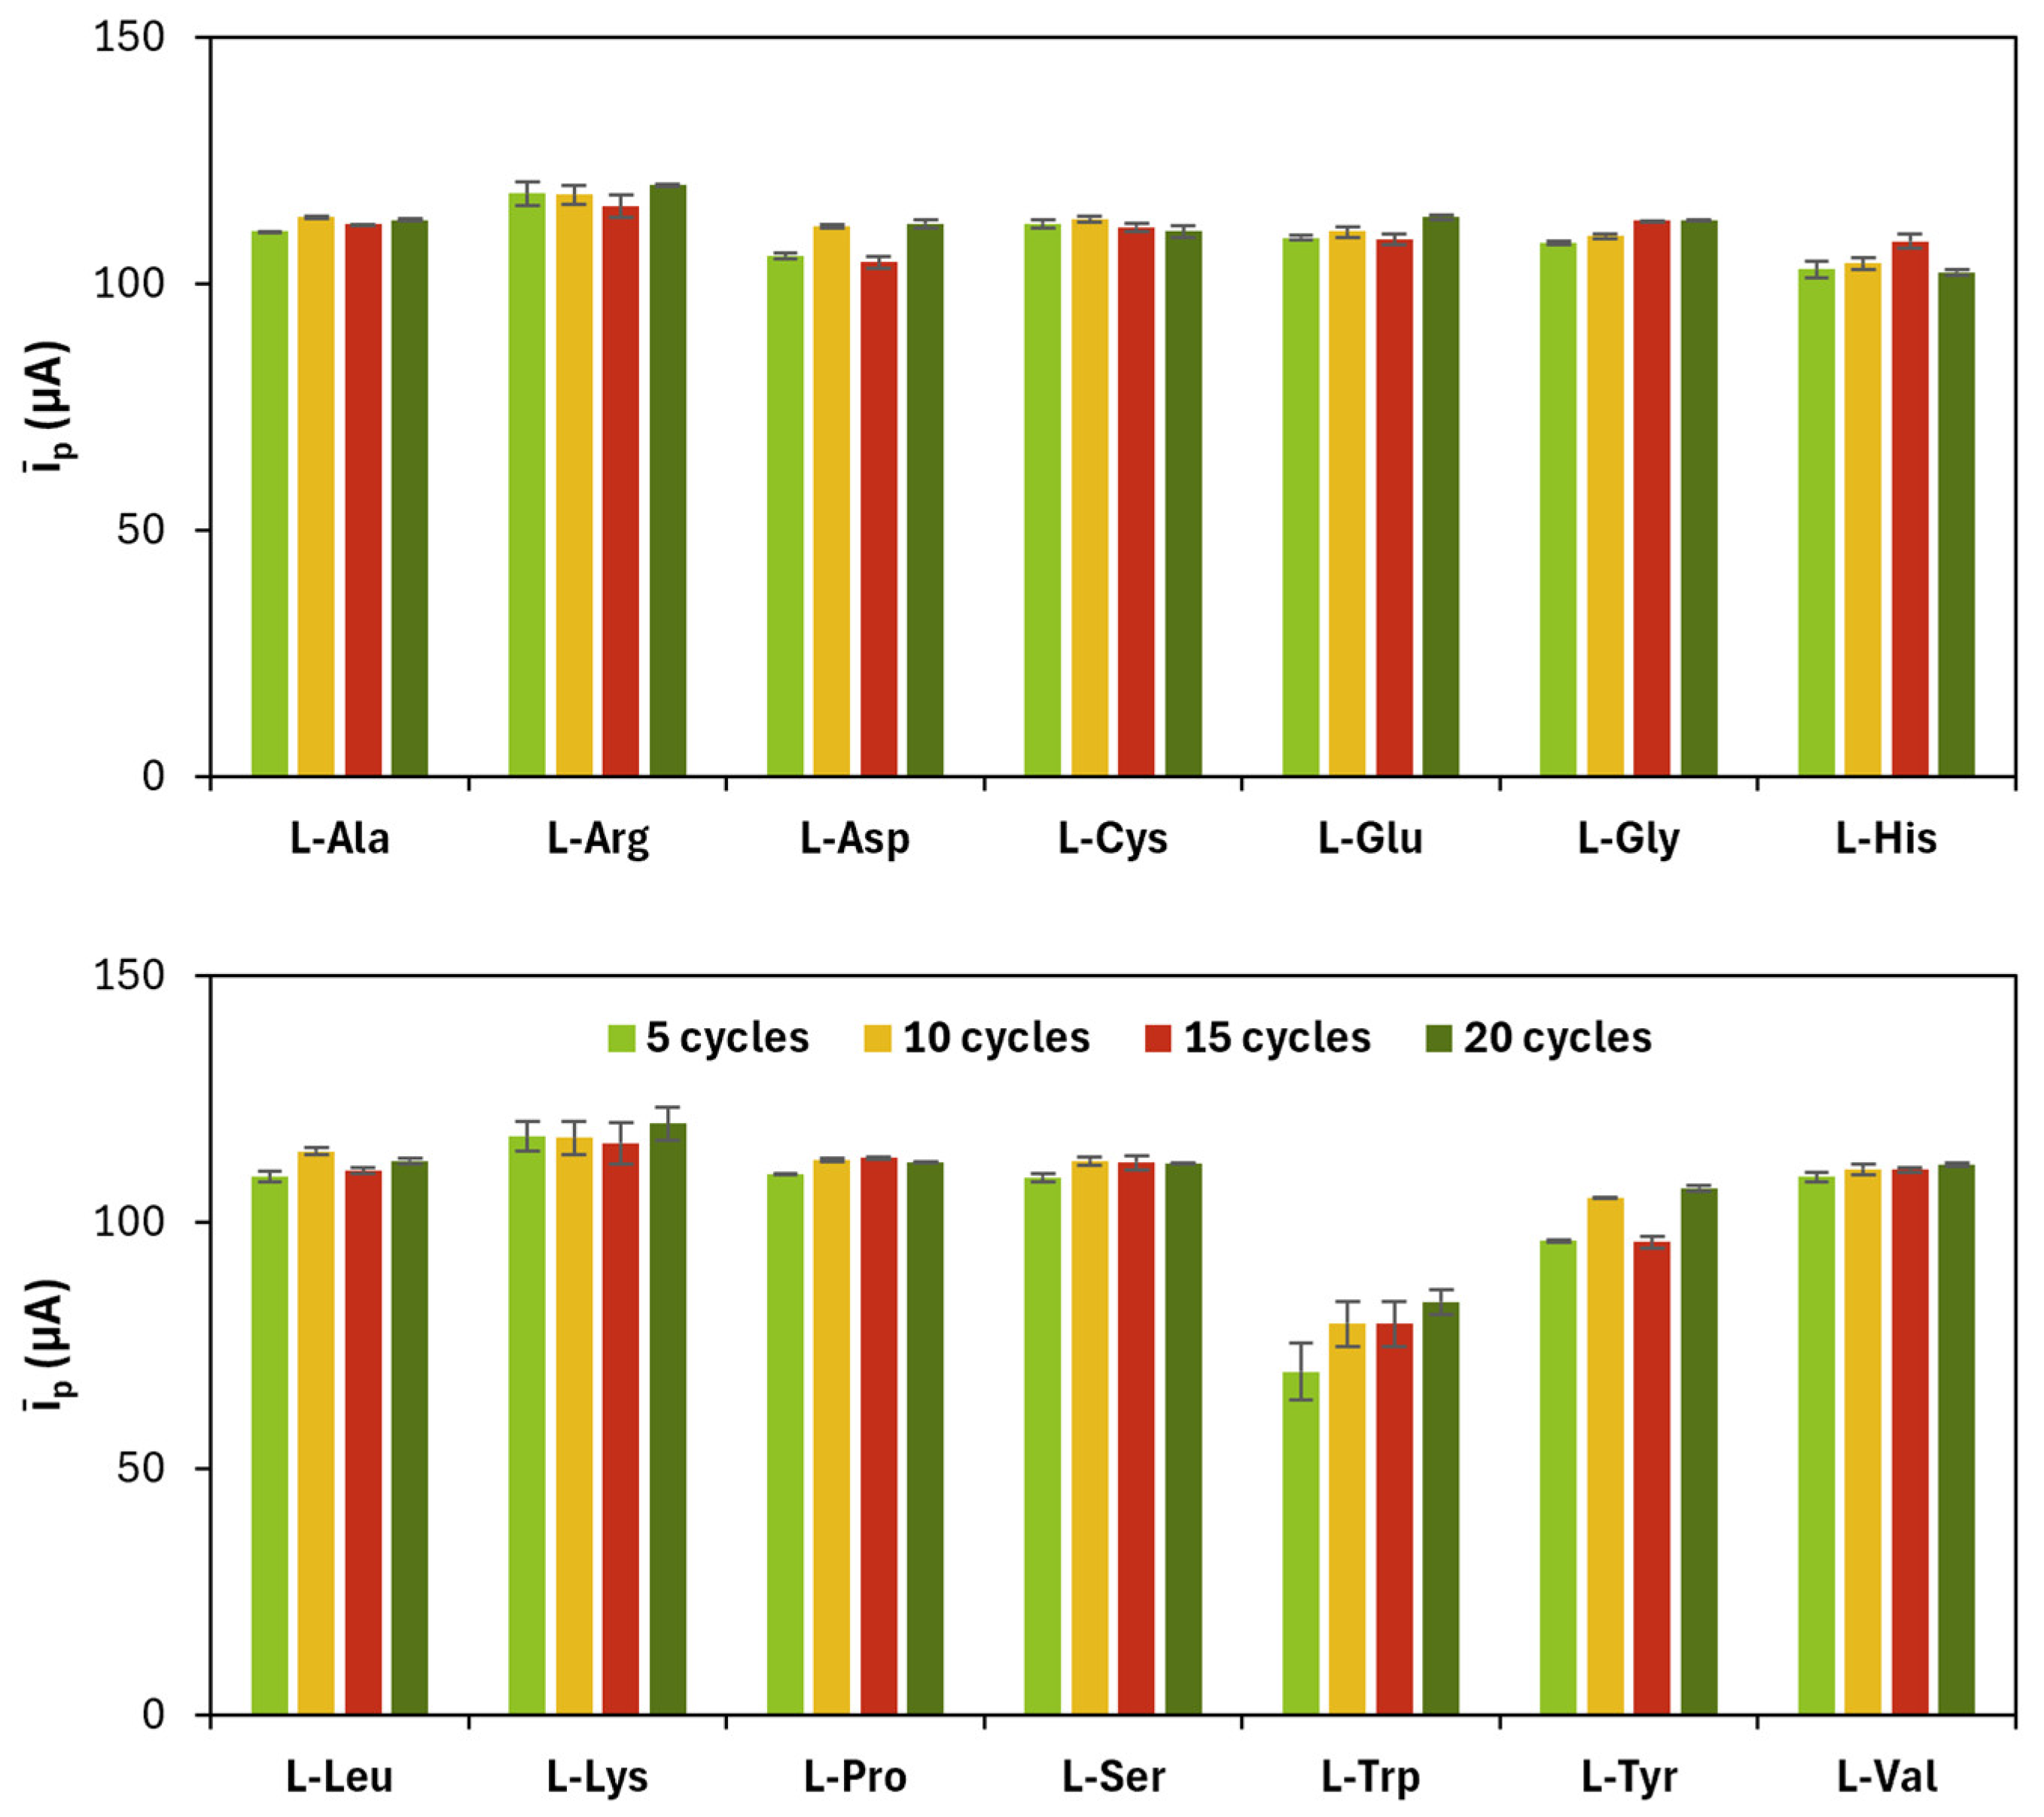
Figure 6.
SEM morphologies of (a) bare and (b) AuNPs/pAA-modified graphite electrodes. A representative sample containing l-Glu as the amino acid was analyzed.
Figure 6.
SEM morphologies of (a) bare and (b) AuNPs/pAA-modified graphite electrodes. A representative sample containing l-Glu as the amino acid was analyzed.
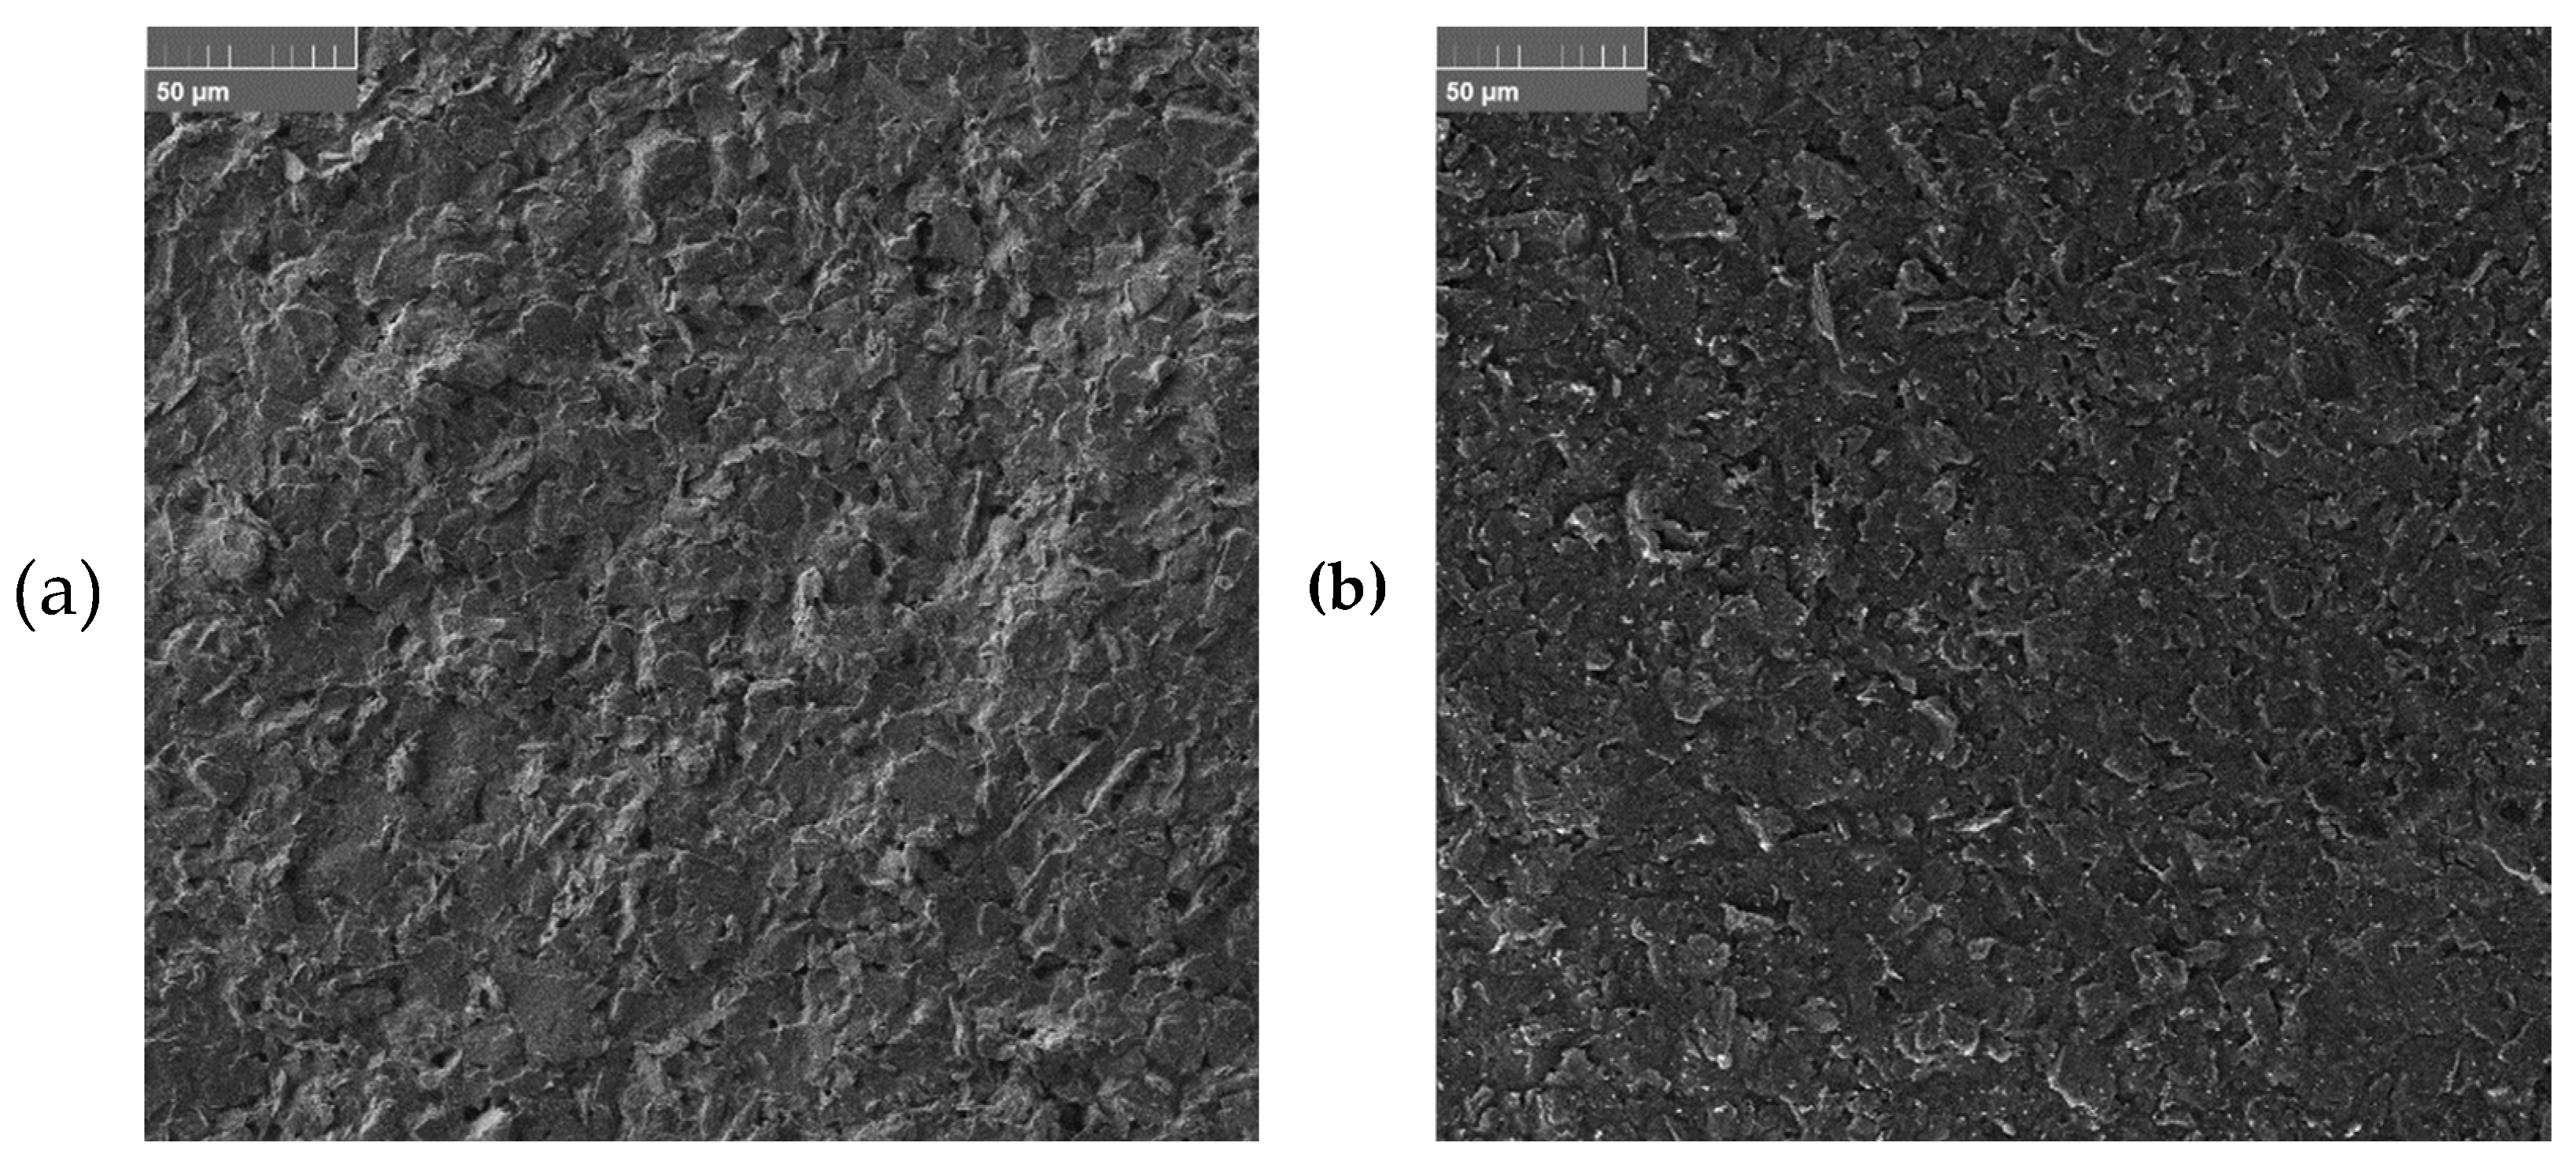
Figure 7.
Differential pulse voltammograms of 1-naphthol oxidation on gold nanoparticles and (a) poly(l-Arg), (b) poly(l-Glu) or (c) poly(l-Lys)-modified graphite electrodes; (d) corresponding calibration curves.
Figure 7.
Differential pulse voltammograms of 1-naphthol oxidation on gold nanoparticles and (a) poly(l-Arg), (b) poly(l-Glu) or (c) poly(l-Lys)-modified graphite electrodes; (d) corresponding calibration curves.
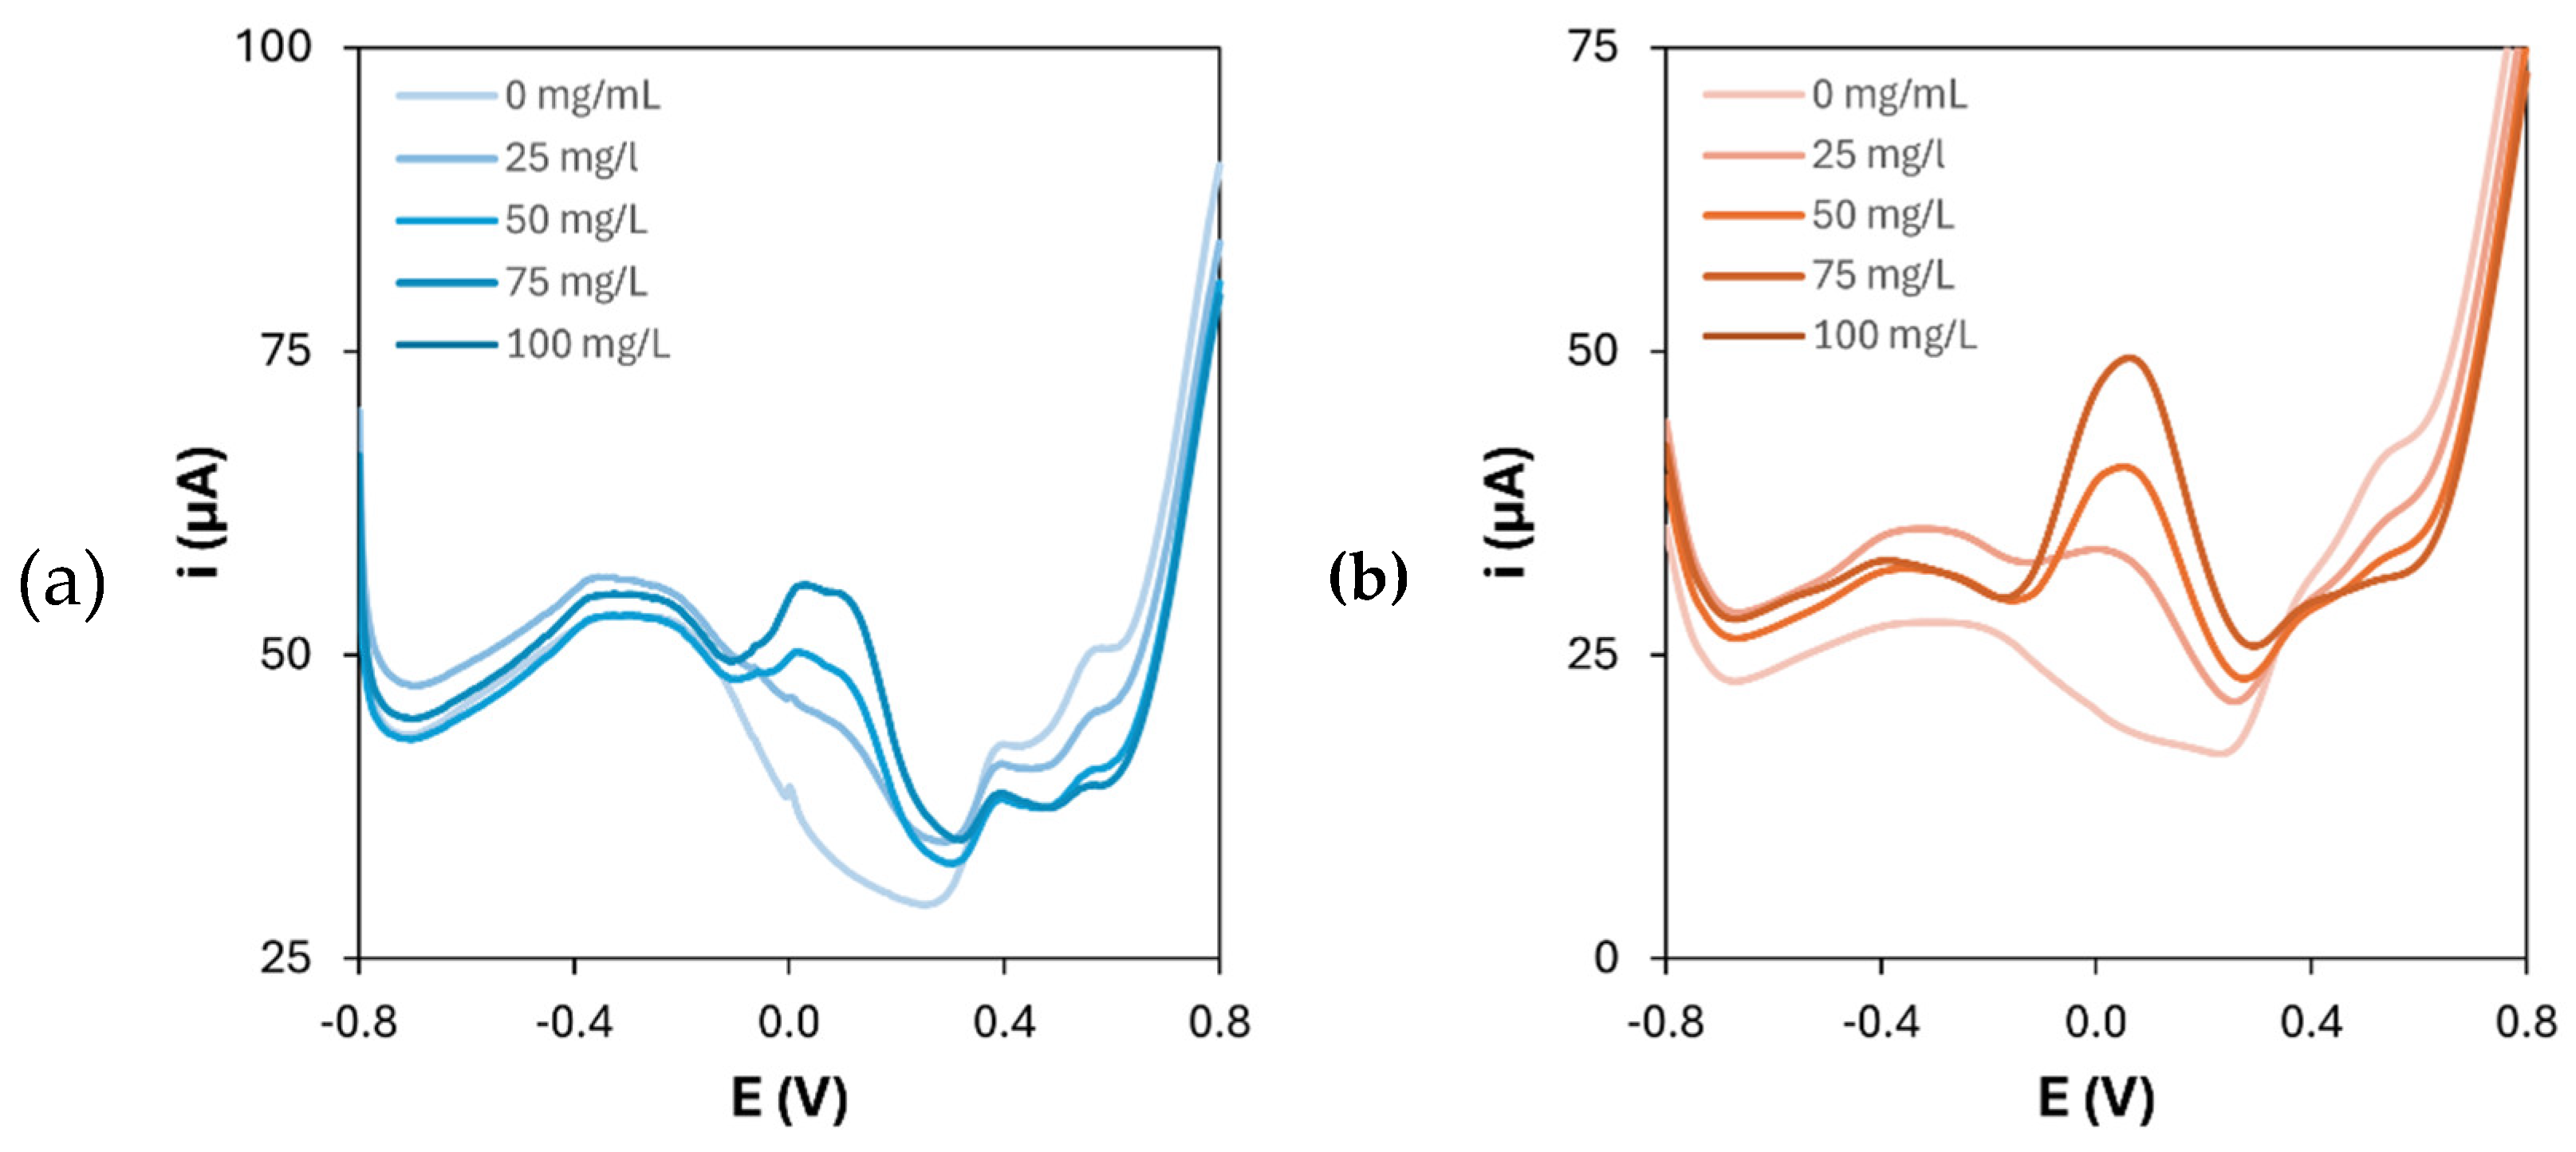
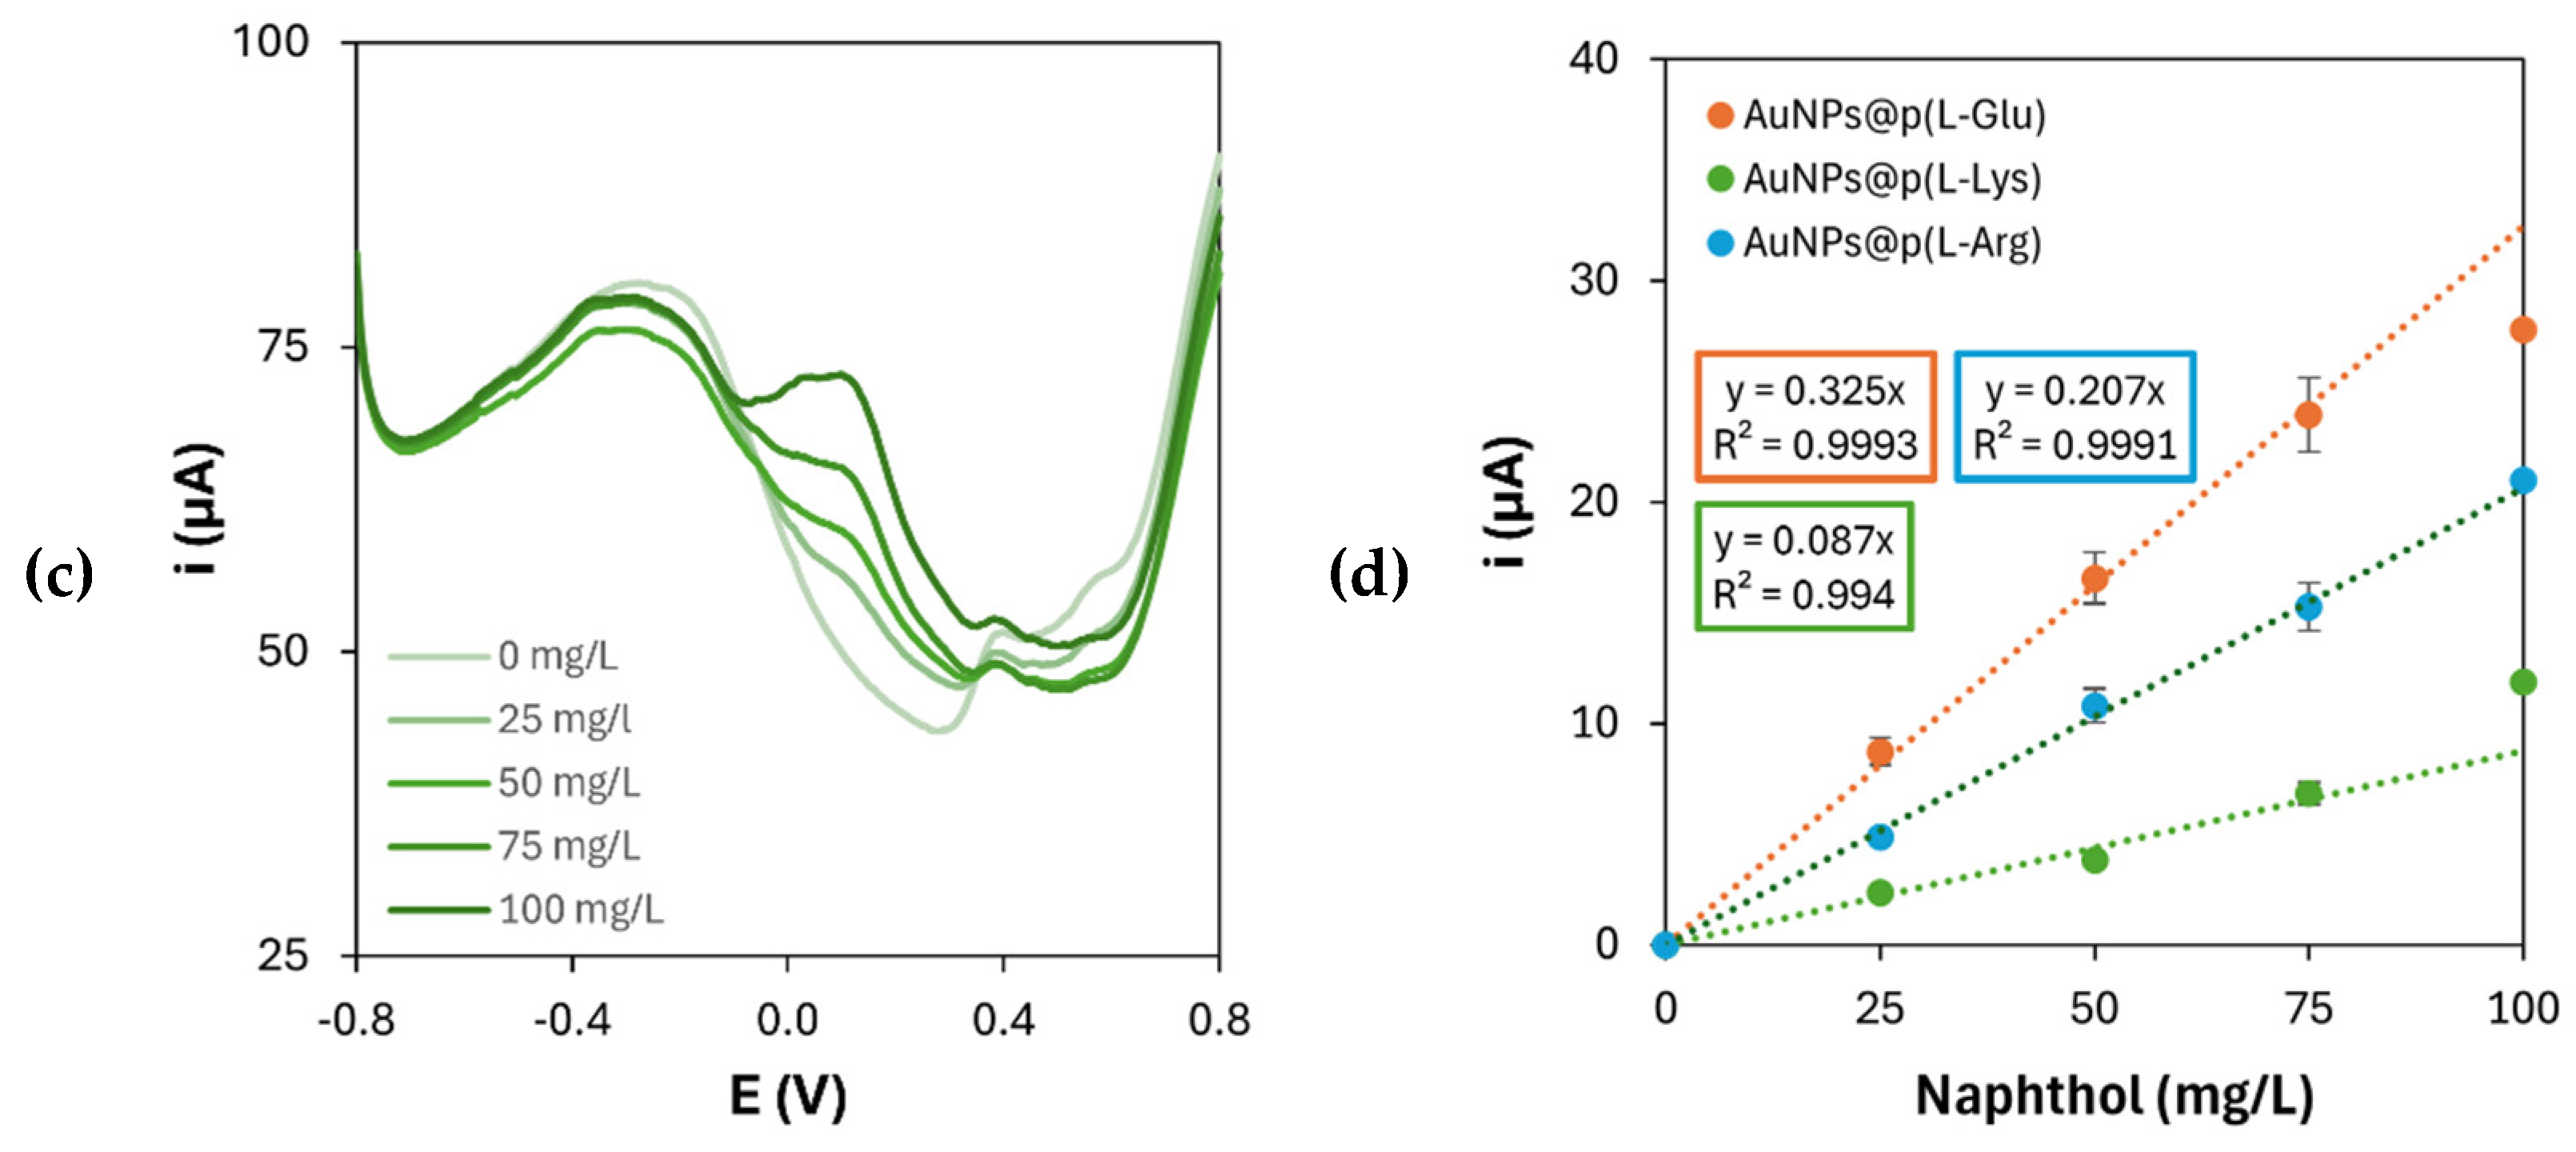
Figure 8.
(a) Differential pulse voltammograms of 1-naphthol oxidation on gold nanoparticles-modified graphite electrodes and (b) corresponding calibration curve ([HAuCl4] = 1 mM; number of CV cycles for the electrodeposition: 20).
Figure 8.
(a) Differential pulse voltammograms of 1-naphthol oxidation on gold nanoparticles-modified graphite electrodes and (b) corresponding calibration curve ([HAuCl4] = 1 mM; number of CV cycles for the electrodeposition: 20).
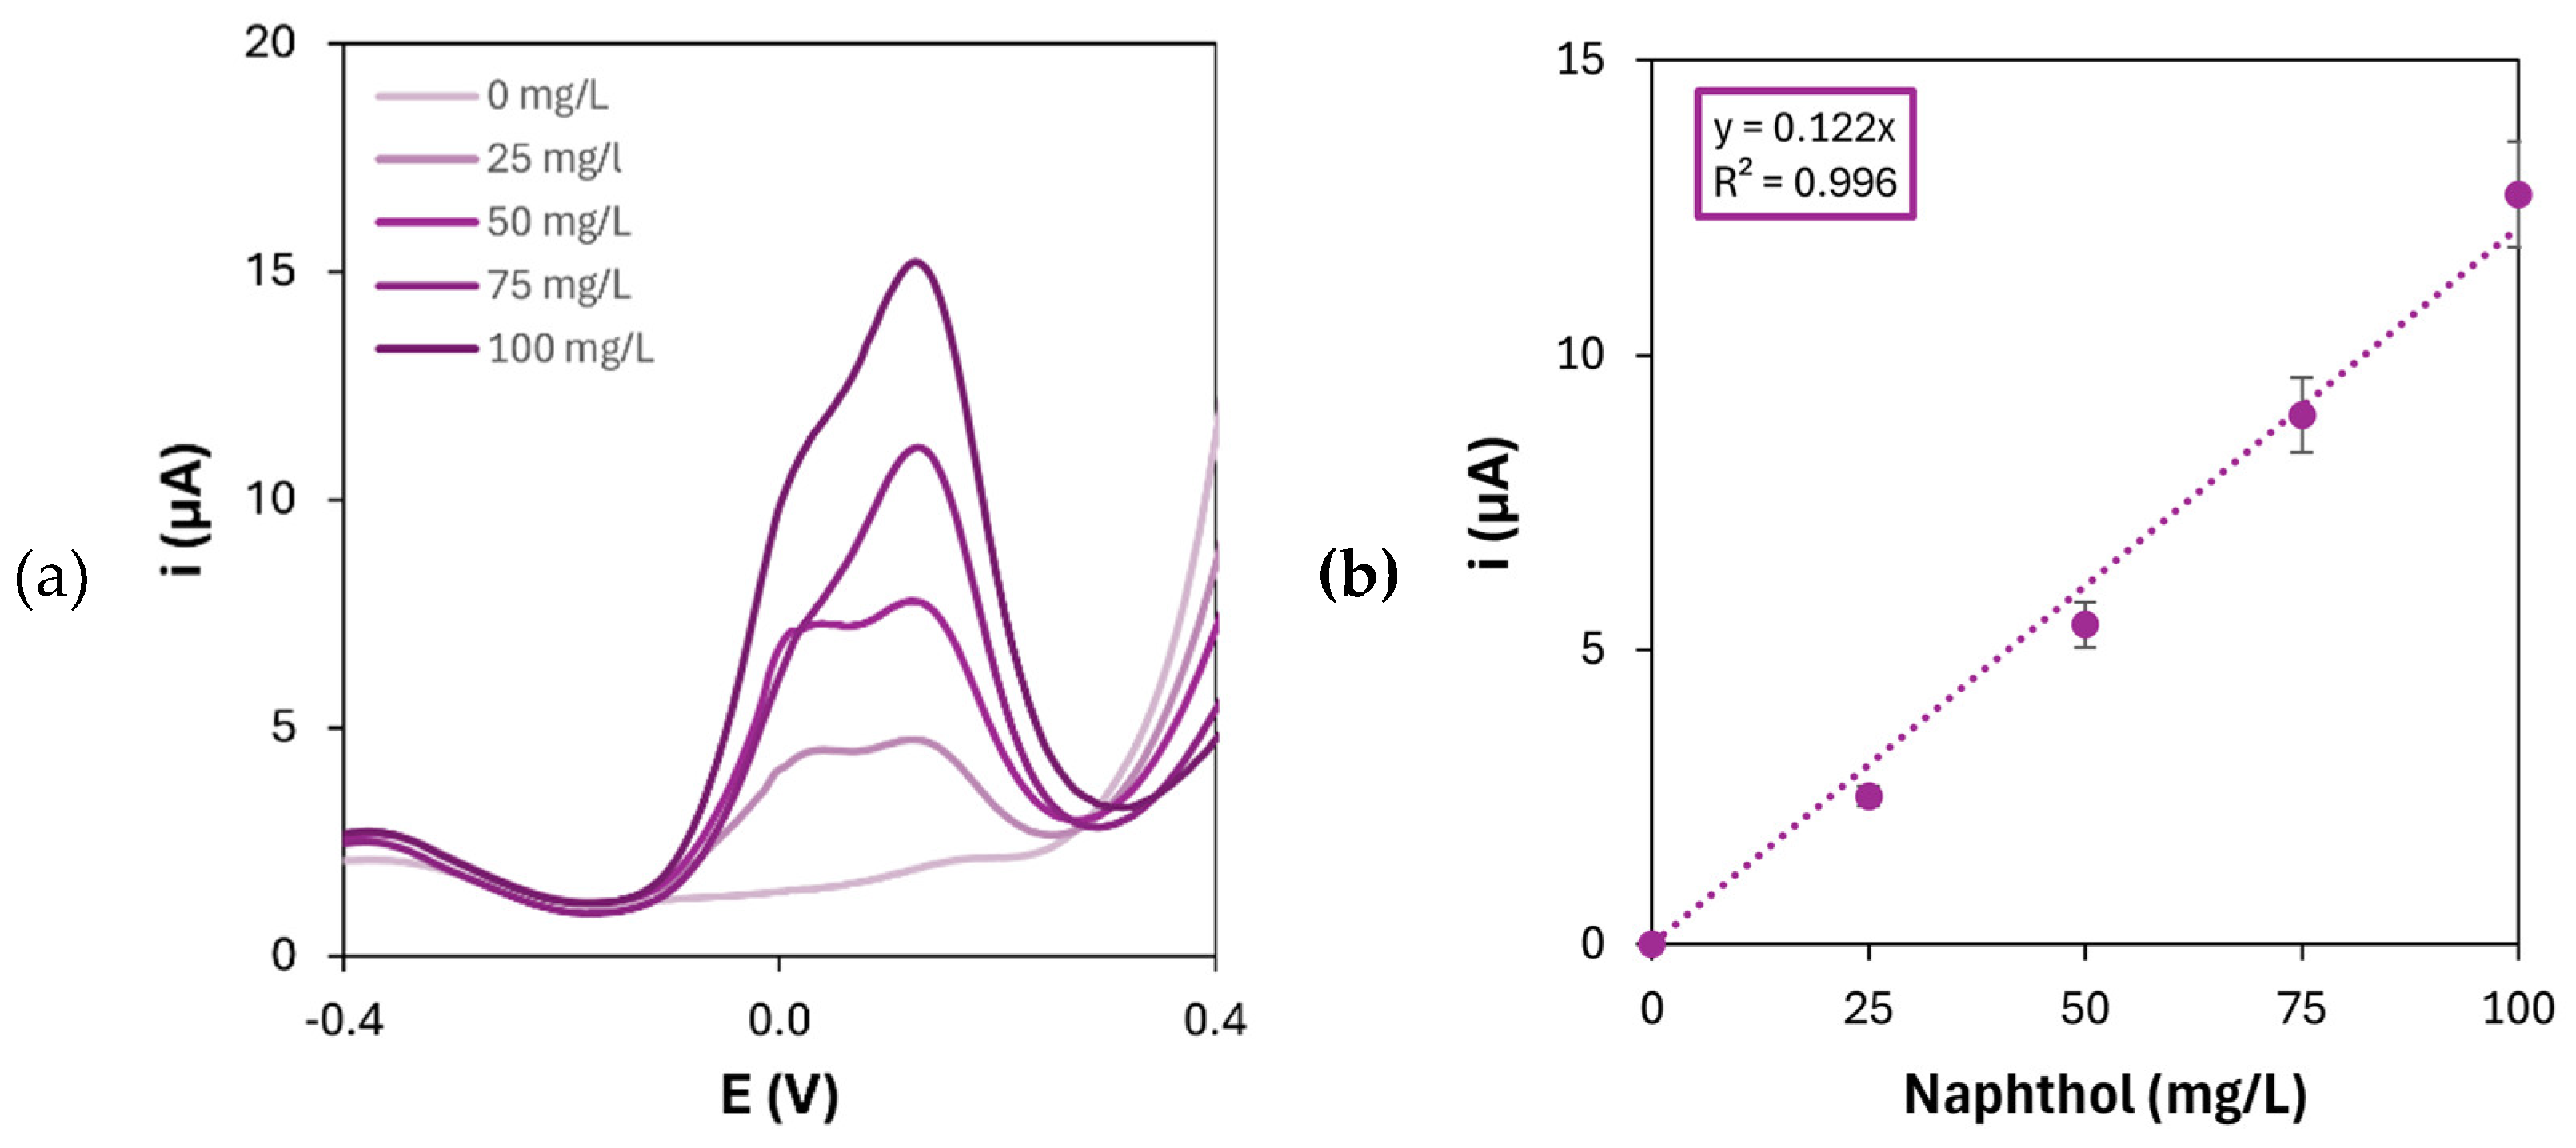

Table 1.
List of ratios between anodic and cathodic current peak heights (|ip,a/ip,c|) and peak potential differences (ΔEp) obtained for each poly(l-amino acid)-modified SPC at different concentrations of the monomer (number of CV cycles: 10).
Table 1.
List of ratios between anodic and cathodic current peak heights (|ip,a/ip,c|) and peak potential differences (ΔEp) obtained for each poly(l-amino acid)-modified SPC at different concentrations of the monomer (number of CV cycles: 10).
| |ip,a/ip,c| | ΔEp (mV) | |||||||
|---|---|---|---|---|---|---|---|---|
| [l-AA] (mM) | 1 | 2 | 5 | 10 | 1 | 2 | 5 | 10 |
| l-Ala | 0.98 | 0.98 | 0.98 | 0.98 | 260 | 255 | 260 | 250 |
| l-Arg | 0.98 | 0.98 | 0.98 | 0.98 | 235 | 225 | 235 | 225 |
| l-Asp | 0.97 | 0.97 | 0.97 | 0.96 | 225 | 225 | 230 | 240 |
| l-Cys | 0.94 | 0.93 | 0.91 | 0.96 | 195 | 200 | 200 | 220 |
| l-Glu | 0.98 | 0.97 | 0.96 | 0.96 | 230 | 230 | 235 | 255 |
| l-Gly | 0.97 | 0.97 | 0.98 | 0.98 | 220 | 225 | 220 | 215 |
| l-His | 0.95 | 0.94 | 0.93 | 0.92 | 215 | 215 | 210 | 195 |
| l-Leu | 0.96 | 0.97 | 0.97 | 0.96 | 250 | 240 | 245 | 240 |
| l-Lys | 0.96 | 0.95 | 0.96 | 0.96 | 205 | 205 | 200 | 185 |
| l-Pro | 0.98 | 0.98 | 0.97 | 0.97 | 260 | 250 | 240 | 230 |
| l-Ser | 0.98 | 0.98 | 0.98 | 0.98 | 235 | 235 | 230 | 235 |
| l-Trp | 0.77 | 0.47 | 0.58 | 0.56 | 205 | 85 | 70 | 70 |
| l-Tyr* | 0.96 | 1.21 | - | - | 205 | 490 | - | - |
| l-Val | 0.97 | 0.97 | 0.97 | 0.98 | 220 | 230 | 220 | 215 |
* The maximum solubility of l-Tyr in H2O is 2 mM.
Table 2.
List of ratios between anodic and cathodic current peak heights (|ip,a/ip,c|) and peak potential differences (ΔEp) obtained for each poly(l-amino acid)-modified SPC at different number of CV cycles.
Table 2.
List of ratios between anodic and cathodic current peak heights (|ip,a/ip,c|) and peak potential differences (ΔEp) obtained for each poly(l-amino acid)-modified SPC at different number of CV cycles.
| |ip,a/ip,c| | ΔEp (mV) | |||||||
|---|---|---|---|---|---|---|---|---|
| CV cycles | 5 | 10 | 15 | 20 | 5 | 10 | 15 | 20 |
| l-Ala (10 mM) | 0.98 | 0.98 | 0.98 | 0.96 | 235 | 250 | 265 | 280 |
| l-Arg (10 mM) | 0.97 | 0.98 | 0.98 | 0.98 | 215 | 225 | 245 | 260 |
| l-Asp (2 mM) | 0.99 | 0.97 | 0.96 | 0.93 | 240 | 225 | 250 | 270 |
| l-Cys (1 mM) | 0.96 | 0.94 | 0.97 | 0.96 | 210 | 195 | 210 | 220 |
| l-Glu (1 mM) | 0.98 | 0.98 | 0.92 | 0.91 | 220 | 230 | 250 | 275 |
| l-Gly (10 mM) | 0.98 | 0.98 | 0.97 | 0.94 | 205 | 215 | 230 | 265 |
| l-His (1 mM) | 0.97 | 0.95 | 0.95 | 0.92 | 215 | 215 | 225 | 230 |
| l-Leu (5 mM) | 0.98 | 0.97 | 0.96 | 0.93 | 225 | 245 | 250 | 275 |
| l-Lys (10 mM) | 0.95 | 0.96 | 0.97 | 0.97 | 195 | 185 | 200 | 215 |
| l-Pro (10 mM) | 0.96 | 0.97 | 0.96 | 0.96 | 225 | 230 | 240 | 270 |
| l-Ser (10 mM) | 0.97 | 0.98 | 0.98 | 0.98 | 235 | 235 | 250 | 255 |
| l-Trp (1 mM) | 0.83 | 0.77 | 0.76 | 0.70 | 240 | 205 | 200 | 205 |
| l-Tyr (1 mM) | 0.98 | 0.96 | 0.94 | 0.91 | 205 | 205 | 230 | 265 |
| l-Val (10 mM) | 0.97 | 0.98 | 0.96 | 0.95 | 215 | 215 | 220 | 235 |
Table 3.
Optimized parameters for the polymerization of l-amino acids on SPCs.
| [l-AA] (mM) | CV cycles | |
|---|---|---|
| l-Ala | 10 | 10 |
| l-Arg | 10 | 10 |
| l-Asp | 2 | 5 |
| l-Cys | 1 | 20 |
| l-Glu | 1 | 5 |
| l-Gly | 10 | 5 |
| l-His | 1 | 5 |
| l-Leu | 5 | 5 |
| l-Lys | 10 | 15 |
| l-Pro | 10 | 5 |
| l-Ser | 10 | 20 |
| l-Trp | 1 | 5 |
| l-Tyr | 1 | 5 |
| l-Val | 10 | 10 |
Table 4.
List of ratios between anodic and cathodic current peak heights (|ip,a/ip,c|) and peak potential differences (ΔEp) obtained for each gold nanoparticles and poly(l-amino acid)-modified SPC at different concentrations of the precursor (number of CV cycles: 15).
Table 4.
List of ratios between anodic and cathodic current peak heights (|ip,a/ip,c|) and peak potential differences (ΔEp) obtained for each gold nanoparticles and poly(l-amino acid)-modified SPC at different concentrations of the precursor (number of CV cycles: 15).
| |ip,a/ip,c| | ΔEp (mV) | |||||||
|---|---|---|---|---|---|---|---|---|
| [HAuCl4] (mM) | 0.1 | 0.2 | 0.5 | 1 | 0.1 | 0.2 | 0.5 | 1 |
| l-Ala (10 mM) | 0.99 | 0.99 | 1.00 | 1.00 | 235 | 235 | 235 | 235 |
| l-Arg (10 mM) | 0.97 | 0.97 | 0.97 | 0.97 | 220 | 210 | 210 | 210 |
| l-Asp (2 mM) | 0.98 | 0.98 | 0.98 | 1.00 | 210 | 210 | 205 | 215 |
| l-Cys (1 mM) | 0.96 | 0.97 | 0.98 | 0.99 | 225 | 235 | 230 | 225 |
| l-Glu (1 mM) | 0.97 | 0.98 | 0.98 | 0.99 | 210 | 215 | 215 | 220 |
| l-Gly (10 mM) | 0.99 | 0.99 | 0.99 | 1.00 | 215 | 220 | 215 | 220 |
| l-His (1 mM) | 0.98 | 0.99 | 1.00 | 1.01 | 210 | 210 | 220 | 225 |
| l-Leu (5 mM) | 0.97 | 0.98 | 0.99 | 0.99 | 245 | 245 | 230 | 230 |
| l-Lys (10 mM) | 0.96 | 0.96 | 0.95 | 0.96 | 220 | 225 | 220 | 245 |
| l-Pro (10 mM) | 0.97 | 0.99 | 1.00 | 1.00 | 240 | 240 | 225 | 230 |
| l-Ser (10 mM) | 0.96 | 0.97 | 1.00 | 0.98 | 235 | 235 | 230 | 245 |
| l-Trp (1 mM) | 0.91 | 0.96 | 1.03 | 1.09 | 270 | 260 | 290 | 270 |
| l-Tyr (1 mM) | 0.97 | 0.99 | 0.99 | 0.98 | 235 | 235 | 235 | 235 |
| l-Val (10 mM) | 0.99 | 1.00 | 1.00 | 1.01 | 225 | 230 | 235 | 235 |
Table 5.
List of ratios between anodic and cathodic current peak heights (|ip,a/ip,c|) and peak potential differences (ΔEp) obtained for each gold nanoparticles and poly(l-amino acid)-modified SPC at different number of CV cycles.
Table 5.
List of ratios between anodic and cathodic current peak heights (|ip,a/ip,c|) and peak potential differences (ΔEp) obtained for each gold nanoparticles and poly(l-amino acid)-modified SPC at different number of CV cycles.
| |ip,a/ip,c| | ΔEp (mV) | ||||||||
|---|---|---|---|---|---|---|---|---|---|
| CV cycles | 5 | 10 | 15 | 20 | 5 | 10 | 15 | 20 | |
| l-Ala (10 mM) | HAuCl4 (1 mM) | 1.00 | 1.00 | 1.00 | 1.00 | 235 | 235 | 235 | 230 |
| l-Arg (10 mM) | HAuCl4 (1 mM) | 0.97 | 0.98 | 0.97 | 1.00 | 205 | 210 | 210 | 210 |
| l-Asp (2 mM) | HAuCl4 (0.5 mM) | 0.99 | 0.99 | 0.98 | 1.01 | 215 | 210 | 205 | 210 |
| l-Cys (1 mM) | HAuCl4 (1 mM) | 0.99 | 0.99 | 0.99 | 1.01 | 230 | 230 | 225 | 245 |
| l-Glu (1 mM) | HAuCl4 (1 mM) | 0.99 | 0.99 | 0.99 | 0.99 | 215 | 215 | 220 | 225 |
| l-Gly (10 mM) | HAuCl4 (1 mM) | 1.00 | 1.01 | 1.00 | 1.00 | 215 | 220 | 220 | 210 |
| l-His (1 mM) | HAuCl4 (0.1 mM) | 0.98 | 0.98 | 0.98 | 0.99 | 220 | 225 | 210 | 230 |
| l-Leu (5 mM) | HAuCl4 (1 mM) | 0.99 | 0.99 | 0.99 | 1.01 | 230 | 220 | 230 | 235 |
| l-Lys (10 mM) | HAuCl4 (0.5 mM) | 0.96 | 0.96 | 0.95 | 0.96 | 215 | 220 | 220 | 235 |
| l-Pro (10 mM) | HAuCl4 (1 mM) | 1.00 | 1.00 | 1.00 | 1.00 | 230 | 225 | 230 | 225 |
| l-Ser (10 mM) | HAuCl4 (1 mM) | 0.99 | 1.01 | 0.98 | 1.00 | 240 | 240 | 245 | 255 |
| l-Trp (1 mM) | HAuCl4 (1 mM) | 1.12 | 1.08 | 1.09 | 1.04 | 300 | 270 | 270 | 270 |
| l-Tyr (1 mM) | HAuCl4 (1 mM) | 1.00 | 1.00 | 0.98 | 0.99 | 240 | 220 | 235 | 220 |
| l-Val (10 mM) | HAuCl4 (1 mM) | 1.01 | 1.01 | 1.01 | 1.01 | 230 | 230 | 235 | 225 |
Table 6.
Optimized parameters for the deposition of gold nanoparticles on poly(l-amino acids)-modified SPCs.
Table 6.
Optimized parameters for the deposition of gold nanoparticles on poly(l-amino acids)-modified SPCs.
| [HAuCl4] (mM) | CV cycles | |
|---|---|---|
| l-Ala | 1 | 10 |
| l-Arg | 1 | 20 |
| l-Asp | 0.5 | 10 |
| l-Cys | 1 | 10 |
| l-Glu | 1 | 20 |
| l-Gly | 1 | 15 |
| l-His | 0.1 | 15 |
| l-Leu | 1 | 10 |
| l-Lys | 0.5 | 20 |
| l-Pro | 1 | 15 |
| l-Ser | 1 | 10 |
| l-Trp | 1 | 20 |
| l-Tyr | 1 | 20 |
| l-Val | 1 | 20 |
Table 7.
Electroactive surface areas of gold nanoparticles and poly(l-amino acids)-modified SPCs.
| Aanodic (mm2) | Acathodic (mm2) | Aaverage (mm2) | SD (mm2) | %RSD (%) | |
|---|---|---|---|---|---|
| l-Ala | 9.1 | 8.5 | 8.8 | 0.4 | 4.7 |
| l-Arg | 9.8 | 10.1 | 10.0 | 0.2 | 2.1 |
| l-Asp | 8.6 | 8.5 | 8.5 | 0.1 | 1.0 |
| l-Cys | 8.9 | 8.6 | 8.8 | 0.2 | 2.2 |
| l-Glu | 9.8 | 9.0 | 9.4 | 0.5 | 5.6 |
| l-Gly | 8.7 | 8.4 | 8.6 | 0.2 | 2.5 |
| l-His | 7.8 | 7.8 | 7.8 | < 0.1 | 0.2 |
| l-Leu | 8.6 | 8.4 | 8.5 | 0.2 | 2.1 |
| l-Lys | 9.4 | 9.7 | 9.5 | 0.3 | 2.6 |
| l-Pro | 8.7 | 8.7 | 8.7 | < 0.1 | 0.1 |
| l-Ser | 8.1 | 8.1 | 8.1 | < 0.1 | 0.1 |
| l-Trp | 4.8 | 3.6 | 4.2 | 0.9 | 20.7 |
| l-Tyr | 9.1 | 8.5 | 8.8 | 0.5 | 5.1 |
| l-Val | 8.8 | 8.3 | 8.5 | 0.3 | 4.0 |
Table 8.
List of sensitivity values obtained for gold nanoparticles and p(l-Arg), p(l-Glu) and p(l-Lys)-modified SPC at different concentrations of the monomers and number of CV cycles for the electropolymerization ([HAuCl4] = 1 mM for p(l-Arg) and p(l-Glu), [HAuCl4] = 0.5 mM for p(l-Lys); number of CV cycles for the electrodeposition: 20).
| Sensitivity (mA·L/g) | ||||
|---|---|---|---|---|
| [l-AA] (mM) | 1 | 2 | 5 | 10 |
| l-Arg | 0.180 | 0.193 | 0.199 | 0.207 |
| l-Glu | 0.323 | 0.317 | 0.312 | 0.306 |
| l-Lys | 0.076 | 0.077 | 0.082 | 0.084 |
| CV cycles | 5 | 10 | 15 | 20 |
| l-Arg (10 mM) | 0.185 | 0.207 | 0.192 | 0.184 |
| l-Glu (1 mM) | 0.325 | 0.323 | 0.303 | 0.290 |
| l-Lys (10 mM) | 0.079 | 0.084 | 0.087 | 0.087 |
Disclaimer/Publisher’s Note: The statements, opinions and data contained in all publications are solely those of the individual author(s) and contributor(s) and not of MDPI and/or the editor(s). MDPI and/or the editor(s) disclaim responsibility for any injury to people or property resulting from any ideas, methods, instructions or products referred to in the content. |
© 2025 by the authors. Licensee MDPI, Basel, Switzerland. This article is an open access article distributed under the terms and conditions of the Creative Commons Attribution (CC BY) license (http://creativecommons.org/licenses/by/4.0/).
Copyright: This open access article is published under a Creative Commons CC BY 4.0 license, which permit the free download, distribution, and reuse, provided that the author and preprint are cited in any reuse.


