
Submitted:
08 November 2025
Posted:
11 November 2025
You are already at the latest version
Abstract
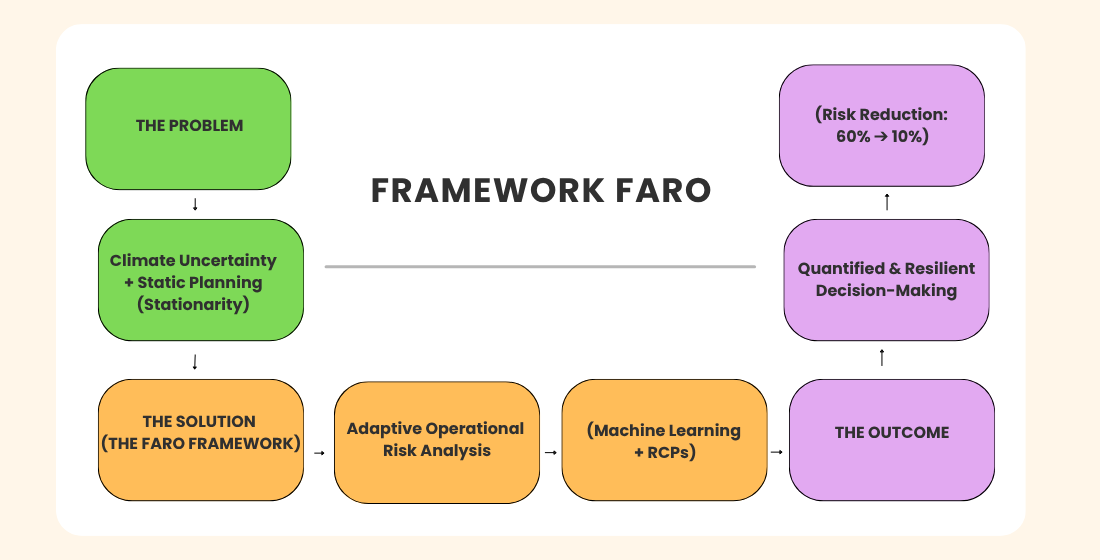
Marine Spatial Planning (MSP), the prevailing global governance paradigm for sustaina-ble ocean development, confronts the critical challenge of integrating climatic uncertainty into its core processes. Reliance on the stationarity assumption compromises risk assess-ments for long-lifecycle assets within the Blue Economy, thereby impeding progress to-ward principal sustainability objectives. This article introduces and validates FARO (Framework for Adaptive Operational Risk Analysis), a methodological framework de-signed to operationalize the transition toward climate-smart MSP. The framework's core innovation lies in furnishing a scalable quantitative structure that directly links high-resolution climatological projections with operational decision-making and capital planning, thereby converting climatic uncertainty into actionable operational risk indica-tors. Its applicability is demonstrated via a case study of Brazil's emergent offshore wind industry (Southeastern Marine Region), analyzing impacts under the RCP 4.5 and RCP 8.5 scenarios. The findings quantify the critical role of technological resilience as a key adap-tation variable, revealing a potential reduction in operational downtime from approxi-mately 60% to 10% by enhancing operational capacity from Standard (SWH 2.0m) to Flexible (SWH 2.5m). In conclusion, FARO proves to be a robust decision-support instru-ment, effectively bridging state-of-the-art regional climate science with participatory plan-ning to foster genuinely sustainable and resilient maritime development.
Keywords:
marine spatial planning
; climate risk
; operational risk
; adaptive governance
; decision support
; sustainable blue economy
1. Introduction
Marine Spatial Planning (MSP) has consolidated globally as the principal paradigm for ocean governance, seeking to harmonize burgeoning demands for resources with conservation imperatives [1]. This planning is fundamental to achieving broad sustainability objectives, including renewable energy targets, energy security, and climate change mitigation, which are central pillars of the sustainable blue economy [2]. However, the conceptual architecture of most MSP processes operates under an implicit premise that Earth system science proves untenable: that of climatic stationarity, which assumes that the statistics of past meteoceanographic variables are a reliable guide for the future [3].
This assumption creates a systemic vulnerability in long-term planning, precisely when predictability is most needed. The necessity of transcending this static model and evolving towards “Climate-Smart MSP” is, therefore, one of the most urgent challenges for ocean governance in the Anthropocene [4], demanding a deeper integration between climate science and public policymaking [5]. This integration should not be merely technical, but also procedural, ensuring that climate adaptation strategies are embedded within participatory, data-informed governance structures [6,7].
This paradigm mismatch yields profound economic consequences. The allocation of capital to long-lifecycle marine infrastructure—such as offshore wind energy farms—becomes a high-risk exercise when feasibility analysis disregards the future trajectory of operational conditions. The failure to quantify how the intensification of extreme events will impact downtime and maintenance costs can lead to maladaptive investments and, ultimately, stranded assets [8], thereby compromising the resilience of a nation’s entire Blue Economy. Beyond financial risk, this vulnerability threatens crucial socioeconomic outcomes, such as the stability of clean energy supplies, local job creation, and the potential for a just energy transition for coastal communities [9,10]. For Brazil, which is poised for unprecedented maritime expansion, this analytical gap constitutes an imminent obstacle to its sustainable and equitable development.
To address this gap, this paper introduces, validates, and discusses FARO (Framework for Operational Risk Analysis), a methodological and computational framework designed to facilitate the transition to a dynamic and risk-based MSP. FARO directly responds to calls for tools that translate cutting-edge science into actionable insights for decision-making under conditions of deep uncertainty [11,12].
The objective of this work is threefold: (1) to present the architecture of FARO, which integrates regional model projections (INPE/CMIP5), statistical downscaling via machine learning (XGBoost), and technological sensitivity analysis; (2) to empirically validate its robustness through a prospective case study in the emerging Brazilian offshore wind industry; and (3) to demonstrate how the framework’s outputs can substantiate the formulation of more resilient investment strategies and policies. Although this study focuses on the Brazilian context—a globally relevant case due to its vast maritime territory and urgent need for energy transition—, the FARO framework is designed as a scalable and broadly applicable methodological structure. It is reproducible for other coastal nations and different sectors of the blue economy (e.g., aquaculture, port logistics) facing similar climatic uncertainties, particularly those in the Global South where data scarcity and high vulnerability converge [13].
In essence, this article proposes and validates a methodology to translate climatic uncertainty into quantifiable financial risk, thereby enabling the pricing of technological adaptation costs in the planning of maritime assets. The central innovation of this article, therefore, is to provide a decision-support structure that is not merely academic, but operational, connecting high-resolution climatological projections to the specific financial and operational decisions managers must make, thereby fostering development that is simultaneously sustainable and resilient.
2. Theoretical Framework
The transition toward a dynamic, climate-aware Marine Spatial Planning (MSP) capable of transcending the stationarity paradigm is not an incremental task; rather, it is one that demands a transdisciplinary synthesis of knowledge for effective and equitable governance. The theoretical foundation of the FARO framework is constructed upon the articulation of advances in three distinct yet interdependent research domains: (1) the conceptual evolution of MSP toward adaptive governance under deep uncertainty; (2) the techno-economic risk analysis for maritime assets in a non-stationary environment; and (3) the new frontiers of predictive modeling for the Earth system via Machine Learning. This review critically analyzes the state-of-the-art in each of these domains to establish the fundamental methodological gap that FARO is designed to address.
MSP has emerged as the principal governance paradigm for the oceans [1]. However, its long-term efficacy is challenged by the premise of climatic stationarity [3]. This premise has become untenable [14], and planning that ignores it may lead to a “lock-in” of investments in maladaptive infrastructures [15]. In response, the “Climate-Smart MSP” concept has gained prominence [4]. Nevertheless, the operationalization of this concept remains a challenge, with many qualitative approaches failing to provide decision-makers with quantitative tools to assess socioeconomic risks [11]. More critically, this gap impedes evidence-based governance, where the trade-offs between economic development, environmental conservation, and social equity can be transparently debated with stakeholders [7,16]. The vanguard of research now argues that the next evolution of MSP depends on the development of “Decision-Support Frameworks” [12] that can translate climatic uncertainty into actionable risk metrics, enabling a transition toward adaptive risk management [17], which is essential for the formulation of robust public policies. Indeed, the challenge for MSP now lies in creating and validating quantitative tools that integrate dynamic projections, thereby bridging the barrier between science and the practice of governance for sustainability [18].
This imperative for quantitative tools directly impacts the economic viability of marine infrastructure. In the offshore wind sector, Operation and Maintenance (O&M) costs are a critical factor of the Levelized Cost of Energy (LCOE), with climate-induced downtime being the most sensitive factor [19,20]. Techno-economic models confirm that variations in “good weather windows” can drastically alter a project’s profitability [21], jeopardizing not only the return on investment but also the broader socioeconomic benefits, such as energy security and job creation [9]. The primary mitigation strategy for this risk is technological (a CAPEX/OPEX trade-off). However, the literature exploring this trade-off almost invariably does so using historical time series, failing to answer the strategic question: what is the value of an investment in technological resilience in a worsening climate scenario? [22]. This failure to integrate projections into risk models exposes investors to underestimated risks [8]. Financial models that do not incorporate climatic non-stationarity fail to price optionality and flexibility [23], underestimating the value of resilience and acting as a barrier to financing the sustainable energy transition [24].
To address this, the downscaling of projections from global climate models (GCMs) to locally relevant scales is essential. Machine Learning (ML) has emerged as the enabling technology for robust statistical downscaling [25]. Algorithms such as Extreme Gradient Boosting (XGBoost) have demonstrated a superior capacity to capture the complex, non-linear relationships between large-scale atmospheric forcings and local meteoceanographic responses [26]. The rise of these methods represents a paradigm shift [27], allowing for the agile generation of multiple scenarios, which is vital for adaptive decision support. In the specific domain of ocean geosciences, the application of ML to project future wave and wind climates is advancing rapidly [28,29], and the efficacy of ML methods for bias correction has been confirmed [30]. The scientific maturity of these methods now permits their integration into risk analysis frameworks.
The analysis of the literature reveals three conclusions: (1) MSP must transcend stationarity and evolve into a quantitative, adaptive governance paradigm; (2) The viability of Blue Economy assets is a function of operational risk, which must incorporate climate projections; (3) Machine Learning provides the validated predictive capability to generate these local projections. However, the literature also exposes a profound fragmentation of knowledge. The absence of a methodological framework that promotes the systematic synthesis of these domains is the primary barrier to operationalizing a truly adaptive MSP [5]. It is precisely this integration gap that the FARO framework is designed to fill.
3. Materials and Methods
The quantitative analysis in this study is the product of a two-stage methodological process: (1) a modeling and statistical downscaling phase to generate high-resolution wave projections, and (2) the application of a risk analysis pipeline, the FARO (Framework for Offshore Risk Analysis) v1.0, to convert these projections into operational metrics. The entire workflow was implemented in Python (v.3.10), utilizing open-source libraries (Scikit-learn, XGBoost, Xarray, Pandas, Cartopy).
3.1. Stage 1: Statistical Downscaling and Generation of Wave Projections
3.1.1. Acquisition and Pre-Processing of Historical Data
The historical dataset (1990–2024) was extracted from the ERA5 reanalysis (ECMWF), considered the state-of-the-art (0.25° spatial resolution, hourly temporal). Two classes of variables were used:
- Predictor Variables (Atmospheric): The zonal and meridional wind components ((u,v) at 10m and 100m, and sea level pressure, slp).
- Target Variables (Oceanographic): Significant Wave Height (SWH), Mean Wave Period (MWP), and Mean Wave Direction (MWD).
The hourly data were aggregated into daily statistics (mean, maximum, minimum, standard deviation) and derived features (wind speed magnitude, shear coefficient) were computed.
3.1.2. Training and Validation of the Predictive Model
To establish the functional relationship between large-scale atmospheric forcings and the local sea state, a statistical downscaling approach was employed. An ensemble of Extreme Gradient Boosting (XGBoost) models was independently trained for each grid cell, capturing local meteoceanographic characteristics. A rigorous validation protocol was implemented with a strict temporal split (training: 1990–2015; validation: 2016–2024) to prevent temporal leakage. The final performance achieved a Coefficient of Determination (R²) of 0.8885 and a Root Mean Square Error (RMSE) of 0.1446 meters.
3.1.3. Generation and Bias Correction of Future Projections
This is the central methodological step that differentiates this study. The choice of the projection data source is fundamental to the validity of the local-scale risk analysis. Global climate models (GCMs), such as those from the CMIP6 ensemble, possess coarse spatial resolutions (typically >100km) [31,32]. This scale is inadequate for capturing the local meteoceanographic phenomena that dictate the daily operational risk for marine infrastructures. Therefore, the choice of a high-resolution regional model is not a limitation, but a methodological requirement. The atmospheric forcings projections (2025–2100) were obtained from the INPE regional model simulations (based on CMIP5, RCP 4.5 and 8.5 scenarios).
In the absence of funding to run a proprietary dynamic downscaling, this is the only high-resolution, public, validated, and auditable projection dataset available for the Brazilian territory, being the primary source used by governmental agencies, including EPE [33]. The FARO framework, then, executes a second ‘downscaling’ layer (in cascade): the trained XGBoost ensemble (3.1.2) utilized these high-resolution regional atmospheric forcings from INPE to generate the daily wave projections (swh_mean_pred). This hybrid approach (dynamic-statistical downscaling) represents a methodological innovation, enabling a robust and replicable proof-of-concept for the FARO framework, aligned with the best available data sources for the Brazilian context.
Finally, to correct for residual distributional biases, a non-parametric bias correction protocol (Quantile Delta Mapping) was applied to the generated wave time series, ensuring climatological consistency with the ERA5 reanalysis.
3.2. Stage 2: Risk Analysis Pipeline (FARO Framework v1.0)
3.2.1. Data Processing and Harmonization
The FARO analysis engine processes the generated wave projections. The pipeline loads the daily wave and wind projections (extrapolated to 100m via the Wind Power Law). The data is spatially filtered using a geographic mask based on the high-potential areas identified by the Brazilian Energy Research Office (EPE) “Offshore Wind Roadmap” [33]. This alignment with official energy policy documents is crucial, as it connects the technical-scientific risk analysis directly to the decision-making process and stakeholder engagement within the scope of MSP governance [7,16]. The procedure resulted in 441 grid points focused on the priority areas.
3.2.2. Quantification of the Operational Window
The core of the analysis is the daily classification of operational viability. A day (d) in a cell (c) is classified as non-operational (downtime, D=1) if conditions exceed the safety thresholds (Equation 1).
where is the significant wave height and is the wind speed at 100m. The is the wave height threshold and is the wind speed threshold for service operation vessels (SOVs) [19,20]. The standard analysis uses = 2.0m and = 15.0 m/s.
3.3. Generation of Risk Analysis Products
The framework generates three central outputs:
- Temporal Risk Analysis (Figure 2): The mean annual downtime (), calculated by spatial and temporal averaging, illustrating the evolution of risk (RCP 4.5 vs. 8.5).
- Spatial Risk Analysis (Figure 3): The mean downtime for the end-of-century (2080-2099, RCP 8.5) for each grid cell, generating a georeferenced risk map.
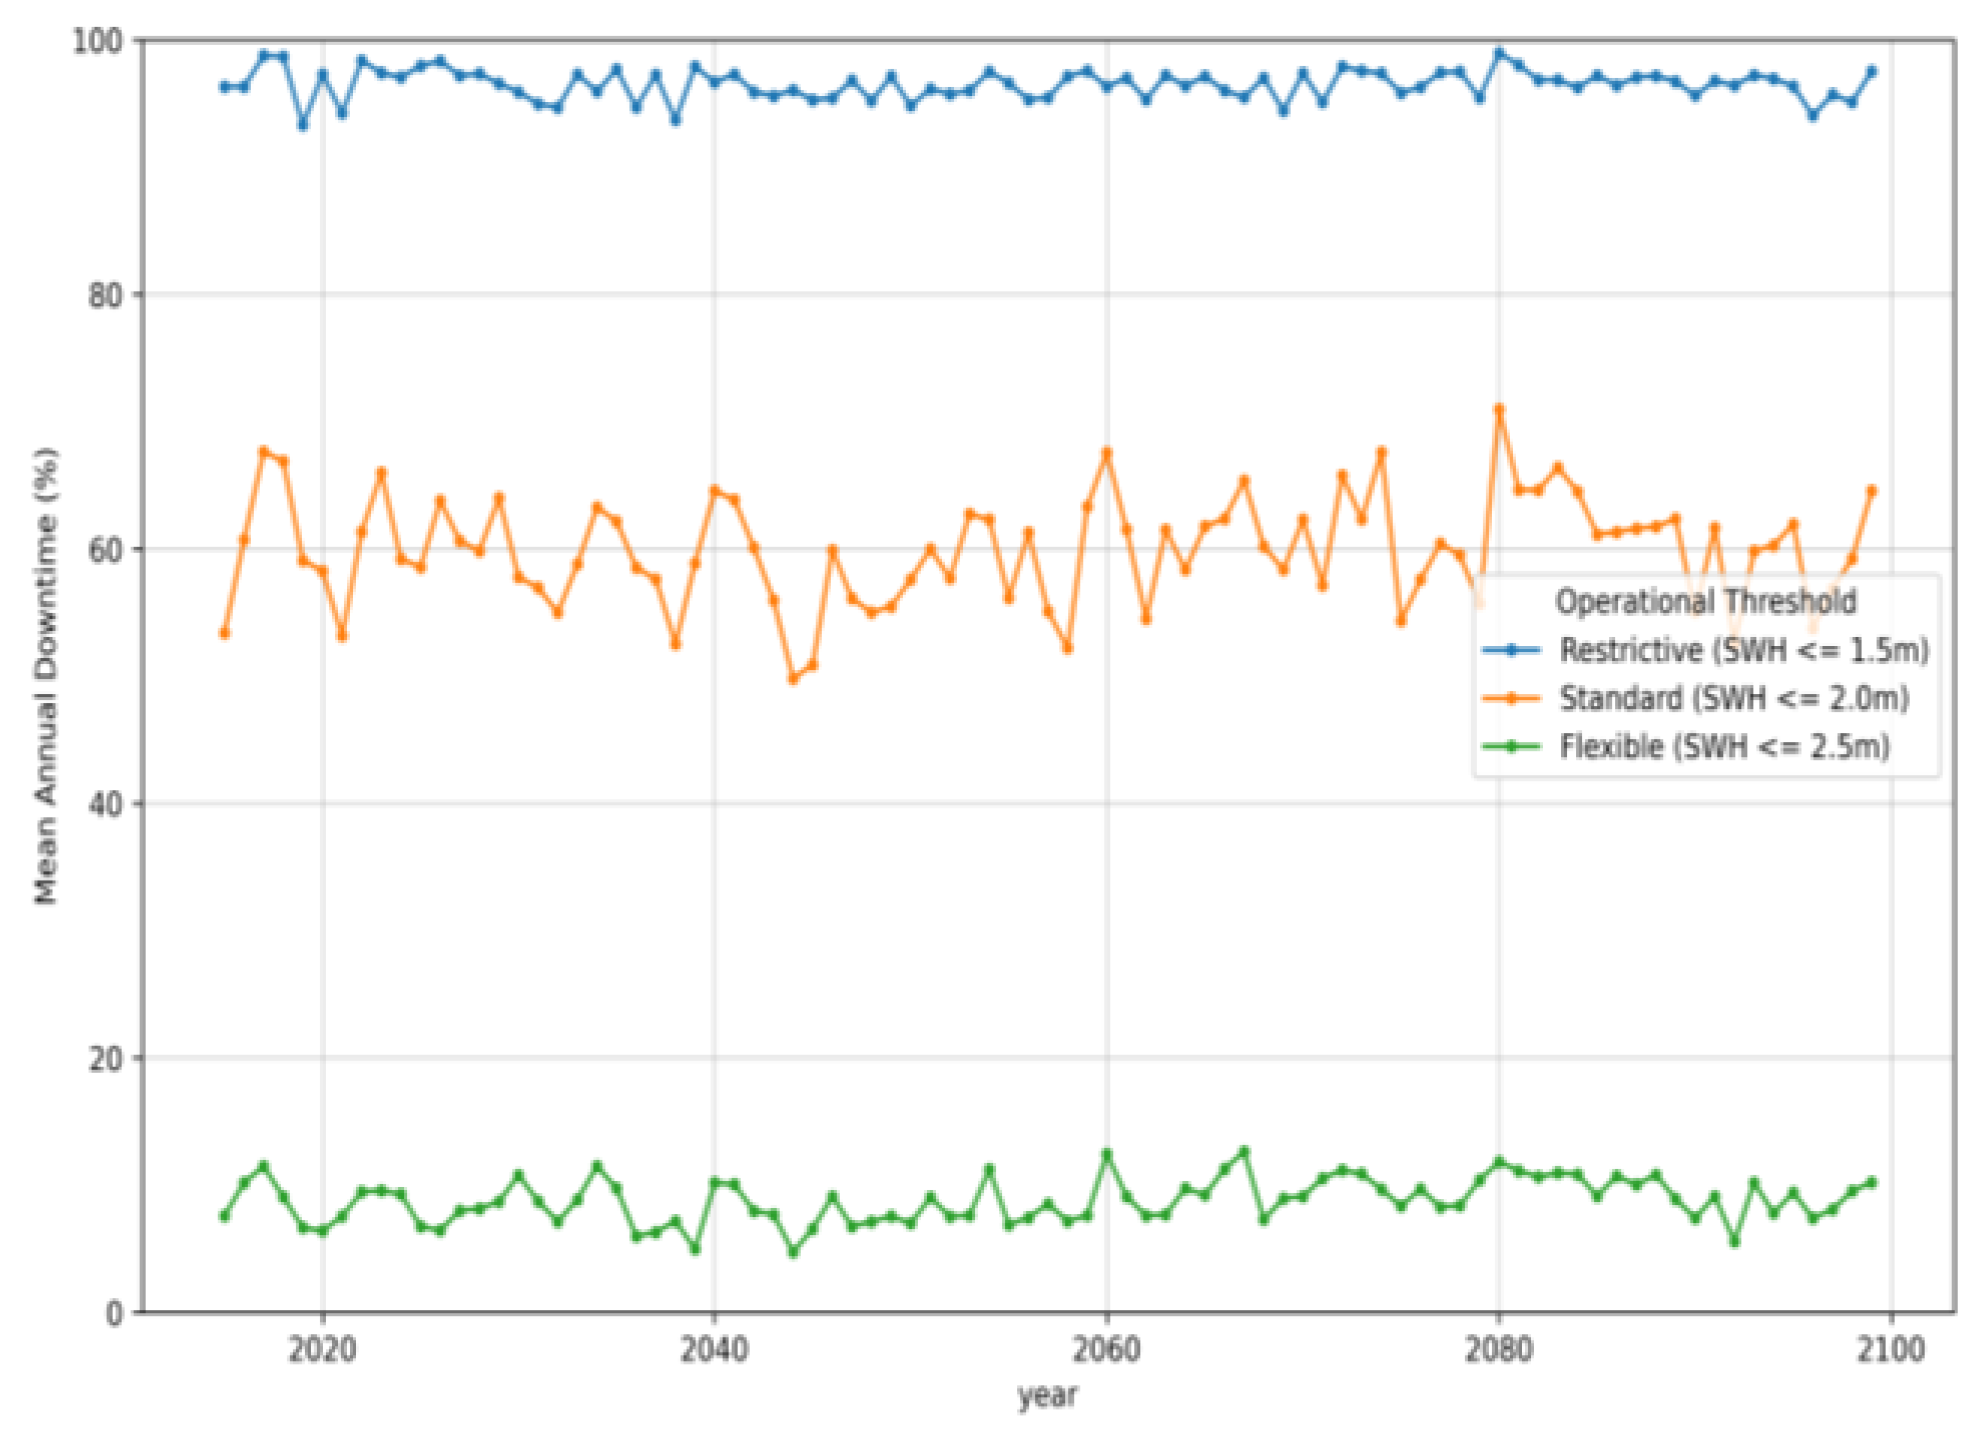
- Technological Sensitivity Analysis (Figure 4): The temporal risk analysis (RCP 8.5) is executed iteratively, varying the for three technological classes: Restrictive (1.5 m), Standard (2.0 m), and Flexible (2.5 m).
3.4. Availability and Reproducibility
In alignment with the principles of open science and demonstrating the study’s replicability even without specific funding, the FARO pipeline source code is available on GitHub (https://github.com/Rinalde-Paulo/FARO-Framework) under a Creative Commons (CC BY-NC 4.0) license. The input data (ERA5 and INPE/CMIP5) are from public repositories.
4. Results
This section presents the outcomes derived from the application of the FARO framework. Firstly, the study area is characterized, followed by a detailed case study analysis, facilitated through the three central deliverables generated by the methodology.
4.1. Study Area
The study area is located in the Southeastern Marine Region of Brazil (Figure 1), a region of strategic importance for the country’s energy transition due to logistical synergies with the O&G industry (Campos Basin) and the high wind potential identified by EPE [33]. The analysis domain (441 grid points) focuses precisely on these high-potential areas, ensuring direct relevance for decision-making.
4.2. Case Study: Risk Analysis for Offshore Wind
The application of the FARO framework produced the three central results for the methodology’s validation.
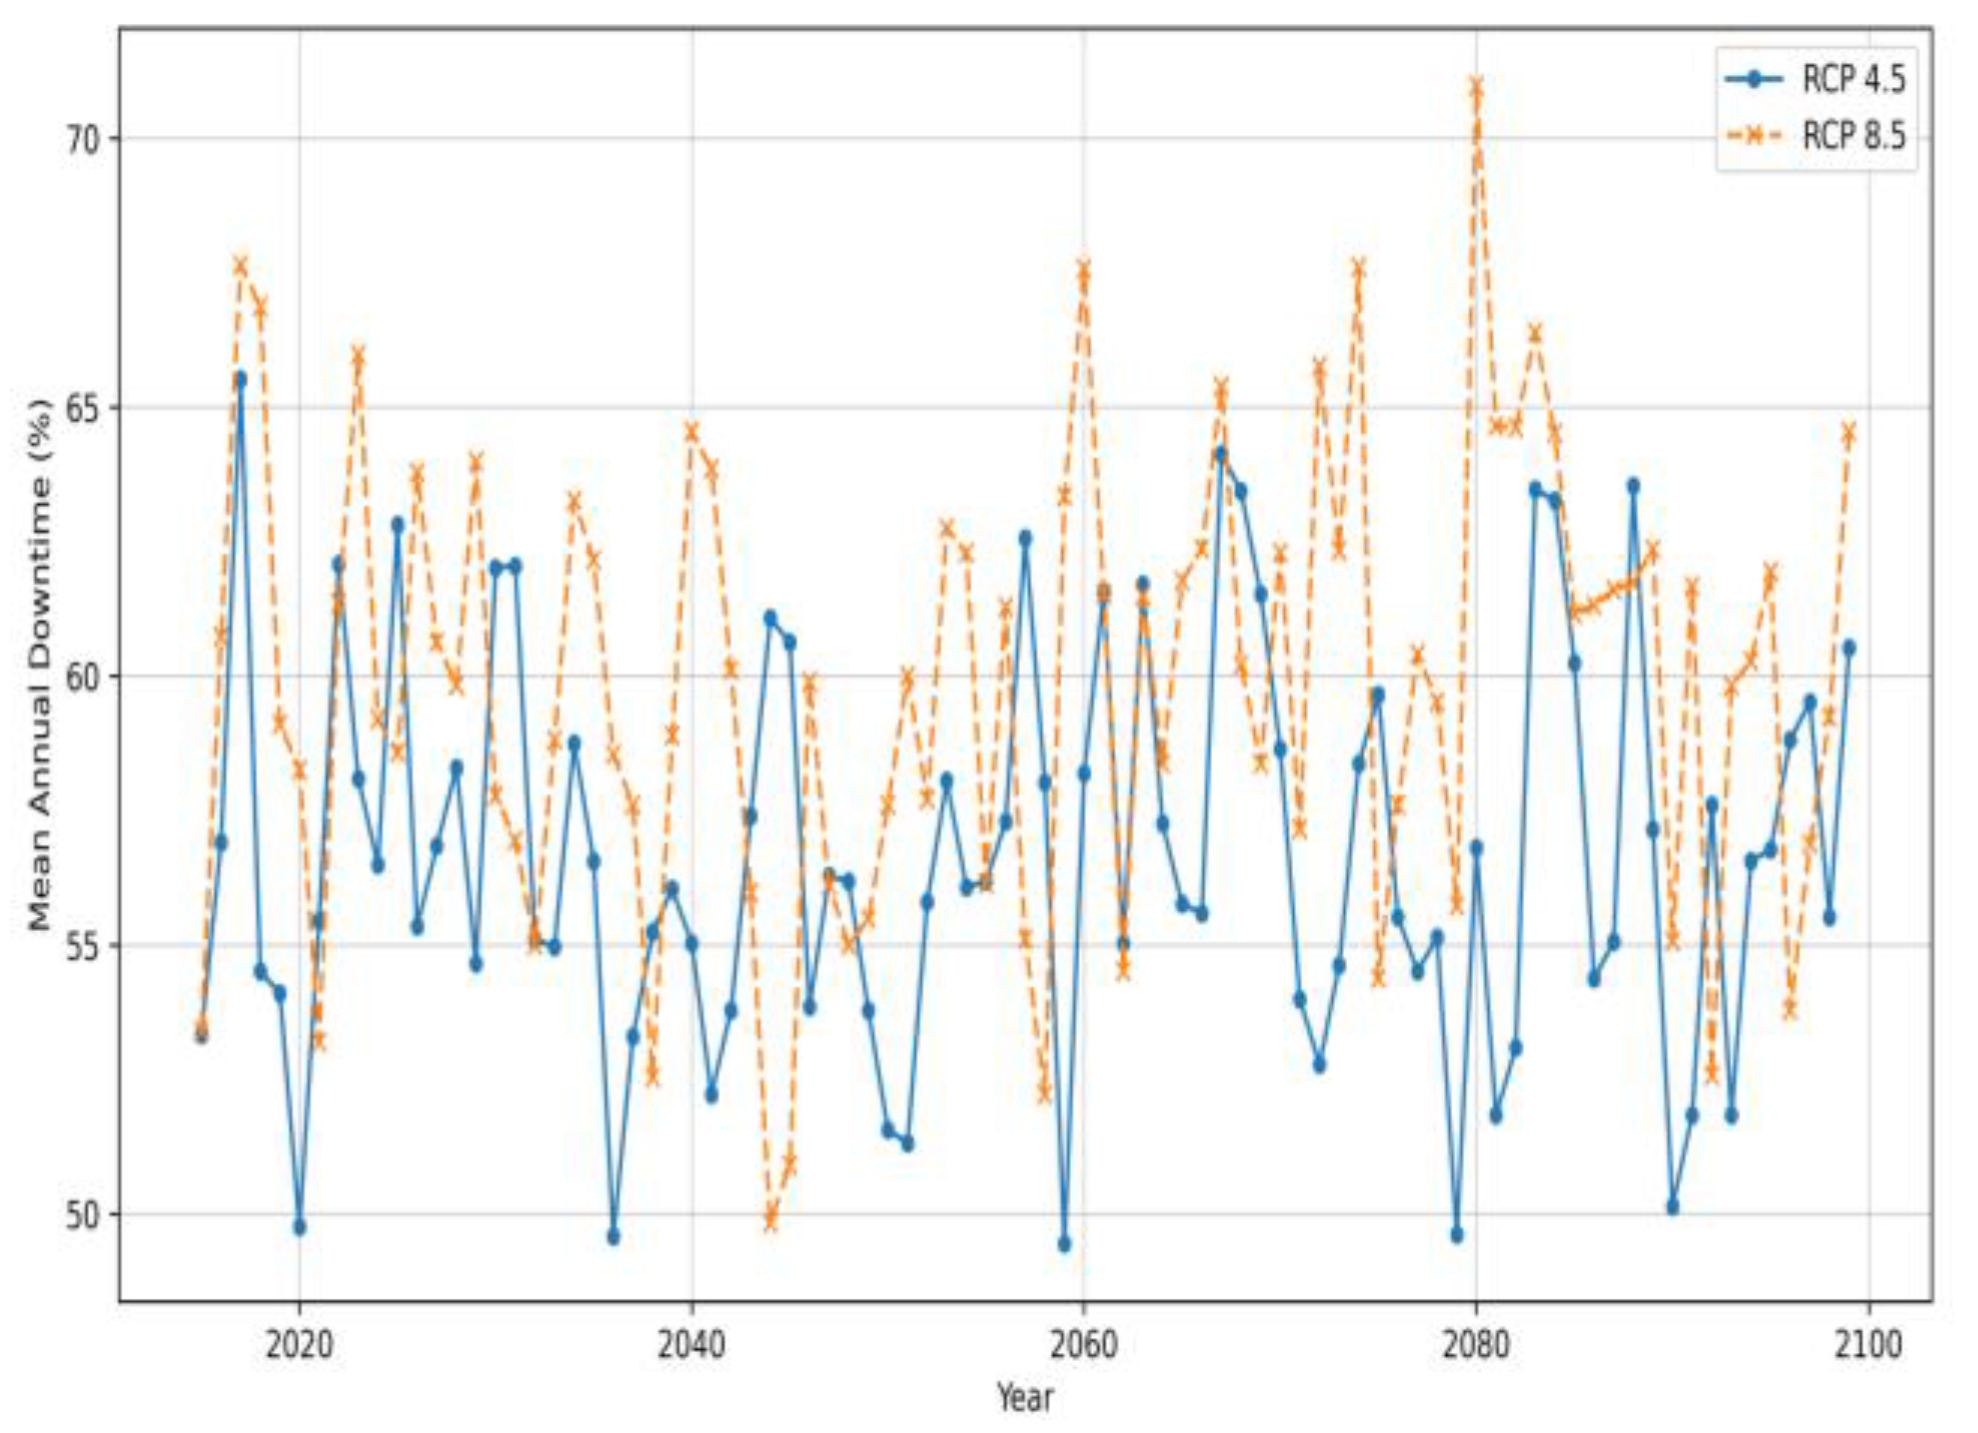
First, the baseline risk analysis (Figure 2) reveals the inadequacy of static assessments. For a “Standard” technology (where 2.0m), the projected mean downtime fluctuates at an economically critical level (50%-70%), indicating economic unfeasibility under this threshold. The comparison between the RCP 4.5 and RCP 8.5 scenarios demonstrates a clear exacerbation of risk under the high-emissions scenario, not only in the trend but also in the amplification of interannual variability in the second half of the century. This high variability is, in itself, a financial risk factor, making cash flow unpredictable and increasing project financing and insurance costs.
Figure 1.
Location of the study area in the Southeast Brazilian Marine Region. The highlighted polygon represents the analysis domain, encompassing the 441 ERA5 grid centroids that fall within the high-potential areas for offshore wind development as identified by the Brazilian Energy Research Office (EPE) [33].
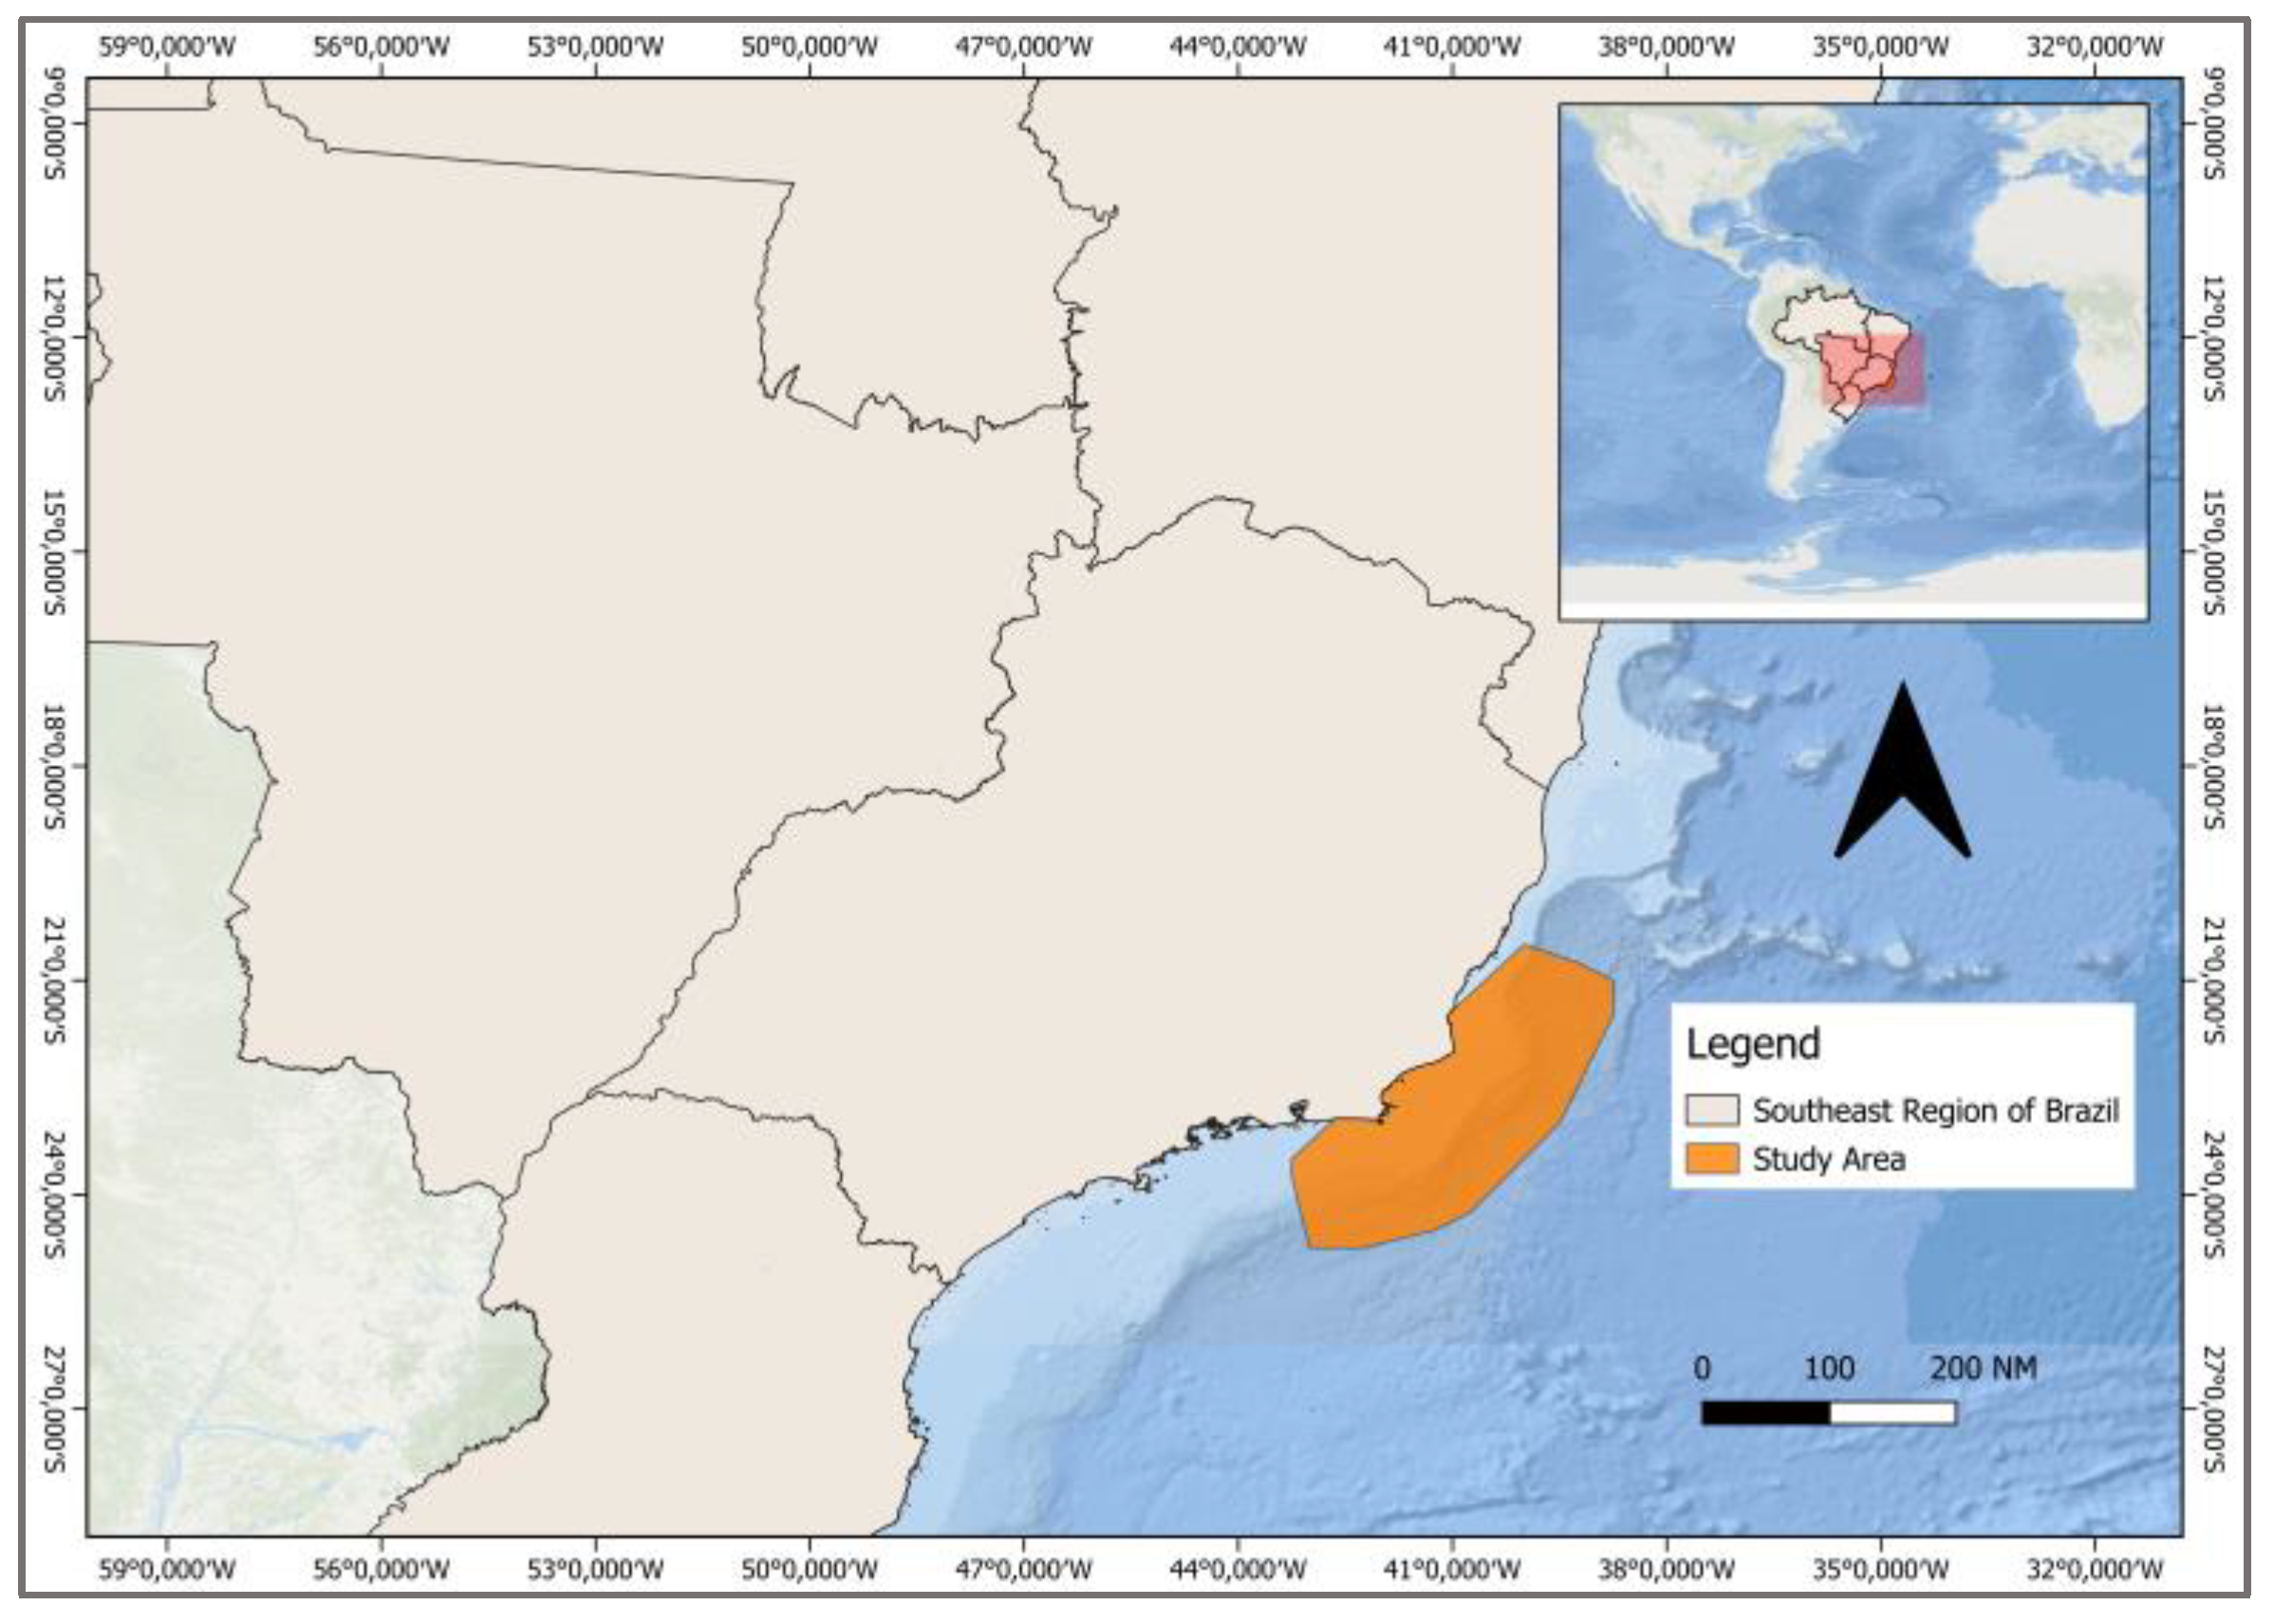
Figure 2.
Projected Operational Downtime Evolution (SWH 2.0 m), comparing RCP 4.5 and RCP 8.5 scenarios. Note the higher variability and worsening trend under the high-emissions scenario (RCP 8.5).
Figure 2.
Projected Operational Downtime Evolution (SWH 2.0 m), comparing RCP 4.5 and RCP 8.5 scenarios. Note the higher variability and worsening trend under the high-emissions scenario (RCP 8.5).
Second, the results establish that climate risk is not spatially homogeneous (Figure 3). The risk map for the end of the century (RCP 8.5) elucidates significant spatial heterogeneity. The interpretation of this map is crucial for planning: the ‘hotspots’ (dark red) indicate zones that will compulsorily require higher-resilience technologies (e.g., ) impacting CAPEX; the ‘corridors’ (yellow/orange), on the other hand, represent strategic opportunities for priority development.
Finally, the sensitivity analysis quantifies the role of technology as the primary adaptation variable (Figure 4). While the ‘Restrictive’ technology (1.5m) is unviable (downtime 100%), the transition from ‘Standard’ (60%) to ‘Flexible’ (2.5m) results in an order-of-magnitude reduction in risk, with downtime dropping to10%. This result transforms climate adaptation from an abstract concept into a quantifiable investment decision.
Figure 3.
Map of the spatial heterogeneity of operational risk, representing the mean downtime for the late century (2080–2099) under the high-emissions scenario (RCP 8.5). The block-like geometry is a direct result of sampling the official study area with the discrete 0.25° x 0.25° data grid.
Figure 3.
Map of the spatial heterogeneity of operational risk, representing the mean downtime for the late century (2080–2099) under the high-emissions scenario (RCP 8.5). The block-like geometry is a direct result of sampling the official study area with the discrete 0.25° x 0.25° data grid.
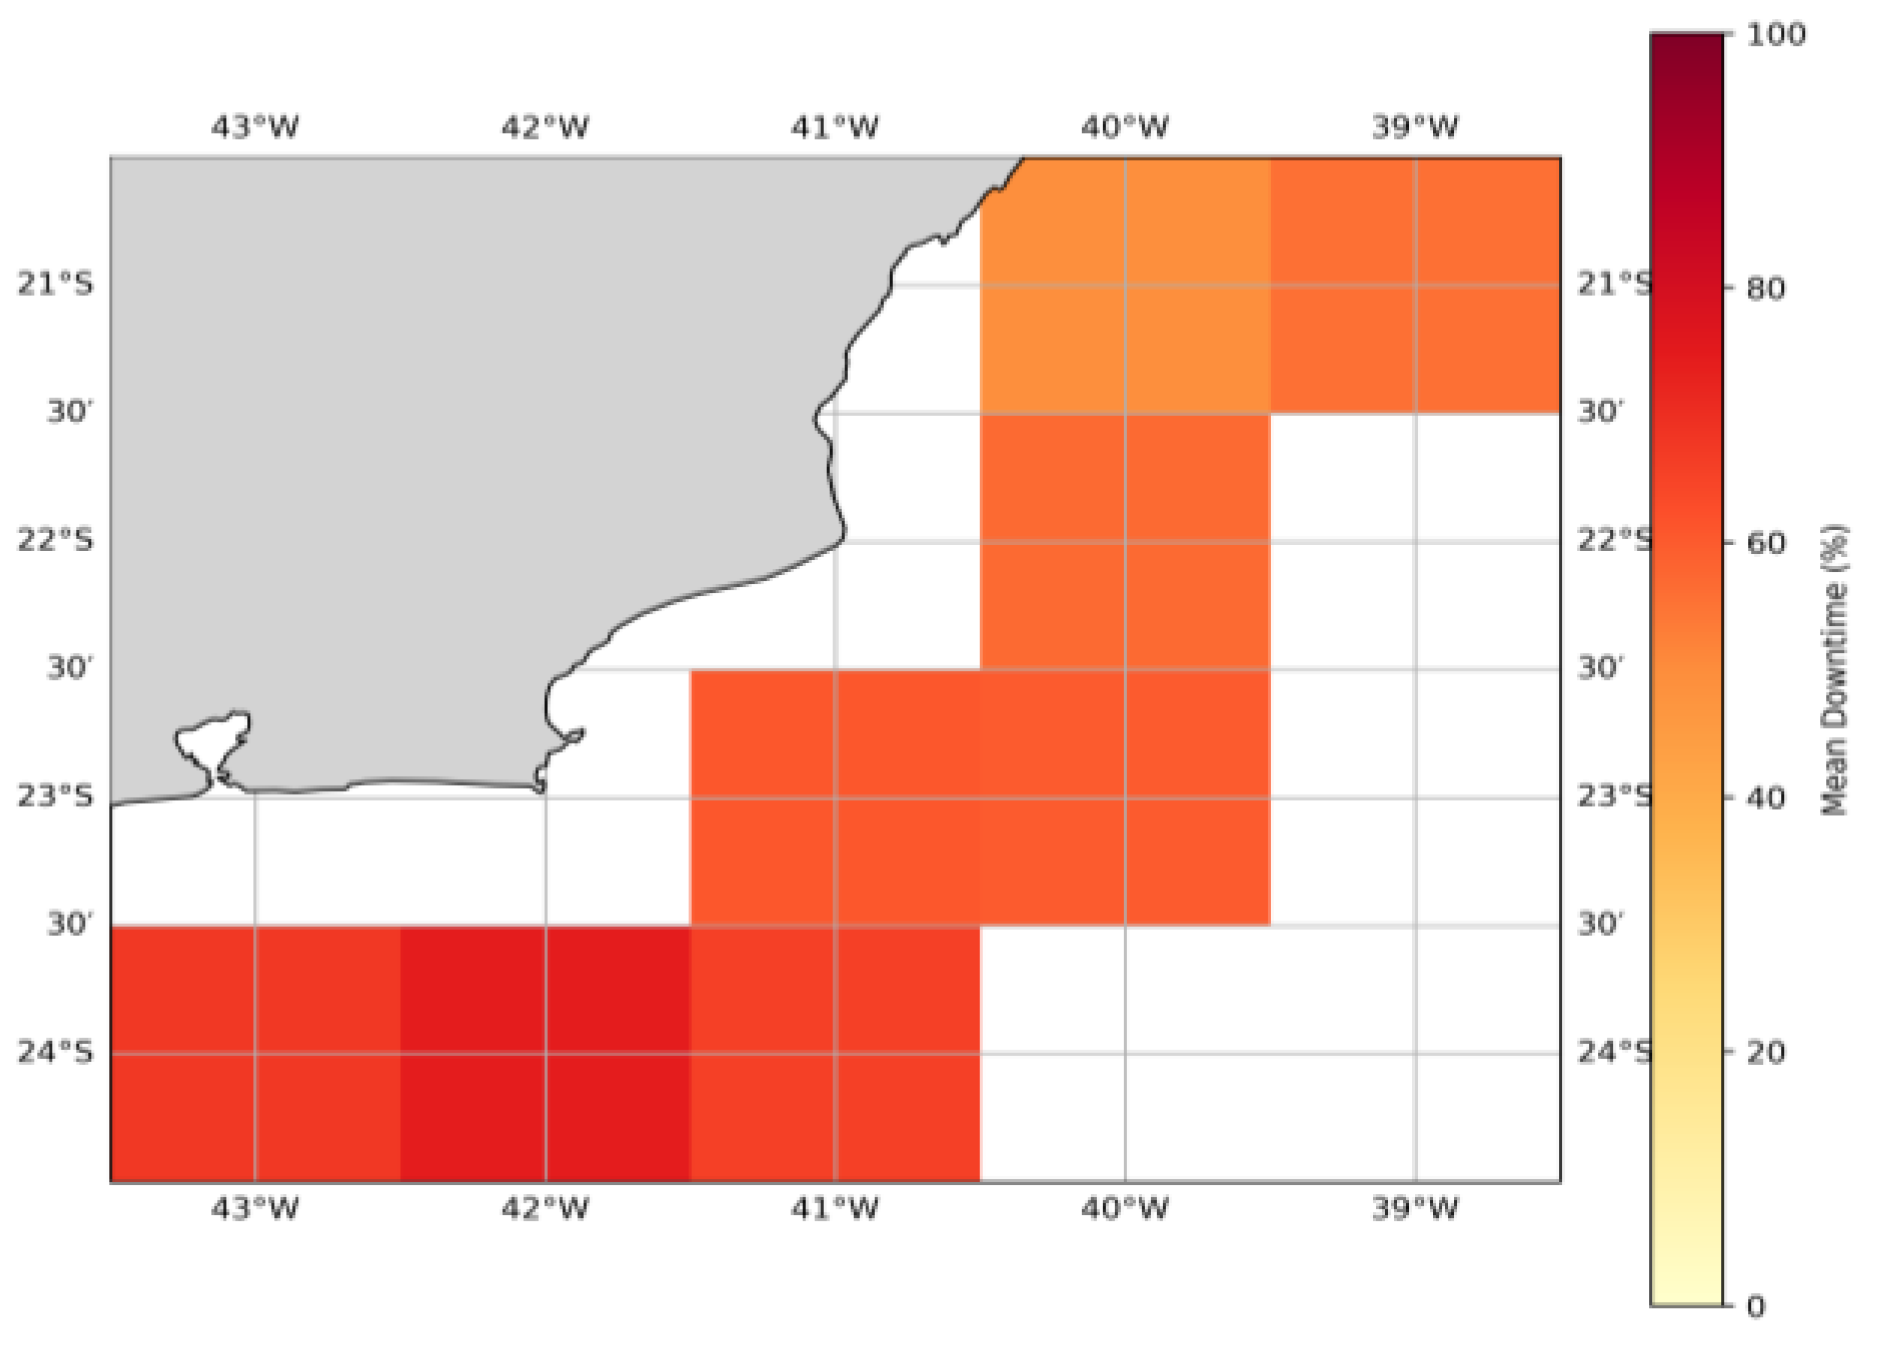
Figure 4.
Sensitivity analysis quantifying the role of technological capacity as an adaptation variable under the RCP 8.5 scenario.
Figure 4.
Sensitivity analysis quantifying the role of technological capacity as an adaptation variable under the RCP 8.5 scenario.
5. Discussion
The results from the FARO framework offer an innovative perspective for the theory and practice of MSP in Brazil and globally, demonstrating that overcoming the stationarity paradigm is methodologically feasible and strategically imperative.
5.1. Techno-Economic Implications: Quantifying the Return on Resilience
The primary implication of the findings is the quantification of the return on investment in resilience. The 50-percentage-point reduction in downtime (Figure 4) provides an objective metric for planners and investors to compare the additional CAPEX (robust technologies) against the reduction in future OPEX losses. This capability allows for the internalization of climate risk into project valuation models, transforming adaptation from a perceived cost into a strategic value lever [23].
5.2. Socioeconomic and Sustainability Implications
The FARO analyses transcend financial viability, touching the core of sustainability objectives [2]. By “de-risking” offshore renewable energy projects, the framework acts as an enabler for achieving clean energy and climate mitigation goals.
More importantly, it provides a quantitative tool to plan for a “just energy transition” [34]. A project that fails financially due to unquantified climate risks does not generate the promised local jobs nor develop the regional supply chain. The spatial analysis (Figure 3), by identifying viable corridors, allows public policies to direct support infrastructure and training programs to coastal communities in these specific areas, ensuring that the socioeconomic benefits of the Blue Economy are distributed more equitably [10], reducing historical regional inequalities.
5.3. Implications for Public Policy and Adaptive Governance
For MSP practice, FARO offers the analytical basis for dynamic, risk-based zoning. The FARO results are not intended solely for engineers; they are tools for governance dialogue [16]. The framework provides quantitative data to inform crucial discussions among stakeholders (government, industry, NGOs, local communities) regarding the allocation of marine space [7]. For example, a data-informed dialogue could lead to a consensus where ‘hotspots’ (Figure 3) are prioritized for conservation, while development is incentivized in the lower-risk ‘corridors’.
This allows regulators to modulate development policies according to the geography of future risk, aligning economic growth with climate adaptation. This is the core of “adaptive governance” [17]: instead of a static plan, FARO allows policymakers to continuously adjust long-term strategies using a dynamic, science-based tool. Although validated with offshore wind, the method is sector-agnostic (applicable to ports, aquaculture, etc.).
5.4. Methodological Limitations and Future Research
The treatment of uncertainty in this study focuses on technological sensitivity and operational risk, rather than the uncertainty of global climate models (GCMs). As justified in the Methodology (3.1.3), the choice of a high-resolution regional climate driver (INPE) was a deliberate and necessary decision to allow for the validation of the framework at a relevant local scale, something that coarse global ensembles (CMIP6) would not permit [32].
The objective of this work is to validate the FARO framework – the methodological “bridge” between climate projections and operational risk analysis – using the best available public regional data. The FARO architecture, being source-agnostic, is ready for the next research step: applying the framework to a CMIP6 ensemble [31], after it has been subjected to a high-resolution dynamic or statistical downscaling similar to the one validated here.
Future research should also focus on applying FARO to other marine industries (aquaculture, port logistics) and in other geographical contexts, especially in the Global South [13]. Additionally, the operational decision function (Equation 1) can be expanded to incorporate multi-dimensional thresholds (e.g., wave period, weather window duration), offering an even more granular risk analysis.
6. Conclusions
This study challenged the anachronistic assumption of climatic stationarity in MSP by introducing FARO, a validated methodological framework for quantifying adaptive operational risk. The analysis demonstrated that disregarding future climate trajectories leads to a severe underestimation of operational risks, whereas strategic investment in technological resilience offers substantial mitigation potential.
By providing the means to integrate high-resolution climate and technological risk analysis directly into the financial and operational decision-making process, FARO offers a clear, quantitative pathway toward a climate-smart MSP. The contribution of this work is not merely a tool but a proof-of-concept that ocean governance can and must be proactive, evidence-based, and prepared for the challenges of a non-stationary world.
As detailed in the discussion, the next logical steps include the expansion of FARO to multi-model ensembles (after regional downscaling) and to other sectors. In doing so, FARO serves as an essential instrument for stakeholder dialogue and public policy formulation, ensuring the sustainable, equitable, and prosperous development of Brazil’s Blue Economy.
7. Patents
The FARO (Framework for Adaptive Operational Risk Analysis) software, developed as part of this research, has been registered with the Brazilian National Institute of Industrial Property (INPI) under registration number BR512025003174-2.
Author Contributions
Conceptualization, J.R.d.P. and T.S.; methodology, software, formal analysis, investigation, and writing—original draft preparation, J.R.d.P.; validation, J.R.d.P. and T.S.; writing—review and editing, J.R.d.P. and T.S.; visualization, J.R.d.P.; supervision and project administration, T.S. All authors have read and agreed to the published version of the manuscript.
Funding
This research received no external funding.
Institutional Review Board Statement
Not applicable.
Informed Consent Statement
Not applicable.
Data Availability Statement
The source code that implements the FARO analysis pipeline is publicly available in the FARO-Framework repository on GitHub at https://github.com/Rinalde-Paulo/FARO-Framework .The repository includes the essential pre-processed auxiliary data files required to run the analysis. The original large datasets for climate projections (ERA5 and CMIP5) are publicly available from their respective official repositories, as cited in the paper.
Conflicts of Interest
The authors declare no conflict of interest.
References
- Santos, C.F.; et al. The global progress of marine spatial planning: A systematic review. Sci. Total Environ. 2024, 912, 169225.
- Gazzola, V.; et al. Connecting Marine Spatial Planning and the Sustainable Blue Economy: A review of analytical tools and a framework for assessment. J. Environ. Manage. 2023, 344, 118465.
- Abbass, K.; et al. A review of the non-stationarity in hydrological modeling under climate change. Hydrol. Sci. J. 2022, 67, 1–21.
- Gissi, E.; et al. A review of the operationalisation of climate-smart principles in Marine Spatial Planning. J. Environ. Manage. 2022, 317, 115403.
- Cvitanovic, C.; et al. A guide to engaging in the science-policy interface for sustainable ocean futures. npj Ocean Sustain. 2023, 2, 8.
- Gissi, E.; et al. Climate-smart Marine Spatial Planning: A framework for strengthening climate change adaptation and mitigation in the ocean. Environ. Sci. Policy 2021, 122, 90–101.
- Flannery, W.; et al. Public participation and the governance of marine spatial planning: A review of the literature. Mar. Policy 2022, 144, 105214.
- Theofilidi, M.; et al. Assessing the risk of stranded assets in the shipping sector due to climate change policies. Marit. Policy Manag. 2023, 50, 968–989.
- Jenkins, K.; et al. The social dimensions of offshore wind energy: A critical review. Energy Res. Soc. Sci. 2021, 75, 102000.
- García-Barrios, L.; et al. Socio-economic impacts of offshore wind energy: A review of the literature on job creation and community benefits. Renew. Sustain. Energy Rev. 2023, 178, 113251.
- Cashion, T.; et al. Operationalizing climate-smart marine spatial planning: A guide for practitioners. Mar. Policy 2024, 159, 105828.
- Tsilimigkas, G.; & SCYCLE-4-MSP Consortium. A Decision Support System for climate-resilient Marine Spatial Planning. Environ. Model. Softw. 2024, 173, 105945.
- Ansong, J.O.; et al. Marine spatial planning in the Global South: A critical review of implementation and challenges. Ocean Coast. Manag. 2022, 225, 106208.
- Yates, K.L.; et al. A review of climate change in marine spatial planning. Mar. Policy 2023, 152, 105559.
- Pörtner, H.-O.; et al. Climate Change 2022: Impacts, Adaptation and Vulnerability. In Contribution of Working Group II to the Sixth Assessment Report of the Intergovernmental Panel on Climate Change; Cambridge University Press: Cambridge, UK, 2022.
- Tuda, A.O.; et al. Stakeholder participation in climate-smart marine spatial planning: A review of approaches and tools. Environ. Sci. Policy 2022, 136, 213–223.
- Rijke, J.; et al. Adaptive governance of climate adaptation: A review of the literature. Ambio 2022, 51, 633–647.
- Laffoley, D.; et al. The potential of Marine Spatial Planning to support the conservation of marine biodiversity in the face of climate change. Aquat. Conserv. Mar. Freshw. Ecosyst. 2023, 33, 1035–1049.
- Ikhennicheu, M.; et al. A comprehensive review on the current and future trends of O&M for offshore wind turbines. Ocean Eng. 2023, 280, 114486.
- Do, T.-P.; et al. A systematic review of operation and maintenance strategy for offshore wind farms. Renew. Sustain. Energy Rev. 2022, 168, 112800.
- Tovar-Hurtado, M.; et al. A review on the techno-economic analysis of floating offshore wind farms. Renew. Sustain. Energy Rev. 2024, 189, 114002.
- Kolker, A.S.; et al. Climate change and the operational lifetime of offshore wind energy infrastructure. Nat. Rev. Earth Environ. 2023, 4, 810–824.
- Monjas-Barroso, M.; Balbás, A. Climate change uncertainty in the valuation of renewable energy projects: A real options approach. Energy Econ. 2024, 131, 107368.
- Monasterolo, I. Climate-related financial risks: A review of the literature and the role of climate stress-testing. J. Econ. Surv. 2023, 37, 1032–1064.
- Grange, S.K. A review of machine learning in statistical downscaling for climate applications. Atmosphere 2023, 14, 529.
- Gutiérrez, J.M.; et al. Good Practice Guidance for Statistical Downscaling; Intergovernmental Panel on Climate Change (IPCC): Geneva, Switzerland, 2021.
- Watson, C.S. A perspective on the future of ocean climate modelling: The role of machine learning. Environ. Data Sci. 2023, 2, e18.
- Fan, Y.; et al. Projecting ocean wave climate with deep learning: A study of the Indian Ocean. Ocean Eng. 2024, 292, 116805.
- López-Ruiz, A.; et al. Machine learning applications for wave energy resource assessment: A state-of-the-art review. Renew. Sustain. Energy Rev. 2024, 189, 114008.
- Larsén, X.G.; et al. Bias correction of modelled wind atlas data. Wind Energy Sci. 2023, 8, 433–455.
- Morim, J.; et al. A global-scale wave climate projection dataset from the Coupled Model Intercomparison Project Phase 6 (CMIP6). Sci. Data 2022, 9, 371.
- Zhu, Q.; et al. Evaluating the uncertainty in offshore wind energy projections from a multi-model ensemble of CMIP6. Renew. Energy 2022, 195, 1378–1388.
- EPE (Empresa de Pesquisa Energética). Roadmap Eólica Offshore Brasil; Ministério de Minas e Energia (MME): Brasília, Brazil, 2020. Available online: https://www.epe.gov.br/pt/publicacoes-dados-abertos/publicacoes/roadmap-eolica-offshore-brasil (accessed on 16 October 2025).
- Soma, K.; et al. The ‘just transition’ in the blue economy: A framework for analysis. Mar. Policy 2021, 132, 104687.
- Brunner, L.; et al. Quantifying uncertainty in climate projections: An overview of methods and applications. Earth-Sci. Rev. 2021, 219, 103671.
Disclaimer/Publisher’s Note: The statements, opinions and data contained in all publications are solely those of the individual author(s) and contributor(s) and not of MDPI and/or the editor(s). MDPI and/or the editor(s) disclaim responsibility for any injury to people or property resulting from any ideas, methods, instructions or products referred to in the content. |
© 2025 by the authors. Licensee MDPI, Basel, Switzerland. This article is an open access article distributed under the terms and conditions of the Creative Commons Attribution (CC BY) license (http://creativecommons.org/licenses/by/4.0/).
Copyright: This open access article is published under a Creative Commons CC BY 4.0 license, which permit the free download, distribution, and reuse, provided that the author and preprint are cited in any reuse.


