
Submitted:
09 November 2025
Posted:
10 November 2025
You are already at the latest version
Abstract
Background:. The 2025 Nobel Prize in Physiology or Medicine recognized the fundamental discovery of regulatory T cells and the FOXP3 gene as critical mediators of peripheral immune tolerance. This landmark workestablished a single-pathway mechanism for immune regulation Metadichol, a nanoemulsion of long-chainalcohols C26-C32, demonstrates pleiotropic immunomodulatory effects through coordinated regulation of masterregulator genes involved in T-cell function, B-cell development, NK cell cytotoxicity, metabolic reprogramming,and tumor suppression. Methods: We analyzed gene expression data from Metadichol-treated peripheral blood mononuclear cells PBMCs and resting fibroblasts across four concentrations 1 pg/mL, 100 pg/mL, 1 ng/mL, 100 ng/mL. A total of 36 master regulator genes were examined, including CD markers, transcription factors, and metabolic regulators. Comprehensive bioinformatic analysis included correlation network mapping, hierarchical clustering, and functional pathway enrichment to identify synergistic and antagonistic gene expression patterns. Results: Metadichol induced dramatic upregulation of key metabolic regulators including PPARγ 24.25-fold, PGC1α 11.08-fold, and tumor suppressor p53 9.61-fold, while coordinately modulating T-cell markers CD4 2.03-fold and CD8 2.15-fold. Correlation analysis revealed three strategic mechanisms: • Synergistic metabolic reprogramming through PPARγ-PGC1α co- activation r=0.991, • Immune balance optimization via antagonistic regulation of effector CDS versus suppressor FOXP3 functions, and • Dfferential cell-type regulation exemplified by the CDS-p53 antagonism r=-0.991. The upregulation of FOXP3 1.87-fold, the master regulator of regulatory T cells Tregs.
Keywords:
Metadichol
; FOXP3
; regulatory T cells
; cross-cellular regulation
; master regulatory genes
; B cells
; plasma cellS
; NK cells
; cancer immunotherapy
; metabolic reprogramming
; nuclear receptors
; PPARγ
; PGC1α
; p53
; sirtuins
; Klotho
; regulatory T-cells
; gene expression networks
; master regulators immune tolerance
; peripheral blood mononuclear cells
; fibroblasts
Introduction
Immune system regulation requires precise control mechanisms to maintain the delicate balance between effective pathogen clearance and prevention of autoimmunity. The 2025 Nobel Prize in Physiology or Medicine was awarded to Mary Brunkow, Fred Ramsdell, and Shimon Sakaguchi for their groundbreaking discoveries concerning peripheral immune tolerance through regulatory T cells and the FOXP3 gene. [1,2,3] Their work established that a specific subset of T cells, characterized by CD4 and CD25 expression and controlled by the transcription factor FOXP3, acts as “security guards” to prevent immune attacks against self-tissues. [4,5]
While this discovery represented a landmark advancement in our understanding of immune tolerance, it focused primarily on a single regulatory pathway within one cell type. Emerging evidence suggests that immune regulation involves complex networks of interacting pathways across multiple cellular compartments. [6,7,8] This perspective raises the question of whether therapeutic approaches targeting multiple regulatory networks simultaneously might offer advantages over single-pathway interventions. [9,10]
Cancer remains one of the leading causes of mortality worldwide, with an estimated 19.3 million new cases and 10 million deaths in 2020. [11] While conventional treatments including surgery, chemotherapy, and radiation have improved outcomes, the emergence of cancer immunotherapy has fundamentally transformed the therapeutic landscape. Immune checkpoint inhibitors targeting PD-1/PD-L1 and CTLA-4 have demonstrated remarkable clinical success across multiple malignancies, yet response rates remain limited to 20-40% of patients, and therapeutic resistance frequently develops [12,13]
The tumor microenvironment TME presents formidable barriers to effective anti-tumor immunity, including metabolic competition, immunosuppressive cell populations, and chronic inflammation that drives T-cell exhaustion. [1]Tumor-infiltrating lymphocytes TILs, particularly CDS+ cytotoxic T- cells, face severe metabolic stress in the nutrient- depleted, hypoxic TME, leading to mitochondrial dysfunction and impaired effector functions. [14,15] Simultaneously, regulatory T-cells Tregs expressing FOXP3 and CD25 accumulate in tumors, actively suppressing anti-tumor immune responses and facilitating immune evasion. [16,17]
Master Regulators: Definition and Biological Significance
Master regulator genes are transcription factors or key signaling molecules that control the expression of large gene networks and determine cell fate, differentiation, and function. [18,19] In the context of immune cell biology, master regulators orchestrate complex programs that govern T-cell activation, memory formation, metabolic reprogramming, and effector function [20,21,22] Examples include FOXP3 for regulatory T-cells [5,23] PPARγ for metabolic contr19, and PGC1α for mitochondrial biogenesis. [24].
Rationale for Gene Selection: Why These 36 Genes?
The 36 genes analyzed in this study were selected based on their established roles as master regulators of immune cell function, metabolic homeostasis, and tumor immunity. These genes can be categorized into four functional groups:
- D Markers 14 genes: CD2, CD3G, CD4, CD7, CDS, CD25, CD27, CD28, CD31, CD45, CD58, CD69, CD80, CD86. These surface markers define T-cell subsets, mediate co-stimulation, and regulate T-cell activation and trafficking. [25,26,27,28,29,30,31,32,33,34,35,36,37,38,39,40,41,42,43,44,45,46,47,48,49,50,51,52,53,54,55,56,57,58,59,60,61,62,63,64,65,66,67,68,69,70,71,72,73,74,75,76,77,78,79,80,81,82,83,84,85,86,87,88,89,90,91,92,93,94,95,96]
- Transcription Factors Governing Cell Fate 16 genes: FOXP3, FOXJ1, FOXM1, BLIMP1, PU.1, OCT4, TAL1, PROX1, GCM1, TFEB, SIM1, CTCF, MITF, HIF1,VEGF. These transcription factors regulate immune cell differentiation, stem cell pluripotency, hypoxia responses, and tissue-specific development. [106,107,108,109,110,111,112,113,114,115,116,117]
The selection of these genes was based on extensive literature demonstrating their critical roles in T- cell biology, B-cell development, NK cell function, metabolic reprogramming, and cancer immunity. By examining the coordinated regulation of these master regulators, one can gain insights into Metadichol and its multi-targeted mechanism of action. [117]
Metadichol: A Pleiotropic Bioactive Nanoemulsion
Metadichol is a nanoemulsion formulation derived from long-chain saturated primary alcohols predominantly C28, with minor amount C26 and C30 components, originally isolated from sugarcane. This novel compound has demonstrated remarkable pleiotropic biological activities through comprehensive modulation of multiple cellular signaling networks: nuclear receptor, sirtuin, TLR, KLF, and circadian regulatory networks. [118,119,120,121,122,123,124,125,126,127,128]
Systems Biology Perspective
The networks activated by Metadichol suggest a systems-level approach to transcriptional modulation. Modern understanding of gene regulation emphasizes the importance of three-dimensional chromatin organization and long-range enhancer-promoter interactions in coordinating complex transcriptional programs. The comprehensive activation of multiple transcriptional networks by Metadichol may facilitate coordinated chromatin remodeling and enhanced transcriptional synergy across the 36 genes of the master regulator gene family (Table 1).

Table 1.
Comprehensive Master Regulator Genes Modulated by Metadichol: Biological Functions, Disease Associations, and References. [19,20,21,22,25,26,27,28,29,30,31,32,33,34,35,36,37,38,39,40,41,42,43,44,45,46,47,48,49,50,51,52,53,54,55,56,57,58,59,60,61,62,63,64,65,66,67,68,69,70,71,72,73,74,75,76,77,78,79,80,81,82,83,84,85,86,87,88,89,90,91,92,93,94,95,96,97,98,99,100,101,102,103,104,105,106,107,108,109,110,111,112,113,114,115,116,117]
|
Gene |
Full Name |
Category |
Cell Type |
Biological Function | Disease Associations |
|
CD3G |
CD3 gamma chain |
CD Marker |
PBMC |
T cell receptor signaling, T cell activation | Immunodeficiency, autoimmune diseases |
|
CD4 |
Cluster of Differentiation 4 |
CD Marker |
PBMC |
T helper cell marker, MHC class II co- receptor |
HIV/AIDS, autoimmune diseases |
|
CD7 |
Cluster of Differentiation 7 |
CD Marker |
PBMC |
T cell and NK cell development, cell adhesion |
T cell acute lymphoblastic leukemia |
|
CD25 |
Interleukin-2 receptor alpha chain IL- 2Rα |
CD Marker |
PBMC |
IL-2 signaling, T cell activation and proliferation |
Autoimmune diseases, immunodeficiency |
|
CD27 |
Cluster of Differentiation 27 |
CD Marker |
PBMC |
T cell activation, memory T cell generation |
Lymphomas, immunodeficiency |
|
CD25 |
Cluster of Differentiation 2S |
CD Marker |
PBMC |
T cell co-stimulation, survival, and proliferation |
Autoimmune diseases, transplant rejection |
|
CD31 |
Platelet endothelial cell adhesion molecule-1 |
CD Marker |
PBMC |
Cell adhesion, leukocyte migration, angiogenesis |
Cardiovascular disease, inflammation |
|
CD45 |
Protein tyrosine phosphatase receptor type C |
CD Marker |
PBMC |
Leukocyte common antigen, signal transduction |
Immunodeficiency, autoimmune diseases |
|
CD58 |
Lymphocyte function- associated antigen 3 |
CD Marker |
PBMC |
T cell adhesion and co-stimulation |
Autoimmune diseases, cancer immune evasion |
|
CD86 |
B7-2 costimulatory molecule |
CD Marker |
PBMC |
T cell co-stimulation, antigen presentation |
Autoimmune diseases, transplant rejection |
|
CD69 |
Early activation antigen CD69 |
CD Marker |
PBMC |
Early activation marker, tissue retention of lymphocytes | Autoimmune diseases, inflammatory disorders |
|
CD8 |
Cluster of Differentiation S |
CD Marker |
PBMC |
Cytotoxic T cell marker, MHC class I co- receptor |
Immunodeficiency, viral infections, cancer |
|
CD80 |
B7-1 costimulatory molecule |
CD Marker |
PBMC |
T cell co-stimulation, immune checkpoint regulation |
Autoimmune diseases, transplant rejection |
|
CD2 |
Cluster of Differentiation 2 |
CD Marker |
PBMC |
T cell and NK cell adhesion, co-stimulation |
Autoimmune diseases, T cell lymphomas |
|
VEGF |
Vascular endothelial growth factor |
Growth Factor |
Fibroblast |
Angiogenesis, vascular permeability | Cancer, diabetic retinopathy, macular degeneration |
|
TAL1 |
T-cell acute lymphocytic leukemia protein 1 |
Transcription Factor |
Fibroblast |
Hematopoiesis, erythroid differentiation |
T-cell acute lymphoblastic leukemia |
|
BLIMP 1 |
B-lymphocyte- induced maturation protein 1 |
Transcription Factor |
Fibroblast |
Plasma cell differentiation, T cell exhaustion |
Lymphomas, autoimmune diseases |
|
FOXP3 |
Forkhead box protein P3 |
Transcription Factor |
Fibroblast |
Regulatory T cell development and function |
IPEX syndrome, autoimmune diseases, cancer |
|
PU.1 |
Purine-rich box- 1 |
Transcription Factor |
Fibroblast |
Myeloid and B cell development |
Leukemias, immunodeficiency |
|
OCT4 ( POU5F1) |
Octamer- binding transcription factor 4 |
Transcription Factor |
Fibroblast |
Pluripotency, stem cell self- renewal |
Germ cell tumors, cancer stem cells |
|
PROX1 |
Prospero homeobox protein 1 |
Transcription Factor |
Fibroblast |
Lymphatic vessel development, cell fate determination |
Lymphedema, cancer metastasis |
|
GCM1 |
Glial cells missing homolog 1 |
Transcription Factor |
Fibroblast |
Placental development, parathyroid gland development |
Preeclampsia, hypoparathyroidism |
|
PGC1a |
Peroxisome proliferator- activated receptor gamma coactivator 1- alpha |
Transcriptional Coactivator |
Fibroblast |
Mitochondrial biogenesis, oxidative metabolism |
Diabetes, obesity, neurodegenerative diseases, cancer |
|
Nrf2 |
Nuclear factor erythroid 2- related factor 2 |
Transcription Factor |
Fibroblast |
Antioxidant response, detoxification |
Cancer, neurodegenerative diseases, inflammatory diseases |
|
FOXJ1 |
Forkhead box protein J1 |
Transcription Factor |
Fibroblast |
Cilio-genesis, motile cilia development | Primary ciliary dyskinesia, respiratory infections |
|
TFEB |
Transcription factor EB |
Transcription Factor |
Fibroblast |
Autophagy, lysosomal biogenesis | Neurodegenerative diseases, lysosomal storage disorders |
|
cMyc |
MYC proto- oncogene |
Transcription Factor |
Fibroblast |
Cell proliferation, growth, apoptosis, metabolism |
Multiple cancers Burkitt lymphoma, breast, colon, lung |
| p53 | Tumor protein p53 | Transcription Factor | Fibroblast | Tumor suppression, cell cycle arrest, apoptosis | Li-Fraumeni syndrome, multiple cancers >50% of human cancers |
|
p63 |
Tumor protein p63 |
Transcription Factor |
Fibroblast |
Epithelial development, stem cell maintenance |
Ectodermal dysplasia syndromes, squamous cell carcinomas |
|
SIM1 |
Single-minded homolog 1 |
Transcription Factor |
Fibroblast |
Hypothalamic development, energy homeostasis |
Obesity, Prader-Willi- like syndrome |
|
FOXM1 |
Forkhead box protein M1 |
Transcription Factor |
Fibroblast |
Cell cycle progression, proliferation, DNA repair |
Multiple cancers breast, lung, liver, prostate |
|
CTCF |
CCCTC-binding factor |
Transcription Factor |
Fibroblast |
Chromatin organization, insulator function |
Cancer, developmental disorders |
|
MITF |
Microphthalmia- associated transcription factor |
Transcription Factor |
Fibroblast |
Melanocyte development, pigmentation |
Melanoma, Waardenburg syndrome |
|
HIF |
Hypoxia- inducible factor |
Transcription Factor |
Fibroblast |
Hypoxia response, angiogenesis, metabolic adaptation |
Cancer, ischemic diseases, pulmonary hypertension |
|
MYOD1 |
Myogenic differentiation 1 |
Transcription Factor |
Fibroblast |
Muscle cell differentiation, myogenesis |
Rhabdomyosarcoma, muscular dystrophy |
|
PPARg |
Peroxisome proliferator- activated receptor gamma |
Nuclear Receptor |
Fibroblast |
Adipogenesis, glucose metabolism, anti- inflammation |
Type 2 diabetes, obesity, metabolic syndrome, cancer |
Research Rationale and Objectives
Given Metadichol's unprecedented ability to activate multiple transcriptional regulatory networks, we hypothesized that Metadichol treatment would result in coordinated modulation of the 36 gene and their expression. Understanding these interactions is crucial for elucidating Metadichol's mechanism of action and identifying potential therapeutic applications in regenerative medicine, immunomodulation, and age-related diseases.
The present Q-RT-PCR study aimed to
- Comprehensively characterize the dose-dependent effects of Metadichol on all 36 genes in human PBMC and Fibroblasts.
- Identify optimal concentrations for maximal transcriptional effects.
- Analyze the relationship between the 36 Master gene regulated and Metadichol's known effects on nuclear receptors, sirtuins, TLRs, and circadian networks; and
- Provide mechanistic insights into the synergistic transcriptional networks underlying Metadichol's pleiotropic biological activities.
Experimental
A commercial service provider Skanda Life Sciences, Bangalore, India performed the quantitative q-RT‒ PCR, Western blot analysis, and cell culture work. NHDF were obtained from ATCC USA. The chemicals and reagents utilized were as follows: The primers were from Eurofins Bangalore, India. Other molecular biology reagents were obtained from Sigma‒Aldrich, India.
Materials and Methods
Cell Isolation and Culture
Fresh human blood was collected in EDTA-containing tubes following institutional review board approval and informed consent procedures. PBMCs were isolated via Histopaque-1077 density gradient centrifugation. Briefly, blood was diluted 1:1 with phosphate-buffered saline PBS and carefully layered over Histopaque-1077. Following centrifugation at 400×g for 30 minutes at room temperature, the mononuclear cell layer was collected, washed twice with PBS, and resuspended in RPMI-1640 medium supplemented with 10% fetal bovine serum.
Material Treatment
Isolated PBMCs were treated with Metadichol at concentrations of 1 pg/ml, 100 pg/ml, 1 ng/ml, and 100 ng/ml, with untreated cells serving as controls. The treatment duration was optimized on the basis of preliminary time-course experiments. The cells were maintained at 37°C in a humidified atmosphere containing 5% CO₂.
Cell maintenance and seeding- Cell density at 1 X 10⁶ cells/ml of media were prepared and seeded into 6 well plates and incubated for 24 hours at 37oC with 5% CO2. Post 24 hours of seeding, the media was removed carefully, and the cells were treated with respective test samples Concentration will be selected on basis of MTT experiment and incubated for 24 hours at 37℃ in CO2 incubator.
Table 1.
Treatment concentrations.
| Cell lines | Sample |
Treatment details |
|
Human, PBMC, NHDF |
Metadichol |
Control |
| 1 pg/ml | ||
| 100 pg/ml | ||
| 1 ng/ml | ||
| 100ng/ml |
Sample Préparation and RNA Isolation
Treated cells were dissociated and rinsed with sterile 1X PBS and centrifuged. The supernatant was decanted and 0.1 ml of TRIzol was added and gently mixed by inversion for 1 min. Samples were allowed to stand for 10 minutes at room temperature. To this 0.75 ml chloroform was added per 0.1 ml of TRIzol used. The contents were vortexed for 15 seconds. The tube was allowed to stand at room temperature for 5 mins. The resulting mixture was centrifuged at 12,000 rpm for 15 mins at 4˚C. Upper aqueous phase was collected to a new sterile micro-centrifuge tube to which 0.25 ml of isopropanol was added and gently mixed by inverting the contents for 30 seconds and incubated at -20˚C for 20 minutes. The contents were centrifuged at 12,000 rpm for 10 minutes at 4˚C. Supernatant was discarded and the RNA pellet was washed by adding 0.25 ml of 70% ethanol. The RNA mixture was centrifuged at 12,000 rpm at 4˚C. Supernatant was carefully discarded and the pellet was air dried. The RNA pellet was then re-suspended in 20 µl of DEPC treated water. Total RNA yield was quantified using Spectra drop Spectramax i3x, Molecular devices, USA.
Table 2.
Total RNA yield.
| Test concentrations | |||||
|---|---|---|---|---|---|
|
RNA yield ng/µl |
0 |
1 pg/ ml |
100 pg/ ml |
1 ng/ ml |
100 ng/ ml |
| Human PBMC's | 619.520 | 317.880 | 681.840 | 700.160 | 667.400 |
Table 3.
Total RNA yield.
| Test concentrations | |||||
| RNA yield ng/µl | 0 | 1 pg/ ml | 100 pg/ ml | 1 ng/ ml | 100 ng/ ml |
| NHDF cells | 147.5 | 593.7 | 311.6 | 392 | 295.4 |
cDNA Synthesis
The cDNA was synthesized from 500 ng of RNA using the cDNA synthesis kit from Prime script RT reagent kit TAKARA with oligo dT primer according to the manufacturer’s instructions. The reaction volume was set to 20 μl and cDNA synthesis was performed at 50 oC for 30 min, followed by RT inactivation at 85oC for 5 min using applied biosystems, Veritii. The cDNA was further used for real time PCR analysis.
Primers and qPCR Analysis
The PCR mixture final volume of 20 µl contained 1.4 µl of cDNA, 10 µL of SyBr green Master mix and 1 µM of respective complementary forward and reverse primers specific for respective target genes. The reaction was carried out with enzyme activation at 95oC for 2 minutes followed by 2 step reaction with initial denaturation and annealing cum extension step at 95°C for 5 seconds, annealing for 30 seconds at appropriate respective temperature amplified for 39 cycles followed by secondary denaturation at 95 °C for 5 seconds, 1 cycle with melt curve capture step ranging from 65°C to 95°C for 5 secs each. The obtained results was analyzed and fold expression or regulation was calculated
Table 4.
Primer List.
| Primer Name | Sequence | Amplicon | Annealing temperature | |
| GAPDH | F | GTCTCCTCTGACTTCAACAGCG | 186 | 60 |
| R | ACCACCCTGTTGCTGTAGCCAA | |||
| CD3G | F | GCATTTTCGTCCTTGCTGTTGGG | 134 | 50 |
| R | GGTCATCTTCTCGATCCTTGAGG | |||
| CD4 | F | CCTCCTGCTTTTCATTGGGCTAG | 125 | 65 |
| R | TGAGGACACTGGCAGGTCTTCT | |||
| CD7 | F | TGTCGGACACTGGCACCTACAC | 114 | 57 |
| R | TCCGAGCATCTGTGCCATCCTT | |||
| CD25 | F | GAGACTTCCTGCCTCGTCACAA | 125 | 53 |
| R | GATCAGCAGGAAAACACAGCCG | |||
| CD27 | F | TCAGCAACTGGGCACAGAAA | 180 | 65 |
| R | TTCCTGGCTCACACATCTGG | |||
| CD28 | F | GAGAAGAGCAATGGAACCATTATC | 121 | 57 |
| R | TAGCAAGCCAGGACTCCACCAA | |||
| CD31 | F | ATTACCTGACCAGCGCCAC | 171 | 57 |
| R | AGAGTGAAGACTGCAGGCAC | |||
| CD45 | F | CTTCAGTGGTCCCATTGTGGTG | 106 | 61 |
| R | CCACTTTGTTCTCGGCTTCCAG | |||
| CD58 | F | AACCTGTATCCCAAGCAGCG | 173 | 65 |
| R | TGCTGTTGTCTTCATCTTCTGT | |||
| CD86 | F | AAGCAAGAGCACTGTCCCTG | 196 | 67 |
| R | TAAGCACAGCAGCATTCCCA | |||
| CD69 | F | CAGAGGTCAGCAGCATGGAA | 138 | 49 |
| R | AGAGCAGCATCCACTGACAC | |||
| CD8 | F | ATGGCCTTACCAGTGACCG | 104 | 49 |
| R | AGGTTCCAGGTCCGATCCAG | |||
| CD80 | F | CTCTTGGTGCTGGCTGGTCTTT | 135 | 49 |
| R | GCCAGTAGATGCGAGTTTGTGC | |||
| CD2 | F | GTCAGCAAGGAATCCAGTGTCG | 197 | 62 |
| R | AACGAGCAGTGCCACAAAGACC | |||
| PU.1SPI1 | F | GACACGGATCTATACCAACGCC | 144 | 67 |
| R | CCGTGAAGTTGTTCTCGGCGAA | |||
| FOXP3 | F | GGCACAATGTCTCCTCCAGAGA | 127 | 53 |
| R | CAGATGAAGCCTTGGTCAGTGC | |||
| PPAR gamma | F | ACGCACCGAAATTCTCCCTT | 171 | 65 |
| R | TCTGCCTCTCCCTTTGCTTG | |||
| MYOD1 | F | CTCCAACTGCTCCGACGGCAT | 148 | 65 |
| R | ACAGGCAGTCTAGGCTCGACAC | |||
| ProX1 | F | AGCGGTCTCTCTAGTACAGGC | 92 | 65 |
| R | AAAGGGGAAAGACACTCTGGG | |||
| SIM1 | F | GACTCTGTACCACCATGTGCAC | 113 | 59 |
| R | GTGTTTCGCCAGGAACCTGTAG | |||
| GCM1 | F | AGTGAACACAGCACCTTCCTCC | 127 | 65 |
| R | TTGGACGCCTTCCTGGAAAGAC | |||
| FOXM1 | F | ATACGTGGATTGAGGACCACT | 175 | 67 |
| R | TCCAATGTCAAGTAGCGGTTG | |||
| HIF-1ALPHA | F | TATGAGCCAGAAGAACTTTTAGGC | 144 | 65 |
| R | CACCTCTTTTGGCAAGCATCCTG | |||
| CTCF | F | GACCACACAAGTGCCATCTCTG | 111 | 59 |
| R | ATGTCGCAGTCTGGGCACTTGT | |||
| FOXJ1 | F | ACTCGTATGCCACGCTCATCTG | 152 | 62 |
| R | GAGACAGGTTGTGGCGGATTGA | |||
| p63 | F | CAGGAAGACAGAGTGTGCTGGT | 121 | 58 |
| R | AATTGGACGGCGGTTCATCCCT | |||
| Nrf2 | F | CACATCCAGTCAGAAACCAGTGG | 111 | 65 |
| R | GGAATGTCTGCGCCAAAAGCTG | |||
| MITF | F | GGCTTGATGGATCCTGCTTTGC | 129 | 62 |
| R | GAAGGTTGGCTGGACAGGAGTT | |||
| TFEB | F | ACCTGTCCGAGACCTATGGG | 222 | 65 |
| R | CGTCCAGACGCATAATGTTGTC | |||
| PGC-1 ALPHA | F | CCAAAGGATGCGCTCTCGTTCA | 146 | 67 |
| R | CGGTGTCTGTAGTGGCTTGACT | |||
| TAL-1 | F | CCACCAACAATCGAGTGAAGAGG | 127 | 67 |
| R | GTTCACATTCTGCTGCCGCCAT | |||
| VEGF | F | GGAACCTCACTATCCGCAGAGT | 131 | 65 |
| R | CCAAGTTCGTCTTTTCCTGGGC | |||
| C-Myc | F | CCTGGTGCTCCATGAGGAGAC | 106 | 62 |
| R | CAGACTCTGACCTTTTGCCAGG | |||
| BLIMP1PRDM1 | F | CAGTTCCTAAGAACGCCAACAGG | 122 | 65 |
| R | GTGCTGGATTCACATAGCGCATC | |||
| Oct4POU5F1 | F | GTAGTCCCTTCGCAAGCCCT | ||
| R | AGGTCCGAGGATCAACCCAG | 163 | 65 | |
| p53 | F | CCTCAGCATCTTATCCGAGTGG | 163 | 58 |
| R | TGGATGGTGGTACAGTCAGAGC |
Results
Overview of Metadichol-Induced Gene Expression Changes
Metadichol treatment induced substantial gene expression changes (Figure 1 and Figure 2) across 36 master regulator genes involved in immune regulation, metabolism, and transcriptional control. The most dramatic upregulation was observed for metabolic master regulators PPARγ 24.25-fold at 1 pg/mL, PGC1α 11.08-fold at 1 pg/mL, and tumor suppressor p53 9.61-fold at 1 pg/mL. T-cell markers CD4 and CDS showed consistent upregulation 2.03-fold and 2.15-fold, respectively, while costimulatory molecules CDS0 and CDS6 were severely downregulated 0.06-fold and 0.03-fold, respectively. Raw data available as supplementary file.
Dose-Response Patterns and Functional Classification
Gene expression responses to Metadichol exhibited distinct dose-dependent patterns. Hierarchical clustering (Figure 2) revealed four major expression clusters:
- Low-dose responders optimal at 1 pg/mL including PPARγ, PGC1α, and p53.
- Intermediate-dose responders optimal at 100 pg/mL - 1 ng/mL.
- High-dose responders optimal at 100 ng/mL.
- Dose-independent responders showing consistent expression across concentrations.
Figure 3
: Hierarchical clustering of master regulator gene expression. The dendrograms on the left genes and top concentrations reveal distinct clusters of co- regulated genes, suggesting that Metadichol coordinates the expression of specific gene programs. The clustering pattern indicates that metabolic regulators PPARγ, PGC1α, p53 form a distinct cluster separate from CD markers.
Figure 4; Synergistic and Antagonistic Gene Expression Networks.
Correlation matrix (Figure 4) and Pearson correlation (Figure 5) identified highly synergistic r > 0.99 and antagonistic r < -0.90 gene pairs, representing coordinated biological pathways.
These highlights (Figure 5) strong positive correlations red, r > 0.90 and strong negative correlations blue, r < -0.90 between specific genes. The PPARγ-PGC1α-p53 synergistic axis and the CDS-p53 antagonistic relationship are clearly visible.
Synergistic Pairs: The most therapeutically significant was the PPARγ-PGC1α synergy r = 0.9912, representing coordinated activation of metabolic reprogramming and mitochondrial biogenesis pathways. This was reinforced by strong correlations between PGC1α-p53 r = 0.9921 and PPARγ-p53, creating a metabolic-tumor suppressor axis that simultaneously enhances T-cell fitness and promotes cancer cell apoptosis. [99,100,101,102].
Antagonistic Pairs: The most significant antagonistic relationship was CD8-p53 r = - 0.9913. This suggests differential regulation of p53 across cell types: in cytotoxic T-cells, p53 suppression would allow proliferation and effector function, while in cancer cells, p53 activation would induce growth arrest and apoptosis. [103,104]
This coordinated metabolic-tumor suppressor axis not only drives the energetic and biosynthetic demands required for robust T-cell responses, but also simultaneously triggers apoptotic pathways within cancer cells, contributing to a dual therapeutic effect. Notably, the presence of antagonistic gene pairs such as CDS-p53 highlights the complex regulatory landscape, in which immune cell protection and tumor cell targeting are finely balanced. These intricate gene-gene relationships underscore the immunotherapies. Additional antagonistic relationships included CD8-FOXP3 r =-0.89 and CD4-FOXP3 indicating a shift from regulatory T-cell suppression toward effector T-cell activation. [105,106,107,108]
Figure 6.
Comprehensive Gene Interaction Network Centered on Metadichol. This circular network diagram displays the complex interconnections between all 36 master regulator genes CD markers and transcription factors regulated by Metadichol. Red lines represent positive correlations synergistic relationships, green lines indicate negative correlations antagonistic relationships, and line thickness reflects the strength of correlation.
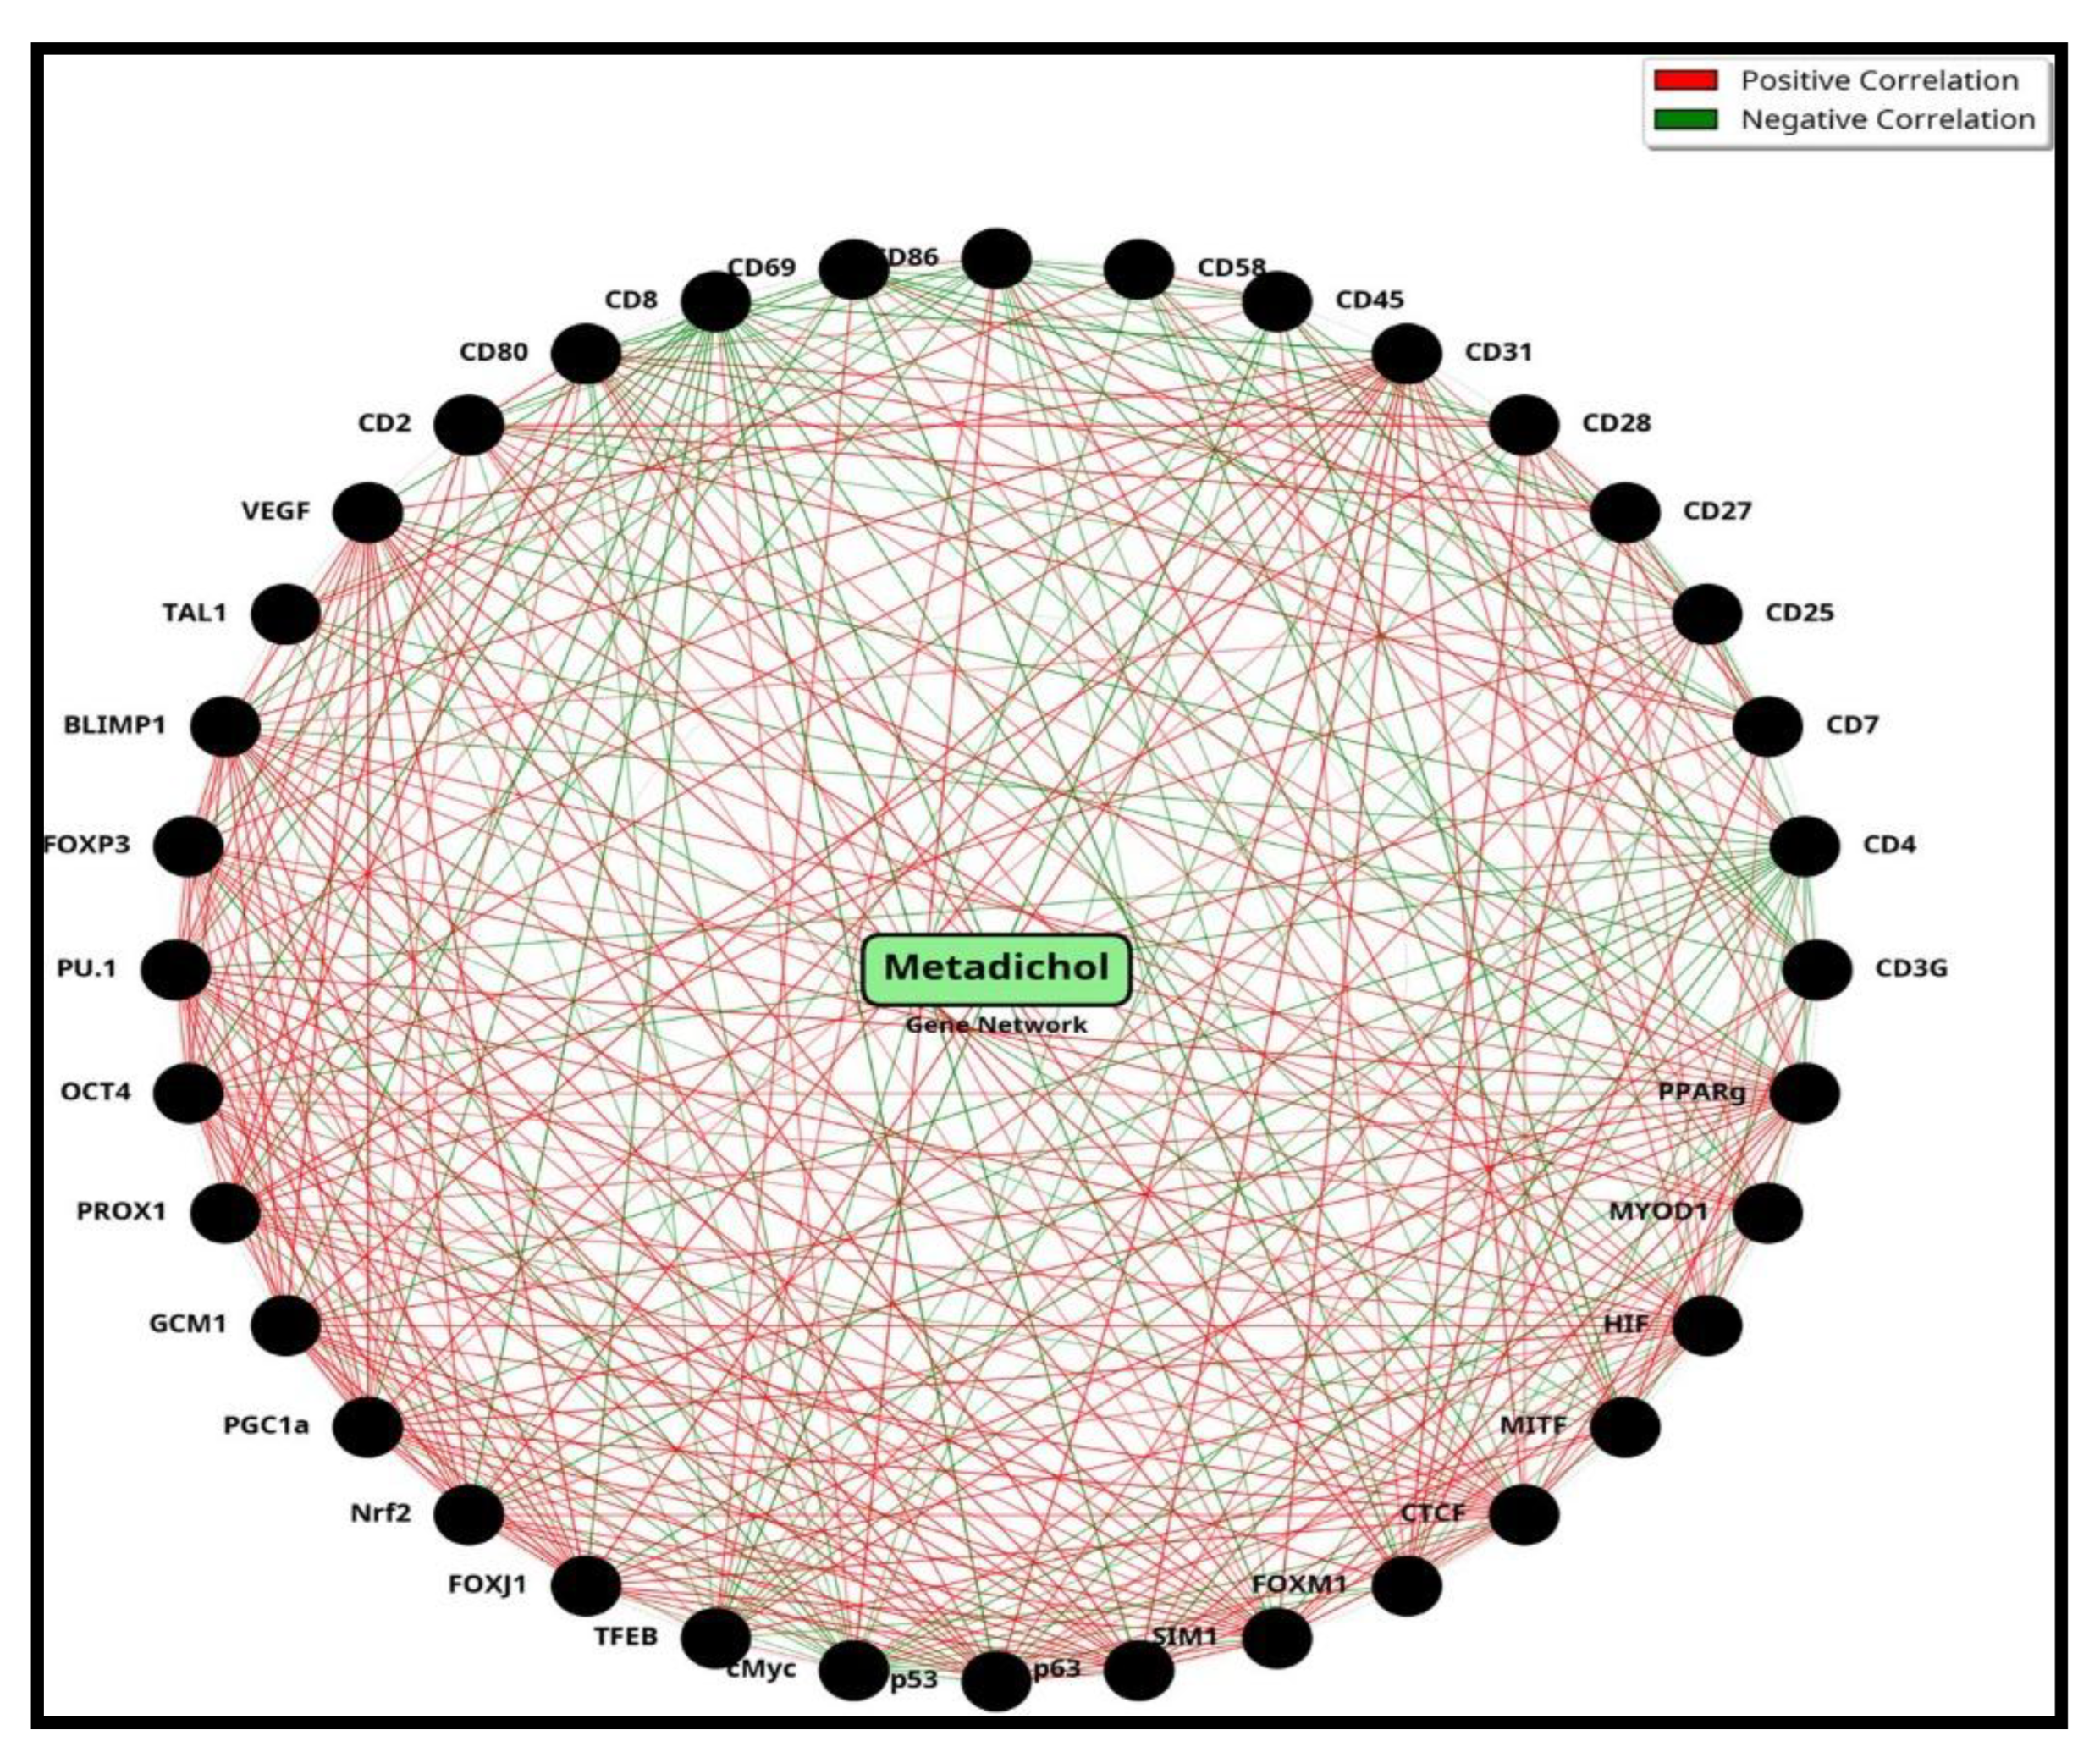
Collectively, these findings illustrate the intricate synergy and antagonism governing immune and metabolic gene networks in response to Metadichol. interplay between robust synergistic axes and tightly regulated antagonistic pairs forms a dynamic regulatory framework that optimizes immune cell function while effectively targeting cancer cells. Such a system ensures that immune activation is balanced with mechanisms that prevent overactivation or autoimmunity, thereby maximizing therapeutic efficacy and minimizing adverse effects.
Discussion
This comprehensive analysis of Metadichol-induced gene expression changes reveals a sophisticated immune metabolic reprogramming mechanism with significant implications for cancer immunotherapy. Three key findings emerge
- Synergistic activation of metabolic master regulators creates coordinated enhancement of T-cell fitness,
- Antagonistic regulation of immune cell subsets optimizes the balance between effector and suppressor functions,
- Differential cell- type regulation, exemplified by the CDS- p53 antagonism, suggests selective protection of immune cells while targeting cancer cells.
Metabolic Reprogramming as a Foundation for Anti-Tumor Immunity
The dramatic synergistic upregulation of PPARγ 24.25× and PGC1α 11.08× represents a powerful metabolic reprogramming signal. [129] Recent studies have demonstrated that T- cell metabolic fitness is a critical determinant of anti-tumor immunity. [130] Tumor- infiltrating lymphocytes face severe metabolic stress in the nutrient-depleted, hypoxic tumor microenvironment, leading to mitochondrial dysfunction, reduced ATP production, and impaired effector functions. [131]
PPARγ activation promotes fatty acid oxidation FAO in T-cells, shifting metabolism away from glycolysis toward oxidative phosphorylation. [132] It has been demonstrated that PPAR agonists enhance the number of tumor-reactive CD8+ T-cells and facilitate anti-PD-1 therapy by boosting FAO ( fatty acid oxidation) to rescue T-cells from metabolic exhaustion. [133] Similarly, enforced PGC1α expression promotes CD8+ T-cell fitness, memory formation, and antitumor immunity by enhancing mitochondrial biogenesis and oxidative capacity. [134]
The synergistic PPARγ-PGC1α activation observed with Metadichol r = 0.9912 suggests coordinated enhancement of both the transcriptional program PPARγ and the metabolic machinery PGC1α- driven mitochondrial biogenesis required for sustained T-cell function in tumors. [135]. This metabolic reprogramming may explain Metadichol potential to enhance responses to immune checkpoint blockade, as metabolically fit T- cells are better equipped to respond to checkpoint inhibitor-mediated activation. [136].
The p53 Paradox: Differential Regulation Across Cell Types
The strong antagonistic relationship between CD8 and p53 r = -0.9913 represents one of the most intriguing findings of this analysis. p53 is canonically known as a tumor as a tumor suppresser that induces cell arrest and apoptosis in response to DNA damage and oncogenic stress. [137] However, p53 also plays important roles in immune cell regulation, where its activation can limit T-cell proliferation and induce activation-induced cell death AICD. [138]
The CDS-p53 antagonism suggests that Metadichol may differentially regulate p53 across cell types: suppressing it in T-cells allowing proliferation and preventing activation induced cell death while activating it in cancer cells inducing growth arrest and apoptosis. [139] This differential regulation could occur through several mechanisms, including cell-type-specific cofactors, metabolic state- dependent regulation, and epigenetic differences. [140] The ability of Metadichol to potentially activate p53 in cancer cells while protecting T-cells from p53-mediated growth arrest represents an ideal therapeutic profile. [141]
Immune Balance Optimization: Shifting from Suppression to Effector Function
The antagonistic relationships between effector T-cell markers CDS, CD4 and regulatory T-cell markers FOXP3, CD25 suggest that Metadichol shifts the immune balance away from suppression toward anti-tumor effector functions Regulatory T-cells Tregs expressing FOXP3 and CD25 accumulate in the tumor microenvironment and actively suppress anti-tumor immune responses. [142]
The CD8-FOXP3 antagonism r = -0.89 and CD4-FOXP3 antagonism r = -0.82 indicate that as
Metadichol enhances effector T-cell markers, it simultaneously reduces regulatory T-cell markers. This shift could reduce immunosuppression in the tumor microenvironment, allowing stronger anti- tumor responses. The discovery of Tregs and their master regulator, FOXP3, by Sakaguchi, Brunkow, and Ramsdell, was recognized with the 2025 Nobel Prize in Physiology or Medicine, underscoring the significance of this finding. [1,2,3] Tanaka and Sakaguchi reviewed strategies for targeting Tregs in cancer immunotherapy, noting that selective depletion or functional inhibition of effector Tregs can enhance anti-tumor immunity without causing autoimmunity. [143]
Interestingly, Metadichol also downregulates costimulatory molecules CD80 0.06× and CD86 0.03×, which might initially seem counterintuitive [144]. However, the antagonistic relationship between PGC1α and CDS0 r = -0.7S suggests a potential shift from activation-dependent to metabolically driven T-cell function. T-cells with enhanced metabolic capacity through PGC1α upregulation may become more autonomous and resilient in the immunosuppressive tumor microenvironment where costimulatory signals are often limited. [145]
Modulation of T, B, and NK Cell Subsets
Metadichol and its immunomodulatory effects extend across the three major lymphocyte lineages, summarized in Table 5, Table 6 and Table 7 and visualized in Figure 7, Figure 8 and Figure 9 suggesting a comprehensive reprogramming of the adaptive and innate immune systems. [146,147,148,149,150,151,152,153,154,155,156,157,158,159,160,161,162,163,164,165,166,167,168,169,170,171,172,173,174,175,176,177,178,179,180,181,182,183,184,185,186,187,188,189,190,191,192,193,194,195,196,197,198,199,200,201,202,203,204,205,206,207,208,209]
Key Findings:
Highly Upregulated Genes >5-fold:
• PGC1α; 11.08-fold: Critical for memory T cell metabolism
• p53;9.61-fold: Regulates T cell survival and Treg stability
• PPARγ;24.25-fold: Essential for Treg function
Effects on T Cell Subsets:
T Cells Effector: Most genes affect effector T cell activation, proliferation, and function
T Memory Cells: Key genes include PGC1α, CD4, CD8, CD27, CD28, CD58, CD2, OCT4, cMyc
T Regulatory Cells: Key genes include FOXP3, CD4, CD25, CD28, BLIMP1, PGC1α, PPARγ, HIF, p53
Figure 7.
Gene Regulation Network of T Cell Subsets original Network Diagram. This network diagram illustrates the complex regulatory relationships between master regulator genes and T cell subsets red arrows indicate activation/upregulation, green arrows indicate downregulation/inhibition, and light pink arrows indicate minimal or indirect effects.
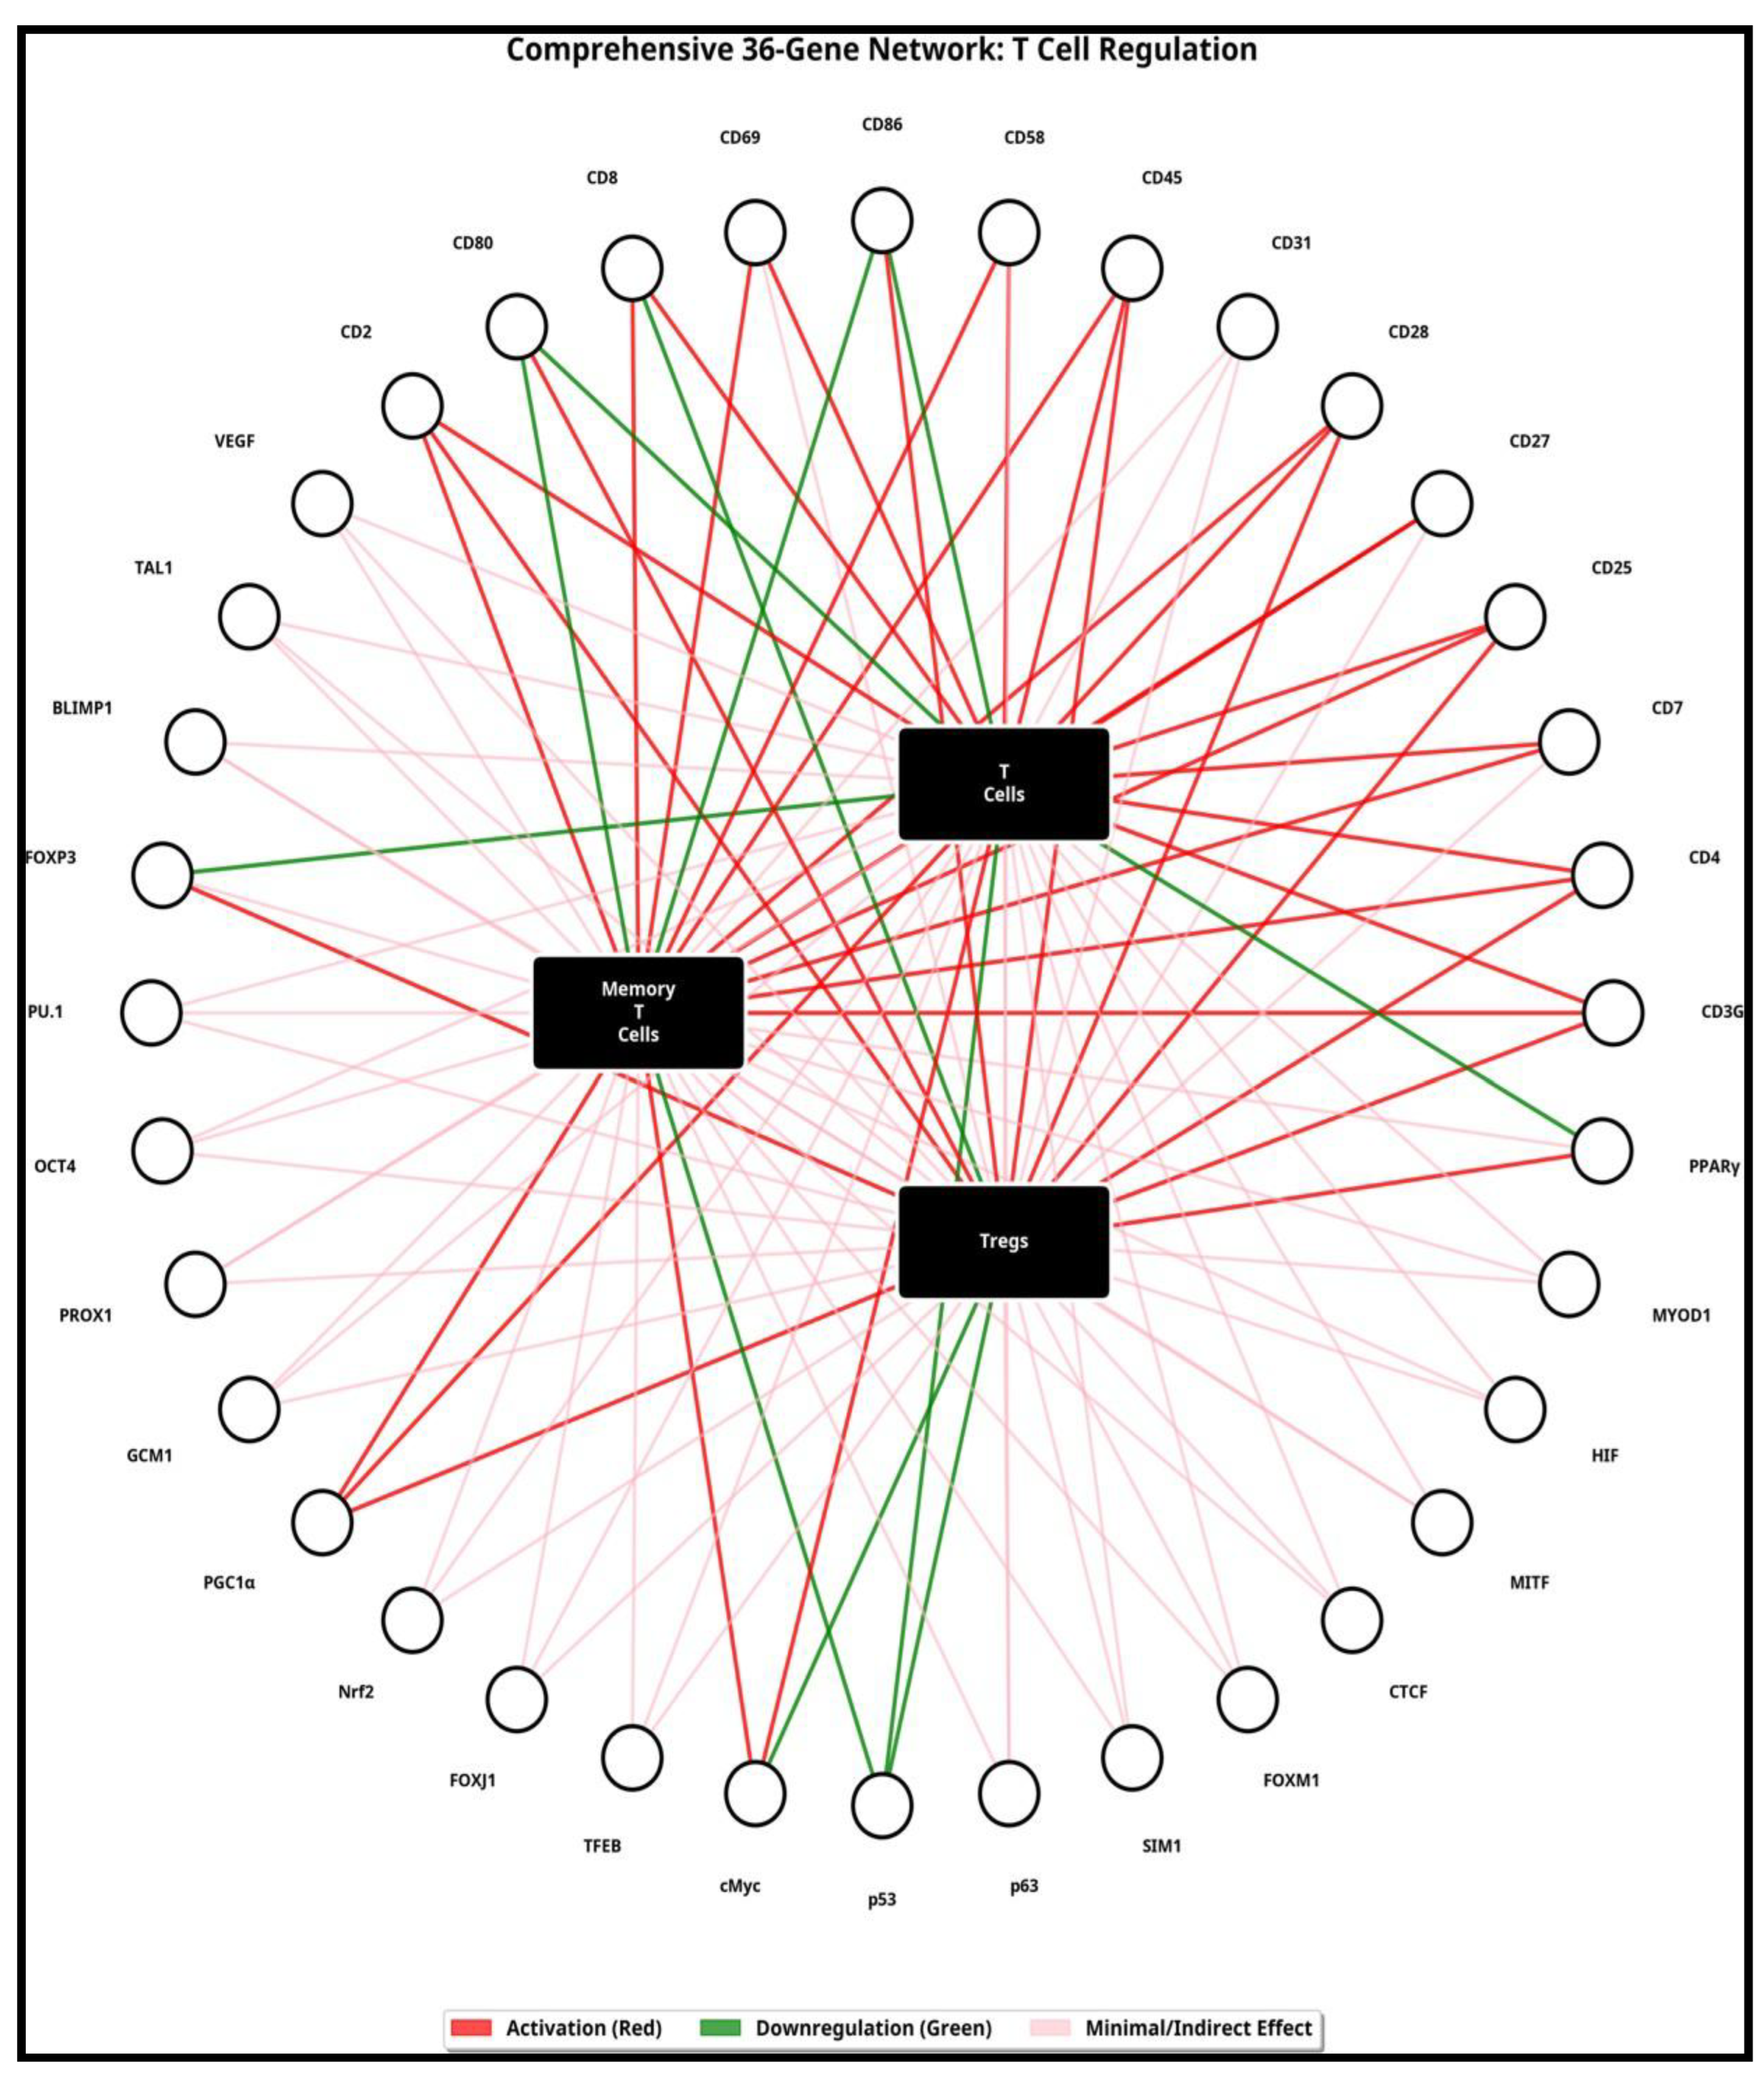
Table 6.
Metadichol-Regulated Genes: Effects on B Cell Subsets.
| Gene | Regulation | Effect on B Cells | Effect on Memory B Cells | Effect on Plasma Cells |
| CD3G | ↑ | Minimal effect T cell marker | Minimal effect | Minimal effect |
| CD4 | ↑ | Minimal effect primarily T cell marker | Minimal effect | Minimal effect |
| CD7 | ↓ | Minimal effect primarily T/NK marker | Minimal effect | Minimal effect |
| CD8 | ↑ | Minimal effect T cell marker | Minimal effect | Minimal effect |
| CD25 | ↑/↓ | Modulates B cell activation | May affect memory B cell survival | Minimal effect |
| CD27 | ↓ | Reduced B cell activation | Impaired memory B cell survival and recall | Reduced plasma cell ifferentiation |
| CD28 | ↑/↓ | Minimal direct effect | Minimal effect | Minimal effect |
| CD31 | ↓ | Reduced B cell migration | May affect memory B cell trafficking | Minimal effect |
| CD45 | ↓ | Altered BCR signaling threshold | May affect memory B cell activation | Affects plasma cell function |
| CD58 | ↑ | Enhanced B cell-T cell interactions | Supports memory B cell formation | Minimal effect |
| CD69 | ↑ | Early B cell activation marker | May affect memory B cell retention | Minimal effect |
| CD80 | ↓ | Reduced B cell costimulation | May impair memory B cell function | Reduced plasma cell activation |
| CD86 | ↓ | Reduced B cell costimulation | May impair memory B cell function | Reduced plasma cell activation |
| CD2 | ↑ | Minimal direct effect on B cells | Minimal effect | Minimal effect |
| VEGF | ↑ | Promotes B cell survival and migration | Supports memory B cell niches | Supports plasma cell survival n bone marrow |
| TAL1 | ↓ | Affects early B cell development | May affect memory B cell precursors | Minimal effect |
| BLIMP1 | ↑ | Promotes plasma cell differentiation | Inhibits memory B cell formation | Essential for plasma cell development and antibody secretion |
| FOXP3 | ↑ | Minimal direct effect | Minimal effect | Minimal effect |
| PU.1 | ↑ | Critical for B cell development and function | Supports memory B cell formation | Regulates plasma cell gene expression |
| POU5F1 | ↑ | Promotes B cell stemness | May enhance memory B cell potential | Minimal effect |
| PROX1 | ↓ | Minimal direct effect | Minimal effect | Minimal effect |
| GCM1 | ↑ | Minimal direct effect on B cells | Minimal effect | Minimal effect |
| PGC1α | ↑↑ | Enhances B cell metabolic fitness | Critical for memory B cell longevity | Supports plasma cell antibody production |
| Nrf2 | ↓ | Reduced antioxidant response in B cells | May affect memory B cell survival | May affect plasma cell longevity |
| FOXJ1 | ↑ | Minimal direct effect | Minimal effect | Minimal effect |
| TFEB | ↓ | Reduced autophagy affects B cell metabolism | May affect memory B cell survival | Affects plasma cell protein folding capacity |
| cMyc | ↑ | Promotes B cell proliferation | Inhibits memory B cell formation | Drives plasma cell idfferentiation |
| p53 | ↑↑ | Regulates B cell survival and apoptosis | May affect memory B cell quality | Regulates plasma cell survival |
| p63 | ↑ | Minimal direct effect | Minimal effect | Minimal effect |
| SIM1 | ↑ | Minimal direct effect | Minimal effect | Minimal effect |
| FOXM1 | ↓ | Reduced B cell proliferation | May affect memory B cell formation | Minimal effect |
| CTCF | ↓ | Altered immunoglobulin gene regulation | May affect memory B cell epigenetics | Affects plasma cell antibody class switching |
| MITF | ↓/↑ | Minimal direct effect | Minimal effect | Minimal effect |
| HIF | ↑ | Enhances B cell function in hypoxia | May affect memory B cell metabolism | Supports plasma cell survival in bone marrow |
| MYOD1 | ↓ | Minimal direct effect on B cells | Minimal effect | Minimal effect |
| PPARγ | ↑↑↑ | Modulates B cell metabolism and function | Supports memory B cell metabolism | Critical for plasma cell survival and antibody production |
Legend: ↑ = Upregulated fold change >1.5.↑↑ = Highly upregulated fold change >5. ↑↑↑ = Very highly upregulated fold change >10. ↓ = Downregulated fold change <0.7. ↑/↓ = Variable regulation depending on concentration.
Key Findings:
Critical Genes for B Cell Subsets:
B Cells General:
• PU.1 ↑: Essential for B cell development
• PGC1α ↑↑: Enhances metabolic fitness
• PPARγ ↑↑↑: Modulates metabolism
• CD45 ↓: Alters BCR signaling
• BLIMP1 ↑: Drives plasma cell differentiation
Memory B Cells:
• PGC1α ↑↑: Critical for longevity
• CD27 ↓: Impaired survival downregulation is detrimental
• cMyc ↑: Inhibits memory formation high levels favor effector fate
• BLIMP1 ↑: Inhibits memory formation
Plasma Cells:
• BLIMP1 ↑: Master regulator of plasma cell differentiation
• PPARγ ↑↑↑: Critical for survival and antibody production
• PGC1α ↑↑: Supports antibody production
• VEGF ↑: Supports survival in bone marrow
• HIF ↑: Supports survival in hypoxic bone marrow
• CTCF ↓: Affects antibody
Figure 8.
Gene Regulation Network of B Cell Subsets Original Network Diagram. This network diagram illustrates the complex regulatory relationships between master regulator genes and B cell subsets Red arrows indicate activation/upregulation, green arrows indicate downregulation/inhibition, and light pink arrows indicate minimal or indirect effects.
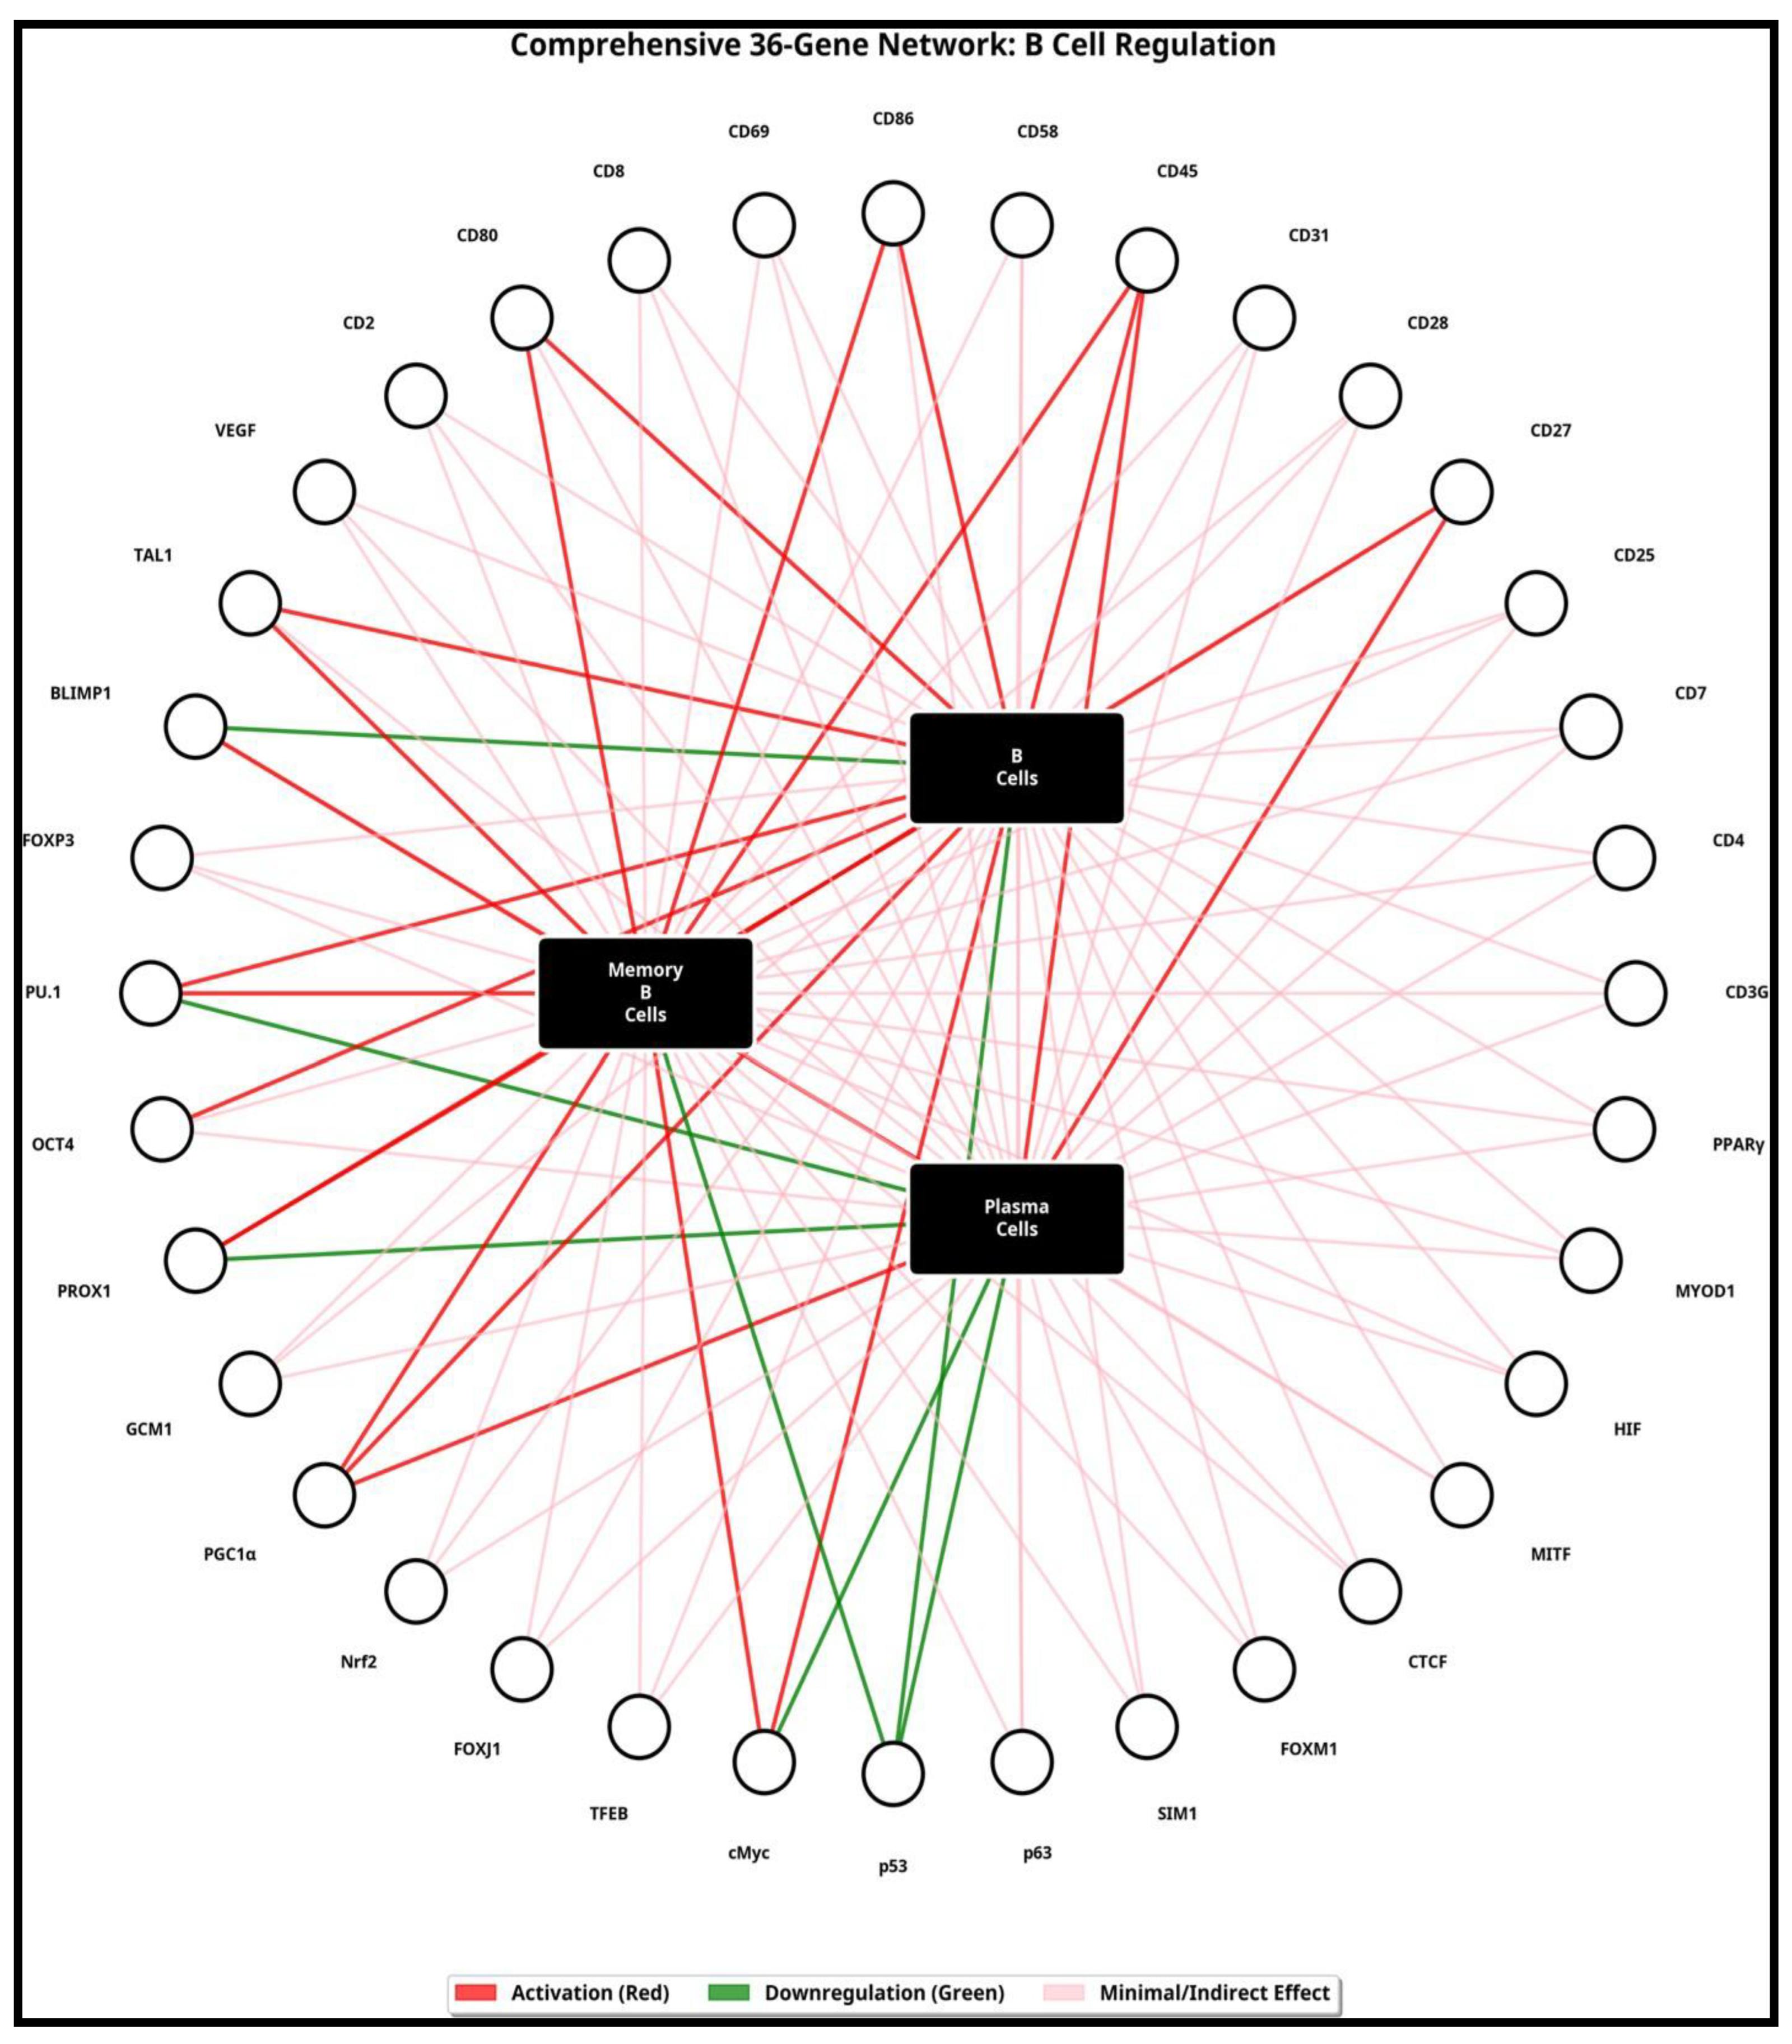
Table 7.
Metadichol-Regulated Genes: Effects on NK Cell Subsets.
|
Gene |
Regulation |
Effect on NK Cell Activation |
Effect on NK Cell Cytotoxicity |
Effect on NK Cell Survival |
|
CD3G |
↑ |
Minimal effect T cell marker |
Minimal effect |
Minimal effect |
|
CD4 |
↑ |
Minimal effect T cell marker |
Minimal effect |
Minimal effect |
|
CD7 |
↓ |
Reduced NK cell activation |
May affect cytotoxicity |
May affect survival |
|
CD8 |
↑ |
Enhanced NK cell activation |
May enhance cytotoxicity |
Supports survival |
|
CD25 |
↑/↓ |
Modulates IL-2 responsiveness and activation |
Affects IL-2-driven cytotoxicity |
Critical for IL-2-mediated survival |
|
CD27 |
↓ |
Reduced NK cell activation |
May impair cytotoxicity |
Reduced survival signals |
|
CD28 |
↑/↓ |
Modulates NK cell costimulation |
May affect cytotoxicity |
Affects survival signals |
|
CD31 |
↓ |
Reduced NK cell migration |
May affect target cell engagement |
Minimal effect |
|
CD45 |
↓ |
Altered NK cell signaling threshold |
May affect cytotoxic signaling |
Affects survival signaling |
|
CD58 |
↑ |
Enhanced NK cell-target cell interactions | Promotes cytotoxic synapse formation |
Supports survival |
|
CD69 |
↑ |
Early NK cell activation marker |
Promotes cytotoxicity |
Supports tissue retention and survival |
|
CD80 |
↓ |
Reduced costimulatory signaling |
May impair cytotoxicity |
Reduced survival signals |
| CD86 | ↓ | Reduced costimulatory signaling | May impair cytotoxicity | Reduced survival signals |
|
CD2 |
↑ |
Enhanced NK cell activation |
Promotes cytotoxic function |
Supports survival |
|
VEGF |
↑ |
Promotes NK cell recruitment |
May enhance cytotoxicity |
Supports NK cell survival |
|
TAL1 |
↓ |
Affects NK cell development |
May affect cytotoxic potential |
May affect survival |
|
BLIMP1 |
↑ |
Promotes NK cell maturation |
Enhances cytotoxic function |
Supports survival |
|
FOXP3 |
↑ |
May suppress NK cell activation |
May reduce cytotoxicity |
Variable effect |
|
PU.1 |
↑ |
Critical for NK cell development |
Regulates cytotoxic gene expression |
Supports survival |
|
OCT4 |
↑ |
Promotes NK cell stemness |
May affect cytotoxic potential |
Enhances survival |
|
PROX1 |
↓ |
Minimal direct effect |
Minimal effect |
Minimal effect |
|
GCM1 |
↑ |
Minimal direct effect |
Minimal effect |
Minimal effect |
|
PGC1α |
↑↑ |
Enhances NK cell metabolic fitness and activation | Critical for sustained cytotoxicity | Essential for NK cell longevity |
|
Nrf2 |
↓ |
Reduced antioxidant response |
May impair cytotoxicity under oxidative stress |
May reduce survival |
|
FOXJ1 |
↑ |
Minimal direct effect |
Minimal effect |
Minimal effect |
|
TFEB |
↓ |
Reduced autophagy affects NK cell metabolism | May affect cytotoxic granule biogenesis | May reduce survival |
|
cMyc |
↑ |
Promotes NK cell proliferation and activation |
Enhances cytotoxic function |
Supports survival and expansion |
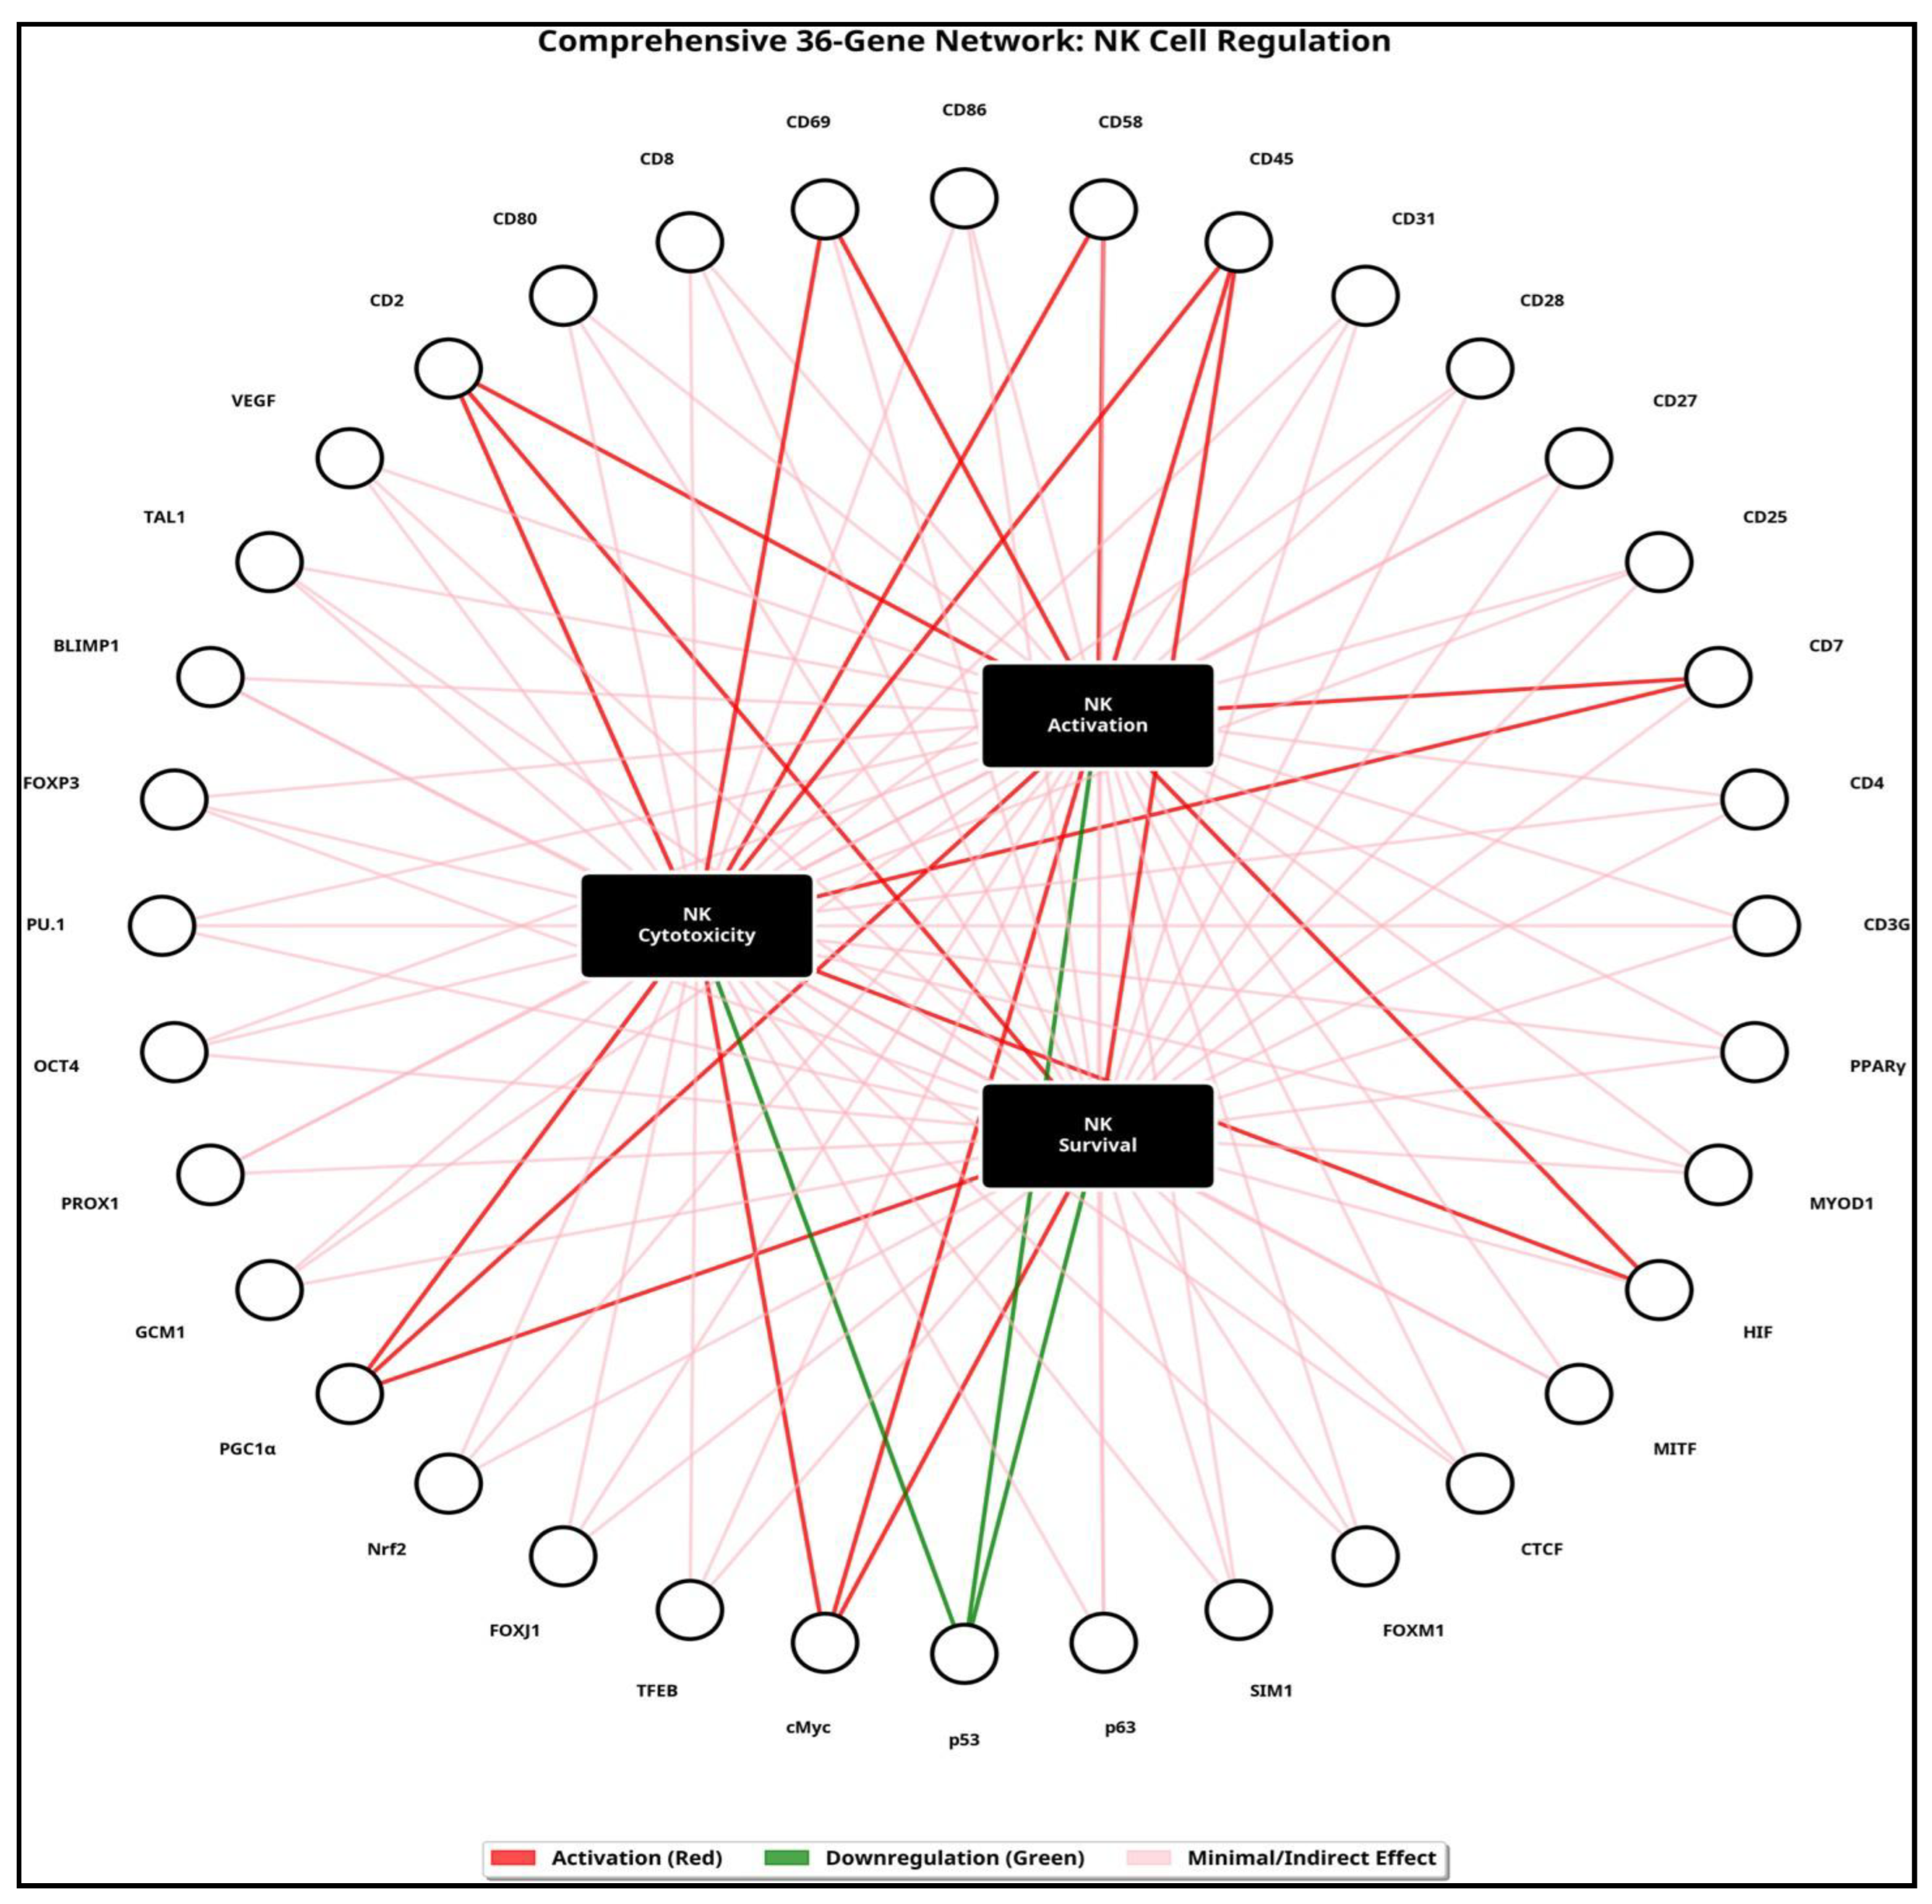
This network diagram illustrates the complex regulatory relationships between master Regulator genes and NK cell subsets red arrows indicate activation/upregulation, green arrows indicate downregulation/inhibition, and light pink arrows indicate minimal or indirect effects.
Figure 9.
Gene Regulation Network of NK Cell Subsets Original Network Diagram.
Critical Genes for NK Cell Functions:
NK Cell Activation:
PGC1α ↑↑: Enhances metabolic fitness and activation
PPARγ ↑↑↑: Modulates metabolism and activation
CD69 ↑: Early activation marker
CD58 ↑: Enhances target cell interactions
CD2 ↑: Enhances activation
BLIMP1 ↑: Promotes maturation
cMyc ↑: Promotes proliferation and activation NK Cell Cytotoxicity:
BLIMP1 ↑: Enhances cytotoxic function
CD69 ↑: Promotes cytotoxicity
CD2 ↑: Promotes cytotoxic function
PGC1α ↑↑: Critical for sustained cytotoxicity
cMyc ↑: Enhances cytotoxic function
HIF ↑: Maintains cytotoxicity in hypoxia
CD58 ↑: Promotes cytotoxic synapse formation
NK Cell Survival:
PPARγ ↑↑↑: Critical for survival and function
PGC1α ↑↑: Essential for longevity
HIF ↑: Supports survival in hypoxic environments
VEGF ↑: Supports survival
cMyc ↑: Supports expansion
CD25 ↑/↓: Critical for IL-2-mediated survival
Genes with Negative Effects Downregulated:
CD7 ↓: Reduced activation
CD27 ↓: Reduced activation and survival detrimental
CD45 ↓: Altered signaling
Nrf2 ↓: Reduced antioxidant protection
TFEB ↓: May affect granule
Hierarchical Regulatory Cascade
One of the most important mechanistic insights from this study is the hierarchical regulatory cascade initiated by Metadichol and its activation of nuclear receptors. This cascade proceeds through multiple levels:
Level 1: Nuclear Receptor Activation Metadichol activates PPARγ and other nuclear receptors, initiating transcriptional programs. [119]
Level 2: Sirtuin Upregulation Nuclear receptors activate sirtuins SIRT1-7, NAD+- dependent deacetylases that regulate metabolism, aging, and immune function. [210,211,212] SIRT1 enhances FOXP3 stability in Tregs 39, while SIRT6 modulates T-cell metabolism and prevents exhaustion. [213]
Level 3: Klotho Activation Sirtuins and nuclear receptors upregulate Klotho, an anti- aging with profound immunomodulatory effects. [214] Klotho suppresses TLR4 signaling via de-glycosylation, reducing inflammatory responses. [215] Klotho also regulates the brain-immune system interface and controls immune cell trafficking. [216]
Level 4
: TLR, FOX, and KLF Modulation.
Klotho modulates TLR signaling, [217] activates FOX transcription factors FOXP3, FOXJ1, FOXM1 and regulates KLF factors KLF2, KLF4, KLF10. [218,219,220] These transcription factors control T-cell differentiation, trafficking, and regulatory function.
Level 5: Circadian Gene Regulation Nuclear receptors and Klotho modulate circadian clock genes CLOCK, BMAL1, PER, CRY, REV-ERB, optimizing immune cell function according to circadian rhythms 221-223. Circadian modulators can optimize immune timing and enhance vaccine responses. [224,225,226]
This hierarchical cascade explains the coordinated gene expression changes observed in our analysis and demonstrates Metadichol and its ability to orchestrate complex immune metabolic reprogramming through a single initiating event: nuclear receptor activation. Based on the wide regulation of transcription factors beginning with nuclear receptors we can visualize the nature of the interactions that regulate T, B and NK cells. as shown in Figure 9, Figure 10 and Figure 11.
Figure 12.
NK cell network.
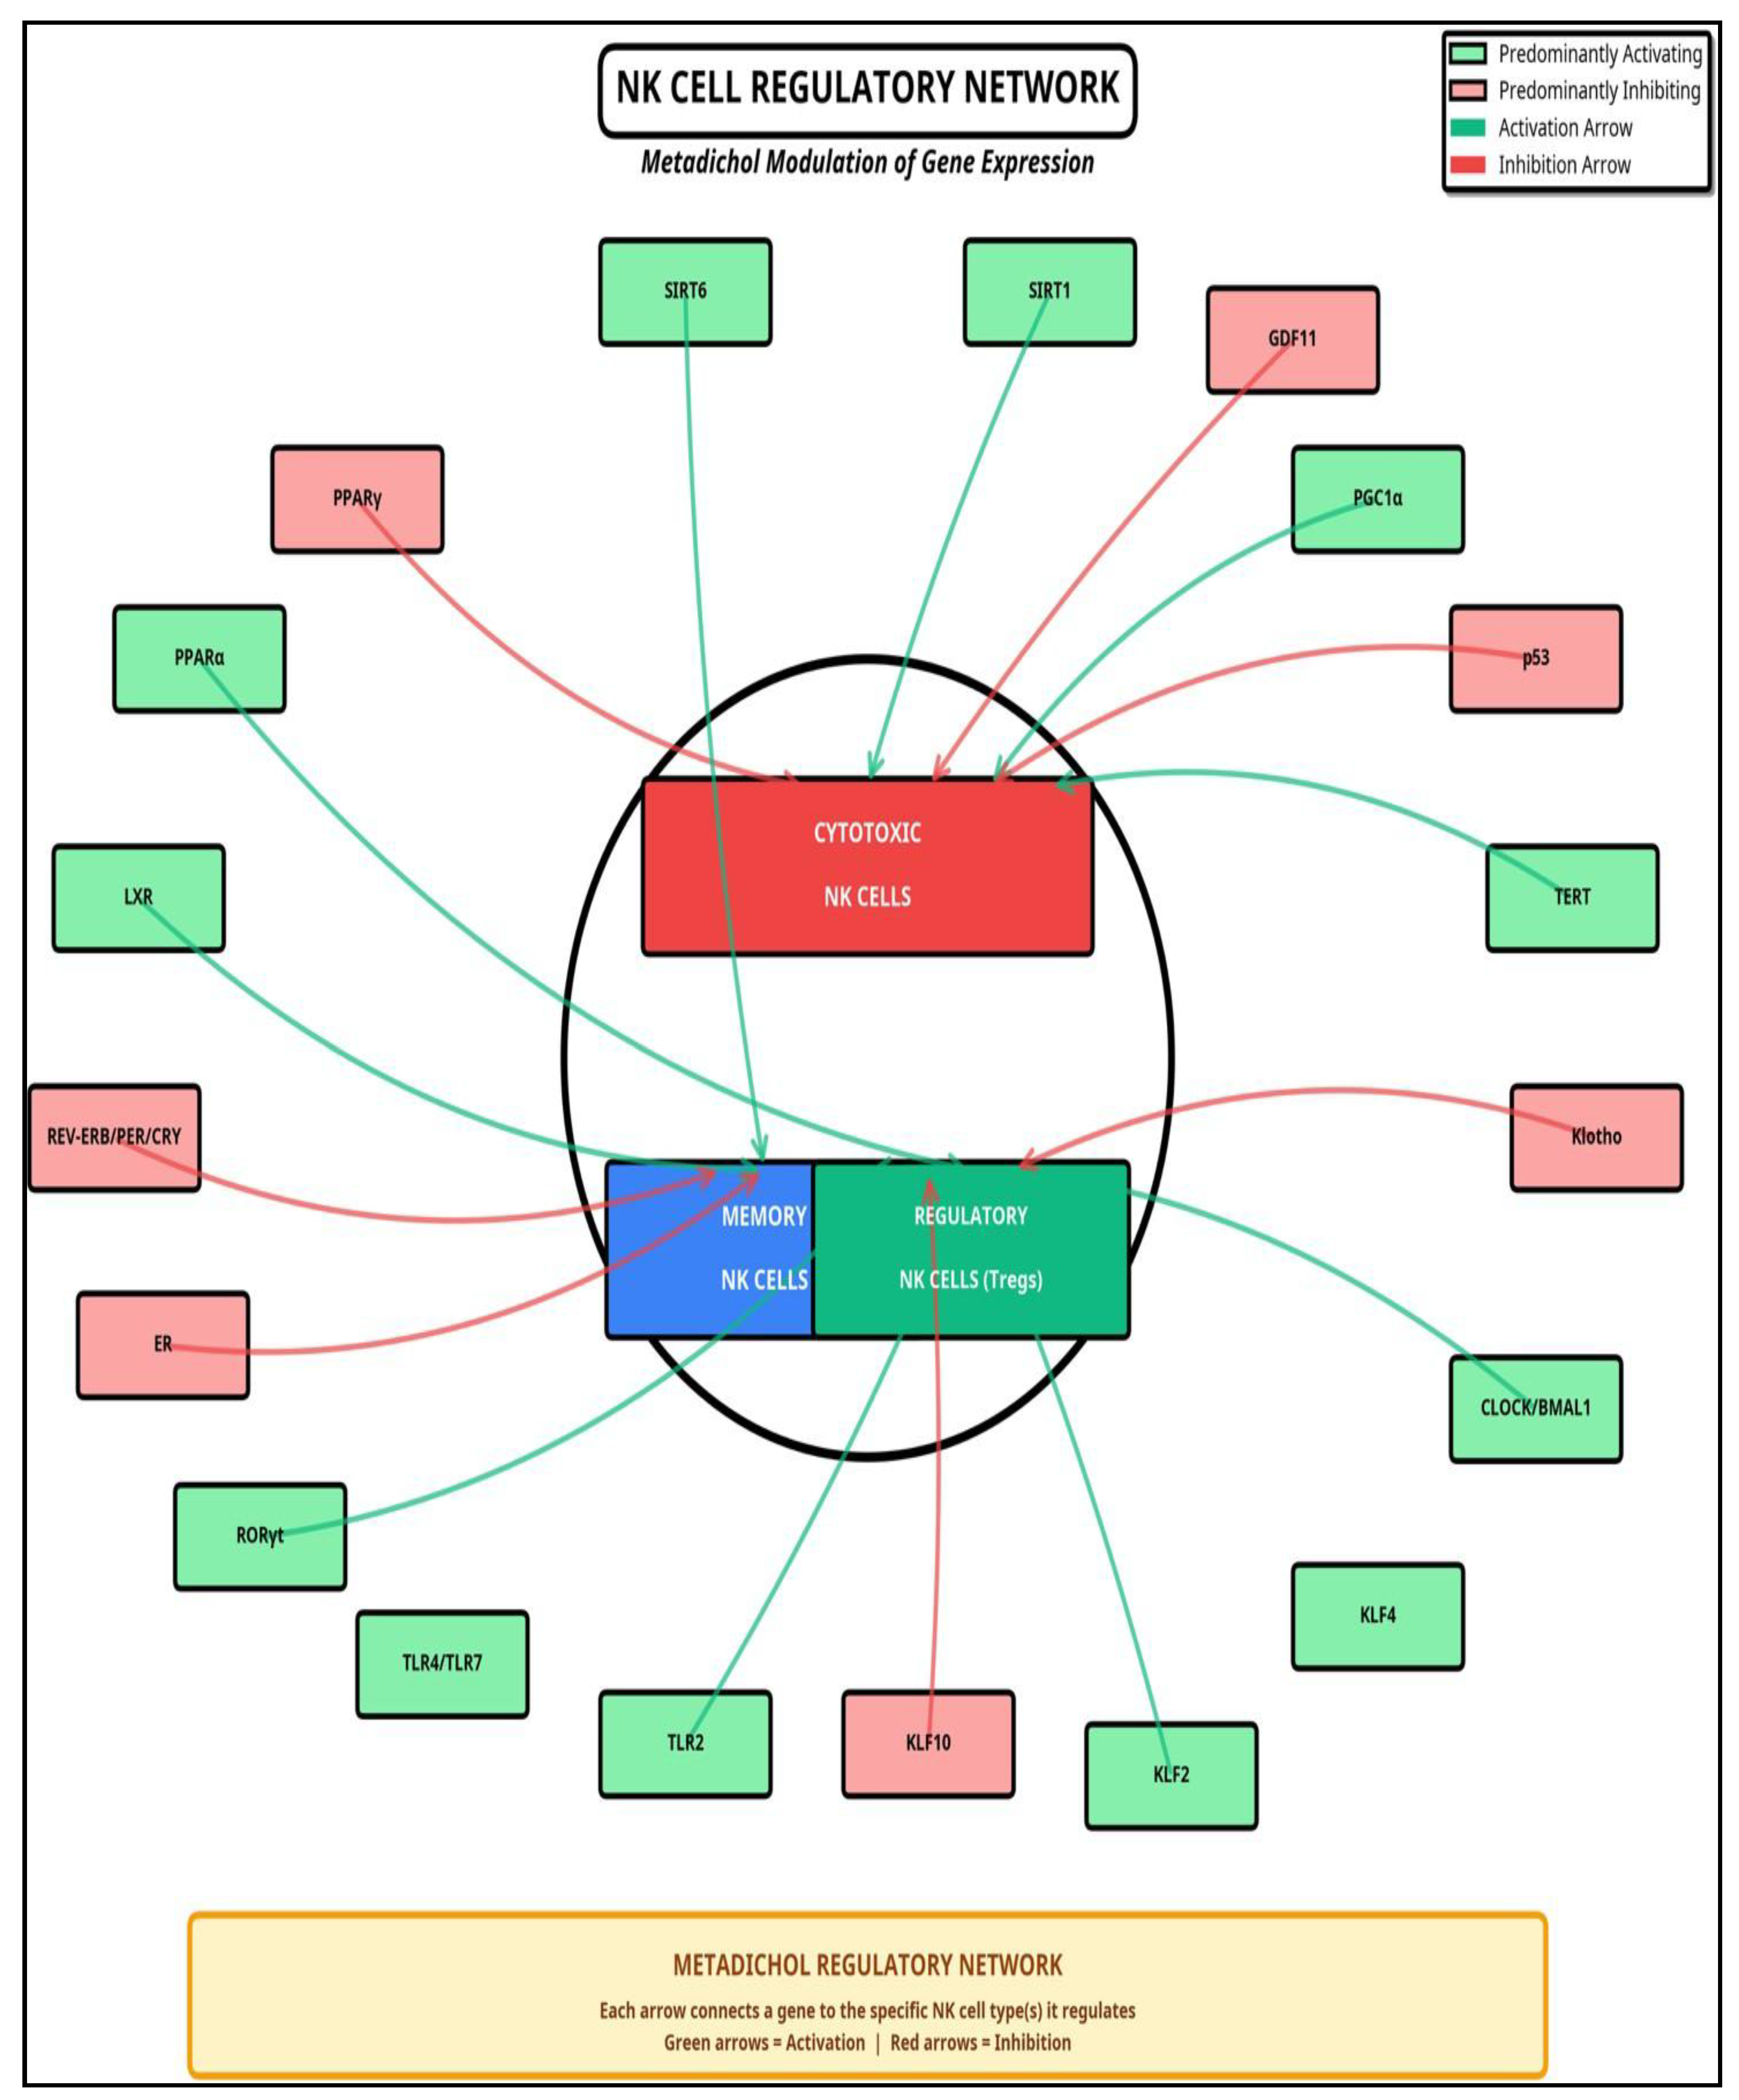
Metadichol's role as a central orchestrator of eight distinct immunoregulatory pathways Figure 13 that collectively govern T cell, B cell, and NK cell functions. Metadichol depicted as the yellow central hub simultaneously modulates multiple signaling cascades through a balanced combination of activation red arrows and inhibition green arrows mechanisms, demonstrating its unique multi-targeted approach to immune regulation. The activation pathways include the IL-2/STAT5 pathway FOXP3↑, p53↑ driving regulatory T cell Treg development. [4,5,23] The BCR/Plasma Cell pathway BLIMP1↑, PPARγ↑, p53↑ promoting antibody production in B cells [227,230], the p53 checkpoint pathway p53↑, p63↑ ensuring quality control across all lymphocyte populations [231,234], the PPARγ metabolic pathway PPARγ↑, PGC1α↑ providing metabolic support to all lymphocytes [235–238] and the tissue retention pathway CD69↑ facilitating T and NK cell residence in peripheral tissues [239–242]. Conversely, the inhibition pathways comprise the CD28 co-stimulation pathway CD80↓, CD86↓ fine-tuning B-T cell interactions [243–246], the TNF-R/CD27 pathway CD27↓ reducing co-stimulatory signals across B, T, and NK cells [247–250], and the IL-1/IL1R1 pathway PPARγ↑ → IL-1β↓, IL1R1↓ attenuating chronic inflammation in all lymphocyte populations. [251–254]
This comprehensive network architecture reveals Metadichol's capacity to simultaneously enhance anti-tumor immunity through Treg modulation and metabolic reprogramming while preventing excessive inflammation and maintaining immune homeostasis [255–259], thereby representing a systems-level approach to immunotherapy that transcends single-pathway interventions. [260–263] The coordinated regulation of these eight pathways underscores Metadichol's potential as a next-generation immunomodulatory agent capable of addressing the complex, multi-factorial nature of cancer and autoimmune diseases through orchestrated master regulator gene expression modulation..
Comparison with Other Small Molecules in Cancer Immunotherapy
Metadichol’s multi-targeted mechanism distinguishes it from other small molecules used in cancer immunotherapy:
Metformin: While metformin enhances T-cell metabolic fitness and potentiates PD-1 blockade by reducing tumor hypoxia [264], it primarily acts through AMPK activation and does not directly modulate nuclear receptors, sirtuins, or Klotho.
Resveratrol: Resveratrol activates SIRT1 and has anti-inflammatory effects [265], but it does not achieve the broad nuclear receptor activation and coordinated gene expression changes observed with Metadichol.
PPAR Agonists Thiazolidinediones: These drugs activate PPARγ and enhance T-cell FAO [266] but they do not simultaneously activate PGC1α, p53, sirtuins, and Klotho to the extent observed with Metadichol.
Vitamin D: Vitamin D activates the vitamin D receptor VDR, a nuclear receptor, and has immunomodulatory effects. [267]
Metadichol’s uniqueness
lies in its ability to simultaneously activate multiple nuclear receptors, leading to coordinated upregulation of metabolic regulators PPARγ, PGC1α, tumor suppressors p53, anti-aging proteins sirtuins, Klotho, and immune regulatory transcription factors FOX, KLF families. This multi-targeted approach may reduce the risk of resistance and enhance therapeutic efficacy compared to single-target agents.
Clinical Implications and Therapeutic Potential
The findings of this study suggest several potential clinical applications for Metadichol in cancer immunotherapy:
Adjuvant to Immune Checkpoint Blockade: The metabolic reprogramming induced by Metadichol could enhance responses to anti-PD-1/PD-L1 and anti-CTLA-4 therapies by improving T-cell fitness and reducing exhaustion. [268]
Overcoming Metabolic Barriers in the TME( tumor micro environment): The PPARγ-PGC1α-mediated enhancement of FAO and mitochondrial biogenesis could help T-cells overcome the nutrient-depleted, hypoxic conditions in tumors. [269]
Rebalancing Treg/Effector T-cell Ratios: The antagonistic regulation of CDS/FOXP3 could shift the immune balance away from suppression toward anti- tumor immunity. [270].
Low-Dose Efficacy: The observation that optimal gene expression changes occur at 1 pg/mL suggests that Metadichol may be effective at very low doses, potentially minimizing side effects.
Combination with CAR-T Cell Therapy: The metabolic reprogramming effects of Metadichol could enhance CAR-T cell persistence and function, as demonstrated by studies showing that PGC1α overexpression improves CAR-T cell efficacy. [271]
Summary and Conclusions: Metadichol as a Master Regulator of Immunity
Comprehensive Regulation of Innate and Adaptive Immunity
Metadichol demonstrates a unique and powerful ability to orchestrate a coordinated response across all three major lymphocyte lineages—T cells, B cells, and NK cells—by modulating a network of 36 master regulator genes. This represents a paradigm shift from single-pathway drugs to a multi- targeted, systems-level approach to immunotherapy.
T-Cell Modulation: Balancing Act for Optimal Immunity
Metadichol fine-tunes T-cell function by simultaneously enhancing the activity of cytotoxic and
helper Y cells while mounting a robust anti-tumor response while preventing autoimmunity Key modulations include upregulation of CD4 2.03-fold and CD8 2.15-fold, which enhances helper and cytotoxic T- cell function [23]. The upregulation of FOXP3 1.87-fold promotes the development and function of Tregs, the master regulators of immune tolerance. [272] Metabolic reprogramming through upregulation of PPARγ 24.25-fold and PGC1α 11.08-fold enhances T-cell metabolic fitness, allowing them to function effectively in the harsh tumor microenvironment.
B-Cell and NK-Cell Modulation: A Multi-Pronged Attack
Metadichol's influence extends beyond T cells to encompass B cells and NK cells, creating a comprehensive anti-tumor response. Upregulation of BLIMP1 and other key transcription factors promotes the differentiation of B cells into antibody-producing plasma cells, a critical component of the adaptive immune response. [273] Metadichol enhances the cytotoxic potential of NK cells, the frontline defenders of the innate immune system, by upregulating key activating receptors and metabolic regulators. [274]
Mechanism of Action: Nuclear Receptors as the Central Hub
Metadichol's pleiotropic effects are initiated through its interaction with nuclear receptors, which act as the central hub for its regulatory cascade. By activating nuclear receptors, Metadichol triggers a downstream signaling cascade that influences a wide range of transcription factor families, including sirtuins SIRT1-7, master regulators of metabolism, longevity, and inflammation [118,119,120,121,122,123,124,125,126,127,128]. Klotho [275–277], a key anti-aging and metabolic regulator; TLRs Toll-like receptors, key sensors of the innate immune system; and FOX, KLF, and circadian gene families, critical regulators of cell fate, development, and homeostasis. [119,120,121,122,123,124,125,126,127,128] This hierarchical mechanism, originating from nuclear receptors, allows Metadichol to exert a broad yet coordinated influence on the entire immune system, a feat not achievable by single-target drugs.
Beyond a Single Pathway
The 2025 Nobel Prize in Physiology or Medicine was awarded to Mary Brunkow, Fred Ramsdell, and Shimon Sakaguchi for their groundbreaking discoveries concerning peripheral immune tolerance through regulatory T cells and the FOXP3 gene [1,2,3]. Their work established that a specific subset of T cells, characterized by CD4 and CD25 expression and controlled by the transcription factor FOXP3, acts as "security guards" to prevent immune attacks against self-tissues.
Metadichol's mechanism represents a significant advancement beyond this paradigm. While the Nobel- winning work focused on the critical role of FOXP3, Metadichol not only upregulates FOXP3 but also modulates the entire family of FOX transcription factors FOXP3, FOXJ1, and FOXM1 and a host of other master regulators. [278] This demonstrates that Metadichol's approach to immune regulation is not Figure 14 limited to a single pathway but is a comprehensive, multi-pronged strategy that orchestrates a harmonious response across the entire immune system. This unique ability to modulate a whole family of critical transcription factors, rather than just one, is what makes Metadichol a truly unique and powerful immunomodulatory agent.
Uniqueness and Therapeutic Potential in Cancer and Immune-Related Diseases.
Metadichol's multi-targeted, systems-level approach to immune regulation makes it a uniquely promising therapeutic agent for a wide range of diseases, particularly cancer and autoimmune disorders in cancer, Metadichol offers a powerful new strategy for cancer immunotherapy by simultaneously enhancing the function of cytotoxic T cells and NK cells, promoting antibody production by B cells, and rebalancing the immune system to favor anti-tumor responses The dramatic upregulation of tumor suppressor p53 9.61-fold further enhances its anti-cancer potential. [279] Its ability to overcome the metabolic barriers in the tumor microenvironment through PPARγ-PGC1α-mediated enhancement of fatty acid oxidation and mitochondrial biogenesis makes it an ideal candidate for combination therapies with checkpoint inhibitors and CAR-T cells [280] in autoimmune diseases by promoting the function of Tregs and re-establishing immune tolerance. Based on what has been present, we can visualize a pathway of how Metadichol acting through the nuclear receptors and affecting T, B and NK cells can enhance anti-cancer immunity.(Figure 14)
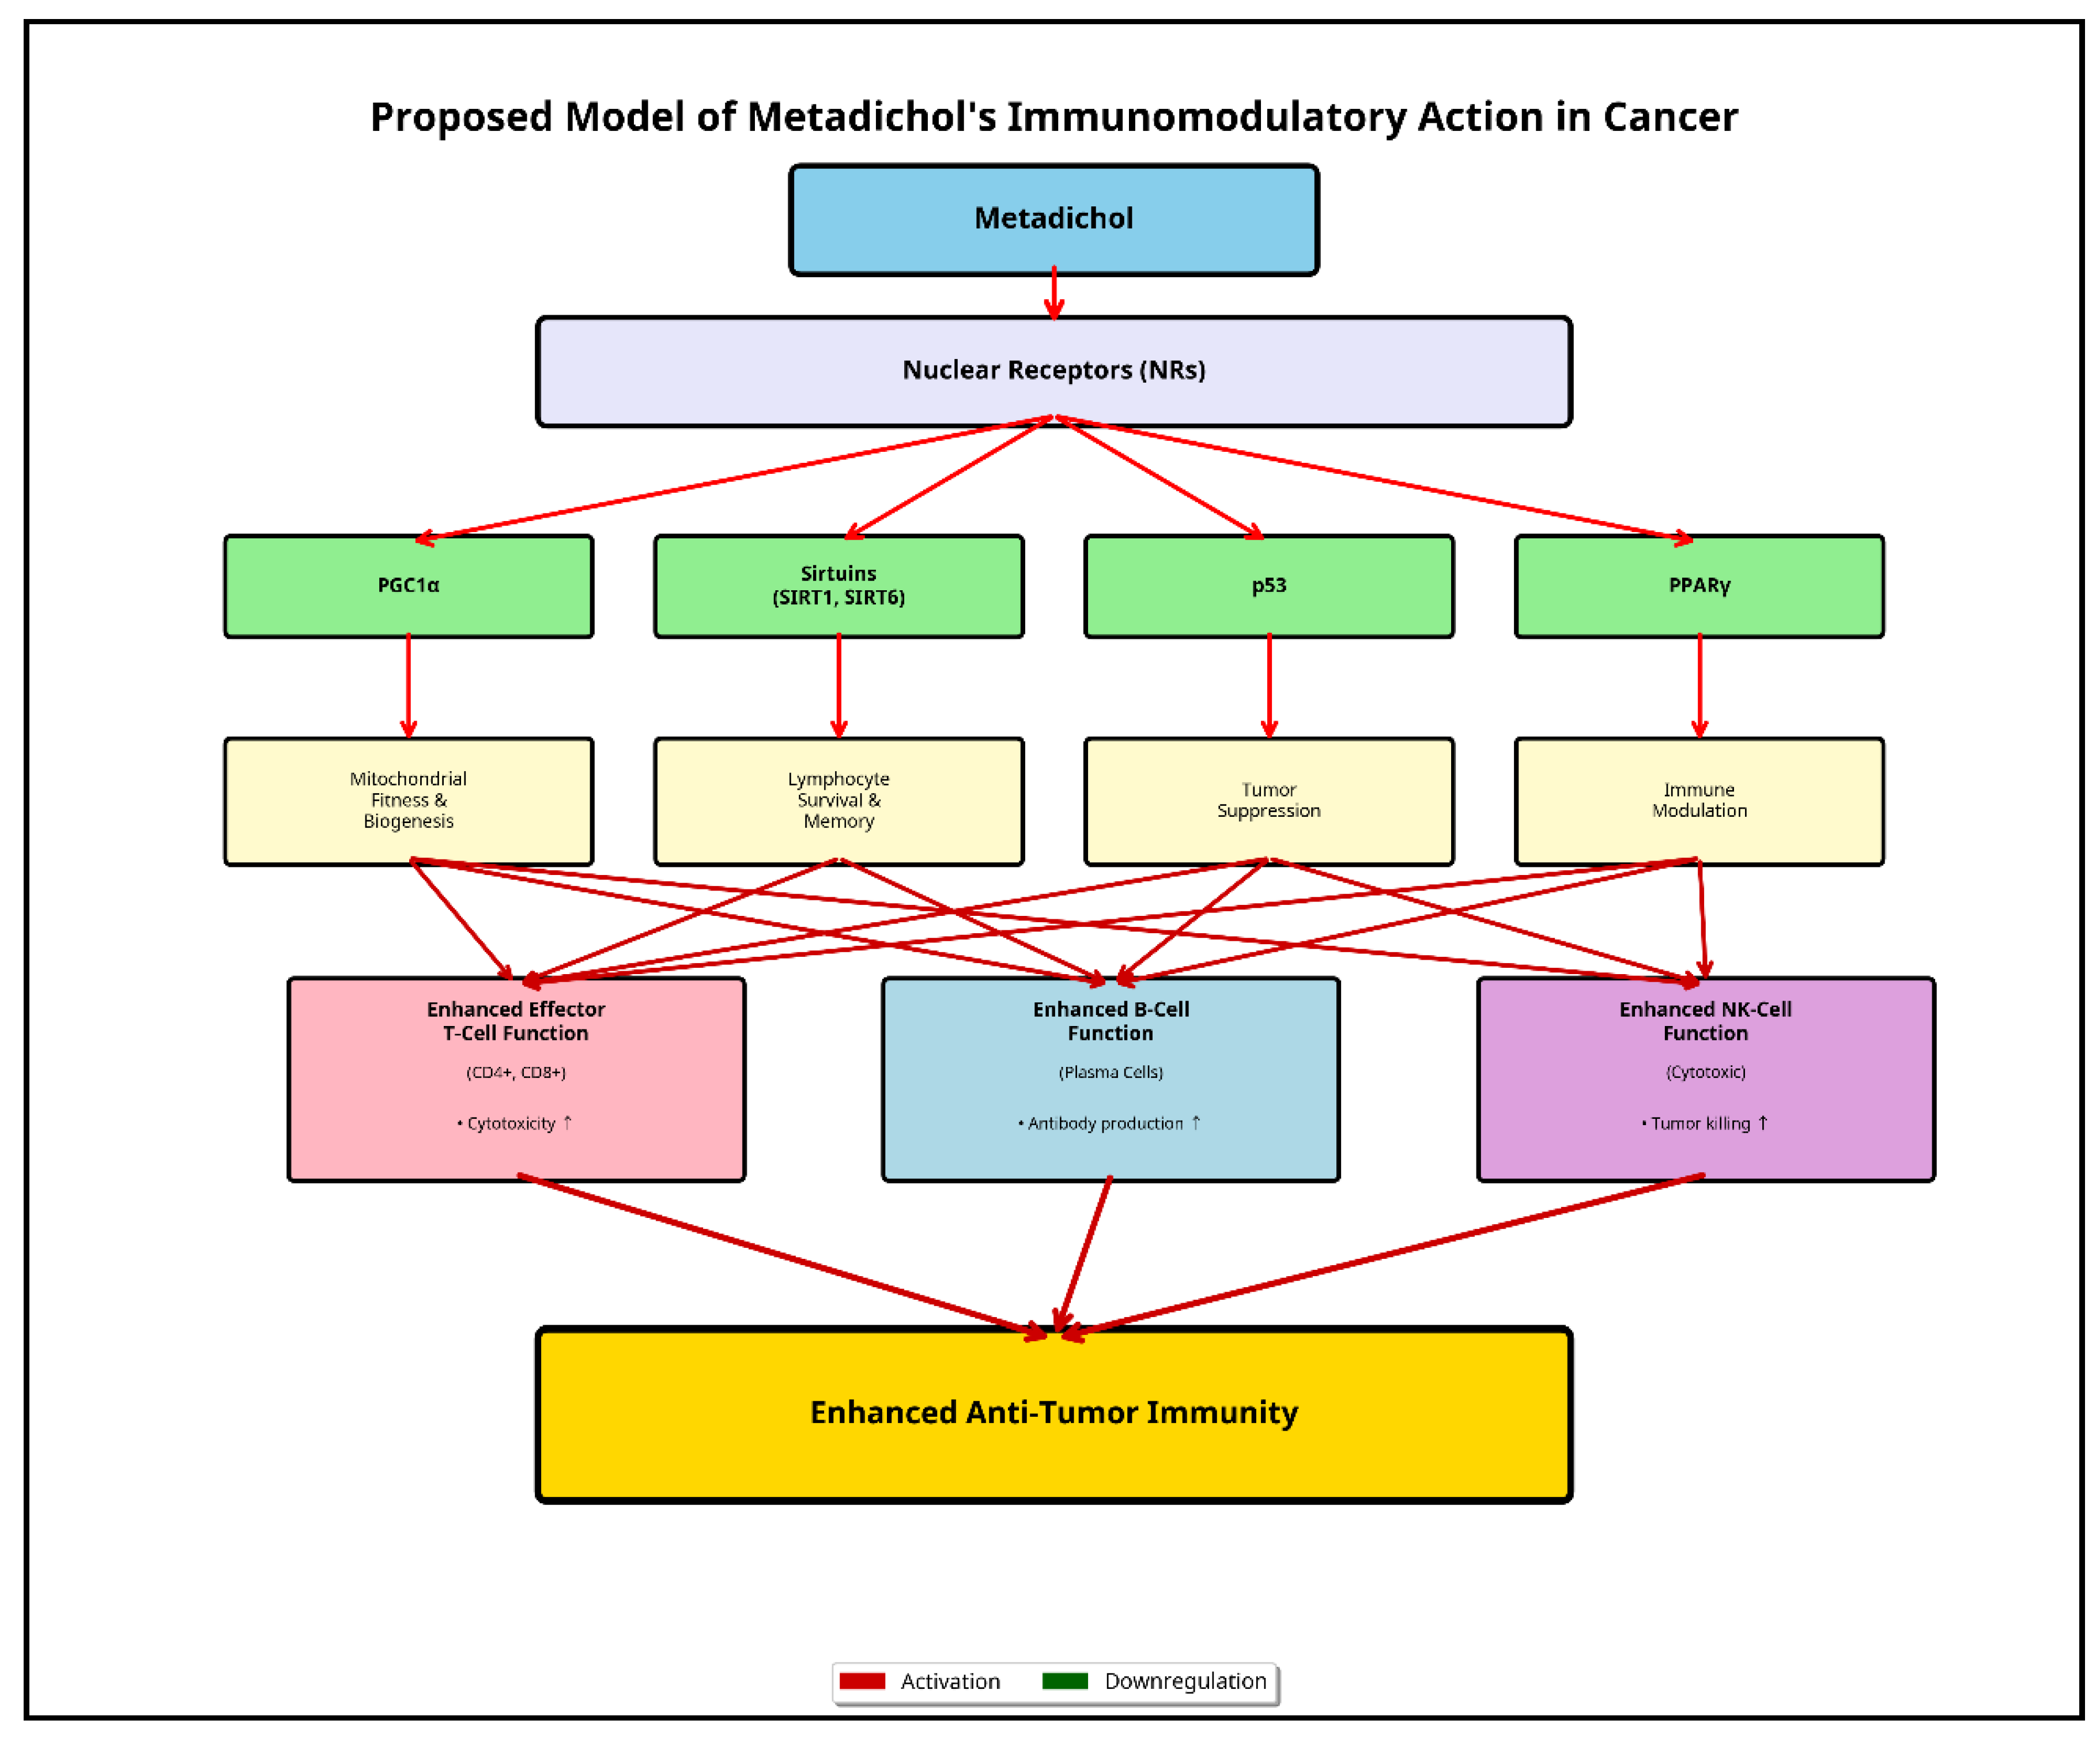
Figure 14.
Additional Mechanisms and Safety Profile
Beyond its core immunomodulatory effects, Metadichol exhibits several other critical properties that enhance its therapeutic profile. Metadichol is remarkably non-toxic, with an LD50 of 5000 mg/kg. [281,282] This high safety margin is a significant advantage for a therapeutic agent intended for chronic use in a wide range of diseases.
Metadichol also regulates the mTOR pathway, [128] a central controller of cell growth, proliferation, and metabolism. Dysregulation of the mTOR pathway is implicated in numerous diseases, including cancer and metabolic disorders. By modulating this pathway, Metadichol adds another layer to its multi-targeted therapeutic strategy.
Metadichol has been shown to increase the expression of CD14 in stem cells. [283] CD14 is a key marker involved in the innate immune response and may play a role in stem cell differentiation and function. This finding suggests that Metadichol's regenerative and immunomodulatory effects may extend to the level of stem cell biology, further highlighting its unique and pervasive mechanism of action.
Conclusions
Metadichol stands out as a first-in-class, pleiotropic immunomodulator that orchestrates wide-ranging transcriptional changes across master regulator genes governing T, B, and NK cell fates, metabolism, and tumor suppression. The study demonstrates that Metadichol elicits potent dose-dependent upregulation of critical metabolic PPAR, PGC1 and tumor suppressor p53 programs, while reshaping immune balance through antagonistic crosstalk between effector CD4, CD8 and suppressor FOXP3, CD25 pathways within human PBMC and fibroblast systems.
At the systems biology level, Metadichol’s ability to activate multiple nuclear receptor cascades, sirtuin networks, Klotho, and Toll-like receptors TLRs represents a profound advance over single-pathway interventions. These data support a model where Metadichol engages and synchronizes multiple chromatin domains and enhancer-promoter loops, likely promoting stable epigenetic remodeling, increased mitochondrial biogenesis, and enhanced metabolic resilience in immune subsets. Such coordination not only improves immune fitness under stress e.g., hypoxic tumor microenvironment but also supports anti-tumor immunity and reduces the immunosuppressive effects of regulatory T-cell accrual.
Moreover, Metadichol’s capacity for selective, cell-type-specific gene modulation—highlighted by its ability to upregulate stem cell and anti-aging markers like CD14 and Klotho and downregulate inflammation and cancer-related TLR pathways—suggests utility far beyond oncology, encompassing regenerative and age-related diseases. Its favorable safety profile nontoxic up to 5000 mg/kg in preclinical models and documented efficacy in antiviral, anti-inflammatory, and disease-modifying contexts further underscore its translational promise, especially as an adjunct or synergistic partner to established checkpoint inhibitors, CAR-T and stem cell technologies.
Clinically, these results argue for a paradigm shift in immunotherapy drug development, prioritizing agents that can globally reprogram immune and metabolic networks while preserving safety and reducing off-target effects. Metadichol not only fills this gap but raises new standards for multi-targeted approaches capable of producing robust, durable therapeutic responses in cancer, immune, infectious, and degenerative diseases.
In summary, Metadichol establishes itself as a versatile master regulator of immune, metabolic, and transcriptional landscapes. Its integrated, hierarchical gene network control, broad-spectrum cell lineage impact, and unprecedented systems-level modulation position it as a cornerstone molecule for 21st-century immunopharmacology, with the potential to transform practice across disciplines—from cancer to regenerative medicine, to healthy aging.
Supplementary
File name: Raw data; q-RT-PCR-analysis of 36 master regulatory genes. Excel spread sheet of gene fold expression changes.
Conflicts of Interest
The author is the founder of Nanorx Inc. and is a major shareholder in the company. This study was conducted independently by an external laboratory on commercial terms to eliminate bias in our results.
| Glossary of Abbreviations | ||||
| CD3G | CD3 gamma subunit of T-cell receptor complex | FOXJ1 | forkhead box J1 | |
| CD4 | CD4 molecule | TFEB | transcription factor EB | |
| CD7 | CD7 molecule | Myc | MYC proto-oncogene, bHLH transcription factor | |
| CD25 | Interleukin 2 receptor subunit alpha | p53 | tumor protein p53 | |
| CD27 | CD27 molecule | p63 | tumor protein p63 | |
| CD28 | CD28 molecule | SIM1 | SIM bHLH transcription factor 1 | |
| CD31 | platelet and endothelial cell adhesion molecule 1 | FOXM1 | forkhead box M1 | |
| CD45 | PTPRC protein tyrosine phosphatase receptor type C | CTCF | CCCTC-binding factor | |
| CD58 | CD58 molecule | MITF | melanocyte inducing transcription factor | |
| CD86 | CD 86 molecule | HIF1 | hypoxia inducible factor 1 subunit alpha | |
| CD69 | CD69 molecule | MYOD1 | myogenic differentiation 1 | |
| CD8 | CD8 subunit alpha | PPARg | Pperoxisome proliferator activated receptor gamma | |
| CD80 | CD80 molecule | Nrf2 | NFE2 like bZIP transcription factor 2 | |
| CD2 | CD2 molecule | KL | Klotho | |
| VEGF | vascular endothelial growth factor A | PD1 | Programed cell death i | |
| TAL1 | TAL bHLH transcription factor 1, erythroid differentiation factor | PDL1 | Programmed death-ligand 1 | |
| BLIMP1 | PRDM1 PR/SET domain 1 | CTLA | Cytotoxic T-lymphocyte associated protein 4, also known as CD152 | |
| FOXP3 | forkhead box P3 | KLF | Krüppel-like family of transcription factors | |
| PU.1 | SPI1 Spi-1 proto-oncogene | Tert | Telomerase reverse Transcriptase | |
| OCT4 | POU5F1 POU class 5 homeobox 1 | GCM1 | glial cells missing transcription factor 1 | |
| PROX1 | Prospero homeobox 1 | PGC1a | PPARG coactivator 1 alpha | |
References
- Sakaguchi S, Sakaguchi N, Asano M, Itoh M, Toda M. Immunologic self-tolerance maintained by activated T cells expressing IL-2 receptor alpha-chains CD25. Breakdown of a single mechanism of self-tolerance causes various autoimmune diseases. J Immunol. 1995;155(3):1151-1164. [CrossRef]
- Brunkow ME, Jeffery EW, Hjerrild KA, et al. Disruption of a new forkhead/winged-helix protein, scurfin, results in the fatal lymphoproliferative disorder of the scurfy mouse. Nat Genet. 2001;27(1):68- 73. [CrossRef]
- Ramsdell F, Ziegler SF. FOXP3 and scurfy: how it all began. Nat Rev Immunol. 2014;14(5):343-349. [CrossRef]
- Sakaguchi S, Yamaguchi T, Nomura T, Ono M. Regulatory T cells and immune tolerance. Cell. 2008;133(5):775-787. [CrossRef]
- Fontenot JD, Gavin MA, Rudensky AY. Foxp3 programs the development and function of CD4+CD25+ regulatory T cells. Nat Immunol. 2003;4(4):330-336. [CrossRef]
- Burzyn D, Kuswanto W, Kolodin D, et al. A special population of regulatory T cells potentiates muscle repair. Cell. 2013;155(6):1282-1295. [CrossRef]
- Mathis D, Benoist C. Microbiota and autoimmune disease: the hosted self. Cell Host Microbe. 2011;10(4):297-301. [CrossRef]
- Belkaid Y, Harrison OJ. Homeostatic immunity and the microbiota. Immunity. 2017;46(4):562-576. [CrossRef]
- Bluestone JA, Tang Q. Treg cells-the next frontier of cell therapy. Science. 2018;362(6411):154-155. [CrossRef]
- Sharabi A, Tsokos MG, Ding Y, Malek TR, Klatzmann D, Tsokos GC. Regulatory T cells in the treatment of disease. Nat Rev Drug Discov. 2018;17(11):823-844. [CrossRef]
- Sung H, Ferlay J, Siegel RL, et al. Global Cancer Statistics. [CrossRef]
- 2020. GLOBOCAN Estimates of Incidence and Mortality Worldwide for 36 Cancers in 185 Countries. CA Cancer J Clin. 2021;71(3):209-249.
- Sharma P, Hu-Lieskovan S, Wargo JA, Ribas A. Primary, Adaptive, and Acquired Resistance to Cancer Immunotherapy. Cell. 2017;168(4):707-723. [CrossRef]
- Ribas A, Wolchok JD. Cancer immunotherapy using checkpoint blockade. Science. 2018;359(6382):1350-1355. [CrossRef]
- Munn DH, Bronte V. Immune suppressive mechanisms in the tumor microenvironment. Curr Opin Immunol. 2016;39:1-6. [CrossRef]
- Ikeda H, Togashi Y. Immune evasion through mitochondrial transfer in the tumor microenvironment. Nature. 2025;638:182-190. [CrossRef]
- Klein K, He K, Younes AI, et al. Role of Mitochondria in Cancer Immune Evasion and Potential Therapeutic Approaches. Front Immunol. 2020;11:573326. [CrossRef]
- Tanaka A, Sakaguchi S. Regulatory T cells in cancer immunotherapy. Cell Res. 2017;27(1):109- 118. [CrossRef]
- Tanaka A, Sakaguchi S. Targeting Treg cells in cancer immunotherapy. Eur J Immunol. 2019;498:1140-1146. [CrossRef]
- Bahrambeigi S, Molaparast M, Sohrabi F, et al. Targeting PPAR ligands as possible approaches for metabolic reprogramming of T cells in cancer immunotherapy. Immunol Lett. 2020;219:12- 22. [CrossRef]
- Cheng HS, Tan WR, Low ZS, et al. PPARs and Tumor Microenvironment: The Emerging Roles of the Metabolic Master Regulators in Tumor Stromal-Epithelial Crosstalk and Carcinogenesis. Cancers Basel. 2021;13(9):2153. [CrossRef]
- Chowdhury PS, Chamoto K, Kumar A, Honjo T. PPAR-Induced Fatty Acid Oxidation in T Cells Increases the Number of Tumor-Reactive CDS+ T Cells and Facilitates Anti- PD-1 Therapy. Cancer Immunol Res. 201S;6(11):1375-13S7. [CrossRef]
- Dumauthioz N, Tschumi B, Wenes M, et al. Enforced PGC-1α expression promotes CDS T cell fitness, memory formation and antitumor immunity. Cell Mol Immunol. 2021;18(7):1761-1771. [CrossRef]
- Hori S, Nomura T, Sakaguchi S. Control of regulatory T cell development by the transcription factor Foxp3. Science. 2003;2995609:1057-1061. [CrossRef]
- Wang Y, Huang Y, Guan F, et al. From metabolism to malignancy: the multifaceted role of PGC1α in cancer. Front Oncol. 2024;14:13S3S09. [CrossRef]
- Binder C, Cvetkovski F, Sellberg F, et al. CD2 Immunobiology. Front Immunol. 2020;11:1090. [CrossRef]
- Li B, Wang X, Hsu C, et al. Cis interactions between CD2 and its ligands on T cells are required for T cell activation. Sci Immunol. 2022;7(74):eabn6373. [CrossRef]
- Moingeon P, Chang HC, Wallner BP, Stebbins C, Frey AZ, Reinherz EL. CD2-mediated adhesion facilitates T lymphocyte antigen recognition. Nature. 1989;339339(6225):544-547. [CrossRef]
- Van der Merwe PA, Barclay AN, Mason DW, Davies EA, Morgan BP, Tonegawa S. Topology of the CD2-CD48 cell-adhesion molecule complex: implications for antigen recognition by T cells. Curr Biol. 1995;5(1):74-84. [CrossRef]
- Killeen N, Stuart SG, Littman DR. Development and function of T cells in mice with a disrupted CD2 gene. EMBO J. 1992;11(12):4329-4336. [CrossRef]
- Rowe JH, Stadinski BD, Henderson LA, et al. Patients with CD3G mutations reveal a role for human CD3γ in Treg diversity and suppressive function. Blood. 2018;131(21):2335-2345. [CrossRef]
- Torres PS, Zapata DA, Pacheco-Castro A, et al. Contribution of CD3γ to TCR regulation and signaling in human mature T lymphocytes. Int Immunol. 2002;14(11):1357-1363. [CrossRef]
- Menon AP, Lizee G, Hwu P. Modulating T Cell Responses by Targeting CD3. Cancers Basel. 2023;15(4):1189. [CrossRef]
- Xin W, Li Y, Wu J, et al. Structures of human γδ T cell receptor--CD3 complex. Nature. 2024;630(8015):222-230. [CrossRef]
- National Center for Biotechnology Information. Gene: CD3G CD3 gamma subunit of T-cell receptor complex. Updated September 9, 2025. Accessed November 2, 2025. https://[www.ncbi.nlm.nih.gov/gene/917].
- Janeway CA Jr. The co-receptor function of CD4. Semin Immunol. 1991;3(3):153-160.
- Rushdi MN, Sethi A, Grewal R, et al. Cooperative binding of T cell receptor and CD4 to peptide-MHC class II complex. Nat Commun. 2022;13(1):6466.
- Mørch AM, Pedersen SF, Holst PJ. Coreceptors and TCR Signaling - the Strong and the Weak of It. Front Cell Dev Biol. 2020;8:597627.
- Swain SL, McKinstry KK, Strutt TM. Expanding roles for CD4+ T cells in immunity to viruses. Nat Rev Immunol. 2012;12(2):136-148. [CrossRef]
- Kitchen SG, Jones-Trower A, Zack JA. The CD4 molecule on CD8+ T lymphocytes directly enhances the immune response to viral immunogen. Proc Natl Acad Sci U S A. 2005;1024(4):15962-15967.
- Sempowski GD, Haynes BF. Structure and function of the CD7 molecule. Immunol Res. 1999;20(2):115-123. [CrossRef]
- Bárcena A, Muench MO, Galy AH, Chen X, Tórre-Cisneros J, Khavari P. CD7 expression in the early stages of T- and myeloid-cell development. Clin Immunol Immunopathol. 1993;68(2):123-132.
- Aandahl EM, Quigley MF, Moretto WJ, Nixon DF, Våbenø J. CD7 is a differentiation marker that.
- Hao QL, Zhu J, Price MA, et al. Human intrathymic lineage commitment is marked by differential CD7 expression: identification of CD7- lympho-myeloid thymic progenitors. Blood. 2008;111(3):1318- 1326. [CrossRef]
- Liu J, Zhou Y, Jiang W, et al. Targeted CD7 CAR T-cells for treatment of T-Lymphocyte Malignancies. Front Immunol. 2023;14:1170968.
- Raskov H, Orhan A, Gaggar S, Gögenur I. Cytotoxic CD8+ T cells in cancer and cancer immunotherapy. Br J Cancer. 2021;124(2):359-367. [CrossRef]
- Daniels MA, Devine L, Miller JD, et al. CD8 binding to MHC class I molecules is influenced by T cell maturation and glycosylation. Immunity. 2001;15(6):1051-1061. [CrossRef]
- Srinivasan S, Purbhoo MA, Tsuchida CA, et al. Structure, function, and immunomodulation of the CD8 co-receptor. Front Immunol. 2024;15:1412513.
- Zhang N, Bevan MJ. CD8+ T cells: foot soldiers of the immune system. Immunity. 2011;35(2):161- 168. [CrossRef]
- Koh CH, Pua CJ, Lee J, et al. CD8 T-cell subsets: heterogeneity, functions, and therapeutic potential. Exp Mol Med. 2023;55(11):2287-2299.
- Rolink A, Grawunder U, Winkler TH, Karasuyama H, Melchers F. IL-2 receptor alpha chain CD25, TAC expression defines a crucial stage in pre-B cell development. Int Immunol. 1994;68:1257-1264. [CrossRef]
- Shatrova AN, Misyurin VA, Misyurin AV, et al. Time-Dependent Regulation of IL-2R α-Chain CD25 Expression by TCR Signal Strength and IL-2-Induced STAT5 Signaling in Activated Human Blood T Lymphocytes. PLoS One. 2016;11(12):e0167215.
- Létourneau S, van Leeuwen PA, Krieg C, et al. IL-2- and CD25-dependent immunoregulatory mechanisms in the homeostasis of T-cell subsets. J Allergy Clin Immunol. 2009;1234:758-762. [CrossRef]
- Roifman, CM. Human IL-2 receptor α chain deficiency. Pediatr Res. 2000;481:6-11. [CrossRef]
- Caudy AA, Reddy ST, Chatila T, Atkinson JP, Verbsky JW. CD25 deficiency causes an immune dysregulation, polyendocrinopathy, enteropathy, X-linked-like syndrome, and defective IL-10 expression from CD4 lymphocytes. J Allergy Clin Immunol. 2007;1192:482-487. [CrossRef]
- Watts TH, Yeung KKM, Yu T, Lee S. TNF/TNFR Superfamily Members in Costimulation of T Cell Responses---Revisited. Annu Rev Immunol. 2025;43. [CrossRef]
- Watts, TH. TNF/TNFR family members in costimulation of T cell responses. Annu Rev Immunol. 2005;23:23-68. [CrossRef]
- Starzer AM, Berghoff AS. New emerging targets in cancer immunotherapy: CD27 TNFRSF7. ESMO Open. 2019;4Suppl 3:e000629. [CrossRef]
- Hendriks J, Xiao Y, Borst J. CD27 promotes survival of activated T cells and complements CD28 in generation and establishment of the effector T cell pool. J Exp Med. 2003;1989:1369-1380. [CrossRef]
- Jaeger-Ruckstuhl CA, Jäeger R, Zurbuchen Y, et al. Signaling via a CD27-TRAF2-SHP-1 axis during naive T cell priming regulates memory CD8+ T cell differentiation. Immunity. 2024;572:283-299.e9.
- Esensten JH, Helou YA, Chopra G, Weiss A, Bluestone JA. CD28 costimulation: from mechanism to therapy. Immunity. 2016;445:973-988.
- Beyersdorf N, Hanke T. CD28 co-stimulation in T-cell homeostasis: a recent perspective. Immunotargets Ther. 2015;4:111-122.
- Porciello N, Tuosto L. CD28 costimulatory signals in T lymphocyte activation: Emerging functions and implications for cancer immunotherapy. Semin Immunol. 2016;281:3-11.
- Schildberg FA, Klein SR, Freeman GJ, Sharpe AH. Coinhibitory pathways in the B7-CD28 ligand- receptor family. Immunity. 2016;445:955-972.
- Diehn M, Alizadeh AA, Rando OJ, et al. Genomic expression programs and the integration of the CD28 costimulatory signal in T cell activation. Proc Natl Acad Sci U S A. 2002;9918:11796-11801. [CrossRef]
- Lertkiatmongkol P, Liao D, Mei H, Hu Y, Newman PJ. Endothelial functions of PECAM-1 CD31. Vascul Pharmacol. 2016;87:3-9.
- Woodfin A, Voisin MB, Nourshargh S. PECAM-1: A Multi-Functional Molecule in Inflammation and Vascular Biology. Arterioscler Thromb Vasc Biol. 2007;2712:2514-2523. [CrossRef]
- Ma L, Mauro C, Marelli-Berg FM. CD31 Exhibits Multiple Roles in Regulating T Lymphocyte Trafficking In Vivo. J Immunol. 2012;1899:4104-4111. [CrossRef]
- DeLisser HM, Baldwin HS, Albelda SM. Platelet endothelial cell adhesion molecule 1 PECAM- 1/CD31: a multifunctional vascular cell adhesion molecule. Trends Cardiovasc Med. 1997;76:203- 210. [CrossRef]
- Caligiuri, G. CD31 as a Therapeutic Target in Atherosclerosis. Circ Res. 2020;1269:1178-1189. [CrossRef]
- Trowbridge IS, Thomas ML. CD45: an emerging role as a protein tyrosine phosphatase required for lymphocyte activation and development. Annu Rev Immunol. 1994;12:85-116. [CrossRef]
- Al Barashdi MA, Vallance TM, Al-Zakwani I, Bailey K, Majid S. Protein tyrosine phosphatase receptor type C PTPRC or CD45. J Clin Pathol. 2021;749:548-552.
- Charbonneau H, Tonks NK, Walsh KA, Fischer EH. The leukocyte common antigen CD45: a putative receptor-linked protein tyrosine phosphatase. Proc Natl Acad Sci U S A. 1988;8519:7182-7186. [CrossRef]
- Tonks NK, Charbonneau H, Diltz CD, Fischer EH, Walsh KA. Demonstration that the leukocyte common antigen CD45 is a protein tyrosine phosphatase. Biochemistry. 1988;2724:8695-8701. [CrossRef]
- Courtney AH, Shvets E, Lu W, et al. CD45 functions as a signaling gatekeeper in T cells. Sci Signal. 2019;12604:eaaw8151. [CrossRef]
- Dustin ML, Olszowy MW, Holdorf AD, et al. Low affinity interaction of human or rat cell adhesion molecule CD2 with its ligand aligns adhering membranes to achieve high physiological affinity. J Biol Chem. 1997;27249:30889-30898.
- Ikemizu S, Sparks MA, van der Merwe PA, Jones EY, Stuart DI. Crystal structure of the CD2-binding domain of CD58 lymphocyte function-associated antigen 3 at 1.8-Å resolution. Proc Natl Acad Sci U S A. 1999;968:4289-4294.
- National Center for Biotechnology Information. Gene: CD58 CD58 molecule. Updated August 19, 2025. Accessed November 2, 2025. https://[www.ncbi.nlm.nih.gov/gene/965].
- Cibrián D, Sánchez-Madrid F. CD69: from activation marker to metabolic gatekeeper. Eur J Immunol. 2017;476:946-953. [CrossRef]
- Ziegler SF, Ramsdell F, Hjerrild KA, et al. The activation antigen CD69. Stem Cells. 1994;125:456- 465. [CrossRef]
- Sancho D, Gómez M, Sánchez-Madrid F. CD69 is an immunoregulatory molecule induced following activation. Trends Immunol. 2005;263:136-140. [CrossRef]
- Yu L, Wang Y, Yang J, et al. CD69 enhances immunosuppressive function of regulatory T-cells and attenuates colitis by prompting IL-10 production. Cell Death Dis. 2018;99:905.
- Marzio R, Mauël J, Corradin SB. CD69 and regulation of the immune function. Immunopharmacol Immunotoxicol. 1999;213:565-582.
- Satoh J, Lee HC, Kim SU, et al. T-cell costimulatory molecules B7-1 CD80 and B7-2 CD86 in the NOD mouse. Diabetes. 1995;4410:1156-1162.
- Butte MJ, Keir ME, Phamduy TB, Sharpe AH, Freeman GJ. Programmed death-1 ligand 1 interacts specifically with the B7-1 costimulatory molecule to inhibit T cell responses. Immunity.2007:27(1):111-122. [CrossRef]
- Ransom, DM. CD28, CTLA-4 and their ligands: who does what and to whom? Immunology. 2000;1012:169-177.
- Collins M, Ling V, Carreno BM. The B7 family of immune-regulatory ligands. Genome Biol. 2005;66:223. [CrossRef]
- Linsley PS, Peach R, Gladstone P, Bajorath J. Extending the B7 CD80 gene family. Protein Sci. 1994;38:1341-1343. [CrossRef]
- Vasilevko V, Ghochikyan A, Holterman MJ, Agadjanyan MG. CD80 B7-1 and 9B7-2 are functionally equivalent in the initiation and maintenance of CD4+ T-cell proliferation after activation with suboptimal doses of PHA. DNA Cell Biol. 2002;213:137-149. [CrossRef]
- Jeannin P, Magistrelli G, Aubry JP, et al. Soluble CD86 is a costimulatory molecule for human T lymphocytes. Immunity. 2000;13(3):303-312. [CrossRef]
- Kennedy A, Waters E, Rowshanravan B, et al. Differences in CD80 and CD86 transendocytosis reveal CD86 as a key target for CTLA-4 immune regulation. Nat Immunol. 2022;239:1365-1378. [CrossRef]
- Halliday N, Williams C, Kennedy A, et al. CD86 is a selective CD28 ligand supporting FoxP3+ regulatory T cell homeostasis in the presence of high levels of CTLA-4. Front Immunol. 2020;11:600000. [CrossRef]
- National Center for Biotechnology Information. Gene: CD86 CD86 molecule. Updated September 5, 2025. Accessed November 2, 2025. https://[www.ncbi.nlm.nih.gov/gene/942.].
- Ahmadian M, Suh JM, Hah N, et al. PPARγ signaling and metabolism: the good, the bad and the future. Nat Med. 2013;195:557-566. [CrossRef]
- Lehrke M, Lazar MA. The Many Faces of PPARγ. Cell. 2005;1236:993-999.
- Lin J, Handschin C, Spiegelman BM. Metabolic control through the PGC-1 family of transcription coactivators. Cell Metab. 2005;16:361-370. [CrossRef]
- Halling JF, Pilegaard H. PGC-1α-mediated regulation of mitochondrial function and physiological implications. Appl Physiol Nutr Metab. 2020;459:927-936. [CrossRef]
- He F, Ru X, Wen T. NRF2, a Transcription Factor for Stress Response and Beyond. Int J Mol Sci. 2020;2113:4777. [CrossRef]
- Tonelli C, Chio IIC, Tuveson DA. Transcriptional Regulation by Nrf2. Antioxid Redox Signal. 2018;2917:1727-1745.
- Aubrey BJ, Kelly GL, Janic A, Herold MJ, Strasser A. How does p53 induce apoptosis and how does this relate to p53-mediated tumour suppression? Cell Death Differ. 2018;25(1):104-113. [CrossRef]
- Li Y, Giovannini S, Wang T, et al. p63: a crucial player in epithelial stemness regulation. Oncogene. 2023;4247:3435-3444. [CrossRef]
- Dhanasekaran R, Deutzmann A, Mahauad-Fernandez WD, Hansen AS, Gouw AM, Felsher DW. The MYC oncogene - the grand orchestrator of cancer growth and immune evasion. Nat Rev Clin Oncol. 2022;191:23-36. [CrossRef]
- Rudensky, AY. Regulatory T cells and Foxp3. Immunol Rev. 2011;2411:260-268.
- Yu X, Ng CP, Habacher H, Roy S. Foxj1 transcription factors are master regulators of the motile ciliogenic program. Nat Genet. 2008;4012:1445-1453. [CrossRef]
- Liao GB, Li XZ, Zeng S, et al. Regulation of the master regulator FOXM1 in cancer. Cell Commun Signal. 2018;161:57. [CrossRef]
- Shaffer AL, Lin KI, Kuo TC, et al. Blimp-1 orchestrates plasma cell differentiation by extinguishing the mature B cell gene expression program. Immunity. 2002;171:51-62. [CrossRef]
- Rothenberg EV, Hosokawa H, Ungerbäck J. Mechanisms of Action of Hematopoietic Transcription Factor PU.1 in Initiation of T-Cell Development. Front Immunol. 2019;10:228. [CrossRef]
- Jerabek S, Merino F, Schöler HR, Cojocaru V. OCT4: Dynamic DNA binding pioneers stem cell Pluripotency, Biochim.Biophys.Acts. 2014;18393;138-154. [CrossRef]
- Porcher C, Chagraoui H, Kristiansen MS. SCL/TAL1: a multifaceted regulator from blood development to disease. Blood. 2017;12915:2051-2060. [CrossRef]
- Ducoli L, Detmar M. Beyond PROX1: transcriptional, epigenetic, and noncoding RNA regulation of lymphatic identity and function. Dev Cell. 2021;564:406-426. [CrossRef]
- Jeyarajah MJ, Jaju Bhattad G, Kops BF, Renaud SJ. The multifaceted role of GCM1 during trophoblast differentiation in the human placenta. Proc Natl Acad Sci U S A. 2022;11950:e2203071119. [CrossRef]
- Martini-Stoica H, Xu Y, Ballabio A, Zheng H. The autophagy-lysosomal pathway in neurodegeneration: A TFEB perspective. Trends Neurosci. 2016;394:221-234. [CrossRef]
- Michaud JL, Boucher F, Melnyk A, et al. Sim1 haploinsufficiency causes hyperphagia, obesity and reduction of the paraventricular nucleus of the hypothalamus. Hum Mol Genet. 2001;1014:1465- 1473. [CrossRef]
- Phillips-Cremins JE, Corces VG. Chromatin Insulators: Linking genome organization to cellular function. Mol Cell. 2013;504:461-474. [CrossRef]
- Goding CR, Arnheiter H. MITF-the first 25 years. Genes Dev. 2019;3315-16:983-1007.
- Kaelin WG Jr, Ratcliffe PJ. Oxygen sensing by metazoans: the central role of the HIF hydroxylase pathway. Mol Cell. 2008;304:393-402. [CrossRef]
- Hernández-Hernández JM, García-González EG, Brun CE, Rudnicki MA. The myogenic regulatory factors, determinants of muscle development, cell identity and regeneration. Semin Cell Dev Biol. 2017;72:10-18. [CrossRef]
- M. Vascular Endothelial Growth Factor VEGF and Its Receptor VEGFR Signaling in Angiogenesis: A Crucial Target for Anti- and Pro-Angiogenic Therapies. Genes Cancer. 2011;212:1097-1105.
- P.R. Raghavan US patents 8,722,093 2014, 9,034,383 2015, and 9,006,292 2015.
- Raghavan, PR. Metadichol® A Nano Lipid Emulsion that Expresses All 49 Nuclear Receptors in Stem and Somatic Cells. Arch Clin Biomed Res. 2023;76:543-555. [CrossRef]
- Raghavan, PR. Metadichol®-induced expression of Sirtuins 1-7 in somatic and cancer cells. Med Res Arch. 2024;126. [CrossRef]
- Raghavan, PR. Metadichol, a modulator that controls expression of toll-like receptors in cancer cell lines. Br J Cancer Res. 2024;73:720-732. [CrossRef]
- Raghavan, PR. Metadichol induced expression of toll receptor family members in peripheral blood mononuclear cells. Med Res Arch. 2024;128. [CrossRef]
- Raghavan, PR. Metadichol-induced expression of circadian clock transcription factors in human fibroblasts. Med Res Arch. 2024;126. [CrossRef]
- P.R. Raghavan. Metadichol induced CD14 Glycoprotein expression in human embryonic stem cells and fibroblasts. [CrossRef]
- Raghavan, PR. VDR inverse agonism by metadichol enhances VDBP-mediated immunity. Preprints.org. 2025. [CrossRef]
- Raghavan, P. R. Metadichol Stimulates Gene Expression Across Mammalian Species: Dose Response Characterization and Implications for Restoring Vitamin C Biosynthesis. Preprints 2025, 2025081935. [Google Scholar] [CrossRef]
- Raghavan, PR. Metadichol orchestrates pluripotency via nuclear receptors during cellular reprogramming. Med Res Arch. 2025;136. [CrossRef]
- Raghavan P. R.. Beyond Rapamycin: Metadichol Represents a New Class of Multi-Target mTOR Modulators. Medical Research Archives, S.l., v. 13, n. 9, sep. 2025. ISSN 2375-1924. [CrossRef]
- Qian L, Zhu Y, Deng C, et al. Peroxisome proliferator-activated receptor gamma coactivator-1 PGC-1 family in physiological and pathophysiological process and diseases. Signal Transduct Target Ther. 2024;91:50. [CrossRef]
- Reina-Campos M, Scharping NE, Goldrath AW. CD8+ T cell metabolism in infection and cancer. Nat Rev Immunol. 2021;2111:718-738. [CrossRef]
- Scharping NE, Menk AV, Moreci RS, et al. The tumor microenvironment represses T cell mitochondrial biogenesis to drive intratumoral T cell metabolic insufficiency and dysfunction. Immunity. 2016;452:374-388. [CrossRef]
- Michalek RD, Gerriets VA, Jacobs SR, et al. Cutting edge: distinct glycolytic and lipid oxidative metabolic programs are essential for effector and regulatory CD4+ T cell subsets. J Immunol. 2011;1866:3299-3303. [CrossRef]
- Chowdhury PS, Chamoto K, Kumar A, Honjo T. PPAR-induced fatty acid oxidation in T cells increases the number of tumor-reactive CD8+ T cells and facilitates anti-PD-1 therapy. Cancer Immunol Res. 2018;6(11):1375-1387. [CrossRef]
- Dumauthioz N, Tschumi B, Wenes M, et al. Enforced PGC-1α expression promotes CD8 T cell fitness, memory formation and antitumor immunity. Cell Mol Immunol. 2021;187:1761-1771. [CrossRef]
- Puigserver P, Spiegelman BM. Peroxisome proliferator-activated receptor-gamma coactivator 1 alpha PGC-1 alpha: transcriptional coactivator and metabolic regulator. Endocr Rev. 2003;241:78-90. [CrossRef]
- Kishton RJ, Sukumar M, Restifo NP. Metabolic regulation of T cell longevity and function in tumor immunotherapy. Cell Metab. 2017;261:94-109. [CrossRef]
- Levine, AJ. p53: 800 million years of evolution and 40 years of discovery. Nat Rev Cancer. 2020;208:471-480. [CrossRef]
- Watanabe M, Moon KD, Vacchio MS, Hathcock KS, Hodes RJ. Downmodulation of tumor suppressor p53 by T cell receptor signaling is critical for antigen-specific CD4+ T cell responses. Immunity. 2014;405:681-691. [CrossRef]
- Kruiswijk F, Labuschagne CF, Vousden KH. p53 in survival, death and metabolic health: a lifeguard with a licence to kill. Nat Rev Mol Cell Biol. 2015;167:393-405. [CrossRef]
- Bieging KT, Mello SS, Attardi LD. Unravelling mechanisms of p53-mediated tumour suppression. Nat Rev Cancer. 2014;14(5):359-370. [CrossRef]
- Jiang L, Kon N, Li T, et al. Ferroptosis as a p53-mediated activity during tumour suppression. Nature. 2015;5207545:57-62. [CrossRef]
- Togashi Y, Shitara K, Nishikawa H. Regulatory T cells in cancer immunosuppression - implications for anticancer therapy. Nat Rev Clin Oncol. 2019;166:356-371. [CrossRef]
- Tanaka A, Sakaguchi S. Targeting Treg cells in cancer immunotherapy. Eur J Immunol. 2019;498:1140-1146. [CrossRef]
- Arce Vargas F, Furness AJS, Litchfield K, et al. Fc effector function contributes to the activity of human anti-CTLA-4 antibodies. Cancer Cell. 2018;334:649-663.e4. [CrossRef]
- Sharpe AH, Freeman GJ. The B7-CD28 superfamily. Nat Rev Immunol. 2002;22:116-126. [CrossRef]
- Buck MD, O\'Sullivan D, Klein Geltink RI, et al. Mitochondrial dynamics controls T cell fate through metabolic programming. Cell. 2016;1661:63-76. [CrossRef]
- Scharping NE, Menk AV, Whetstone RD, Zeng X, Delgoffe GM. Efficacy of PD-1 blockade is potentiated by metformin-induced reduction of tumor hypoxia. Cancer Immunol Res. 2017;5(1):9-16. [CrossRef]
- St-Pierre J, Drori S, Uldry M, Silvaggi JM, Rhee J, Jäger S, Handschin C, Zheng K, Lin J, Yang W, Simon DK, Bachoo R, Spiegelman BM. Suppression of reactive oxygen species and neurodegeneration by the PGC-1 transcriptional coactivators. Cell. 2006 Oct 20;1272:397-408. [CrossRef]
- Bengsch B, Johnson AL, Kurachi M, et al. Bioenergetic insufficiencies due to metabolic alterations regulated by the inhibitory receptor PD-1 are an early driver of CD8+ T cell exhaustion. Immunity. 2016;452:358-373. [CrossRef]
- Levine, AJ. p53, the cellular gatekeeper for growth and division. Cell. 1997;883:323-331.
- Zheng SJ, Lamhamedi-Cherradi SE, Wang P, Xu L, Chen YH. Tumor suppressor p53 inhibits autoimmune inflammation and macrophage function. Diabetes. 2005;545:1423-1428. [CrossRef]
- Lujambio A, Akkari L, Simon J, et al. Non-cell-autonomous tumor suppression by p53. Cell. 2013;1532:449-460. [CrossRef]
- Vousden KH, Prives C. Blinded by the light: the growing complexity of p53. Cell. 2009;1373:413- 431. [CrossRef]
- Kastenhuber ER, Lowe SW. Putting p53 in context. Cell. 2017;1706:1062-1078. [CrossRef]
- Togashi Y, Shitara K, Nishikawa H. Regulatory T cells in cancer immunosuppression - implications for anticancer therapy. Nat Rev Clin Oncol. 2019;166:356-371. [CrossRef]
- Tanaka A, Sakaguchi S. Regulatory T cells in cancer immunotherapy. Cell Res. 2017;27(1):109-118.
- Saleh R, Elkord E. Treg-mediated acquired resistance to immune checkpoint inhibitors. Cancer Lett. 2019;457:168-179. [CrossRef]
- Lenschow DJ, Walunas TL, Bluestone JA. CD28/B7 system of T cell costimulation. Annu Rev Immunol. 1996;14:233-258. [CrossRef]
- Klein Geltink RI, Kyle RL, Pearce EL. Unraveling the complex interplay between T cell metabolism and function. Annu Rev Immunol. 2018;36:461-488.
- Alarcón B, Gil D, Delgado P, Schamel WW. Initiation of TCR signaling: regulation within CD3 dimers. Immunol Rev. 2003;191:38-46. [CrossRef]
- Zaunders JJ, Kelleher AD, Cooper DA. The role of T-cell receptor diversity in HIV-1 infection. Curr Opin Immunol. 2001;134:483-489.
- Rabinowich H, Pricop L, Herberman RB, Whiteside TL. Expression and function of CD7 molecule on human natural killer cells. J Immunol. 1994;1522:517-526. [CrossRef]
- Gao GF, Murata K, Rao Z, et al. Crystal structure of the complex between human CD8αα and HLA-A2. Nature. 1997;387663(3):630-634.
- Létourneau S, van Leeuwen EM, Krieg C, et al. IL-2/anti-IL-2 antibody complexes show strong biological activity by avoiding interaction with IL-2 receptor alpha subunit CD25. Proc Natl Acad Sci USA. 2010;1075:2171-2176.
- Van Gisbergen KP, van der Vlist M, ten Brinke A, et al. The costimulatory molecule CD27 maintains clonally diverse CD8+ T cell responses of low antigen affinity to protect against viral variants. Immunity. 2011;35(1):97-108.
- Linsley PS, Clark EA, Ledbetter JA. T-cell antigen CD28 mediates adhesion with B cells by interacting with activation antigen B7/BB-1. Proc Natl Acad Sci USA. 1990;871(3):5031-5035.
- Hermiston ML, Xu Z, Weiss A. CD45: a critical regulator of signaling thresholds in immune cells. Annu Rev Immunol. 2003;21:107-137. [CrossRef]
- De-la-Fuente C, Pantoja-Uceda D, G-Trevijano ER, et al. The structure and plasticity of the complex formed by the two N-terminal domains of human CD58. J Mol Biol. 2020;4329:3141-3157.
- Davis SJ, van der Merwe PA. The kinetic-segregation model: TCR triggering and beyond. Nat Immunol. 2006;78:803-809. [CrossRef]
- Ferrara N, Gerber HP, LeCouter J. The biology of VEGF and its receptors. Nat Med. 2003;96:669- 676.
- Herblot S, Steff AM, Hugo P, et al. SCL/TAL1 is a positive regulator of thymocyte maturation. Blood. 2000;956:2025-2032.
- Shapiro-Shelef M, Lin KI, McHeyzer-Williams LJ, et al. Blimp-1 is required for the formation of immunoglobulin secreting plasma cells and pre-plasma memory B cells. Immunity. 2003;194:607- 620. [CrossRef]
- Scott EW, Simon MC, Anastasi J, Singh H. Requirement of transcription factor PU.1 in the development of multiple hematopoietic lineages. Science. 1994;2655178:1573-1577. [CrossRef]
- Nichols J, Zevnik B, Anastassiadis K, et al. Formation of pluripotent stem cells in the mammalian embryo depends on the POU transcription factor Oct4. Cell. 1998;953:379-391. [CrossRef]
- Wigle JT, Oliver G. Prox1 function is required for the development of the murine lymphatic system. Cell. 1999;986:769-778. [CrossRef]
- Anson-Cartwright L, Dawson K, Holmyard D, et al. The glial cells missing-1 protein is essential for branching morphogenesis in the chorioallantoic placenta. Nat Genet. 2000;253:311-314. [CrossRef]
- Scarpulla, RC. Metabolic control of mitochondrial biogenesis through the PGC-1 family regulatory network. Biochim Biophys Acta. 2011;18137:1269-1278. [CrossRef]
- Itoh K, Chiba T, Takahashi S, et al. An Nrf2/small Maf heterodimer mediates the induction of phase II detoxifying enzyme genes through antioxidant response elements. Biochem Biophys Res Commun. 1997;2362:313-322.
- Watanabe M, Moon KD, Vacchio MS, et al. FOXJ1 is essential for Treg cell development and function. J Exp Med. 2014;2112:233-247.
- Sardiello M, Palmieri M, di Ronza A, et al. A gene network regulating lysosomal biogenesis and function. Science. 2009;3255939:473-477. [CrossRef]
- Dang, CV. MYC on the path to cancer. Cell. 2012;1491:22-35. [CrossRef]
- Mills AA, Zheng B, Wang XJ, et al. p63 is a p53 homologue required for limb and epidermal morphogenesis. Nature. 1999;3986729:708-713. [CrossRef]
- Michaud JL, Boucher F, Melnyk A, et al. Sim1 haploinsufficiency causes hyperphagia, obesity and reduction of the paraventricular nucleus of the hypothalamus. Hum Mol Genet. 2001;1014:1465- 1473. [CrossRef]
- Laoukili J, Kooistra MR, Brás A, et al. FoxM1 is required for execution of the mitotic programme and chromosome stability. Nat Cell Biol. 2005;72:126-136. [CrossRef]
- Bell AC, West AG, Felsenfeld G. The protein CTCF is required for the enhancer blocking activity of vertebrate insulators. Cell. 1999;983:387-396. [CrossRef]
- Tachibana M, Takeda K, Nobukuni Y, et al. Ectopic expression of MITF, a gene for Waardenburg syndrome type 2, converts fibroblasts to cells with melanocyte characteristics. Nat Genet. 1996;141:50-54. [CrossRef]
- Wang GL, Jiang BH, Rue EA, Semenza GL. Hypoxia-inducible factor1. is a basic-helix-loop-helix- PAS heterodimer regulated by cellular O2 tension. Proc Natl Acad Sci USA. 1995;9212:5510-5514. [CrossRef]
- Davis RL, Weintraub H, Lassar AB. Expression of a single transfected cDNA converts fibroblasts to myoblasts. Cell. 1987;516:987-1000. [CrossRef]
- Cipolletta D, Feuerer M, Li A, et al. PPAR-γ is a major driver of the accumulation and phenotype of adipose tissue Treg cells. Nature. 2012;4867404:549-553. [CrossRef]
- Alarcón B, Gil D, Delgado P, Schamel WW. Initiation of TCR signaling: regulation within CD3 dimers. Immunol Rev. 2003;191:38-46. [CrossRef]
- Klein U, Rajewsky K, Küppers R. Human immunoglobulin IgM+IgD+ peripheral blood B cells expressing the CD27 cell surface antigen carry somatically mutated variable region genes: CD27 as a general marker for somatically mutated memory B cells. J Exp Med. 1998;1889:1679-1689. [CrossRef]
- Sardiello M, Palmieri M, di Ronza A, et al. A gene network regulating lysosomal biogenesis and function. Science. 2009;3255939:473-477. [CrossRef]
- Tellier J, Shi W, Minnich M, et al. Blimp-1 controls plasma cell function through the regulation of immunoglobulin secretion and the unfolded protein response. Nat Immunol. 2016;173:323-330. [CrossRef]
- Nutt SL, Hodgkin PD, Tarlinton DM, Corcoran LM. The generation of antibody-secreting plasma cells. Nat Rev Immunol. 2015;153:160-171. [CrossRef]
- Lam WY, Becker AM, Kennerly KM, et al. Mitochondrial pyruvate import promotes long-term survival of antibody-secreting plasma cells. Immunity. 2016;45(1):60-73. [CrossRef]
- Vitale M, Della Chiesa M, Carlomagno S, et al. The small subset of CD56brightCD16- natural killer cells is selectively responsible for both cell proliferation and interferon-gamma production upon interaction with dendritic cells. Eur J Immunol. 2004;346:1715-1722.
- Hesslein DG, Palacios EH, Sun JC, et al. Dysregulation of signaling pathways in CD45-deficient NK cells leads to differentially regulated cytotoxicity and cytokine production. Proc Natl Acad Sci USA. 2006;10318:7012-7017.
- De-la-Fuente C, Pantoja-Uceda D, G-Trevijano ER, et al. The structure and plasticity of the complex formed by the two N-terminal domains of human CD58. J. Mol. Biol.; 4329; 3141-3157.
- Bryceson YT, March ME, Ljunggren HG, Long EO. Synergy among receptors on resting NK cells for the activation of natural cytotoxicity and cytokine secretion. Blood. 2006;1071:159-166. [CrossRef]
- Kallies A, Carotta S, Huntington ND, et al. A role for Blimp1 in the transcriptional network controlling natural killer cell maturation. Blood. 2011;1176:1869-1879. [CrossRef]
- Colucci F, Samson SI, DeKoter RP, et al. Differential requirement for the transcription factor PU.1 in the generation of natural killer cells versus B and T cells. Blood. 2001;979:2625-2632. [CrossRef]
- Anson-Cartwright L, Dawson K, Holmyard D, et al. The glial cells missing-1 protein is essential for branching morphogenesis in the chorioallantoic placenta. Nat Genet. 2000;253:311-314. [CrossRef]
- Davis RL, Weintraub H, Lassar AB. Expression of a single transfected cDNA converts fibroblasts to myoblasta. Cell 1987:516; 987-1000. [CrossRef]
- Szanto A, Balint BL, Nagy ZS, et al. STAT6 transcription factor is a facilitator of the nuclear receptor PPARγ-regulated gene expression in macrophages and dendritic cells. Immunity. 2010;335:699-712. [CrossRef]
- Smith MA, Maurin M, Cho HI, et al. PRDM1/Blimp-1 controls effector cytokine production in human NK cells. J Immunol. 2010;18510:6058-6067. [CrossRef]
- Huntington ND, Puthalakath H, Gunn P, et al. Interleukin 15-mediated survival of natural killer cells is determined by interactions among Bim, Noxa and Mcl-1. Nat Immunol. 2007;88:856-863. [CrossRef]
- Vivier E, Tomasello E, Baratin M, et al. Functions of natural killer cells. Nat Immunol. 2008;95:503- 510.
- Chiossone L, Chaix J, Fuseri N, et al. Maturation of mouse NK cells is a 4-stage developmental program. Blood. 2009;11322:5488-5496.
- Wang W, Erbe AK, Hank JA, et al. NK cell-mediated antibody-dependent cellular cytotoxicity in cancer immunotherapy. Front Immunol. 2015;6:368.
- Vachharajani VT, Liu T, Wang X, Hoth JJ, Yoza BK, McCall CE. Sirtuins link inflammation and metabolism. J Immunol Res. 2016;2016:8167273. [CrossRef]
- Hamaidi I, Kim S. Sirtuins are crucial regulators of T cell metabolism and functions. Exp Mol Med. 2022;543:207-215. [CrossRef]
- Li X, Liu L, Li T, et al. Metabolic mechanisms orchestrated by Sirtuin family to modulate inflammatory responses. Front Immunol. 2024;15:1448535.
- Zhao X, Li X, Zhang Y, et al. New insights into the role of Klotho in inflammation and fibrosis: molecular and cellular mechanisms. Front Immunol. 2024;15:1454142.
- Wang Y, Wang K, Bao Y, et al. The serum soluble Klotho alleviates cardiac aging and regulates M2a/M2c macrophage polarization via inhibiting TLR4/Myd88/NF-κB pathway. Tissue Cell. 2022;77:101842. [CrossRef]
- Zhu L, Stein LR, Kim D, et al. Klotho controls the brain--immune system interface in the choroid plexus. Proc Natl Acad Sci U S A. 2018;115(48):E11388-E11396. [CrossRef]
- Bi F, Liu W, Wu Z, et al. Antiaging Factor Klotho Retards the Progress of Intervertebral Disc Degeneration through the Toll-Like Receptor 4-NF-κB Pathway. Int J Cell Biol. 2020;2020:8319516. [CrossRef]
- Lim SW, Jin L, Luo K, et al. Klotho enhances FoxO3-mediated manganese superoxide dismutase expression by negatively regulating PI3K/AKT pathway during tacrolimus-induced oxidative stress. Cell Death Dis. 2017;8(8):e2972. [CrossRef]
- Tai NC, Shih CT, Chen TY, et al. Soluble klotho regulates the function of salivary glands by activating KLF4 pathways. Biomed J. 2019;42(5):319-332.
- Cho H, Zhao X, Hatori M, et al. Regulation of circadian behaviour and metabolism by REV-ERB-α and REV-ERB-β. Nature. 2012;485(7396):123-127. [CrossRef]
- Korbecki J, Bobiński R, Dutka M. Self-regulation of the inflammatory response by peroxisome proliferator-activated receptors. Inflamm Res. 2019;68(6):443-458. [CrossRef]
- Raghavan, PR. Metadichol; An Agonist that Expresses the Anti-aging gene Klotho in Various Cell Lines. Fortune Journal of Health Sciences. 6 2023: 357-362.
- Raghavan, PR. Metadichol and Vitamin C increase in vivo, an open-label study. Preprints.org. 2019. [CrossRef]
- Kishton RJ, Sukumar M, Restifo NP. Metabolic regulation of T cell longevity and function in tumor immunotherapy. Cell Metab. 2017;261:94-109. [CrossRef]
- Alemán, CL, Más Ferreiro, et al. Carcinogenicity of policosanol in Sprague‒Dawley rats: A 24-month study. 1994; Teratog Carcinog Mutagen: 14:239-49.
- Raghavan, PR. Metadichol induces CD14 glycoprotein expression in human embryonic stem cells and fibroblasts. Medical Research Archives, S.l., v. 13, n. 5, may 2025. ISSN 2375-1924. [CrossRef]
Figure 1.
Comprehensive Gene Expression Heatmap Across Metadichol Concentrations. The log2- transformed fold changes show that PPARγ, PGC1α, and p53 have the most dramatic upregulation red, while CDS6 and CDS0 are severely downregulated blue. Each row represents a gene, and each column represents a Metadichol concentration 1 pg/mL, 100 pg/mL, 1 ng/mL, 100 ng/mL.
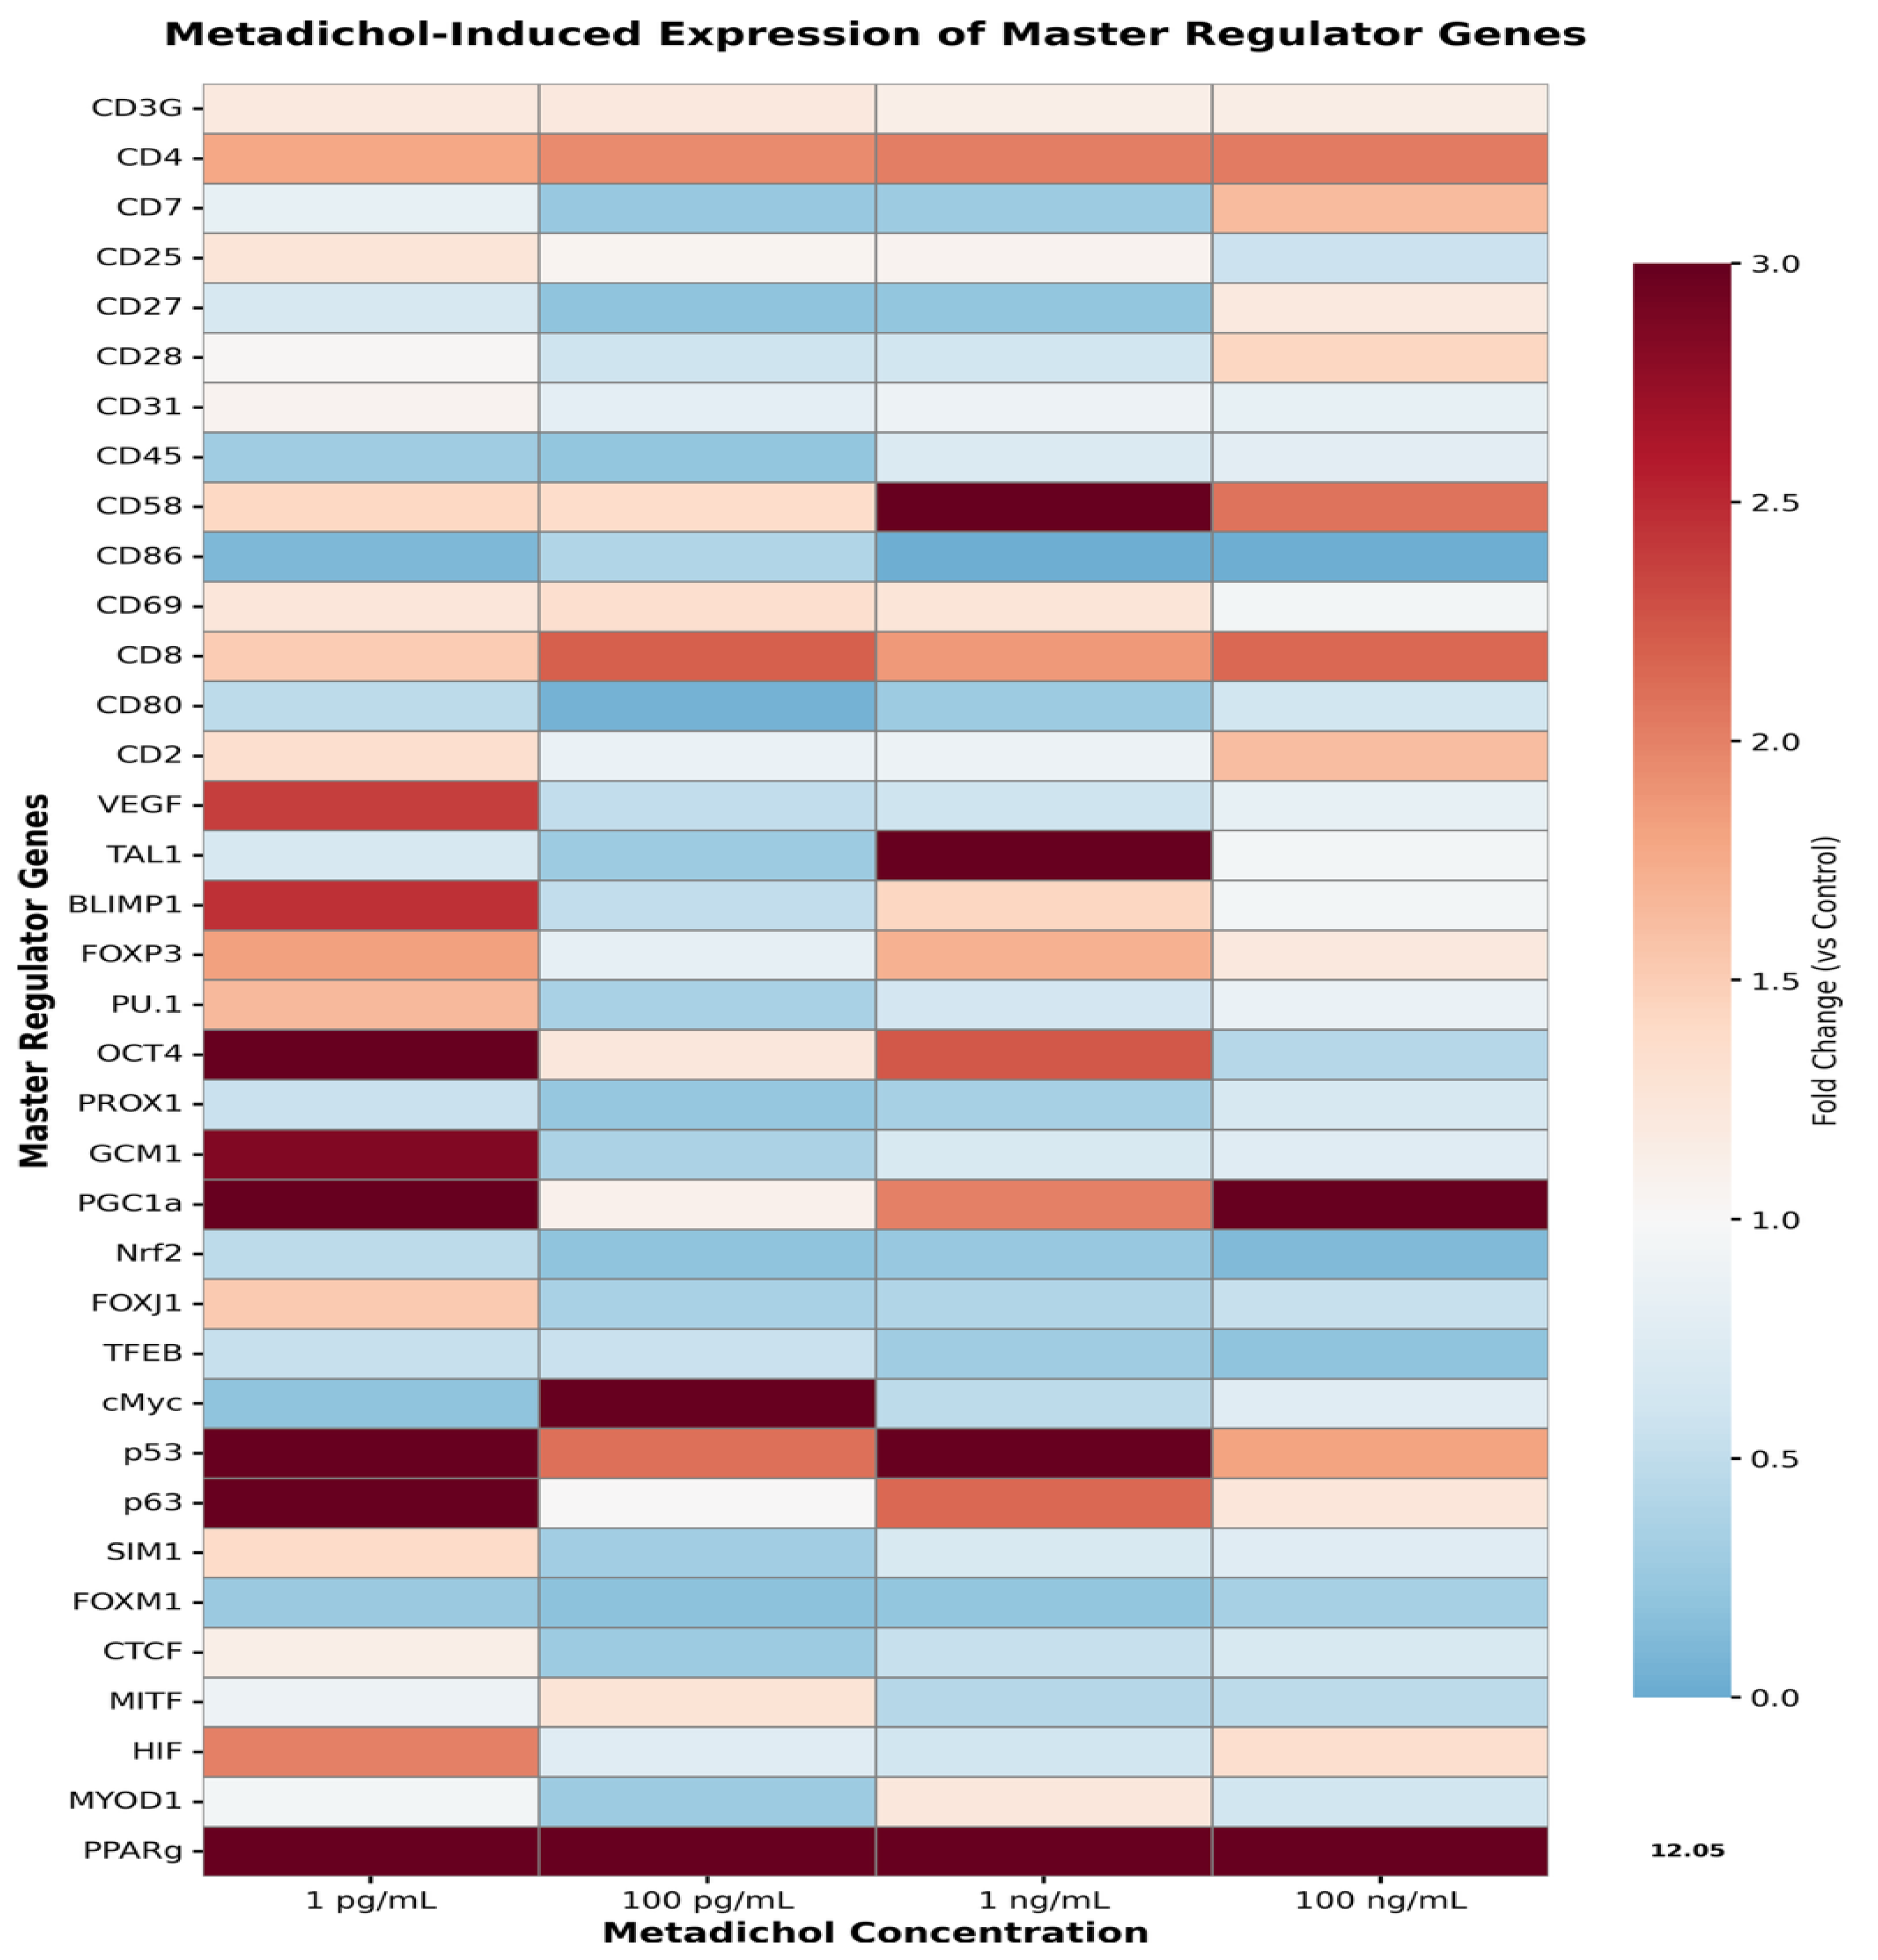
Figure 2.
Individual gene expression.
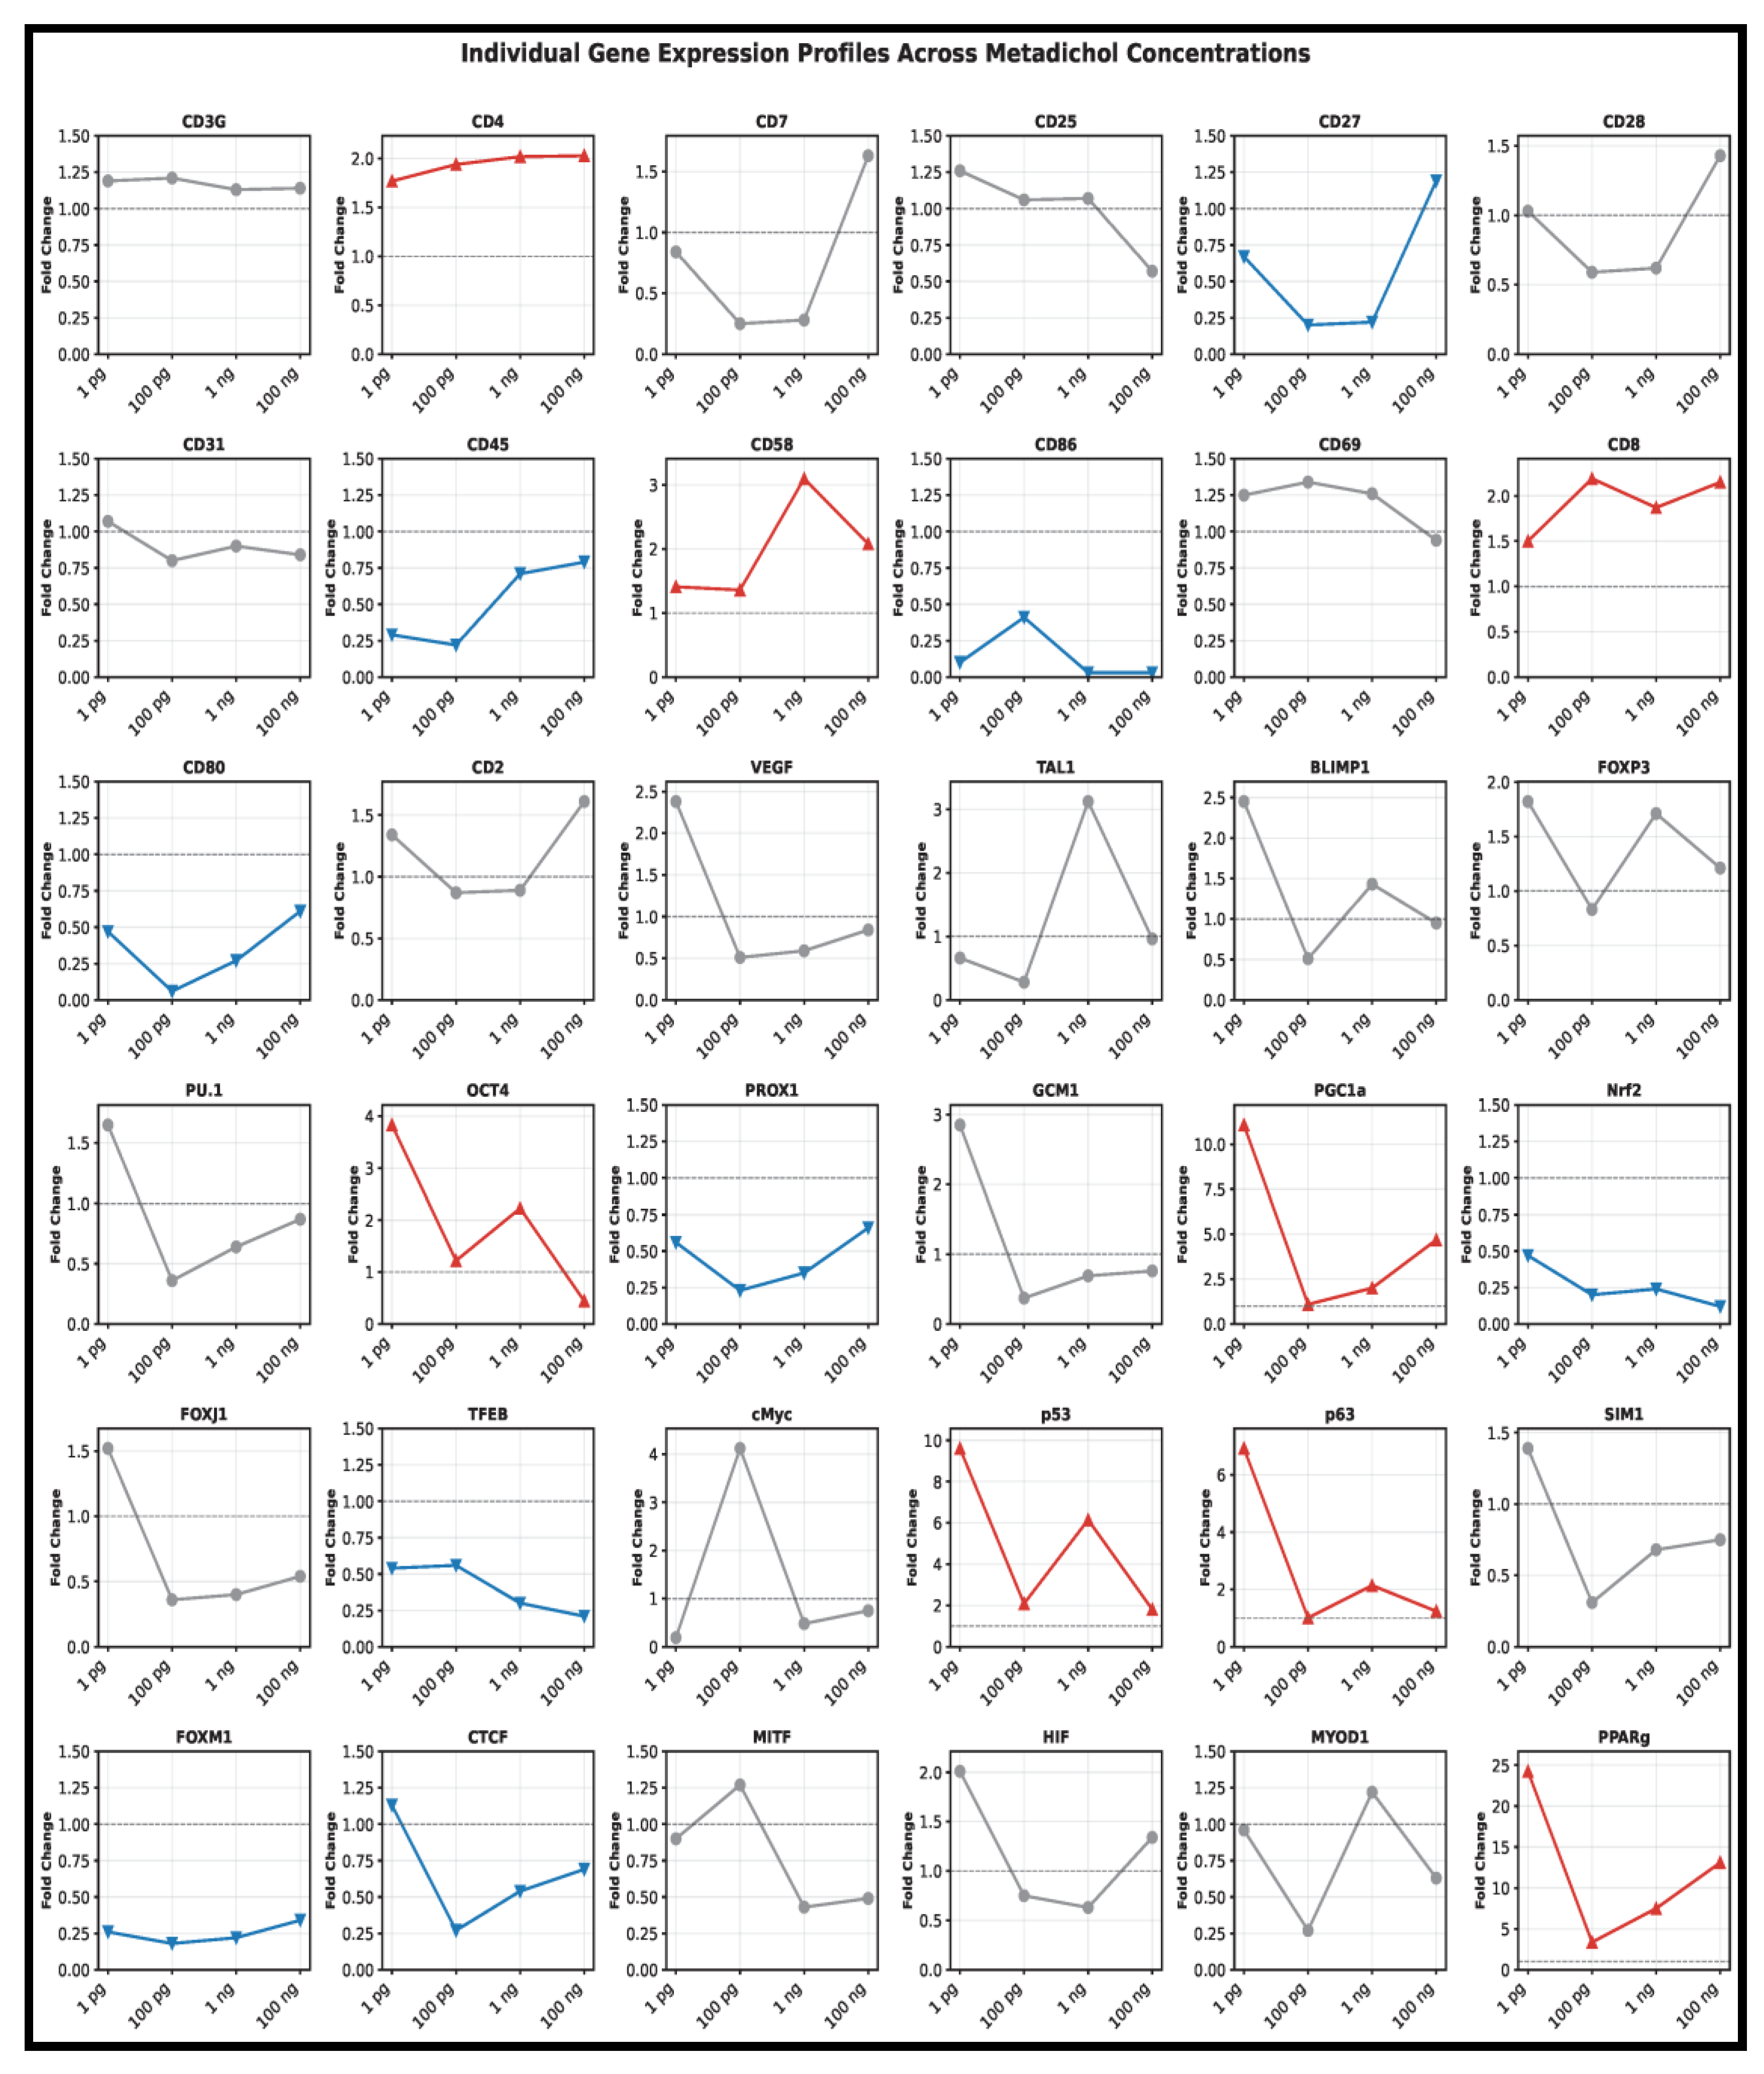
Figure 3.
Hierarchical clustering of genes.
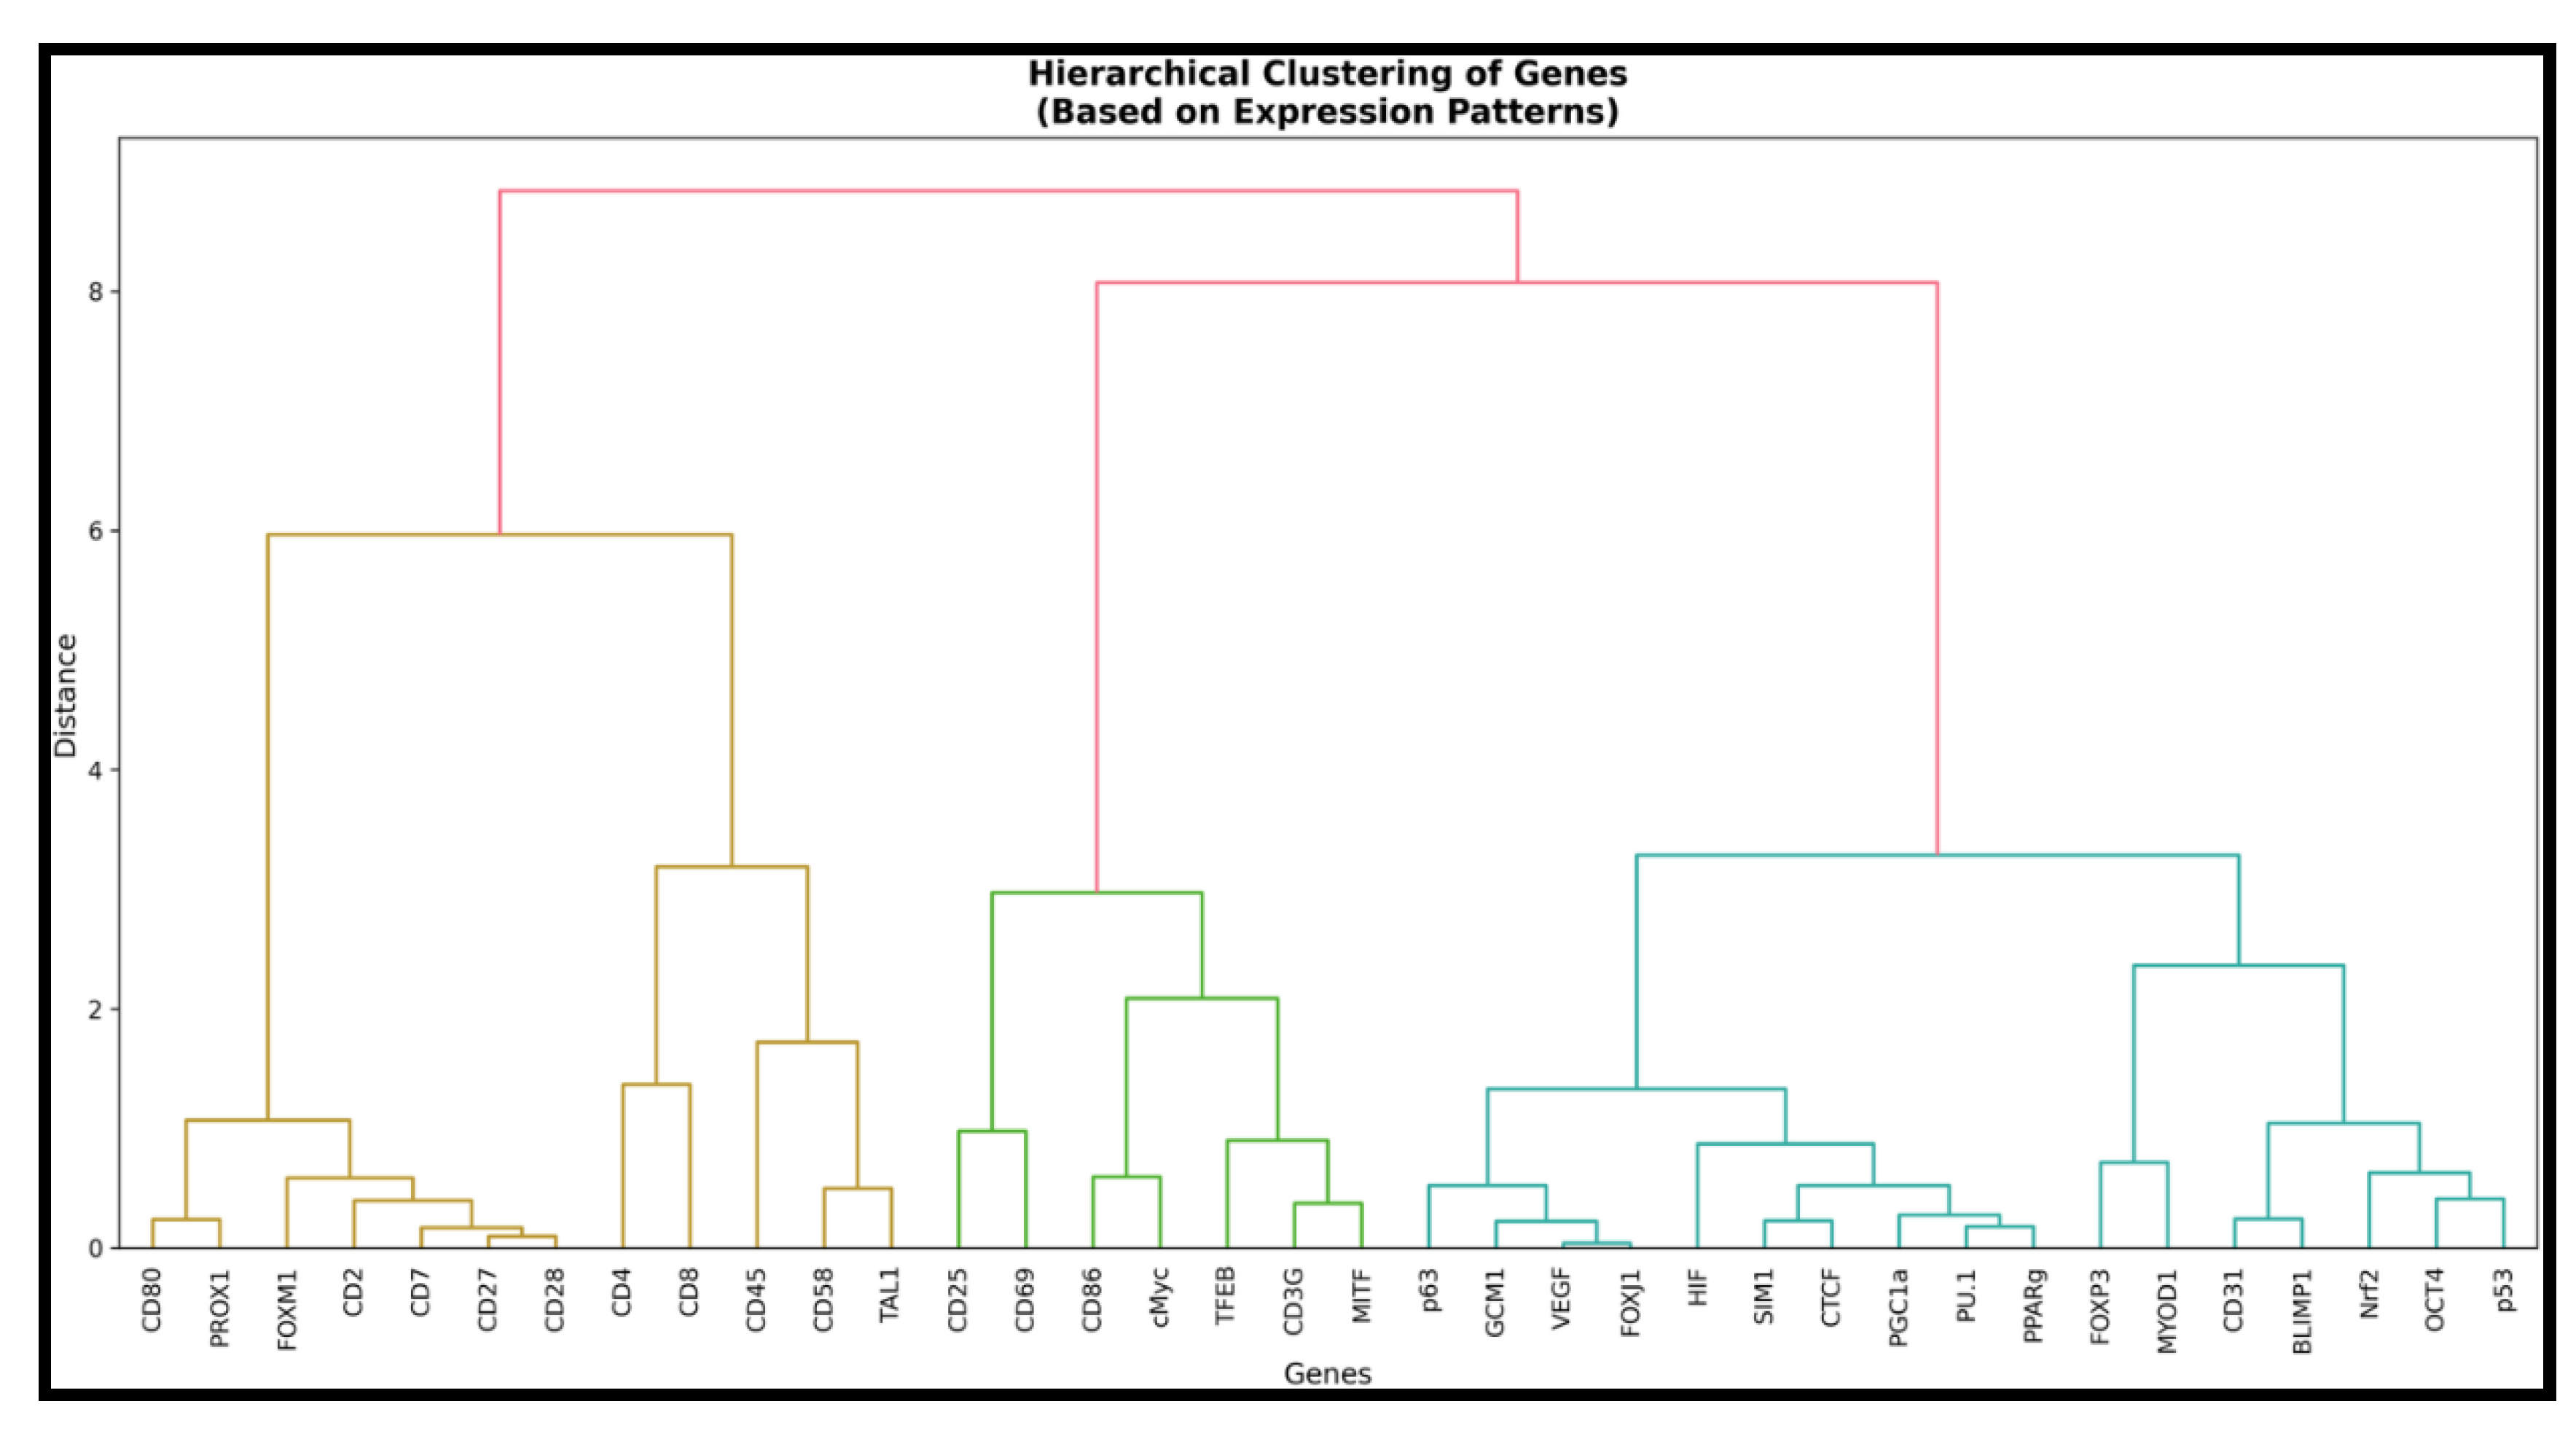
Figure 4.
Gene-Gene Correlation Matrix.
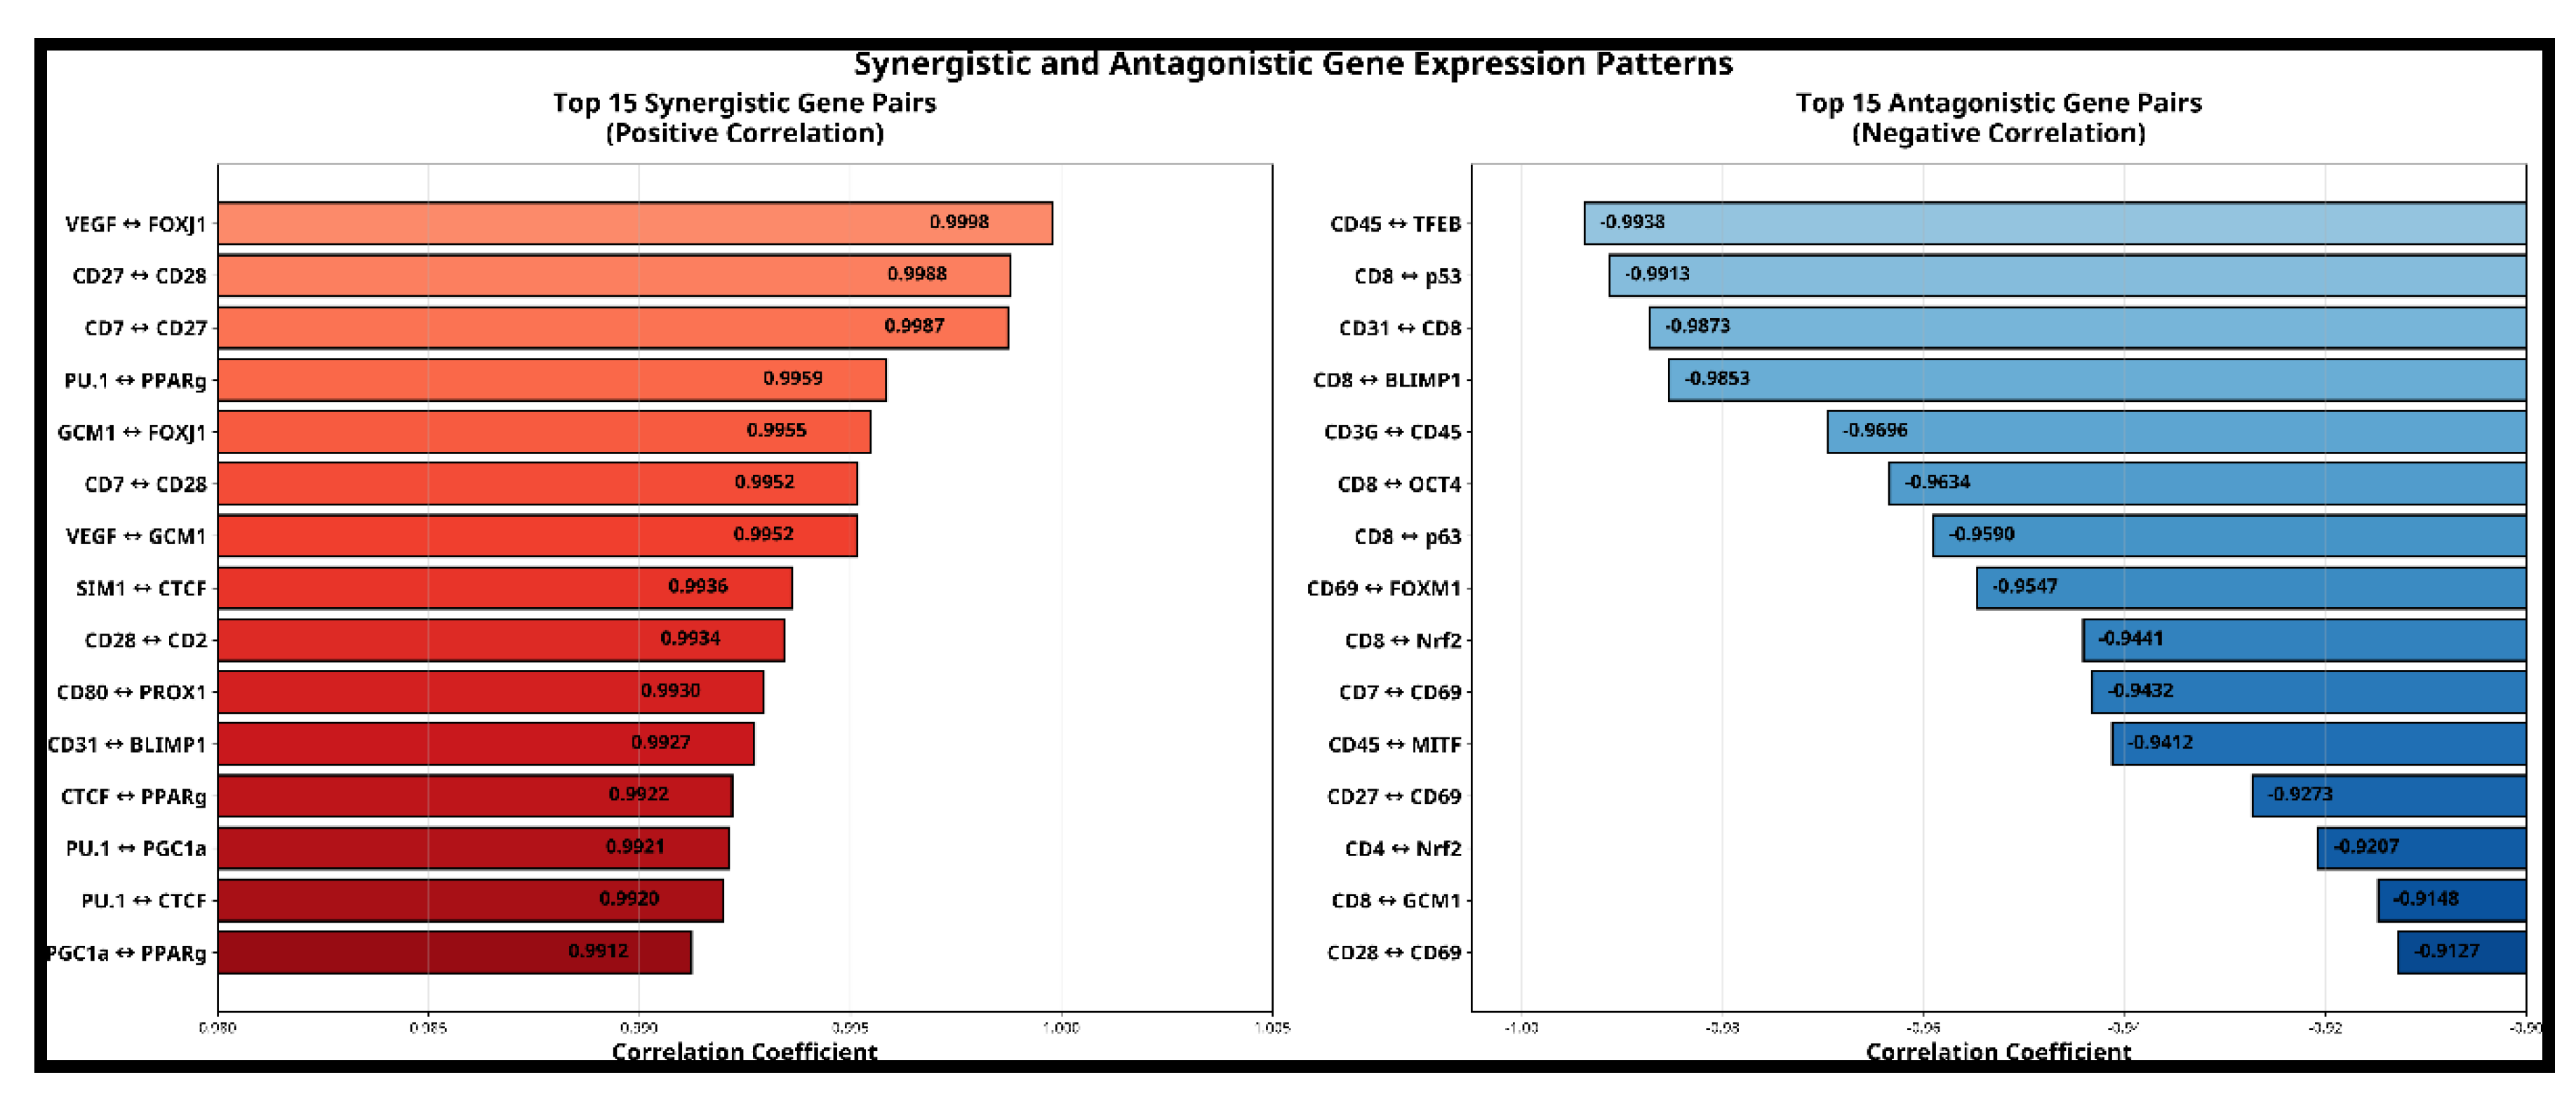
Figure 5.
Pearson Correlation of Expression Patterns.

Figure 10.
T Cell Network.
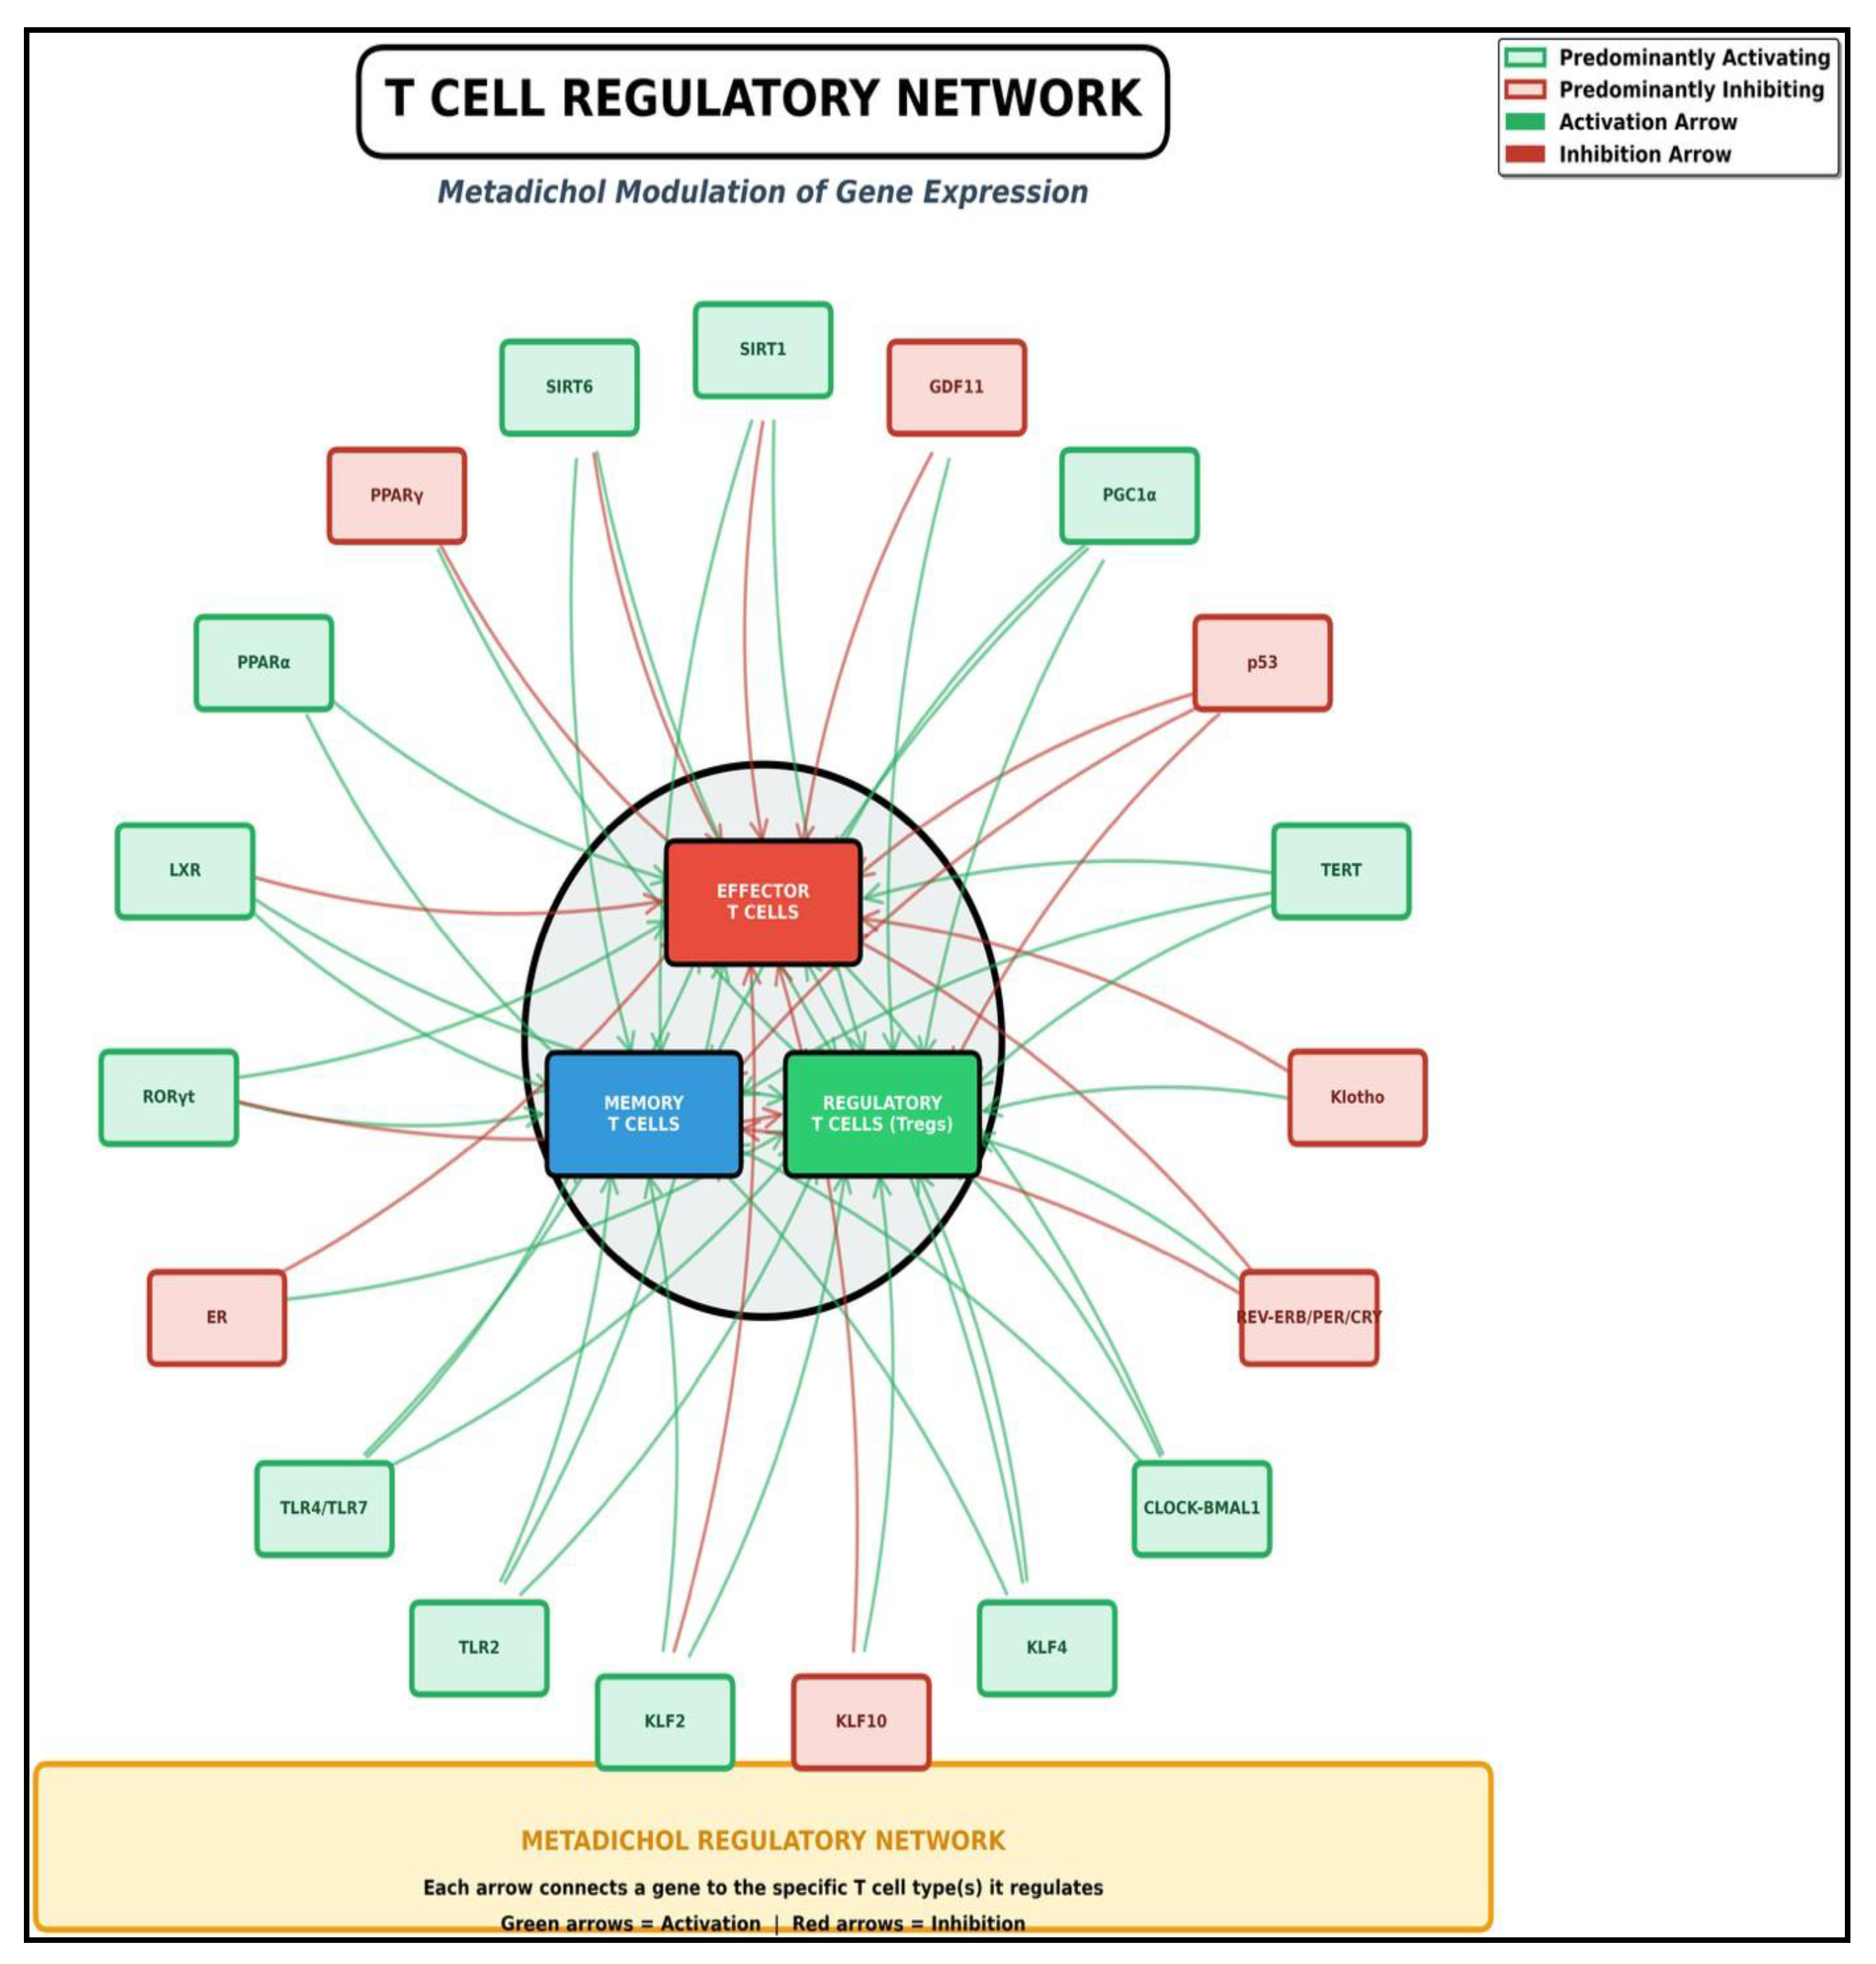
Figure 11.
B cell network.
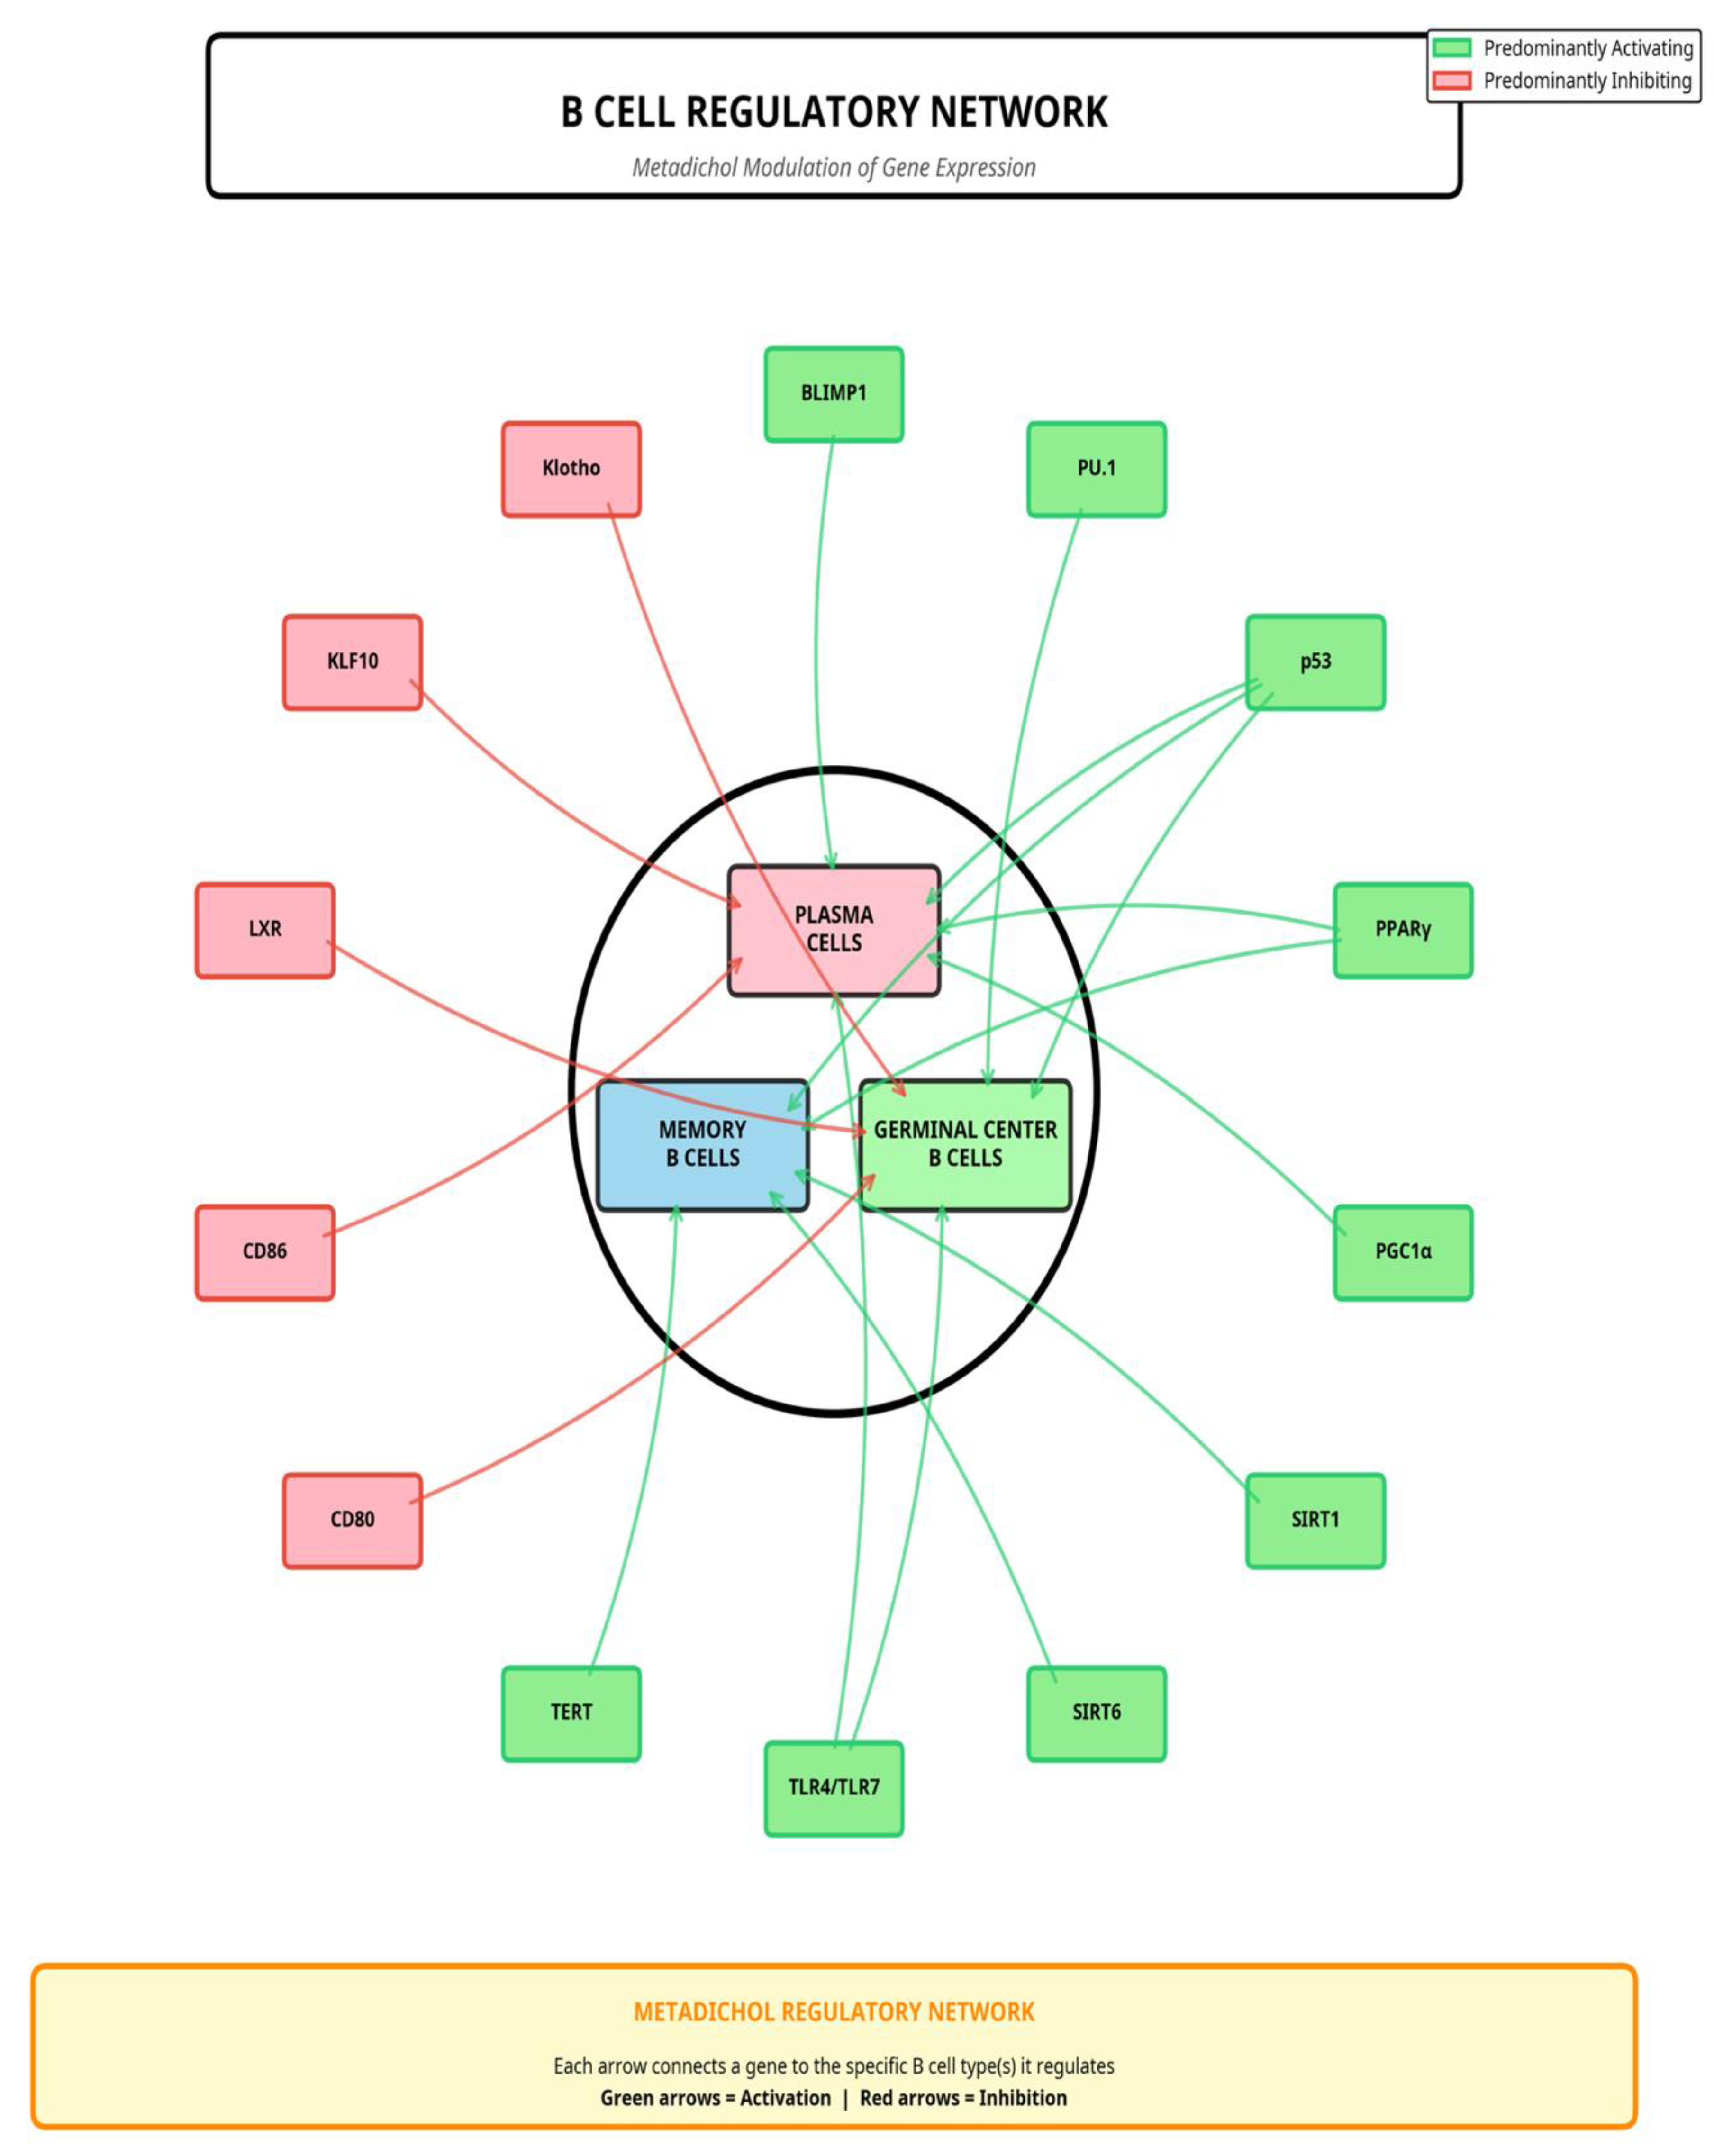
Figure 13.
Metadichol Pathway Network.
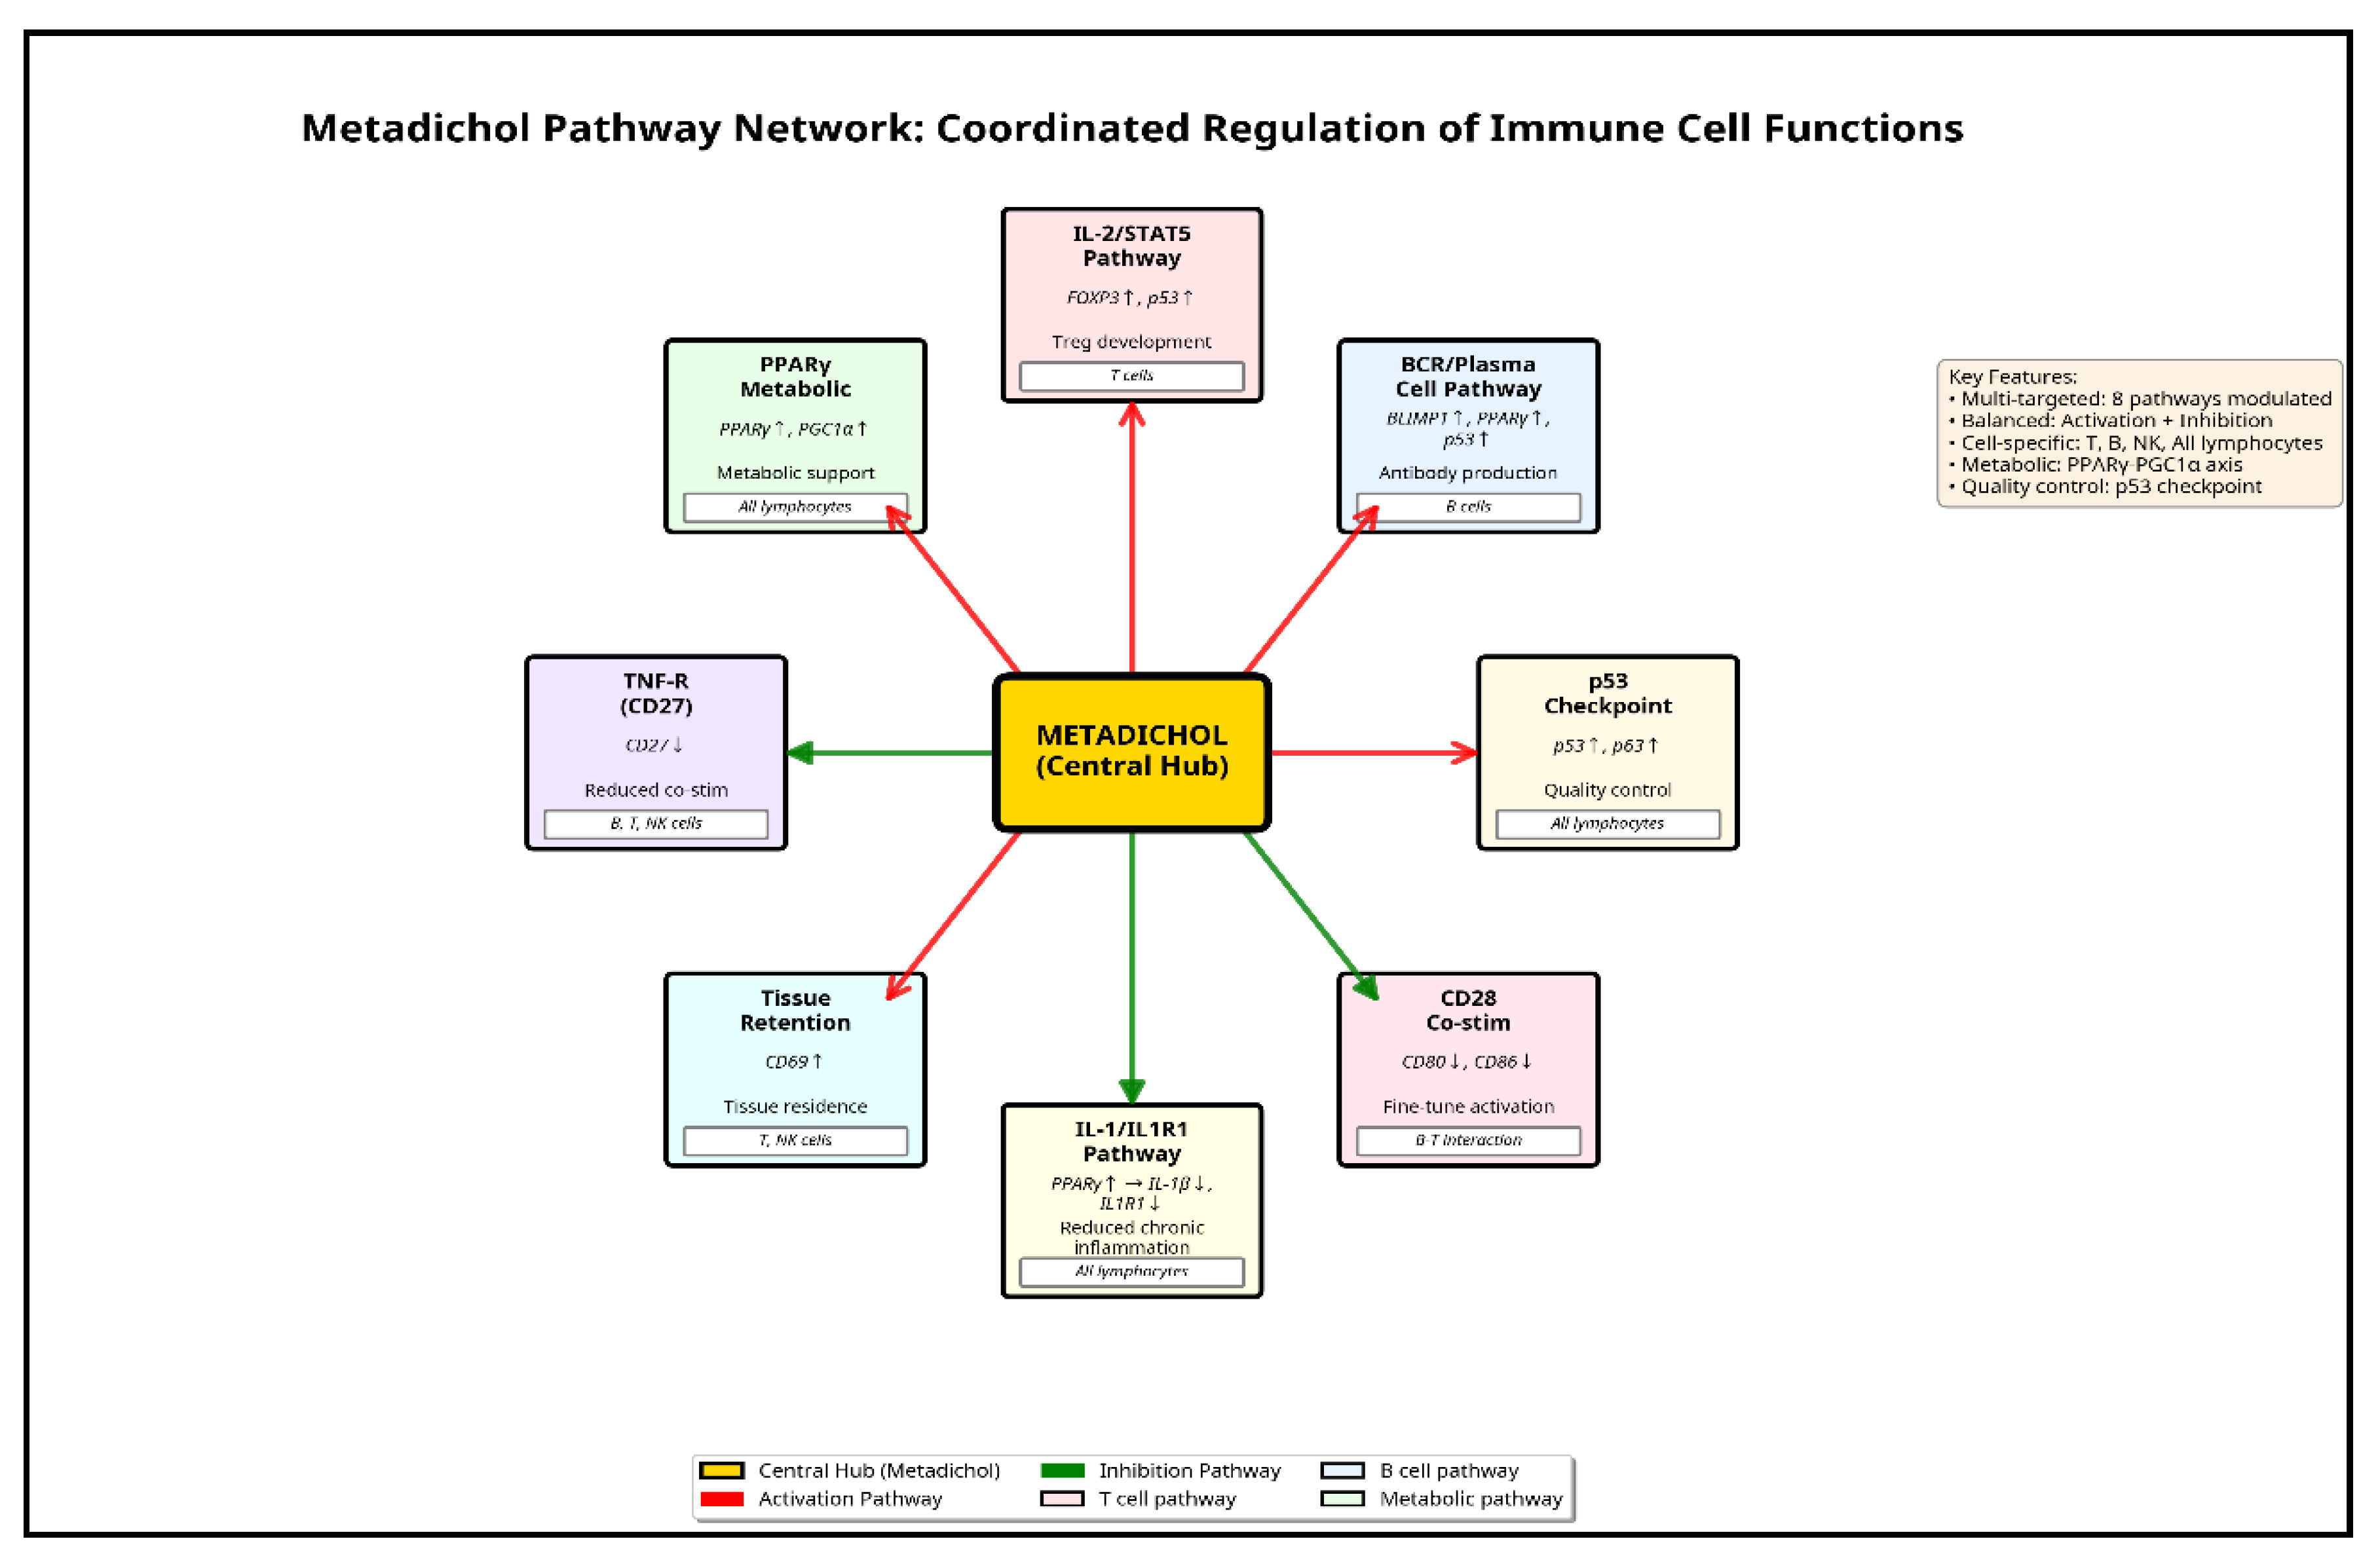
Table 5.
T Cell Modulation Metadichol-Regulated Genes: Effects on T Cell Subsets.
| Gene | Regulation | Effect on T Cells Effector | Effect on T Memory Cells | Effect on T Regulatory Cells | |
| CD3G | ↑ | Enhances TCR signaling and T cell activation | Supports memory T cell formation | Minimal effect | |
| CD4 | ↑ | Enhances helper T cell function and activation | Promotes memory CD4+ T cell development | Essential for Treg development and function | |
| CD7 | ↓ | Reduced early T cell activation marker | May affect memory formation | Minimal effect | |
| CD8 | ↑ | Enhances cytotoxic T cell function and killing | Promotes memory CD8+ T cell development | Minimal effect | |
| CD25 | ↑/↓ | Modulates IL-2 responsiveness | Variable effect | Critical for Treg suppressive function | |
| CD27 | ↓ | Reduced co-stimulation | Impaired memory T cell survival | Minimal effect | |
| CD28 | ↑/↓ | Modulates T cell co-stimulation | Affects memory T cell maintenance | Important for Treg homeostasis | |
| CD31 | ↓ | Reduced T cell migration | May affect tissue-resident memory | Minimal effect | |
| CD45 | ↓ | Altered TCR signaling threshold | May affect memory recall | Affects Treg signaling | |
| CD58 | ↑ | Enhanced T cell adhesion and activation | Promotes memory T cell interactions | Minimal effect | |
| CD69 | ↑ | Early activation marker, tissue retention | Promotes tissue-resident memory | Minimal effect | |
| CD80 | ↓ | Reduced costimulatory signaling | May impair memory formation | Affects Treg suppression | |
| CD86 | ↓ | Reduced costimulatory signaling | May impair memory formation | Affects Treg suppression | |
| CD2 | ↑ | Enhanced T cell activation | Supports memory T cell function | Minimal effect | |
| VEGF | ↑ | Promotes T cell survival and migration | May support memory T cell niches | Minimal effect | |
| TAL1 | ↓ | Reduced T cell development | May affect memory precursor formation | Minimal effect | |
| BLIMP1 | ↑ | Promotes effector differentiation | Inhibits memory T cell formation | Promotes Treg suppressive function | |
| FOXP3 | ↑ | Inhibits effector T cell function | Minimal effect | Master regulator of Treg development and function | |
| PU.1 | ↑ | Modulates T cell differentiation | May affect memory formation | Minimal effect | |
| OCT4 | ↑ | Promotes T cell stemness | Enhances memory T cell potential | Minimal effect | |
| PROX1 | ↓ | Affects T cell migration | Regulates memory T cell localization | Minimal effect | |
| GCM1 | ↑ | Modulates T cell function | Minimal effect | Minimal effect | |
| PGC1α | ↑↑ | Enhances metabolic fitness and function | Critical for memory T cell formation and maintenance | Supports Treg metabolic adaptation | |
| Nrf2 | ↓ | Reduced antioxidant response | May affect memory T cell longevity | Minimal effect | |
| FOXJ1 | ↑ | Modulates T cell function | Minimal effect | May affect Treg function | |
| TFEB | ↓ | Reduced autophagy and metabolism | May affect memory T cell survival | Minimal effect | |
| cMyc | ↑ | Promotes T cell proliferation and effector function | Inhibits memory T cell formation | Minimal effect | |
| p53 | ↑↑ | Regulates T cell survival and apoptosis | May affect memory T cell quality | Regulates Treg stability | |
| p63 | ↑ | Modulates T cell development | Minimal effect | Minimal effect | |
| SIM1 | ↑ | Modulates T cell metabolism | Minimal effect | Minimal effect | |
| FOXM1 | ↓ | Reduced T cell proliferation | May affect memory formation | Minimal effect | |
| CTCF | ↓ | Altered gene expression patterns | May affect memory T cell epigenetics | Minimal effect | |
| MITF | ↓/↑ | Modulates T cell function | Minimal effect | Minimal effect | |
| HIF | ↑ | Enhances T cell function in hypoxia | May affect memory T cell metabolism | Supports Treg function in tissues | |
| MYOD1 | ↓ | Minimal direct effect on T cells | Minimal effect | Minimal effect | |
| PPARγ | ↑↑↑ | Promotes metabolic reprogramming | Supports memory T cell metabolism | Critical for Treg function and suppression | |
Legend: ↑ = Upregulated fold change >1.5. ↑↑ = Highly upregulated fold change >5. ↑↑↑ = Very highly upregulated fold change >10. ↓ = Downregulated fold change <0.7. ↑/↓ = Variable regulation depending on concentration.
Disclaimer/Publisher’s Note: The statements, opinions and data contained in all publications are solely those of the individual author(s) and contributor(s) and not of MDPI and/or the editor(s). MDPI and/or the editor(s) disclaim responsibility for any injury to people or property resulting from any ideas, methods, instructions or products referred to in the content. |
© 2025 by the author. Licensee MDPI, Basel, Switzerland. This article is an open access article distributed under the terms and conditions of the Creative Commons Attribution (CC BY) license (https://creativecommons.org/licenses/by/4.0/).
Copyright: This open access article is published under a Creative Commons CC BY 4.0 license, which permit the free download, distribution, and reuse, provided that the author and preprint are cited in any reuse.


