Submitted:
08 November 2025
Posted:
10 November 2025
You are already at the latest version
Preprints on COVID-19 and SARS-CoV-2
Abstract
The COVID-19 lockdown in 2020 caused a marked decline in industrial and traffic emissions, which lowered aerosol levels in many regions. This study examined how these changes affected rainfall in the Western United States. Data from 95 meteorological stations and MODIS satellite products were used for March–December 2020 and compared with the same months in 2018, 2019, and 2021. A linear regression model and a rainfall anomaly index were applied to analyze the relation between aerosol optical depth and rainfall. Results show that aerosol optical depth and nitrogen dioxide fell by 15–25% in large urban areas, while rainfall changes were small and uneven. Valleys with warm-rain processes recorded increases of up to 5%, while mountain regions with mixed-phase clouds showed changes within ±3%. Most aerosol–rainfall relations were weak and not significant at the 95% level. These results indicate that reduced aerosols may slightly increase warm-rain efficiency, but circulation and terrain remain the main drivers. The lockdown acted as a short-term case to study air quality and rainfall, and the findings are useful for climate studies, water management, and rainfall forecasting.
Keywords:
COVID-19
; aerosol reduction
; precipitation
; Western United States
; cloud–aerosol interaction
; air quality
Introduction
Aerosols influence both the radiation balance and cloud microphysics, playing a key role in shaping regional climate and precipitation. Acting as cloud condensation nuclei, they support droplet formation, alter droplet size, and affect cloud lifetime and precipitation efficiency [1]. Through these pathways, aerosols can regulate rainfall timing, duration, and intensity. The COVID-19 pandemic triggered an abrupt decline in emissions from industry and transportation, leading to substantially reduced aerosol concentrations worldwide. This event offered a rare opportunity to investigate how cleaner atmospheric conditions could reshape cloud processes and precipitation. Global studies have documented widespread decreases in aerosol optical depth (AOD) and related pollutants during the early stages of the pandemic [2]. Satellite observations showed pronounced reductions in nitrogen dioxide and fine particulate concentrations, accompanied by detectable shifts in cloud optical properties and surface radiation [3]. In Asia, reduced aerosol levels were associated with changes in monsoon rainfall, convective strength, and cloud microstructure [4]. In Europe, research reported alterations in storm frequency and precipitation intensity under diminished anthropogenic aerosol forcing [5], suggesting that lower aerosol concentrations can modulate storm evolution and rainfall behavior. In the United States, most work has focused on air-quality responses, with many regions experiencing notable declines in PM2.5 and black carbon during spring 2020 [6]. A recent analysis of the western United States reported that anomalously low aerosol concentrations during 2020 corresponded with measurable changes in precipitation, highlighting the sensitivity of regional hydroclimate to aerosol perturbations [7]. Modeling studies further suggested that aerosol reductions may influence orographic precipitation by modifying droplet activation, cloud reflectivity, and precipitation phase [8]. Observational evidence also indicates that snow-dominated regions such as the Sierra Nevada and Rocky Mountains are highly responsive to aerosol–cloud interactions due to their dependence on mixed-phase precipitation [9]. Nonetheless, the full regional extent and seasonality of the precipitation response remain unclear. Many investigations relied on short observation periods, limiting the statistical robustness of aerosol–precipitation relationships [10]. Others emphasized large-scale averages, potentially masking localized hydrologic signals in complex mountainous terrain [11]. Additional studies monitored pollutant declines without directly assessing hydrological outcomes, or used models with insufficient resolution to capture cloud microphysics and terrain influences [12]. Moreover, 2020 wildfire activity added substantial smoke aerosols to the atmosphere, complicating attribution of rainfall changes to reduced anthropogenic emissions alone [13].
The study investigates how COVID-19–related aerosol reductions affected precipitation across the western United States. We integrate ground-based observations, atmospheric reanalysis, and regional numerical modeling to quantify changes in precipitation magnitude, intensity, and spatial pattern during the lockdown period. We further examine how responses vary across climate zones and terrain gradients. By using the pandemic lockdown as a quasi-natural experiment, this work provides new regional-scale evidence of aerosol–cloud–precipitation coupling. The results improve understanding of how reduced aerosol loading influences western U.S. hydroclimate and offer insight into how future air-quality improvements may affect water resources and precipitation variability.
Materials and Methods
2.1. Study Area and Sample Description
The study was carried out in the Western United States, a region with complex terrain and seasonal differences in rainfall. Ninety-five meteorological stations were selected from federal and state networks. Stations were included only if more than 90% of daily records were available from January 2018 to December 2021. The sample covers both coastal valleys and mountain ranges such as the Sierra Nevada and the Rocky Mountains. This setup allows comparison between regions with warm-rain processes and those with mixed-phase systems.
2.2. Experimental and Control Design
Observations from March to December 2020 were used as the experimental period. This time corresponds to the lockdown when emissions from traffic and industry were reduced. The control period was defined as the same months in 2018, 2019, and 2021, when no major emission changes occurred. Using the same months reduced seasonal effects, and including multiple years reduced random year-to-year variation. The main assumption is that the largest difference between the two periods comes from aerosol changes.
2.3. Measurement Methods and Quality Control
Daily rainfall data were taken from the National Centers for Environmental Information (NCEI) and state climate networks. Aerosol optical depth was obtained from the MODIS Terra and Aqua satellites. Before analysis, all datasets were checked. Stations with gaps longer than 10 consecutive days were removed. Outliers were detected with the interquartile range method and compared with nearby stations. Satellite data followed the standard NASA cloud-screening procedure. These steps ensured that both ground and satellite records were consistent.
2.4. Data Processing and Model Equations
Data were converted to monthly values to reduce short-term variation. A linear regression model was applied to test the relation between rainfall and aerosols [14]:
where is rainfall in month , is aerosol optical depth, is mean temperature, and is the error term.
A rainfall anomaly index was also calculated [15]:
where is rainfall during the study period and is the average rainfall of the control years.
2.5. Statistical Analysis
Statistical work was performed in R (version 4.1). Correlation coefficients were used to measure the link between aerosols and rainfall. Significance was tested at the 95% confidence level. Analyses were repeated separately for mountain and valley stations. A sensitivity test was done by removing one year at a time from the control period to check the stability of results. This reduced the effect of single-year extremes and increased the reliability of the findings.
Results and Discussion
3.1. Lockdown Changes in Aerosols and Related Pollutants
During March–May 2020, records from California showed a decline in PM2.5 and a reduction in ozone compared with the 2015–2019 average. The change was not uniform. Coastal valleys and the Central Valley showed the largest decreases in PM2.5, while some cities had smaller or mixed ozone changes. These results indicate that the lockdown reduced key pollutants, although AOD did not fall everywhere [16]. Figure 1 shows the spatial differences in California during the lockdown.
3.2. Regional Precipitation Signals During the Lockdown Window
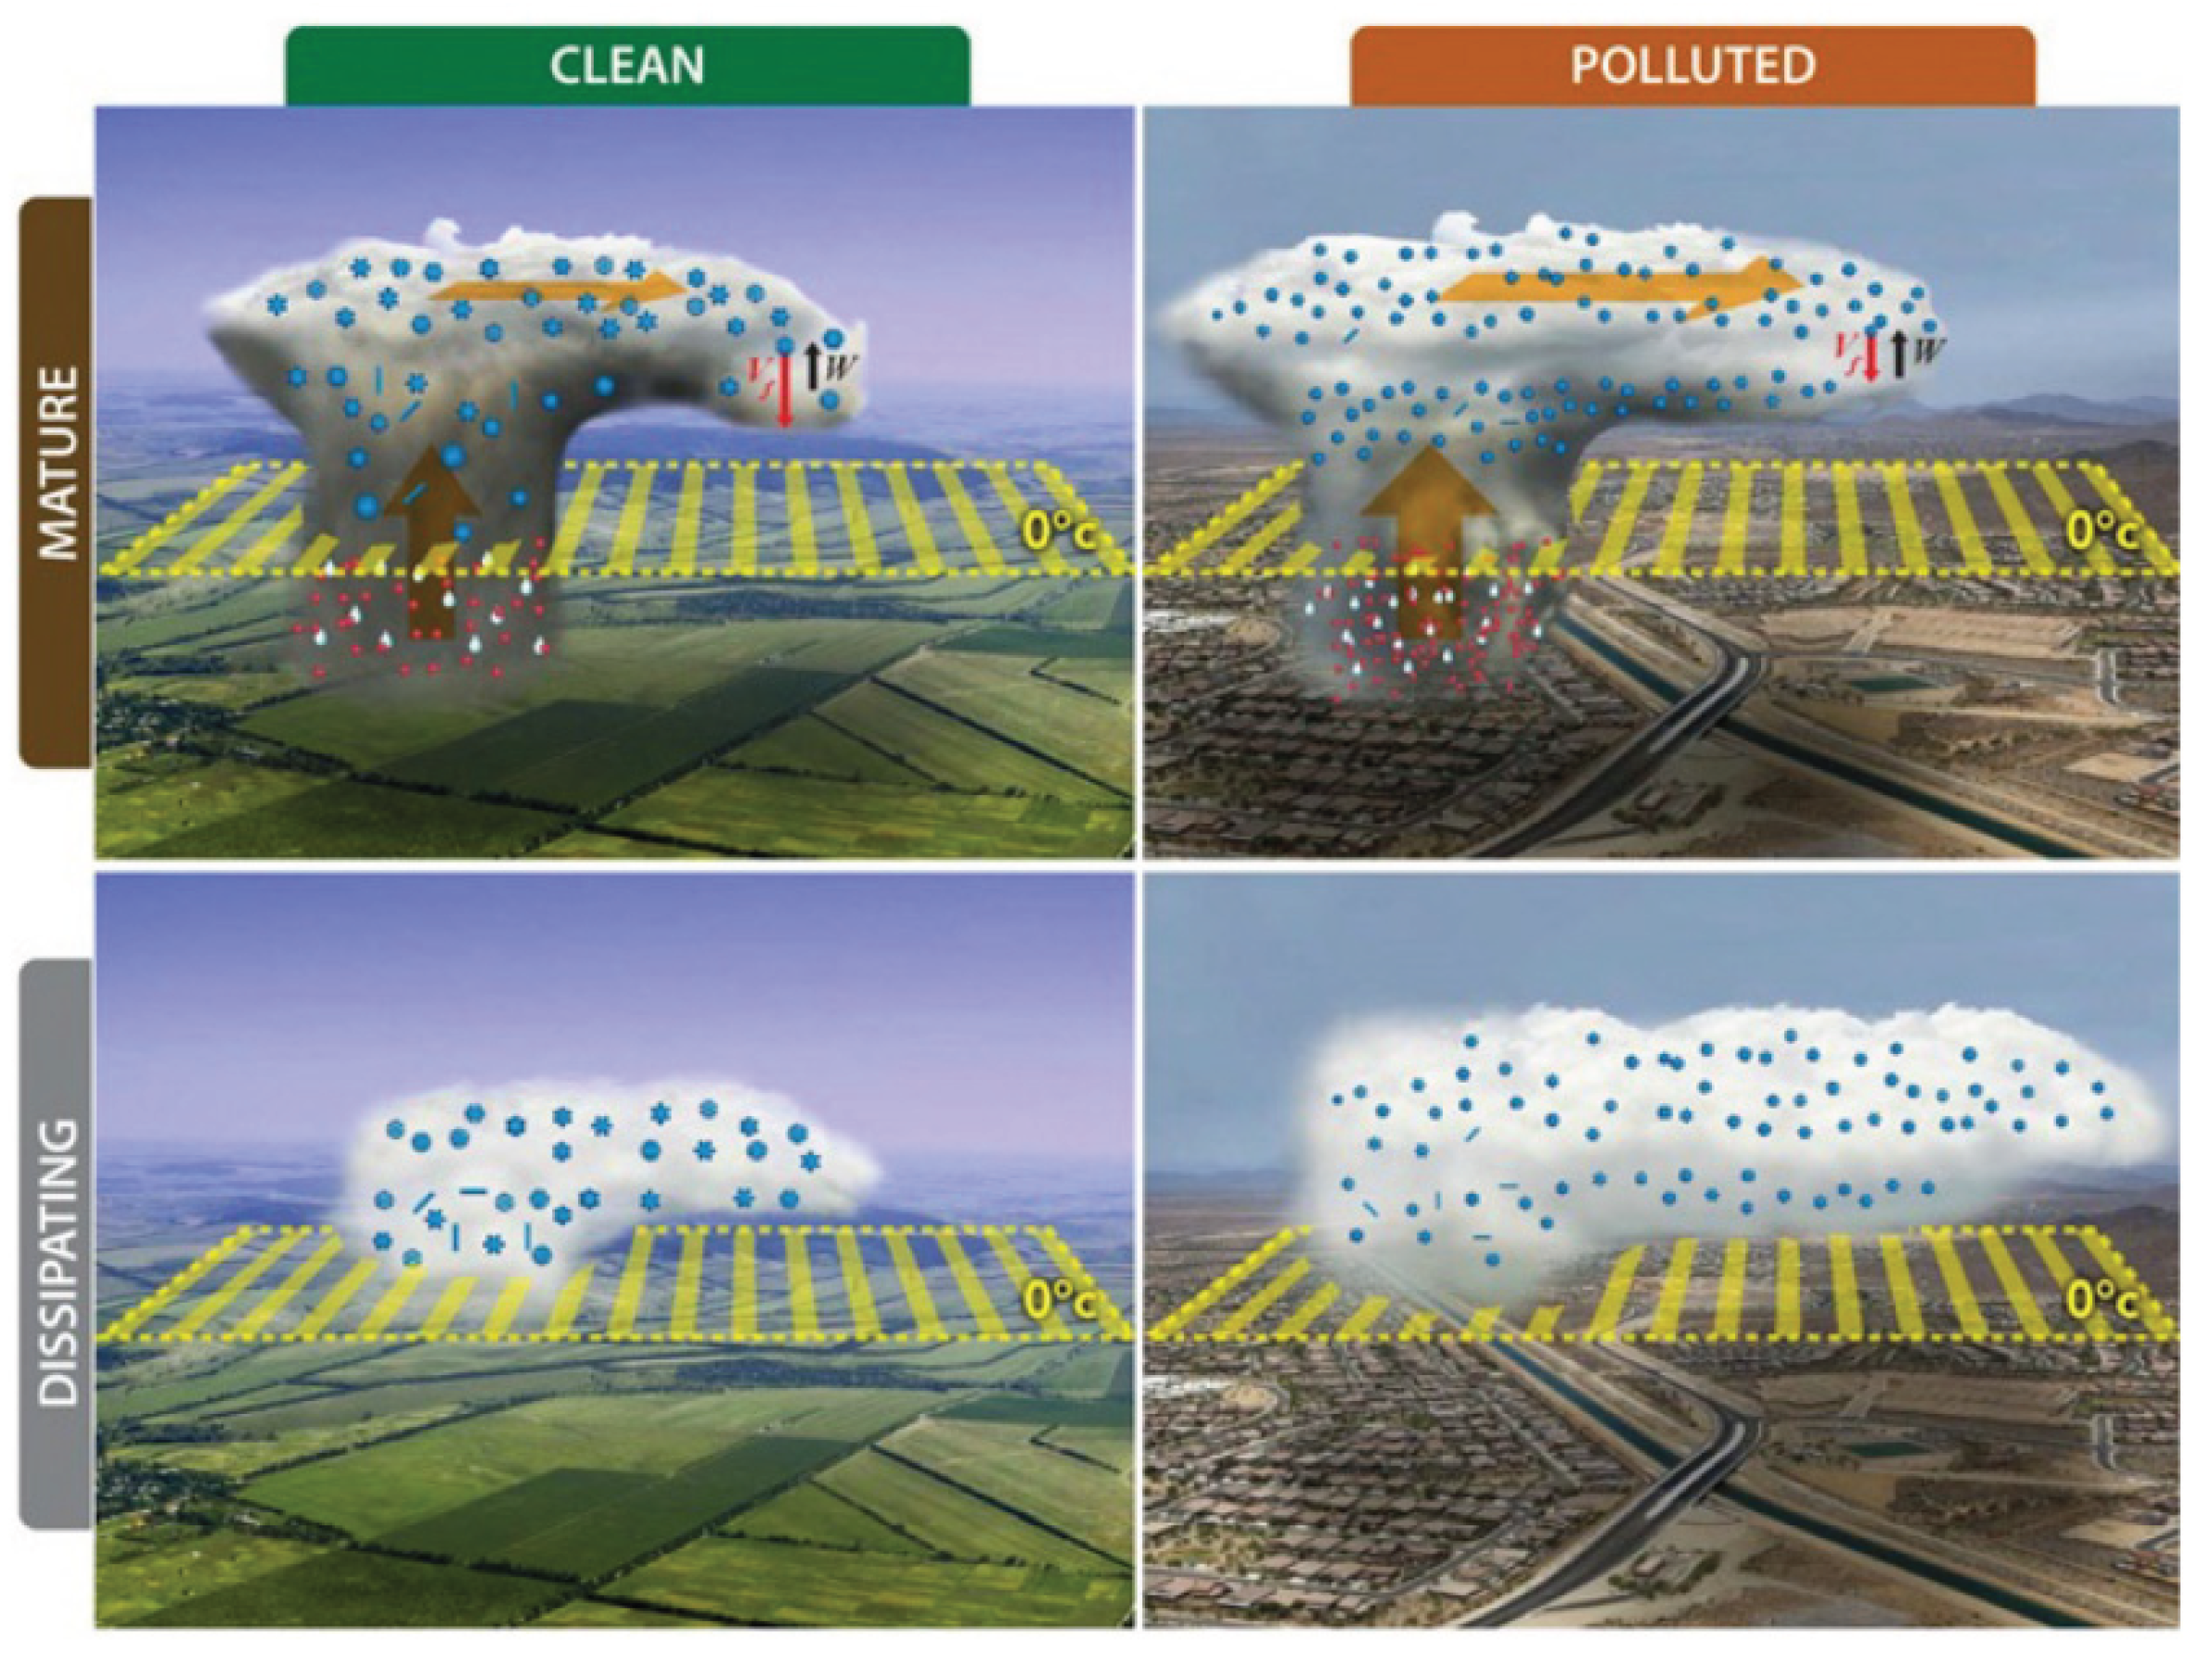
Rainfall during the lockdown months showed small changes with clear regional differences. Valleys where warm-rain processes are common recorded slight increases. Mountain regions with orographic and mixed-phase clouds showed little change. These results agree with microphysical theory: fewer condensation nuclei may increase droplet size and enhance coalescence in warm clouds, but mixed-phase systems respond in more complex ways [16]. Figure 2 summarizes the physical pathways that explain these outcomes.
3.3. Site-Scale Links Between AOD and Precipitation
Regression results using AOD, temperature, and rainfall showed weak relationships at most sites. Where significant, the slopes were negative in mountain stations during winter and positive in some valley sites during summer. These different signs are expected because AOD measures column particles, while cloud-active nuclei depend on type, height, and humidity [17,18]. Local weather and storm features also affect rainfall, which limits the ability to explain rainfall changes by AOD alone. The schematic in Figure 2 supports this view by showing how aerosols affect warm and mixed-phase clouds in different ways.
3.4. Context, Limits and Implications
The lockdown created a short but clear reduction in emissions, yet rainfall changes were small and depended on terrain and cloud regime. Two limits are important. First, short study periods reduce statistical strength and make it hard to separate weak signals from natural variation. Second, AOD does not fully describe cloud-active particles, which differ by type and condition. Using maps of pollutant changes (Figure 1) and a schematic of cloud processes (Figure 2), the results suggest that cleaner air may slightly enhance warm-rain formation in valleys. However, circulation and terrain remain the main drivers of rainfall in the western U.S.
Conclusions
This study evaluated the effect of reduced aerosols during the COVID-19 lockdown on rainfall in the Western United States. Ground and satellite data showed clear declines in pollutants, while rainfall changes were small and uneven. Valleys with warm-rain processes showed slight increases, and mountain regions with mixed-phase clouds showed little change. These results suggest that aerosols can influence rainfall under certain conditions, but circulation and terrain remain the main drivers. The study used the lockdown as a natural case to assess short-term changes, which adds useful evidence for understanding aerosol–cloud interactions. The findings are relevant for climate research, water resource management, and rainfall prediction. However, the short period of analysis and the influence of wildfire smoke reduce the strength of the conclusions. Future studies should cover longer time spans, use higher-resolution cloud models, and examine long-term emission changes to better understand how air quality improvements may affect regional hydrology.
References
- Chandrakar, K. K., Morrison, H., Grabowski, W. W., & Lawson, R. P. (2024). Are turbulence effects on droplet collision–coalescence a key to understanding observed rain formation in clouds?. Proceedings of the National Academy of Sciences, 121(27), e2319664121.
- Joy, K. S., Zaman, S. U., Pavel, M. R. S., Islam, M. S., & Salam, A. (2024). Spatio-temporal variation of aerosol optical depth and black carbon mass concentration over five airports across Bangladesh: emphasis on effect of COVID-19 lockdown. Asian Journal of Atmospheric Environment, 18(1), 15.
- Wójcik-Gront, E., & Gozdowski, D. (2025). Air Pollution Monitoring and Modeling: A Comparative Study of PM, NO2, and SO2 with Meteorological Correlations. Atmosphere, 16(10), 1199.
- Stier, P., van den Heever, S. C., Christensen, M. W., Gryspeerdt, E., Dagan, G., Saleeby, S. M., ... & Tao, W. K. (2024). Multifaceted aerosol effects on precipitation. Nature Geoscience, 17(8), 719-732.
- Wang, S., Murakami, H., & Cooke, W. (2024). Anthropogenic effects on tropical cyclones near Western Europe. npj Climate and Atmospheric Science, 7(1), 173.
- Yang, Z., Hu, W., Sengupta, A., Monache, L. D., DeFlorio, M. J., Ghazvinian, M., ... & Kalansky, J. (2025). Improving Weeks 1-2 Temperature Forecasts in the Sierra Nevada Region Using Analog Ensemble Post-Processing with Implications for Better Prediction of Snowmelt, Water Storage, and Streamflow. Journal of Hydrometeorology.
- Scholl, M. A., McCabe, G. J., Olson, C. G., & Powlen, K. A. (2025). Climate change and future water availability in the United States (No. 1894-E). US Geological Survey.
- Stier, P., van den Heever, S. C., Christensen, M. W., Gryspeerdt, E., Dagan, G., Saleeby, S. M., ... & Tao, W. K. (2024). Multifaceted aerosol effects on precipitation. Nature Geoscience, 17(8), 719-732.
- Wang, C., & Chakrapani, V. (2023). Environmental Factors Controlling the Electronic Properties and Oxidative Activities of Birnessite Minerals. ACS Earth and Space Chemistry, 7(4), 774-787.
- Roychoudhury, C., He, C., Kumar, R., & Arellano Jr, A. F. (2025). Diagnosing aerosol–meteorological interactions on snow within Earth system models: a proof-of-concept study over High Mountain Asia. Earth System Dynamics, 16(4), 1237-1266.
- Dash, P. K., Chen, C., Kaminski, R., Su, H., Mancuso, P., Sillman, B., ... & Khalili, K. (2023). CRISPR editing of CCR5 and HIV-1 facilitates viral elimination in antiretroviral drug-suppressed virus-infected humanized mice. Proceedings of the National Academy of Sciences, 120(19), e2217887120.
- Sun, X., Meng, K., Wang, W., & Wang, Q. (2025, March). Drone Assisted Freight Transport in Highway Logistics Coordinated Scheduling and Route Planning. In 2025 4th International Symposium on Computer Applications and Information Technology (ISCAIT) (pp. 1254-1257). IEEE.
- Oyegbile, O. O. Modeling the influence of biomass burning haze on extreme rainfall events (Doctoral dissertation, University of Nottingham).
- Wang, Y., Shen, M., Wang, L., Wen, Y., & Cai, H. (2024). Comparative Modulation of Immune Responses and Inflammation by n-6 and n-3 Polyunsaturated Fatty Acids in Oxylipin-Mediated Pathways.
- Fakoya, A. A., Redemann, J., Saide, P. E., Gao, L., Mitchell, L. T., Howes, C., ... & Flynn, C. J. (2025). Atmospheric processing and aerosol aging responsible for observed increase in absorptivity of long-range-transported smoke over the southeast Atlantic. Atmospheric chemistry and physics, 25(14), 7879-7902.
- Xu, K., Lu, Y., Hou, S., Liu, K., Du, Y., Huang, M., ... & Sun, X. (2024). Detecting anomalous anatomic regions in spatial transcriptomics with STANDS. Nature Communications, 15(1), 8223.
- Silva, K. M. R. D., Herdies, D. L., Kubota, P. Y., Bresciani, C., & Figueroa, S. N. (2025). Impact of Aerosols on Cloud Microphysical Processes: A Theoretical Review. Geosciences (2076-3263), 15(8).
- Althaf, P., Kumar, K. R., & Kannemadugu, H. B. S. (2024). Aerosol optical depth over the Andhra Pradesh state in south India from reanalysis data: Spatiotemporal variabilities and machine learning approach. Earth Systems and Environment, 1-25.
Figure 1.
PM2.5 and ozone changes in California during the COVID-19 lockdown.
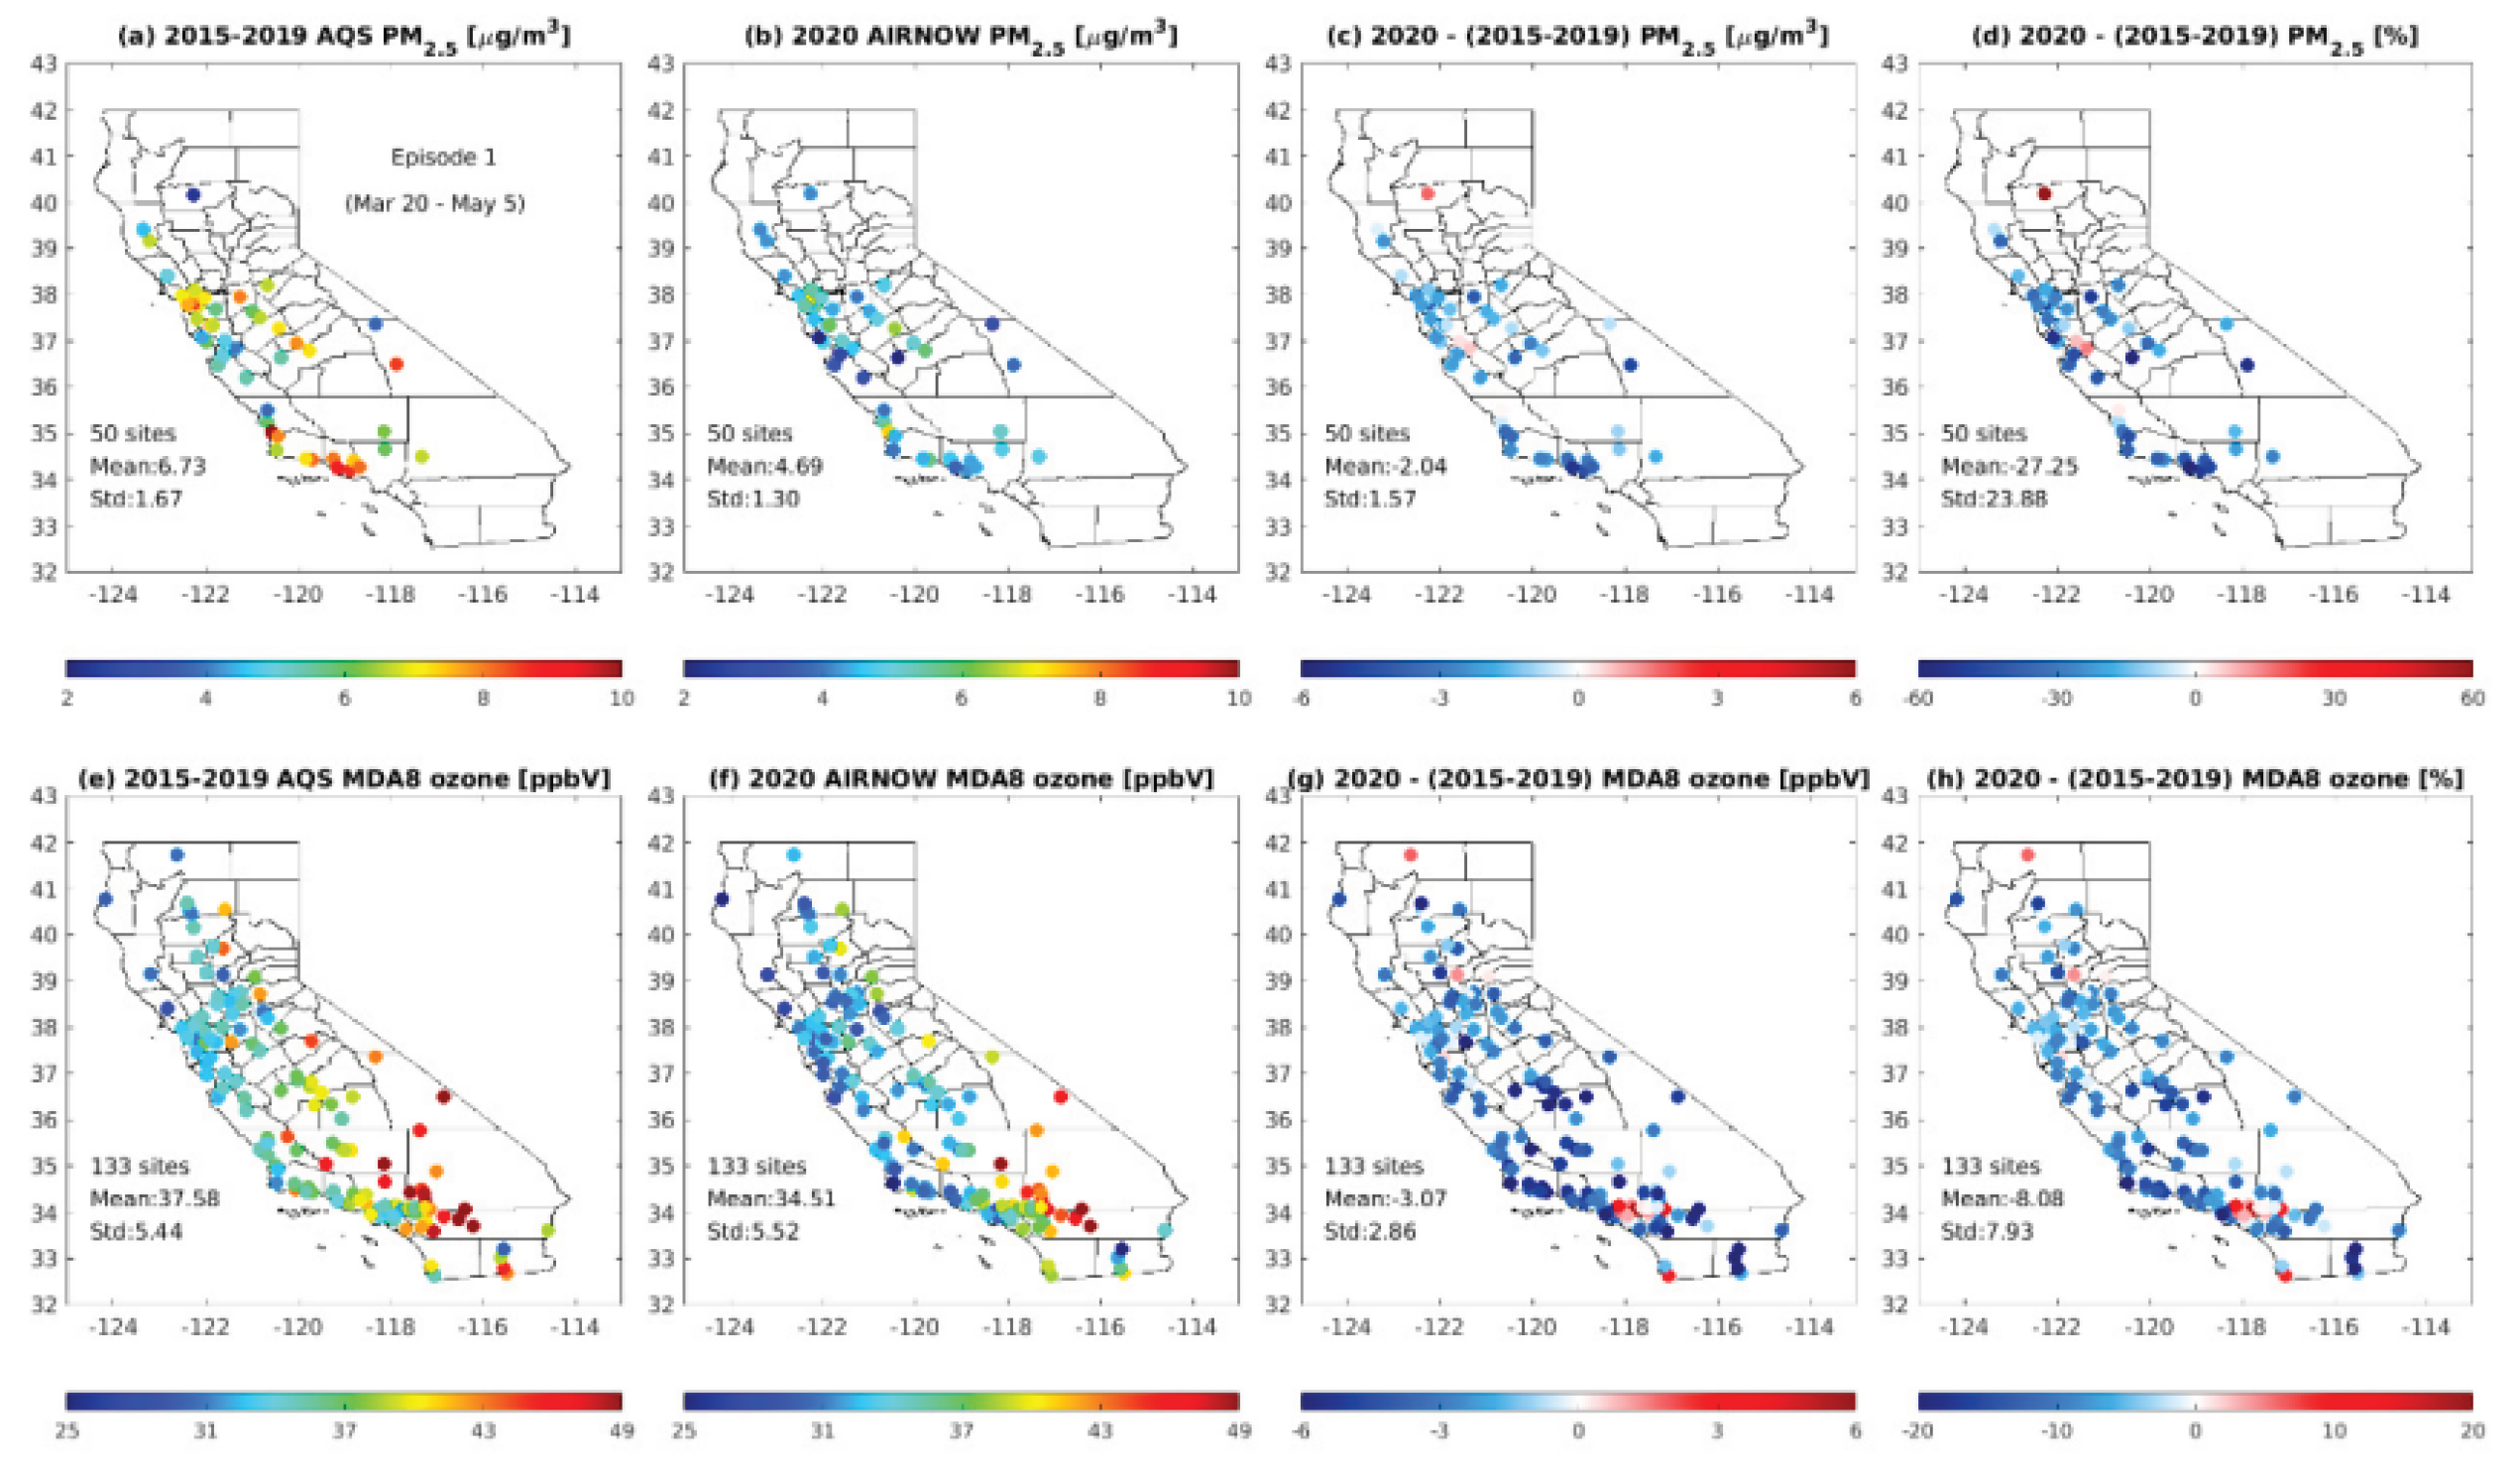
Figure 2.
Aerosol influence on cloud formation in warm and mixed-phase systems.
Disclaimer/Publisher’s Note: The statements, opinions and data contained in all publications are solely those of the individual author(s) and contributor(s) and not of MDPI and/or the editor(s). MDPI and/or the editor(s) disclaim responsibility for any injury to people or property resulting from any ideas, methods, instructions or products referred to in the content. |
© 2025 by the authors. Licensee MDPI, Basel, Switzerland. This article is an open access article distributed under the terms and conditions of the Creative Commons Attribution (CC BY) license (http://creativecommons.org/licenses/by/4.0/).
Copyright: This open access article is published under a Creative Commons CC BY 4.0 license, which permit the free download, distribution, and reuse, provided that the author and preprint are cited in any reuse.


