
Submitted:
10 November 2025
Posted:
11 November 2025
You are already at the latest version
Abstract
This study presents a one-dimensional numerical simulation of particulate matter (PM) oxidation and regeneration behavior in gasoline particulate filters (GPFs) under Worldwide Harmonized Light Vehicles Test Cycle (WLTC) conditions. The model incorporates both catalyst activity—represented by activation energy (E) and pre-exponential factor (A)—and exhaust control strategies involving forced fuel cut (FC). PM deposition and oxidation were simulated based on solid-state and gas-phase reactions, with the effects of oxygen concentration and temperature analyzed in detail. The results show that under high catalyst activity (E = 100 kJ mol⁻¹, A = 6.2 × 10⁷), PM oxidation proceeds efficiently even during medium-speed phases, achieving a 98.8% oxidation rate after one WLTC cycle. Conversely, conventional catalysts (E = 120 kJ mol⁻¹, A = 6.2 × 10⁶) exhibited limited regeneration, leaving 0.11 g of residual PM. Introducing forced FC effectively enhanced oxidation by increasing oxygen concentration to 20% and sustaining heat release. A single continuous 100-s FC yielded the highest oxidation (96% reduction), while split FCs reduced peak PM accumulation. These findings demonstrate that optimizing the balance between catalyst activity and FC control can significantly improve GPF regeneration performance, providing a practical strategy for PM reduction in GDI vehicles under real driving conditions.
Keywords:
gasoline particulate filter (GPF)
; particulate matter (PM) oxidation
; one-dimensional simulation
; catalyst activity
; forced fuel cut (FC)
; WLTC
; Euro 7 emission regulation
1. Introduction
In recent years, gasoline vehicles—both port fuel injection (PFI) and gasoline direct injection (GDI)—have advanced in a way that simultaneously improves fuel economy and power output. In particular, GDI increases freedom in combustion control by injecting fuel directly into the chamber, enabling higher compression ratios and lean operation that raise thermal efficiency and torque. At the same time, growing concern over ultrafine particle exposure has prompted regulatory tightening: Euro 7 requires all spark-ignition (i.e., gasoline) cars and vans to meet particulate matter (PM) mass and particle-number limits down to 10 nm (PN10). This scope now includes PFI, which had been exempt from PN limits under Euro 6. However, the direct-injection configuration is especially prone to wall impingement and ignition-delay-related incomplete combustion, increasing the propensity for carbonaceous residues and hence particulate matter (PM) formation. As a result, GDI applications have seen accelerated deployment and study of gasoline particulate filters (GPF) and related control strategies; with Euro 7, particle control is mandated across all gasoline technologies, not only GDI[1,2].
Accordingly, while Euro 7 mandates particle control across all gasoline technologies, we focus next on the GDI-dominant pathways of PM formation and on GPF-based regeneration under WLTC-representative oxygen and temperature windows. The amount of PM emitted from GDI vehicles is reported to be significantly higher than that from conventional port fuel injection gasoline vehicles—up to 28 times higher under the JC08 cold mode and 170 times higher under the JC08 hot mode [3]. Furthermore, PM generated from GDI engines is primarily in the size range of 10–70 nm [4], which is smaller than PM from diesel engines. These nanosized particles can penetrate the human body via the respiratory tract, potentially affecting the alveoli and cardiovascular system. Thus, PM emissions from GDI engines have attracted attention as a new environmental and health risk.
Against this background, regulations on particulate matter (PM) emissions from gasoline vehicles have been increasingly tightened, particularly in Europe. In response, the installation of Gasoline Particle Filters (GPF) is being promoted as a countermeasure. GPFs are wall-flow filters with a structure similar to Diesel Particle Filters (DPF). They filter exhaust gases through porous ceramics, capturing, storing, and oxidizing PM.
As shown in Figure 1, a GPF consists of ceramic channels that are alternately sealed at one end. Exhaust gases enter through the inlet channels and pass through the porous walls, where PM is trapped on the wall surface, and only the cleaned gas is discharged through the outlet channels. As PM accumulates, it clogs the pores and wall surfaces, increasing the pressure drop (ΔP) between the inlet and outlet, which may negatively affect engine performance and fuel economy. Therefore, a “regeneration process” is required regularly to burn off and remove the accumulated PM.
The primary component of PM is carbon, which, in principle, can be oxidized under atmospheric conditions with 20 % oxygen at temperatures above 650 ℃. However, the oxygen concentration and temperature of GDI exhaust gases vary greatly depending on the engine combustion state and the configuration of the three-way catalyst (TWC), and conditions suitable for GPF regeneration are not always achieved[3,4,5,6,7,8,9].
For example, when the GPF is installed downstream of the TWC, the exhaust gas flows under a reducing atmosphere at relatively low temperatures of 250–500 °C. In contrast, when the TWC and GPF are integrated into a single purification unit, the temperature can rise to around 700 °C [10], indicating that the exhaust system design plays a crucial role in achieving effective regeneration.
Moreover, oxygen concentration in the exhaust also fluctuates significantly. As shown in Figure 2, under the Worldwide Harmonized Light Vehicles Test Cycle (WLTC) mode, the oxygen concentration reaches 20 % during fuel cut (FC) events; however, this high-oxygen period lasts only a few to several seconds. For most of the remaining driving cycle, the oxygen concentration remains below 1 %, indicating a low-oxygen environment. Thus, opportunities where both high temperature and high oxygen conditions are necessary for PM oxidation are simultaneously satisfied and extremely limited.
To address these challenges, our earlier work [6,7,8,9,10,11,12,13,14,15,16] analyzed PM oxidation using a rate-equation model. Building on that framework, the present study extends the analysis to clarify the effects of activation energy (ΔE) and pre-exponential factor (A) on PM oxidation performance (Figure 3). The results indicate that the oxidation reaction does not proceed effectively under conventional catalyst properties (e.g., ΔE = 120 kJ mol⁻¹, A = 6.2 × 10⁶), leaving PM within the filter. In contrast, when the activation energy is reduced to approximately 100 kJ mol⁻¹, oxidation progresses under certain conditions—such as the high-speed phase of the WLTC—leading to a significant reduction in residual PM. Additionally, the effect of oxygen concentration on oxidation behavior was investigated. Consistent with our previous numerical analysis (ref 4), the model predicts that at 1 % oxygen, the decrease in PM is gradual, whereas at 20 % oxygen, rapid oxidation occurs within about 10 seconds, leading to substantial PM removal (Table 1). These findings confirm that even a short period of high oxygen exposure can significantly promote PM oxidation.
In this study, as an alternative approach that does not rely on conventional catalyst performance, we investigate, based on the hypothesis that PM oxidation can be promoted by intentionally introducing high-oxygen conditions through forced fuel cut (forced FC), the impact of this strategy on regeneration performance via numerical analysis. Specifically, forced FC events were introduced once, three times, or five times in each speed phase (low, medium, and high) of the WLTC mode, with the total duration of high-oxygen conditions set to 100 seconds. The effect of oxidation temperature (700 ℃ and 800 ℃) was also evaluated.
This study aims to determine whether GPF regeneration can be improved through appropriate engine control (fuel cut), even under limited catalyst performance. Furthermore, we aim to elucidate the interaction between catalyst characteristics (ΔE) and operational conditions (FC introduction), and to propose an optimal balance between material design and control strategy for effective PM regeneration.
2. Calculation Model
In this study, numerical calculations were conducted using a GPF-specific numerical model developed in previous studies [11,12,13,14,15,16,17,18,19,20,21]. The computational model is described below.
A schematic diagram of the GPF is shown in Figure 4(a), and its cross-sectional view is shown in Figure 4(b). The GPF is assumed to be a cylindrical shape with diameter D and length L, and it is discretized into n equally spaced cells along the axial direction (x-direction). Figure 4 (a) illustrates that each cell is divided into three regions: the inlet channel, the filter wall, and the outlet channel. The thickness direction (y-direction) inside the filter wall is also discretized into n equally spaced segments.
2.1. Exhaust Gas Flow in the Axial Direction (x-Direction) of the GPF
This section explains the exhaust gas flow along the axial direction (x-direction) of the GPF. As shown in Figure 4(b), the total exhaust gas flow rate entering the GPF is denoted as ΣFi [m³/s], and this total flow is divided among n cells according to the following equation:
The flow rate in each cell, Fᵢ, is defined as:
Here, Fₙᵢ [m³/s] is the flow rate in the i-th cell, vₙᵢ [m/s] is the velocity, and σ [m²] is the cross-sectional area through which the fluid passes. The pressure drop is expressed as:
where λ is the pipe friction coefficient, LWP+PM is the flow length [m], Dwalls is the wall diameter [m], v is the average velocity [m/s], and ρ is the fluid density [kg/m³].In the initial PM deposition stage (i.e., during the first deposition starting from a clean state), the exhaust gas containing PM is assumed to be distributed equally across all cells. Furthermore, when the gas flows in the y-direction (into the filter wall), the pressure is assumed to be uniform across all cells. The calculation is fundamentally carried out for the i-th cell, and the result is sequentially passed on to the next cell, i+1. The following sections describe PM deposition within the GPF wall, temperature handling, PM oxidation, and the location of the oxidation reaction.
2.2. PM Deposition Within the GPF Wall
This section describes PM deposition behavior within the GPF wall. According to previous studies, shortly after the start of PM accumulation, PM begins to bridge at tens of micrometers from the wall surface, and subsequent deposition occurs only on the surface rather than throughout the entire wall thickness. In addition, it has been reported that porosity changes in the direction from the wall surface toward the interior[22,23]. Therefore, this study assumes that the PM deposition rate decreases exponentially with depth from the surface toward the interior of the wall (Figure 5).
2.3. Treatment of Temperature
First, it is assumed that there is no heat transfer between PM particles and that during PM oxidation, the temperature of the gas and that of the PM particles are the same. Furthermore, the effects of radiation and convection during PM oxidation are neglected. This can be attributed to the fact that PM particles are typically on the order of a few micrometers and are sparsely distributed in the gas phase. Based on these assumptions, the treatment of heat is described as follows. The heat capacity Q [J/K] of a single computational cell is given by:
Here, Vd [mL] is the deposited volume, S [mol] is the amount of gas passing through, μ is the permeability of the GPF wall, Cc [J/(g·K)] is the specific heat of the wall material (cordierite), dc [kg/m³] is the density of the wall material, and Cg [J/(g·K)] is the specific heat of the exhaust gas. The amount of PM reacted, Rpm [mol], is calculated as:
The corresponding temperature rise due to the reaction, ΔT [°C], is expressed as:
It is assumed that PM particles maintain this temperature after the reaction. The gas also maintains this temperature as it flows from one cell to the next. Upon entering the next cell, the wall temperature on the gas-inlet side is assumed to be the same as the gas temperature. When the gas temperature is high, the corrected temperature is given by:
where TR [°C] is the corrected temperature, Tw [°C] is the wall temperature, and TPM [°C] is the combustion temperature of PM. In the y-direction, between unit cells j and j+1, temperature changes due to PM oxidation are considered (Figure 5(b)). If PM is present, oxidation results in heat generation and a rise in the gas temperature. If PM is absent, the gas temperature decreases. In the x-direction, heat accumulation between unit cells i and i+1 is expected to lead to a temperature rise due to PM oxidation.
2.4. PM Oxidation
The PM oxidation process is assumed to be a first-order complete combustion reaction involving carbon components only, expressed as:
The rate of PM oxidation per unit time is given by:
where A [m³/(mol·s)] is the pre-exponential factor, PM [mol] is the amount of PM, E [kJ/mol] is the activation energy, R [J/(K·mol)] is the gas constant, and T [K] is the absolute temperature.
2.5. Catalytic Reaction and Gas-Phase O₂ Reaction
In reality, as shown in Figure 5, two types of PM oxidation occur:
- Solid-state reaction (SSR), where PM reacts in contact with the catalyst
- Gas-phase reaction (GPR), where PM is not in contact with the catalyst, reacts with gaseous oxygen
Therefore, this study adopts a catalytic reaction model that divides the PM regeneration process in more detail (refs. 13–21). The activation energies and pre-exponential factors used in the numerical calculations for SSR and GPR in this study (as shown in Figure 6 and summarized in Table 1) were selected based on previously reported values. Specifically, the SSR values were referenced from references 20 - 22, while the GPR values were estimated using TG-DTA measurements following the method described in reference 23. The activation energies for SSR were set to 105, 110, 115, and 120 kJ/mol. The pre-exponential factor A was set to 6.2 × 10⁷ when the GPF was fully coated with catalyst, and 6.2 × 10⁶ when it was not fully coated. For GPR, values were obtained using thermogravimetric–differential thermal analysis (TG-DTA) experiments by estimating the shape factor. The SSR parameters were referenced from prior studies [24,25,26,27].

Table 2.
The frequency factor and activation energy for SSR and GPR.
| Frequency factor: A | Activation energy: E [kJ/mol] | |
| SSR | 6.2×10⁷, 6.2×10⁶ | 100, 120 |
| GPR | 2×10⁹ | 195 |
3. Results
3.1. Effect of Activation Energy ΔE on PM Oxidation Performance
This section evaluates the influence of catalyst activity on PM oxidation performance within the GPF, and the limitations of catalyst performance and the necessity of complementary engine control strategies are discussed. Numerical simulations were conducted under four conditions with activation energy (E) set to 100 and 120 kJ/mol, and pre-exponential factor (A) set to 6.2 × 10⁶ and 6.2 × 10⁷, respectively, over one WLTC cycle (1800 seconds). The PM inflow rate was set at 0.5 g/h, assuming a total PM introduction of 0.25 g. Figure 7 shows the temporal variation in PM accumulation. The periods from 0–600 s, 600–1200 s, and 1200–1800 s correspond to low-speed, medium-speed, and high-speed modes, respectively. The blue solid line represents the case with E = 120 kJ/mol and A = 6.2 × 10⁶; the blue dashed line corresponds to E = 100 kJ/mol and A = 6.2 × 10⁶; the red solid line shows E = 120 kJ/mol and A = 6.2 × 10⁷; and the red dashed line indicates E = 100 kJ/mol and A = 6.2 × 10⁷. Figure 8 illustrates the relationship between activation energy and final PM mass/residual oxidation rate. Red bars represent the remaining PM mass, while black bars show the oxidation rate, calculated using the following formula, based on the initial PM input of 0.25 g:
These results indicate that lower activation energy (E) and higher pre-exponential factor (A) promote PM oxidation, reducing the final residual PM. In the case of E = 100 kJ/mol and A = 6.2 × 10⁷, PM accumulation was suppressed even during the low-speed mode, oxidation began during the medium-speed mode (where exhaust temperatures reached 550–600 ℃), and combustion was accelerated during the high-speed mode. By the end of the cycle (1800 s), only 0.00299 g of PM remained, corresponding to a high oxidation rate of 98.8%. For E = 100 kJ/mol with A = 6.2 × 10⁶ and E = 120 kJ/mol with A = 6.2 × 10⁷, PM oxidation was insufficient to counterbalance the accumulation during low- and medium-speed phases, resulting in a net increase. However, oxidation overtook accumulation in the latter half of the high-speed phase, where the exhaust temperature exceeded 650 °C, and the residual PM began to decrease. In contrast, under the condition approximating commercially available catalysts (E = 120 kJ/mol, A = 6.2 × 10⁶), though a direct literature reference may be needed, PM oxidation was minimal even during the high-speed mode. As a result, the final PM mass remained at 0.109 g, and the oxidation rate was limited to 56.3 %. These findings demonstrate that PM oxidation is highly dependent on catalyst performance. However, in practical applications, installing highly active catalysts is constrained by cost and durability concerns. Therefore, it is necessary to compensate for these limitations through operational control strategies, such as intentionally introducing fuel cut events. The following section quantitatively investigates the effectiveness of forced fuel cuts as a countermeasure.
3.2. Effect of Forced Fuel Cut (FC) on PM Oxidation
This section evaluates the influence of catalyst activity on PM oxidation performance within the GPF, and the limitations of catalyst performance and the necessity of complementary engine control strategies are discussed. Numerical simulations were conducted under four conditions with activation energy (E) set to 100 and 120 kJ/mol, and pre-exponential factor (A) set to 6.2 × 10⁶ and 6.2 × 1In the previous section, we demonstrated that catalyst performance, represented by parameters such as activation energy and pre-exponential factor, significantly impacts the rate of PM oxidation. However, in practical automotive catalysts, ensuring sufficiently high activity is challenging due to cost, durability, and performance constraints. Therefore, as a compensatory measure for the limitations of catalyst performance, this section investigates the potential of promoting PM oxidation by intentionally introducing fuel cut (FC) periods, which temporarily raise the oxygen concentration in the exhaust gas. In this analysis, the PM oxidation behavior in a GPF was evaluated numerically under catalyst conditions of E = 100 kJ/mol and A = 6.2 × 10⁷, focusing on the low-speed phase (0–600 s) of the WLTC mode. The total duration of FC was fixed at 100 seconds, and three introduction patterns were examined: (1) a single continuous 100-second FC; (2) three divided FC events of 30, 30, and 40 seconds; and (3) five divided events of 20 seconds each. Two temperature conditions, 700 °C and 800 °C, were also set to evaluate the effect of exhaust temperature. Figure 9 illustrates the time-dependent profile of PM accumulation during the low-speed phase of WLTC. The results clearly indicate that continuous FC significantly suppresses PM buildup compared to the split FC or no-FC scenarios. When FC was applied continuously for 100 seconds, the final residual PM mass was 0.010 g at 700 °C and 0.001 g at 800 °C (Figure 10). In contrast, when FC was introduced in three divided intervals, the final residuals were 0.013 g at 700 °C and 0.004 g at 800 °C (Figure 11). For the five-interval case, the values were 0.016 g and 0.009 g, respectively (Figure 12). These quantitative results are summarized in Table 3. By comparing each FC condition with the baseline case (no FC), the improvement in regeneration performance due to FC introduction can be quantitatively assessed. As shown in Figure 9, the PM mass at 600 s under the no-FC condition was 0.0246 g. Using this as a reference, it was found that continuous FC for 100 seconds reduced the final PM mass to 0.001 g, representing a 96% reduction. This substantial PM removal is attributed to the strong acceleration of oxidation reactions, due to the sudden increase in oxygen concentration and the sustained heat release from the reaction. When FC was divided into three intervals, the final PM mass was 0.004 g—an 84% reduction compared to the no-FC case. Although the oxygen supply and heat release effects became intermittent in the divided cases, a high oxidation efficiency was maintained. In the five-interval FC condition, the final PM mass was 0.009 g, corresponding to a 63% reduction. It is inferred that increasing the number of FC intervals decreases the duration of each event, reducing the sustainability of heat release and local temperature rise, leading to a diminished regeneration effect. While the oxidation rate varied with each FC strategy, it is also important to consider the peak PM accumulation. Although the final PM mass tended to be slightly higher in the divided FC cases, these strategies effectively suppressed the peak PM accumulation. This is advantageous for minimizing pressure drop across the filter and suggests potential for short-cycle partial regeneration strategies. From these results, it is clear that under E = 100 kJ/mol and A = 6.2 × 10⁷ conditions, forcing FC significantly enhances PM regeneration. In particular, continuous FC maintained a high-oxygen and elevated-temperature state, which strongly accelerated oxidation reactions, resulting in the highest PM removal efficiency. Alternatively, divided FC introduced intermittent oxidation, leading to slightly lower oxidation rates, but offering benefits such as suppression of peak PM accumulation. In summary, while continuous FC introduction offers the highest PM oxidation efficiency, split FC strategies can effectively mitigate peak PM accumulation and pressure drop. Thus, the FC strategy must be optimized based on system requirements and operational constraints. Therefore, optimizing the FC strategy in accordance with operational conditions and system design goals is essential.
Based on the above findings, it is clear that forced fuel cut (FC) is effective in promoting PM oxidation; however, its effectiveness depends on both the temperature conditions and the method of introduction. In particular, under low-temperature conditions such as those in the low-speed phase, continuous FC enables sustained oxidation reactions and leads to a greater regeneration effect.
4. Conclusion
In this study, numerical simulations were conducted from the perspectives of catalyst performance and engine control to improve the regeneration performance of gasoline particulate filters (GPF) under WLTC mode conditions. The main findings are summarized as follows:
-
Effect of Catalyst Performance (Activation Energy and Pre-exponential Factor)Simulations under four different conditions, varying activation energy (E) and pre-exponential factor (A), revealed that PM oxidation performance highly depends on catalyst activity. Under high-activity conditions (E = 100 kJ/mol, A = 6.2 × 10⁷), an oxidation rate of 98.8% was achieved within a single WLTC cycle, and the final residual PM mass was as low as 0.003 g. In contrast, under conventional catalyst performance (E = 120 kJ/mol, A = 6.2 × 10⁶), oxidation was insufficient, with residual PM reaching 0.11 g, highlighting the limitations in regeneration under such conditions.
-
Effectiveness of Forced Fuel Cut (FC) IntroductionUnder conditions of limited catalyst performance, temporarily raising the exhaust oxygen concentration to 20% through forced fuel cut (FC) was shown to promote PM oxidation effectively. Especially in the low-speed mode, where exhaust temperatures remain around 500 °C, introducing a single continuous 100-second FC event yielded the highest oxidation effect, reducing PM by approximately 96%. This is attributed to the synergistic effects of sustained oxygen supply and heat release from oxidation reactions, which accelerated and maintained the reaction. On the other hand, when FC was divided into three or five intervals, the oxidation rate slightly decreased, but peak PM accumulation was effectively suppressed. This suggests that a split FC introduction may help reduce pressure drop and improve filter regeneration stability. Therefore, optimizing the FC strategy is crucial to meet multiple performance demands, such as regeneration efficiency and pressure loss reduction, and strategic control tailored to the operating conditions is required.
-
Future Issues and OutlookThe present model analyzed regeneration behavior separately for each speed phase. Future work must include continuous PM accumulation calculations, catalyst aging effects, and exhaust gas fluctuations to more accurately simulate real driving conditions. Moreover, for the practical implementation of forced FC, a comprehensive evaluation of control feasibility, user impact, and safety will be essential.
Based on the above, the numerical analysis has demonstrated that combining catalyst activity and engine control utilizing fuel cut can effectively improve GPF regeneration performance in GDI vehicles. These findings provide valuable technical insight that may guide the future development of regeneration control algorithms and the design of thermally durable catalysts.
Author Contributions
Conceptualization, Maki Nakamura and Masakuni Ozawa; methodology, Maki Nakamura; software, Koji Yokota; validation, Maki Nakamura and Koji Yokota; formal analysis, Maki Nakamura; investigation, Koji Yokota; data curation, Koji Yokota; writing—original draft preparation, Maki Nakamura; writing—review and editing, Maki Nakamura and Masakuni Ozawa; visualization, Koji Yokota; supervision, Maki Nakamura and Masakuni Ozawa; project administration, Maki Nakamura; funding acquisition, Masakuni Ozawa. Maki Nakamura and Masakuni Ozawa contributed equally to this work and serve as corresponding authors. All authors have read and agreed to the published version of the manuscript.
Acknowledgments
This work was supported by JSPS KAKENHI Grant Number 25K07617 and Creation of Life Innovation Materials for Interdisciplinary and International Researcher Development of the MEXT.
Definitions/Abbreviations
The following abbreviations are used in this manuscript:
| Cg | Specific heat of exhaust gas [J/(kg·K)] |
| D | Diameter of GPF [m] |
| dc | Density of cordierite [kg/m³] |
| E | Activation energy [J/mol] |
| ΣF | Total flow rate [m³/s] |
| i | Cell number in x-direction [-] |
| j | Number in y-direction (wall thickness direction) within each cell i [-] |
| L | Total length of GPF [m] |
| N | Cell number counted from the inlet in x-direction [-] |
| PM | Amount of particulate matter (PM) [mol] |
| Q | Heat capacity [J/K] |
| R | Gas constant [J/(K·mol)] |
| Rpm | Amount of PM reaction [mol] |
| S | Flow amount of gas [kg] |
| T | Temperature used in PM combustion reaction rate equation [°C] |
| Tw | Wall temperature [°C] |
| TR | Corrected temperature [°C] |
| TPM | PM combustion heat temperature [°C] |
| ΔT | Temperature change [°C] |
| V | Volume of computational unit cell [m³] |
| vi | Flow velocity [m/s] |
| VO2 | O₂ concentration [mol/m³] |
| WT | Wall thickness of GPF [m] |
| α | Superficial velocity of each cell [m/s] |
| μ | Permeability of GPF wall [-] |
| σ | Cross-sectional area of each cell [m²] |
| φ | Porosity [-] |
| λ | Pipe friction coefficient [-] |
| ρ | Fluid density [kg/m³] |
| Lwp+PM | Length [m] |
| Dwalls | Diameter [m] |
References
- Zissis C. Samaras, Anastasios Kontses, Athanasios Dimaratos, Dimitrios Kontses, Andreas Balazs, Stefan Hausberger, Leonidas Ntziachristos, Jon Andersson, Norbert Ligterink, Paivi Aakko-Saksa, Panagiota Dilara, “A European Regulatory Perspective towards a Euro 7 Proposal”, SAE Technical Papers, 2022-37-0032,2022.
- Chris Morgan*, John Goodwin, “Impact of the Proposed Euro 7 Regulations on Exhaust Aftertreatment System Design”, Johnson Matthey Technol. Rev., 67, (2), 239–245, 2023. [CrossRef]
- National Institute for Environmental Studies, Research Project Report No. 123 (in Japanese).
- T. W. Chan, M. Saffaripour, F. Liu, J. Hendren, K. A. Thomson, J. Kubsh, R. Brezny, and G. Rideout, “Characterization of Real-Time Particle Emissions from a Gasoline Direct Injection Vehicle Equipped with a Catalyzed Gasoline Particulate Filter During Filter Regeneration,” Emission Control Science and Technology, 2, pp. 75–88, 2016. [CrossRef]
- R. H. Bock, M. M. Baum, J. A. Moss, A. E. Castonguay, S. Jocic, and W. F. Northrop, “Dicarboxylic Acid Emissions from a GDI Engine Equipped with a Catalytic Gasoline Particulate Filter,” Fuel, 275, 117940, 2020. [CrossRef]
- K. Akihama, “Particulate Matter (PM): Automobile Exhaust Gas Regulations and the Need for Modeling of Generation—Gasoline Direct Injection Engine/Vehicle,” Journal of the Combustion Society of Japan, 59(187), pp. 49–54, 2017 (in Japanese).
- J. Jang, J. Lee, Y. Choi, and S. Park, “Reduction of Particle Emissions from Gasoline Vehicles with Direct Fuel Injection Systems Using a Gasoline Particulate Filter,” Science of the Total Environment, 644, pp. 1418–1428, 2018. [CrossRef]
- H. Arunachalam, G. Pozzato, M. A. Hoffman, and S. Onori, “Modeling the Thermal and Soot Oxidation Dynamics Inside a Ceria-Coated Gasoline Particulate Filter,” Control Engineering Practice, 94, 104199, 2020. [CrossRef]
- J. Wang, F. Yan, N. Fang, D. Yan, G. Zhang, Y. Wang, and W. Yang, “An Experimental Investigation of the Impact of Washcoat Composition on Gasoline Particulate Filter (GPF) Performance,” Energies, 13, 693, 2020. [CrossRef]
- C. Reinharter, “Investigation of Gasoline Particulate Filters (GPF) System Requirements and Their Integration in Future Passenger Car Series Applications,” Master’s Thesis, 2015.
- M. Nakamura, K. Yokota, and M. Ozawa, “Numerical Simulation of PM Deposition and Oxidation Using a One-Dimensional Model: A Study Considering Driving Modes,” Transactions of the Society of Automotive Engineers of Japan, 53(2), pp. 360–365, 2022.
- M. Nakamura, K. Yokota, and M. Ozawa, “One-Dimensional Simulation of PM Deposition and Regeneration Considering Driving Modes (Part 2),” Proceedings of the 2021 JSAE Spring Congress (in Japanese).
- M. Nakamura, K. Yokota, and M. Ozawa, “PM Deposition and Oxidation in Catalyzed Diesel Particulate Filters,” Transactions of the Society of Automotive Engineers of Japan, 51(2), 2020 (in Japanese).
- M. Nakamura, K. Yokota, M. Hattori, and M. Ozawa, “PM Deposition and Oxidation in Catalyzed Diesel Particulate Filters—Thermal Analysis in GPF (Part 2),” Transactions of the Society of Automotive Engineers of Japan, 51(2), 2019 (in Japanese).
- K. Yokota, M. Nakamura, M. Hattori, and M. Ozawa, “One-Dimensional Simulation of PM Deposition and Oxidation in Catalyzed Diesel Particulate Filters—Effect of GPF Geometry (Part 3),” Transactions of the Society of Automotive Engineers of Japan, 51(5-2), 2020 (in Japanese).
- M. Nakamura, K. Yokota, and M. Ozawa, “One-Dimensional Simulation of PM Deposition and Oxidation in Catalyzed Diesel Particulate Filters—Analysis of PM Combustion Behavior with Catalysts (Part 4),” Transactions of the Society of Automotive Engineers of Japan, 52(2), pp. 257–262, 2021 (in Japanese).
- M. Nakamura and M. Ozawa, “Effect of Surface Cavity Shape on PM Deposition and Pressure Drop in DPF Porous Material,” Journal of the Society of Materials Science, Japan, 76, pp. 562–567, 2018. [CrossRef]
- M. Nakamura, K. Yokota, M. Hattori, and M. Ozawa, “Numerical Calculation of PM Trapping and Oxidation of Diesel Particulate Filter with Catalyst,” SAE Technical Paper, 2020-01-2169, 2020.
- M. Nakamura, K. Yokota, K. Okai, and M. Ozawa, “Development of Converter Model for Catalysts in Particulate Filters,” Transactions of the Society of Automotive Engineers of Japan, 54(2-1), 2023 (in Japanese).
- M. Nakamura, K. Yokota, and M. Ozawa, “One-Dimensional Simulation of PM Deposition and Regeneration in Particulate Filters—Evaluation of Catalyst Loading Position,” Transactions of the Society of Automotive Engineers of Japan, 53(5-2), 2022 (in Japanese).
- Maki Nakamura, Koji Yokota, Masakuni Ozawa, “Numerical calculation optimization for particulate matter (PM) trapping and oxidation of catalytic diesel particulate filter (DPF)”, Applied Sciences, 15(5), 2356, 2025. [CrossRef]
- R. Sanui and K. Hanamura, “Electron Microscopic Time-Lapse Visualization of Surface Cavity Filtration in the Particulate Matter Trapping Process,” Journal of Microscopy, 263(3), pp. 250–259, 2016. [CrossRef]
- Maki Nakamura and Masakuni Ozawa, “Phenomena of PM deposition and oxidation in the diesel particulate filter”, SAE2019-01-2288, 2019.
- M. Yu, D. Luss, and V. Balakotaiah, “Analysis of Flow Distribution and Heat Transfer in a Diesel Particulate Filter,” Chemical Engineering Journal, 226, pp. 68–78, 2013. [CrossRef]
- J. Huang, Y. Liu, Z. Meng, Y. Peng, H. Li, Z. Zhang, Q. Zhang, Z. Qin, J. Mao, and J. Fang, “Effect of Different Aging Conditions on the Soot Oxidation by Thermogravimetric Analysis,” ACS Omega, 5, pp. 30568–30576, 2020. [CrossRef]
- X. Liang, X. Lv, Y. Wang, L. He, Y. Wang, K. Fu, Q. Liu, and K. Wang, “Experimental Investigation of Diesel Soot Oxidation Reactivity Along the Exhaust After-Treatment System Components,” Fuel, 302, 121047, 2021. [CrossRef]
- Z. Hu, Z. Lu, H. Zhang, B. Song, and Y. Quan, “Effect of Oxidation Temperature on Oxidation Reactivity and Nanostructure of Particulate Matter from a China VI GDI Vehicle,” Atmospheric Environment, 256, 2021. [CrossRef]
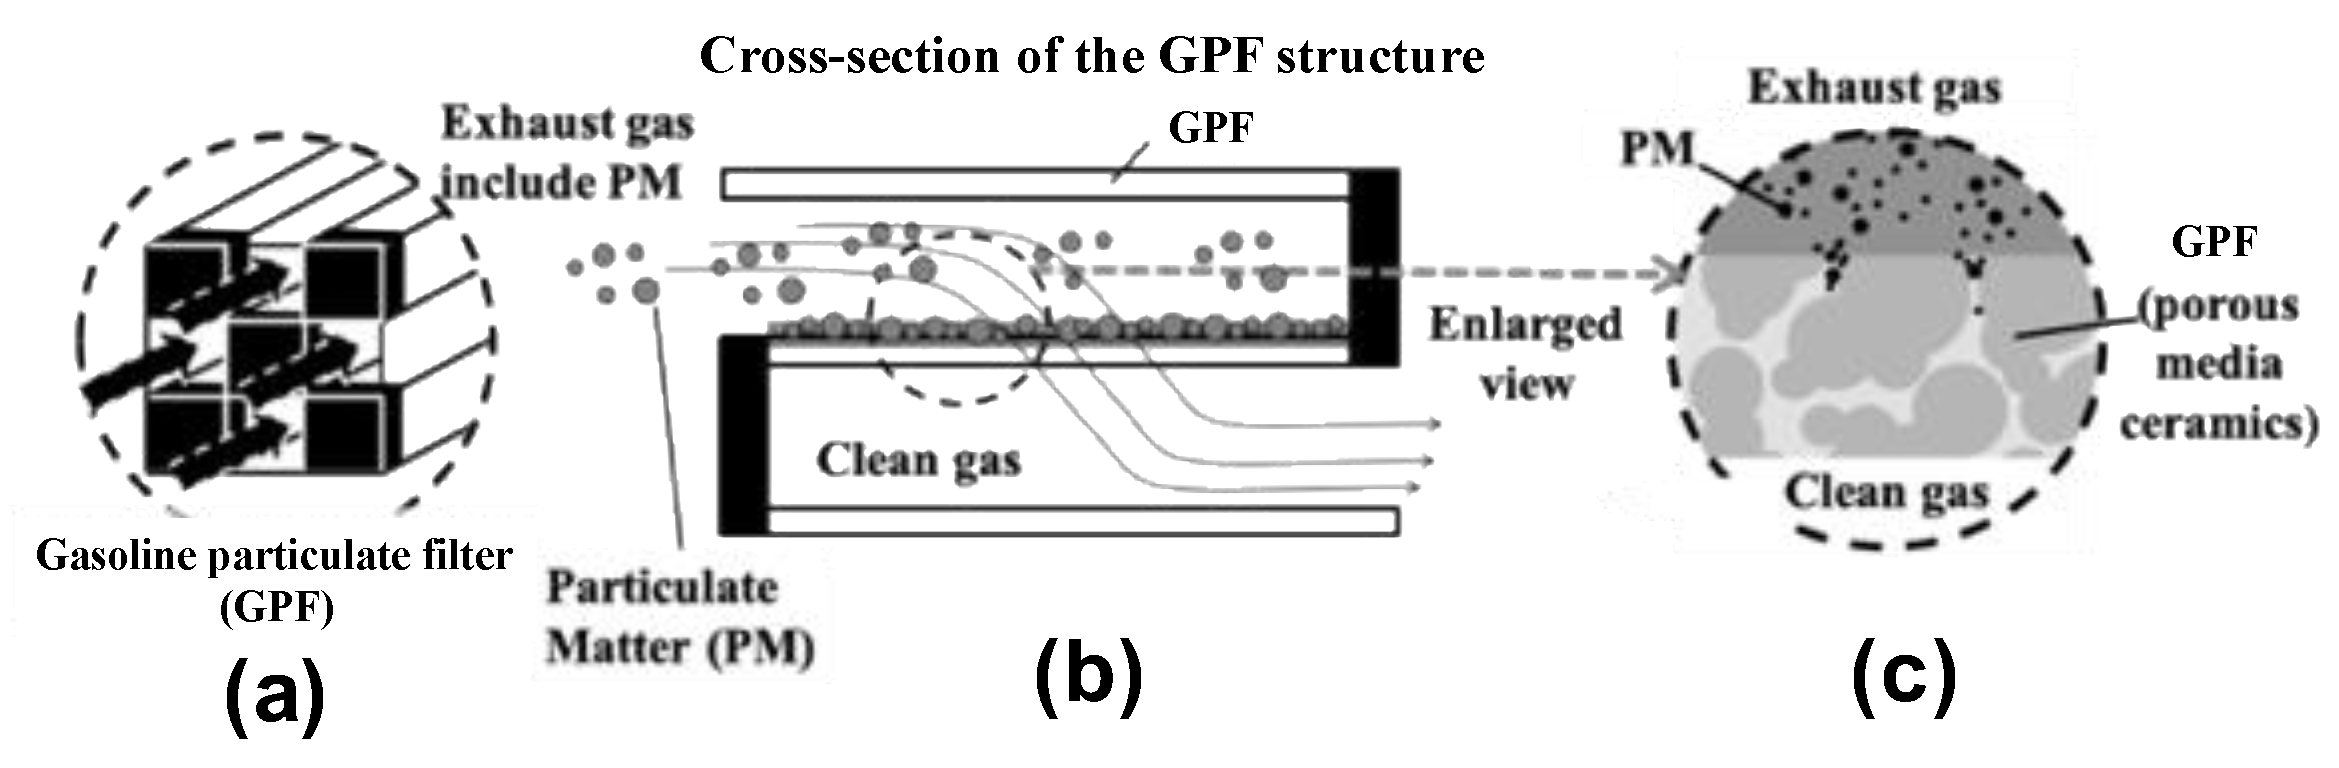
Figure 2.
The drive mode of WLTC. Variations of red, blue, and black lines are the temperature of exhaust gas, the density of oxygen, and fuel cut-off, respectively [10].
Figure 2.
The drive mode of WLTC. Variations of red, blue, and black lines are the temperature of exhaust gas, the density of oxygen, and fuel cut-off, respectively [10].
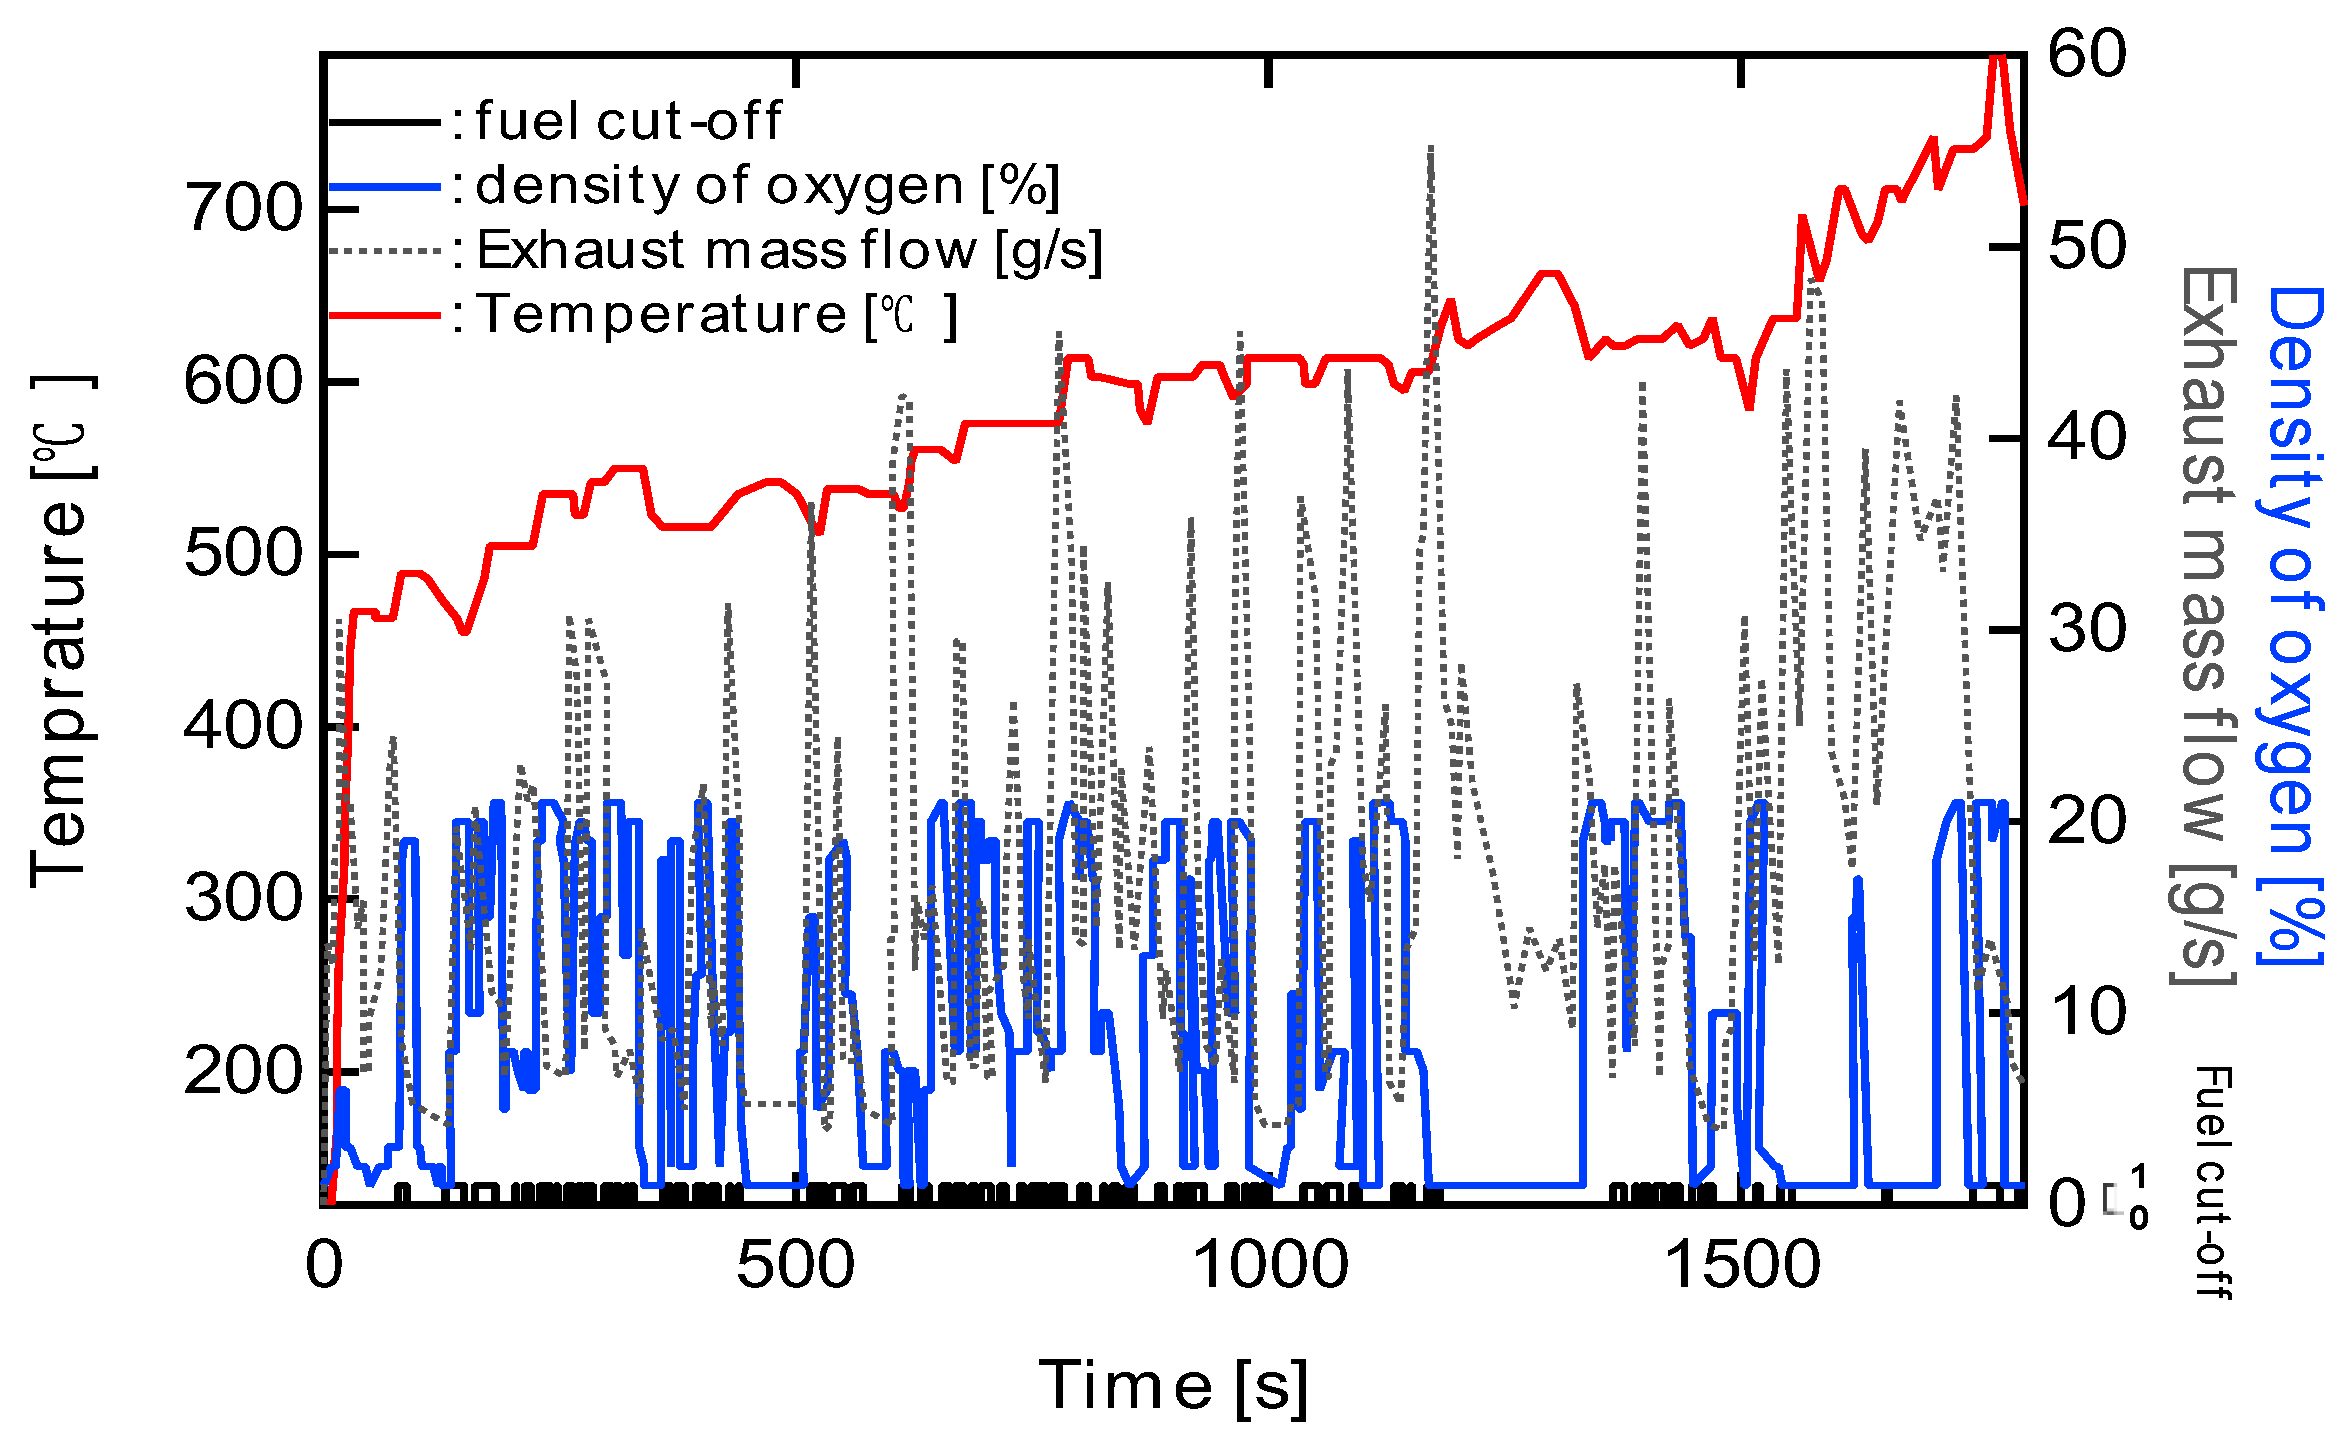
Figure 3.
Dependence of oxygen density on PM combustion rate. The vertical axis shows the combustion rate, and the horizontal axis shows the elapsed time. Red, blue, pink, yellow, and yellow-green lines indicate oxygen concentrations of 1 %, 5 %, 10 %, 15 %, and 20 %, respectively[6].
Figure 3.
Dependence of oxygen density on PM combustion rate. The vertical axis shows the combustion rate, and the horizontal axis shows the elapsed time. Red, blue, pink, yellow, and yellow-green lines indicate oxygen concentrations of 1 %, 5 %, 10 %, 15 %, and 20 %, respectively[6].
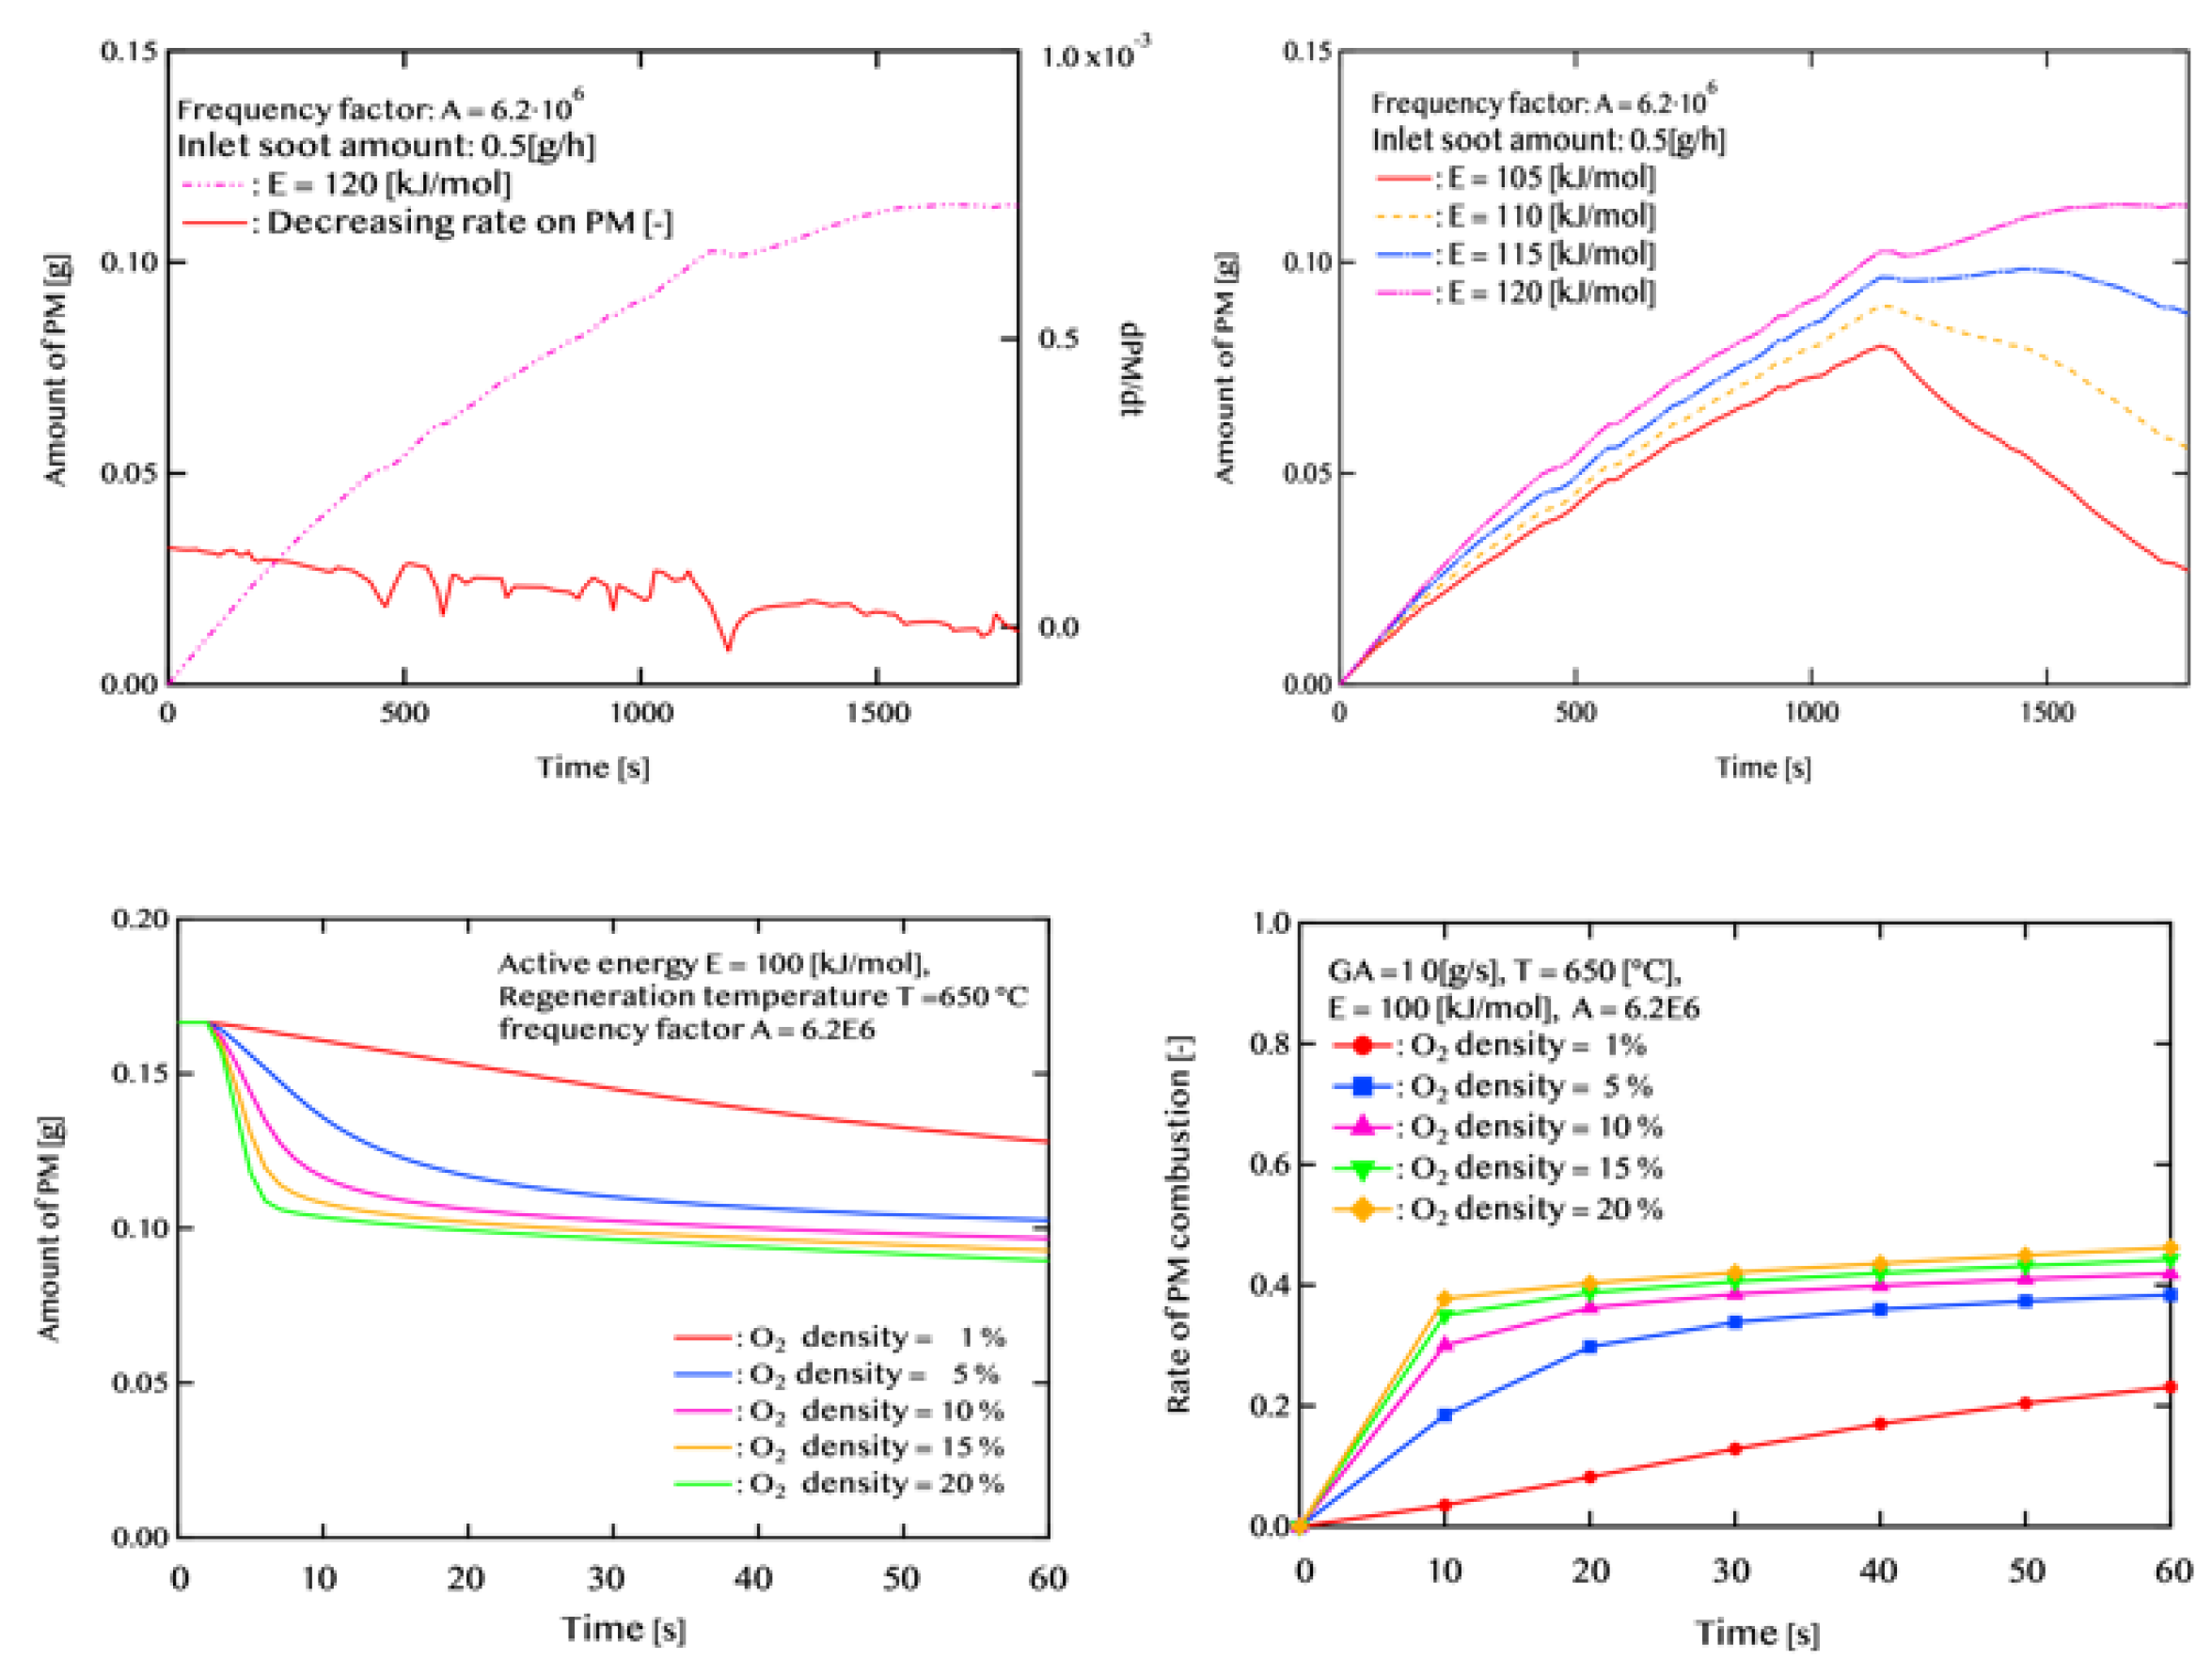
Figure 4.
(a) conceptual diagram of GPF, (b)conceptual diagram of GPF cross-section (X-direction).
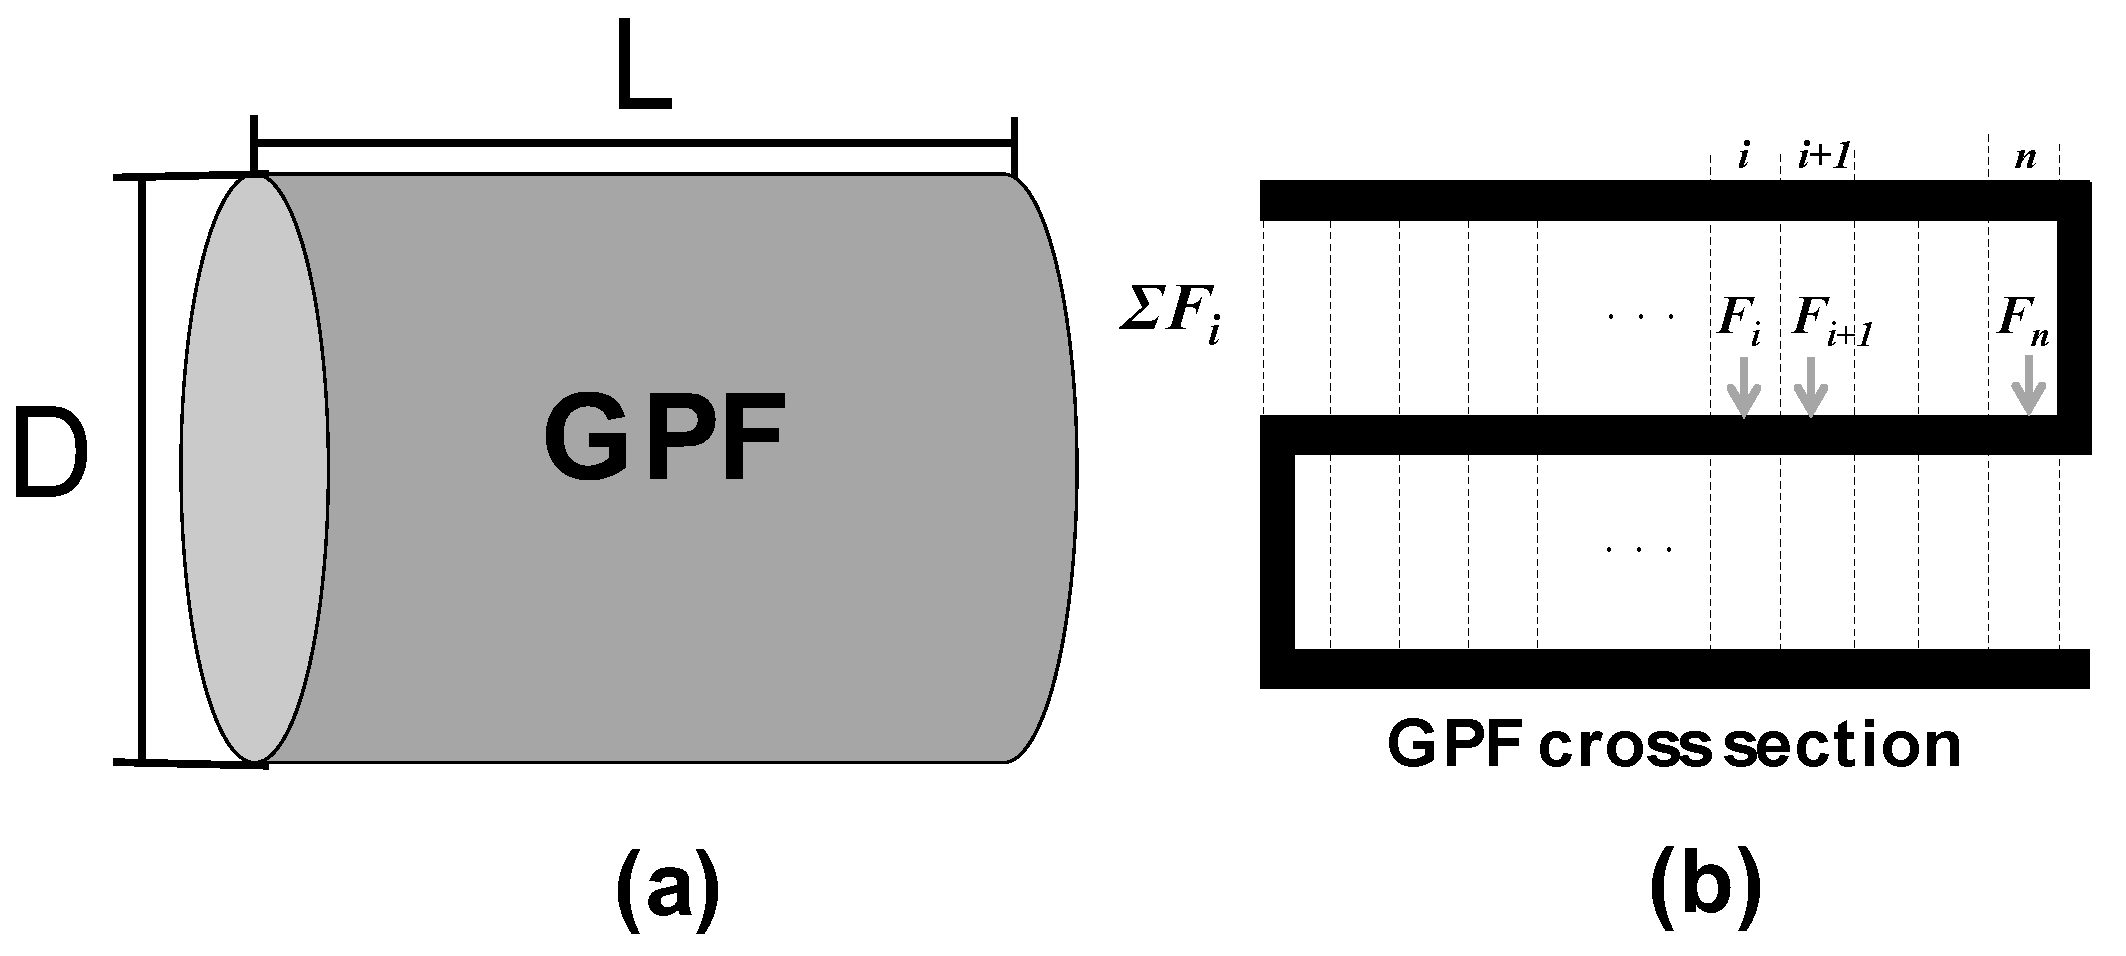
Figure 5.
Conceptual diagram of GPF cross-section (y-direction).
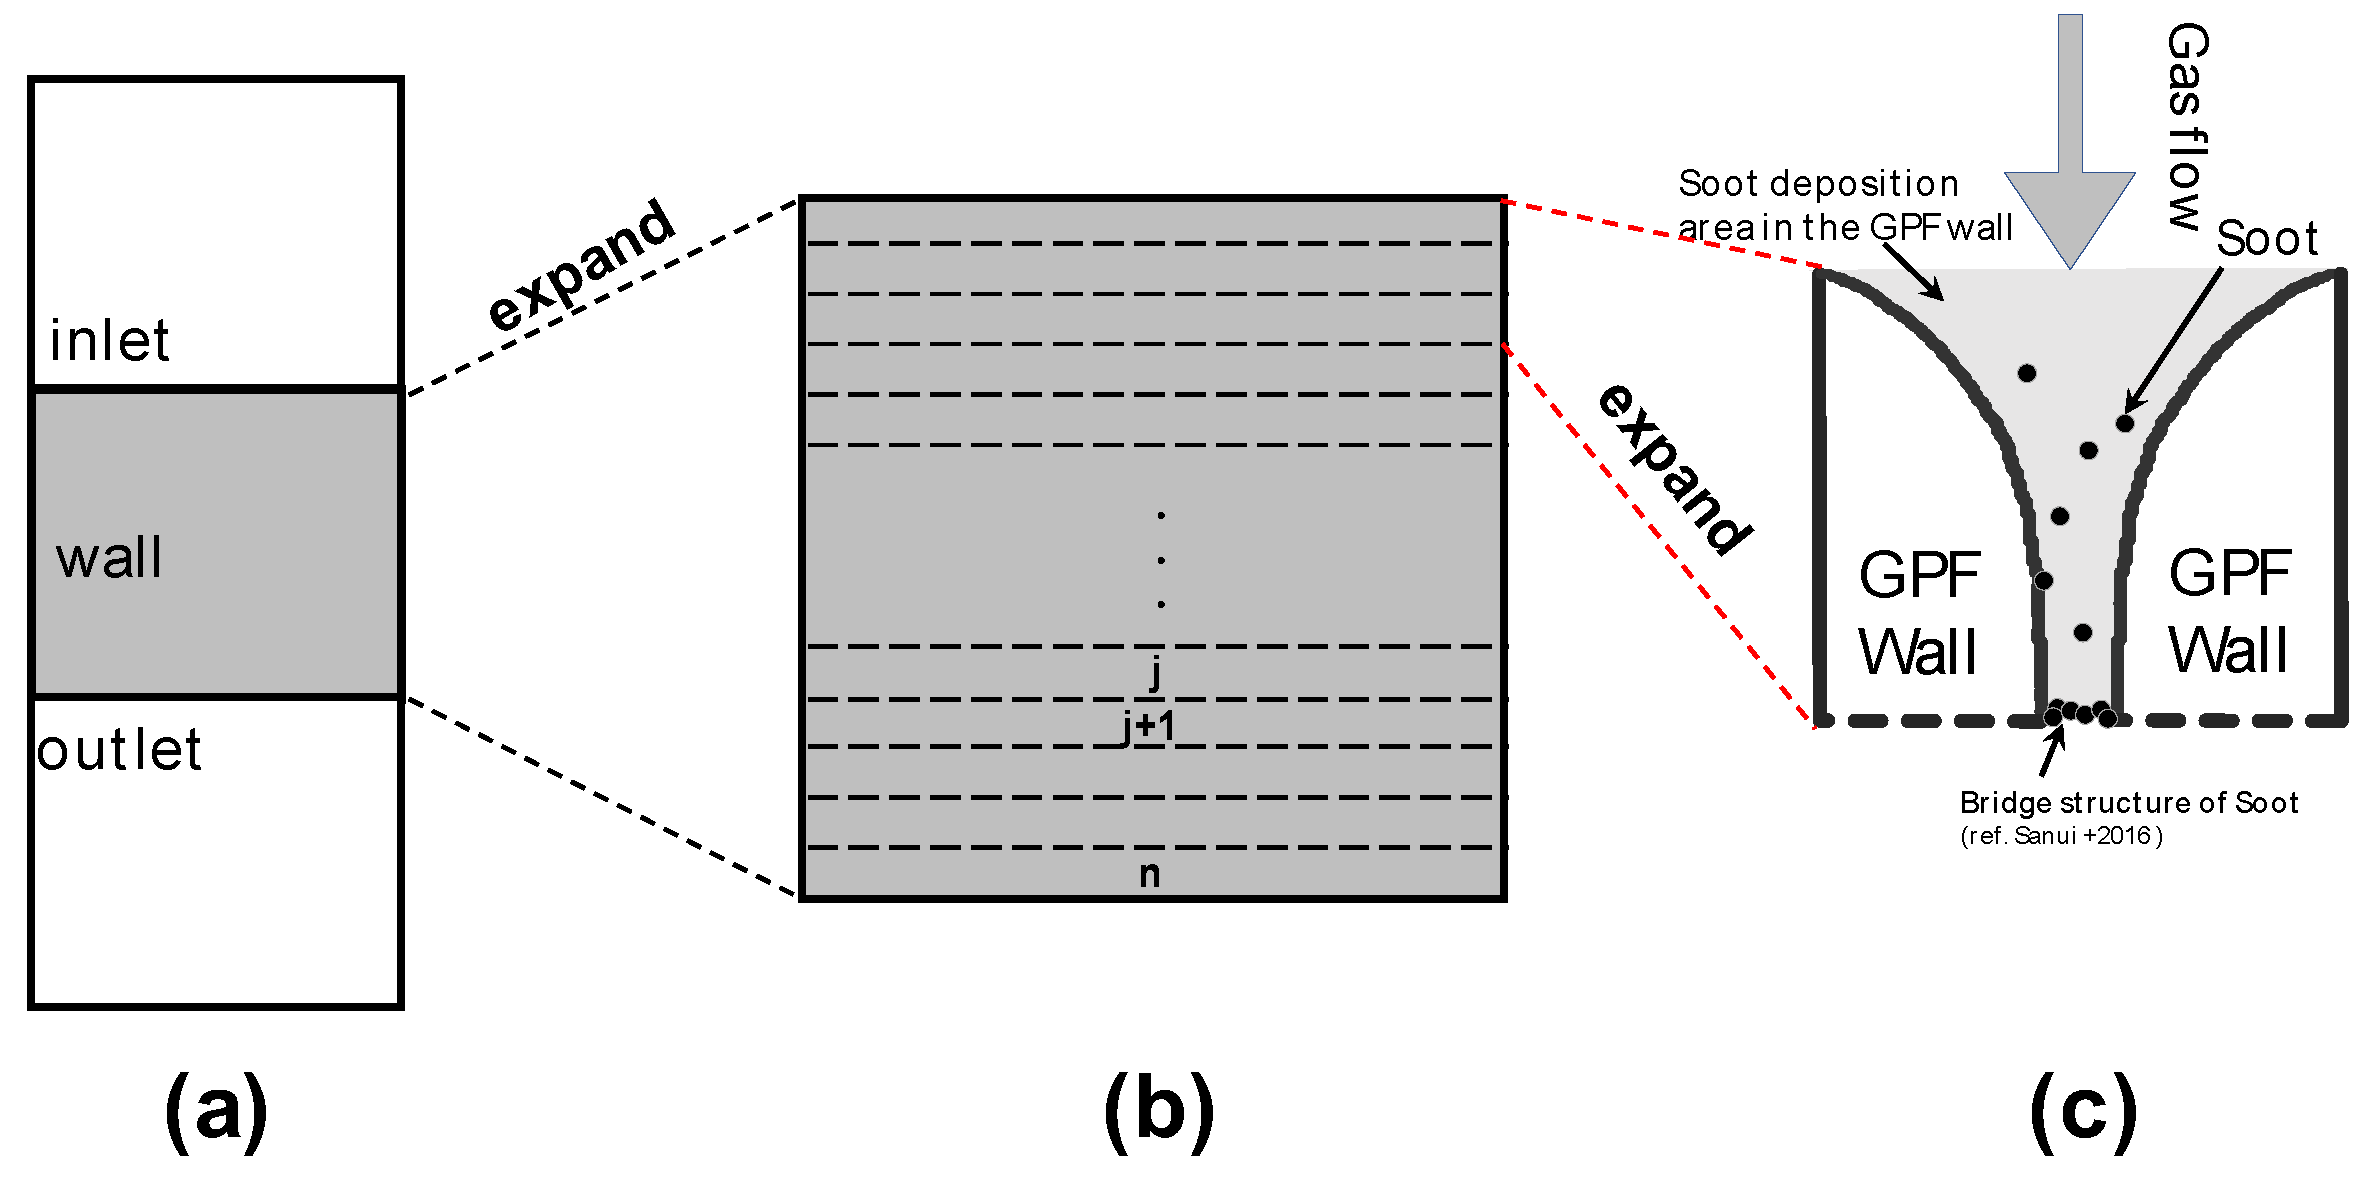
Figure 6.
illustrates the contact condition between the catalyst and soot.
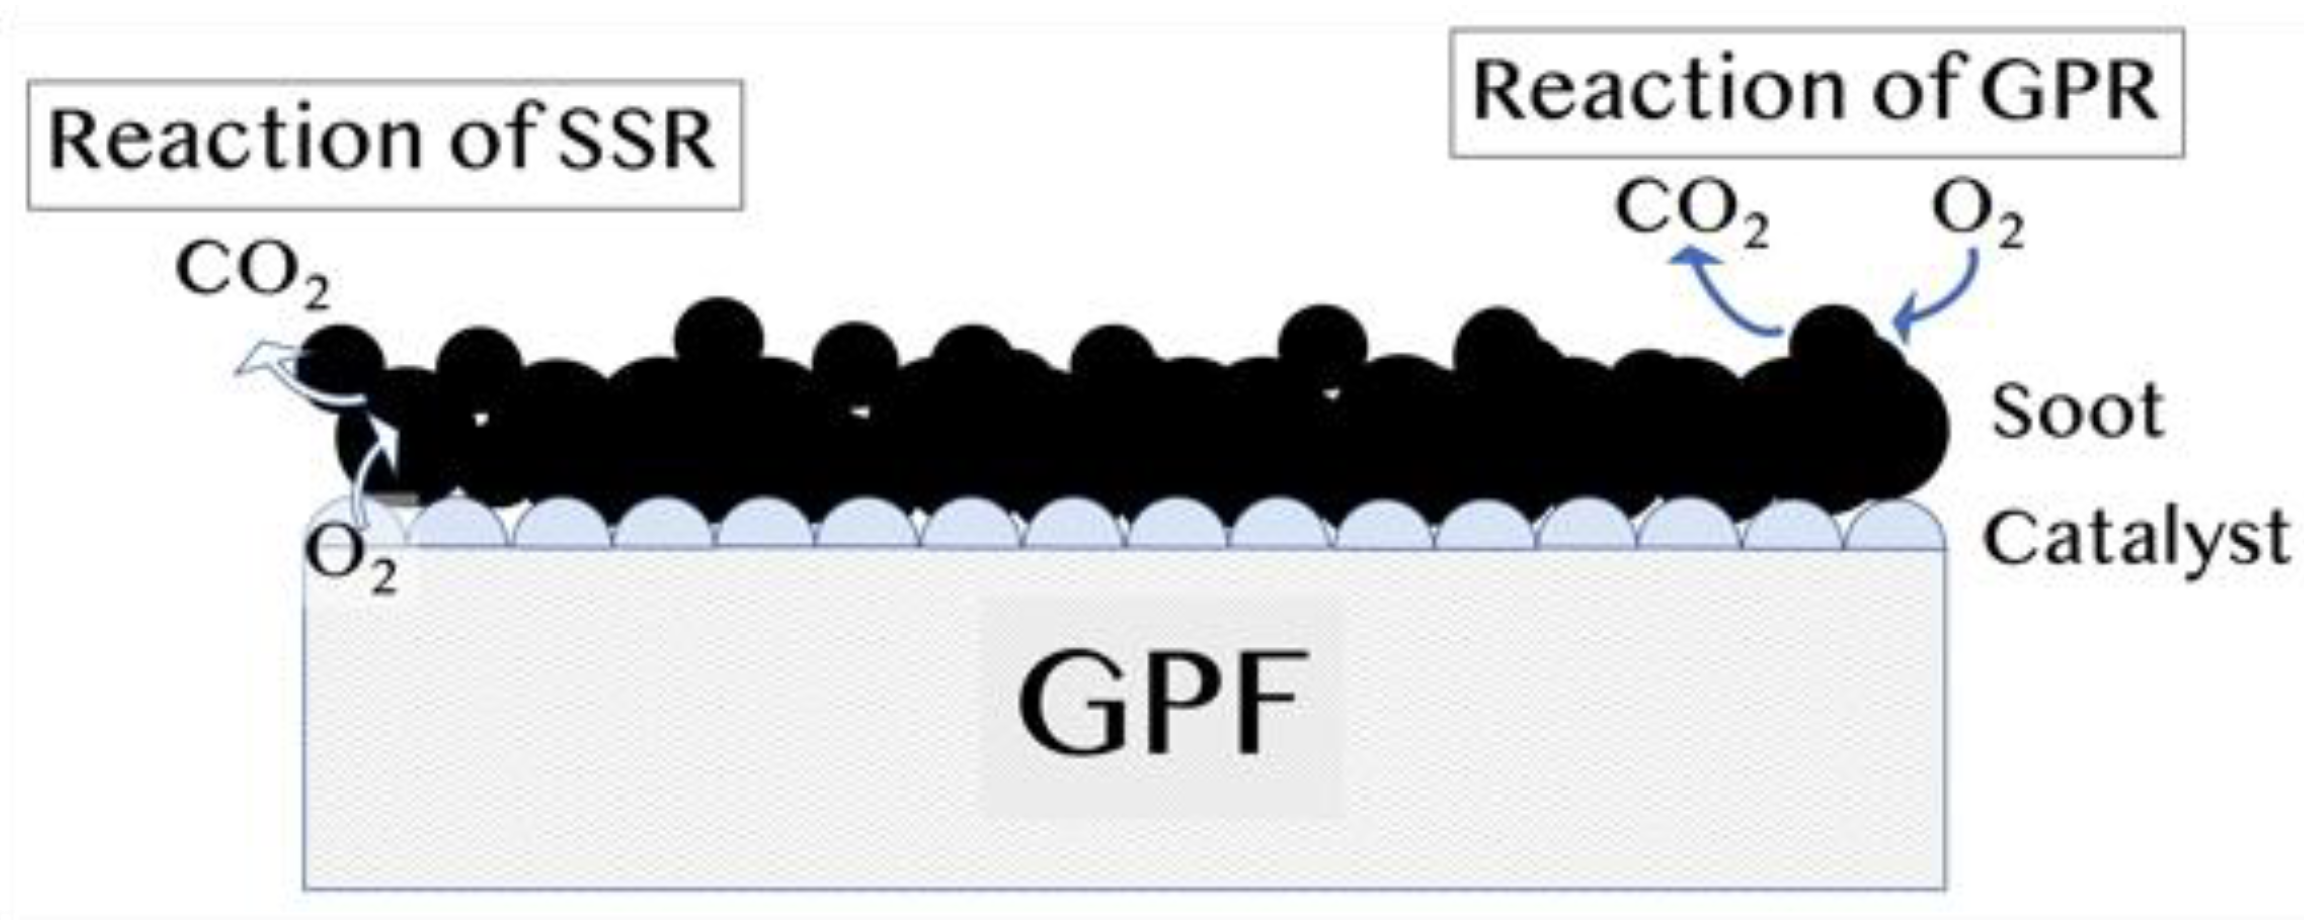
Figure 7.
Calculation result in WLTC mode by using a cataly.
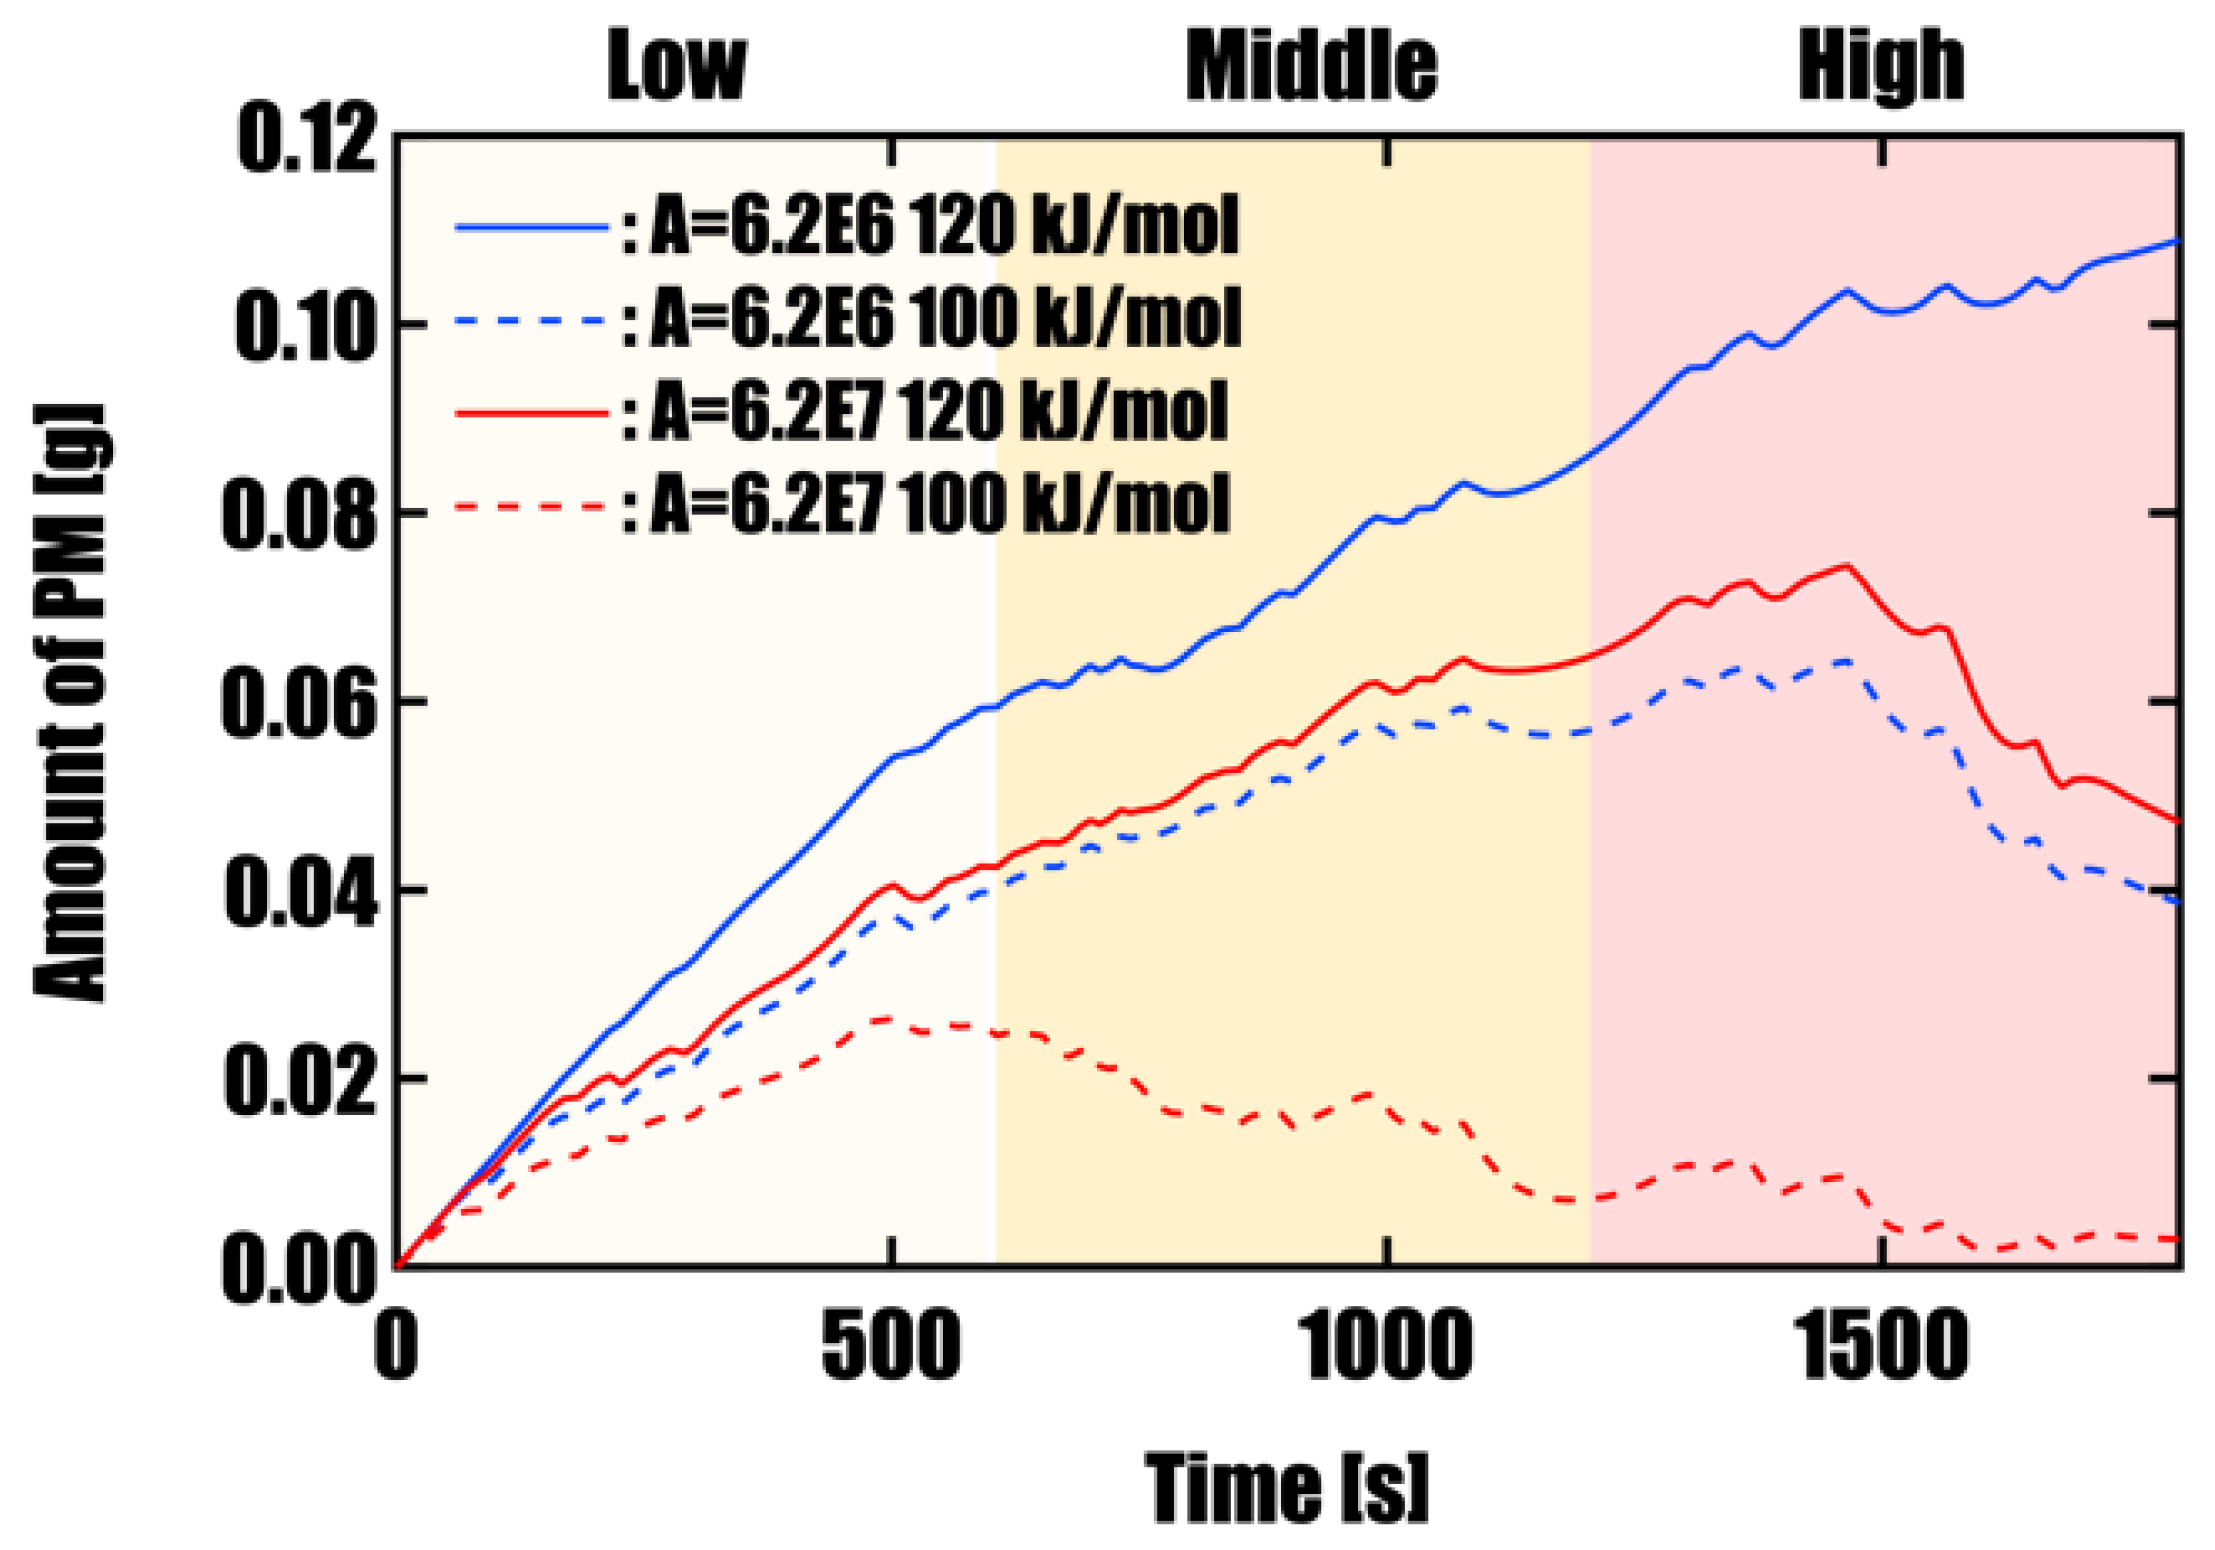
Figure 8.
Relationship between Activation Energy and PM Oxidation Characteristics (Residual PM and Oxidation Rate).
Figure 8.
Relationship between Activation Energy and PM Oxidation Characteristics (Residual PM and Oxidation Rate).
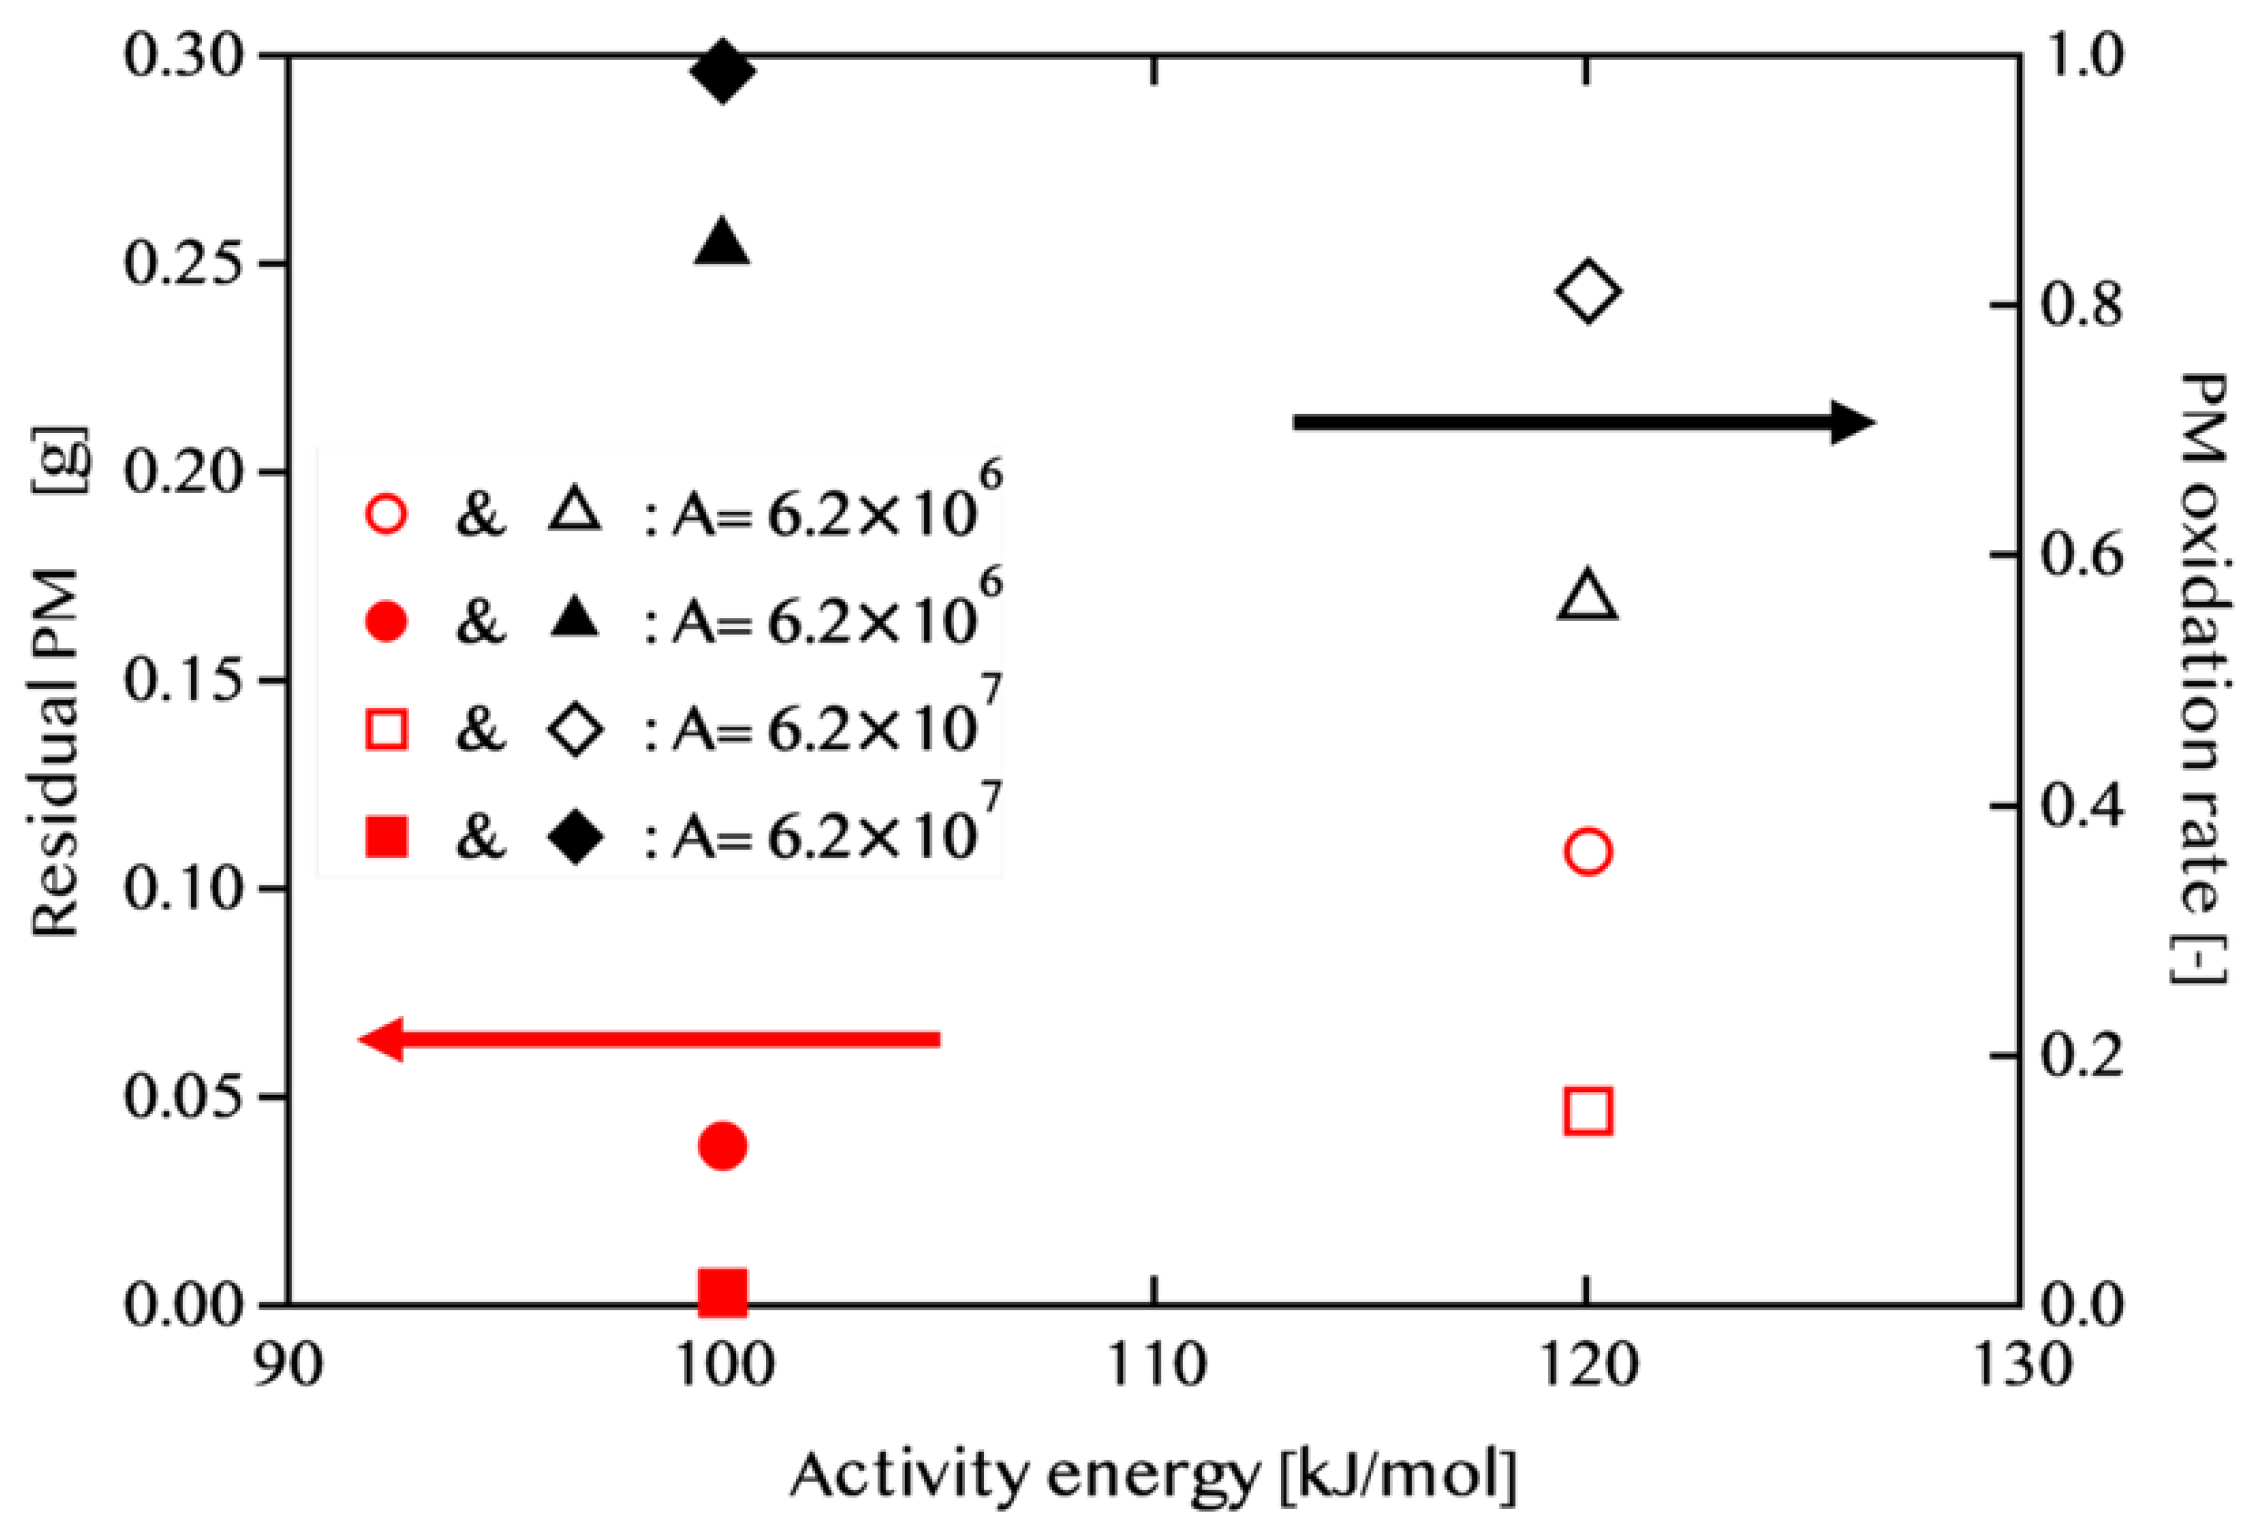
Figure 9.
Low-speed mode in WLTC.
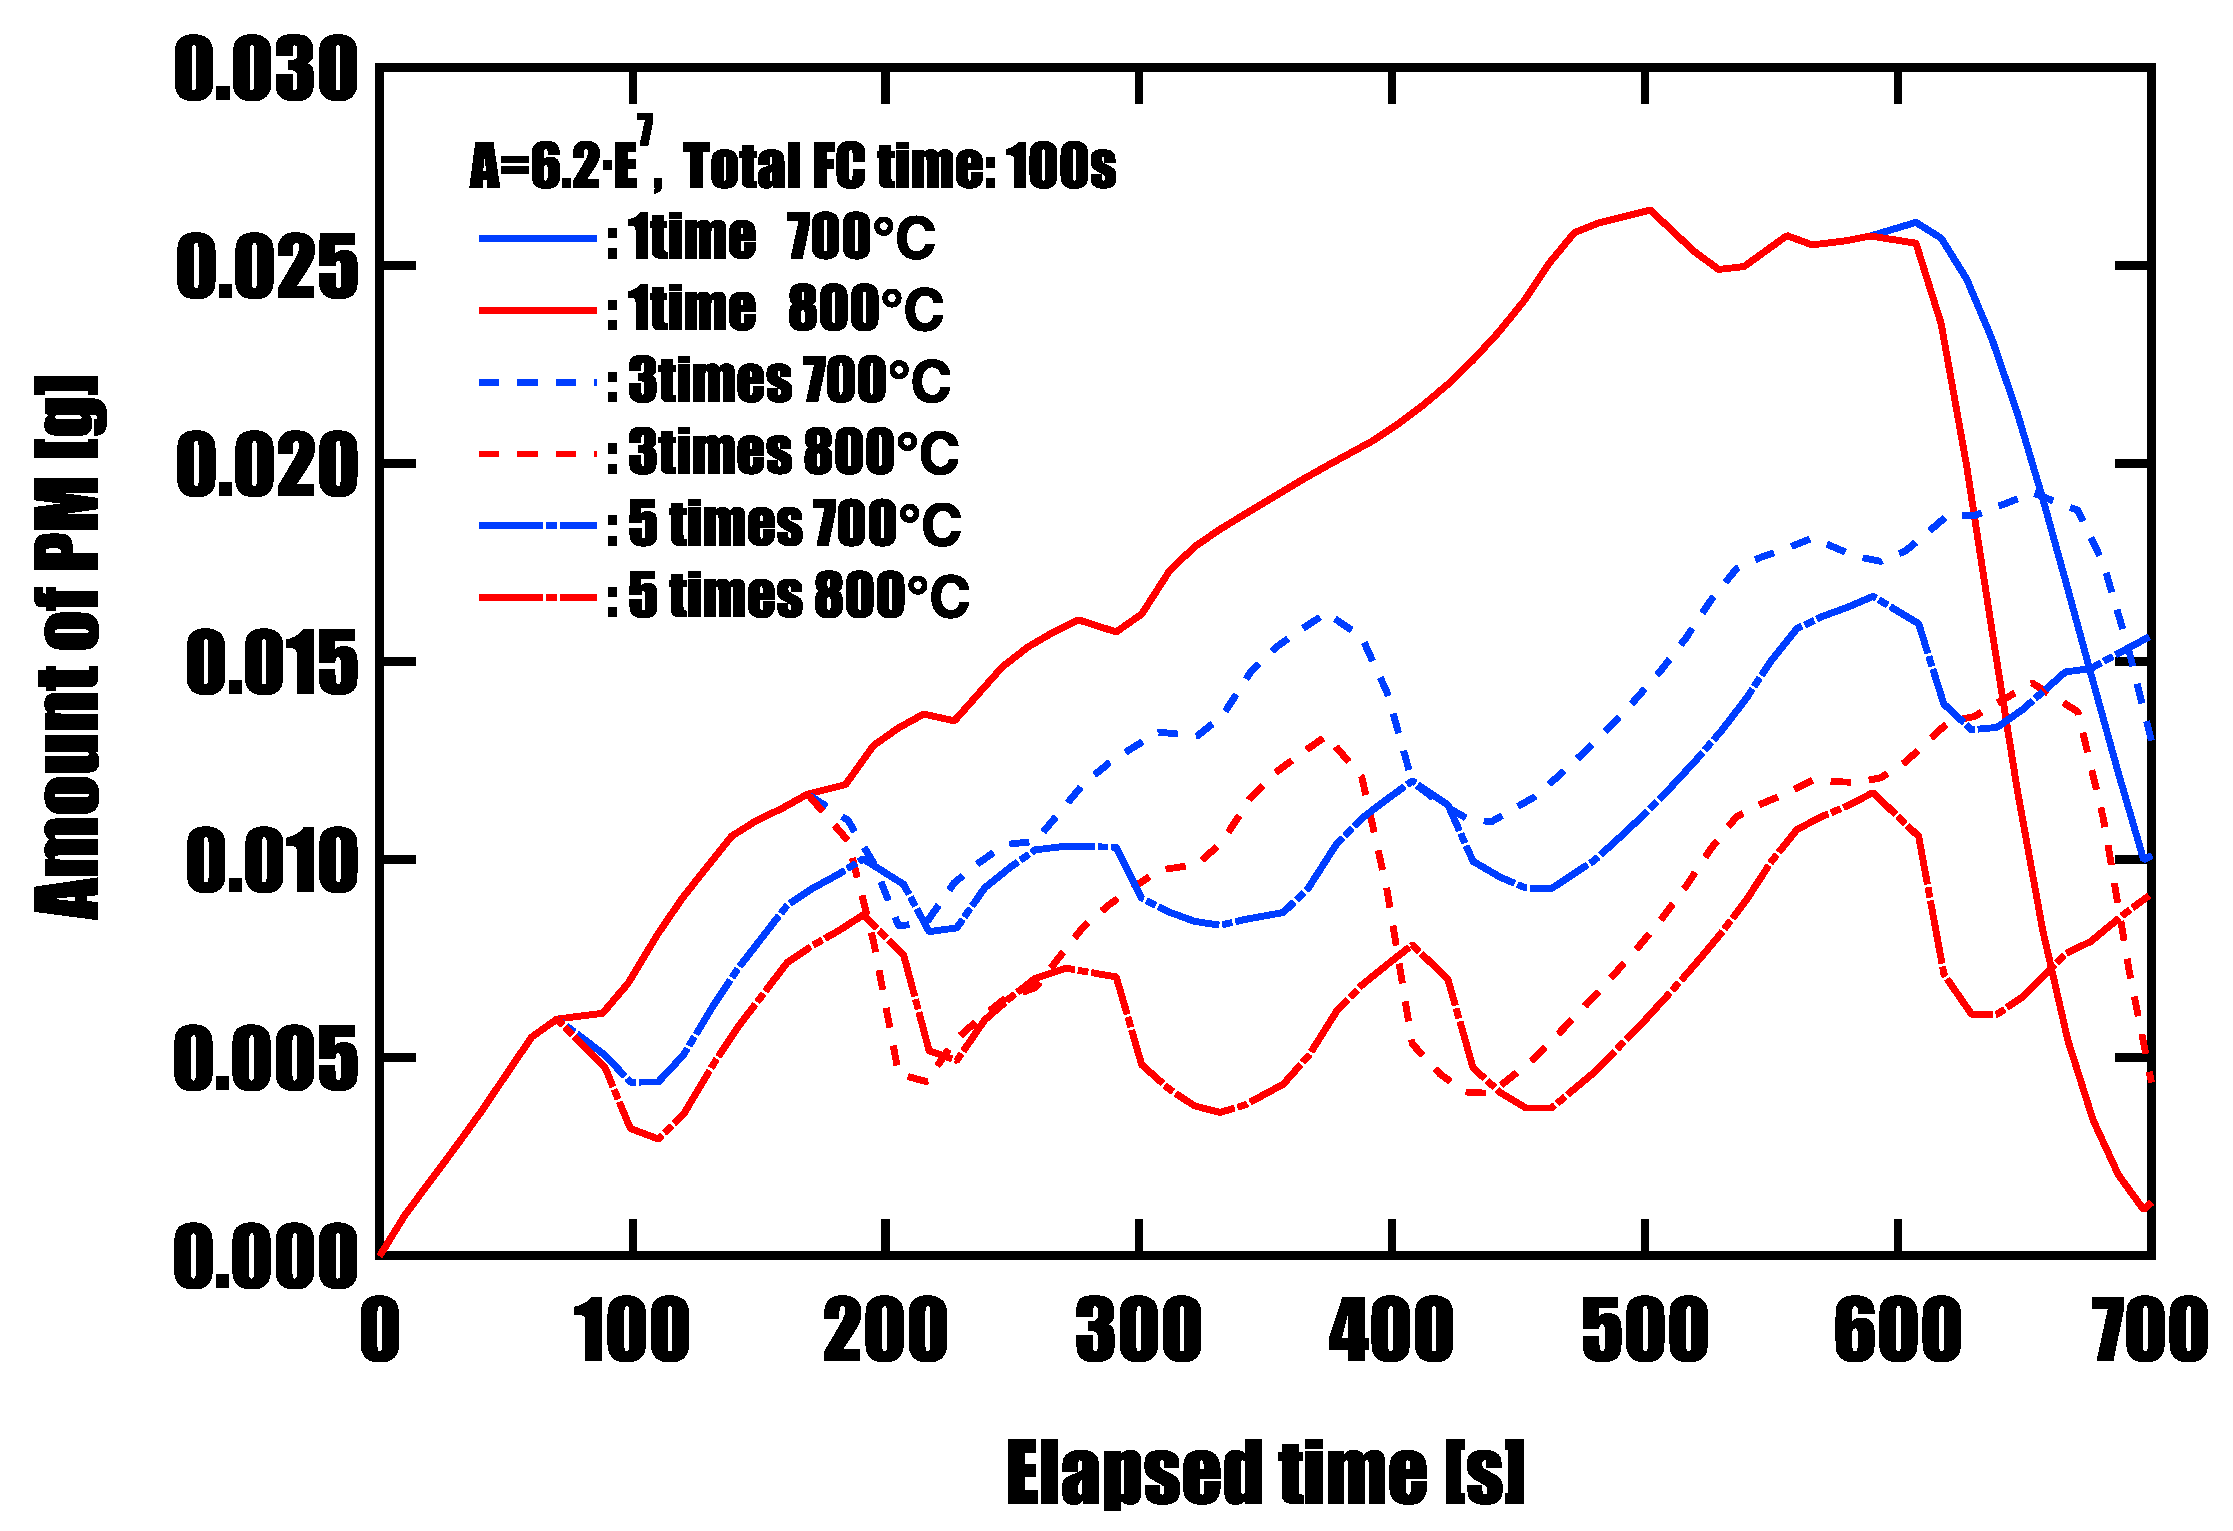
Figure 10.
One forced FC of 100 seconds was introduced in the low-speed mode of WLTC.
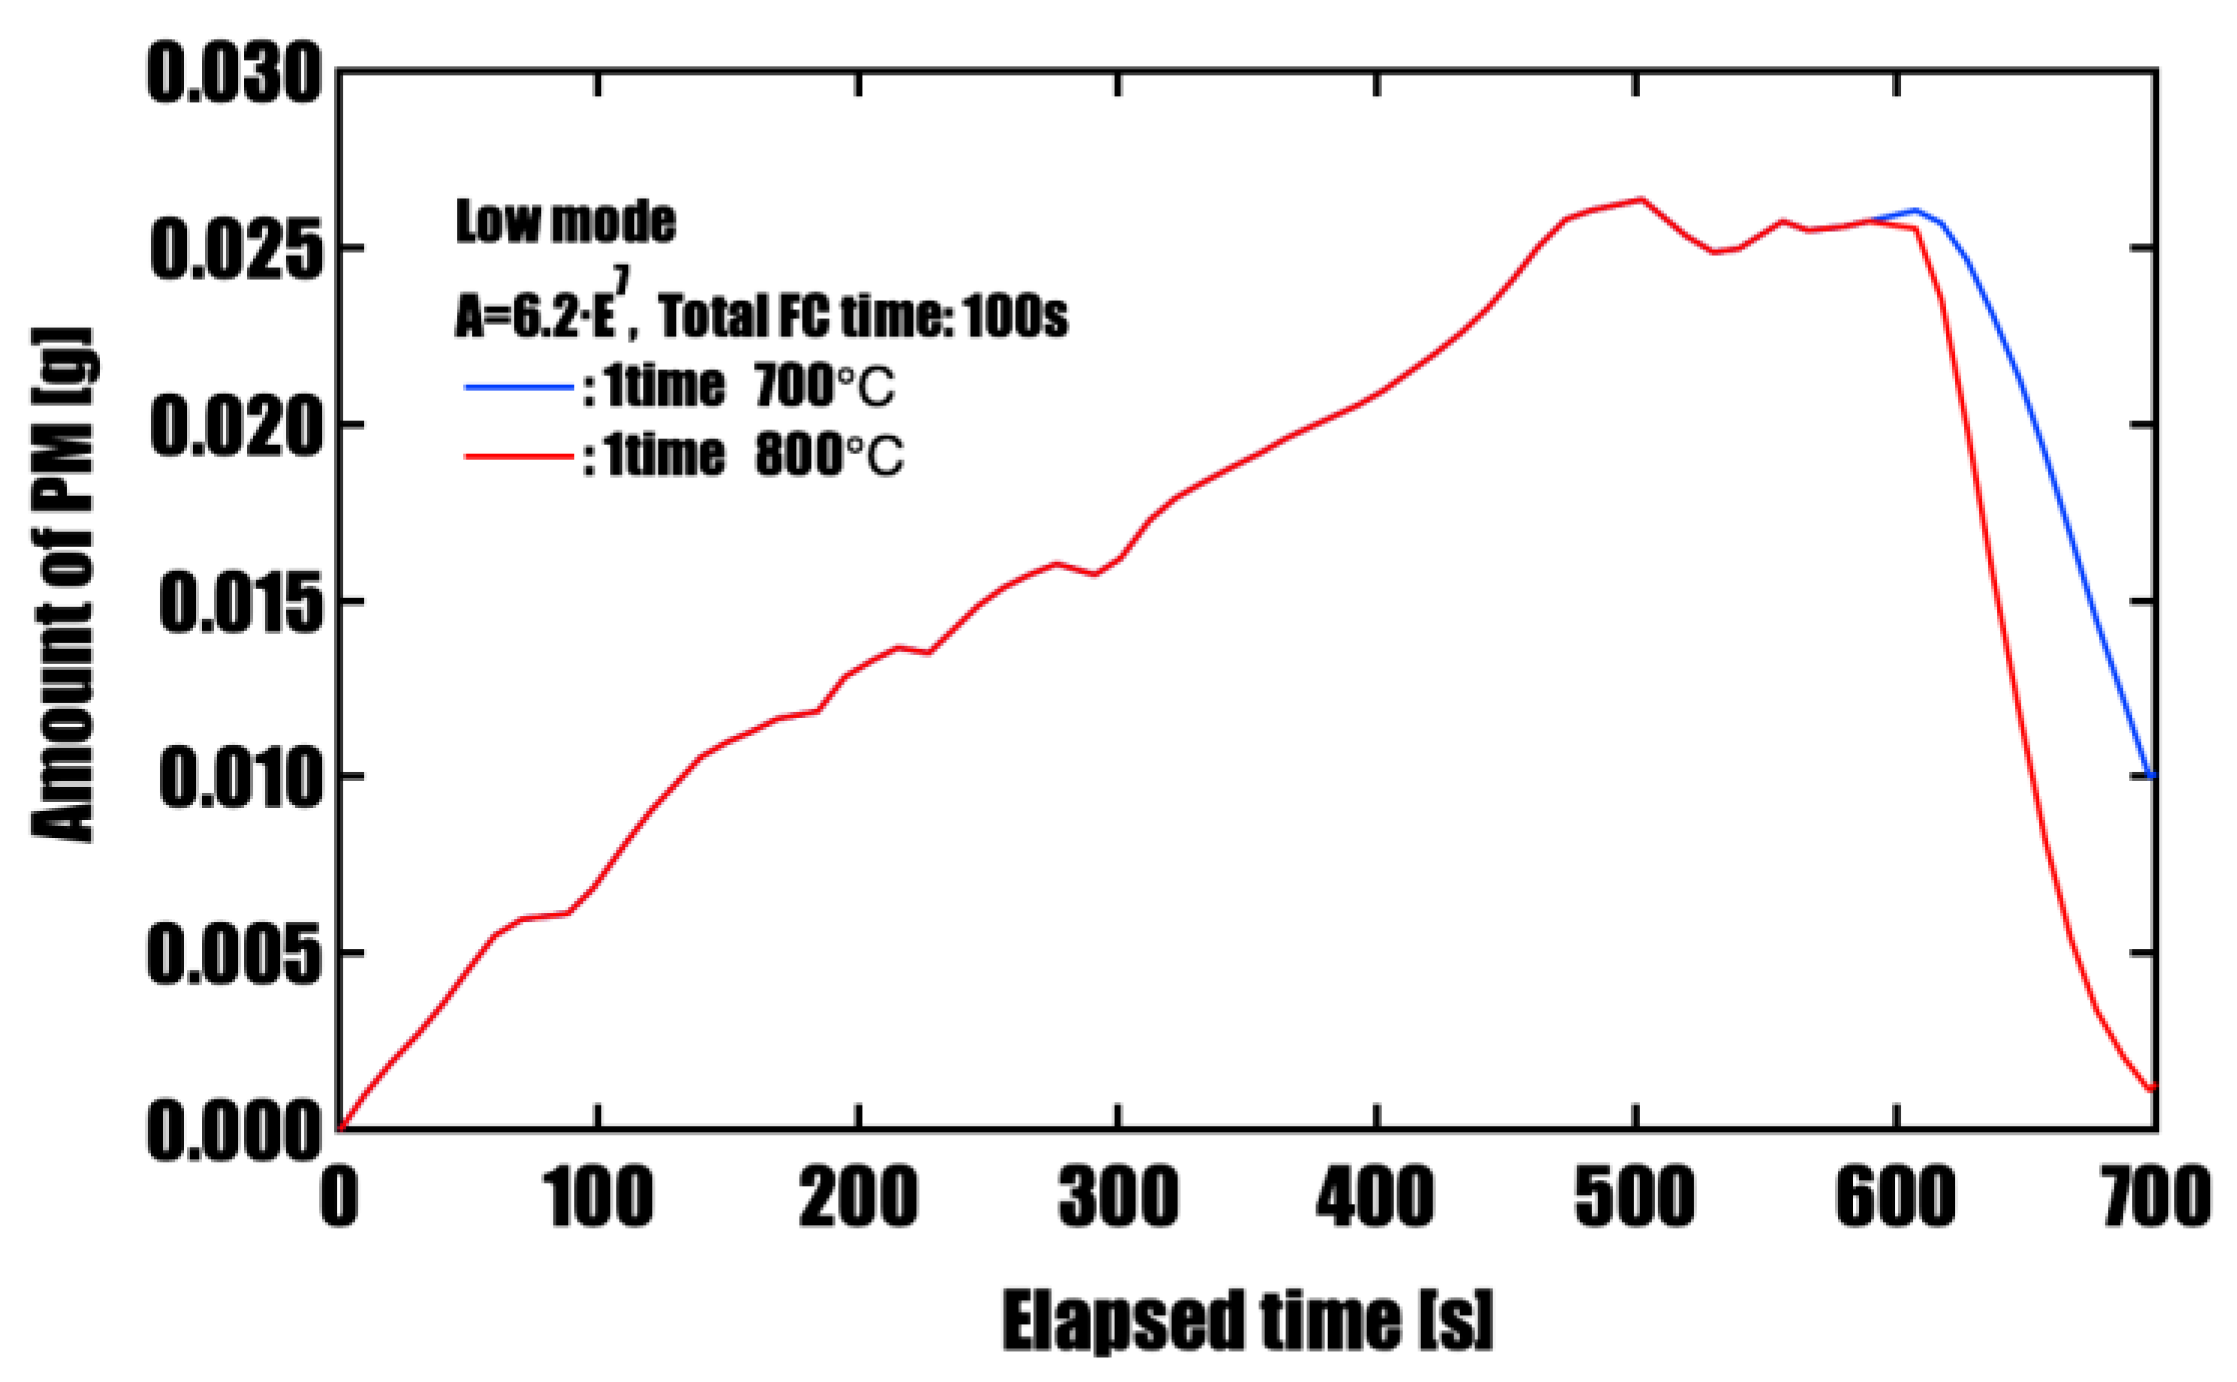
Figure 11.
Result of three separate forced FC installations for 100 seconds in WLTC low-speed mode.
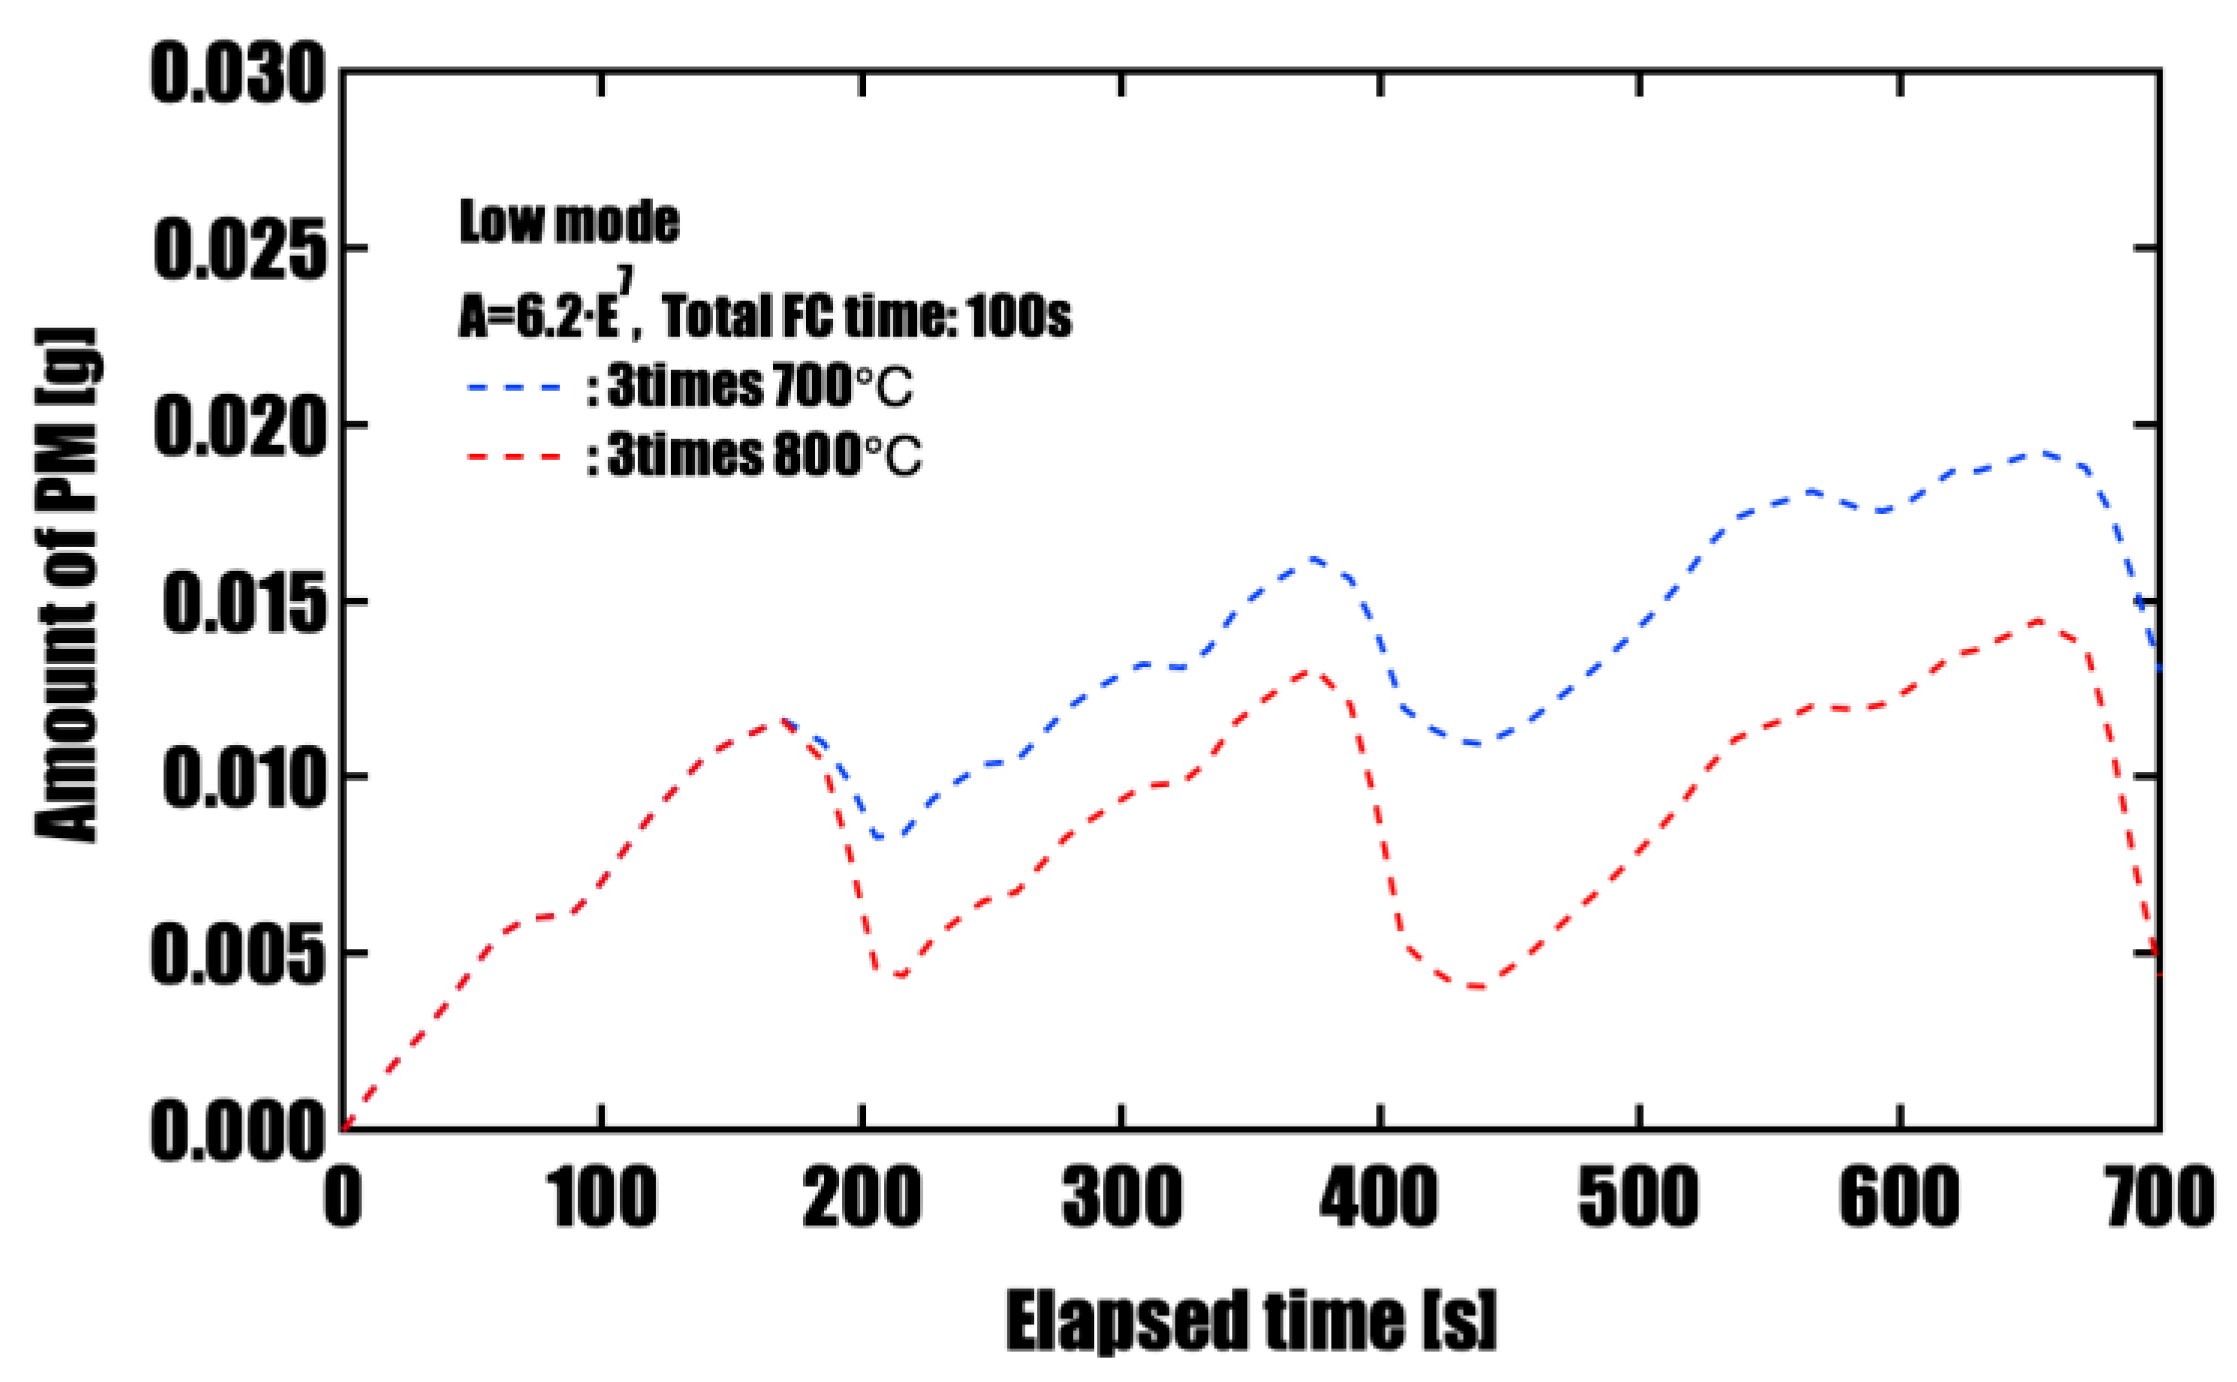
Figure 12.
Result of 5 forced FC in WLTC low-speed mode, introducing 100 seconds of forced FC.
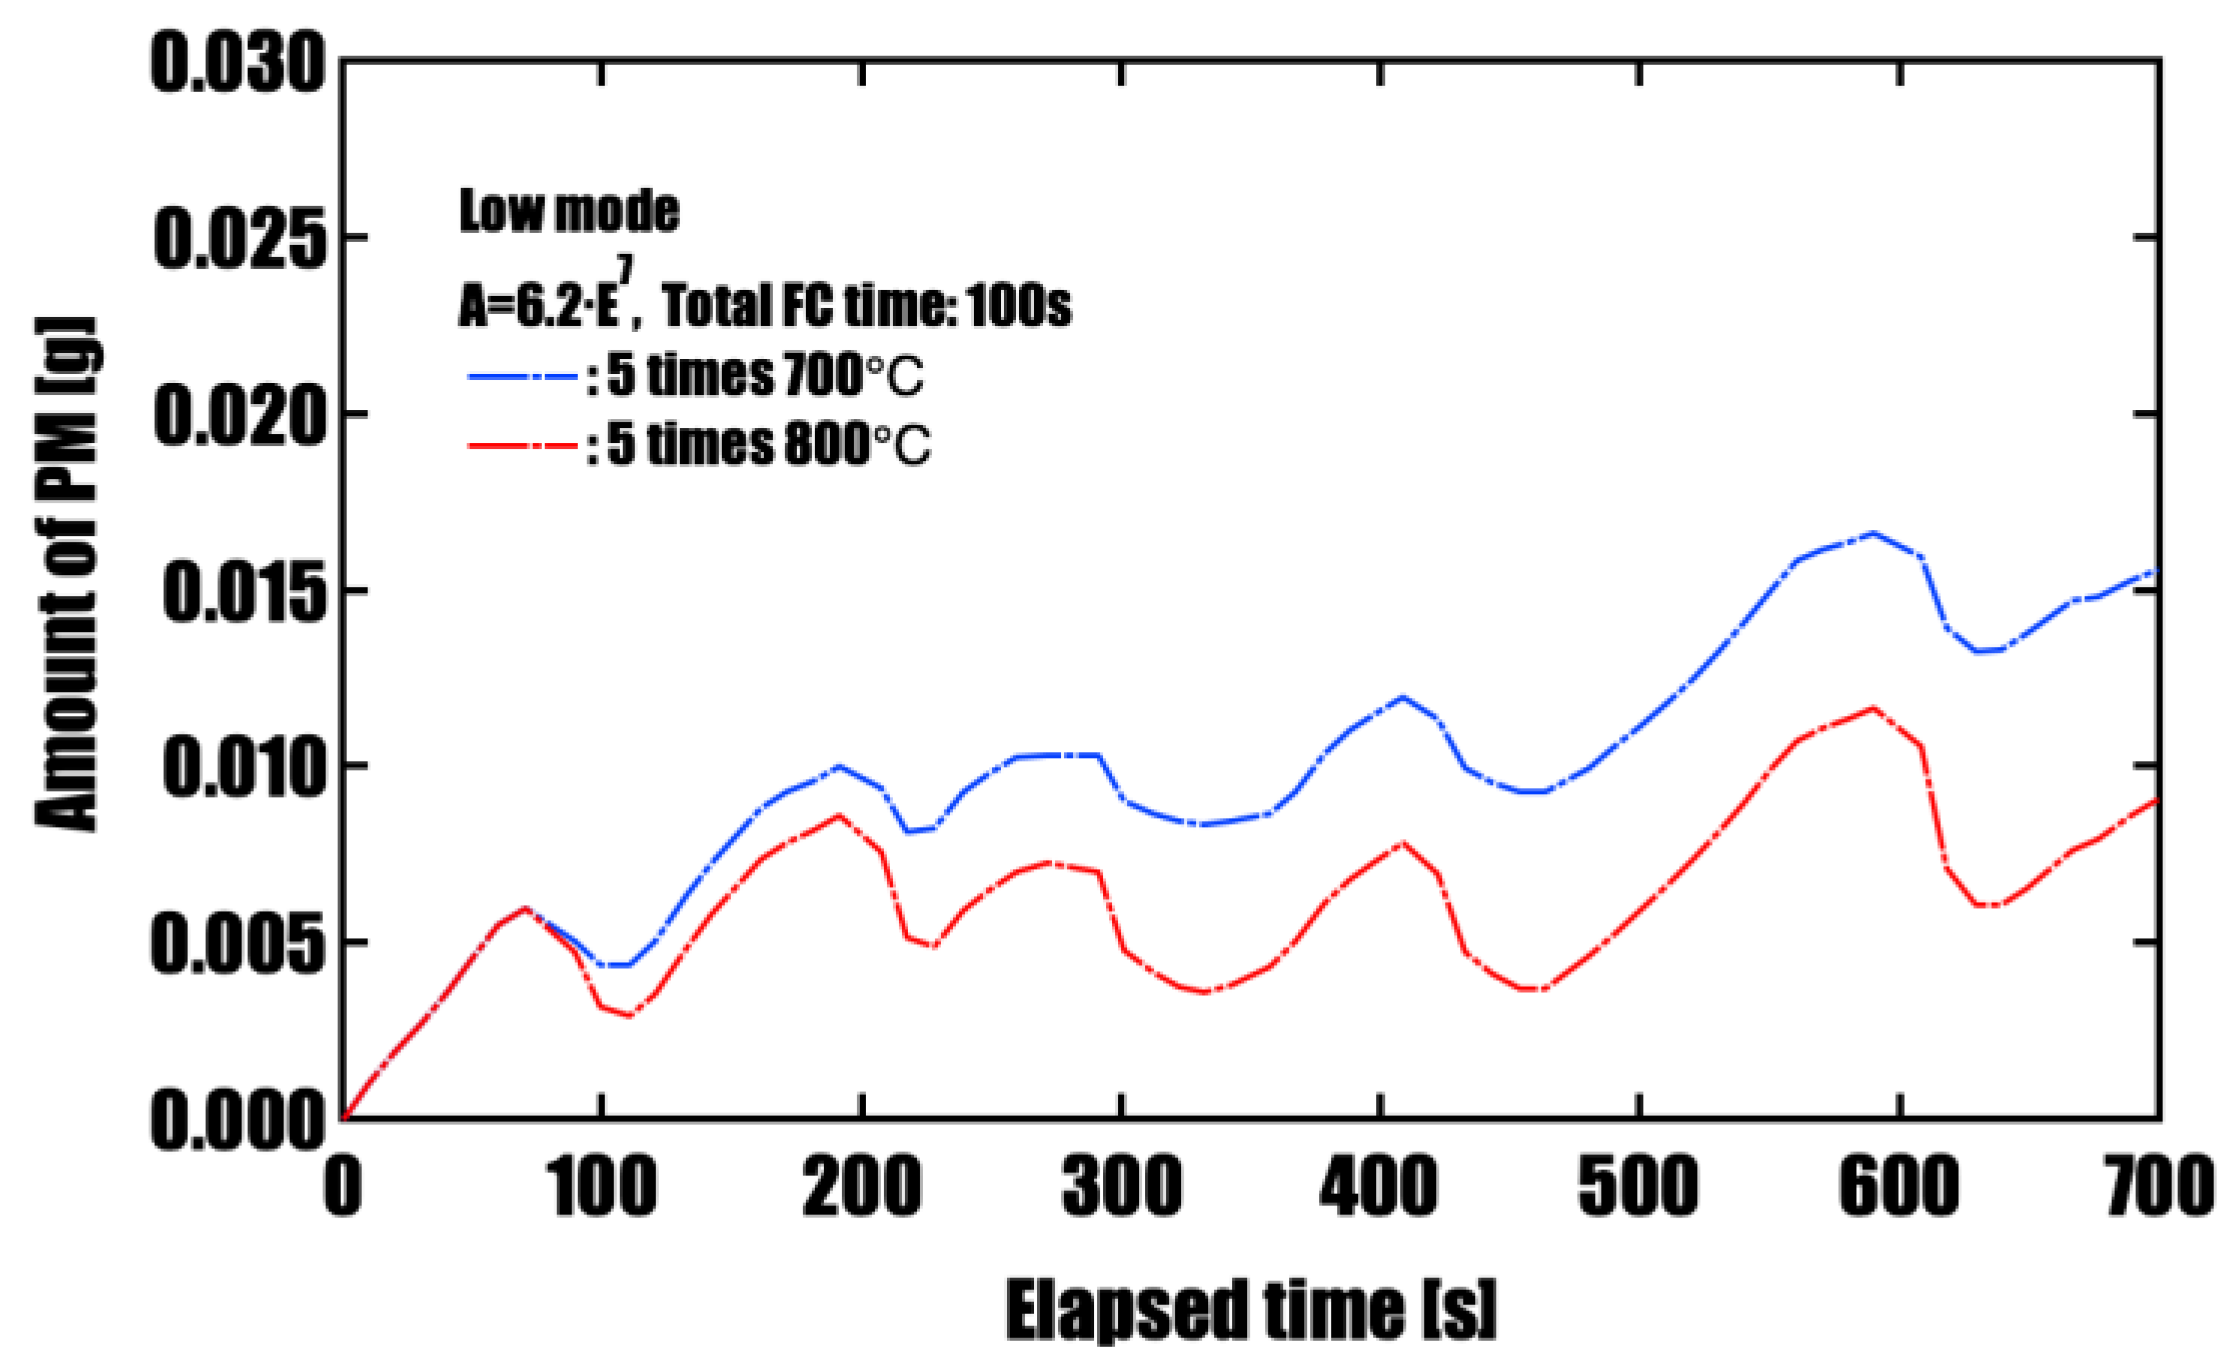
Table 1.
ate of PM combustion.
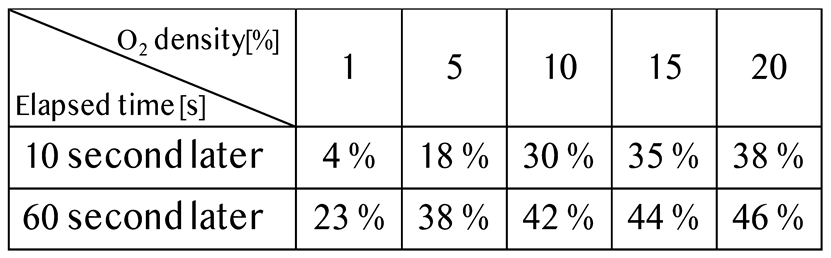 |
Table 3.
PM deposition and residual amount under forced FC introduction conditions (low-speed mode).
Table 3.
PM deposition and residual amount under forced FC introduction conditions (low-speed mode).
| Number of FC installations | Temperature [℃] | Maximum deposited volume [g] | Final residual volume [g] |
| 1 time (100 s) | 700 | 0.026 | 0.010 |
| 1 time (100 s) | 800 | 0.026 | 0.001 |
| 3 times (30+30+40 s) | 700 | 0.019 | 0.013 |
| 3 times (30+30+40 s) | 800 | 0.019 | 0.004 |
| 5 times (20 s × 5) | 700 | 0.016 | 0.016 |
| 5 times (20 s × 5) | 800 | 0.016 | 0.009 |
Disclaimer/Publisher’s Note: The statements, opinions and data contained in all publications are solely those of the individual author(s) and contributor(s) and not of MDPI and/or the editor(s). MDPI and/or the editor(s) disclaim responsibility for any injury to people or property resulting from any ideas, methods, instructions or products referred to in the content. |
© 2025 by the authors. Licensee MDPI, Basel, Switzerland. This article is an open access article distributed under the terms and conditions of the Creative Commons Attribution (CC BY) license (http://creativecommons.org/licenses/by/4.0/).
Copyright: This open access article is published under a Creative Commons CC BY 4.0 license, which permit the free download, distribution, and reuse, provided that the author and preprint are cited in any reuse.


