
Submitted:
07 November 2025
Posted:
10 November 2025
You are already at the latest version
Abstract
Wildfires increasingly threaten Mediterranean landscapes, particularly in regions like Attica, Greece, where urban sprawl, agricultural abandonment, and climatic conditions enhance the risk associated with the Wildland-Urban Interface (WUI). The Mediterranean basin, recognized as one of the global wildfire “hotspots”, has witnessed a steady increase in both fire severity, frequency, and burned area during the last four decades, a trend amplified by urban sprawl and agricultural land abandonment. This study represents the first integrated, region-wide mapping of the WUI and associated wildfire risk in Attica, the most densely urbanized area in Greece and one of the most fire-exposed metropolitan regions in southern Europe, utilizing advanced techniques such as Earth Observation and GIS analysis. For this purpose, various geospatial datasets were combined, including Copernicus High Resolution Layers, a multi-decadal Landsat fire history archive, UCR-STAR building footprints, and CORINE Land Cover, among others. The research delineated WUI zones classified into 40 categories of interface and intermix, revealing that WUI encompasses 26.29% of Attica, predominantly within shrub-dominated areas. An analysis of fire frequency history from 1983 to 2023 indicated that approximately 102,366 hectares have been affected by wildfires. Risk assessments highlighted that moderate hazard zones are most prevalent, covering 36.85% of the region, while approximately 25% of Attica is classified within moderate, high, and very high susceptibility zones. The integrated risk map indicates that 37.74% of Attica is situated in high- and very high-risk zones, principally concentrated in peri-urban areas. These findings underscore Attica’s designation as one of the most fire-prone metropolitan regions in southern Europe, presenting a viable methodology for enhancing land-use planning, fuel management, and civil protection efforts.
Keywords:
WUI
; GIS
; remote sensing
; risk
; Attica
; wildfires
1. Introduction
Wildfires have received increasing global attention in recent decades due to prolonged fire seasons, the rising frequency of extreme fire events, and their proximity to expanding urban and peri-urban areas [1,2]. Beyond their immediate ecological impacts, wildfires pose significant socio-economic and health-related risks, particularly where human development intersects with fire-prone landscapes [3]. These areas, broadly termed the Wildland-Urban Interface (WUI), represent the zones where built environments and wildland vegetation meet and interact [4,5]. The WUI is of particular concern because the juxtaposition of human presence and highly flammable vegetation increases the likelihood of ignition, the intensity of fire spread, and the difficulty of suppression efforts [6,7].
The WUI is not a static entity. It evolves dynamically as a result of urban sprawl, demographic shifts, and land-use changes such as the abandonment of agricultural land and subsequent vegetation encroachment [8,9]. These trends are further exacerbated by climate change, which is projected to intensify heat waves, extend drought periods, and prolong fire seasons in the Mediterranean basin [1,10]. The outcome is a complex and expanding landscape of risk, where both ecosystems and human communities are increasingly vulnerable to catastrophic fire events [11].
Southern Europe has emerged as one of the global flashpoints for WUI-related fire risk. Across the Mediterranean, rising urbanisation and the dispersion of settlements into vegetated landscapes have increased exposure, while governance frameworks often struggle to keep pace with rapid land-use changes [9,12,13]. The Mediterranean basin has historically endured recurrent wildfires, often megafires, with catastrophic impacts on biodiversity, ecosystem services, and human settlements. In recent decades, residential areas have become increasingly exposed, with tragic consequences in countries such as Portugal, Spain, and Greece [9,14].
Greece has experienced a sharp increase in the frequency and severity of wildfires, particularly in the Attica region, which encompasses the Athens metropolitan area and is home to more than 3.8 million inhabitants. Major fire events have repeatedly devastated Attica: in 2007 and 2009, wildfires burned over 14,500 and 13,000 hectares of pine forest, respectively; in 2018, the Mati fire resulted in 104 fatalities, hundreds of injuries, and the destruction of 5,000 hectares [15,16]. The Varympompi fire in 2021 destroyed approximately 7,500 hectares of forest, along with hundreds of dwellings and livestock, while in 2023, wildfires affected 18,000 hectares across northern and eastern Attica. Most recently, in August 2024, more than 10,000 hectares were burned in Mt. Penteli and surrounding areas, with one fatality and numerous injuries. These events underline both the human and ecological toll of WUI fires in Attica, where rapid urban expansion intersects with fire-prone ecosystems [17,18,19,20,21,22].
Demographic and land-use changes have intensified this risk. According to the Hellenic Statistical Authority (ELSTAT), the population of mainland Attica doubled between 1961 (1.85 million) and 2021 (3.81 million) [23]. Much of this growth occurred in suburban and peri-urban areas, leading to unplanned and dispersed development [13,24,25]. This monocentric and fragmented urban form, typical of Mediterranean cities, has placed enormous pressure on local forests and disrupted ecological balance [9,24]. Land-use statistics from the Copernicus Program confirm the trend: between 1990 and 2018, agroforestry land decreased by 13%, agricultural land by 20%, and forest cover by 9%, while urban cover increased by 75% [26,27]. The reduction of forest cover undermines critical ecosystem services such as water regulation, erosion control, and carbon sequestration, while biodiversity loss is compounded by habitat fragmentation [28,29,30]. At the same time, regeneration capacity has lagged behind the pace of urban expansion, resulting in highly vulnerable WUI landscapes [31,32]. Attica is thus a region where the WUI is expanding rapidly, shaped by anarchic settlement patterns, incomplete or poorly planned road networks, and a fragmented landscape mosaic of forests, shrublands, and urban structures. These characteristics not only facilitate fire ignition and spread but also complicate firefighting logistics and evacuation strategies [33,34]. The unique interaction of urban growth, land-use change, and fire-prone ecosystems renders Attica a critical case study for understanding WUI vulnerability in the Mediterranean.
Earth Observation from the Copernicus program of the European Space Agency, together with the National Aeronautics and Space Administration’s Landsat satellite records, offers exactly what peri-urban fire-risk studies need, such as high spatial detail, systematic revisits, and a multi-decadal archive to quantify land-cover/use change, urban expansion, burn scars, and their hydrological/geomorphic impacts. Sentinel-2 multispectral imagery, in concert with CORINE Land Cover and the Copernicus High Resolution Layers (e.g., tree cover density, dominant leaf type, small woody features, imperviousness), forms a harmonized evidence base for WUI mapping, susceptibility metrics, and change detection at the regional scale. By coupling these Copernicus layers with GIS workflows, accurate monitoring and mapping of urbanization and fire history can be used to produce comparable, decision-ready products to assist WUI studies.
Research on the WUI has expanded considerably over the past two decades, with much of the foundational work originating in North America [4,5,8]. Early definitions of the WUI combined criteria of housing density, vegetation cover, and buffer distances to classify interface and intermix areas, providing a framework that allowed for consistent mapping across large territories [4]. Subsequent studies refined these methods by incorporating high-resolution remote sensing data, cadastral building footprints, and census information, which enabled more precise assessments of WUI extent and dynamics [5]. In the United States, such approaches have been instrumental in linking settlement patterns to fire occurrence and suppression challenges, ultimately informing national fire management and policy strategies [35].
In Europe, interest in WUI research has grown primarily in response to the increasing frequency and severity of wildfires in Mediterranean countries. France, Spain, Italy, and Portugal have developed regional methodologies that combine Corine Land Cover data with cadastral or population datasets to delineate WUI zones and assess associated fire risks [9,33]. More recent advances have capitalised on Copernicus High Resolution Layers and Sentinel imagery, which allow for the production of harmonised WUI maps at continental and regional scales [27]. These studies not only examine the spatial overlap of settlements and vegetated areas but also integrate fire history, fuel characteristics, and socio-economic vulnerability into comprehensive risk assessments [14,36].
Despite these advancements, relatively few efforts have systematically mapped the WUI in Greece at a regional scale. Existing research has often focused on post-fire impact studies or individual catastrophic events, such as the 2007 Peloponnese fires or the 2018 Mati tragedy, rather than comprehensive analyses of the spatial interactions between urban expansion and wildland vegetation [12,37,38,39,40]. While valuable in documenting the social and ecological consequences of specific disasters, these case studies do not provide a broader framework for understanding WUI dynamics across Greece’s highly urbanised and fire-prone regions. This gap is particularly evident in Attica, where rapid demographic growth, dispersed settlement patterns, and recurrent megafires underscore the urgent need for spatially explicit WUI mapping and integrated fire risk assessment.
Despite noteworthy progress in WUI mapping and wildfire modelling, several challenges persist in translating methodological advances into effective risk assessment frameworks, particularly in Mediterranean contexts such as Attica. One of the primary difficulties concerns data availability and scale. Variables such as building materials, road connectivity, and proximity to firefighting infrastructure strongly influence local vulnerability, yet such datasets are rarely available in consistent or comprehensive formats at the regional scale, forcing researchers to adopt generalised assumptions that may obscure local variations in susceptibility [41]. In addition, land-use dynamics pose a further challenge. Processes such as agricultural abandonment, informal urbanisation, and spontaneous settlement growth create constantly shifting boundaries between vegetated and built areas, which are difficult to capture using static datasets like Corine Land Cover, and which may underestimate the speed of vegetation encroachment into peri-urban zones [26,42]. Climate change further compounds these uncertainties, as projected increases in temperature, drought frequency, and wind extremes alter fire behaviour in complex ways, while indices such as the Fire Weather Index (FWI) provide valuable baseline indicators but struggle to fully account for long-term climatic variability and extreme weather events [43,44]. Finally, gaps in spatial planning and governance represent a structural limitation in countries such as Greece, where WUI expansion often occurs without coordinated regulation or adequate fire-prevention measures. The anarchic settlement patterns, incomplete or poorly planned road networks, and limited emergency access in peri-urban areas of Attica not only facilitate ignition and fire spread but also hinder evacuation and the deployment of firefighting resources [34,39,45,46]. Collectively, these factors underscore the inherent complexity of assessing WUI fire risk and highlight the urgent need for integrated approaches that combine remote sensing, socio-economic data, and policy frameworks to deliver actionable insights for risk reduction and management.
The principal objective of this study is to identify, map, and categorise the WUI of Attica and to assess its fire risk profile. By integrating remote sensing data, cadastral building footprints, vegetation datasets, and historical fire records, this research develops a comprehensive wildfire risk map for the Attica region. The outputs aim to support civil protection agencies, urban planners, and policymakers by providing spatially explicit insights into WUI vulnerability and fire-prone areas.
2. Materials and Methods
2.1. Study Area
The study was conducted in the mainland region of Attica (Figure 1), Greece, located in central Greece, excluding the islands, and the continental municipalities that are situated administratively in Attica but geographically belong to the Peloponnese region. The study area is located between latitudes 37°38′56′' and 38°20′24′' N and longitudes 23°06′25 and 24°05′09 E. It covers an area of almost 300,000 hectares and its dominant topographical features include the eastern part of the Gerania Mountains, as well as the Pateras, Aigaleo, Parnitha, Penteli, and Hymettus Mountains, the last four of which form the Attica Basin. Altitude ranges from 0 to 1,409 m, with an average of 279 m. The mountains are characterised by slopes of more than 30%. The Attica basin encompasses the entire Athens metropolitan area, the country’s largest city and capital, with a population of over 3.8 million inhabitants. The metropolitan area of Athens is one of the most densely populated regions in Greece, characterized by a lack of open and green spaces and continuous urban expansion.
The region also encompasses areas that are part of the Natura 2000 network, accounting for approximately 15% of Attica's total area.
The Attica region is characterized by a variety of vegetation types that contribute to the area's biodiversity, including Mediterranean pine forests dominated by Pinus halepensis, maquis shrublands, and phrygana. Pinus Halepensis forests are a dominant feature and influence fire behaviour by contributing to and shaping the fuel type. Pinus h. is one of the most fire-prone vegetation types in the Mediterranean basin due to its high resin content and the accumulation of its highly flammable needle litter, which allows fires to spread rapidly. These forests are commonly found in the lower altitudes of mountains, while the peaks are mainly covered by Abies Cephalonica forests, particularly on Mt. Parnitha and Gerania. Several areas on the mainland of Attica are covered by macchie at moderate altitudes and in lowlands, especially near the coast.
Attica has a Mediterranean climate, characterized by hot, dry summers and mild, wet winters. The mean annual temperature is approximately 19 °C (with a mean daily maximum of around 23 °C), and annual precipitation is about 400–450 mm, with December being the wettest month. Recent observations indicate warming and drying trends, with the strongest summer warming in northern and eastern Attica. More frequent heatwaves and prolonged droughts dry fuels faster, and lower relative humidity increases wildfire danger.
2.2. Data
In Table 1, the distinct types of data sets of the study are presented. The orthophoto maps were used to compare different types of vegetation data and validate building footprints. Subsequently, urban structure and vegetation data were used to map the WUI. Landsat 4, 5, 7, 8, and 9 images were employed for historical fire mapping from 1983 to 2023, creating a fire frequency map. The risk assessment required various types of inputs, such as a Digital Elevation Model (DEM) and a slope map, which were created from the topographic maps (scale 1.5,000), as well as climatic data, for which we modified the Fire Weather Index to the 90th percentile for RCP (Representative Concentration Pathway) 4.5. The data were processed using ESA’s SNAP (v. 10.0.0), ArcGIS (v. 10.8.1) and QGIS (v. 3.34) software.
2.3 Methods
2.3.1. WUI Definition and Conceptual Framework
Consistent with European WUI practice, we define the WUI as areas where structures and wildland vegetation are in direct contact or proximity, with distances and buffer zones tailored to the morphology of Attica. North American thresholds (e.g., ≥6.18 structures·km⁻² and proximity within 2.4 km of ≥75% wildland vegetation) were considered but not adopted due to the region’s higher urban density and finer-scale vegetation mosaic. Instead, we implement a three-stage approach: (a) fuel type mapping, (b) dwelling characterisation, and (c) WUI classification [4,5,33,47].
2.3.2. Fuel Type Mapping
To ensure the selected vegetation dataset accurately represented fuel types, multiple vegetation datasets were compared based on recent orthophoto maps of Attica and historical fire data. The dataset with the highest accuracy and most recent update was chosen; in this case, the Copernicus High Resolution Layers, which were processed by dissolving fuel types and assigning a weighted value to each vegetation type (Table 2). This resulted in a new layer in which the two types of mixed forest had the highest weighted values, followed by coniferous forest, shrubs, and deciduous forest. The values were assigned considering the amount of fuel contained in each type of vegetation, its flammability, and its spread ability [48,49,50,51].
Subsequently, a 400 m “context” buffer was generated around fuel patches to represent near-site influence consistent with European practice. This buffer distance, shorter than the 2,400 meters often used in North American WUI studies, was chosen due to the high urban density and varied vegetation types in Attica, effectively defining the boundaries of interface areas [4,5]. Grouped fuels form a continuous “potential” surface used downstream in hazard and for distinguishing intermix contexts.
2.3.3. Dwelling Characterization
Building footprint data obtained from the UCR-STAR database contained individual structures, which allowed us to use the precise spatial location of each building, and thus identify dwelling types accurately. The approach was the identification of dwelling types using distance and counting criteria method of Lampin-Maillet et al. [47]. To distinguish between (i) isolated dwellings, which are defined as ≤3 buildings spaced 100 meters apart, (ii) scattered dwellings, which are defined as 4-50 buildings less than 100 meters apart, (iii) dense cluster dwellings, which are defined as ≥50 less than 100 meters apart, and (iv) very dense cluster, which are defined as ≤10 buildings spaced less than 30 meters apart, two buffers of 50 and 15 meters were first established around each building and the number of buildings within each buffer was counted (Figure 2). Finally, a 100-metre buffer zone was created around each building characterised as WUI, which was selected considering the European standards for fire safety zones around structures, European studies on WUI mapping, and guidelines from the Greek Fire Department and Civil Protection.
2.3.4. Classification of WUI Types
Following the delineation of fuel zones and dwelling clusters, WUI areas were classified into two categories according to the proportion of surrounding vegetation. Areas in which the contact zone around dwellings adjoined vegetation but overall cover remained below 50% within the 400 m context were labelled Interface WUI. Areas where vegetation exceeded 50% of the 400 m context were labelled Intermix WUI, reflecting the direct embedding of structures within continuous fuel beds.
Each WUI polygon was then assigned a three-digit code combining: (i) WUI type (interface = 100; intermix = 200), (ii) dwelling density (isolated = 10, scattered = 20, dense = 30, very dense = 40), and (iii) dominant vegetation type (broadleaf = 1, shrub = 2, conifer = 3, mixed-1 = 4, mixed-2 = 5). This coding scheme produced 40 distinct WUI classes (Table 3), which served as inputs for susceptibility analysis and wildfire risk assessment.
2.3.5. Fire Mapping
The correlation between past fire events and the expansion of the WUI, as well as the related risk, was examined through the temporal monitoring of these events. Burned areas were identified using Landsat imagery (1983-2023) and the Normalized Burn Ratio (NBR). The NBR index is frequently used to highlight burned areas in fire zones. The formula combines the use of near infrared (NIR) and shortwave infrared (SWIR) wavelengths (Equation 1). where healthy vegetation exhibits high NIR reflectance and low SWIR reflectance. Burned areas show the opposite [52]. Annual burn perimeters were delineated, merged per year, and stacked to compute per-pixel fire frequency (number of burn years). Results were cross-checked against the BSM-NOA fire inventory, with additional verification using available EFFIS perimeters.
2.3.6. Risk Assessment Concept and Workflow
Wildfire risk (R) was conceptualised as the interaction of hazard (H) and susceptibility (S), consistent with disaster risk theory and previous wildfire risk frameworks [44,53,54,55,56]. Hazard refers to the biophysical processes that determine the probability and potential intensity of fire, while susceptibility reflects the degree of exposure and vulnerability of assets located within the WUI.
2.3.6.1 Hazard
Hazard was modelled as a weighted linear combination of four geospatial factors: fire weather, fuel type, fire history, and topography. Each factor was standardised to the range [0, 1] through min-max normalisation and then aggregated as Equation 2. Where W is the Fire Weather Index (FWI90), F is fuel type, FH is historical fire frequency, and T is topography (slope and elevation classes). Weights (ww, wf, wfh, wt) were assigned through a weighted linear combination (WLC) approach, informed by previous Mediterranean wildfire risk studies [10,31,43,45,46,51]. In line with these studies, fire weather (0.35) was weighted highest, reflecting the decisive role of drought and wind extremes in Mediterranean fire regimes. Fuel type (0.25) and fire recurrence (0.25) were assigned intermediate weights due to their combined influence on burn probability and severity. Topography (0.15) was considered secondary, acting mainly as a spread modifier. Although not derived through a formal Analytic Hierarchy Process, this scheme is consistent with prior European risk assessments. A sensitivity analysis, in which each weight was varied ±20%, confirmed that the spatial pattern of high-risk hotspots was robust to alternative weighting. This formulation ensures that areas with a propensity for extreme weather, highly flammable vegetation, and a recurrent fire history receive higher hazard scores, while slope and elevation modulate the final distribution by influencing fire spread rates and suppression difficulty.
2.3.6.2 Susceptibility
Susceptibility was derived from two inputs: the WUI classification and the Corine Land Cover (CLC 2018) layer [44,57,58]. Each WUI class was assigned an ordinal score (Low, Medium, High, Very High) corresponding to values one through four, using the predefined risk matrix, which applied only to the WUI categories and not to fuels separately. The matrix was operated by cross-classifying dwelling density and WUI type with the dominant vegetation. For example, scattered or dense intermix clusters adjacent to coniferous or mixed forest were assigned a Very High susceptibility, whereas very dense interface clusters were consistently classified as Low. In parallel, CLC land-cover types were reclassified to reflect their relative exposure potential, with transitional, shrubland, and forest areas ranked higher than compact urban land uses [58].
The two layers were then combined into a single susceptibility index using a weighted overlay (Equation 3):
Where WUI is the susceptibility score derived from the matrix and LC is the reclassified land-cover score. Weights were defined through a WLC approach, with WUI given greater importance (, than the land-cover component , because it directly encodes settlement density, type, and proximity to fuels. The resulting values were grouped into four classes (Low, Medium, High, Very High) to produce the final susceptibility surface at 30 m resolution.
The final wildfire risk surface was produced by combining the hazard and susceptibility indices through a weighted overlay (Equation 4):
The resulting wildfire risk map offers a quantitative analysis of WUI vulnerability in Attica, highlighting areas with the highest potential for severe wildfire impact. This structured approach integrates remote sensing, GIS analysis, and risk modelling to provide a comprehensive assessment of WUI zones and wildfire risk, offering critical insights into fire-prone areas and the effectiveness of potential mitigation strategies.
3. Results
3.1. Fire History and Frequency (1983-2023)
The multi-decadal analysis of Landsat imagery using NBR identified a cumulative burned area of 102,366.08 ha across Attica during 1983-2023, corresponding to 34.99% of the regional extent (Attica reference area ≈ 292,519.75 ha). Single-burn pixels dominate the fire record, accounting for 64.99% of the total burned area (66,529.97 ha). Areas burned twice and three times represent 25.24% (25,835.84 ha) and 7.05% (7,214.60 ha), respectively, while frequencies four to eight events together comprise the remaining ≈3% (2,606.71, 139.55, 34.07, 3.75, and 1.59 ha, respectively) (Table 3). Expressed as shares of the entire Attica region, single-burn areas cover 22.74%, two burns 8.83%, three burns 2.47%, and the aggregate of four to eight burns approximately 1%. These results indicate that fires recur over substantial portions of northern and eastern Attica, with most affected pixels experiencing one or two events during the study period. (Figure 3).

Table 3.
Burn frequency in Attica (1983-2023).
| Burn Frequency | Area (ha) | % of total burned area | % of Attica |
|---|---|---|---|
| 1 | 66,529.97 | 64.99% | 22.74% |
| 2 | 25,835.84 | 25.24% | 8.83% |
| 3 | 7,214.60 | 7.05% | 2.47% |
| 4 | 2,606.71 | 2.55% | 0.89% |
| 5 | 139.55 | 0.14% | 0.05% |
| 6 | 34.07 | 0.03% | 0.01% |
| 7 | 3.75 | <0.01% | <0.01% |
| 8 | 1.59 | <0.01% | <0.01% |
| Total | 102,366.08 | 100% | 34.99% |
1 Note: Values smaller than 0.01% are denoted as “<0.01”. Percentages may not sum to exactly 100% due to rounding.
3.2. WUI Distribution
Integration of dwelling density with vegetation context produced a detailed WUI map for Attica. The mapped WUI covers 76,909.47 ha, equivalent to 26.29% of Attica. Interface WUI occupies 49,348.93 ha, exceeding Intermix WUI (27,560.54 ha). Among the forty classes, the most extensive are 142 (Interface, Very dense dwellings with Shrubs) and 132 (Interface, Dense dwellings with Shrubs), representing 12.90% (9,921.46 ha) and 12.60% (9,690.65 ha) of total WUI, respectively. These correspond to 3.39% and 3.31% of the Attica region. At the opposite end of the distribution, class 221 (Intermix, Scattered dwellings with Broadleaf Forest) covers only 13.44 ha (0.02% of WUI; 0.005% of Attica), while class 211 (Intermix, Isolated dwellings with Broadleaf forest) accounts for 26.53 ha (0.03% of WUI; 0.009% of Attica). The complete distribution of all 40 WUI classes is provided in Table 4. (Figure 4, Figure 5, Figure 6, Figure 7).
3.3. Hazard
The hazard surface, derived from fire weather, fuel type, fire frequency, and topography, ranged from 0.13 to 0.92, within the theoretical bounds of 0 to 1. The realised span, therefore, covered 78.7% of the possible envelope. The empirical mean was 0.54, close to the theoretical mean of 0.50. In contrast, the empirical standard deviation (0.09) was markedly lower than the theoretical value (0.24), indicating a concentration of hazard values around the mid-range and a narrower spread than expected. Classified by natural breaks into four categories, Moderate hazard covers 107,295.65 ha (36.85%), Low hazard 89,831.48 ha (30.85%), High hazard 54,440.38 ha (18.70%), and Very High hazard 39,624.79 ha (13.61%) (Table 5, Figure 8).
3.4. Susceptibility
The susceptibility index ranged from 0.00 to 1.00, consistent with its theoretical bounds. The empirical mean (0.79) exceeded the theoretical mean (0.50), while the empirical standard deviation (0.36) was slightly above the theoretical value (0.30), indicating that susceptibility values were concentrated toward the upper portion of the scale with modest dispersion. After classification into four ordinal categories, Low susceptibility dominates with 221,582.66 ha (75.88%), followed by Moderate 28,364.49 ha (9.71%), High 24,394.94 ha (8.35%), and Very High 17,672.12 ha (6.05%) (Table 6, Figure 9).
3.5. Integrated Wildfire Risk
The final wildfire risk surface, derived from the weighted overlay of hazard and susceptibility, ranged from 0.11 to 0.90 within the theoretical bounds of 0–1, covering 79.3% of the possible extent. The empirical mean (0.38) was lower than the theoretical midpoint (0.50), while the empirical standard deviation (0.11) was markedly lower than the theoretical value (0.29), indicating a clustering of risk values toward mid-to-low levels with a comparatively tight spread. Following reclassification into four risk categories, Moderate risk is most prevalent, at 97,127.78 ha (33.51%), followed by Low at 83,341.02 ha (28.75%), High at 71,438.89 ha (24.64%), and Very High at 37,978.20 ha (13.10%) (Table 7, Figure 10).
To examine the robustness of the hazard weighting, we explored a simple sensitivity test in which each weight was varied by ±20% while the others were proportionally adjusted. Across these alternatives, the overall pattern of hazard distribution in Attica was largely stable. High-hazard clusters in the eastern and northern peri-urban belts persisted in all scenarios, with only minor shifts in relative extent. These results suggest that the precise weighting has some influence on local scores but does not substantially alter the spatial identification of priority hazard zones.
4. Discussion
4.1 Key Findings
This study presents the first region-wide delineation of the WUI and an integrated wildfire-risk surface for Attica. Consistent with the established definition, where settlements are in proximity or intermix with wildland fuels, WUI occupies roughly one quarter of the region and is predominantly interface, i.e., dense and very-dense settlement clusters abutting vegetated edges; intermix occurs where dwellings are embedded within continuous vegetation. This configuration mirrors patterns reported for Mediterranean Europe, where dispersed housing within shrub-forest mosaics commonly exceeds compact interface belts[33,34].
Fire history further underscores the structural nature of the problem: approximately one-third of Attica has burned at least once since 1983, with most pixels affected by one or two events, recurrence levels comparable to other Mediterranean landscapes but affecting a substantial share of a metropolitan region [11,59].
When hazard and susceptibility are integrated, over one-third of Attica falls in High or Very High risk classes, with hotspots concentrated along the eastern and northern peri-urban belts. This pattern is consistent with theory and with operational practice: risk is highest where exposure (dense intermix/interface) overlaps with danger (extreme fire-weather windows) and continuous, flammable fuels [60].
These patterns reflect decades of peri-urban expansion since the 1960s, which embedded dispersed housing within flammable vegetation mosaics and produced the contemporary WUI configuration. At the typology level, we delineated 40 WUI classes across Attica. Indirect or near-contact categories account for ≈approximately 64% of the total WUI, while high- and very-high dwelling densities comprise ≈approximately 70%. Within the WUI, vegetation is dominated by shrubs (≈approximately 42%), followed by mixed forest (type 2; ≈approximately 24%) and conifers (≈approximately 22%). These patterns underscore the central role of shrub fuels in exposure [46,61].
The fire recurrence patterns observed here further align with Mediterranean fire regimes, where large landscapes experience repeated burning over decadal timescales. Moreira et al. (2020) reported comparable recurrence frequencies in Portugal and Italy, where most burned pixels were affected once or twice, with a smaller fraction experiencing multiple fires [11]. In Attica, the recurrence profile is similar, but the overall proportion of the region affected, approximately 35% of the land area since 1983, is exceptionally high. This figure is considerably greater than values reported for other urbanised Mediterranean regions, underlining the compounded pressures of climatic variability, fuel availability, and demographic change [17].
4.2. WUI Delineation: Methodological Positioning and Comparability
Our delineation follows established practice, combining settlement configuration with vegetation extent to distinguish interface from intermix WUI. Prior studies show that settlement metric (housing points vs. building footprints), fuel layers, and thresholds can shift the mapped WUI extent and class balance[62,63,64]; adopting building footprints with high-resolution Copernicus HRL vegetation layers reduces known artifacts of coarse population grids and improves sensitivity to shrub-dominated fuels [46,65,66]. In Attica’s heterogeneous peri-urban mosaics, this design clarifies the prevalence of shrub-dominated intermix and likely explains the larger share of intermix we observe relative to interface. Methodological alignment with recent European mapping also enhances comparability, while highlighting that studies using different settlement proxies or coarser fuels may under-detect shrub-centric WUI [49,67]. These choices, therefore, have direct interpretive consequences for both WUI extent and the spatial pattern of integrated risk.
Taken together, these comparisons situate Attica firmly within the Mediterranean WUI paradigm while simultaneously underscoring its status as a critical hotspot of fire risk. The region exemplifies how the interaction of urban sprawl, fuel continuity, and recurrent fire regimes produces landscapes where the balance between human settlement and ecological processes is increasingly unstable.
In the Greek context, where high-resolution WUI mapping remains limited, the Attica maps and risk layers are among the first region-scale, decision-ready products that explicitly link WUI typologies to integrated wildfire risk. Together, these choices operationalise exposure within susceptibility by weighting WUI configuration over generic land cover and provide a replicable template for metropolitan WUI mapping that improves comparability across studies [43,68].
4.3 Integrated Wildfire Risk: Patterns and Drivers
The integrated risk surface, combining a hazard layer that captures fire-weather and topographic potential with a susceptibility layer that encodes settlement-fuel juxtaposition, shows a distribution clustered around mid-lower values, with a narrower spread than the theoretical distribution and a mean below the expected midpoint. The upper tail, however, is concentrated in peri-urban belts where intermix WUI coincides with continuous, shrub-dominated fuels and steeper slopes. In these areas, pervasive contact between vegetation and structures sustains high exposure even when hazard is only moderate, whereas very dense interface clusters embedded within largely built fabric register lower susceptibility, hence lower integrated risk, despite occasional high-hazard windows. Risk is not negligible in compact or agrarian WUI. Under dry conditions, agricultural and ruderal fuels can act as bridges that propagate fire into larger vegetated blocks, warranting tailored mitigation even where wildland cover is sparse.
After reclassification, the Moderate risk class is the most extensive, covering approximately 33.51% of Attica, followed by Low (28.75%), High (24.64%), and Very High (13.10%) (Table 7; Figure 10). These class shares reflect the statistical profile of the index, where values concentrate near the mid-range, but hotspots still push into the upper tail. The spatial pattern is consistent with a mechanism in which fuel structure at the settlement edge accelerates potential spread, dispersed intermix layouts increase the density of exposed assets per unit area, and slope amplifies rates of spread during periods of high Fire Weather Index (FWI) [59,67,69]. Two design choices in the mapping help explain these outcomes: weighting the WUI component more strongly than generalized land cover foregrounds settlement-fuel contact, the defining feature of exposure, while the use of natural breaks preserves local contrasts so that shrub-dominated intermix clusters emerge as contiguous hotspots rather than being diluted by global thresholds [33,44,46].
Overall, the results indicate that wildfire risk in Attica is primarily governed by WUI geometry and fuel continuity, with susceptibility skewed toward higher values and hazard clustering around the mid-range. Episodic fire-weather extremes act as a multiplier rather than a sole driver. Consequently, measures that directly alter settlement-fuel contact, such as enforceable defensible-space standards, targeted fuel treatments along WUI edges, and growth controls that limit new intermix, are likely to yield larger risk reductions than uniform, climate-agnostic measures applied across the region.
4.4 Implications for Fire-Risk Reduction and Planning
As shown in Section 4.3, exposure concentrates where settlement-fuel contact is high and shrub fuels are continuous, with fire-weather extremes acting as an amplifier rather than a sole driver. This has immediate consequences for policy design. First, land-use regulation should target the form and location of new development. Steering growth away from intermix configurations and toward compact, contiguous urban fabric reduces fuel-structure contact, while risk-informed zoning can restrict or condition construction in corridors where shrub-dominated fuels, slope, and high-FWI windows coincide [9,12,14,41]. In established WUI, subdivision approvals and change-of-use permits should be contingent on demonstrable mitigation (road width, secondary egress, hydrants, and enforceable defensible-space plans) [9,12].
Second, the prevalence of shrub-dominated interface clusters (notably the dense/very-dense settlement classes abutting shrublands) argues for spatially targeted fuel management. Strategic fuel treatments placed at settlement edges and along upslope approach paths, combined with standards for defensible space and vegetation maintenance on private parcels, are likely to deliver disproportionate benefits [70,71]. Where intermix is dispersed, area-wide mosaics that interrupt shrub continuity are preferable to narrow linear breaks. These measures should be prioritized in the eastern and northern peri-urban belts identified as contiguous hotspots by the integrated risk map [72,73].
Third, structure-level resilience must complement landscape measures. Home-hardening (ember-resistant vents, non-combustible cladding and roofing, treatment of near-home vegetation) reduces loss probability in intermix settings where suppression access is constrained [74,75]. Building controls should be adapted to the WUI context rather than copied from urban fire codes; minimum standards for setbacks, materials, and water supply need to be explicitly tied to local risk classes derived from the map [6,75].
The classed risk surface can set clearance-enforcement zones and seasonal inspections; the hazard (FWI-based) layer can trigger readiness levels; and the susceptibility layer can guide pre-attack planning in high-intermix neighbourhoods. Civil protection agencies can formalize these linkages by embedding map-based triggers in contingency plans and by monitoring compliance through annual reporting at the municipality level. To support implementation, municipalities should pair these triggers with simple, auditable workflows (e.g., predefined clearance targets, inspection rosters, and public notifications) so that risk classes translate into specific tasks and deadlines.
Prevention must also address ignition processes: human-caused ignitions dominate in WUI, and isolated or dispersed dwellings face slower detection and response; targeted investigation, enforcement, and community programmes to reduce ignition sources are necessary complements to fuel and planning measures [76,77,78].
Finally, governance capacity is as important as technical mapping. The Attica results highlight places where informal settlement patterns, discontinuous infrastructure, and fragmented responsibilities undermine implementation. A WUI-specific regulatory framework, clarifying mandates for clearance, inspection, and penalties; aligning municipal plans with provincial/national civil-protection protocols; and enabling cost-sharing for community-scale fuel treatments, will be necessary to convert risk information into measurable reductions in exposure. Overall, because the drivers of elevated risk in Attica are fundamentally spatial (settlement configuration and shrub fuel continuity), risk-informed planning and enforcement at the WUI will yield larger and more durable benefits than undifferentiated, region-wide measures.
4.5 Limitations
The susceptibility layer emphasises settlement–fuel contact using building footprints and Copernicus/CLC vegetation, but does not incorporate parcel-scale vulnerability factors such as construction materials, defensible space, or hydrant coverage. The hazard layer relies on projected Fire Weather Index values (RCP 4.5) combined with static fuel and topography data. It therefore does not capture seasonal or interannual variations in fuel moisture and vegetation conditions. Validation was based primarily on spatial overlap with recent fire perimeters and Landsat-scale burn scars, which may under-represent small events or localised impacts. In addition, class thresholds and weighting choices introduce scale-dependent uncertainty, although sensitivity checks indicated that the main spatial patterns were robust. These constraints highlight the need for finer-resolution socio-environmental data and probabilistic approaches in future WUI risk assessments.
4.6 Future Perspectives
Advancing WUI risk assessment in Attica will hinge on tightening the connection between settlement-fuel geometry and the processes that convert hazard into losses. At the data level, two upgrades are most promising. First, integrating fine-scale structure and infrastructure attributes, roof and cladding materials, near-home vegetation condition, road width, egress options, hydrant, and water-supply coverage, will allow susceptibility to encode vulnerability rather than serve only as an exposure proxy. Second, incorporating dynamic fuel metrics (time-varying canopy water content, soil and live-fuel moisture proxies from multispectral/hyperspectral time series, and vertical structure from UAV/airborne LiDAR) will better represent the conditions that govern spread potential at the WUI edge [79].
Model design should move toward explicitly probabilistic products. Sensitivity/uncertainty across thresholds and weights can be quantified via Monte-Carlo ensembles, and scale tests can assess robustness to resolution and zoning configuration. Coupling the susceptibility layer with physics-based or empirically calibrated spread simulations under observed and projected fire-weather windows would enable translation from categorical risk to burn-probability fields that are comparable across years and scenarios [43,60,80]. Beyond method testing, the Attica layers establish a region-scale benchmark for validation, as they can be paired with ignition, loss, and response data to quantify predictive skill and standardize cross-study comparisons in Mediterranean settings.
Validation needs to extend beyond overlaps with recent catastrophic perimeters. A multi-source programme that cross-checks predictions against ignition records, suppression reports, insurance and civil-protection loss data, and asset-level outcomes will provide a more stringent test of predictive skill. Event-based post-audits, using the same pipeline on pre-fire conditions, can isolate whether errors stem from the hazard, susceptibility, or their interaction, thereby guiding model revision.
Finally, operationalization should be pursued in parallel with methodological refinement. Linking the risk map to routine civil-protection workflows—such as seasonal clearance targets, inspection scheduling, readiness level triggers tied to daily FWI exceedances, and pre-attack planning for ingress/egress and staging—will convert scientific outputs into measurable reductions in exposure. Scenario analyses that combine alternative planning controls, strategic fuel-treatment layouts, and plausible urban growth pathways under mid-century climate projections can inform where regulatory efforts yield the largest benefit. Because the dominant drivers in Attica are spatial, intermix geometry and shrub-fuel continuity, the most effective advances will be those that make the map more diagnostic of these features and embed it in decisions that directly modify settlement-fuel contact.
5. Conclusions
Across Attica’s ~3.81 million inhabitants, this study delivers the first integrated, region-wide assessment of the Wildland–Urban Interface (WUI) and wildfire risk. Using remote sensing, GIS analysis, and risk modelling, we map 26.3% of the territory as WUI, with shrub-dominated interface and intermix categories the most extensive and among the most hazardous. Fire-history analysis reveals that more than 102,000 ha (~35%) of the region have burned since 1983, underscoring the region's recurrent disturbance. The combined hazard–susceptibility framework indicates that 37.7% of the mapped terrestrial extent falls in High/Very High wildfire-risk classes, with hotspots concentrated in the eastern and northern peri-urban belts where settlement–fuel overlap is most acute. Collectively, these results provide a quantitative baseline, WUI extent, recurrence, and integrated risk, that is directly comparable across studies and suitable for meta-analysis and model benchmarking.
These findings confirm that Attica exemplifies the structural challenges of Mediterranean WUI landscapes: dispersed urban expansion, fuel continuity, and repeated wildfire recurrence converge to produce landscapes of elevated and persistent risk. The study not only aligns with patterns observed in southern France, Spain, Portugal, and Italy but also highlights the exceptional intensity of risk in a metropolitan region of this size.
The methodological framework developed here, which combines WUI typologies, fire recurrence, hazard drivers, and susceptibility modeling, offers a transferable approach for other Mediterranean and fire-prone metropolitan regions. Beyond its scientific contribution, the study provides an operational evidence base to guide fuel management, land-use regulation, and civil protection planning in Attica.
Ultimately, the results demonstrate that the WUI in Attica is not a marginal phenomenon but a defining feature of the regional landscape, requiring integrated policies that combine scientific risk assessment with governance and community action. While this study offers a regional-scale perspective, its insights are crucial for informing both strategic planning and local interventions. They can guide broader Mediterranean strategies for adapting to an increasingly severe wildfire regime.
Author Contributions
Conceptualization, E.P., A.O. and M.A.; methodology, E.P, A.O.; software, A.O., M.A.; validation, E.P.; formal analysis, A.O.; resources, E.P., A.O. and M.A.; writing—original draft preparation, E.P., and A.O.; writing—review and editing, E.P., A.O.; supervision, E.P.; project administration, E.P.; All authors have read and agreed to the published version of the manuscript.” Please turn to the CRediT taxonomy for the term explanation. Authorship must be limited to those who have contributed substantially to the work reported.
Funding
This research was supported by the action “Studies for the Rehabilitation of Areas Affected by Fires in the Wider Area of Varympompi” and funded through a donation from the companies VIANEX S.A., GlaxoSmithKline S.A., Groupama S.A., and Rossi S.A.
Acknowledgments
The authors acknowledge the Copernicus Programme for providing access to Earth-observation data, as well as Corine Land Cover 2018 dataset obtained through the Copernicus Land Monitoring Service. We also thank the National Centre for Scientific Research “Demokritos” for access to the Fire Weather Index (FWI90) data, as well as UCR-STAR and LPIS for the datasets used in this study.
Conflicts of Interest
The authors declare no conflicts of interest.
References
- Intergovernmental Panel on Climate Change (IPCC) Climate Change 2021 – The Physical Science Basis: Working Group I Contribution to the Sixth Assessment Report of the Intergovernmental Panel on Climate Change; Cambridge University Press: Cambridge, 2023.
- Tedim, F.; Leone, V.; Amraoui, M.; Bouillon, C.; Coughlan, M.R.; Delogu, G.M.; Fernandes, P.M.; Ferreira, C.; McCaffrey, S.; McGee, T.K.; et al. Defining Extreme Wildfire Events: Difficulties, Challenges, and Impacts. Fire 2018, 1, 9. [Google Scholar] [CrossRef]
- Goldammer, J.G.; Statheropoulos, M.; Andreae, M.O. Chapter 1 Impacts of Vegetation Fire Emissions on the Environment, Human Health, and Security: A Global Perspective. In Developments in Environmental Science; Elsevier, 2008; Vol. 8, pp. 3–36. ISBN 978-0-08-055609-3.
- Radeloff, V.C.; Hammer, R.B.; Stewart, S.I.; Fried, J.S.; Holcomb, S.S.; McKeefry, J.F. The Wildland–Urban Interface in the United States. Ecological Applications 2005, 15, 799–805. [Google Scholar] [CrossRef]
- Stewart, S.I.; Radeloff, V.C.; Hammer, R.B.; Hawbaker, T.J. Defining the Wildland–Urban Interface. Journal of Forestry 2007. [Google Scholar] [CrossRef]
- Calkin, D.E.; Cohen, J.D.; Finney, M.A.; Thompson, M.P. How Risk Management Can Prevent Future Wildfire Disasters in the Wildland-Urban Interface. Proceedings of the National Academy of Sciences 2014, 111, 746–751. [Google Scholar] [CrossRef]
- Bar-Massada, A.; Radeloff, V.; Stewart, S. Biotic and Abiotic Effects of Human Settlements in the Wildland-Urban Interface. BioScience 2014, 64, 429–437. [Google Scholar] [CrossRef]
- Radeloff, V.C.; Helmers, D.P.; Kramer, H.A.; Mockrin, M.H.; Alexandre, P.M.; Bar-Massada, A.; Butsic, V.; Hawbaker, T.J.; Martinuzzi, S.; Syphard, A.D.; et al. Rapid Growth of the US Wildland-Urban Interface Raises Wildfire Risk. Proc. Natl. Acad. Sci. U.S.A. 2018, 115, 3314–3319. [Google Scholar] [CrossRef]
- Modugno, S.; Balzter, H.; Cole, B.; Borrelli, P. Mapping Regional Patterns of Large Forest Fires in Wildland–Urban Interface Areas in Europe. Journal of Environmental Management 2016, 172, 112–126. [Google Scholar] [CrossRef]
- Kalabokidis, K.; Palaiologou, P.; Gerasopoulos, E.; Giannakopoulos, C.; Kostopoulou, E.; Zerefos, C. Effect of Climate Change Projections on Forest Fire Behavior and Values-at-Risk in Southwestern Greece. Forests 2015, 6, 2214–2240. [Google Scholar] [CrossRef]
- Moreira, F.; Ascoli, D.; Safford, H.; Adams, M.A.; Moreno, J.M.; Pereira, J.M.C.; Catry, F.X.; Armesto, J.; Bond, W.; González, M.E.; et al. Wildfire Management in Mediterranean-Type Regions: Paradigm Change Needed. Environ. Res. Lett. 2020, 15, 011001. [Google Scholar] [CrossRef]
- San-Miguel-Ayanz, J.; Moreno, J.M.; Camia, A. Analysis of Large Fires in European Mediterranean Landscapes: Lessons Learned and Perspectives. Forest Ecology and Management 2013, 294, 11–22. [Google Scholar] [CrossRef]
- Psomiadis, E.; Soulis, K.X.; Efthimiou, N. Using SCS-CN and Earth Observation for the Comparative Assessment of the Hydrological Effect of Gradual and Abrupt Spatiotemporal Land Cover Changes. Water 2020, 12, 1386. [Google Scholar] [CrossRef]
- Galiana-Martín, L. Spatial Planning Experiences for Vulnerability Reduction in the Wildland-Urban Interface in Mediterranean European Countries. European Countryside 2017, 9, 577–593. [Google Scholar] [CrossRef]
- Efthimiou, N.; Psomiadis, E.; Panagos, P. Fire Severity and Soil Erosion Susceptibility Mapping Using Multi-Temporal Earth Observation Data: The Case of Mati Fatal Wildfire in Eastern Attica, Greece. CATENA 2020, 187, 104320. [Google Scholar] [CrossRef]
- Xanthopoulos, G. The Forest Fires of 1995 and 1998 on Penteli Mountain. In Proceedings of the Proceedings of the International Workshop “Improving Dispatching for Forest Fire Control”; Chania, 2002; pp. 85–94.
- Arianoutsou, M.; Athanasakis, G.; Kazanis, D.; Christopoulou, A. Attica: A Hot Spot for Forest Fires in Greece. Fire 2024, 7, 467. [Google Scholar] [CrossRef]
- EMSN170 - Copernicus EMS Mapping | Copernicus EMS On Demand Mapping. Available online: https://mapping.emergency.copernicus.eu/activations/EMSN170/ (accessed on 29 September 2025).
- Operational Mapping and Post-Disaster Hazard Assessment by the Development of a Multiparametric Web App Using Geospatial Technologies and Data: Attica Region 2021 Wildfires (Greece). Available online: https://www.mdpi.com/2076-3417/12/14/7256?utm_source=chatgpt.com (accessed on 29 September 2025).
- EMSR300 - Copernicus EMS Mapping | Copernicus EMS On Demand Mapping. Available online: https://mapping.emergency.copernicus.eu/activations/EMSR300/?utm_source=chatgpt.com (accessed on 29 September 2025).
- Amiridis, V.; Zerefos, C.; Kazadzis, S.; Gerasopoulos, E.; Eleftheratos, K.; Vrekoussis, M.; Stohl, A.; Mamouri, R.E.; Kokkalis, P.; Papayannis, A.; et al. Impact of the 2009 Attica Wild Fires on the Air Quality in Urban Athens. Atmospheric Environment 2012, 46, 536–544. [Google Scholar] [CrossRef]
- Restoration of the Forest Ecosystem after the Fire of 2007. Φορέας Διαχείρισης Δρυμού Πάρνηθας 2021.
- Population Censuses 1821 - 2021 - ELSTAT. Available online: https://www.statistics.gr/el/census_priv_results_1821-2021 (accessed on 22 October 2025).
- Salvati, L.; Zitti, M. Sprawl and Mega-Events: Economic Growth and Recent Urban Expansion in a City Losing Its Competitive Edge (Athens, Greece). Urbani izziv 2017, 28, 110–121. [Google Scholar] [CrossRef]
- Rontos, K.; Antonoglou, D.; Salvati, L.; Maialetti, M.; Kontogiannis, G. Revisiting the Spatial Cycle: Intra-Regional Development Patterns and Future Population Dynamics in Metropolitan Athens, Greece. Economies 2024, 12, 202. [Google Scholar] [CrossRef]
- Gounaridis, D.; Symeonakis, E.; Chorianopoulos, I.; Koukoulas, S. Incorporating Density in Spatiotemporal Land Use/Cover Change Patterns: The Case of Attica, Greece. Remote Sensing 2018, 10, 1034. [Google Scholar] [CrossRef]
- Copernicus Land Monitoring Service. Available online: https://land.copernicus.eu/en (accessed on 22 October 2025).
- Neary, D.G. An Overview of FIre Effects on Soils. Southwest Hydrology 2004, 3, 18–19. [Google Scholar]
- MacDonald, L.H.; Huffman, E.L. Post-Fire Soil Water Repellency. Soil Science Society of America Journal 2004, 68, 1729–1734. [Google Scholar] [CrossRef]
- Pausas, J.G.; Llovet, J.; Rodrigo, A.; Vallejo, R. Are Wildfires a Disaster in the Mediterranean Basin? - A Review. Int. J. Wildland Fire 2008, 17, 713. [Google Scholar] [CrossRef]
- Moreira, F.; Viedma, O.; Arianoutsou, M.; Curt, T.; Koutsias, N.; Rigolot, E.; Barbati, A.; Corona, P.; Vaz, P.; Xanthopoulos, G.; et al. Landscape – Wildfire Interactions in Southern Europe: Implications for Landscape Management. Journal of Environmental Management 2011, 92, 2389–2402. [Google Scholar] [CrossRef] [PubMed]
- Arianoutsou, M.; Kazanis, D.; Kokkoris, Y.; Skourou, P. Land-Use Interactions with Fire in Mediterranean Pinus Halepensis Landscapes of Greece: Patterns of Biodiversity. 2002.
- Lampin-Maillet, C.; Jappiot, M.; Long, M.; Bouillon, C.; Morge, D.; Ferrier, J.-P. Mapping Wildland-Urban Interfaces at Large Scales Integrating Housing Density and Vegetation Aggregation for Fire Prevention in the South of France. Journal of Environmental Management 2010, 91, 732–741. [Google Scholar] [CrossRef]
- Badia, A.; Serra, P.; Modugno, S. Identifying Dynamics of Fire Ignition Probabilities in Two Representative Mediterranean Wildland-Urban Interface Areas. Applied Geography 2011, 31, 930–940. [Google Scholar] [CrossRef]
- Johnston, L.M.; Flannigan, M.D. Mapping Canadian Wildland Fire Interface Areas. Int. J. Wildland Fire 2018, 27, 1. [Google Scholar] [CrossRef]
- Vilar del Hoyo, L.; Martín Isabel, M.P.; Martínez Vega, F.J. Logistic Regression Models for Human-Caused Wildfire Risk Estimation: Analysing the Effect of the Spatial Accuracy in Fire Occurrence Data. Eur J Forest Res 2011, 130, 983–996. [Google Scholar] [CrossRef]
- Xanthopoulos, G. Forest Fires, Their Management in Greece and Its Reflection in Attica (in Greek with English abstract). GEOGRAPHIES (1109-186X) 2016, 72–88.
- Zoka, M.; Stasinos, N.; Tsoutsos, M.-C.; Kokkalidou, M.; Girtsou, S.; Yfantidou, A.; Stathopoulos, N.; Kontoes, C. Detailed Wildfire Vulnerability Assessment In Selected Wildland Urban Interface Residential Areas In The Region Of Attica, Greece. In Proceedings of the IGARSS 2024 - 2024 IEEE International Geoscience and Remote Sensing Symposium; July 2024; pp. 3316–3321.
- Zikeloglou, I.; Lekkas, E.; Lozios, S.; Stavropoulou, M. Is Early Evacuation the Best and Only Strategy to Protect and Mitigate the Effects of Forest Fires in WUI Areas? A Qualitative Research on the Residents’ Response during the 2021 Forest Fires in NE Attica, Greece. International Journal of Disaster Risk Reduction 2023, 88, 103612. [Google Scholar] [CrossRef]
- Lagouvardos, K.; Kotroni, V.; Giannaros, T.M.; Dafis, S. Meteorological Conditions Conducive to the Rapid Spread of the Deadly Wildfire in Eastern Attica, Greece. Bulletin of the American Meteorological Society 2019, 100, 2137–2145. [Google Scholar] [CrossRef]
- Syphard, A.D.; Massada, A.B.; Butsic, V.; Keeley, J.E. Land Use Planning and Wildfire: Development Policies Influence Future Probability of Housing Loss. PLOS ONE 2013, 8, e71708. [Google Scholar] [CrossRef]
- San-Miguel-Ayanz, J.; Pereira, J.M.C.; Boca, R.; Strobl, P.; Kucera, J.; Pekkarinen, A. Forest Fires in the European Mediterranean Region: Mapping and Analysis of Burned Areas. In Earth Observation of Wildland Fires in Mediterranean Ecosystems; Chuvieco, E., Ed.; Springer Berlin Heidelberg: Berlin, Heidelberg, 2009; ISBN 978-3-642-01753-7. [Google Scholar]
- Politi, N.; Vlachogiannis, D.; Sfetsos, A.; Gounaris, N. Fire Weather Assessment of Future Changes in Fire Weather Conditions in the Attica Region. Environmental Sciences Proceedings 2023, 26, 186. [Google Scholar] [CrossRef]
- Erni, S.; Wang, X.; Swystun, T.; Taylor, S.W.; Parisien, M.-A.; Robinne, F.-N.; Eddy, B.; Oliver, J.; Armitage, B.; Flannigan, M.D. Mapping Wildfire Hazard, Vulnerability, and Risk to Canadian Communities. International Journal of Disaster Risk Reduction 2024, 101, 104221. [Google Scholar] [CrossRef]
- Fox, D.M.; Carrega, P.; Ren, Y.; Caillouet, P.; Bouillon, C.; Robert, S. How Wildfire Risk Is Related to Urban Planning and Fire Weather Index in SE France (1990–2013). Science of The Total Environment 2018, 621, 120–129. [Google Scholar] [CrossRef]
- Fernández-García, V.; Beltrán-Marcos, D.; Calvo, L. Building Patterns and Fuel Features Drive Wildfire Severity in Wildland-Urban Interfaces in Southern Europe. Landscape and Urban Planning 2023, 231, 104646. [Google Scholar] [CrossRef]
- Lampin-Maillet, C.; Jappiot, M.; Long, M.; Morge, D.; Ferrier, J.-P. Characterization and Mapping of Dwelling Types for Forest Fire Prevention. Computers, Environment and Urban Systems 2009, 33, 224–232. [Google Scholar] [CrossRef]
- Prichard, S.J.; Rowell, E.M.; Hudak, A.T.; Keane, R.E.; Loudermilk, E.L.; Lutes, D.C.; Ottmar, R.D.; Chappell, L.M.; Hall, J.A.; Hornsby, B.S. Fuels and Consumption. In Wildland Fire Smoke in the United States: A Scientific Assessment; Peterson, D.L., McCaffrey, S.M., Patel-Weynand, T., Eds.; Springer International Publishing: Cham, 2022; pp. 1–49. ISBN 978-3-030-87045-4. [Google Scholar]
- Murray, A.T.; Baik, J.; Echeverri Figueroa, V.; Rini, D.; Moritz, M.A.; Roberts, D.A.; Sweeney, S.H.; Carvalho, L.M.V.; Jones, C. Developing Effective Wildfire Risk Mitigation Plans for the Wildland Urban Interface. International Journal of Applied Earth Observation and Geoinformation 2023, 124, 103531. [Google Scholar] [CrossRef]
- Calviño-Cancela, M.; Chas-Amil, M.L.; García-Martínez, E.D.; Touza, J. Wildfire Risk Associated with Different Vegetation Types within and Outside Wildland-Urban Interfaces. Forest Ecology and Management 2016, 372, 1–9. [Google Scholar] [CrossRef]
- Beltrán-Marcos, D.; Calvo, L.; Fernández-Guisuraga, J.M.; Fernández-García, V.; Suárez-Seoane, S. Wildland-Urban Interface Typologies Prone to High Severity Fires in Spain. Science of The Total Environment 2023, 894, 165000. [Google Scholar] [CrossRef]
- Key, Carl H.; Benson, Nathan C. The Normalized Burn Ratio, a Landsat TM Radiometric Index of Burn Severity Incorporating Multi-Temporal Differencing | Fire Research and Management Exchange System; 1999; p. 39.
- Novo, A.; Fariñas-Álvarez, N.; Martínez-Sánchez, J.; González-Jorge, H.; Fernández-Alonso, J.M.; Lorenzo, H. Mapping Forest Fire Risk—A Case Study in Galicia (Spain). Remote Sensing 2020, 12, 3705. [Google Scholar] [CrossRef]
- Chuvieco, E.; Aguado, I.; Yebra, M.; Nieto, H.; Salas, J.; Martín, M.P.; Vilar, L.; Martínez, J.; Martín, S.; Ibarra, P.; et al. Development of a Framework for Fire Risk Assessment Using Remote Sensing and Geographic Information System Technologies. Ecological Modelling 2010, 221, 46–58. [Google Scholar] [CrossRef]
- Scott, J.H.; Thompson, M.P.; Calkin, D.E. A Wildfire Risk Assessment Framework for Land and Resource Management; U.S. Department of Agriculture, Forest Service, Rocky Mountain Research Station: Ft. Collins, CO, 2013; p. RMRS-GTR-315.
- Chuvieco, E.; Yebra, M.; Martino, S.; Thonicke, K.; Gómez-Giménez, M.; San-Miguel, J.; Oom, D.; Velea, R.; Mouillot, F.; Molina, J.R.; et al. Towards an Integrated Approach to Wildfire Risk Assessment: When, Where, What and How May the Landscapes Burn. Fire 2023, 6, 215. [Google Scholar] [CrossRef]
- Nikolić, G.; Vujović, F.; Golijanin, J.; Šiljeg, A.; Valjarević, A. Modelling of Wildfire Susceptibility in Different Climate Zones in Montenegro Using GIS-MCDA. Atmosphere 2023, 14, 929. [Google Scholar] [CrossRef]
- Zhai, J.; Ning, Z.; Dahal, R.; Yang, S. Wildfire Susceptibility of Land Use and Topographic Features in the Western United States: Implications for the Landscape Management. Forests 2023, 14, 807. [Google Scholar] [CrossRef]
- Ganteaume, A.; Barbero, R.; Jappiot, M.; Maillé, E. Understanding Future Changes to Fires in Southern Europe and Their Impacts on the Wildland-Urban Interface. Journal of Safety Science and Resilience 2021, 2, 20–29. [Google Scholar] [CrossRef]
- Finney, M.A. The Challenge of Quantitative Risk Analysis for Wildland Fire. Forest Ecology and Management 2005, 211, 97–108. [Google Scholar] [CrossRef]
- Pausas, J.; Paula, S. Fuel Shapes the Fire-Climate Relationship: Evidence from Mediterranean Ecosystems. Global Ecology and Biogeography 2012, 21, 1074–1082. [Google Scholar] [CrossRef]
- Hammer, R.B.; Stewart, S.I.; Radeloff, V.C. Demographic Trends, the Wildland–Urban Interface, and Wildfire Management. Society & Natural Resources 2009, 22, 777–782. [Google Scholar] [CrossRef]
- Platt, R.V. The Wildland–Urban Interface: Evaluating the Definition Effect. Journal of Forestry 2010, 108, 9–15. [Google Scholar] [CrossRef]
- Kumar, M.; Li, S.; Nguyen, P.; Banerjee, T. Examining the Existing Definitions of Wildland-urban Interface for California. Ecosphere 2022, 13, e4306. [Google Scholar] [CrossRef]
- Ketchpaw, A.R.; Li, D.; Khan, S.N.; Jiang, Y.; Li, Y.; Zhang, L. Using Structure Location Data to Map the Wildland–Urban Interface in Montana, USA. Fire 2022, 5, 129. [Google Scholar] [CrossRef]
- Alexandre, P.M.; Stewart, S.I.; Mockrin, M.H.; Keuler, N.S.; Syphard, A.D.; Bar-Massada, A.; Clayton, M.K.; Radeloff, V.C. The Relative Impacts of Vegetation, Topography and Spatial Arrangement on Building Loss to Wildfires in Case Studies of California and Colorado. Landscape Ecol 2016, 31, 415–430. [Google Scholar] [CrossRef]
- Nunes, A.N.; Figueiredo, A.; Pinto, C.; Lourenço, L. Assessing Wildfire Hazard in the Wildland–Urban Interfaces (WUIs) of Central Portugal. Forests 2023, 14, 1106. [Google Scholar] [CrossRef]
- Giannaros, T.M.; Papavasileiou, G.; Lagouvardos, K.; Kotroni, V.; Dafis, S.; Karagiannidis, A.; Dragozi, E. Meteorological Analysis of the 2021 Extreme Wildfires in Greece: Lessons Learned and Implications for Early Warning of the Potential for Pyroconvection. Atmosphere 2022, 13, 475. [Google Scholar] [CrossRef]
- Dillon, G.K.; Holden, Z.A.; Morgan, P.; Crimmins, M.A.; Heyerdahl, E.K.; Luce, C.H. Both Topography and Climate Affected Forest and Woodland Burn Severity in Two Regions of the Western US, 1984 to 2006. Ecosphere 2011, 2, art130. [Google Scholar] [CrossRef]
- Karimi, N.; Mahler, P.; Beverly, J.L. Optimizing Fuel Treatments for Community Wildfire Mitigation Planning. Journal of Environmental Management 2024, 370, 122325. [Google Scholar] [CrossRef]
- Agee, J.K.; Skinner, C.N. Basic Principles of Forest Fuel Reduction Treatments. Forest Ecology and Management 2005, 211, 83–96. [Google Scholar] [CrossRef]
- Fernandes, P.M. Fire-Smart Management of Forest Landscapes in the Mediterranean Basin under Global Change. Landscape and Urban Planning 2013, 110, 175–182. [Google Scholar] [CrossRef]
- Boer, M.M.; Sadler, R.J.; Wittkuhn, R.S.; McCaw, L.; Grierson, P.F. Long-Term Impacts of Prescribed Burning on Regional Extent and Incidence of Wildfires—Evidence from 50 Years of Active Fire Management in SW Australian Forests. Forest Ecology and Management 2009, 259, 132–142. [Google Scholar] [CrossRef]
- Syphard, A.D.; Keeley, J.E. Factors Associated with Structure Loss in the 2013–2018 California Wildfires. Fire 2019, 2, 49. [Google Scholar] [CrossRef]
- Cohen, J.D. Preventing Disaster: Home Ignitability in the Wildland-Urban Interface. Journal of Forestry 2000, 98, 15–21. [Google Scholar] [CrossRef]
- Ruffault, J.; Mouillot, F. Contribution of Human and Biophysical Factors to the Spatial Distribution of Forest Fire Ignitions and Large Wildfires in a French Mediterranean Region. Int. J. Wildland Fire 2017, 26, 498. [Google Scholar] [CrossRef]
- Romero-Calcerrada, R.; Novillo, C.J.; Millington, J.D.A.; Gomez-Jimenez, I. GIS Analysis of Spatial Patterns of Human-Caused Wildfire Ignition Risk in the SW of Madrid (Central Spain). Landscape Ecol 2008, 23, 341–354. [Google Scholar] [CrossRef]
- Catry, F.X.; Rego, F.C.; Bação, F.L.; Moreira, F. Modeling and Mapping Wildfire Ignition Risk in Portugal. Int. J. Wildland Fire 2009, 18, 921–931. [Google Scholar] [CrossRef]
- Keane, R.E. Wildland Fuel Fundamentals and Applications; Springer International Publishing: Cham, 2015; ISBN 978-3-319-09014-6. [Google Scholar]
- Varela Fire Weather Index (FWI) Classification for Fire Danger Assessment Applied in Greece. Tethys 2015. [CrossRef]
Figure 1.
Location of the study area. (a) Greece, with the Attica Region outlined in red; (b) detailed map of the Attica Region showing the study boundaries.
Figure 1.
Location of the study area. (a) Greece, with the Attica Region outlined in red; (b) detailed map of the Attica Region showing the study boundaries.
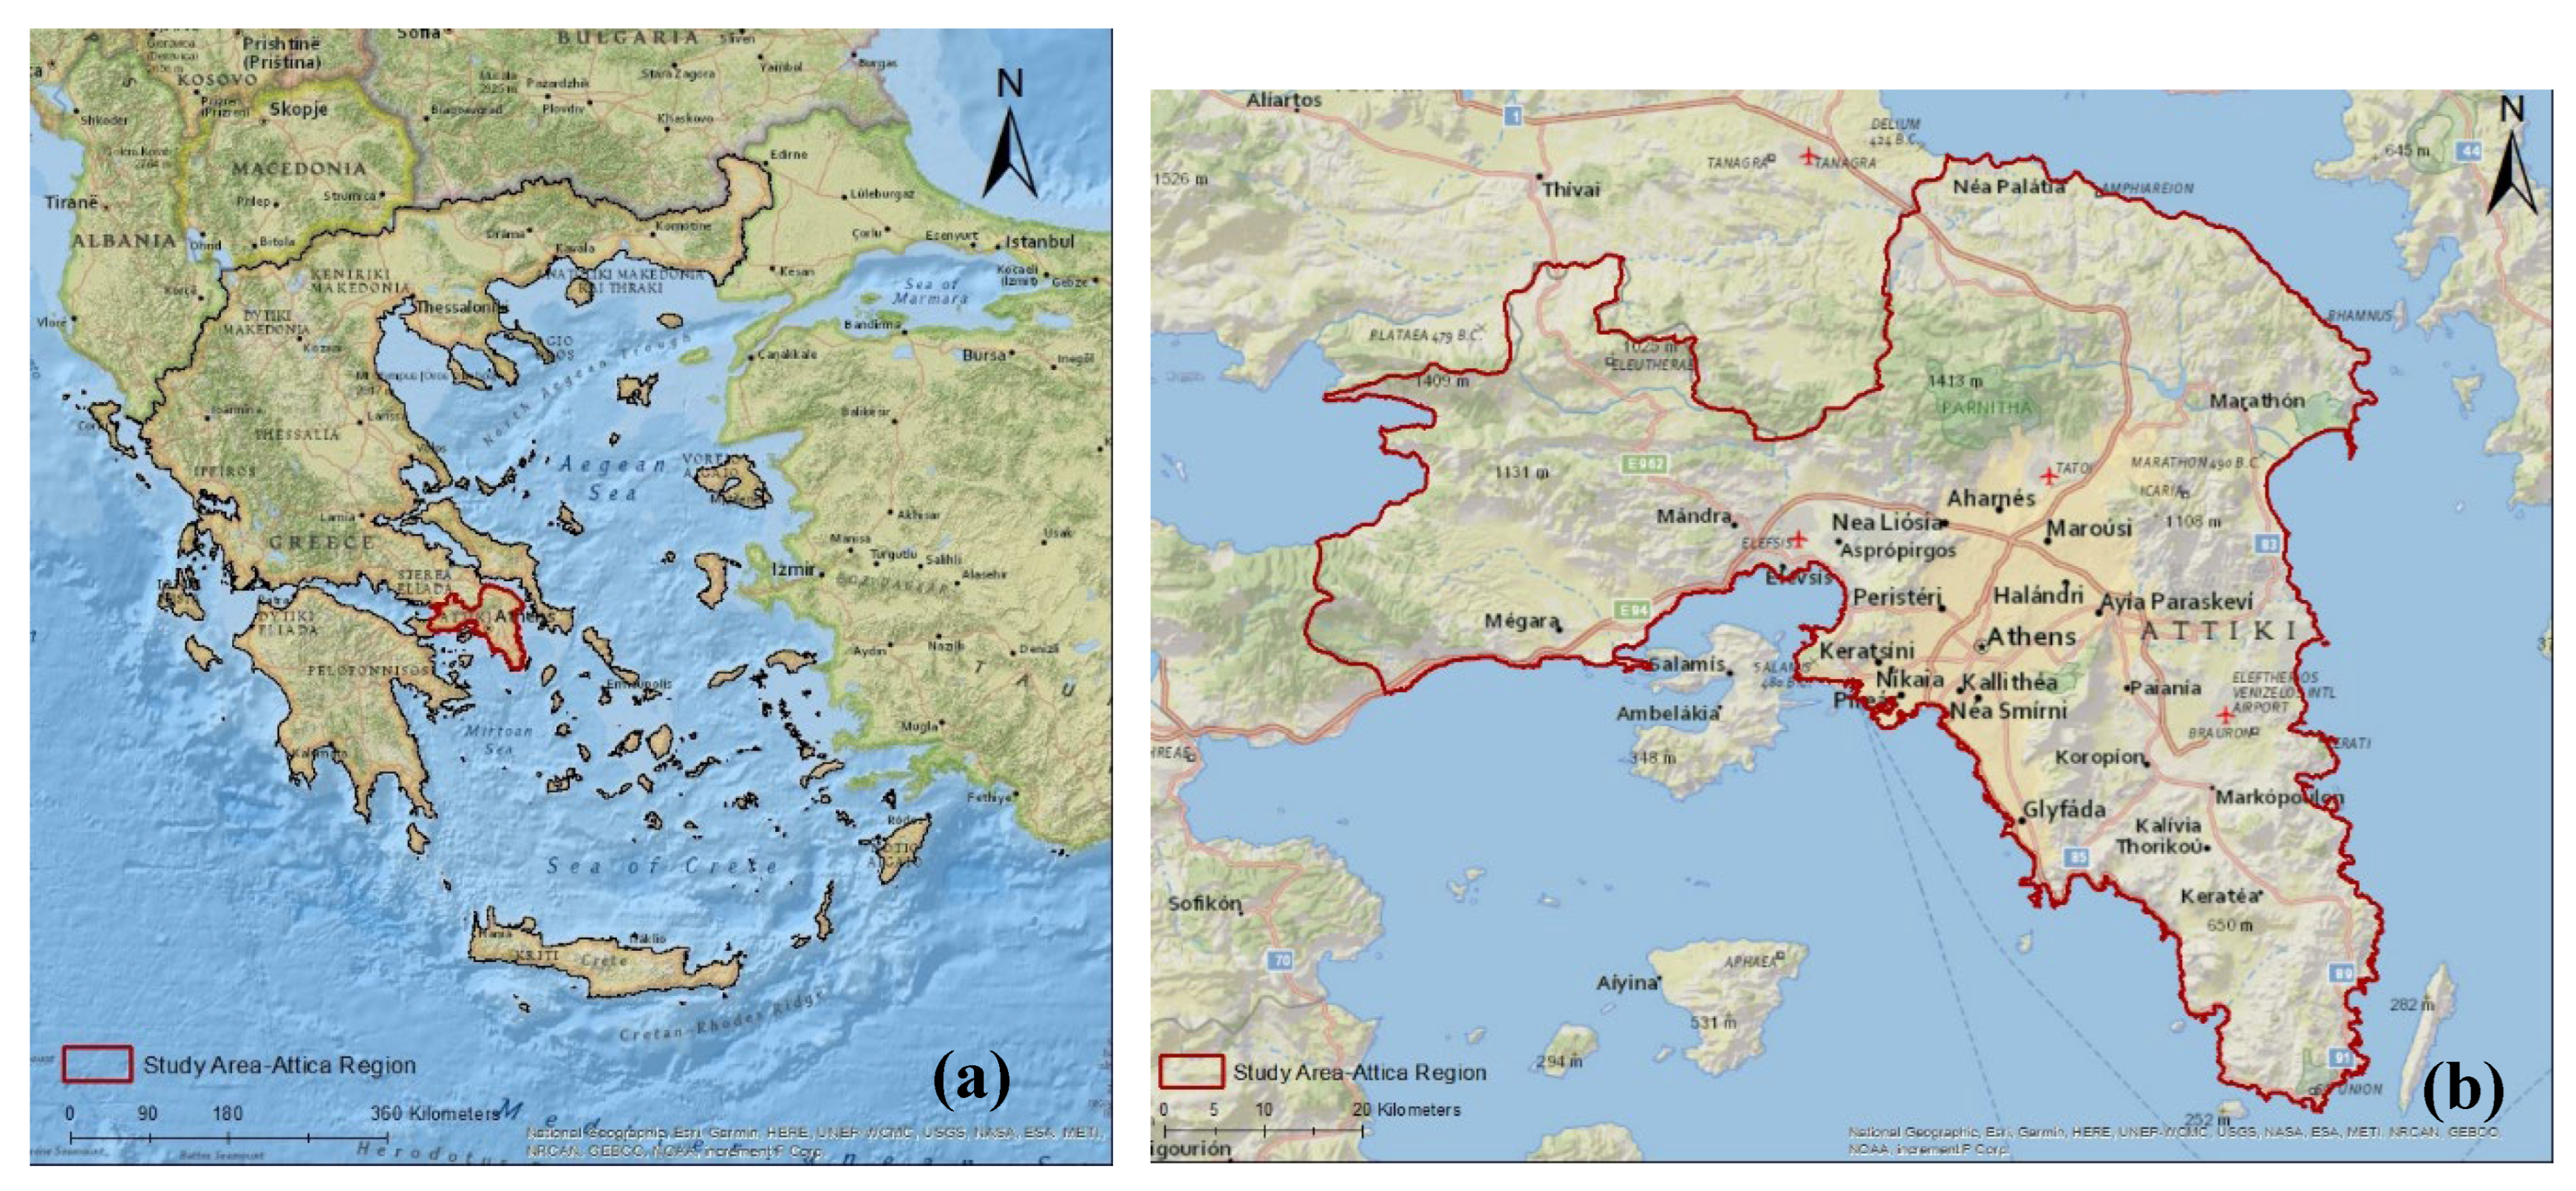
Figure 2.
Flowchart of the dwelling density classification process used for WUI mapping.
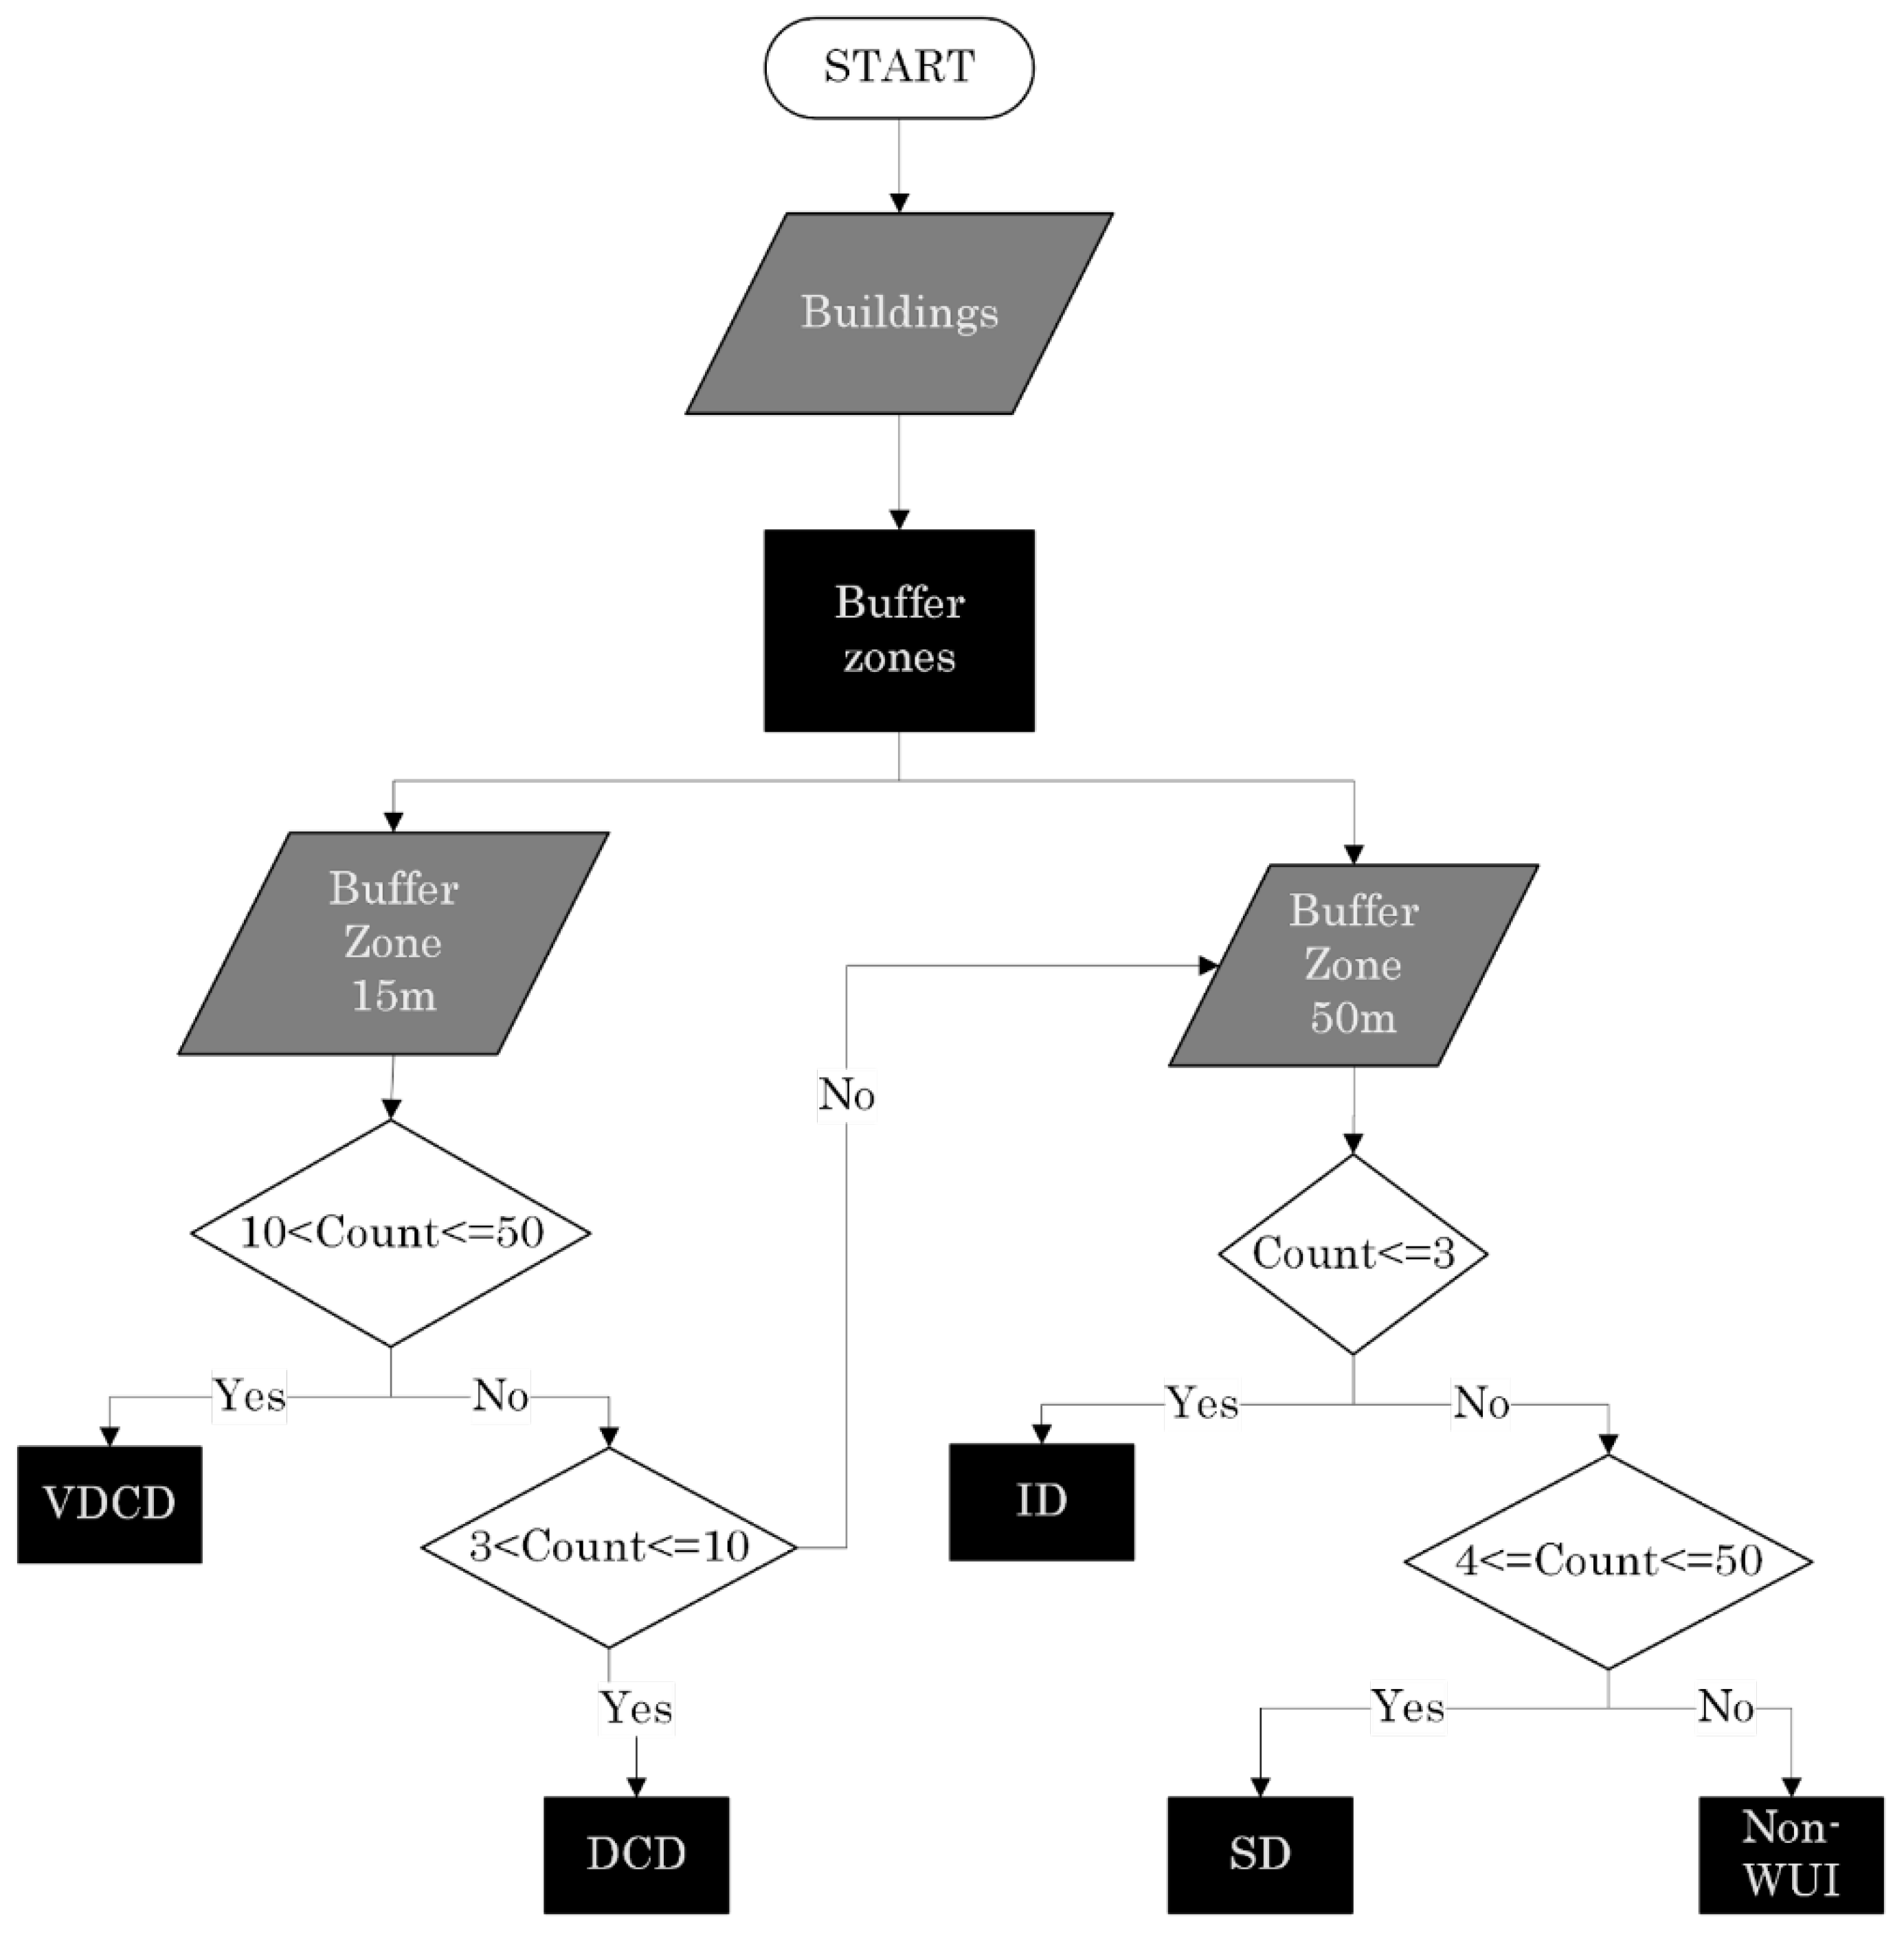
Figure 3.
Fire Frequency Map of Attica
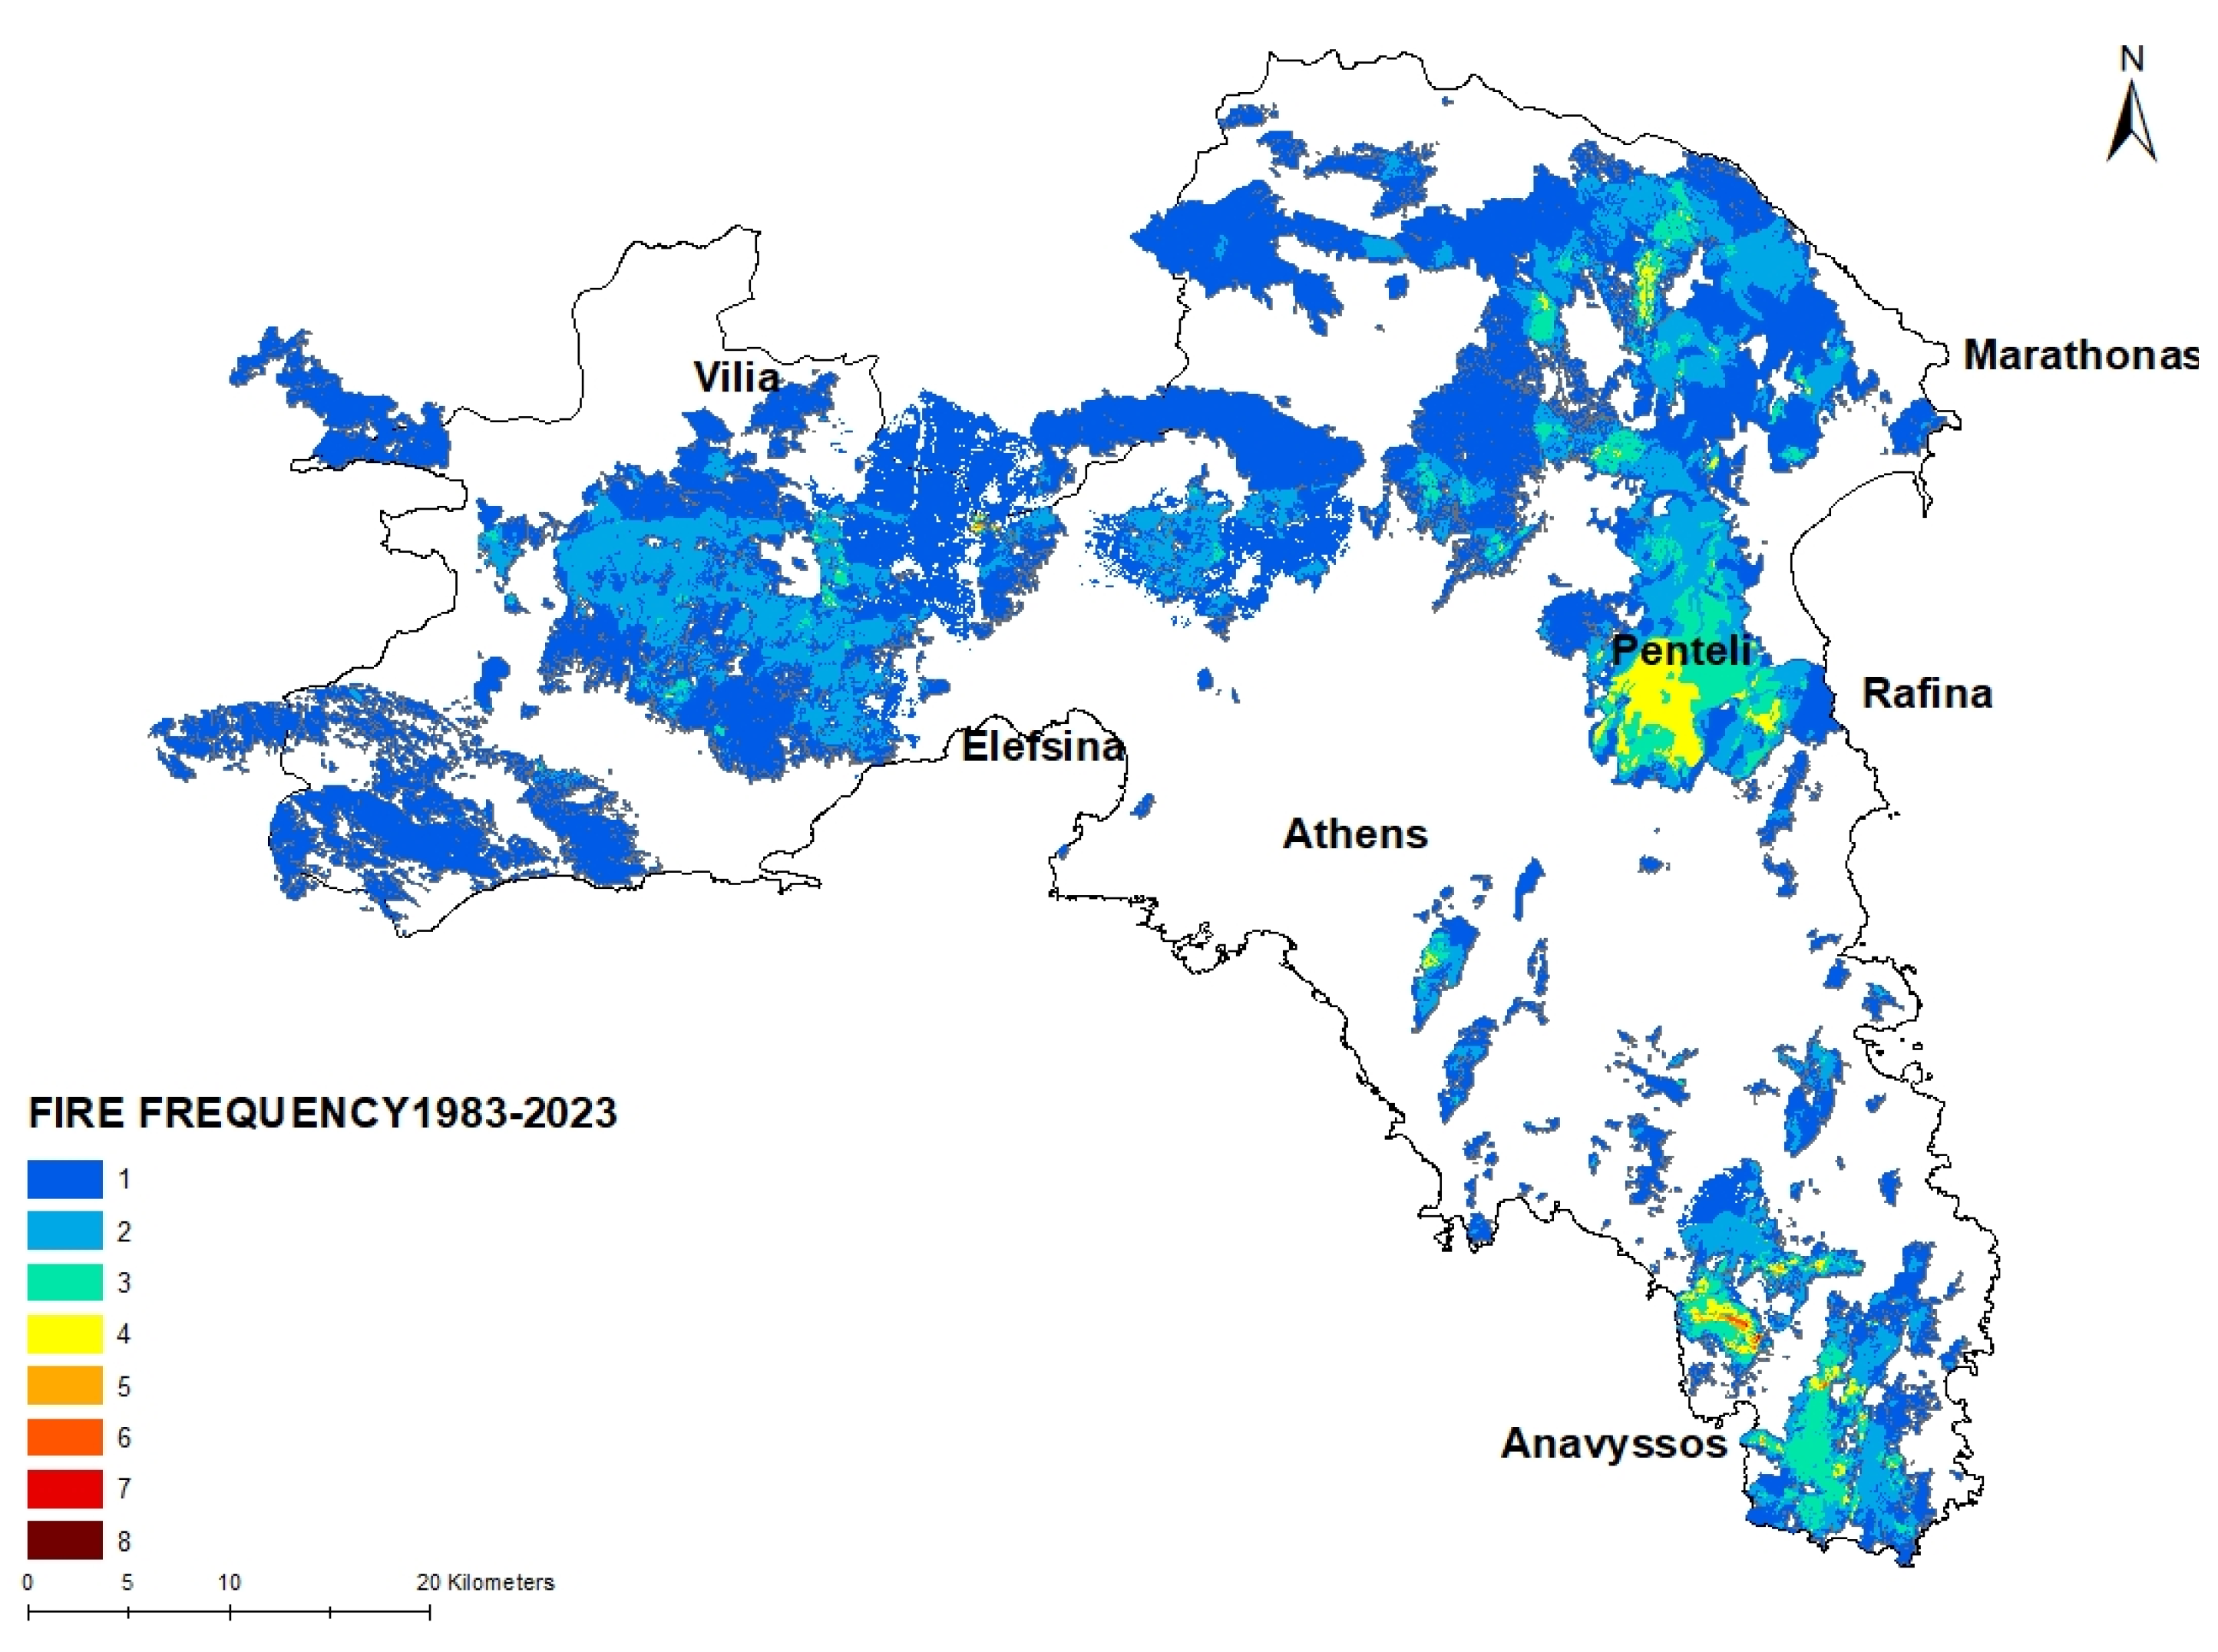
Figure 4.
Map of WUI classes in Attica
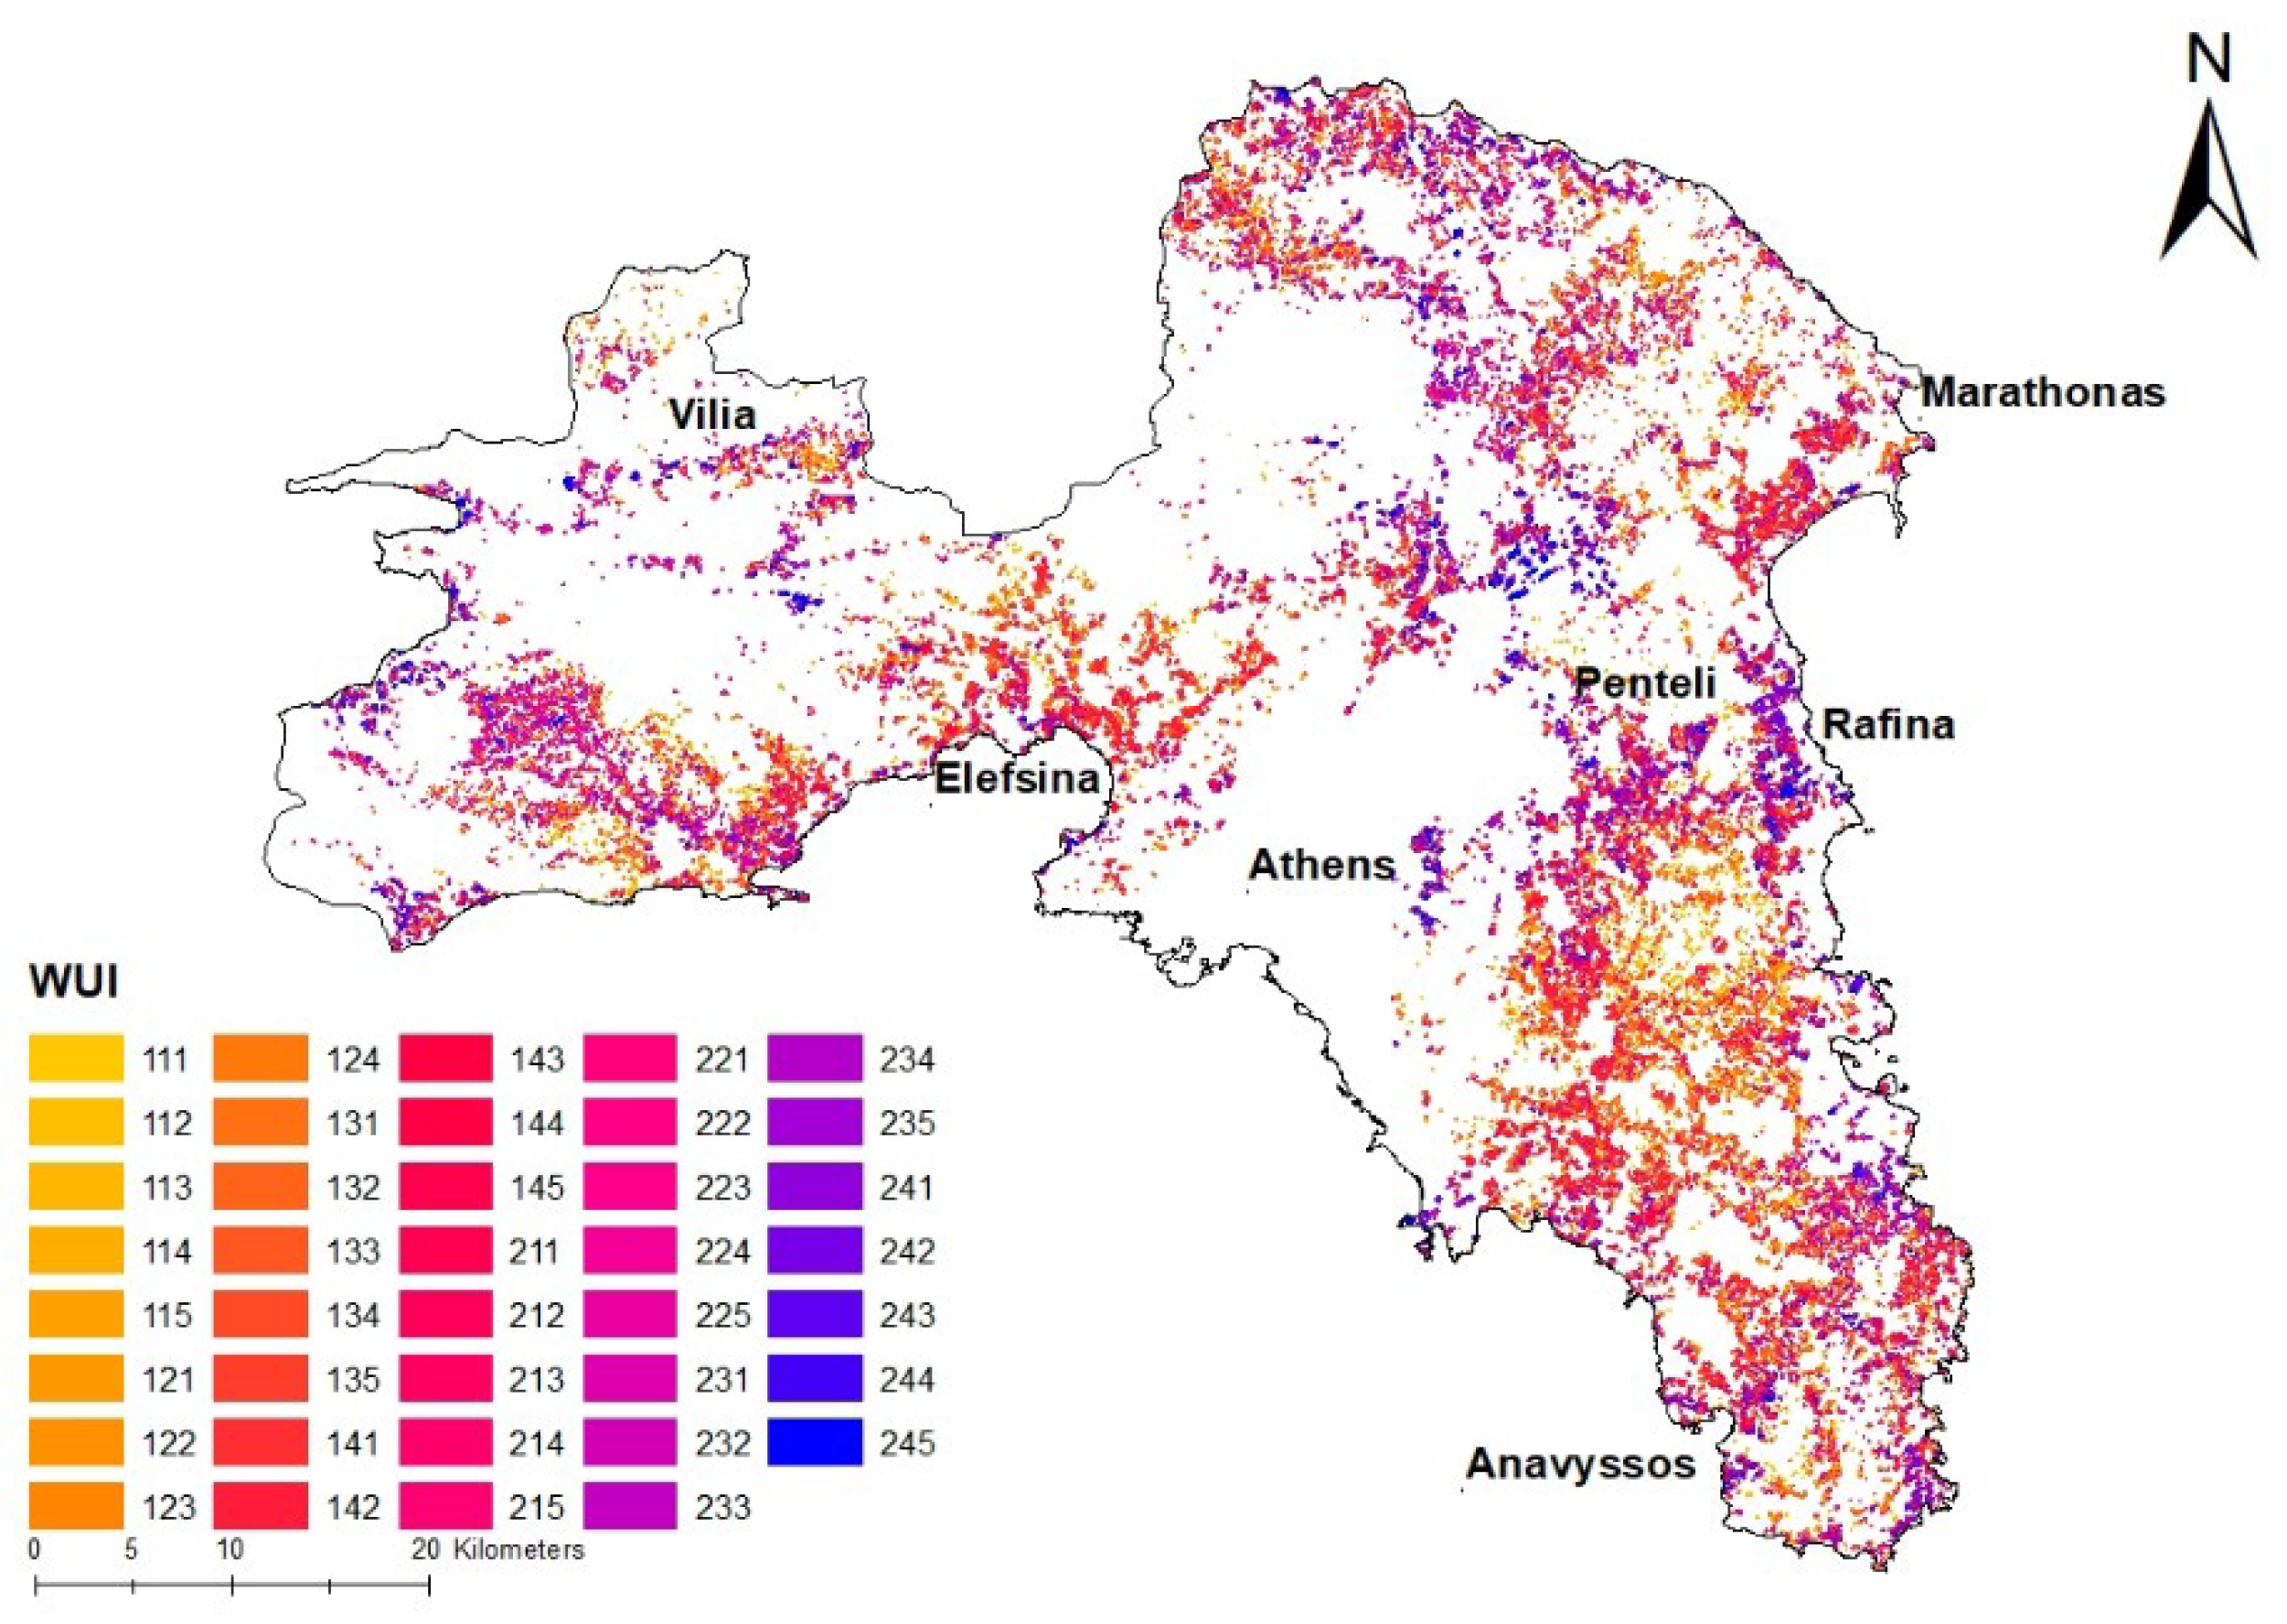
Figure 5.
Interface map of Attica.
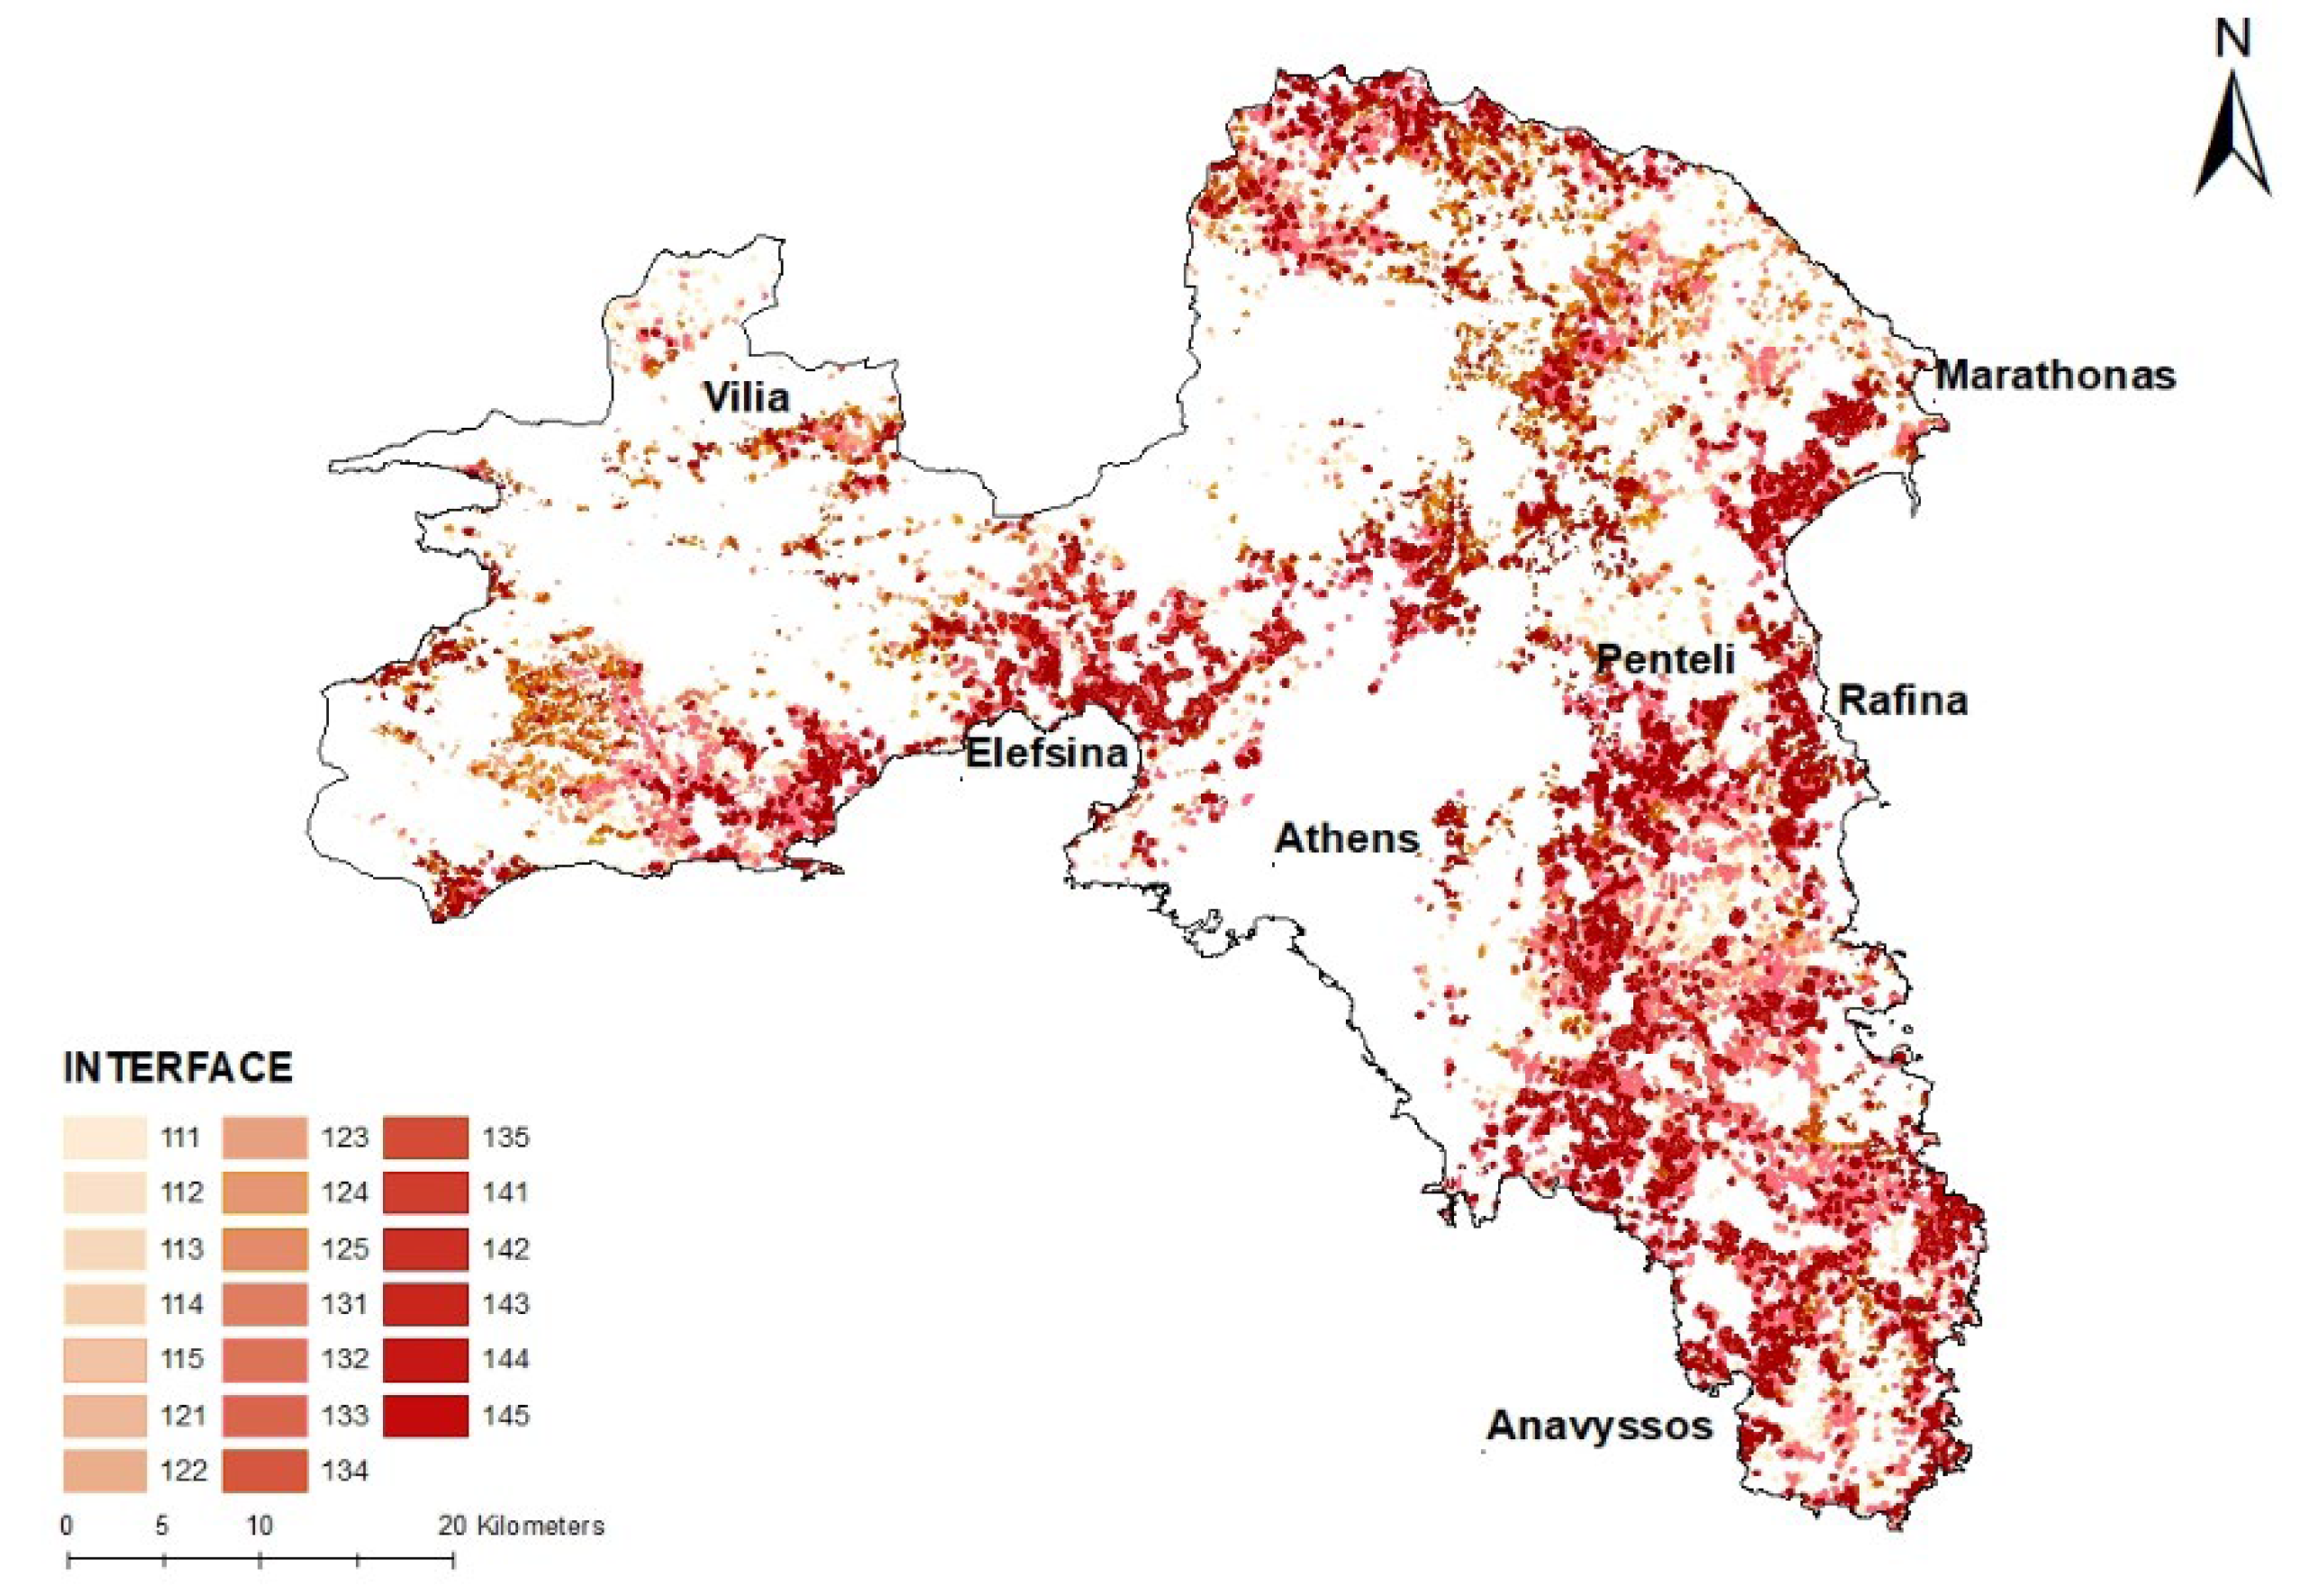
Figure 6.
Intermix map of Attica.
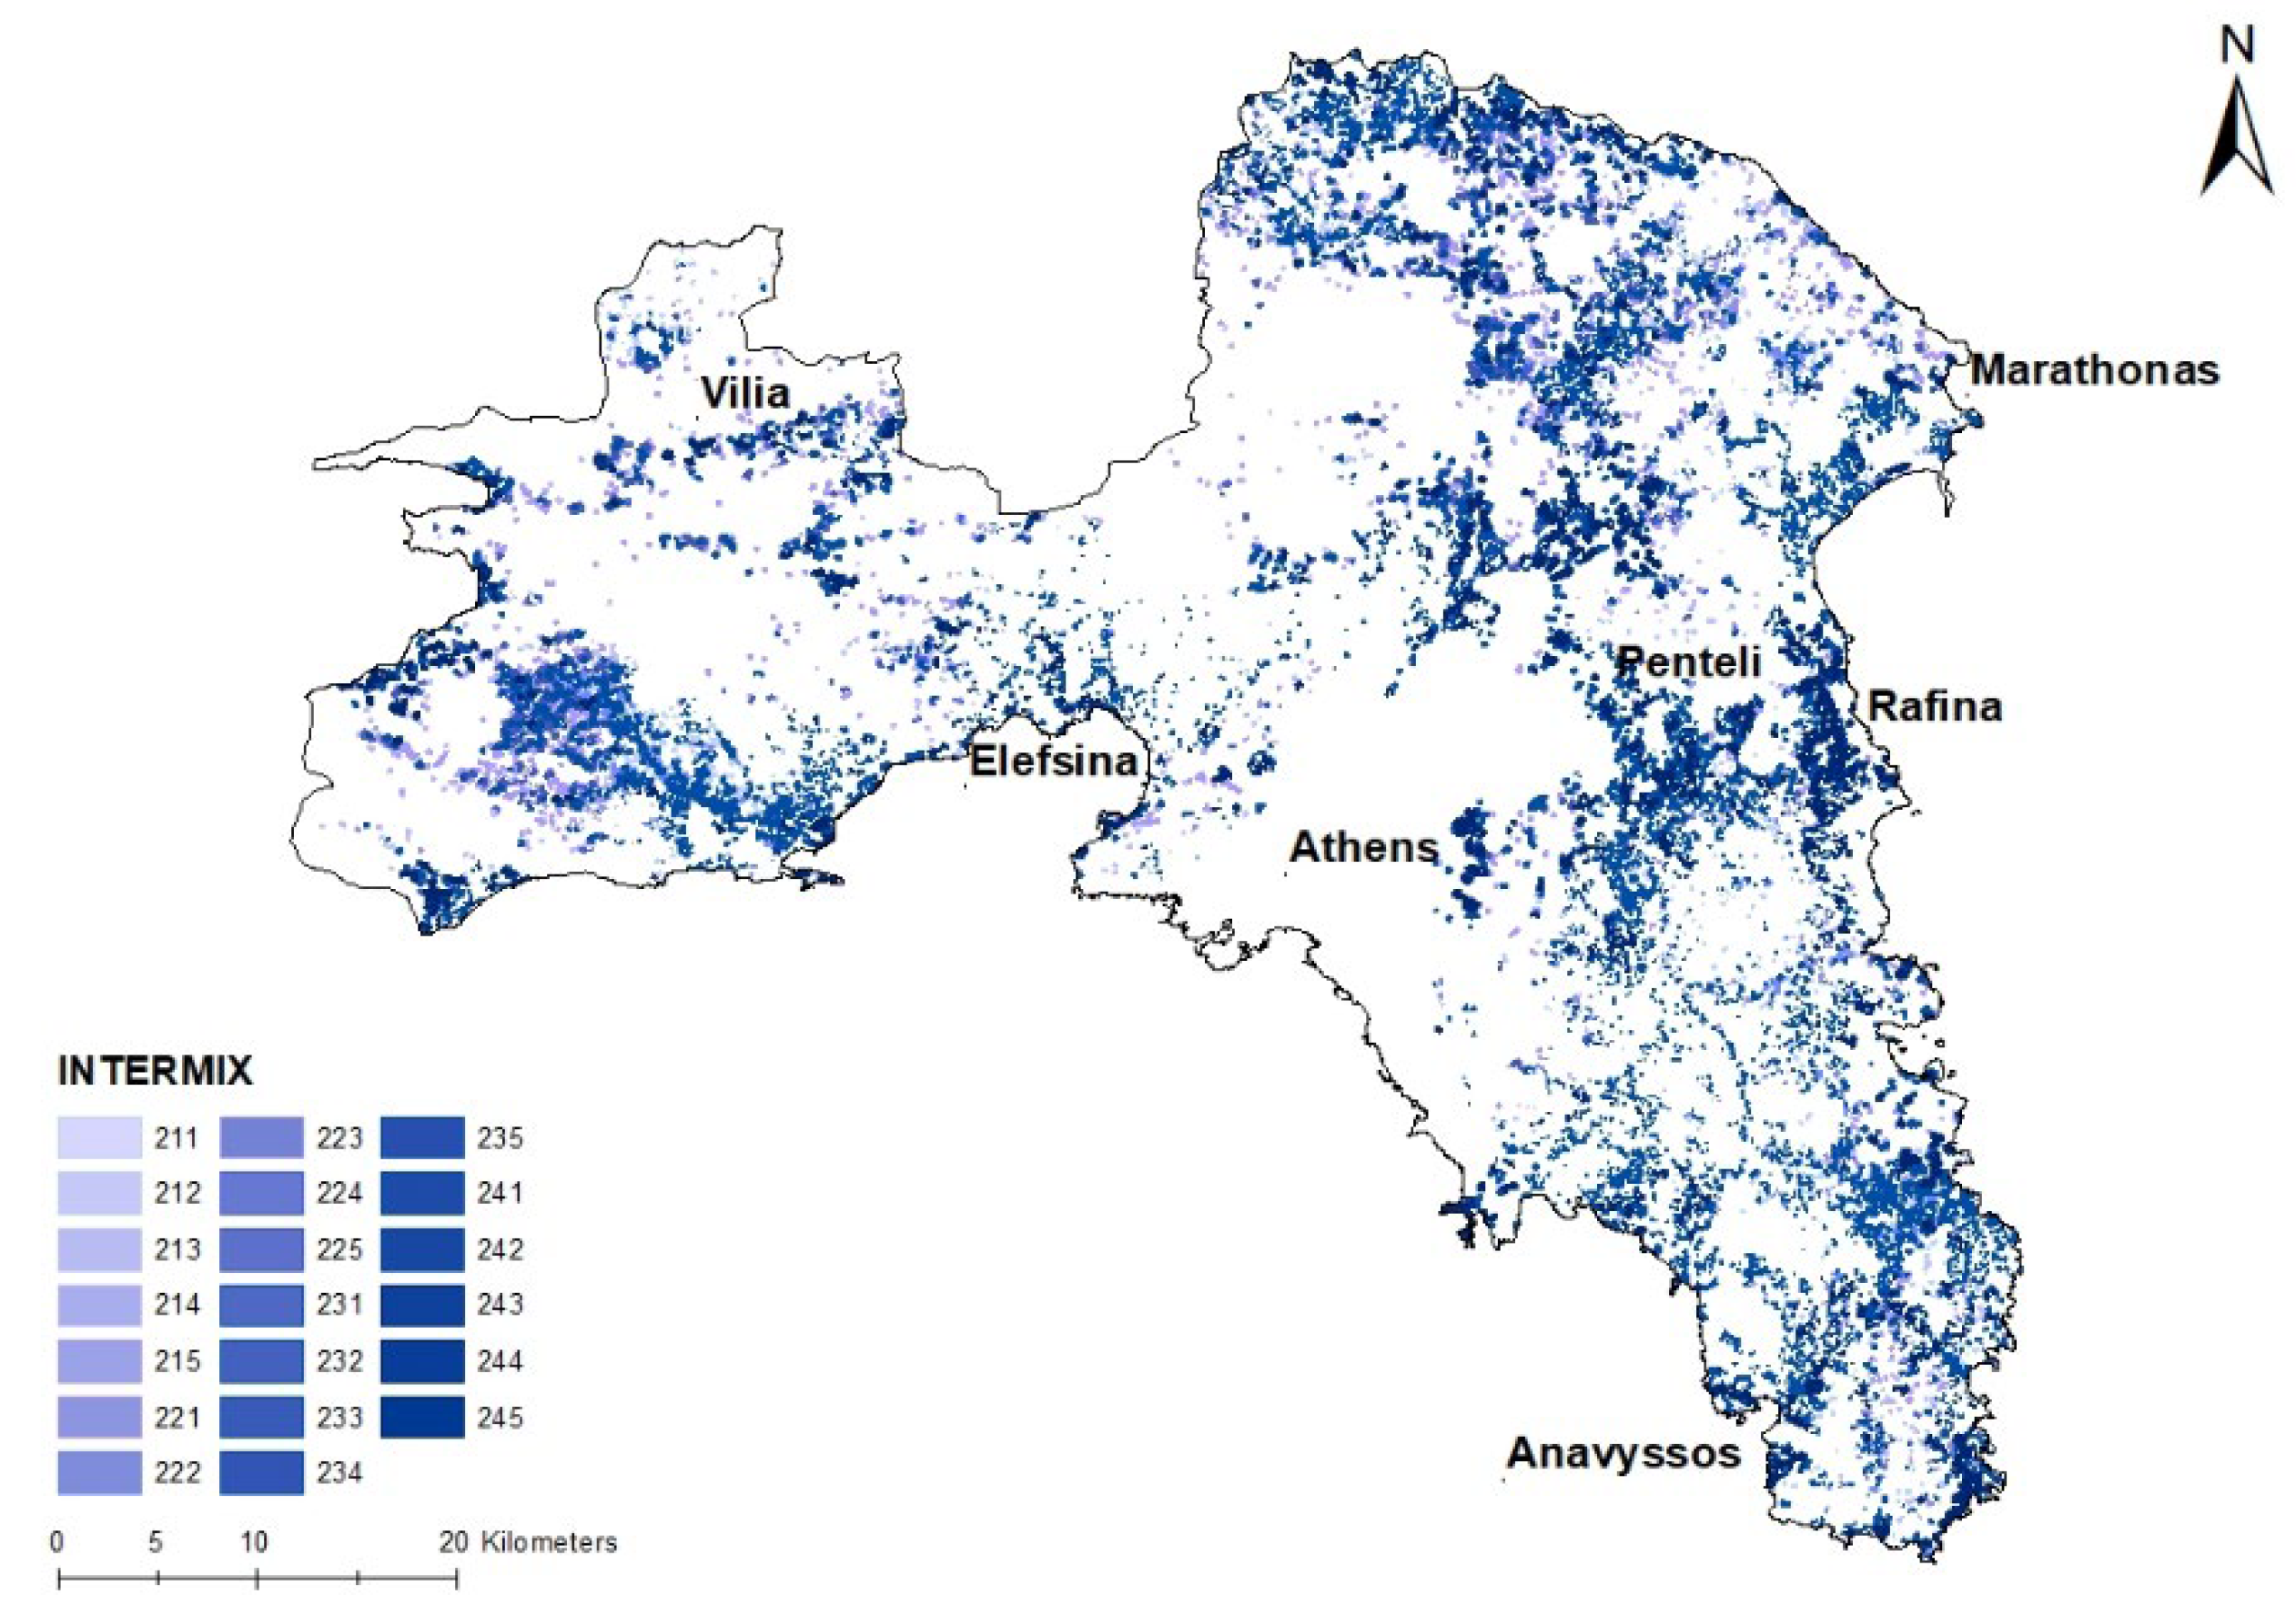
Figure 7.
Distribution of WUI classes in Attica
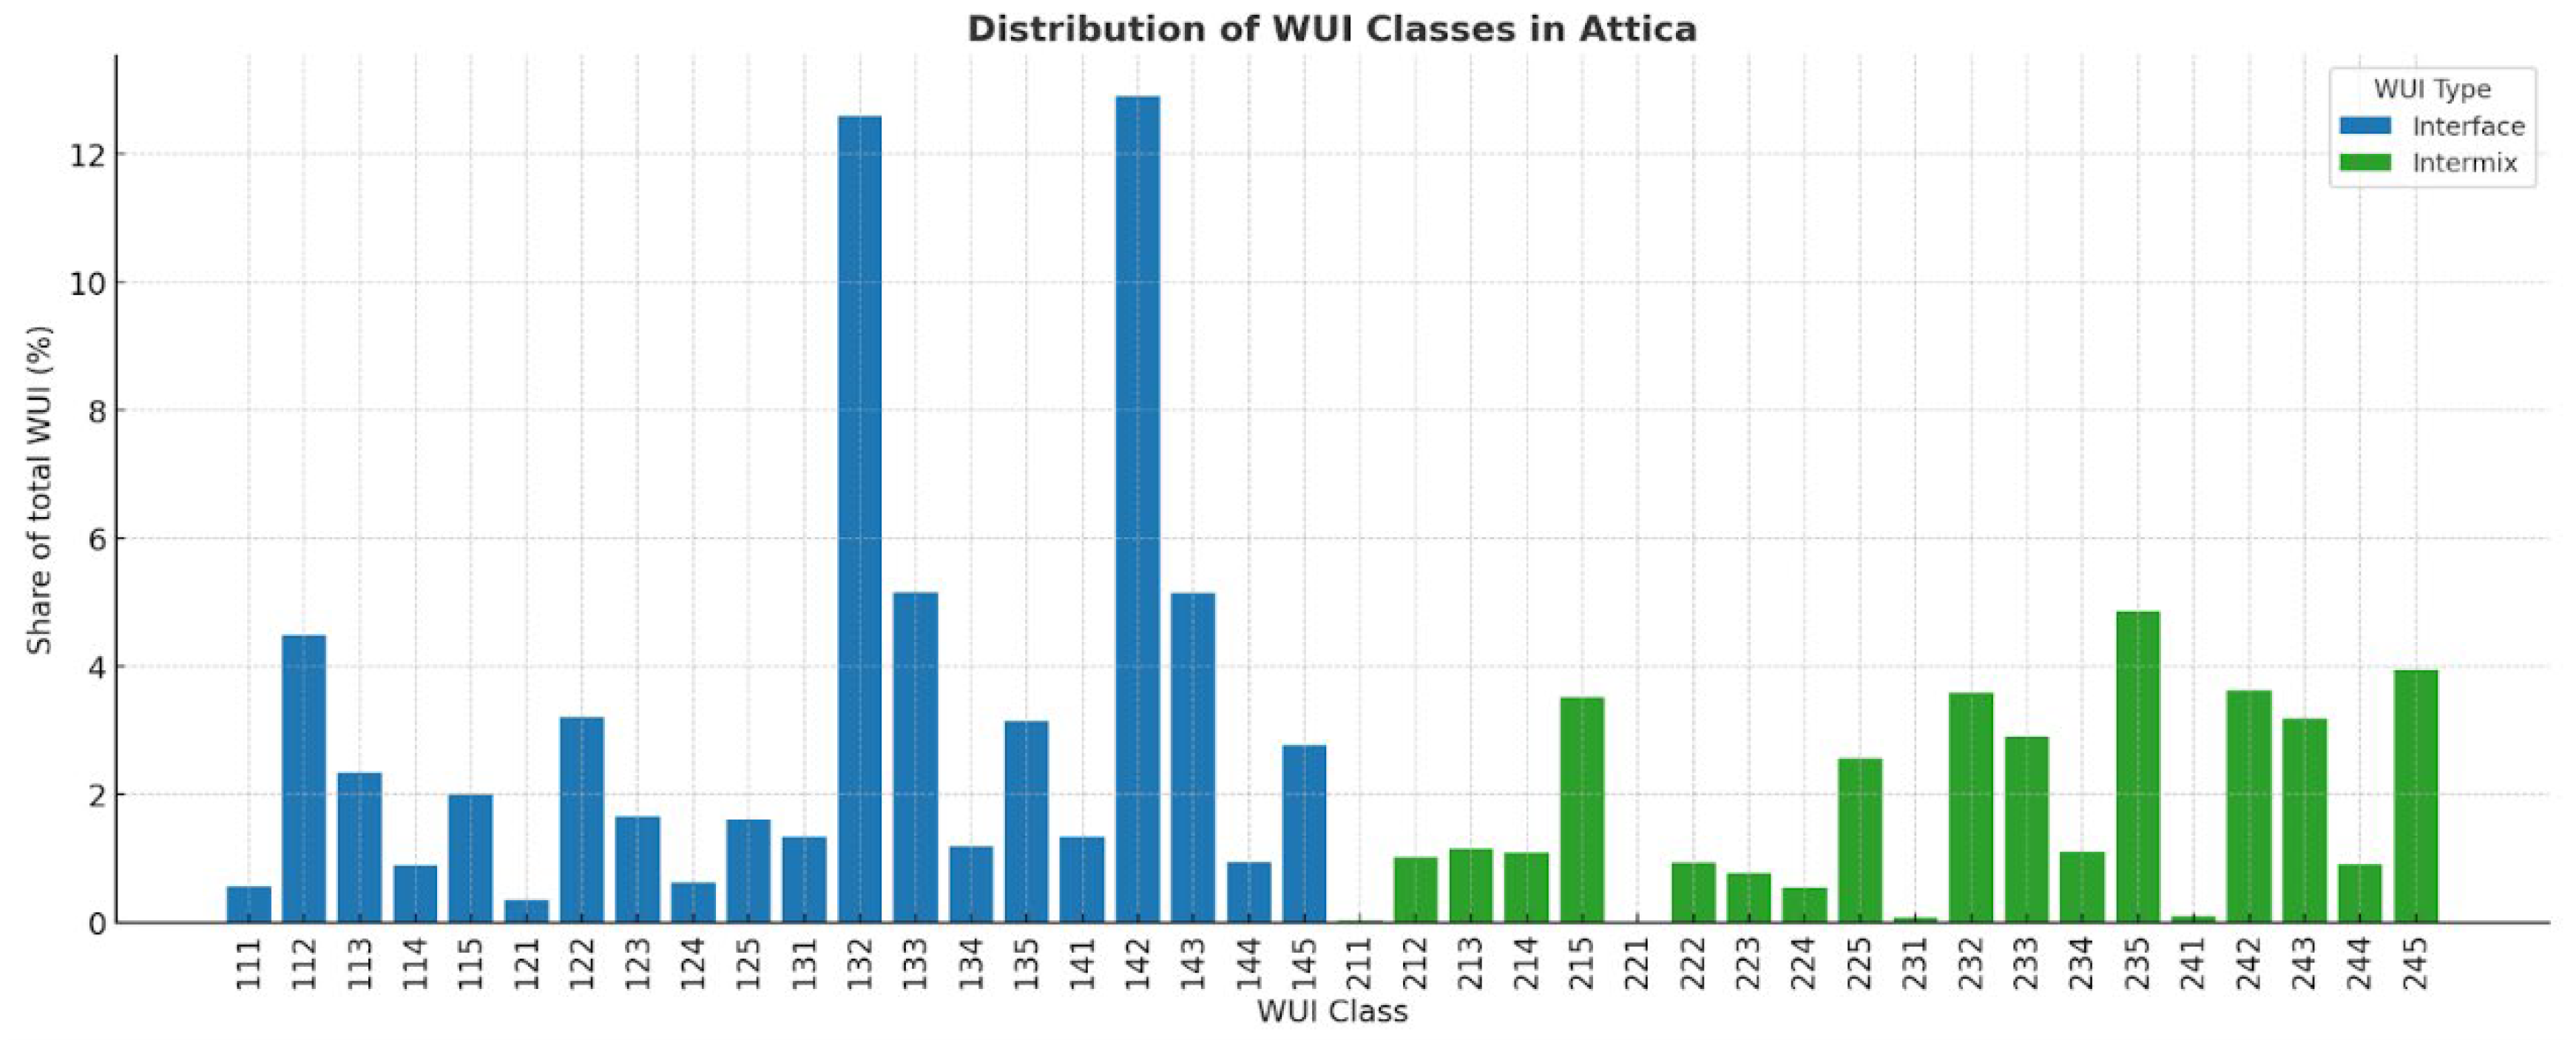
Figure 8.
Fire Hazard Map of Attica.
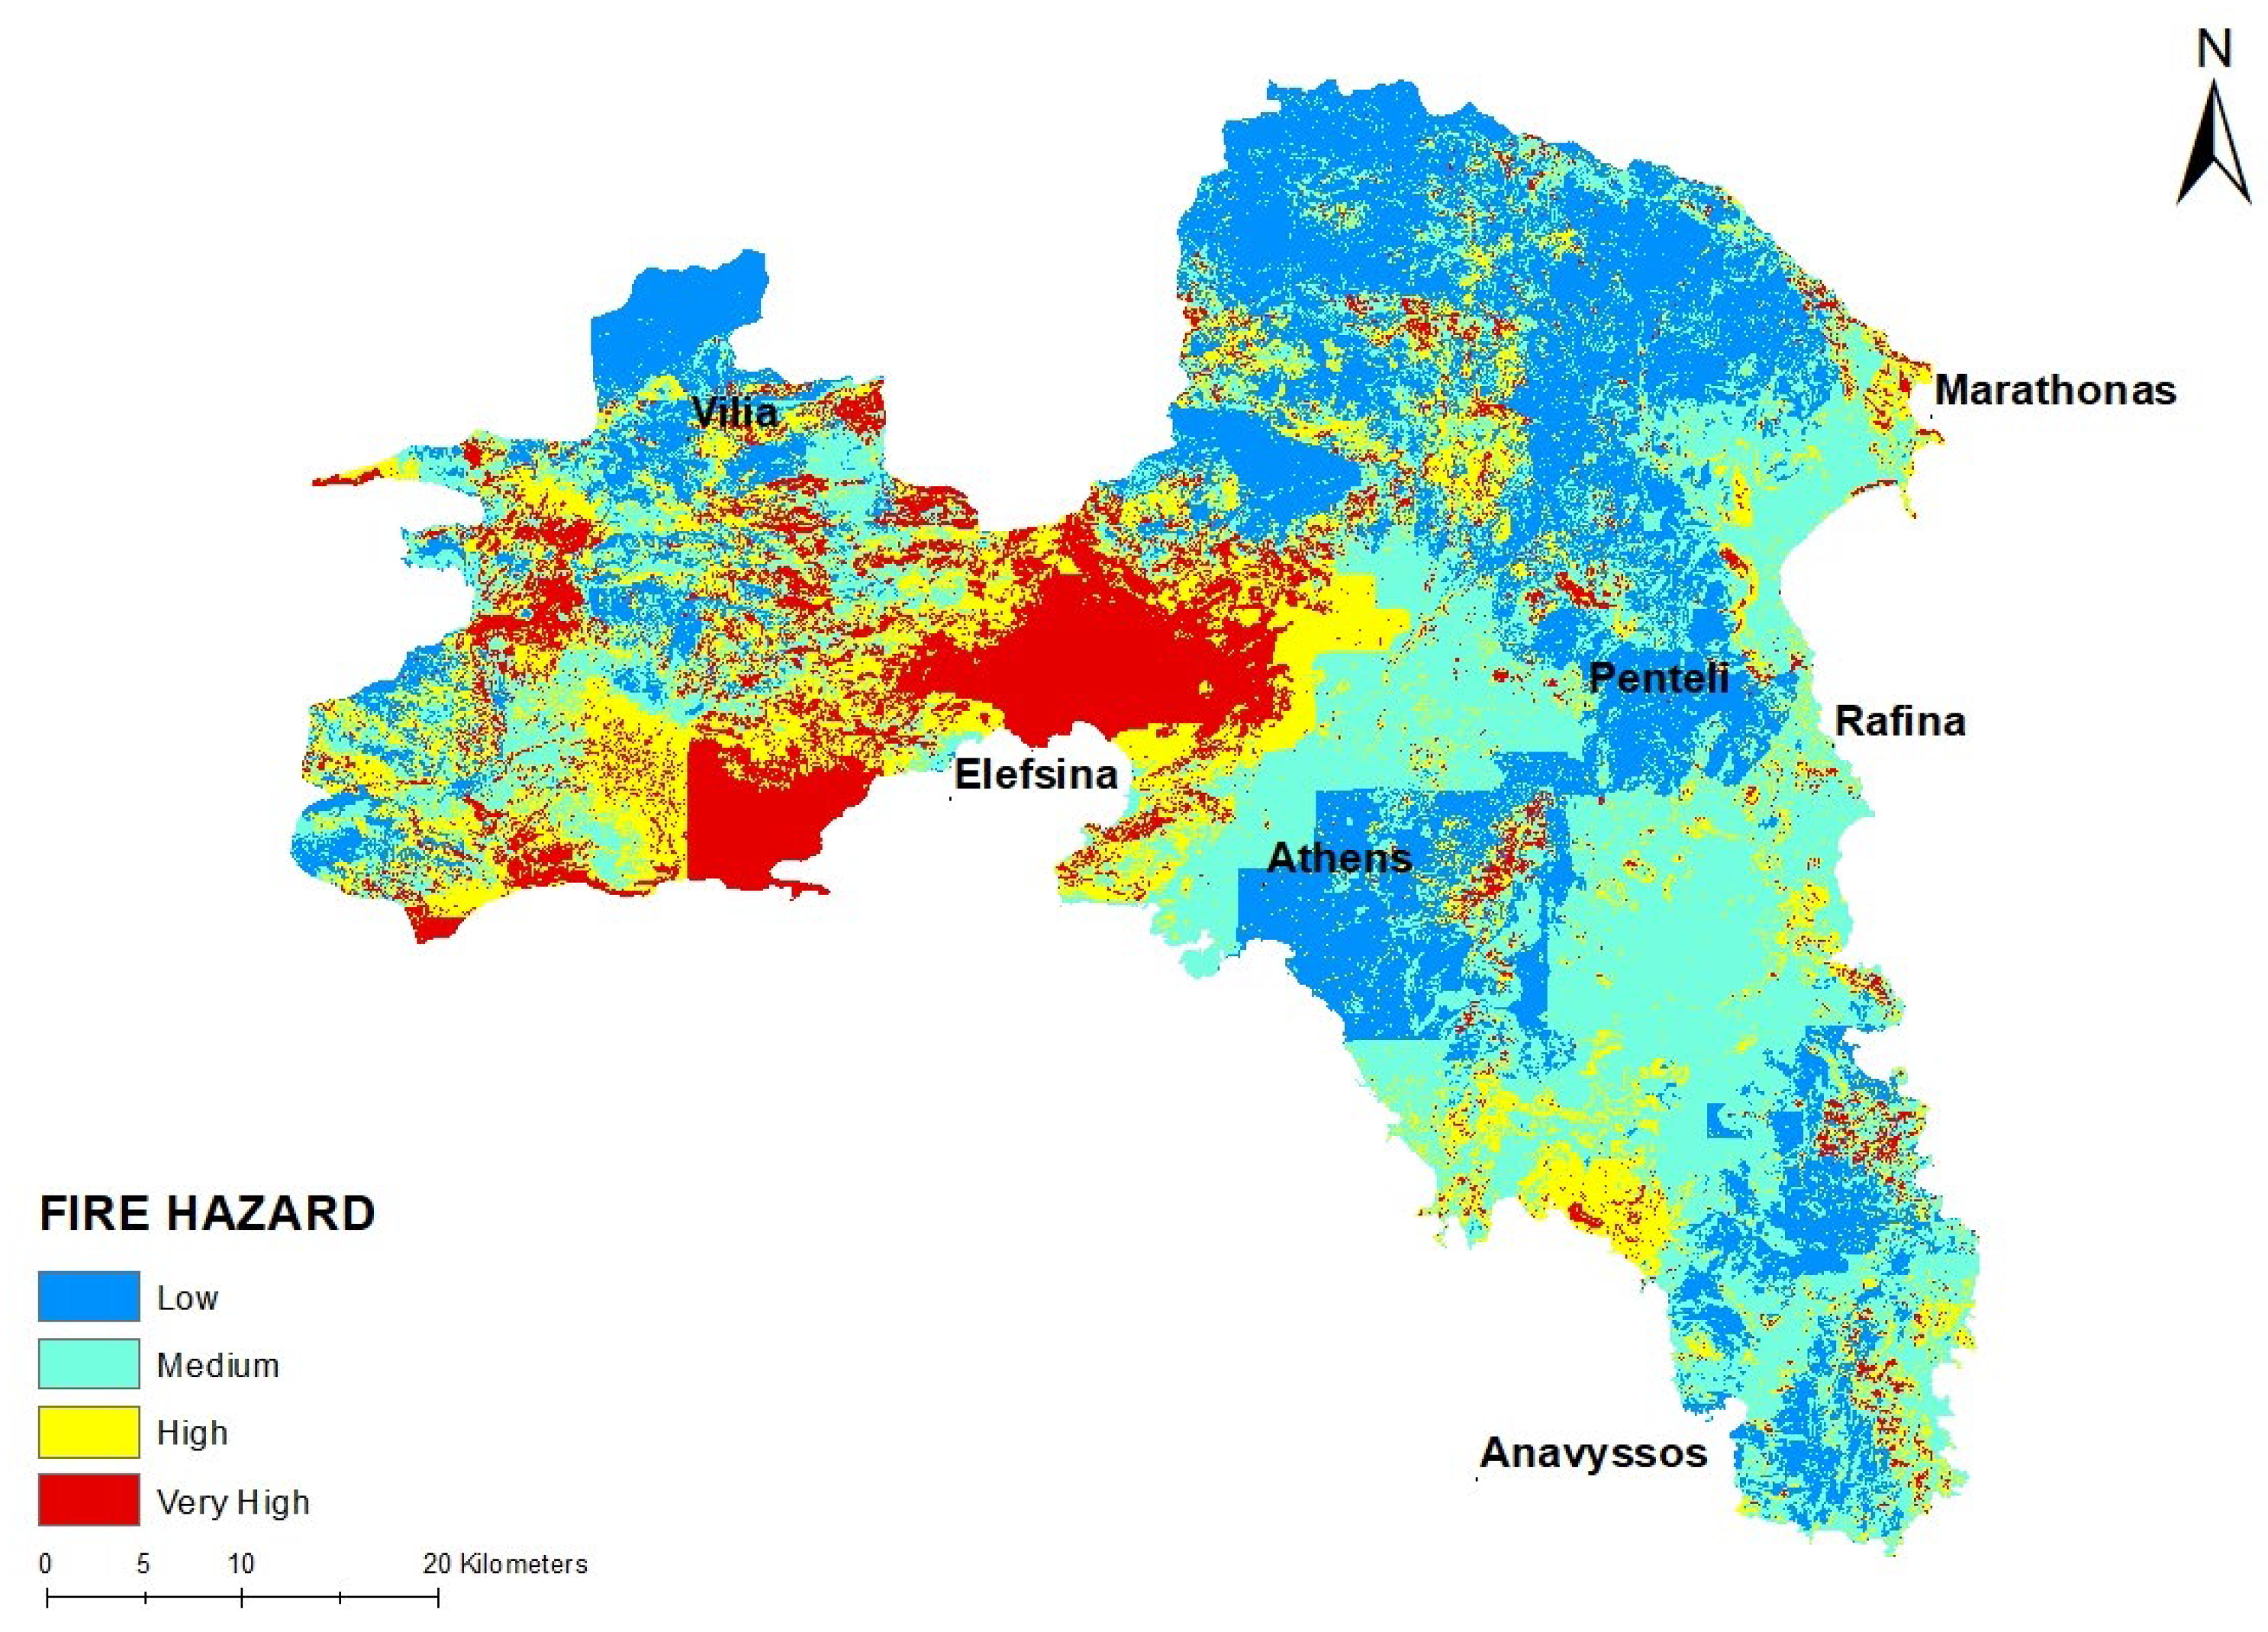
Figure 9.
Susceptibility Map of Attica.
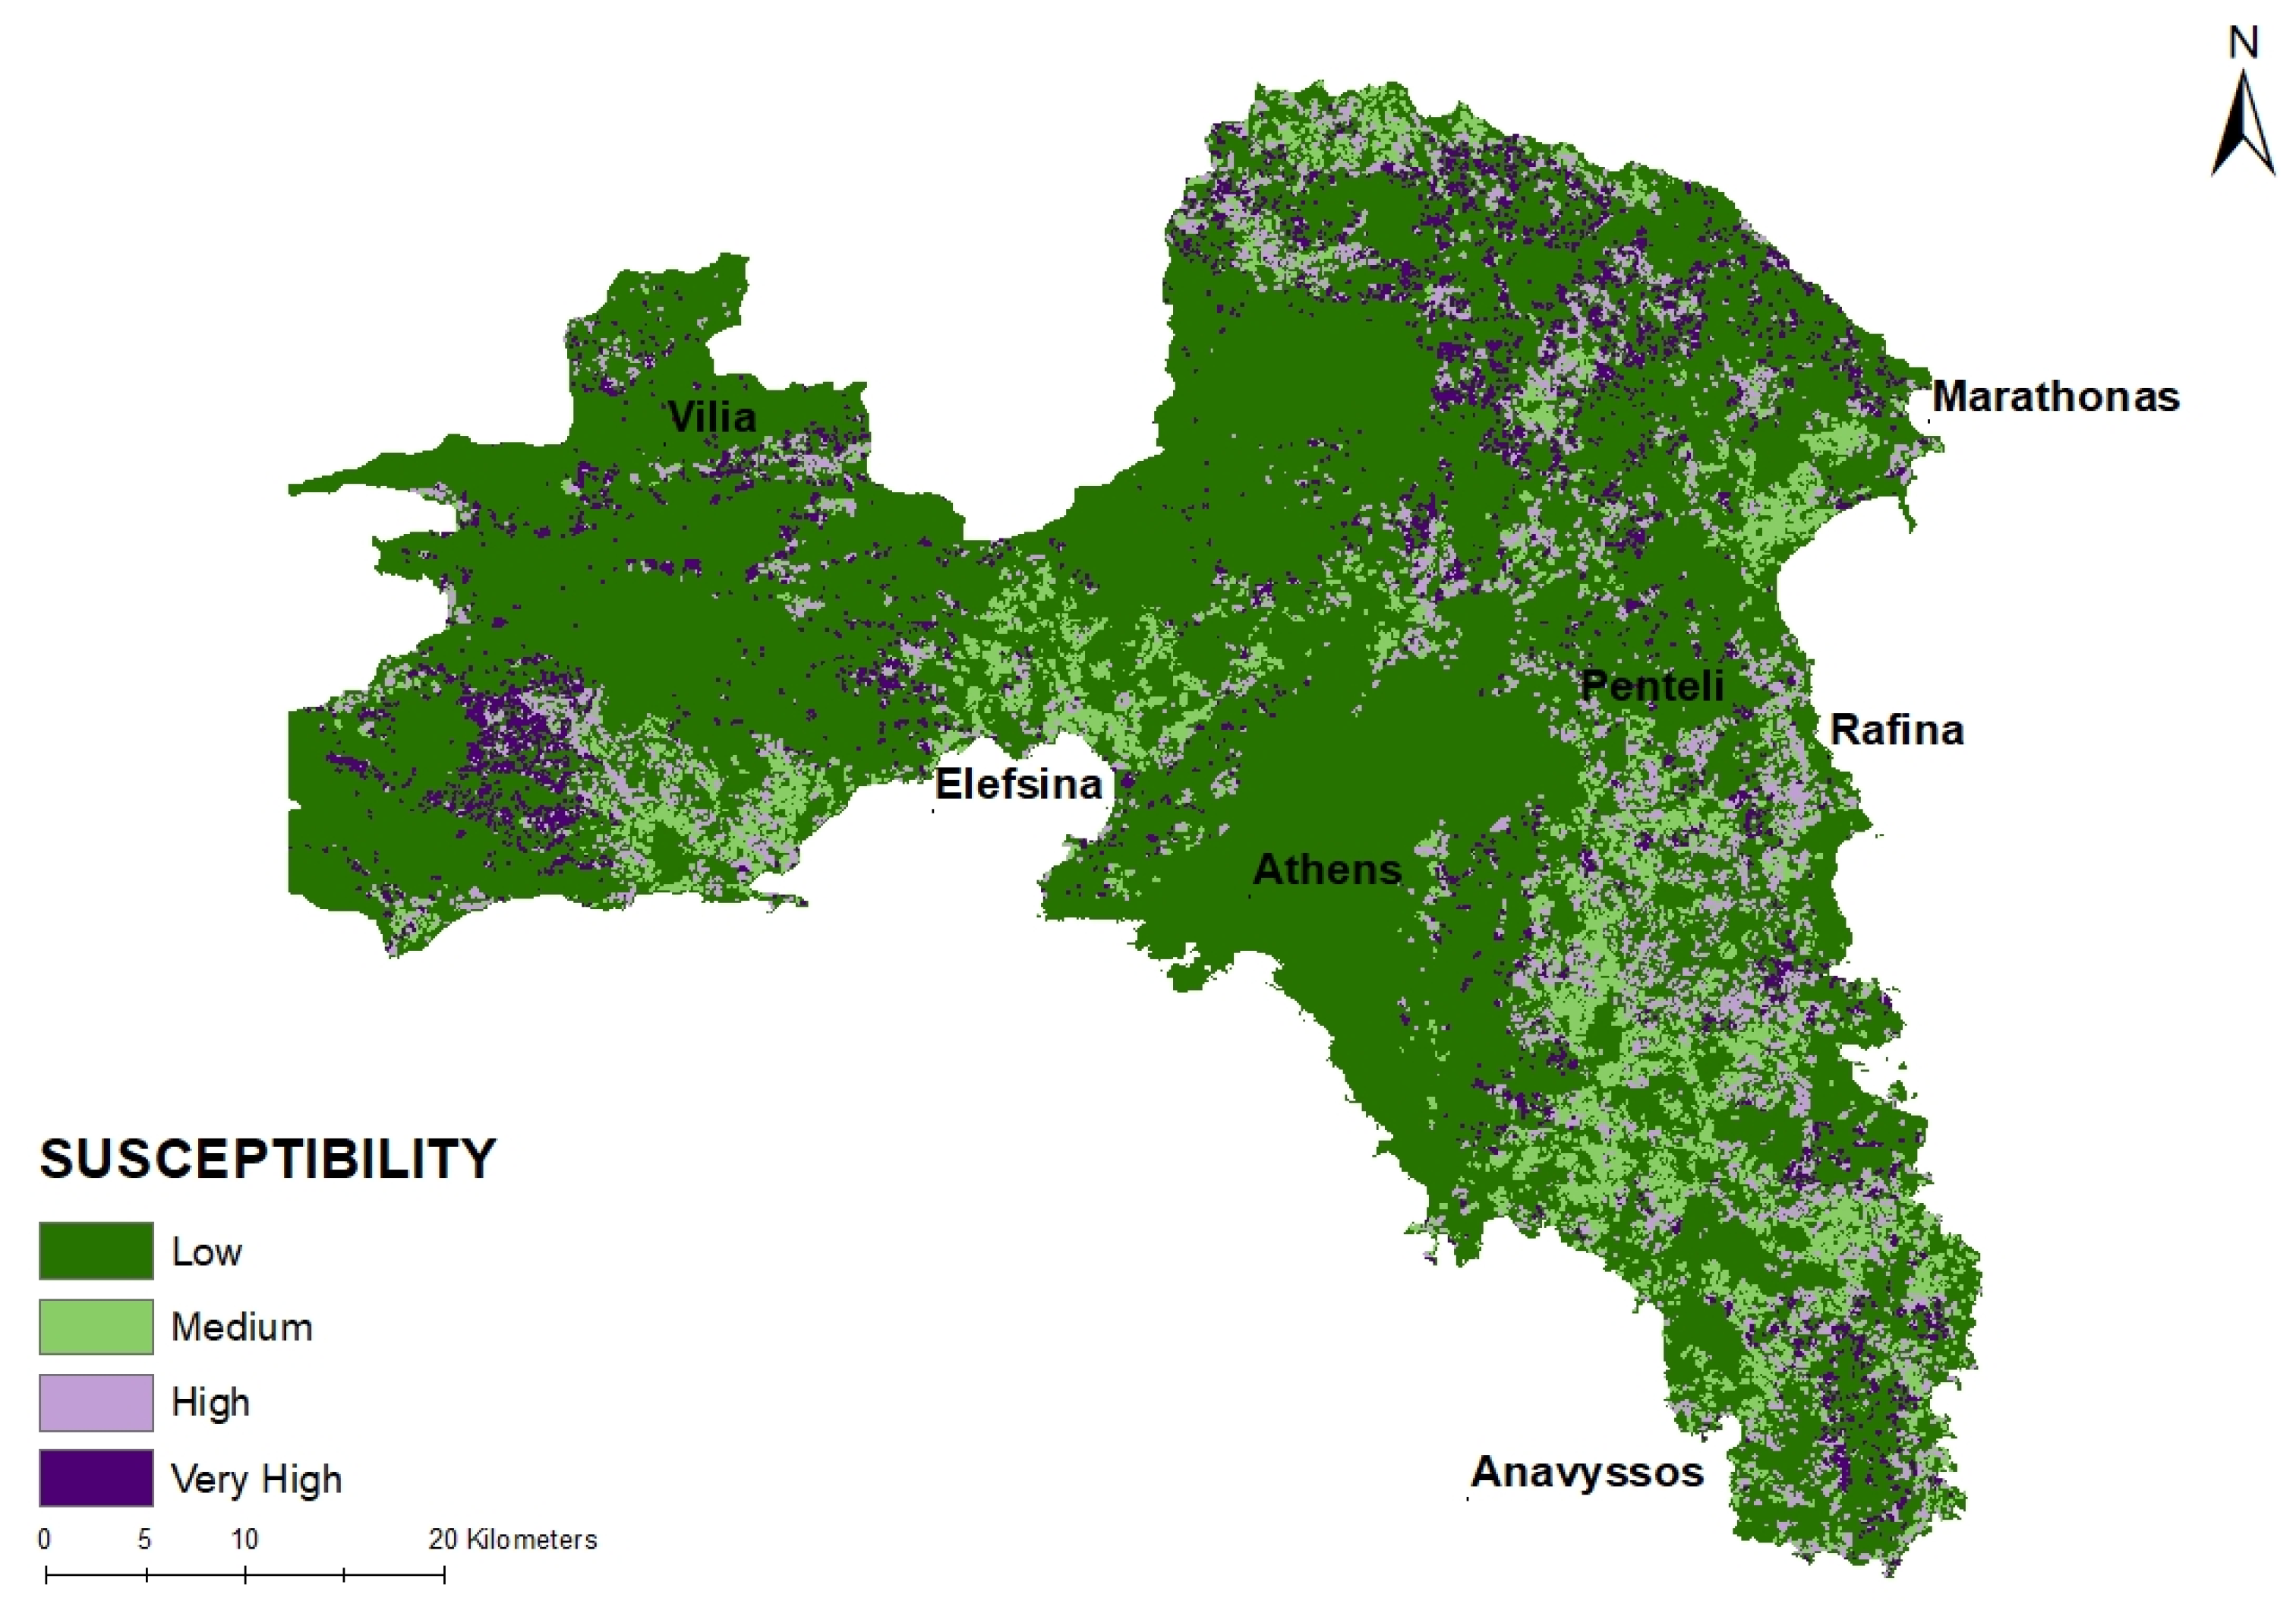
Figure 10.
Map of fire risk in Attica.
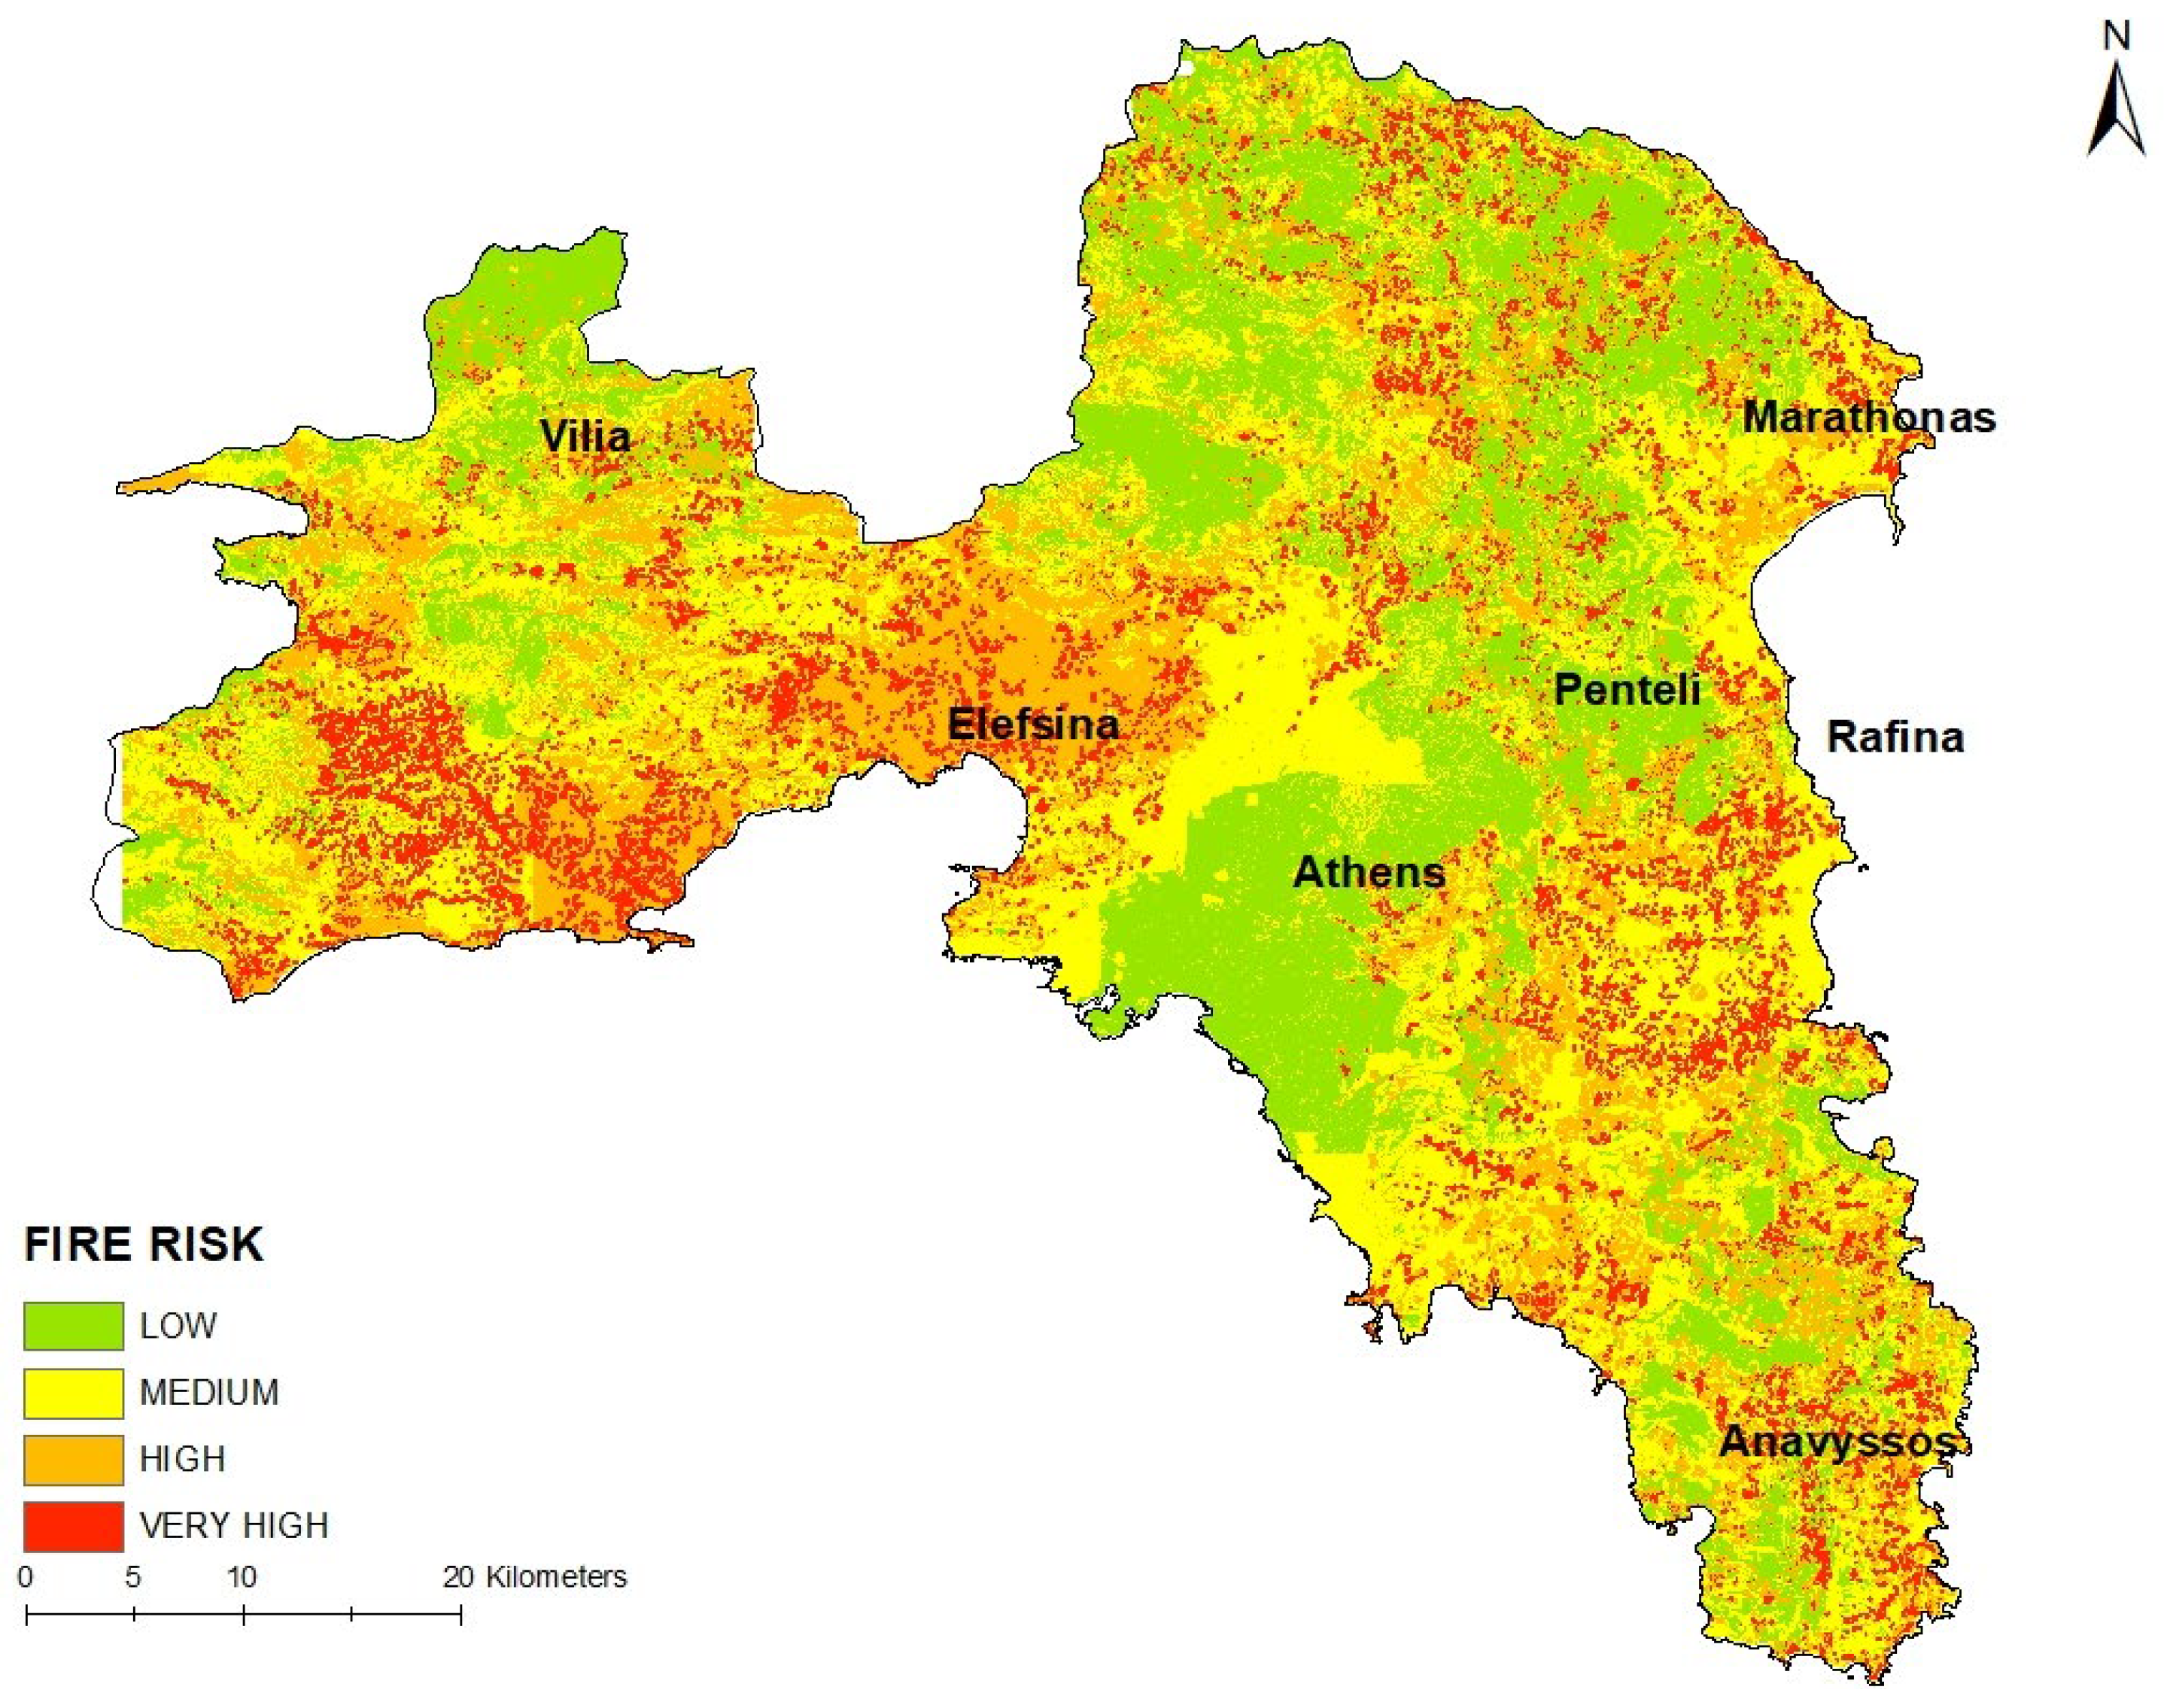
Table 1.
Geospatial Datasets used in the present study.
| Utilisation | Data | Data Characteristic | Acquisition Date/ Date of Creation |
|---|---|---|---|
| WUI mapping | Urban structures | UCR-STAR (Database); Building footprints (https://star.cs.ucr.edu/) | 2014-2021 |
| Corine Land Cover | Copernicus Database; Static, classified, continental-scale land cover map, utilising a Minimum Mapping Unit (MMU) of 25ha for areal phenomena (https://land.copernicus.eu/en/products/corine-land-cover) | 2018 | |
| Reference Parcels | Land Parcel Identification System (LPIS) | 2020 | |
| Forest maps | National Cadastral Organization | 2022 | |
| Dominant leaf type, Tree cover density, Small woody features maps | Copernicus Database; High resolution (vector/raster 5m/100m) (https://land.copernicus.eu/en/products) | 2018 | |
| Comparison of vegetation data/ building structures validation | Orthophoto maps | Aerial photographs orthorectified (1 m spatial resolution) | 2014 |
| DEM/slope | Topographic maps | Hellenic Military Geographical Service at 1:5.000 scale/maps | 1988-1994 |
| Risk Assessment | FWI90 Index | Modified from Politi et al (2023)[43]. National Centre for Scientific Research “Demokritos”; FWI threshold value of the 90th percentile for RCP 4.5 |
2025-2049 |
| Historical Burn Scar delineation |
Landsat 4, 5, 7, 8, 9 | U.S. Geological Survey; Spectral bands Near-Infrared and SWIR (https://earthexplorer.usgs.gov/) | 1983-2023 |
Table 2.
Fuel types weighted values for each vegetation type.
| Final class | Description | Final class | Description |
|---|---|---|---|
| 111 | Interface, Isolated dwelling, Broadleaf | 211 | Intermix, Isolated dwelling, Broadleaf |
| 112 | Interface, Isolated dwelling, Shrubs | 212 | Intermix, Isolated dwelling, Shrubs |
| 113 | Interface, Isolated dwelling, Coniferous | 213 | Intermix, Isolated dwelling, Coniferous |
| 114 | Interface, Isolated dwelling, Mixed type 1 | 214 | Intermix, Isolated dwelling, Mixed type 1 |
| 115 | Interface, Isolated dwelling, Mixed type 2 | 215 | Intermix, Isolated dwelling, Mixed type 2 |
| 121 | Interface, Scattered dwelling, Broadleaf | 221 | Intermix, Scattered dwelling, Broadleaf |
| 122 | Interface, Scattered dwelling, Shrubs | 222 | Intermix, Scattered dwelling, Shrubs |
| 123 | Interface, Scattered dwelling, Coniferous | 223 | Intermix, Scattered dwelling, Coniferous |
| 124 | Interface, Scattered dwelling, Mixed type 1 | 224 | Intermix, Scattered dwelling, Mixed type 1 |
| 125 | Interface, Scattered dwelling, Mixed type 2 | 225 | Intermix, Scattered dwelling, Mixed type 2 |
| 131 | Interface, Dense cluster dwelling, Broadleaf | 231 | Intermix, Dense cluster dwelling, Broadleaf |
| 132 | Interface, Dense cluster dwelling, Shrubs | 232 | Intermix, Dense cluster dwelling, Shrubs |
| 133 | Interface, Dense cluster dwelling, Coniferous | 233 | Intermix, Dense cluster dwelling, Coniferous |
| 134 | Interface, Dense cluster dwelling, Mixed type 1 | 234 | Intermix, Dense cluster dwelling, Mixed type 1 |
| 135 | Interface, Dense cluster dwelling, Mixed type 2 | 235 | Intermix, Dense cluster dwelling, Mixed type 2 |
| 141 | Interface, Very dense cluster dwelling, Broadleaf | 241 | Intermix, Very dense cluster dwelling, Broadleaf |
| 142 | Interface, Very dense cluster dwelling, Shrubs | 242 | Intermix, Very dense cluster dwelling, Shrubs |
| 143 | Interface, Very dense cluster dwelling, Coniferous | 243 | Intermix, Very dense cluster dwelling, Coniferous |
| 144 | Interface, Very dense cluster dwelling, Mixed type 1 | 244 | Intermix, Very dense cluster dwelling, Mixed type 1 |
| 145 | Interface, Very dense cluster dwelling, Mixed type 2 | 245 | Intermix, Very dense cluster dwelling, Mixed type 2 |
Table 4.
Extent of Wildland–Urban Interface (WUI) typology classes in Attica.
| Class | Area (ha) | % of Attica | % of WUI |
|---|---|---|---|
| 111 | 431.34 | 0.147% | 0.56% |
| 112 | 3,448.62 | 1.179% | 4.48% |
| 113 | 1,795.39 | 0.614% | 2.33% |
| 114 | 684.27 | 0.234% | 0.89% |
| 115 | 1537.4 | 0.526% | 2.00% |
| 121 | 269.13 | 0.092% | 0.35% |
| 122 | 2,472.54 | 0.845% | 3.21% |
| 123 | 1266.33 | 0.433% | 1.65% |
| 124 | 478.94 | 0.164% | 0.62% |
| 125 | 1,228.66 | 0.420% | 1.60% |
| 131 | 1,025.42 | 0.351% | 1.33% |
| 132 | 9,690.65 | 3.313% | 12.60% |
| 133 | 3,957.57 | 1.353% | 5.15% |
| 134 | 904.59 | 0.309% | 1.18% |
| 135 | 2,412.53 | 0.825% | 3.14% |
| 141 | 1,031.54 | 0.353% | 1.34% |
| 142 | 9,921.46 | 3.392% | 12.90% |
| 143 | 3,952.69 | 1.351% | 5.14% |
| 144 | 719.64 | 0.246% | 0.94% |
| 145 | 2,120.22 | 0.725% | 2.76% |
| 211 | 26.53 | 0.009% | 0.03% |
| 212 | 775.5 | 0.265% | 1.01% |
| 213 | 883.96 | 0.302% | 1.15% |
| 214 | 837.88 | 0.286% | 1.09% |
| 215 | 2,699.03 | 0.923% | 3.51% |
| 221 | 13.44 | 0.005% | 0.02% |
| 222 | 716.14 | 0.245% | 0.93% |
| 223 | 588.07 | 0.201% | 0.76% |
| 224 | 415.93 | 0.142% | 0.54% |
| 225 | 1,959.54 | 0.670% | 2.55% |
| 231 | 51.39 | 0.018% | 0.07% |
| 232 | 2,753.54 | 0.941% | 3.58% |
| 233 | 2,227.63 | 0.762% | 2.90% |
| 234 | 842.16 | 0.288% | 1.10% |
| 235 | 3,738.68 | 1.278% | 4.86% |
| 241 | 73.78 | 0.025% | 0.10% |
| 242 | 2,786.98 | 0.953% | 3.62% |
| 243 | 2,442.26 | 0.835% | 3.18% |
| 244 | 696.82 | 0.238% | 0.91% |
| 245 | 3,031.28 | 1.036% | 3.94% |
| Total: | 76,909.47 | 26.292% | 100.00% |
1 Class codes follow the scheme defined in Methods (Section 2.3). Areas are in hectares; “% of Attica” is relative to the mapped terrestrial extent, and “% of WUI” is relative to the total mapped WUI.
Table 5.
Classification of fire hazard levels in Attica based on natural breaks in the hazard index.
Table 5.
Classification of fire hazard levels in Attica based on natural breaks in the hazard index.
| Hazard level | Area (ha) | % of Attica |
|---|---|---|
| Low | 89,831.48 | 30.85% |
| Moderate | 107,295.65 | 36.85% |
| High | 54,440.38 | 18.70% |
| Very High | 39,624.79 | 13.61% |
| Total | 291,192.30 | 100.00% |
1 Note: Totals correspond to the mapped terrestrial extent; minor differences from the administrative area arise from masking and edge effects.
Table 6.
Classification of susceptibility levels in Attica.
| Susceptibility level | Area (ha) | % of Attica |
|---|---|---|
| Low | 221,582.66 | 75.88% |
| Moderate | 28,364.49 | 9.71% |
| High | 24,394.94 | 8.35% |
| Very High | 17,672.12 | 6.05% |
| Total | 292,014.21 | 100.00% |
1 Note: Totals correspond to the mapped terrestrial extent; minor differences from the administrative area arise from masking and edge effects.
Table 7.
Classification of wildfire risk levels in Attica.
| Risk level | Area (ha) | % of Attica |
|---|---|---|
| Low | 83,341.02 | 28.75% |
| Moderate | 97,127.78 | 33.51% |
| High | 71,438.89 | 24.64% |
| Very High | 37,978.20 | 13.10% |
| Total | 289,885.89 | 100.00% |
1 Note: Totals correspond to the mapped terrestrial extent; minor differences from the administrative area arise from masking and edge effects.
Disclaimer/Publisher’s Note: The statements, opinions and data contained in all publications are solely those of the individual author(s) and contributor(s) and not of MDPI and/or the editor(s). MDPI and/or the editor(s) disclaim responsibility for any injury to people or property resulting from any ideas, methods, instructions or products referred to in the content. |
© 2025 by the authors. Licensee MDPI, Basel, Switzerland. This article is an open access article distributed under the terms and conditions of the Creative Commons Attribution (CC BY) license (http://creativecommons.org/licenses/by/4.0/).
Copyright: This open access article is published under a Creative Commons CC BY 4.0 license, which permit the free download, distribution, and reuse, provided that the author and preprint are cited in any reuse.


