
Submitted:
22 July 2025
Posted:
24 July 2025
You are already at the latest version
Abstract
Seasonal fires in northern Thailand are a persistent environmental and public health concern, yet existing fire probability mapping approaches in Thailand rely heavily on subjective multi-criteria analysis (MCA) methods and temporally static data aggregation methods. To address these limitations, we present a flexible, replicable, and operationally viable seasonal fire probability mapping methodology using a Random Forest (RF) machine learning model in the Google Earth Engine (GEE) platform. We trained the model on historical fire occurrence and fire predictor layers from 2016-2023, and applied it to 2024 conditions to generate a probabilistic fire prediction. Our novel approach uses a more representative sample design which is agnostic to the burn history of fire presences and absences, pairs fire and fire predictor data from each year to account for interannual variation in conditions, empirically refines the most influential fire predictors from a comprehensive set of predictors, and provides a reproducible and accessible framework using GEE. Predictor variables include both socioeconomic and environmental predictors of fire, such as topography, fuels, potential fire behavior, forest type, vegetation characteristics, climate, water availability, crop type, recent burn history, and human influence and accessibility. The model achieved an Area Under the Curve (AUC) of 0.841 when applied to 2016-2023 data and 0.848 when applied to 2024 data, indicating strong discriminatory power. The highest fire probabilities emerged in forested and agricultural areas at mid elevations and near human settlements and roads, which aligns with the known anthropogenic drivers of fire Thailand. Variable importance analysis using the Gini Impurity Index identified both natural and anthropogenic predictors as key drivers of fire, including certain forest and crop types, vegetation characteristics, topography, climate, human influence and accessibility, water availability, and recent burn history. Our findings demonstrate the influence of model design choices on model results. The model outputs are provided as interpretable probability maps and the methods can be adapted to future years or augmented with local datasets. Our methodology presents a scalable advancement in wildfire probability mapping with machine learning and open-source tools, particularly for data-constrained landscapes. It can support Thailand’s fire managers in proactive fire response and planning, and also inform broader regional fire risk assessment efforts.
Keywords:
seasonal fire probability
; annual fire prediction
; Northern Thailand
; machine learning
; random forest
; fire risk modeling
; historical fire data
; remote sensing
; Google Earth Engine
; burn scar
1. Introduction
Thailand experiences seasonal forest and agricultural fires beginning in January or February and continuing until the onset of the rainy season in May [1,2,3,4,5]. Predicting seasonal wildfires in this time period is critical to mitigating the negative environmental and human health impacts, including landscape degradation and high levels of hazardous PM 2.5 air pollution [1,6,7,8,9,10,11].
Wildfires in Thailand are challenging to predict as they are largely driven by anthropogenic, rather than natural factors, including cultural, economic, and legal activities [12,13]. These anthropogenic influences not only drive current fire events but also initiate feedback mechanisms that create conditions conducive to future wildfires (Figure 1) [14,15,16,17,18]. More specifically, wildfires most commonly result from escaped intentional burns, carelessness, or arson, though some are ignited by lightning [1,17]. Intentional burns are used for clearing vegetation for agriculture and hunting, clearing understory for non-timber forest product (NTFP) collection, eliminating crop residue from rice, maize, and sugarcane plantations, and regenerating grass on livestock grazing land [15,16,18,19,20,21,22,23,24]. Only 5% of forest fires between 2001-2021 in Thailand were associated with complete forest loss, suggesting that forests are likely degraded but not completely cleared by most types of fire events [2].
Fire feedback mechanisms are both natural and anthropogenic. Certain forest types, such as dry dipterocarp, bamboo, and teak forests, are naturally more fire-prone and are also more frequently burned for NTFP collection [16,17]. Many of these ecosystems are maintained naturally by edaphic, climatic, and ecological factors [25,26,27,28] while others are likely the result of human-facilitated encroachment on other ecosystems [25,26,29,30] and may eventually return to wet forest types if left unburned [26,31]. The severity of wildfires is seasonally influenced by El Niño and La Niña [32] and is continually exacerbated by population growth and the growing need for land for cultivation [23,33,34].
Together, these complexities make it difficult to accurately predict and manage fires in Thailand. Mapping wildfire probability and risk are critical components of wildfire management. Fire risk is the combination of fire probability, intensity, exposure, and susceptibility [35]. Fire risk maps predict where fires will occur and how dangerous they will be [35,36,37]. In this study, we will refer to “fire probability” to mean the likelihood of a fire occurring and “fire risk” to mean the comprehensive quantification of probability, intensity, exposure, and vulnerability. Note that in the Thai language scientific and government literature frequently uses “fire risk” to refer to what English speaking fire managers define as “fire probability”. This study addresses fire probability, which is foundational to quantifying fire risk but does not provide a complete assessment of fire risk.
Existing work on fire probability mapping in Thailand and peninsular Southeast Asia includes operational methods and scientific studies (Supplement Tables S1 and S2). Operational methods in Thailand generally use multi-criteria analysis (MCA) to evaluate fire probability, which is a method that weights predictor variables based on expert opinion or statistical distributions and combines them into a final score [1,10,38]. Scientific literature exploring fire probability mapping in peninsular Southeast Asia uses either MCA [39,40,41,42,43], probabilistic statistics (PS) [44,45], or machine learning (ML) [46,47,48,49,50,51], approaches, with MCA and ML being the most common. The most common MCA approach is Analytical Hierarchy Process (AHP), while many different ML approaches are used, including Random Forest (RF), Bayes Network (BN), Naive Bayes (NB), and Support Vector Machine (SVM).
While providing important information for wildfire management, existing approaches for fire probability mapping face a few key challenges related to methods and data. With regards to methods, the MCA approaches are the simplest to implement, however scores and weights are completely subjective and final scores can be difficult to compare to one another or interpret in real world scenarios [50,52,53,54,55,56,57]. Existing MCA approaches have seen limited operational use by the general public in Thailand, due in part to how difficult they are to interpret in a practical setting without a fundamental understanding of the analysis methods [14]. ML approaches are computationally expensive and require large reference data sets for training and validation [58,59]. However, they can be used to empirically examine the relationship between predictor variables and fire occurrence and output probabilities that can be easily interpreted as the likelihood of a real world event [55,58,59]. In addition, ML based studies provide standard measures of accuracy and empirical measures of variable importances, allowing for inter-model comparison [53,54,55,57,59].
Existing approaches also do not include data-driven temporal variation between the predictor variables and predicted fire probabilities. Predictor variables commonly include burn history and frequency, land use and land cover, vegetation and water indices, fire season weather, infrastructure and accessibility, and topography [1,10,38,39,40,41,42,43,44,45,46,47,48,49,50,51]. Many of the approaches produce a single static map of fire probability representative of the entire time period of interest; these probabilities are based on cumulative fire occurrence over a set of years, and average conditions from the same years or a subset of those years [39,40,42,43,44,45,46,47,48,49,50,51]. They use historical fire reference points from a range of years, but most predictor variables are static; any historical predictor variables available for the time period are aggregated into a single layer for use in the model, rather than associating the predictor variables to reference points of each corresponding year [39,40,42,44,45,46,47,48,49,50,51]. Further, many studies derive their fire occurrence data solely from MODIS or VIIRS active fire hotspots [44,45,46,50,60]. The inadequate spatial and temporal resolution and sensor type make these datasets ineffective in detecting the small, short, and mostly anthropogenic fires common in Thailand.
To address both methodological and temporal data issues, we developed a seasonal fire probability mapping approach for Thailand, with a fully developed example from the nine northernmost provinces of the country. We leverage machine learning and globally available data sets in Google Earth Engine’s (GEE) cloud computing environment. We trained a random forest model on annual historical fire and fire predictor data from 2016 to 2023 in Northern Thailand, then deployed the model on 2024 fire predictor data to generate the 2024 fire probability map. This methodology can increase the speed and complexity of fire risk related analyses while also offering flexibility for the input data sources and analysis frequency; it can be easily run for any given year for which historical fire data and predictor data are available.
Our intention was to develop a method to produce a straightforward probability metric that is easily interpreted by the general public and can be operationalized by government fire managers by running the analysis annually before each fire season. The approach is easy for local fire experts to modify using higher quality local data in lieu of publicly available global datasets used by default. Our approach is novel in that we offer an operationalization-ready machine learning approach for fire probability mapping, which improves upon the current operational methods in Thailand that use manual weighted overlay analyses; we use historical data to account for interannual variation in fire and its predictors in order to predict seasonal fire probability in a given year; we use a more representative sample design that allows for locations with any burn history to be selected as fire presences and absences for a given year; we empirically test and refine a comprehensive set of potential fire predictors compiled from existing fire probability mapping methodologies; and we provide all code necessary for implementation.
2. Materials and Methods
2.1. Study Area
Our study area was the 9 most northeastern provinces of Thailand: Chiang Mai, Chiang Rai, Mae Hong Son, Lamphun, Lampang, Phayao, Phrae, Nan, Tak (Figure 2). These provinces experience lengthy fire seasons [2,41,50] characterized by infrequent, small, fragmented, and low intensity fires in forested and agricultural lands [2]. In 2019, the LULC was comprised of 69% closed forest (>70% canopy cover); 16% agriculture; 11% open forest (15-70% canopy cover); 2% urban; and <1% grassland, shrubland, or herbaceous wetland (<10% canopy cover) [61]. The terrain is mountainous, with some of the highest elevations found in Thailand [62]. The three main ecoregions are Kayah-Karen montane rain forests, Central Indochina dry forests, and Northern Thailand-Laos moist deciduous forests [63], all tropical and subtropical moist broadleaf forest biomes. The region is characterized by strong seasonality in precipitation and vegetation greenness; precipitation peaks in September through October and the normalized vegetation index (NDVI) peaks in July through October [64,65,66,67]. Mean annual precipitation accumulation for 2016-2024 was 163 cm and mean temperature for 2016-2024 was 24 degrees celsius [68]. Temperature generally fluctuates between 20-30 degrees celsius throughout the year with the lowest temperatures in November through January and the highest temperatures in March through May [64].
2.2. Model Selection
We chose a random forest model to model fire probability due to performance and operationalizability (Figure 3) [69]. Random forest models have performed well in predicting fire likelihood in Thailand and neighboring countries, sometimes outperforming more complex machine learning models [46,50]. They better capture non-linear interactions between predictors [70] and are more robust to overfitting due to data noise [71,72], and multicollinearity [73,74], than simpler decision tree and regression methods. In addition, random forest models are easy to operationalize as they are conceptually straightforward algorithms that can be easily understood, employed, and refined by fire managers, even with no prior machine learning experience.
To create the seasonal fire probability map, we used Google Earth Engine’s smileRandomForest classification algorithm with 500 decision trees [58,75]. Training points consisted of fire presence and absence data, and environmental and social predictor variables consisted of representative data layers. Once trained, the model was deployed on predictor variable layers from 2024 to produce the probability map for the 2024 fire season. The model outputs probability values that can be interpreted as the percentage of decision trees that predict fire presence [58].
2.3. Data Selection
2.3.1. Fire Presence and Absence Data
Reference points representing fire presence and absence were derived from burn scar data for 2014-2023 from GISTDA [1]. GISTDA produces burn scar data by calculating the difference between pre- and post-fire Normalized Burn Ratio (NBR) is calculated from Sentinel-2 imagery to produce delta NBR (dNBR); dNBR is then manually thresholded on a regional basis using its frequency distribution as a guide for determining the localized cutoffs for burnt areas [1,38,76]. GISTDA reports that this methodology has an overall accuracy around 66.8% [1].
This approach is preferable to using MODIS or VIIRS-derived FIRMS active fire hotspots [60] as reference data for fire occurrence in Thailand for multiple reasons [77]. The MODIS and VIIRS sensors detect fires through temperature anomalies in their thermal bands, providing full global coverage once daily for MODIS and twice daily for VIIRS [5,78,79,80]. MODIS has a spatial resolution of 1000m and VIIRS has a spatial resolution of 375m [5,78]. MODIS-derived hotspots have low error of commission in Thailand [81] and VIIRS-derived hotspots can detect fires as small as 5m2 both globally [82] and in Thailand [83]. However, these data lack the spatial resolution necessary to pinpoint precise locations for the small transient fires characteristic to Southeast Asia [77]. GISTDA burn scars in Thailand have a median size of 0.006 km2 and a mean size of 0.15 km2, compared to the 0.14-1 km2 pixel size of the FIRMS data. FIRMS point locations are generated at the centroids of the MODIS or VIIRS pixels, so fires smaller than a pixel will have imprecise locations. Additionally, fires must produce enough heat to be detected during the satellite overpass [5,78]. Sensors sometimes do not register agricultural fires on small fields or understory fires under dense forest canopies, even if they burn during multiple satellite overpasses [14]. Further, landowners and officials are aware of satellite orbital patterns and will sometimes time their intentional burns to be between overpass times in order to avoid detection [14].
Reference points for fire presence and absence were randomly generated within historical burn scar polygons from 2016-2023 obtained from GISTDA (Supplement Figure S1). For each year, 600 total reference points were generated (300 in areas that burned that year and 300 in areas that did not burn that year) yielding a total of 4800 reference points [84,85,86]. Of these reference points, 80% were used to train the model and 20% were used to validate the model for 2016-2023 [87]. An additional 600 reference points were generated solely for validating the final 2024 probability map (300 in areas that burned in 2024 and 300 in areas that did not burn in 2024).
2.3.2. Predictor Variable Data
We used environmental and socioeconomic variables with known relationships to fire probability in Thailand as predictor variables based on similar fire probability mapping analyses from scientific literature in peninsular Southeast Asia and operational methods in the Thai government [1,10,38,39,40,41,42,43,44,45,46,47,48,49,50,51]. These include variables representing topography [10,42,88,89], fuels [12,24,89,90,91,92,93,94,95], potential fire behavior [91,93], forest type [1,3,10,12,26,28,90,92,96,97,98], vegetation characteristics [3,12,26,28,90,92,96,97,98], climate [1,2,12,24,89,95,98], water availability [1,10,39,99], crop type [1,13,18,20,21,22], recent burn history [1,10,12,18,25,30,100], and human influence and accessibility [10,12,98] (Table 1). These variables both directly and indirectly influence ignition likelihood and fire behavior, and many of them exhibit complex interactions with each other across multiple temporal and spatial scales [18,26,88,92,96,97,101,102,103,104].
2.4. Data Preprocessing
Full descriptions of preprocessing steps and example maps for each predictor layer can be found in Supplement Table S3 and Supplement Figure S8a-j. Publicly available global data layers were used to represent predictors for which we did not have local data sets. All predictor variable layers were resampled to a 300 m resolution using either mean or minimum aggregating functions, as appropriate. For data sets that had spatial resolutions lower than 300 m (pixel size larger than 300 m), the pixels were subdivided to 300 m and smoothed with a focal mean function.
All variables with multiple time steps available were composited to produce operational layers comprising data available before the start of each fire season. The exact compositing methods varied based on the known seasonality of the variables and the data type, quality, and availability. For example, climate variables were derived from composites of the 5 pre-fire season months (August-December) [1,2,3,4], forest canopy and change variables were derived from annual values from the two pre-fire season years, optical imagery indices were derived from composites of the pre-fire season year, and seasonal SAR imagery differences were derived from composites of the 4 months in the peak leaf-on season (July-October) and 4 months in peak leaf-off season (January-April) [64,65,66,67]. For data sets that had temporal resolutions lower than 1 year (intervals greater than 1 year), annual layers for years without data were created using the most recent values. Predictor variable values were extracted to the reference points from the corresponding year. For predictors for which we had no historical data, the values from the single-date static layers were extracted to all points.
In order to ensure the reliability of variable importance assessments, we ensured that all variables were continuous and scaled to the same numerical range. The Gini impurity index favors variables that provide more potential splits during tree construction, including variables with more unique values and larger numerical ranges [123,124]. Thus, it often assigns higher importance to continuous rather than categorical variables, and higher importance to variables with higher numerical values rather than lower numerical values [123,124]. Additionally, if some rare classes have very few representative reference points, the model may not be able to identify their predictive relationship with fire, even if a relationship does exist [125]. Categorical variables were converted to continuous values by calculating the distance to each class, alleviating the biases posed by categorical variables and sampling bias. All predictor variable values were also normalized to a zero to one scale using a simple min-max normalization, alleviating the biases posed by differing numerical ranges.
2.5. Model Development and Refinement
2.5.1. Multicollinearity
We assessed multicollinearity between variables using correlation coefficients and the Variance Inflation Factor (VIF) [126,127] (Supplement Figures S2-S4). While random forest models have been shown to maintain predictive performance despite multicollinearity in predictor variables [73,74], multicollinearity can confound variable importance rankings in random forest models [125,128,129]. Two pairs of variables had high correlation, namely elevation and maximum temperature and EVI and NDWI, however we kept both pairs as they independently influence fire behavior and their VIF fell below the generally accepted threshold [127]. Ecological data often exhibit inherent multicollinearity, and it can be appropriate to retain highly correlated variables in random forest models when the goal of the study includes identifying multiple important variables [125].
2.5.2. Variable Importance
Variable importance was calculated for all predictors using the Gini impurity index. Despite its potential biases, Gini impurity is the most accessible empirical variable importance metric on which to base variable selection for an operational fire probability model. The Gini index measures how often a randomly chosen data point would be incorrectly classified if it were given a random class label based on the distribution of classes in a given subset of data points [130,131]. The variable importance metric can be defined as how much each variable contributes to the model’s ability to distinguish between classes.
We normalized variable importances to sum to a 100 for easy interpretation. The model was then refined by removing variables individually in order of importance to the model until further removals resulted in a distinct drop in 2016-2023 AUC below 0.84 (Figure 4). Eleven variables were removed during model refinement, leaving 31 variables in the final version of the model. A full chart of variable importances before model refinement can be found in Supplement Figure S5.
2.5.3. Accuracy Assessment
We used Area Under the Curve (AUC), which is calculated for the Receiver Operating Characteristic (ROC) curve, to assess the predictive power of the model [46,47,48,49,51,132,133,134,135]. We calculated AUC for the two separate testing sets: 20% of the 4800 reference points from 2016-2023 set aside for validation, and the 600 reference points from 2024 generated solely for validation. AUC quantifies a model’s ability to correctly classify the validation data compared to a random classification; values between 0.8 and 0.9 are excellent and values between 0.9 and 1.0 are outstanding [136,137,138].
2.5.4. Sensitivity Analysis
We also conducted a sensitivity analysis on the model’s response to the removal of individual variables. We trained and validated 44 versions of the random forest model, with the initial run including all variables and each subsequent run removing only a single variable from the set. We calculated the mean and median of each variable’s scaled importance values across all runs and plotted the difference in 2016-2023 AUC (dAUC) between each run and the initial run.
3. Results
3.1. Variable Importance and Model Sensitivity
Two distinct groups emerged within our variable importance rankings: a group of low importance variables, and a group of high importance variables with nearly equal importance values. There is a clear difference in importance values between the top and bottom groups and a distinct drop in 2016-2023 AUC once variables from the high importance group are removed during model refinement (Figure 4). Before model refinement, the most important variables each contributed between 2.4-3.1% of the total impurity reduction across all splits within all trees (Supplement Figure S5). These included certain forest and crop types, vegetation characteristics, topography, climate, human influence and accessibility, water availability, and recent burn history (Figure 5).
In the sensitivity analysis, seasonal difference in SAR backscatter, PDSI, aspect, distance to bamboo forest, and EVI had the highest mean and median importance values across all runs, while population density, distance to Royal Forest Department (RFD) and Department of National Parks, Wildlife, and Plant Conservation (DNP) protected areas, grass height, litter depth, and canopy height change had the lowest importance values (Figure 6). Removal of distance to hill evergreen forest, soil moisture, canopy height change, and slope increased the 2016-2023 AUC, while the removal of distance to burns 2 years prior, distance to burns 1 year prior, and canopy cover decreased the 2016-2023 AUC (Figure 7).
3.2. Fire Probability Map
The 2024 Fire Probability in Northern Thailand map (Figure 8) is available online as an interactive application in Google Earth Engine.
The overall AUC of our fire probability model is 0.841 for 2016-2023 and 0.848 for 2024, which demonstrates a reasonably high ability to discriminate between fire presence and absence [136,137,138]. The ROC curves show that as the classification threshold is gradually lowered, the true positive rate increases rapidly but the false positive rate increases more slowly (Supplement Figure S6). This indicates that the model can distinguish well between areas that have burned and have not burned using the selected predictor variables in the area and time period of interest. The accuracy of the model for the 2024 prediction can be calculated once 2024 burn scar data are made available through official channels.
4. Discussion
4.1. Evaluation of Model Results
Most fires in Thailand are anthropogenic and ignited for land management purposes in agricultural production or non-timber forest product collection [1,12,13,14,15,16,17,18]. Our 2024 fire probability map aligns well with these known patterns, indicating that the highest probability of fire is in agricultural and forested areas near human settlements, accessible to roads and at mid elevations. Empirically, our model also performed well, with an AUC of 0.841 for the 2016-2023 testing points and an AUC of 0.848 for the 2024 testing points [136,137,138].
Overall, despite two major differences in methods, our seasonal spatial patterns align with other machine learning based fire probability approaches in Thailand and SE Asia. First, while other studies used a small number of predictor variables based on theory [46,47,48,49,50,51], we began with a large number of predictor variables and iteratively removed empirically less important variables. We found that certain forest and crop types, vegetation characteristics (seasonality, health, density), topography (elevation, aspect, slope), climate (precipitation, temperature, VPD, soil moisture, drought indicators), human influence and accessibility (roads, settlements, special management designations), water availability, and recent burn history are the strongest predictors of fire probability in northern Thailand. These variables were all of near equal importance in our model (Figure 5, Supplement Figure S6), and our sensitivity analysis confirmed the decision to retain these variables (Figure 6 and Figure 7). This is in contrast with similar studies that found only a few variables of high importance, with the highest often being distance to roads and human settlements [46,47,48,49,51].
Differences in variable importance may be attributed to differences in model structure, input data quality, and variable importance metrics, complicating direct comparisons. Specifically, other studies use fewer variables with minimal multicollinearity (e.g., [46]), or different variable importance metrics (e.g., Relief-F Average Merit [48], Correlation Attribute Evaluation [49], Pearson Correlation Coefficient [47,51], or Cramer’s V Coefficient [45]). Some of our observed patterns in variable importance may also stem from the statistical properties of the Gini Index, namely its sensitivity to high numbers of variables [125], sampling bias in variables [125], multicollinearity among variables [125,128,129], and differing unique value counts across variables [123,124,128]. This may have contributed to the low importance we observed for population density, distance to protected areas, fuel characteristics, predicted fire behavior, and canopy change, along with the discrepancies between dAUCs and Gini Index rankings in our sensitivity analysis.
Further, many of these metrics, including the Gini Index, cannot capture spatial autocorrelation [130,139], which is important for many geospatial phenomena including fire. Future research should evaluate variable importance metrics in the context of fire probability mapping in Thailand in order to understand the practical implications and tradeoffs of using different metrics to build machine learning models for management applications,,,,. We also suggest incorporating forecasts for fire season weather conditions; these weather conditions influence fire behavior in real time and have a different effect than pre-fire season climate which largely influences fuel conditions. Including crop rotation and shifting cultivation as predictor variables may also improve the model; agriculture is particularly transient in nature, as different crop types are often rotated seasonally on a single plot of land and forests are frequently cleared to be cultivated or grazed for only a few years. The model can also be applied with future climate projections as the input climate predictor variables to see how different climate change scenarios will alter fire probability. An important component of this is also calculating the uncertainty associated with each set of conditions.
The second major methodological difference for our approach is that we paired annual fire occurrences with annual predictor variables in order to capture temporal variation, while other studies use cumulative fire occurrence with temporally averaged predictor conditions [46,47,48,49,50,51]. This allows us to evaluate year to year shifts following both monotonic (deforestation, climate change) and cyclical (ENSO) trends. When interannual variations in predictor conditions are aggregated for the study period, their influence on fire probability is also aggregated. Thus, cyclical patterns during the study period may be discounted. Further, with each new fire season, the model can be retrained and rerefined with the addition of the most recent fire occurrence and fire predictor data to enhance its performance.
However, this approach has important implications for both the model training data selection and calculating accuracy metrics. Considering temporal variation allowed us to draw a more representative sample for fire presence and absence. Other approaches define fire absences as locations that never burned within a multi-year study period [46,47,48,49,50,51], but our model also considers areas that may have burned in one year in the study period but not in other years as fire absences for those years in which the area did not burn (Supplement Figure S7). This allowed us to draw a more representative sample for fire absences, as there are fundamental ecological and socioeconomic differences between areas that have never burned in the study period and areas that have burned, but not during the specific year of interest. Sampling fire absences only from areas that never burned creates a biased sample that provides an extreme basis for comparison with fire presences.
The increased temporal resolution likely contributed to the slightly lower AUC compared to the ≥0.9 values reported by other random forest models [46,47,48,49,51]. Higher temporal resolution preserves cyclical variability—e.g., in climate—that would otherwise be smoothed by multi-year averages. Including areas that burned during the study period but not in a specific year better represents the fire regime in the model but slightly reduces predictive power. In contrast, other models often use a biased subset of fire absences and smooth inter-annual variability, potentially exaggerating predictor-response relationships and inflating AUCs. While most models capture only spatial variation, ours accounts for both spatial and temporal variability, introducing greater complexity and noise due to the more representative sampling and added temporal dimension. These differences suggest future work should examine how model performance varies with the selection of training and validation years to optimize prediction accuracy while minimizing data requirements (Supplement Table S4).
4.2. Feedback from Stakeholders
Stakeholders provided feedback on a preliminary version of the fire probability mapping approach at a Regional Consultation in Chiang Mai Province and National Consultation in Bangkok. The proposed methods were well received, especially by technical geospatial experts who are already familiar with the advantages of machine learning and cloud computing and are interested in expanding their departments’ use of these tools. However, many participants also recognized the organizational and technical obstacles that would need to be addressed in order to implement these methods. This would include widespread capacity building and data collection, as well as changes in organizational structure to integrate automated tools with manual methodologies.
Stakeholders also expressed the need to identify the intended uses and users of the fire probability map, from high level officials and local communities. In its current form, the map can provide a broad overview of expected fire patterns, but it should be further calibrated for community use. Community-level data should be incorporated to refine the analysis, since local communities are one of the primary actors in preventing and fighting fires [14]. Local communities would need much greater spatial and temporal precision in the map for it to be useful for on-the-ground activities, which can be achieved if such products with the desired spatial and temporal resolution are incorporated into the model in lieu of the global data sets currently used as placeholders [14].
These concerns about data quality were also reflected in the final model’s accuracy metrics. The reference data points were produced from the burn scar polygons provided by GISTDA, which were themselves generated using an automated methodology. These data are likely less accurate than data produced by manual image interpretation or field surveys. Similarly, the fuel, potential fire behavior, climate, and canopy data layers were derived from global data sets, which were generated using generalized models at the global or continental scales [105,109,110,113]. These data are likely less precise than regional or national scale data that are generated using locally calibrated and validated models.
These concerns can be addressed with improved data from local experts. The current model uses coarse, global public datasets for many predictors like climate, weather, and fuels, producing a fire probability map with lower resolution than the scale of fires in Thailand. For variables like LULC and infrastructure, only static, single-date datasets were available, which miss rapid interannual changes that may affect fire probability. Replacing them with high-resolution, historical local data would improve model performance and operational value. Some datasets, like climate and weather, are regularly produced by the government but remain hard to access, while others, like fuels and corresponding fire behavior, do not yet exist and would require extensive fieldwork and modeling to produce. We also recommend generating reference data from manually delineated burn scars to improve training and testing accuracy.
Further, developing separate fire probability models for each LULC type could reveal both broad differences between classes and finer-scale variation within them. Fire regimes, their drivers, and human management vary widely among LULC classes. Since random forest models and the Gini impurity index treat categorical and continuous variables differently, including LULC alongside continuous predictors complicates the interpretation of variable importance. Therefore, building and comparing separate models for key LULC types, such as specific crops or forest types, is advisable.
Finally, local users would benefit from higher temporal resolution in fire probability maps. Shifting from seasonal to daily, weekly, or monthly predictions would improve prevention, mitigation, and response during fire season. Weather, a key driver of fire behavior, changes frequently across these timescales. More frequent predictions are possible if matching temporal data are available for key variables. This includes date-labeled fire occurrences and short-term weather forecasts aligned with the desired prediction intervals.
5. Conclusions
We developed an annual random forest machine learning model approach to mapping fire probability in northern Thailand that produces a straightforward fire probability metric. The model yielded a high AUC of 0.841 for 2016-2023 and 0.848 for 2024, and indicated the highest probability of fire is in easily accessed agricultural and forested areas adjacent to human settlements. Variables with high predictive power in the model included certain forest and crop types, vegetation characteristics, topography, climate, human influence and accessibility, water availability, and recent burn history. The model aligns with both previous maps of fire probability and known mechanistic drivers of fire in Thailand.
Key process improvements include automated variable selection, disaggregated historical data, and representative sample design. Empirically selecting the most influential fire predictor variables from a comprehensive set of predictor variables, rather than pre-selecting variables, allows flexibility and opportunities for localization. Due to the modularity and automation employed by the model, it can also be modified using higher quality local data in lieu of global datasets for localization. It can also be adapted to data scarce regions, using fewer years of fire occurrences or predictor variables until more data can be made available. Disaggregating historical data to account for year to year variability in fire predictors allows the model to be sensitive to cyclical variables. This allowed us to use a more representative sample for fire absences, including areas that did not burn in a given year rather than only areas that never burned.
With machine learning and other forms of artificial intelligence becoming standard tools in the field of fire probability mapping worldwide [140,141,142,143,144]. Thailand should leverage these tools for their own fire management activities. Our approach provides the groundwork for an easy to implement approach that predicts fire probability annually and can be adapted based on locally available data.
Supplementary Materials
The following supporting information can be downloaded at: Preprints.org; Figure S1, Figure S2, Figure S3, Figure S4, Figure S5, Figure S6, Figure S7, Figure S8, Table S1, Table S2, Table S3, Table S4.
Author Contributions
Conceptualization: Conceptualization, Enikoe Bihari, Karen Dyson, Kayla Johnston, Daniel dela Torre, Akkarapon Chaiyana, Karis Tenneson, Wasana Sittirin , Ate Poortinga, Veerachai Tanpipat, Kobsak Wanthongchai, Thannarot Kunlamai, Marina Tornorsam , David Ganz and David Saah; Data curation, Enikoe Bihari, Kayla Johnston, Akkarapon Chaiyana, Wasana Sittirin , Thannarot Kunlamai and Chanarun Saisaward ; Formal analysis, Enikoe Bihari, Kayla Johnston and Akkarapon Chaiyana; Funding acquisition, Daniel dela Torre, Karis Tenneson, Ate Poortinga, David Ganz and David Saah; Investigation, Enikoe Bihari, Kayla Johnston, Daniel dela Torre, Akkarapon Chaiyana, Wasana Sittirin , Veerachai Tanpipat, Kobsak Wanthongchai and David Ganz; Methodology, Enikoe Bihari, Karen Dyson, Kayla Johnston, Daniel dela Torre, Akkarapon Chaiyana, Karis Tenneson, Ate Poortinga, Veerachai Tanpipat, Kobsak Wanthongchai and Thannarot Kunlamai; Project administration, Karen Dyson, Daniel dela Torre, Karis Tenneson, Wasana Sittirin , Ate Poortinga, Chanarun Saisaward and David Ganz; Resources, Kayla Johnston, Daniel dela Torre, Karis Tenneson, Veerachai Tanpipat, Kobsak Wanthongchai, Marina Tornorsam , David Ganz and David Saah; Software, Enikoe Bihari, Kayla Johnston, Akkarapon Chaiyana, Thannarot Kunlamai and Elijah Dalton; Supervision, Karen Dyson, Daniel dela Torre, Karis Tenneson, Ate Poortinga, David Ganz and David Saah; Validation, Enikoe Bihari, Akkarapon Chaiyana and Elijah Dalton; Visualization, Enikoe Bihari and Karen Dyson; Writing – original draft, Enikoe Bihari and Karen Dyson; Writing – review & editing, Enikoe Bihari, Karen Dyson, Kayla Johnston, Daniel dela Torre, Akkarapon Chaiyana, Karis Tenneson, Wasana Sittirin , Ate Poortinga, Veerachai Tanpipat, Kobsak Wanthongchai, Thannarot Kunlamai, Elijah Dalton, Chanarun Saisaward , Marina Tornorsam , David Ganz and David Saah. All authors have read and agreed to the published version of the manuscript.
Funding
This research was funded by the World Bank contract number 7208429, solicitation number ECC1284335, “Technical Assistance to Improve Knowledge and Innovative Policy for Wildfire Reduction in Northern Thailand Activity I: Wildfire Risk Map and Management Information System.”
Data Availability Statement
The original data presented in the study are openly available as a GitHub repository accessible at: https://github.com/enikoebihari/ThailandFireProbability & https://doi.org/10.5281/zenodo.15935272.
Acknowledgments
The authors gratefully acknowledge the support of the World Bank for funding the project titled “Technical Assistance to Improve Knowledge and Innovative Policy for Wildfire Reduction in Northern Thailand”, which provided the foundation for this research. We would also like to thank the Thailand Department of National Parks, Wildlife, and Plant Conservation (DNP) and the Regional Community Forestry Training Centre for Asia and the Pacific (RECOFTC) for their close collaboration and data sharing throughout the project. Additional thanks to the Geo-Informatics and Space Technology Development Agency (GISTDA) for providing data, as well as all project stakeholders from local communities, non profit organizations, and government agencies for their feedback and technical guidance. Note that input from interviews and consultations with individual government officials, field personnel, academic faculty, and community leaders has been deliberately anonymized.
Conflicts of Interest
The authors declare no conflicts of interest.
References
- Summary Report on Forest Fire and Haze Situation in 2023 Using Space and Geospatial Technology - รายงานสรุปสถานการณ์ไฟป่าและหมอกควัน ปี พ.ศ. 2566 โดยใช้เทคโนโลยีอวกาศและภูมิสารสนเทศ สำนักงานพัฒนาเทคโนโลยีอวกาศและภูมิสารสนเทศ (องค์การมหาชน) 2023.
- Ku, A. Fire-Climate Relationships in Continental Southeast Asia. MS in Geography, University of British Columbia, Vancouver, 2023.
- Chaiyo, U.; Pizzo, Y.; Garivait, S. Estimation of Carbon Released from Dry Dipterocarp Forest Fires in Thailand. International Journal of Environmental Sciences 2013, 7, 522–525.
- Thailand Deforestation Rates & Statistics. Available online: https://www.globalforestwatch.org/dashboards/country/THA?category=fires (accessed on 30 December 2024).
- Layer Information: VIIRS (Suomi NPP, NOAA-20 and NOAA-21) Fires and Thermal Anomalies (Day | Night, 375m). Available online: https://firms.modaps.eosdis.nasa.gov/descriptions/FIRMS_VIIRS_Firehotspots.html (accessed on 8 January 2025).
- Chart-asa, C. Spatial-Temporal Patterns of MODIS Active Fire/Hotspots in Chiang Rai, Upper Northern Thailand and the Greater Mekong Subregion Countries During 2003-2015. App. Envi. Res. 2021, 43, 121–131. [CrossRef]
- Pungkhom, P.; Jinsart, W. Health Risk Assessment from Bush Fire Air Pollutants Using Statistical Analysis and Geographic Information System: A Case Study in Northern Thailand. International Journal of Geoinformatics 2014, 10. [CrossRef]
- Sirimongkonlertkun, N. Smoke Haze Problem and Open Burning Behavior of Local People in Chiang Rai Province. Environment and Natural Resources Journal 2014, 12, 29–34.
- Tang, J.; Weeramongkolkul, M.; Suwankesawong, S.; Saengtabtim, K.; Leelawat, N.; Wongwailikhit, K. Toward a More Resilient Thailand: Developing a Machine Learning-Powered Forest Fire Warning System. Heliyon 2024, 10. [CrossRef]
- Analysis of Fire Risk Areas in Conservation Forests - การวิเคราะห์พื้นที่เสี่ยงต่อการเกิดไฟป่าในพื้นที่ป่าอนุรักษ์.
- Pardthaisong, L.; Sin-ampol, P.; Suwanprasit, C.; Charoenpanyanet, A. Haze Pollution in Chiang Mai, Thailand: A Road to Resilience. Procedia Engineering 2018, 212, 85–92. [CrossRef]
- Baker, P.J.; Bunyavejchewin, S. Fire Behavior and Fire Effects across the Forest Landscape of Continental Southeast Asia. In Tropical Fire Ecology; Springer Berlin Heidelberg: Berlin, Heidelberg, 2009; pp. 311–334 ISBN 978-3-540-77380-1.
- Phairuang, W.; Hata, M.; Furuuchi, M. Influence of Agricultural Activities, Forest Fires and Agro-Industries on Air Quality in Thailand. Journal of Environmental Sciences 2017, 52, 85–97. [CrossRef]
- Feedback and input from government officials, firefighters, NGO personnel, academic faculty, and community leaders during interviews, consultation workshops, and webinars in Thailand 2024.
- Tiyapairat, Y.; Sajor, E.E. State Simplification, Heterogeneous Causes of Vegetation Fires and Implications on Local Haze Management: Case Study in Thailand. Environ Dev Sustain 2012, 14, 1047–1064. [CrossRef]
- Makarabhirom, P.; Ganz, D.; Onprom, S. Community Involvement in Fire Management : Cases and Recommendations for Community-Based Fire Management in Thailand. In Proceedings of the Communities in flames; 2004.
- Smith, R.W.; Shields, B.J.; Ganz, D. Global Forest Resources Assessment 2005 – Report on Fires in the South East Asian (ASEAN) Region. In Proceedings of the Fire Management Working Paper 10; Forestry Department, Food and Agriculture Organization of the United Nations: Rome, Italy, March 2006.
- Prapatigul, P.; Sreshthaputra, S. Causes and Solution of Forest and Agricultural Burning in Northern, Thailand. International Journal of Agricultural Technology 2022, 18, 1715–1726.
- Kennedy, K.H.; Maxwell, J.F.; Lumyong, S. Fire and the Production of Astraeus Odoratus (Basidiomycetes) Sporocarps in Deciduous Dipterocarp-Oak Forests of Northern Thailand. Maejo International Journal of Science and Technology 2012, 6, 483–504.
- Kim Oanh, N.T.; Permadi, D.A.; Dong, N.P.; Nguyet, D.A. Emission of Toxic Air Pollutants and Greenhouse Gases from Crop Residue Open Burning in Southeast Asia. In Land-Atmospheric Research Applications in South and Southeast Asia; Vadrevu, K.P., Ohara, T., Justice, C., Eds.; Springer International Publishing: Cham, 2018; pp. 47–66 ISBN 978-3-319-67474-2.
- Sirithian, D.; Thepanondh, S.; Sattler, M.L.; Laowagul, W. Emissions of Volatile Organic Compounds from Maize Residue Open Burning in the Northern Region of Thailand. Atmospheric Environment 2018, 176, 179–187. [CrossRef]
- Kumar, I.; Bandaru, V.; Yampracha, S.; Sun, L.; Fungtammasan, B. Limiting Rice and Sugarcane Residue Burning in Thailand: Current Status, Challenges and Strategies. Journal of Environmental Management 2020, 276, 111228. [CrossRef]
- Fisher, R.; Hirsch, P. Poverty and Agrarian-Forest Interactions in Thailand. Geographical Research 2008, 46, 74–84. [CrossRef]
- Tanpipat, V.; Manomaiphiboon, K.; Field, R.D.; deGroot, W.J.; Nhuchaiya, P.; Jaroonrattanapak, N.; Buaniam, C.; Yodcum, J. An Operational Fire Danger Rating System for Thailand and Lower Mekong Region: Development, Utilization, and Experiences. In Vegetation Fires and Pollution in Asia; Vadrevu, K.P., Ohara, T., Justice, C., Eds.; Springer International Publishing: Cham, 2023; pp. 575–588 ISBN 978-3-031-29916-2.
- Ratnam, J.; Tomlinson, K.W.; Rasquinha, D.N.; Sankaran, M. Savannahs of Asia: Antiquity, Biogeography, and an Uncertain Future. Philosophical Transactions of the Royal Society B: Biological Sciences 2016, 371, 20150305. [CrossRef]
- Stott, P. Stability and Stress in the Savanna Forests of Mainland South-East Asia. Journal of Biogeography 1990, 17, 373–383. [CrossRef]
- Eiadthong, W. Endemic and rare plants in dry deciduous dipterocarp forest in Thailand. In Proceedings of the Proceedings of the FORTROP II: Tropical forestry change in a changing world; Kasetsart University, Bangkok (Thailand). Faculty of Forestry, November 2008; pp. 133–142.
- Stott, P. The Savanna Forests of Mainland Southeast Asia: An Ecological Survey. Progress in Physical Geography: Earth and Environment 1984, 8, 315–335. [CrossRef]
- Baker, P.J.; Bunyavejchewin, S.; Oliver, C.D.; Ashton, P.S. Disturbance History and Historical Stand Dynamics of a Seasonal Tropical Forest in Western Thailand. Ecological Monographs 2005, 75, 317–343. [CrossRef]
- Rundel, P.; Boonpragob, K. Dry Forest Ecosystems of Thailand. In Seasonally Dry Tropical Forests; Cambridge University Press, 1995; pp. 93–123 ISBN 978-0-521-43514-7.
- Laurance, W.F. Slow Burn: The Insidious Effects of Surface Fires on Tropical Forests. Trends in Ecology & Evolution 2003, 18, 209–212. [CrossRef]
- Fuller, D.O.; Murphy, K. The Enso-Fire Dynamic in Insular Southeast Asia. Climatic Change 2006, 74, 435–455. [CrossRef]
- Hussain, M.J.; Doane, D.L. Socio-Ecological Determinants of Land Degradation and Rural Poverty in Northeast Thailand. Environmental Conservation 1995, 22, 44–50. [CrossRef]
- Haenssgen, M.J.; Leepreecha, P.; Sakboon, M.; Chu, T.-W.; Vlaev, I.; Auclair, E. The Impact of Conservation and Land Use Transitions on the Livelihoods of Indigenous Peoples: A Narrative Review of the Northern Thai Highlands. Forest Policy and Economics 2023, 157, 103092. [CrossRef]
- USDA Forest Service Understand Risk. Available online: https://wildfirerisk.org/understand-risk/ (accessed on 10 September 2024).
- Scott, J.H.; Thompson, M.P.; Calkin, D.E. A Wildfire Risk Assessment Framework for Land and Resource Management; U.S. Department of Agriculture, Forest Service, Rocky Mountain Research Station: Ft. Collins, CO, 2013;
- About Quantitative Wildfire Risk Assessment (QWRA). Available online: https://iftdss.firenet.gov/firenetHelp/help/pageHelp/content/30-tasks/qwra/qwraabout.htm (accessed on 8 January 2025).
- Guide to Using Geospatial Data for Monitoring Wildfires and Haze Monitoring - คู่มือการใช้ข้อมูลภูมิสารสนเทศ เพื่อการติดตามไฟป่าและหมอกควัน 2015.
- Nuthammachot, N.; Stratoulias, D. A GIS- and AHP-Based Approach to Map Fire Risk: A Case Study of Kuan Kreng Peat Swamp Forest, Thailand. Geocarto International 2019, 36, 212–225. [CrossRef]
- Nuthammachot, N.; Stratoulias, D. Multi-Criteria Decision Analysis for Forest Fire Risk Assessment by Coupling AHP and GIS: Method and Case Study. Environ Dev Sustain 2021, 23, 17443–17458. [CrossRef]
- Thaewthatum, S.; Moolchan, T.; Chaweewong, Y. Forest Fire Risk Forecasting in the Upper North Region of Thailand 2017.
- Burapapol, K.; Nagasawa, R. Assessment of Wildfire Risk at Recreational Sites in Sri Lanna National Park, Chiang Mai, Northern Thailand, Using Remote Sensing and GIS Techniques. International Journal of Geoinformatics 2017, 13.
- Van Hoang, T.; Chou, T.Y.; Fang, Y.M.; Nguyen, N.T.; Nguyen, Q.H.; Xuan Canh, P.; Ngo Bao Toan, D.; Nguyen, X.L.; Meadows, M.E. Mapping Forest Fire Risk and Development of Early Warning System for NW Vietnam Using AHP and MCA/GIS Methods. Applied Sciences 2020, 10, 4348. [CrossRef]
- Pradhan, B.; Dini Hairi Bin Suliman, M.; Arshad Bin Awang, M. Forest Fire Susceptibility and Risk Mapping Using Remote Sensing and Geographical Information Systems (GIS). Disaster Prevention and Management: An International Journal 2007, 16, 344–352. [CrossRef]
- Ahmad, F.; Uddin, M.M.; Goparaju, L. Fire Risk Assessment along the Climate, Vegetation Type Variability over the Part of Asian Region: A Geospatial Approach. Model. Earth Syst. Environ. 2018, 5, 41–57. [CrossRef]
- He, Q.; Jiang, Z.; Wang, M.; Liu, K. Landslide and Wildfire Susceptibility Assessment in Southeast Asia Using Ensemble Machine Learning Methods. Remote Sensing 2021, 13, 1572. [CrossRef]
- Tien Bui, D.; Bui, Q.-T.; Nguyen, Q.-P.; Pradhan, B.; Nampak, H.; Trinh, P.T. A Hybrid Artificial Intelligence Approach Using GIS-Based Neural-Fuzzy Inference System and Particle Swarm Optimization for Forest Fire Susceptibility Modeling at a Tropical Area. Agricultural and Forest Meteorology 2017, 233, 32–44. [CrossRef]
- Pham, B.T.; Jaafari, A.; Avand, M.; Al-Ansari, N.; Dinh Du, T.; Yen, H.P.H.; Phong, T.V.; Nguyen, D.H.; Le, H.V.; Mafi-Gholami, D.; et al. Performance Evaluation of Machine Learning Methods for Forest Fire Modeling and Prediction. Symmetry 2020, 12, 1022. [CrossRef]
- Tuyen, T.T.; Jaafari, A.; Yen, H.P.H.; Nguyen-Thoi, T.; Phong, T.V.; Nguyen, H.D.; Van Le, H.; Phuong, T.T.M.; Nguyen, S.H.; Prakash, I.; et al. Mapping Forest Fire Susceptibility Using Spatially Explicit Ensemble Models Based on the Locally Weighted Learning Algorithm. Ecological Informatics 2021, 63, 101292. [CrossRef]
- Phoompanich, S.; Barr, S.; Gaulton, R. Development of Geospatial Techniques for Natural Hazard Risk Assessment in Thailand. The International Archives of the Photogrammetry, Remote Sensing and Spatial Information Sciences 2019, XLII-3-W8, 315–322. [CrossRef]
- Tien Bui, D.; Le, K.-T.T.; Nguyen, V.C.; Le, H.D.; Revhaug, I. Tropical Forest Fire Susceptibility Mapping at the Cat Ba National Park Area, Hai Phong City, Vietnam, Using GIS-Based Kernel Logistic Regression. Remote Sensing 2016, 8, 347. [CrossRef]
- Adem Esmail, B.; Geneletti, D. Multi-Criteria Decision Analysis for Nature Conservation: A Review of 20 Years of Applications. Methods in Ecology and Evolution 2018, 9, 42–53. [CrossRef]
- Ferreira, Z.; Almeida, B.; Costa, A.C.; Do Couto Fernandes, M.; Cabral, P. Insights into Landslide Susceptibility: A Comparative Evaluation of Multi-Criteria Analysis and Machine Learning Techniques. Geomatics, Natural Hazards and Risk 2025, 16, 2471019. [CrossRef]
- Khuc, T.D.; Truong, X.Q.; Tran, V.A.; Bui, D.Q.; Bui, D.P.; Ha, H.; Tran, T.H.M.; Pham, T.T.T.; Yordanov, V. Comparison of Multi-Criteria Decision Making, Statistics, and Machine Learning Models for Landslide Susceptibility Mapping in Van Yen District, Yen Bai Province, Vietnam. International Journal of Geoinformatics 2023, 19, 33–45. [CrossRef]
- Uthappa, A.R.; Das, B.; Raizada, A.; Kumar, P.; Jha, P.; Prasad, P.V.V. Forest Fire Susceptibility Mapping Using Multi-Criteria Decision Making and Machine Learning Models in the Western Ghats of India. Journal of Environmental Management 2025, 379, 124777. [CrossRef]
- Zhao, L.Q.; van Duynhoven, A.; Dragićević, S. Machine Learning for Criteria Weighting in GIS-Based Multi-Criteria Evaluation: A Case Study of Urban Suitability Analysis. Land 2024, 13, 1288. [CrossRef]
- Khalil, U.; Imtiaz, I.; Aslam, B.; Ullah, I.; Tariq, A.; Qin, S. Comparative Analysis of Machine Learning and Multi-Criteria Decision Making Techniques for Landslide Susceptibility Mapping of Muzaffarabad District. Front. Environ. Sci. 2022, 10. [CrossRef]
- Breiman, L. Random Forests. Machine Learning 2001, 45, 5–32. [CrossRef]
- Hastie, T.; Friedman, J.; Tibshirani, R. The Elements of Statistical Learning; Springer Series in Statistics; Springer: New York, NY, 2001; ISBN 978-1-4899-0519-2.
- NASA-FIRMS. Available online: https://firms.modaps.eosdis.nasa.gov/map/ (accessed on 17 January 2025).
- Copernicus Global Land Cover Layers: CGLS-LC100 Collection 3 2020.
- Copernicus DEM GLO-30: Global 30m Digital Elevation Model. Available online: https://developers.google.com/earth-engine/datasets/catalog/COPERNICUS_DEM_GLO30 (accessed on 16 August 2024).
- Dinerstein, E.; Olson, D.; Joshi, A.; Vynne, C.; Burgess, N.D.; Wikramanayake, E.; Hahn, N.; Palminteri, S.; Hedao, P.; Noss, R.; et al. An Ecoregion-Based Approach to Protecting Half the Terrestrial Realm. BioScience 2017, 67, 534–545. [CrossRef]
- Kaewthongrach, R.; Diem, P.; Chidthaisong, A.; Sanwangsri, M.; Hanpattanakit, P.; Varnkovida, P.; Suepa, T. Detecting the El Niño’s Induced Changes in Phenology of a Secondary Dry Dipterocarp Forest by Using Remote Sensing.; Tambon Thung Sukala, Thailand, February 1 2018.
- Kieu Diem, P. Responses of Tropical Deciduous Forest Phenology to Climate Variation in Northern Thailand.; Penang, Malaysia, August 25 2017.
- Kieu Diem, P.; Chidthaisong, A.; Varnakovida, P.; Kaewthongrach, R.; Sanwangsri, M. Estimating the Gross Primary Production of Secondary Dry Dipterocarp Forest Using Vegetation Photosynthesis Model. In Proceedings of the Technology & Innovation for Global Energy Revolution; Bangkok, Thailand, November 30 2018.
- Bunyavejchewin, S.; Baker, P.; Davies, S.J. Seasonally Dry Tropical Forest in Continental Southeast Asia Structure, Composition, and Dynamics. The Ecology and Conservation of Seasonally Dry Forest in Asia 2011, 9–35.
- Muñoz Sabater, J. ERA5-Land Monthly Aggregated - ECMWF Climate Reanalysis 2019.
- Caruana, R.; Niculescu-Mizil, A. An Empirical Comparison of Supervised Learning Algorithms. In Proceedings of the Proceedings of the 23rd international conference on Machine learning; Association for Computing Machinery: New York, NY, USA, June 25 2006; pp. 161–168.
- Auret, L.; Aldrich, C. Interpretation of Nonlinear Relationships between Process Variables by Use of Random Forests. Minerals Engineering 2012, 35, 27–42. [CrossRef]
- Malhotra, S.; Karanicolas, J. A Numerical Transform of Random Forest Regressors Corrects Systematically-Biased Predictions 2020.
- Barreñada, L.; Dhiman, P.; Timmerman, D.; Boulesteix, A.-L.; Calster, B.V. Understanding Overfitting in Random Forest for Probability Estimation: A Visualization and Simulation Study. Diagn Progn Res 2024, 8, 14. [CrossRef]
- Farrell, A.; Wang, G.; Rush, S.A.; Martin, J.A.; Belant, J.L.; Butler, A.B.; Godwin, D. Machine Learning of Large-Scale Spatial Distributions of Wild Turkeys with High-Dimensional Environmental Data. Ecology and Evolution 2019, 9, 5938–5949. [CrossRef]
- Kaveh, N.; Ebrahimi, A.; Asadi, E. Comparative Analysis of Random Forest, Exploratory Regression, and Structural Equation Modeling for Screening Key Environmental Variables in Evaluating Rangeland above-Ground Biomass. Ecological Informatics 2023, 77, 102251. [CrossRef]
- Oshiro, T.M.; Perez, P.S.; Baranauskas, J.A. How Many Trees in a Random Forest? In Proceedings of the Machine Learning and Data Mining in Pattern Recognition; Perner, P., Ed.; Springer: Berlin, Heidelberg, 2012; pp. 154–168.
- Mahamart, P. Burned Area บาดแผลจากเปลวเพลิง Available online: https://gistda.or.th/news_view.php?n_id=5655&language=EN (accessed on 16 October 2024).
- Oliva, P.; Schroeder, W. Assessment of VIIRS 375 m Active Fire Detection Product for Direct Burned Area Mapping. Remote Sensing of Environment 2015, 160, 144–155. [CrossRef]
- Layer Information: MODIS (Aqua & Terra) Fire and Thermal Anomalies (Day | Night, 1km). Available online: https://firms.modaps.eosdis.nasa.gov/descriptions/FIRMS_MODIS_Firehotspots.html (accessed on 8 January 2025).
- FIRMS: How Often Are the Active Fire Data Acquired? NASA Earthdata Forum 2024.
- How Often Is FIRMS Updated? NASA Earthdata Forum 2024.
- Tanpipat, V.; Honda, K.; Nuchaiya, P. MODIS Hotspot Validation over Thailand. Remote Sensing 2009, 1, 1043–1054. [CrossRef]
- Schroeder, W.; Oliva, P.; Giglio, L.; Csiszar, I.A. The New VIIRS 375 m Active Fire Detection Data Product: Algorithm Description and Initial Assessment. Remote Sensing of Environment 2014, 143, 85–96. [CrossRef]
- Input from Academic Faculty in Thailand 2025.
- Peduzzi, P.; Concato, J.; Kemper, E.; Holford, T.R.; Feinstein, A.R. A Simulation Study of the Number of Events per Variable in Logistic Regression Analysis. J Clin Epidemiol 1996, 49, 1373–1379. [CrossRef]
- Luan, J.; Zhang, C.; Xu, B.; Xue, Y.; Ren, Y. The Predictive Performances of Random Forest Models with Limited Sample Size and Different Species Traits. Fisheries Research 2020, 227, 105534. [CrossRef]
- Millard, K.; Richardson, M. On the Importance of Training Data Sample Selection in Random Forest Image Classification: A Case Study in Peatland Ecosystem Mapping. Remote Sensing 2015, 7, 8489–8515. [CrossRef]
- Joseph, V.R. Optimal Ratio for Data Splitting. Statistical Analysis and Data Mining: The ASA Data Science Journal 2022, 15, 531–538. [CrossRef]
- Linn, R.; Winterkamp, J.; Edminster, C.; Colman, J.J.; Smith, W.S. Coupled Influences of Topography and Wind on Wildland Fire Behaviour. Int. J. Wildland Fire 2007, 16, 183–195. [CrossRef]
- Junpen, A.; Garivait, S.; Bonnet, S.; Pongpullponsak, A. Fire Spread Prediction for Deciduous Forest Fires in Northern Thailand. ScienceAsia 2013, 39, 535. [CrossRef]
- Stott, P.A.; Goldammer, J.G.; Werner, W.L. The Role of Fire in the Tropical Lowland Deciduous Forests of Asia. In Fire in the Tropical Biota; Goldammer, J.G., Ed.; Ecological Studies; Springer Berlin Heidelberg: Berlin, Heidelberg, 1990; Vol. 84, pp. 32–44 ISBN 978-3-642-75397-8.
- Rothermel, R.C. A Mathematical Model for Predicting Fire Spread in Wildland Fuels. Res. Pap. INT-115. Ogden, UT: U.S. Department of Agriculture, Intermountain Forest and Range Experiment Station. 40 p. 1972, 115.
- Stott, P. The Spatial Pattern of Dry Season Fires in the Savanna Forests of Thailand. Journal of Biogeography 1986, 13, 345–358. [CrossRef]
- Byram, G.M. Combustion of Forest Fuels. In “Forest Fire: Control and Use”. (Ed. KP Davis). In Forest Fire Control and Use; McGraw-Hill: New York City, NY, 1959; pp. 61–89.
- Burapapol, K.; Nagasawa, R. Mapping Soil Moisture as an Indicator of Wildfire Risk Using Landsat 8 Images in Sri Lanna National Park, Northern Thailand. JAS 2016, 8, 107. [CrossRef]
- Finney, M.A. Mechanistic Modeling of Landscape Fire Patterns. In Spatial Modeling of Forest Landscape Change: Approaches and Applications; Cambridge University Press, 1999.
- Fukushima, M.; Kanzaki, M.; Hara, M.; Ohkubo, T.; Preechapanya, P.; Choocharoen, C. Secondary Forest Succession after the Cessation of Swidden Cultivation in the Montane Forest Area in Northern Thailand. Forest Ecology and Management - FOREST ECOL MANAGE 2008, 255, 1994–2006. [CrossRef]
- Schmidt-Vogt, D. Secondary Forests in Swidden Agriculture in the Highlands of Thailand. Journal of Tropical Forest Science 2001, 13, 748–767.
- Vadrevu, K.P.; Lasko, K.; Giglio, L.; Schroeder, W.; Biswas, S.; Justice, C. Trends in Vegetation Fires in South and Southeast Asian Countries. Sci Rep 2019, 9, 7422. [CrossRef]
- Talukdar, N.R.; Ahmad, F.; Goparaju, L.; Choudhury, P.; Qayum, A.; Rizvi, J. Forest Fire in Thailand: Spatio-Temporal Distribution and Future Risk Assessment. Natural Hazards Research 2024, 4, 87–96. [CrossRef]
- Hartung, M.; Carreño-Rocabado, G.; Peña-Claros, M.; van der Sande, M.T. Tropical Dry Forest Resilience to Fire Depends on Fire Frequency and Climate. Front. For. Glob. Change 2021, 4. [CrossRef]
- Scott, J.H. Introduction to Fire Behavior Modeling 2012.
- Nelson, R.M. A Model of Diurnal Moisture Change in Dead Forest Fuels.; Society of American Foresters: Bethesda, MD, 1991; pp. 109–116.
- Beck, J.A.; Alexander, M.E.; Harvey, S.D.; Beaver, A.K. Forecasting Diurnal Variation in Fire Intensity for Use in Wildland Fire Management Applications.; 2001.
- Saxena, S.; Dubey, R.R.; Yaghoobian, N. A Planning Model for Predicting Ignition Potential of Complex Fuels in Diurnally Variable Environments. Fire Technol 2023, 59, 2787–2827. [CrossRef]
- Pettinari, M.L.; Chuvieco, E. Generation of a Global Fuel Data Set Using the Fuel Characteristic Classification System. Biogeosciences 2016, 13, 2061–2076. [CrossRef]
- Pettinari, M.L.; Chuvieco, E. Global Fuelbed Dataset. Department of Geology, Geography and Environment, University of Alcala, Spain 2015.
- Prichard, S.J.; Sandberg, D.V.; Ottmar, R.D.; Eberhardt, E.; Andreu, A.; Eagle, P.; Swedin, K. Fuel Characteristic Classification System Version 3.0: Technical Documentation. Gen. Tech. Rep. PNW-GTR-887. Portland, OR: U.S. Department of Agriculture, Forest Service, Pacific Northwest Research Station. 79 p. 2013, 887. [CrossRef]
- Prichard, S.J.; Andreu, A.G.; Ottmar, R.D.; Eberhardt, E. Fuel Characteristic Classification System (FCCS) Field Sampling and Fuelbed Development Guide; U.S. Department of Agriculture, Forest Service, Pacific Northwest Research Station: Portland, OR, 2019;
- Hansen, M.C.; Potapov, P.V.; Moore, R.; Hancher, M.; Turubanova, S.A.; Tyukavina, A.; Thau, D.; Stehman, S.V.; Goetz, S.J.; Loveland, T.R.; et al. High-Resolution Global Maps of 21st-Century Forest Cover Change. Science 2013, 342, 850–853. [CrossRef]
- Potapov, P.; Li, X.; Hernandez-Serna, A.; Tyukavina, A.; Hansen, M.C.; Kommareddy, A.; Pickens, A.; Turubanova, S.; Tang, H.; Silva, C.E.; et al. Mapping Global Forest Canopy Height through Integration of GEDI and Landsat Data. Remote Sensing of Environment 2021, 253, 112165. [CrossRef]
- USGS Landsat 8 Level 2, Collection 2, Tier 1. Available online: https://developers.google.com/earth-engine/datasets/catalog/LANDSAT_LC08_C02_T1_L2 (accessed on 16 August 2024).
- PALSAR-2 ScanSAR Level 2.2. Available online: https://developers.google.com/earth-engine/datasets/catalog/JAXA_ALOS_PALSAR-2_Level2_2_ScanSAR (accessed on 17 August 2024).
- Abatzoglou, J.T.; Dobrowski, S.Z.; Parks, S.A.; Hegewisch, K.C. TerraClimate, a High-Resolution Global Dataset of Monthly Climate and Climatic Water Balance from 1958–2015. Sci Data 2018, 5, 170191. [CrossRef]
- TerraClimate: Monthly Climate and Climatic Water Balance for Global Terrestrial Surfaces. Available online: https://developers.google.com/earth-engine/datasets/catalog/IDAHO_EPSCOR_TERRACLIMATE (accessed on 15 July 2025).
- Geospatial-Informatics and Space Technology Development Agency (GISTDA) Thailand Roads. Available online: https://data.humdata.org/dataset/thailand-roads? (accessed on 24 October 2024).
- World Settlement Footprint 2015. Available online: https://developers.google.com/earth-engine/datasets/catalog/DLR_WSF_WSF2015_v1 (accessed on 17 August 2024).
- Marconcini, M.; Metz-Marconcini, A.; Üreyen, S.; Palacios-Lopez, D.; Hanke, W.; Bachofer, F.; Zeidler, J.; Esch, T.; Gorelick, N.; Kakarla, A.; et al. Outlining Where Humans Live, the World Settlement Footprint 2015. Sci Data 2020, 7, 242. [CrossRef]
- Royal Forest Department KTC Area. Available online: https://www.forest.go.th/land/ข้อมูลการอนุญาต-คทช/ (accessed on 24 October 2024).
- Royal Forest Department National Forest. Available online: https://data.forest.go.th/dataset/reserve_forest (accessed on 24 October 2024).
- Department of National Parks, Wildlife, and Plant Conservation Office of Conservation Area Management Boundaries. Available online: http://www2.dnp.go.th/gis/Blog%20Posts/%E0%B8%94%E0%B8%B2%E0%B8%A7%E0%B8%99%E0%B9%82%E0%B8%AB%E0%B8%A5%E0%B8%94-%E0%B8%95%E0%B8%B2%E0%B8%A3%E0%B8%B2%E0%B8%87-%E0%B9%81%E0%B8%A5%E0%B8%B0-shp.html (accessed on 24 October 2024).
- GHSL: Global Population Surfaces 1975-2030. Available online: https://developers.google.com/earth-engine/datasets/catalog/JRC_GHSL_P2023A_GHS_POP (accessed on 17 August 2024).
- GHSL Data Package 2023; European Commission, Ed.; Publications Office of the European Union: Luxembourg, 2023; ISBN 978-92-68-19156-9.
- Sandri, M.; Zuccolotto, P. A Bias Correction Algorithm for the Gini Variable Importance Measure in Classification Trees. Journal of Computational and Graphical Statistics 2008, 17, 611–628. [CrossRef]
- Strobl, C.; Boulesteix, A.-L.; Zeileis, A.; Hothorn, T. Bias in Random Forest Variable Importance Measures: Illustrations, Sources and a Solution. BMC Bioinformatics 2007, 8, 25. [CrossRef]
- Bradter, U.; Altringham, J.D.; Kunin, W.E.; Thom, T.J.; O’Connell, J.; Benton, T.G. Variable Ranking and Selection with Random Forest for Unbalanced Data. Environmental Data Science 2022, 1, e30. [CrossRef]
- Craney, T.A.; Surles, J.G. Model-Dependent Variance Inflation Factor Cutoff Values. Quality Engineering 2002, 14, 391–403. [CrossRef]
- O’brien, R.M. A Caution Regarding Rules of Thumb for Variance Inflation Factors. Qual Quant 2007, 41, 673–690. [CrossRef]
- Strobl, C.; Boulesteix, A.-L.; Kneib, T.; Augustin, T.; Zeileis, A. Conditional Variable Importance for Random Forests. BMC Bioinformatics 2008, 9, 307. [CrossRef]
- Gregorutti, B.; Michel, B.; Saint-Pierre, P. Correlation and Variable Importance in Random Forests. Stat Comput 2017, 27, 659–678. [CrossRef]
- Karabiber, F. Gini Impurity. LearnDataSci.
- Li, H. smileRandomForest Source Code 2021.
- Ferreira, I.J.M.; Campanharo, W.A.; Barbosa, M.L.F.; Silva, S.S. da; Selaya, G.; Aragão, L.E.O.C.; Anderson, L.O. Assessment of Fire Hazard in Southwestern Amazon. Front. For. Glob. Change 2023, 6. [CrossRef]
- Shabani, F.; Kumar, L.; Ahmadi, M. Assessing Accuracy Methods of Species Distribution Models: AUC, Specificity, Sensitivity and the True Skill Statistic. Acta Scientiarum Human and Social Sciences 2018.
- Peterson, A.T.; Papeş, M.; Soberón, J. Rethinking Receiver Operating Characteristic Analysis Applications in Ecological Niche Modeling. Ecological Modelling 2008, 213, 63–72. [CrossRef]
- Lobo, J.M.; Jiménez-Valverde, A.; Real, R. AUC: A Misleading Measure of the Performance of Predictive Distribution Models. Global Ecology and Biogeography 2008, 17, 145–151. [CrossRef]
- Mandrekar, J.N. Receiver Operating Characteristic Curve in Diagnostic Test Assessment. Journal of Thoracic Oncology 2010, 5, 1315–1316. [CrossRef]
- Fan, J.; Upadhye, S.; Worster, A. Understanding Receiver Operating Characteristic (ROC) Curves. CJEM 2006, 8, 19–20. [CrossRef]
- Hanberry, B.B.; He, H.S. Prevalence, Statistical Thresholds, and Accuracy Assessment for Species Distribution Models. Web Ecology 2013, 13, 13–19. [CrossRef]
- Saha, A.; Datta, A. Random Forests for Binary Geospatial Data 2025.
- Pyrecast. Available online: https://pyrecast.org/ (accessed on 3 January 2025).
- Jain, P.; Coogan, S.C.P.; Subramanian, S.G.; Crowley, M.; Taylor, S.; Flannigan, M.D. A Review of Machine Learning Applications in Wildfire Science and Management. Environ. Rev. 2020, 28, 478–505. [CrossRef]
- Alkhatib, R.; Sahwan, W.; Alkhatieb, A.; Schütt, B. A Brief Review of Machine Learning Algorithms in Forest Fires Science. Applied Sciences 2023, 13, 8275. [CrossRef]
- Andrianarivony, H.S.; Akhloufi, M.A. Machine Learning and Deep Learning for Wildfire Spread Prediction: A Review. Fire 2024, 7, 482. [CrossRef]
- Xu, Z.; Li, J.; Cheng, S.; Rui, X.; Zhao, Y.; He, H.; Xu, L. Wildfire Risk Prediction: A Review 2024.
Figure 1.
Causes of fire and the feedback mechanisms that drive wildfires in Thailand; after fire is initially introduced to a landscape, socioeconomic and environmental feedbacks may increase the likelihood of future fires.
Figure 1.
Causes of fire and the feedback mechanisms that drive wildfires in Thailand; after fire is initially introduced to a landscape, socioeconomic and environmental feedbacks may increase the likelihood of future fires.
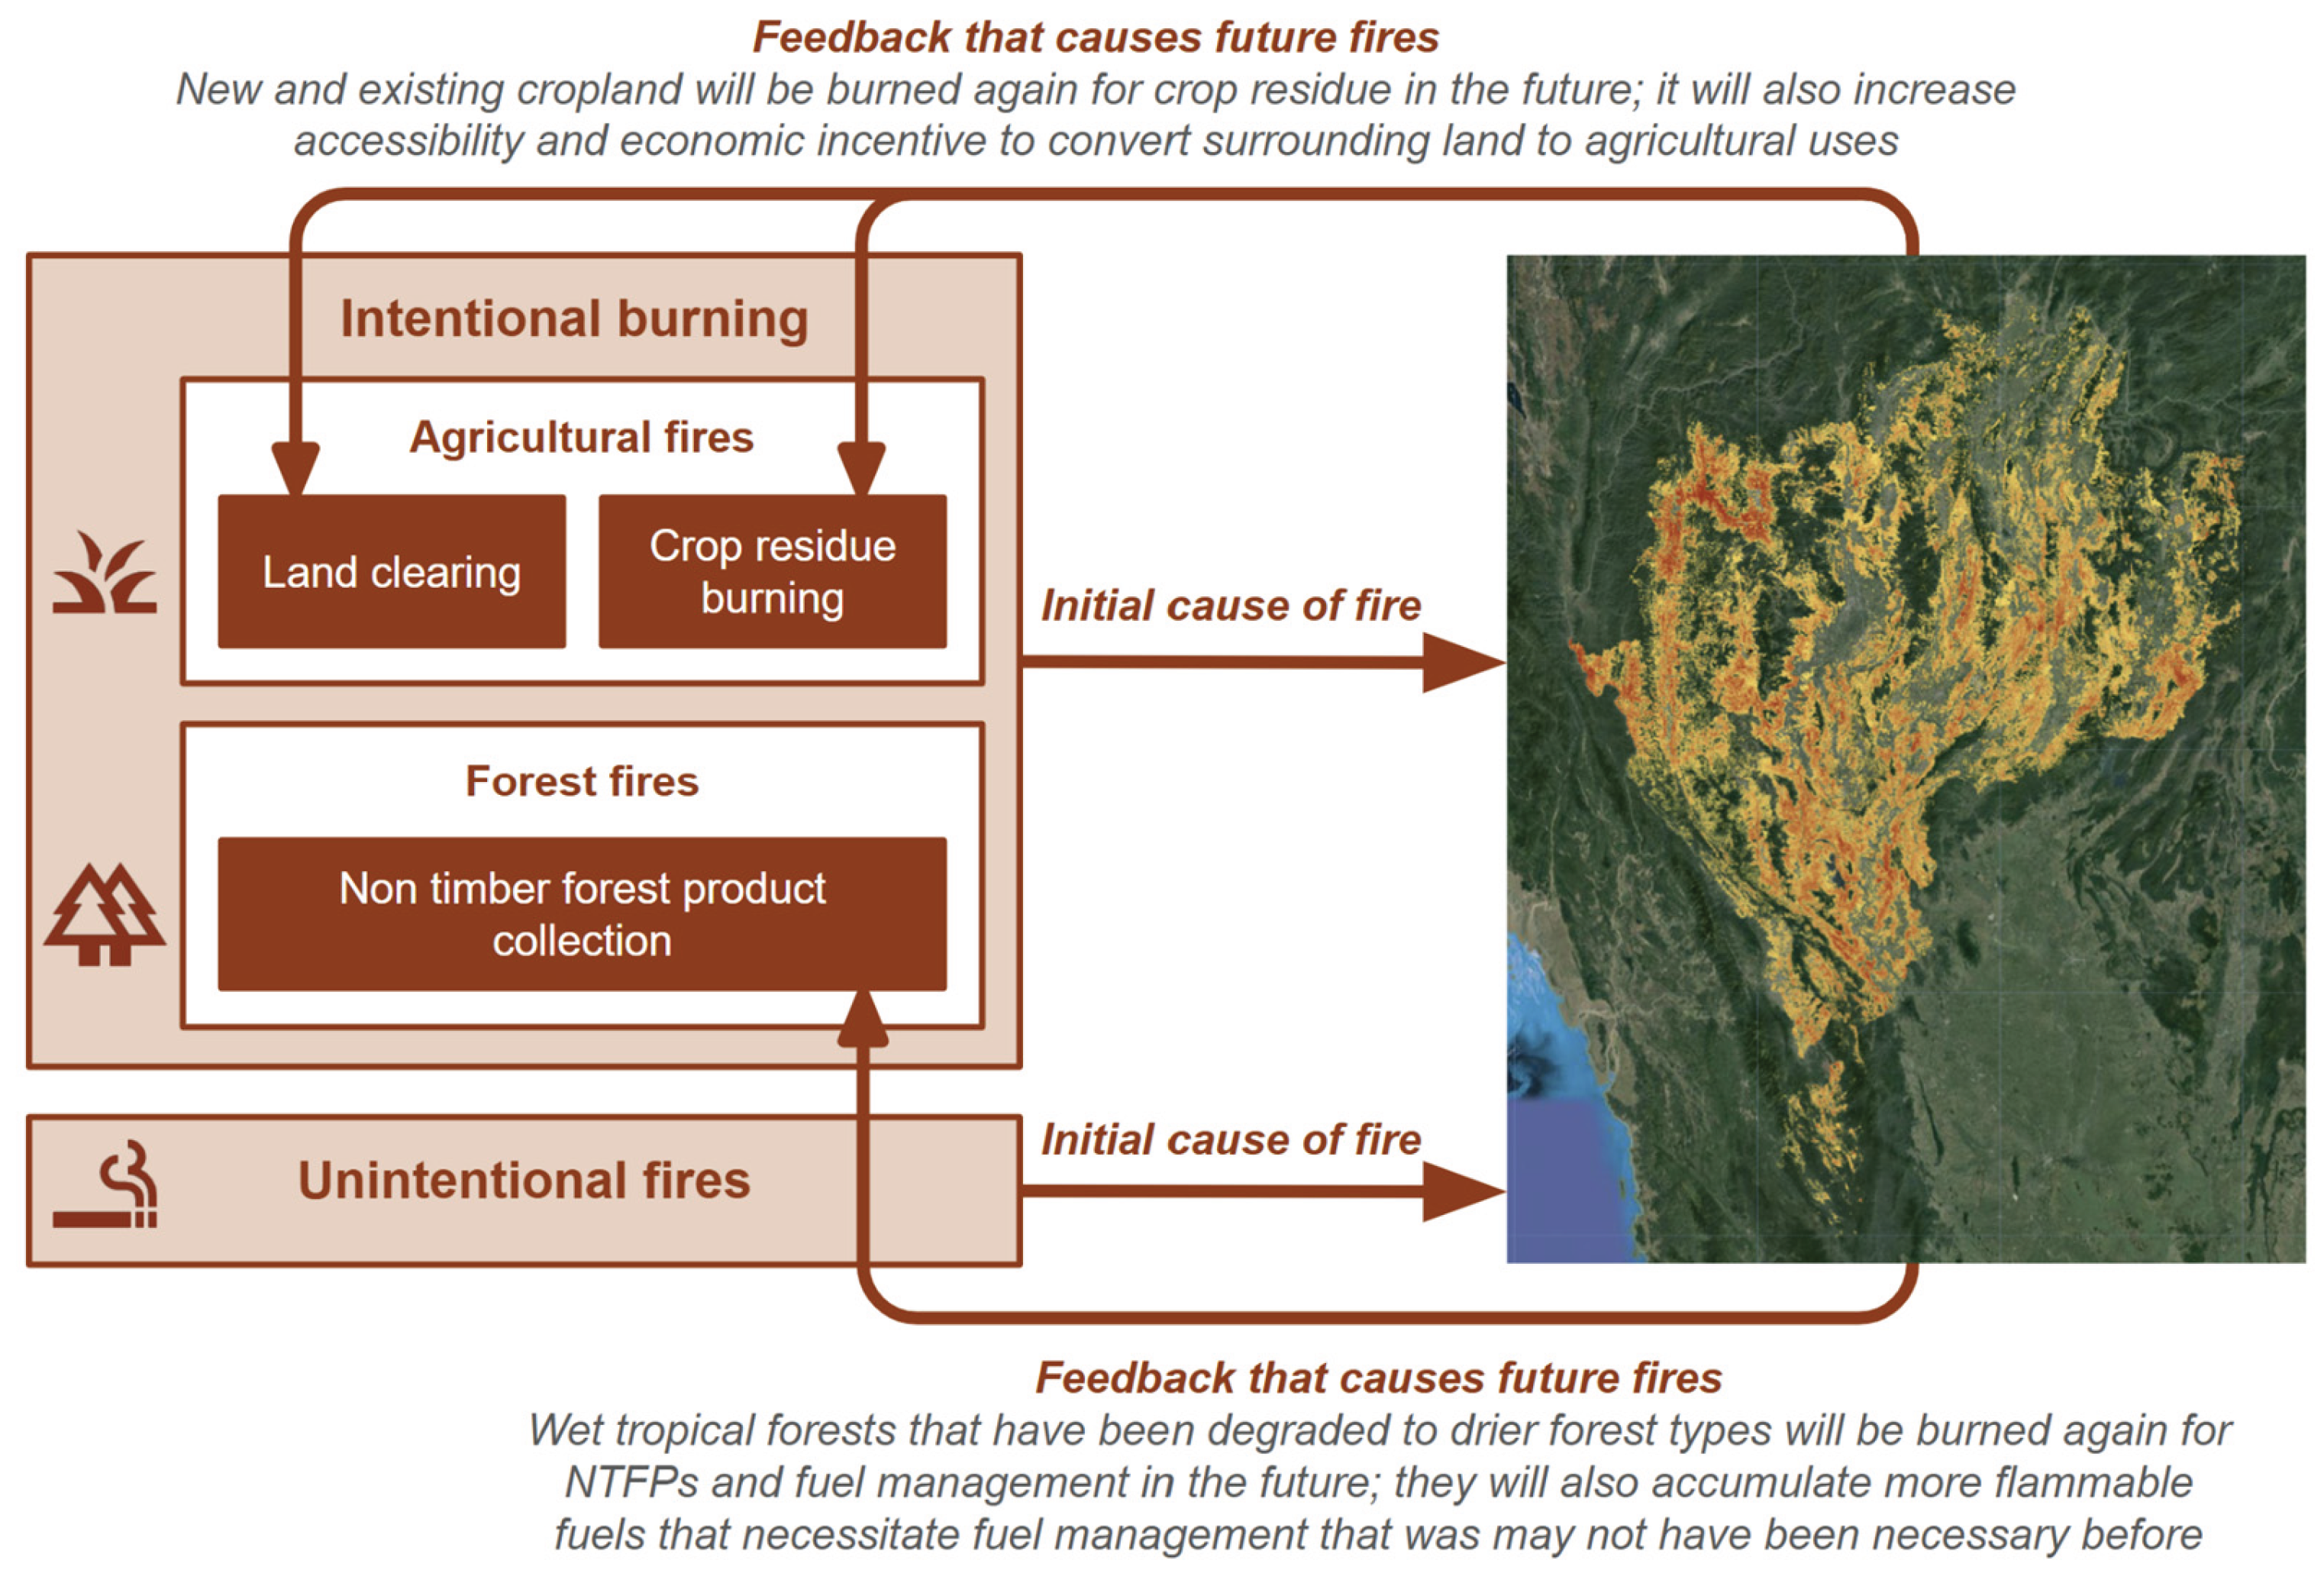
Figure 2.
Reference map of the study area, which consists of the 9 most northeastern provinces of Thailand. (Basemap credits: Earthstar Geographics, Esri, TomTom, Garmin, FAO, NOAA, USGS, © OpenStreetMap contributors, and the GIS User Community; Spatial reference: GCS WGS 1984, EPSG 4326).
Figure 2.
Reference map of the study area, which consists of the 9 most northeastern provinces of Thailand. (Basemap credits: Earthstar Geographics, Esri, TomTom, Garmin, FAO, NOAA, USGS, © OpenStreetMap contributors, and the GIS User Community; Spatial reference: GCS WGS 1984, EPSG 4326).
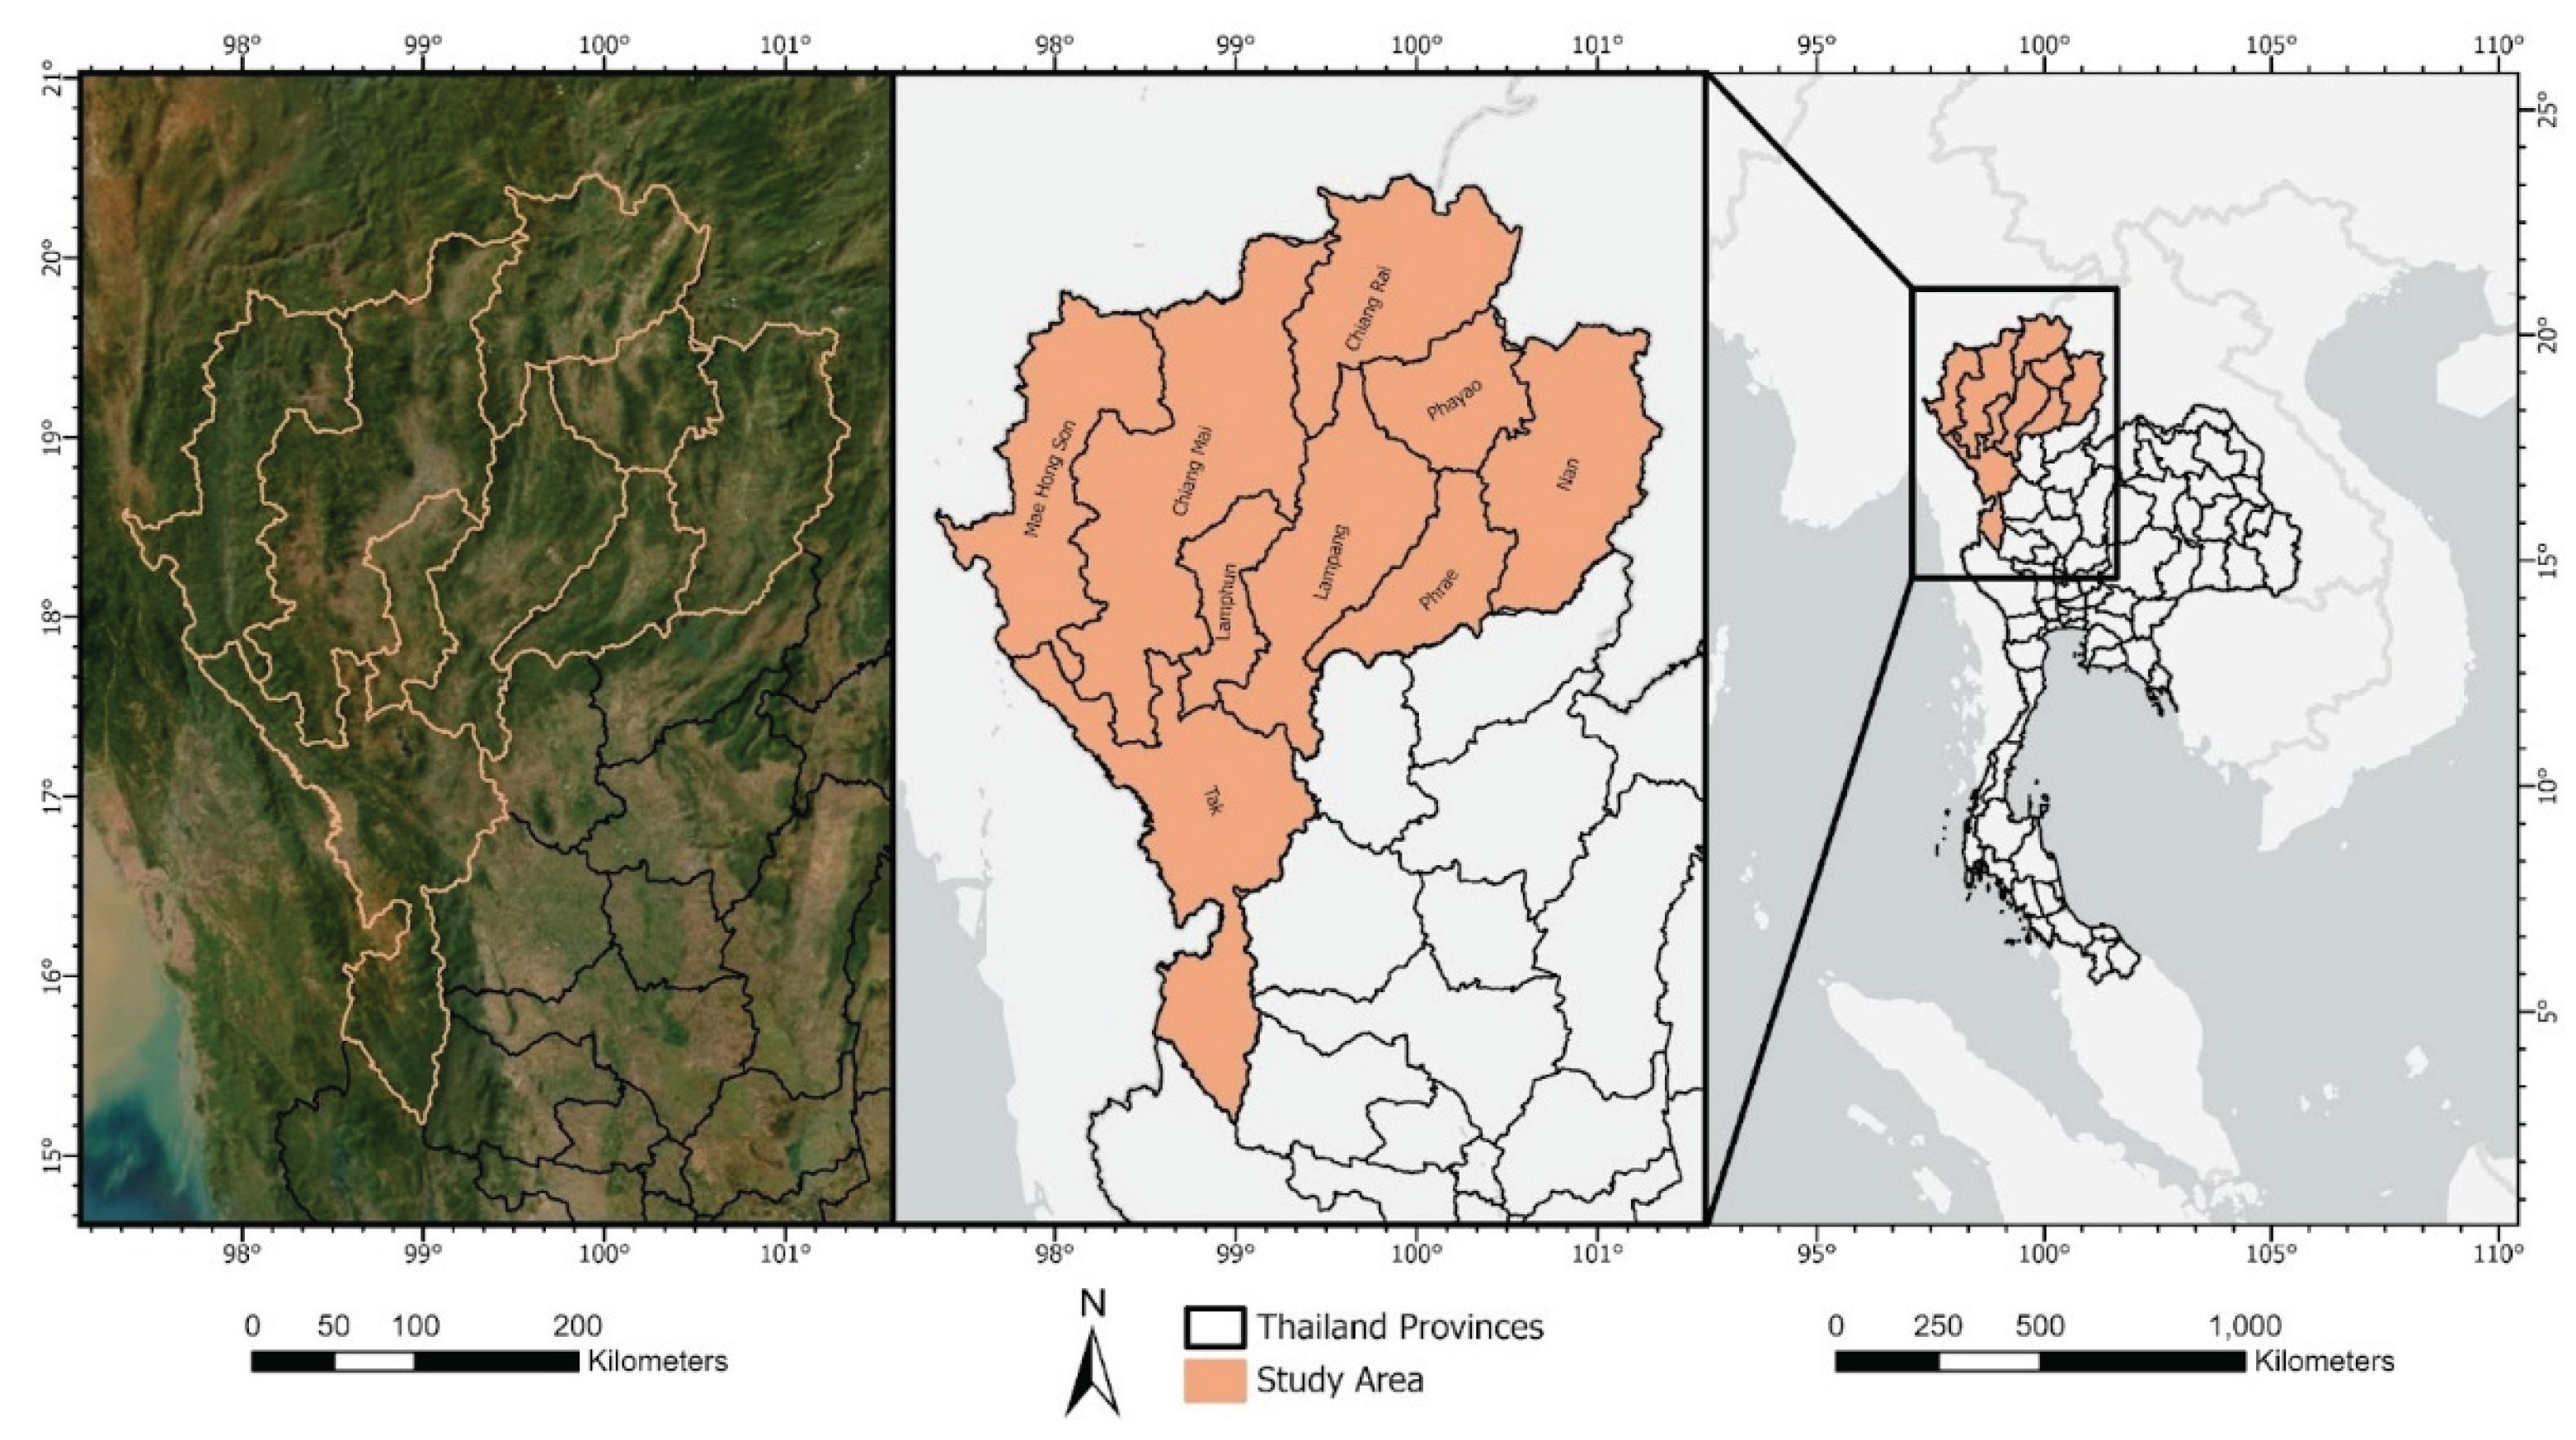
Figure 3.
Overview of our model development workflow, including input data preparation, model development, and model refinement.
Figure 3.
Overview of our model development workflow, including input data preparation, model development, and model refinement.
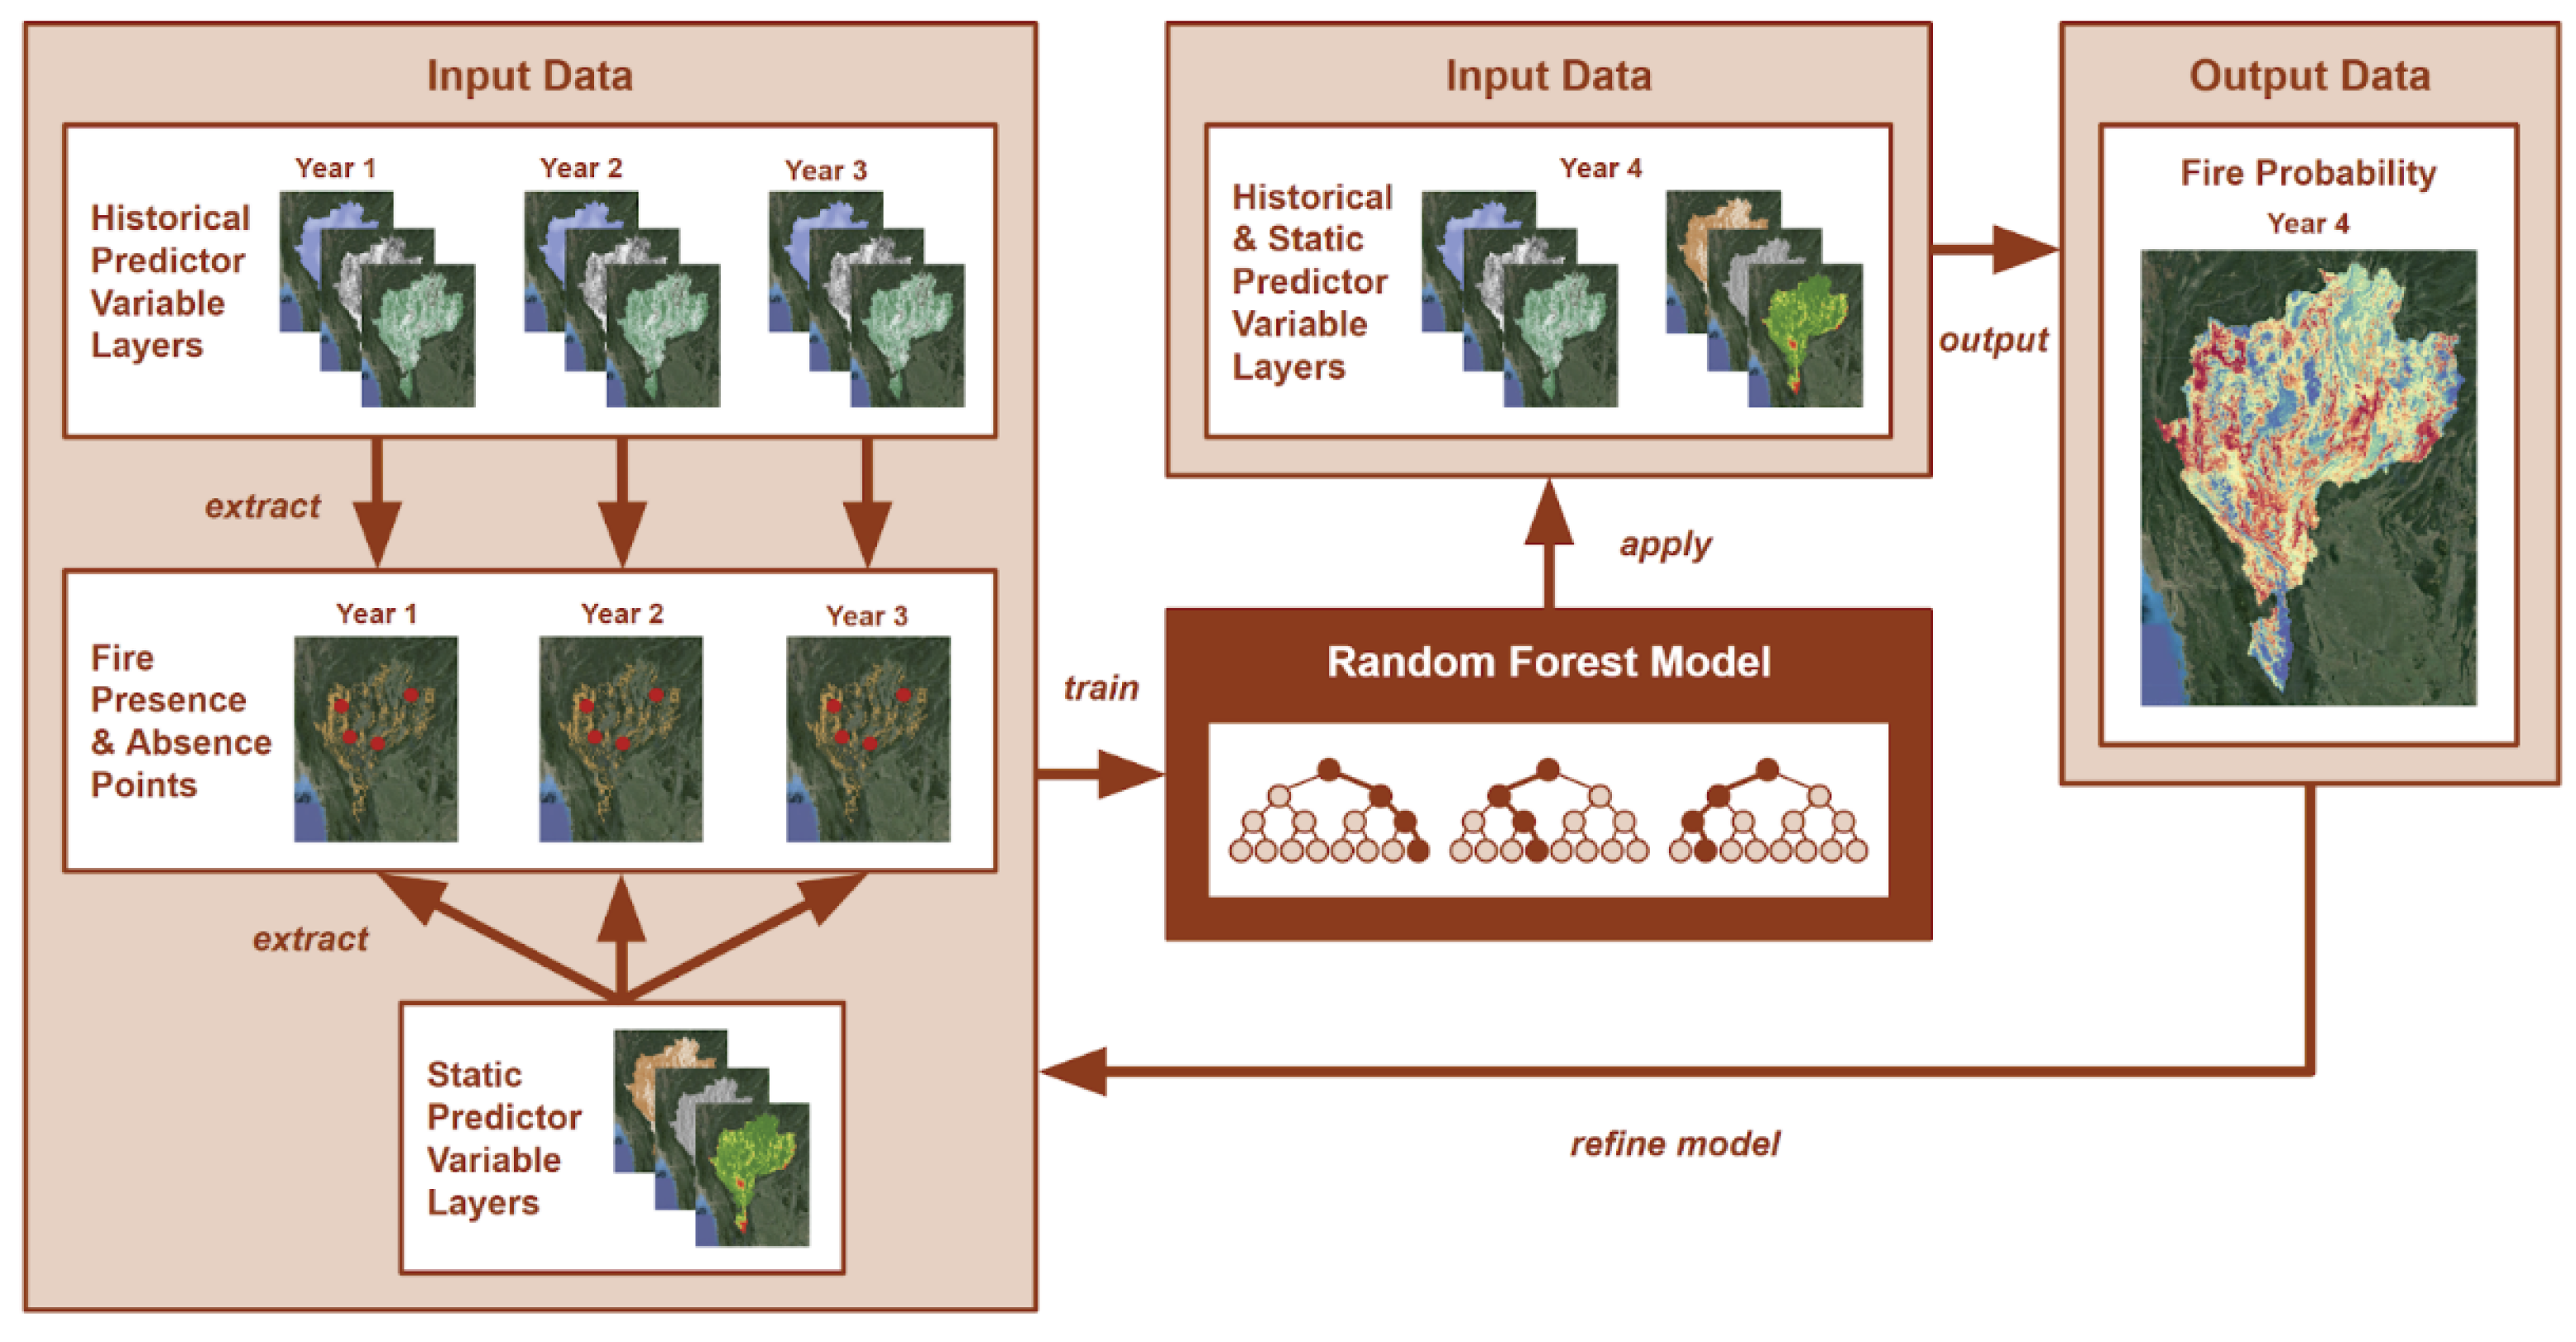
Figure 4.
2016-2023 AUC of all model runs during model refinement using consecutive variable removal without replacement.
Figure 4.
2016-2023 AUC of all model runs during model refinement using consecutive variable removal without replacement.
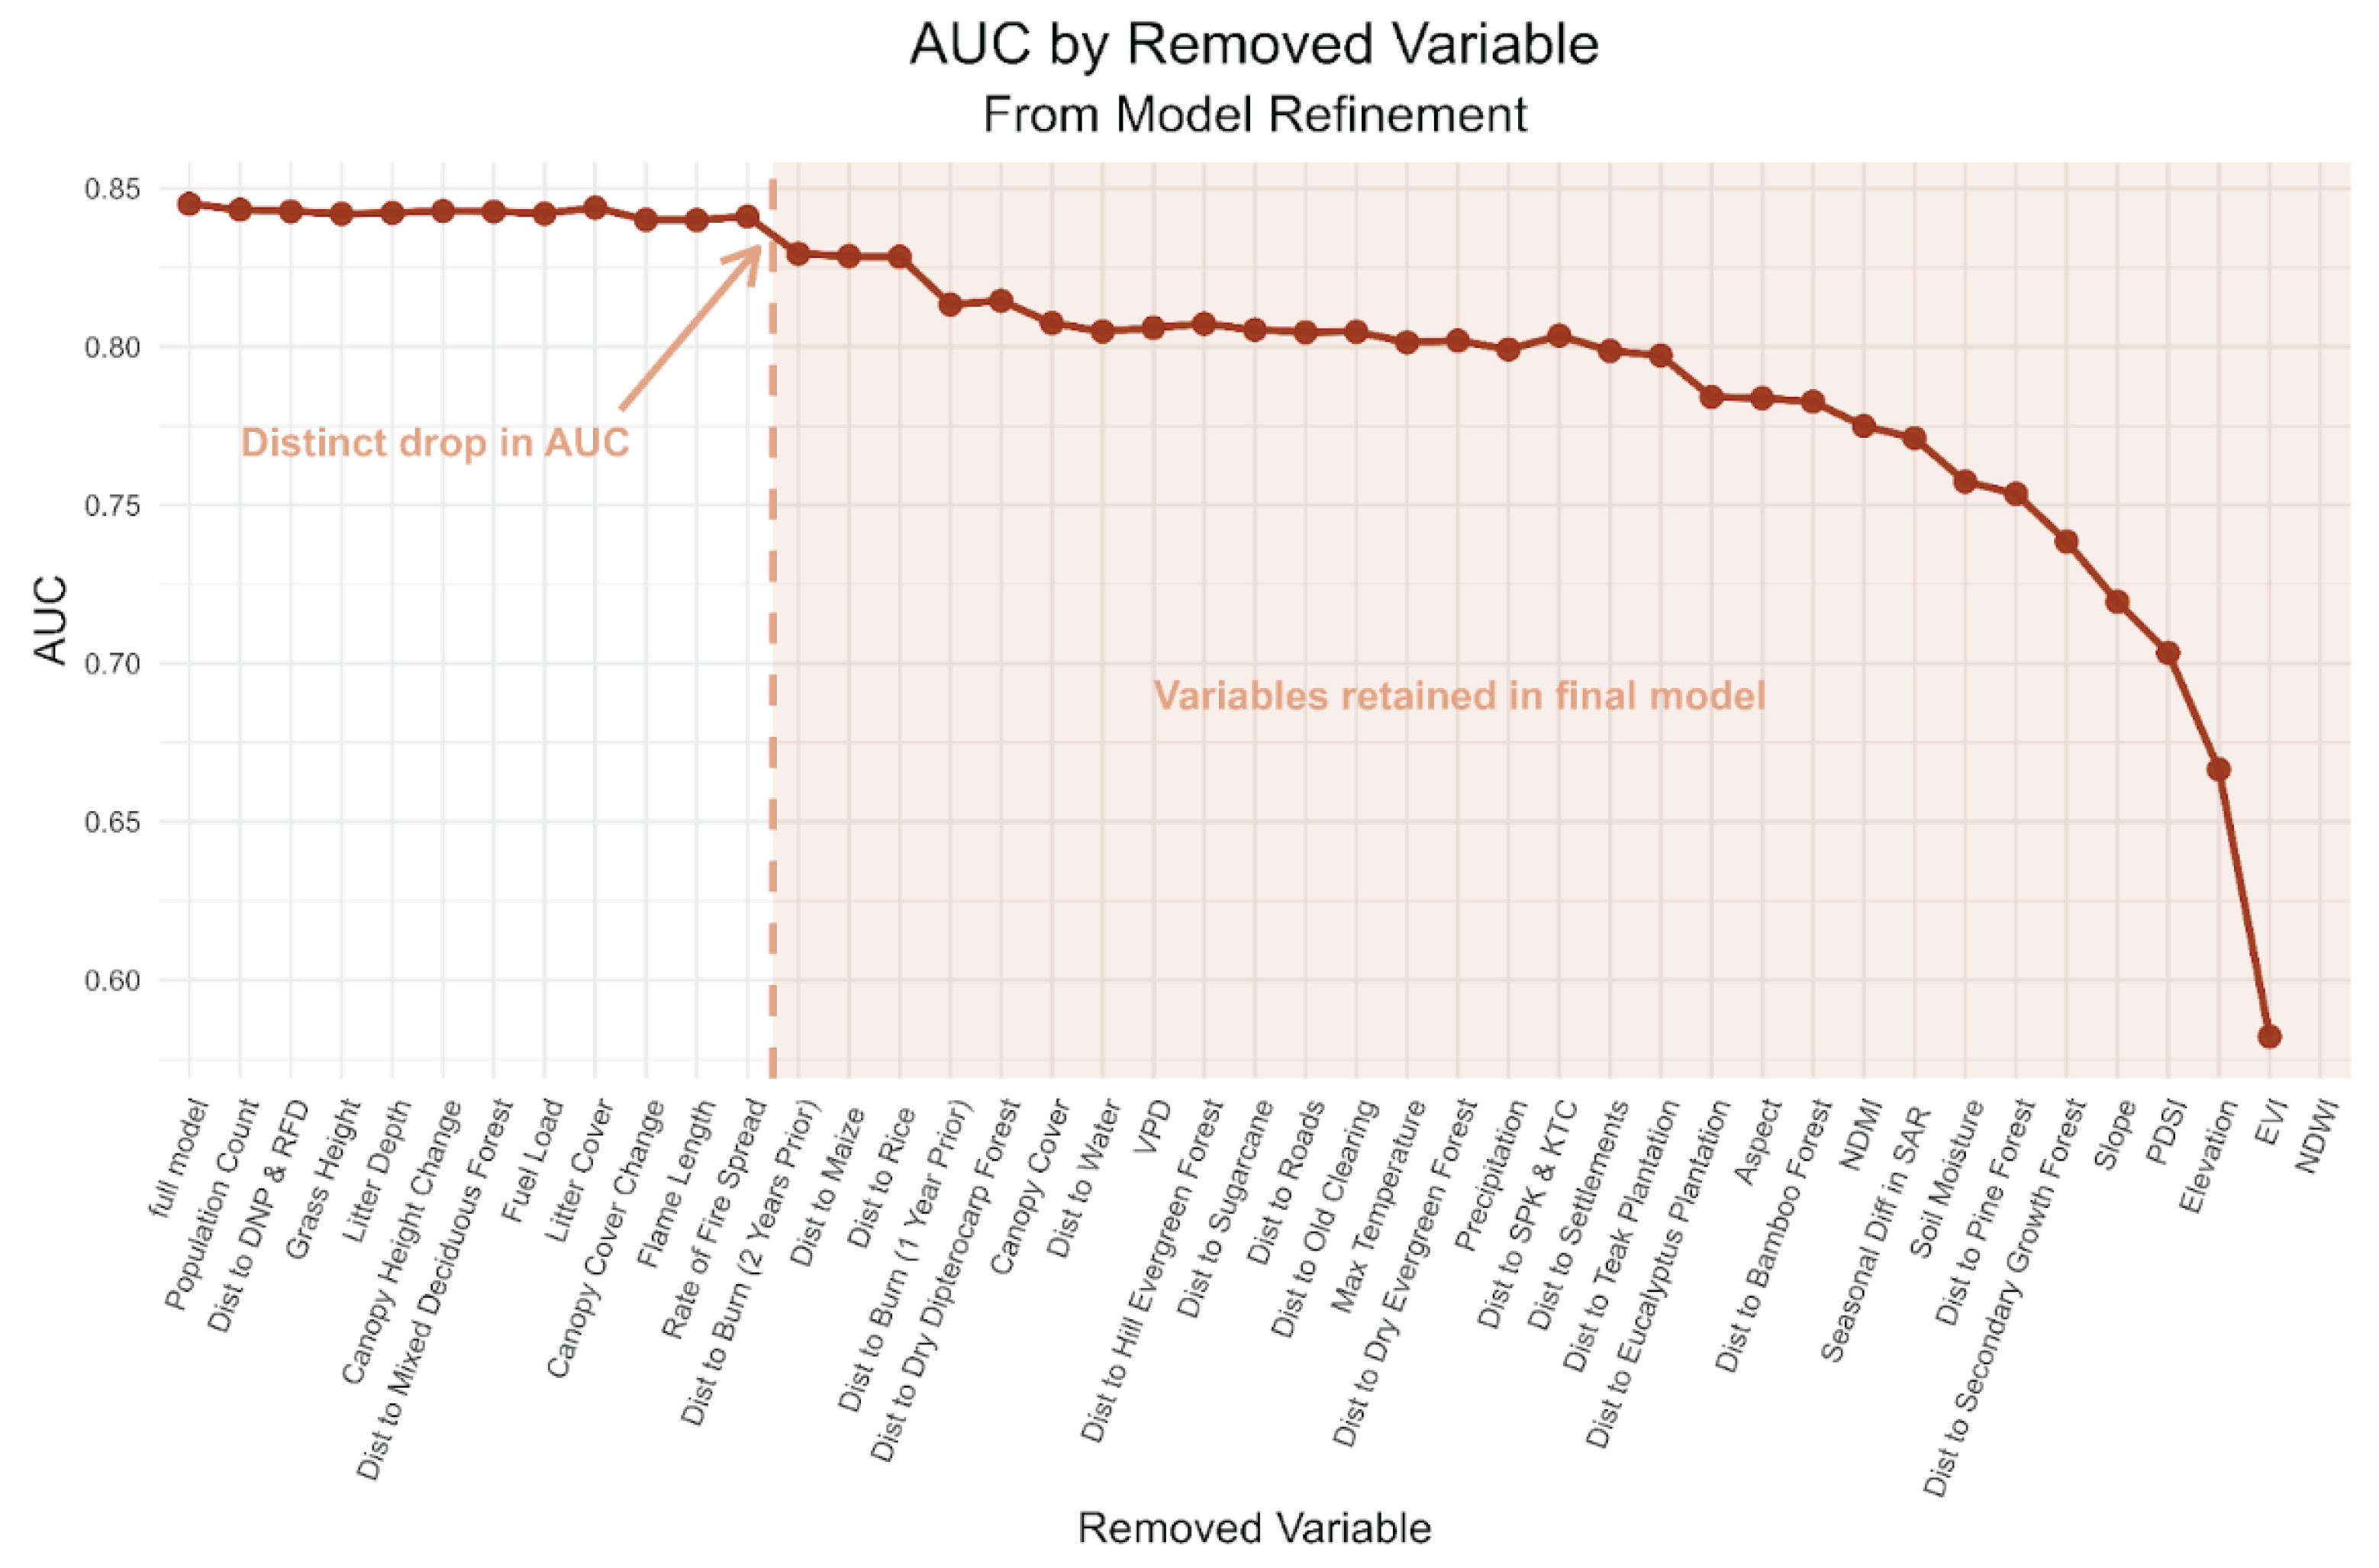
Figure 5.
Scaled Gini-based variable importance values of final model, after model refinement through variable removal.
Figure 5.
Scaled Gini-based variable importance values of final model, after model refinement through variable removal.
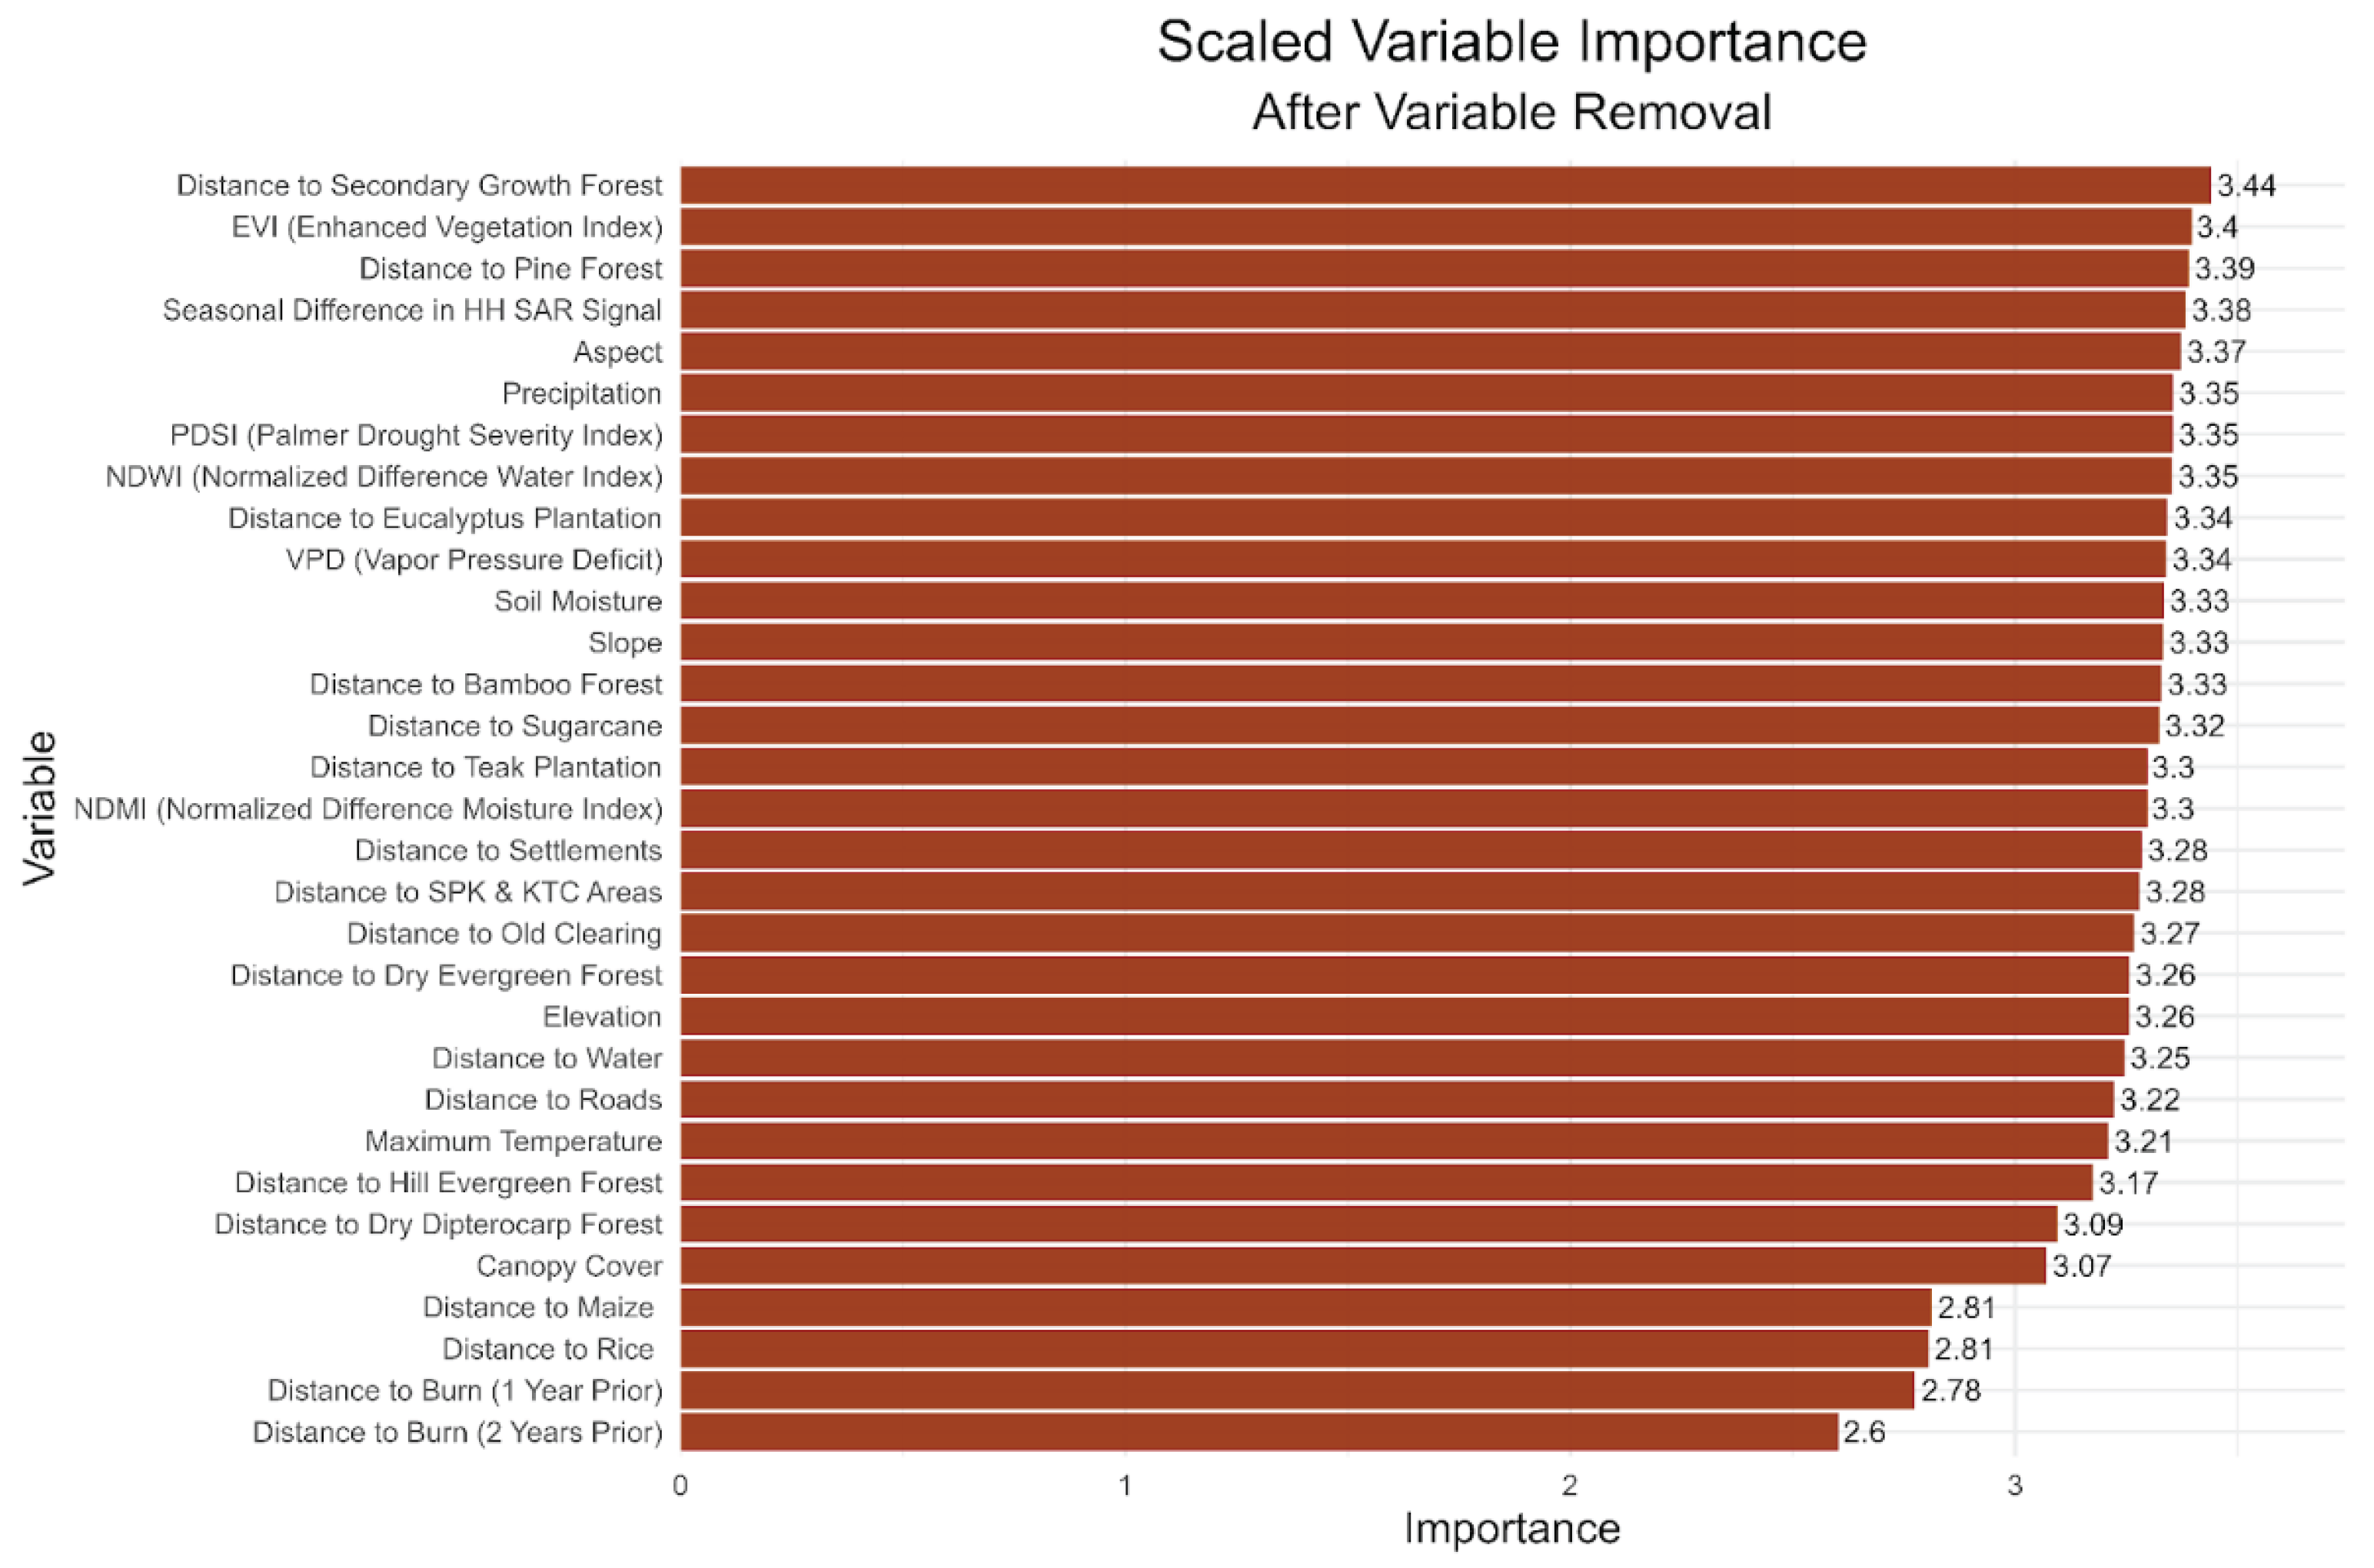
Figure 6.
Variable importance distributions of predictor variables across all model runs in sensitivity analysis using individual variable removal with replacement.
Figure 6.
Variable importance distributions of predictor variables across all model runs in sensitivity analysis using individual variable removal with replacement.
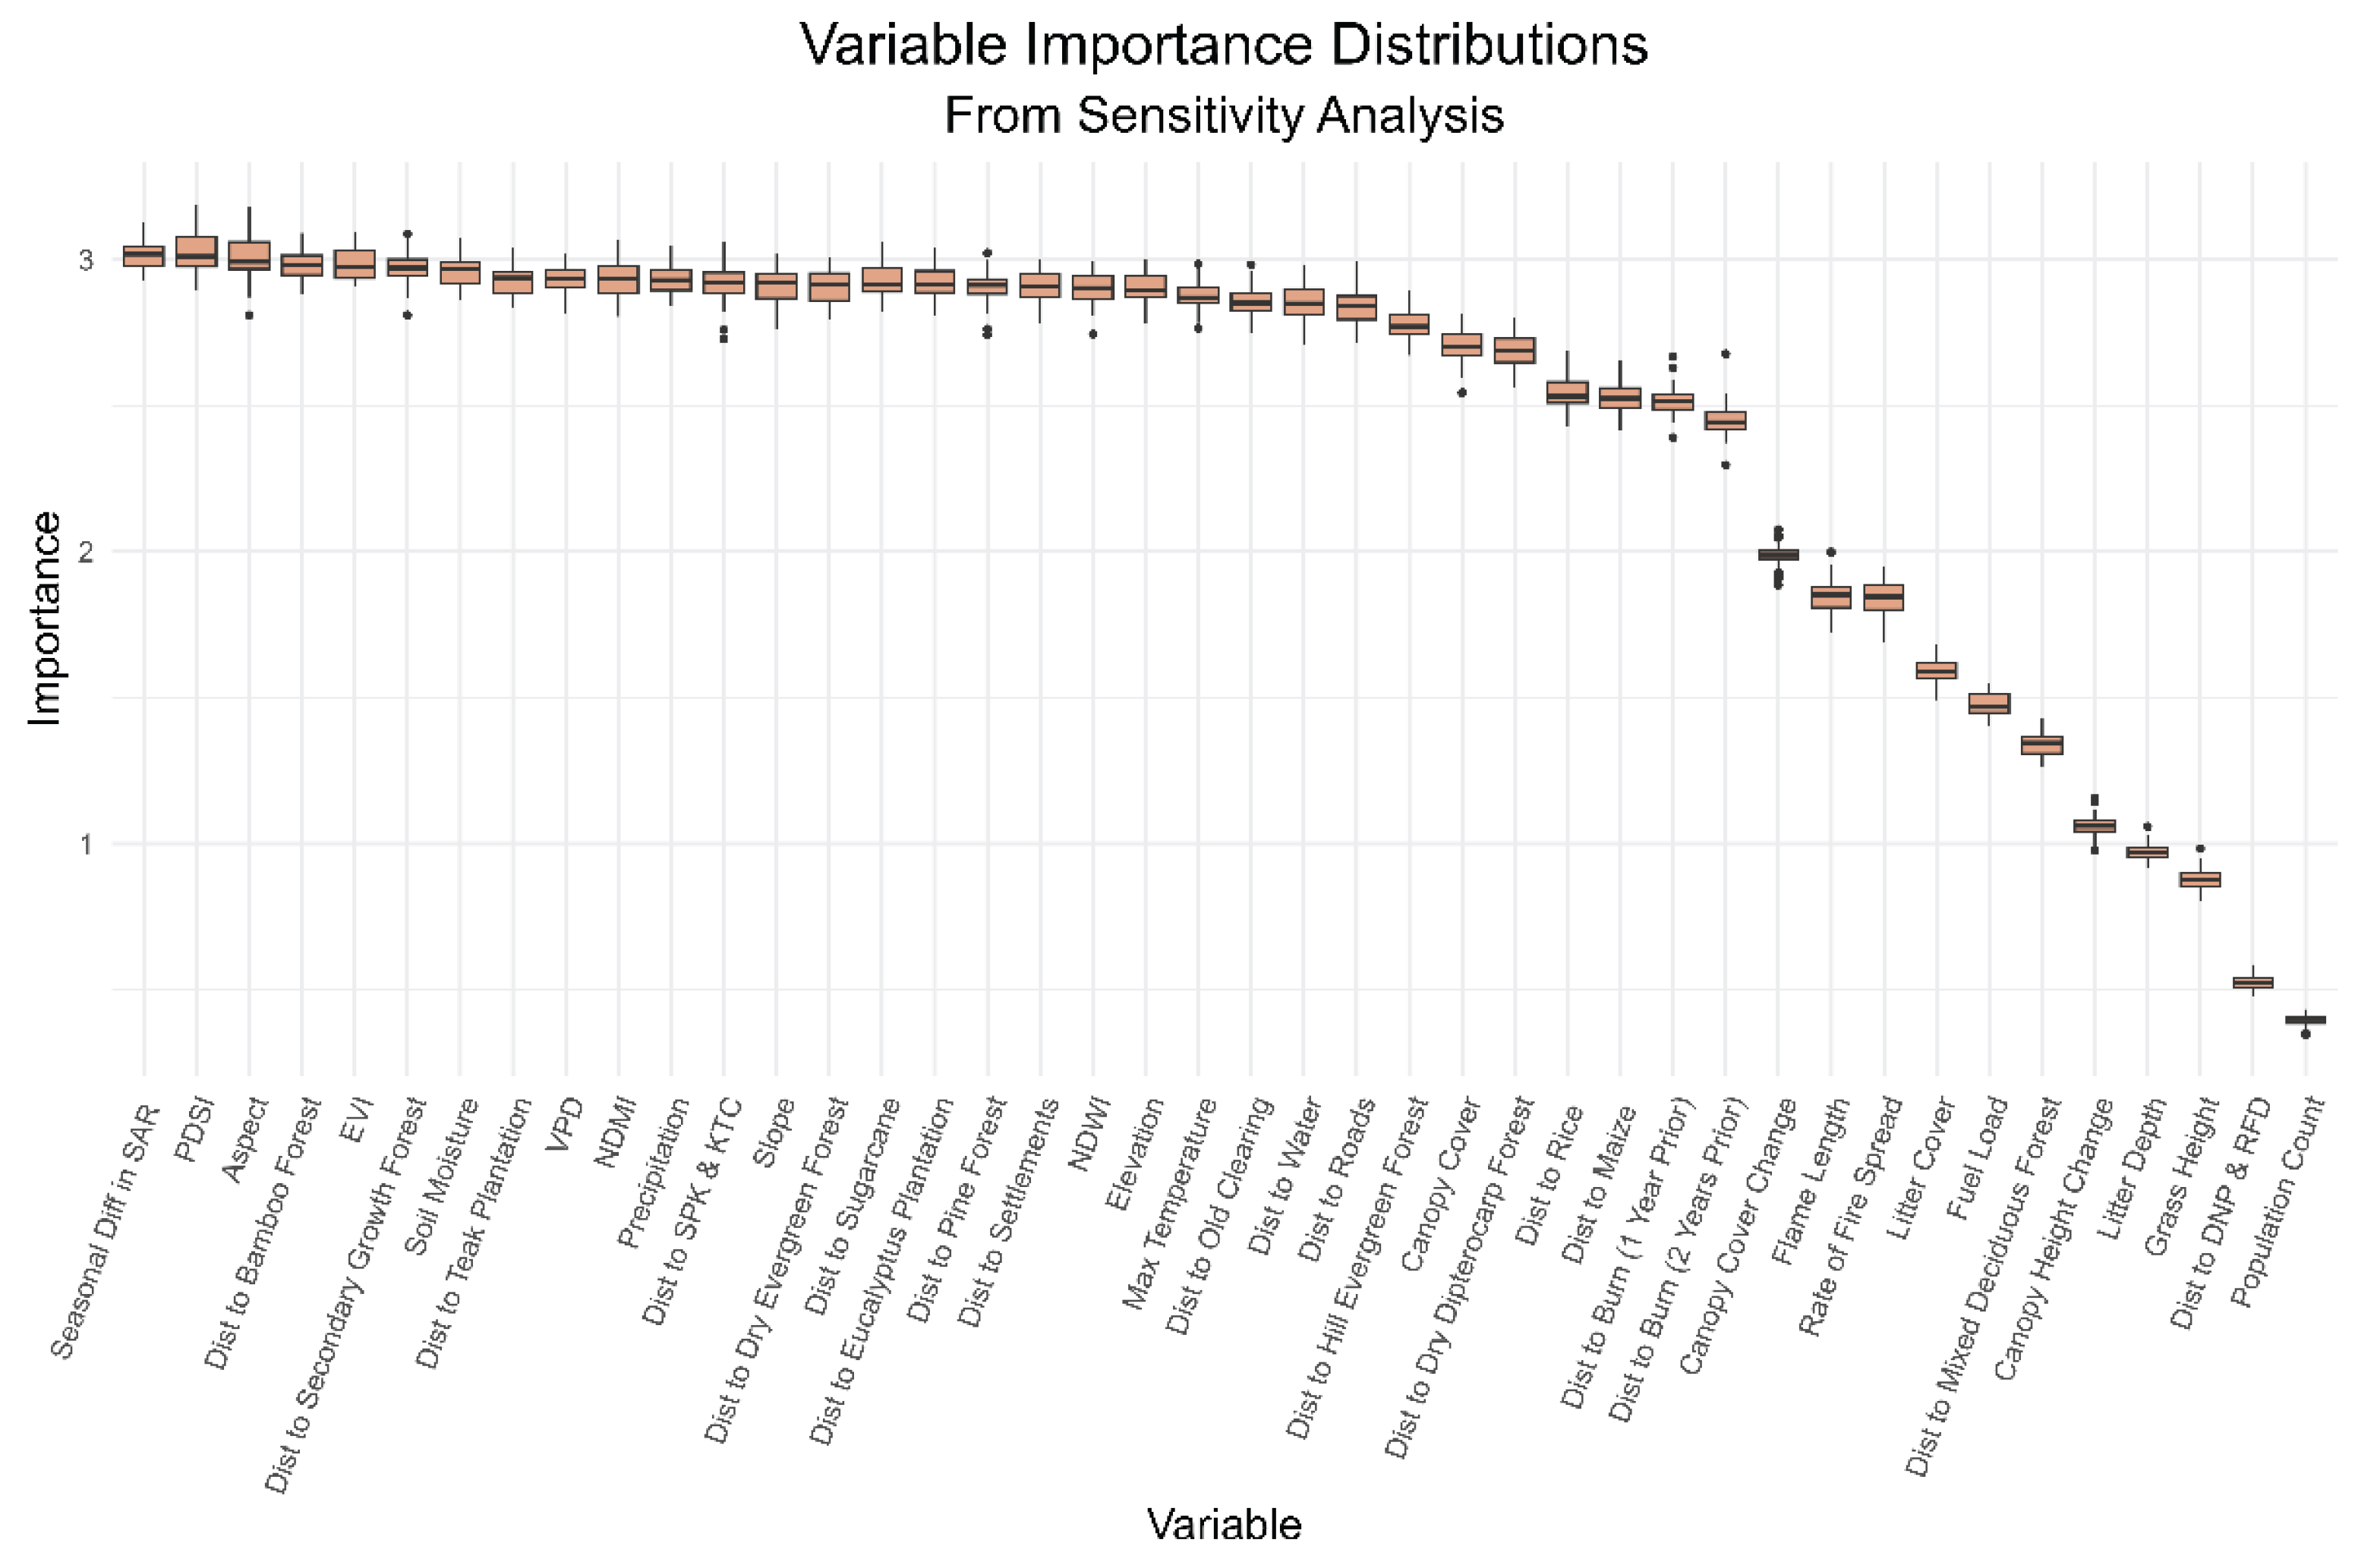
Figure 7.
2016-2023 AUC of all model runs in sensitivity analysis using individual variable removal with replacement.
Figure 7.
2016-2023 AUC of all model runs in sensitivity analysis using individual variable removal with replacement.
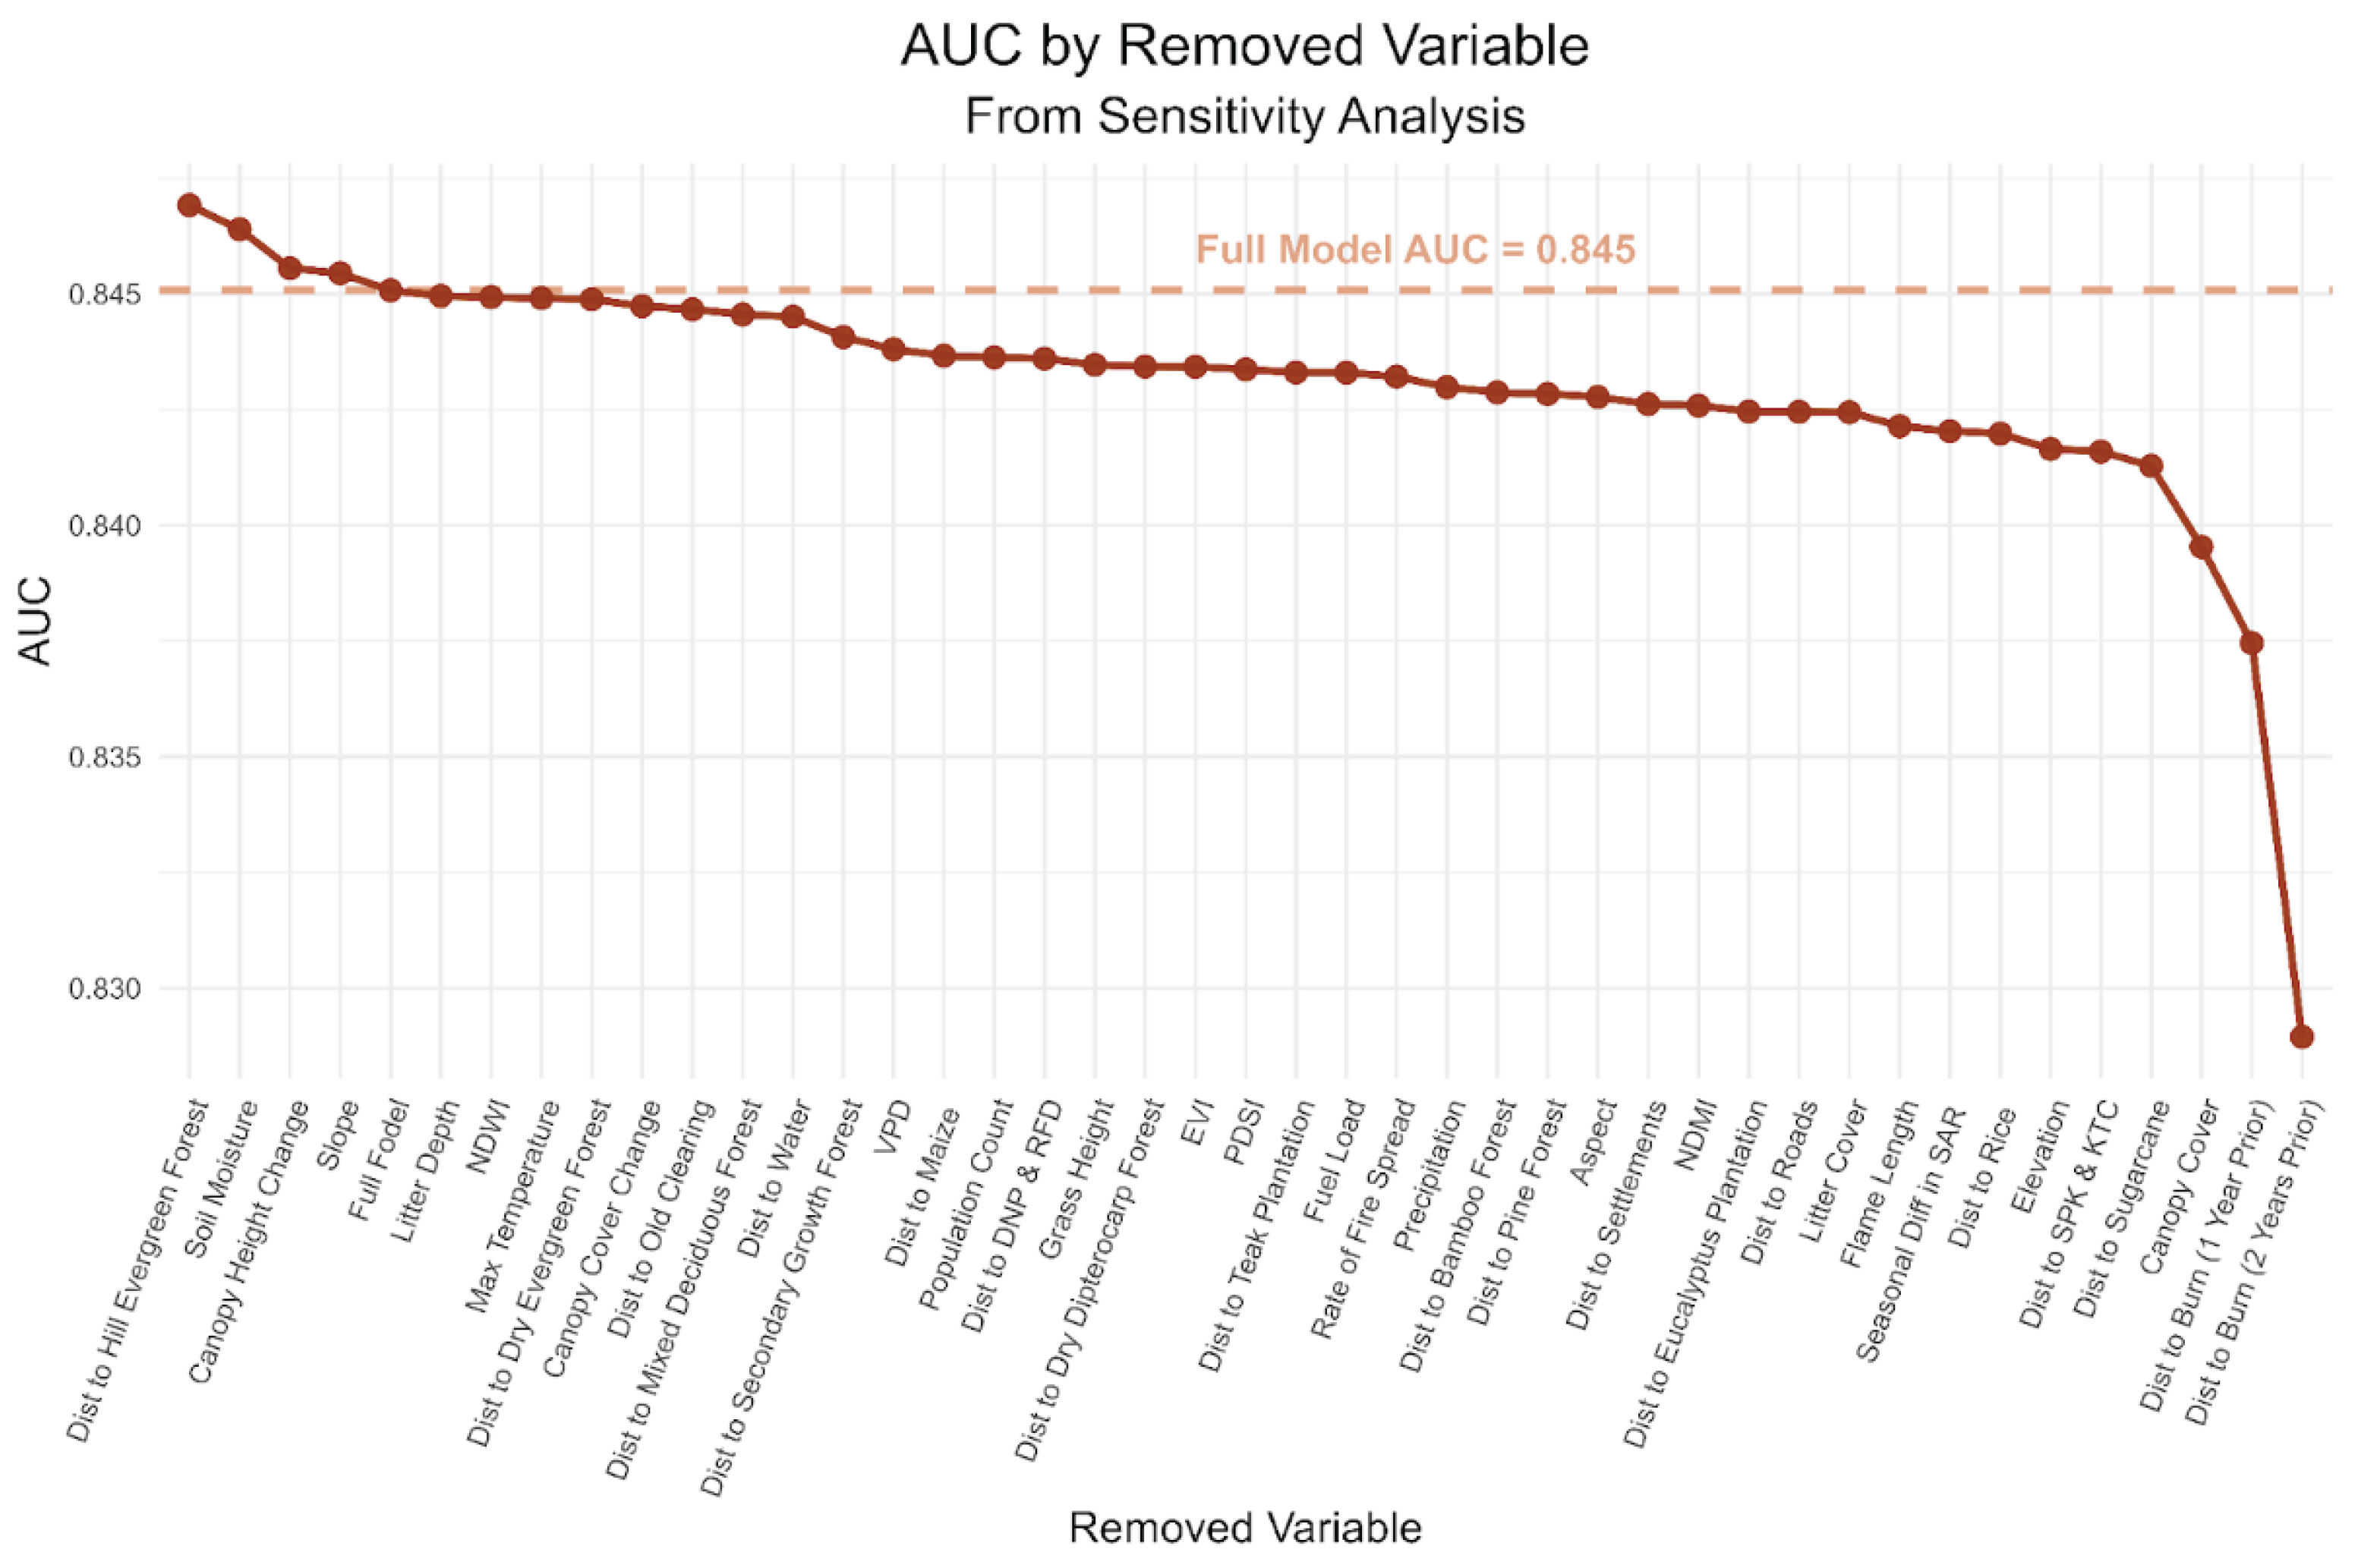
Figure 8.
(a) The probability of fire occurrence in 2024 for the 9 most northeastern provinces of Thailand, generated by the random forest model developed with predictor and fire occurrence data from 2016-2023 and applied to new predictor data from 2024; (b) Fire frequency (number of years with at least one fire occurrence) for the 9 most northeastern provinces of Thailand from 2014-2023. (Basemap credits: Esri, CGIAR, USGS, TomTom, Garmin, FAO, NOAA, USGS, © OpenStreetMap contributors, and the GIS User Community; Spatial reference: GCS WGS 1984, EPSG 4326).
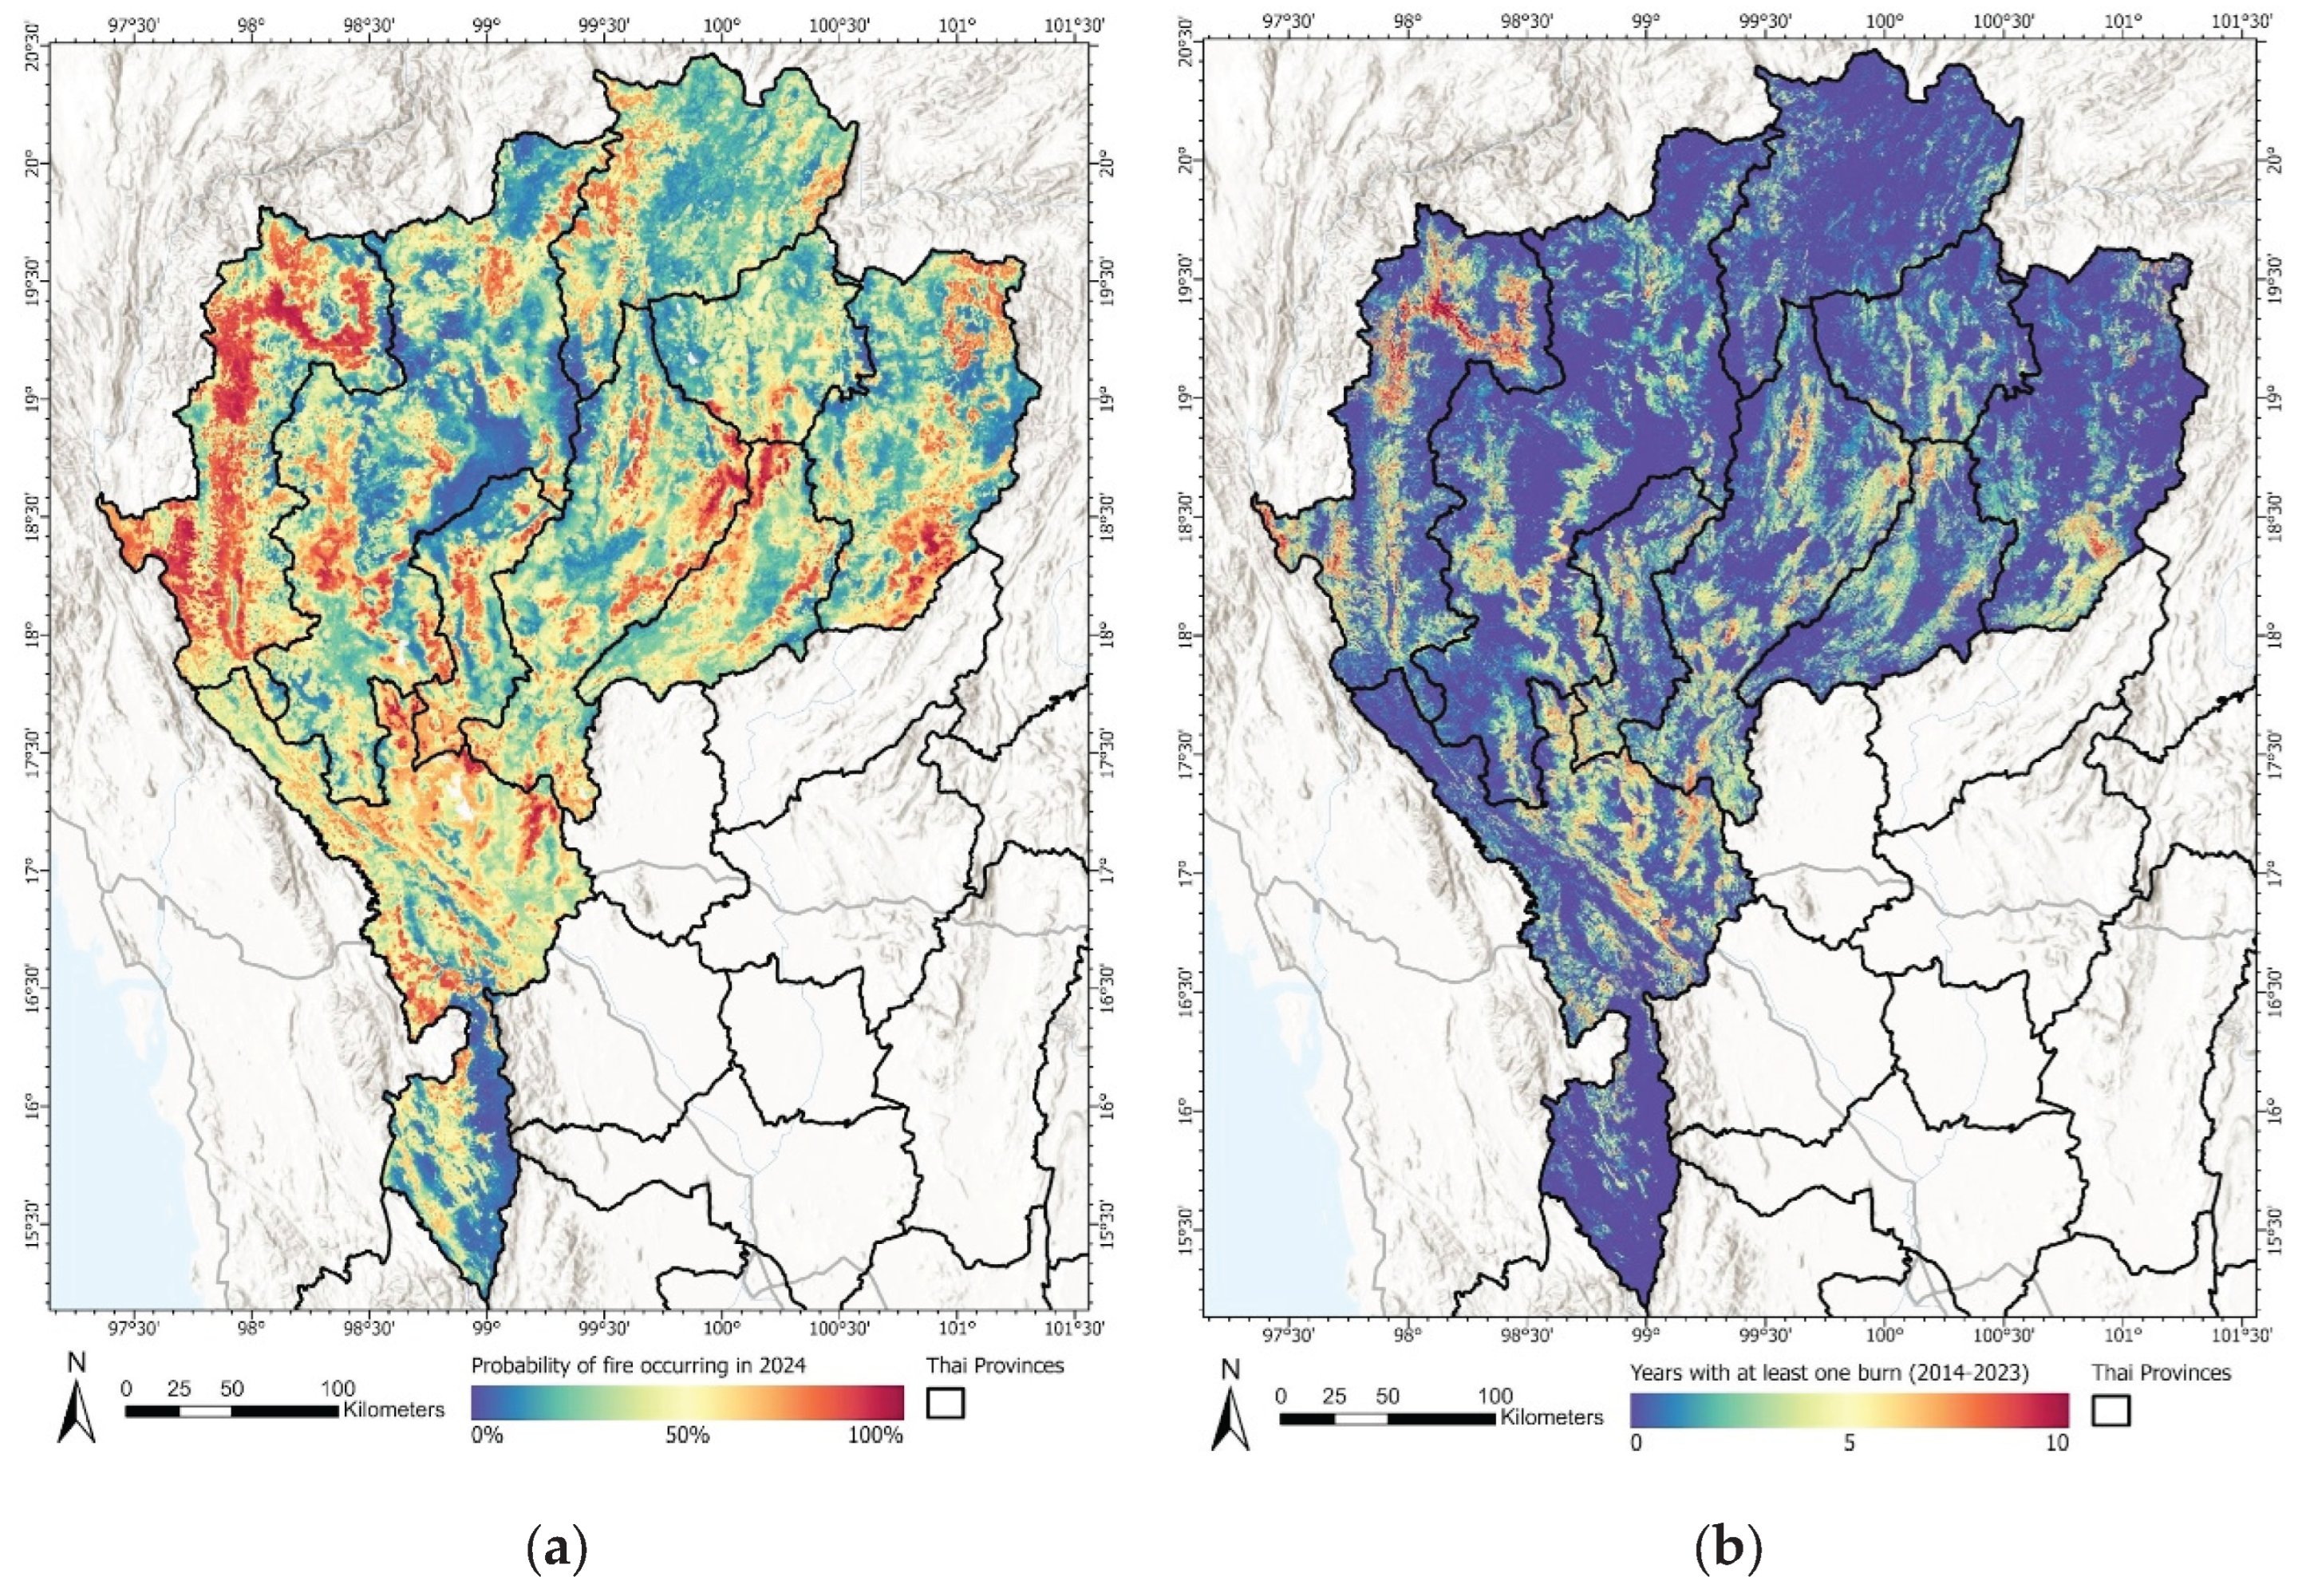

Table 1.
Predictor variables included in the full model prior to model refinement.
| Environmental Variables | ||||||
|---|---|---|---|---|---|---|
| Category | Variable | Units | Description | Available Temporal Extent | Available Spatial Extent | Data Source |
| Topography | Elevation | meters | Elevation above sea level | NA | global | [62] |
| Slope | degrees | Degree of incline | NA | global | [62] | |
| Aspect | degrees | Orientation of slope | NA | global | [62] | |
| Fuels | Woody and herbaceous fuel load | tons per ha | Combined mass of fuel from sound woody and primary herbaceous vegetation | 2015 | global | [105,106] |
| Litter cover | percent | Percent of ground cover of leaf litter | 2015 | global | [105] | |
| Litter depth | centimeters | Depth of vegetative litter | 2015 | global | [105] | |
| Grass height | centimeters | Height of primary herbaceous vegetation | 2015 | global | [105] | |
| Potential fire behavior | Flame length | meters | Modeled flame length from the Fuel Characteristic Classification System | 2015 | global | [93,105,106,107,108] |
| Rate of fire spread | meters per minute | Modeled rate of fire spread from the Fuel Characteristic Classification System | 2015 | global | [91,105,106,108] | |
| Forest type | Distance to forest type | kilometers | Distance to common forest types 1. Dry Evergreen Forest 2. Hill Evergreen Forest 3. Pine Forest 4. Mixed Deciduous Forest 5. Dry Dipterocarp Forest 6. Bamboo Forest 7. Teak Plantation 8. Secondary Growth Forest 9. Old clearing 10. Eucalyptus Plantation |
NA | Thailand | RFD* |
| Vegetation Characteristics | Canopy cover | percent | Percent of cover of trees from above (peak of growing season) | 2000-2023, annual | Mekong region | [109]** |
| Change in canopy cover | percent | Difference in canopy cover between current year and prior year; positive values indicate increase, negative values indicate decrease | 2001-2023, annual | Mekong region | [109]** | |
| Change in canopy height | meters | Difference in canopy height between current year and prior year; positive values indicate increase, negative values indicate decrease | 2001-2023, annual | Mekong region | [110]** | |
| Normalized difference moisture index (NDMI) | unitless | Captures moisture content of vegetation; calculated from the near infrared and shortwave infrared bands; positive values indicate higher moisture, negative values indicate lower moisture | 2013-2024 | global | [111] | |
| Enhanced vegetation index (EVI) | unitless | Captures density and health of vegetation; calculated from the red, blue, and near infrared bands; positive values indicate higher moisture, negative values indicate lower moisture | 2013-2024 | global | [111] | |
| Seasonal Differences in HH SAR signal | decibels | Difference between Synthetic Aperture Radar (SAR) HH polarization backscatter between the wet and dry seasons | 2014-2024 | global | [112] | |
| Climate | Maximum temperature | degrees celsius | Average maximum temperature of air at 2m above the earth surface | 1958-2023, monthly | global | [113,114] |
| Precipitation | millimeters | Sum of accumulated precipitation | 1958-2023, monthly | global | [113,114] | |
| Vapor pressure deficit (VPD) | kilopascals | Difference between the amount of moisture in the air and how much moisture the air can hold when it is saturated; calculated from dewpoint temperature and temperature | 1958-2023, monthly | global | [113,114] | |
| Soil moisture | millimeters | Water content of soil; calculated using a one-dimensional soil water balance model | 1958-2023, monthly | global | [113,114] | |
| Palmer drought severity index (PDSI) | unitless | Quantifies long-term dought and can be interpreted as relative dryness as a deviation from normal conditions; calculated from temperature data and precipitation data with a physical water balance model; values range from -10 to 10, negative values indicate dryer conditions and positive values indicate wetter conditions | 1958-2023, monthly | global | [113,114] | |
| Water Availability | Distance to water | kilometers | Distance to natural and artificial sources of water (Farm ponds, Irrigation canals, Oceans, Reservoirs, Lakes, Lagoons, Rivers, Canals) | NA | Thailand | LDD*** |
| Normalized difference water index (NDWI) | unitless | Captures the presence of open water bodies and moisture content of vegetation; calculated from the red and near infrared bands; positive values indicate surface water present, negative values indicate no surface water present | 2013-2024 | global | [111] | |
| Socioeconomic Variables | ||||||
| Category | Variable | Units | Description | Available Temporal Extent | Available Spatial Extent | Data Source |
| Crop type | Distance to crop types | kilometers | Distance to crop types managed by fire 1.Maize 2. Corn 3. Sugarcane |
NA | Thailand | LDD*** |
| Recent burn history | Distance to burns (1 & 2 years prior) | kilometers | Distance to burn scars that occurred 1 year prior to the year of interest and 2 years prior to the year of interest | 2015-2023, annual | Thailand | GISTDA **** |
| Human influence and accessibility | Distance to roads | kilometers | Distance to roads | NA | Thailand | [115] |
| Distance to settlements | kilometers | Distance to buildings | 2015 | global | [116,117] | |
| Distance to SPK & KTC areas | kilometers | Distance to land under special agricultural management provisions in either the Sor Por Kor (SPK) and Kor Tor Chor (KTC) programs (land reform areas under laws M64 and M121) | NA | Thailand | [118] | |
| Distance to DNP & RFD areas | kilometers | Distance to land under the jurisdiction and protections of either the Department of National Parks (DNP) or the Royal Forestry Department (RFD) | NA | Thailand | [119,120] | |
| Population count | people per hectare | Population density, represented by the number of people residing per hectare | 1975-2030, 5 year intervals |
global | [121,122] | |
* Provided directly by the Royal Forest Department (RFD). ** A regional version of the referenced model, provided directly by University of Maryland. *** Provided directly by the Land Development Department (LDD). **** Provided directly by the Geo-Informatics & Space Technology Development Agency (GISDTA).
Disclaimer/Publisher’s Note: The statements, opinions and data contained in all publications are solely those of the individual author(s) and contributor(s) and not of MDPI and/or the editor(s). MDPI and/or the editor(s) disclaim responsibility for any injury to people or property resulting from any ideas, methods, instructions or products referred to in the content. |
© 2025 by the authors. Licensee MDPI, Basel, Switzerland. This article is an open access article distributed under the terms and conditions of the Creative Commons Attribution (CC BY) license (http://creativecommons.org/licenses/by/4.0/).
Copyright: This open access article is published under a Creative Commons CC BY 4.0 license, which permit the free download, distribution, and reuse, provided that the author and preprint are cited in any reuse.


