Preprint
Article

This version is not peer-reviewed.

Machine Learning–Based Prediction of Ultrasound-Detected Metabolic Dysfunction–Associated Steatotic Liver Disease Using Routine Clinical and Biochemical Parameters

Submitted:

07 November 2025

Posted:

10 November 2025

You are already at the latest version

Abstract

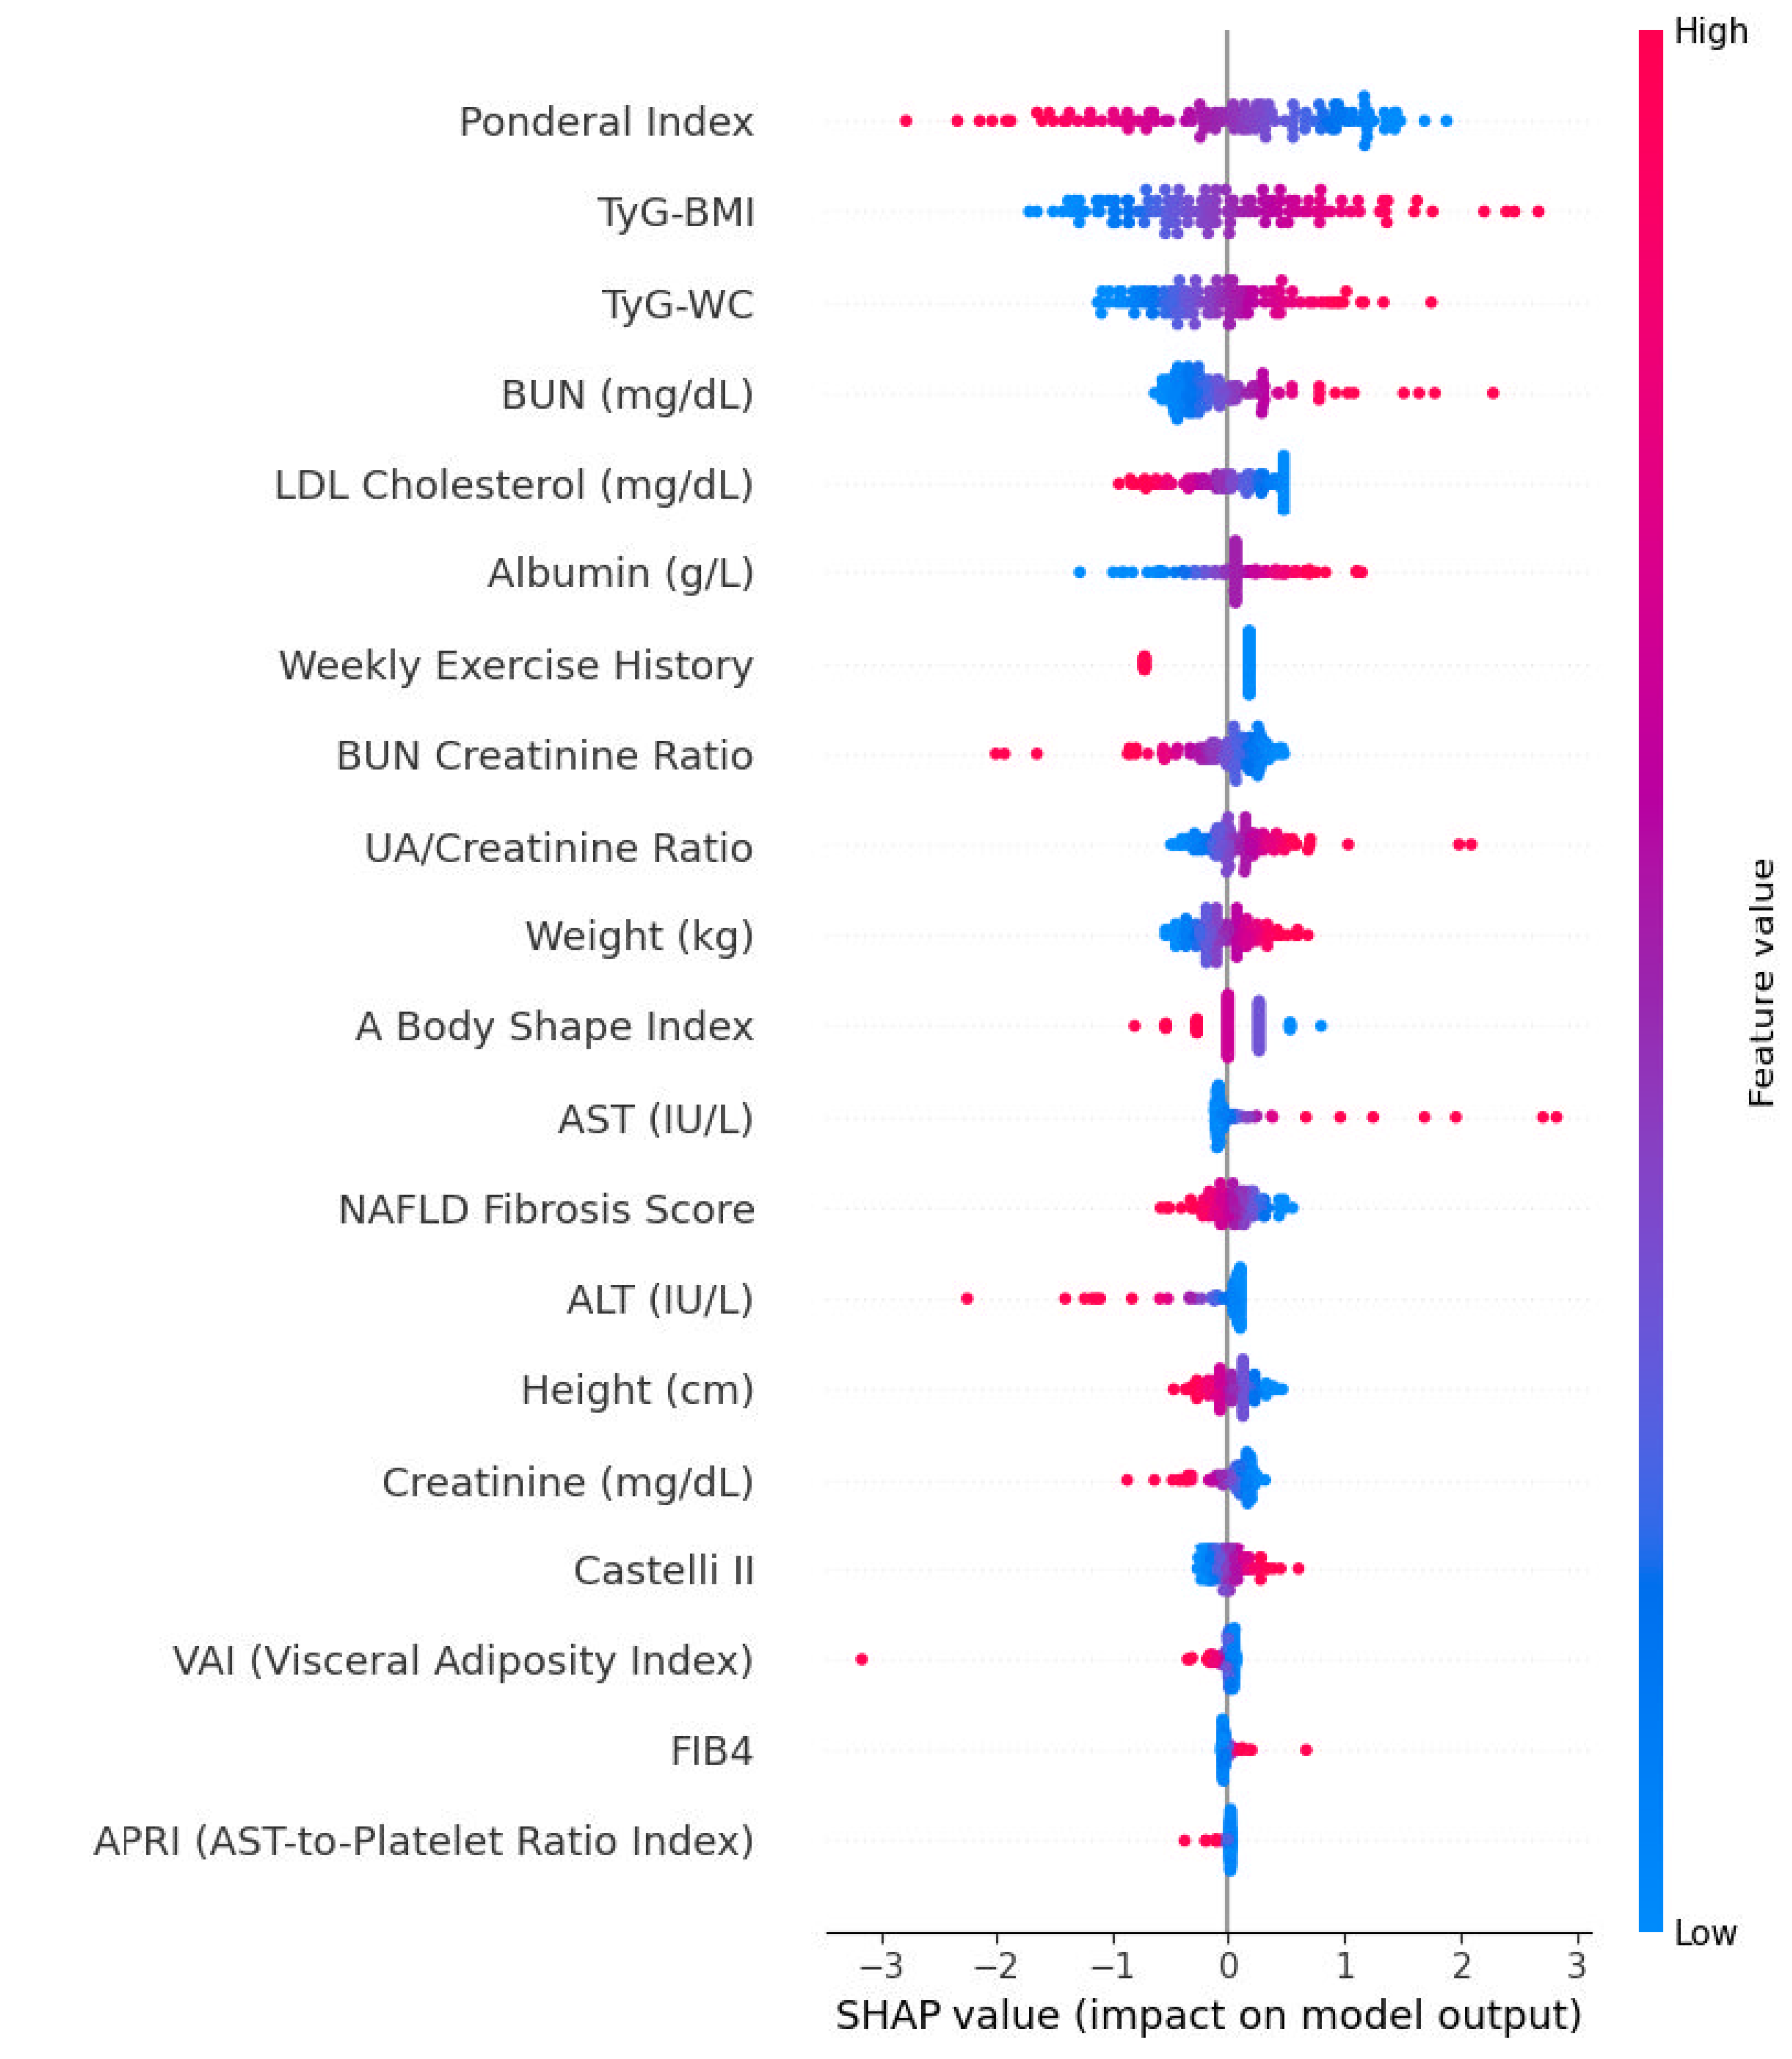
Background/Objectives: Metabolic dysfunction–associated steatotic liver disease (MASLD) is now the leading cause of chronic liver disease globally, mirroring the increasing prevalence of obesity, insulin resistance, and type 2 diabetes. Early detection of hepatic steatosis is vital for cardiometabolic risk assessment; however, conventional imaging is costly and impractical for population screening. This study aimed to develop interpretable machine-learning models to predict ultrasound-detected MASLD using routinely available clinical and biochemical data. Methods: We analyzed data from 644 adults (50% with MASLD on ultrasonography). Preprocessing, imputation, and feature selection were implemented within a single scikit-learn pipeline to avoid information leakage. An Elastic Net–regularized logistic regression identified the top 20 predictors, which were subsequently used across nine supervised machine learning (ML) classifiers. Model performance was evaluated via repeated stratified 5-fold cross-validation (25 resamples) using accuracy, F1 score, sensitivity, specificity, Youden’s J, balanced accuracy, and Area Under the Receiver Operating Characteristic Curve (AUROC). Interpretability was assessed using SHapley Additive exPlanations (SHAP). Results: Participants with MASLD exhibited greater adiposity, insulin resistance, and dyslipidemia compared with controls [p < 0.05 for body mass index (BMI), waist circumference, glucose, HbA1c, triglycerides). Elastic Net selection highlighted Weight, Ponderal Index, Fibrosis-4 Index (FIB-4), blood urea nitrogen (BUN)/Creatinine ratio, Aspartate Aminotransferase to Platelet Ratio Index (APRI), and Visceral Adiposity Index as the strongest predictors. Logistic Regression and Gradient Boosting achieved the best performance (accuracy = 0.65 ± 0.03; AUROC = 0.71 ± 0.04; balanced accuracy = 0.66 ± 0.06), outperforming rule-based indices such as Fatty Liver Index (FLI) and Hepatic Steatosis Index (HSI) reported in the literature. SHAP analysis confirmed clinically coherent feature effects, with higher anthropometric and hepatic injury indices increasing predicted MASLD probability. Conclusions: Routinely available clinical and biochemical parameters can predict hepatic steatosis with moderate accuracy using transparent, interpretable ML models. Logistic Regression and Gradient Boosting provided the best discrimination and generalizability, offering a pragmatic, low-cost approach for early MASLD screening in primary and metabolic care settings.

Keywords: 
;  ;  ;  ;  

1. Introduction

Metabolic dysfunction–associated steatotic liver disease (MASLD) is the leading cause of chronic liver disease globally, a trend that closely parallels the escalating prevalence of obesity, insulin resistance, and type 2 diabetes [1,2]. The defining early lesion is hepatic steatosis, which is not only a harbinger of steatohepatitis and fibrosis but also a marker of heightened cardiometabolic risk [3,4]. Timely, scalable detection of steatosis is therefore essential for risk stratification, targeted lifestyle counseling, and allocation of imaging and specialty care resources.
Conventional diagnostic pathways depend on imaging [ultrasound, CAP (Controlled Attenuation Parameter), Magnetic Resonance Imaging–Proton Density Fat Fraction (MRI-PDFF)] or, less commonly, liver biopsy [5,6]. While accurate, these approaches can be costly, operator dependent, or invasive, limiting their utility for large-scale screening and routine follow-up. Simple clinical scores such as fatty liver index (FLI) and hepatic steatosis index (HSI) offer low-cost alternatives but may underperform across diverse populations and often fail to capture nonlinear interactions among commonly available variables [7,8].
Routinely collected clinical and laboratory parameters—anthropometrics, vital signs, glycemic indices, lipid profile, and liver enzymes, encode rich information about hepatic fat accumulation. Modern machine learning methods can exploit these multidimensional signals to deliver non-invasive, low-barrier prediction tools that integrate seamlessly into primary and metabolic care [6,9,10,11,12].
In this study, we aimed to detect hepatic steatosis using only clinical and laboratory parameters. We developed and validated machine learning models across multiple algorithms, quantified discrimination and calibration, and explored clinical utility across actionable decision thresholds. To support interpretability and adoption, we analyzed feature importance and individual-level explanations. Our goal is a pragmatic, scalable approach that complements imaging, enabling earlier identification of at-risk patients while minimizing reliance on costly or invasive testing.

2. Methods

2.1. Study Design and Modeling

In this study, we aimed to predict the presence of MASLD on ultrasonography using supervised machine-learning (ML) algorithms applied to routinely collected clinical, anthropometric, and biochemical variables. The study protocol was reviewed and approved by the Scientific Research Evaluation and Ethics Committee of Ankara Etlik City Hospital, Ankara, Türkiye (Approval Date and ID: 22.10.2025, AEŞH-BADEK-2025-590). The target was ultrasound-detected hepatic steatosis (present/absent); records with missing outcome were excluded. All analyses were performed in Python 3.11.5 with standard scientific libraries, including pandas (v2.1.1) for data manipulation, numpy (v1.26.0) for numerical computations, scikit-learn (v1.3.1) for model development and evaluation, matplotlib (v3.8.0) for visualization, and xgboost/shap for gradient boosting and explainability, respectively.

2.2. Preprocessing and Feature Selection (Single Pipeline)

To prevent information leakage, all preprocessing and feature selection were implemented within a single scikit-learn pipeline and executed inside the cross-validation loop. Numeric variables were median-imputed and standardized to z-scores; categorical variables were mode-imputed and one-hot encoded with unknown levels ignored at transform time. Feature selection used logistic regression with an Elastic Net penalty [Stochastic Average Gradient Augmented (SAGA) solver], combining L1 for sparsity and L2 for stability under collinearity. A predictor (or one-hot level) was considered selected if its coefficient was non-zero after regularization. Because one-hot encoding yields multiple columns per original variable, variable-level importance was summarized as the L2 norm of all associated coefficients (across levels, and across classes if applicable). Variables were ranked by this aggregated importance, and the top 20 variables were fixed a priori as the feature panel for subsequent modeling and evaluation.

2.3. Data Splitting and Resampling

To obtain an unbiased estimate of performance, patients were randomly and stratifiedly allocated into training (80%; n=515) and test (20%; n=129) sets, preserving the class distribution of MASLD vs. non-MASLD. The same train–test partition was applied across all algorithms for comparability. Within the training data, we used repeated stratified k-fold cross-validation with 5 folds and 5 repetitions (total 25 resamples; fixed random seed) to benchmark candidate models. At each fold, the full pipeline (imputation → encoding/standardization → Elastic-Net selection → classifier) was fitted on the training split and assessed on the held-out split.

2.4. Classifiers

Evaluated classifiers included decision tree, AdaBoost [base estimator: decision tree; Stagewise Additive Modeling using a Multiclass Exponential loss function (SAMME)], random forest, XGBoost (eval_metric = logloss), gradient boosting, support vector machine with probability estimates enabled, k-nearest neighbors, multilayer perceptron (maximum iterations = 5000), Gaussian naïve Bayes, and logistic regression (maximum iterations = 2000). For algorithms without native probability outputs, decision-function scores were used for Receiver Operating Characteristic (ROC) analyses.

2.5. Evaluation Metrics and Interpretability

Predictive performance was summarized using accuracy, sensitivity (recall), specificity, positive and negative predictive values (PPV/NPV), F1 score, Youden’s J index, balanced accuracy, and area under the receiver operating characteristic curve (AUROC). Receiver-operating-characteristic curves were generated to visualize diagnostic discrimination. For each algorithm, results are reported as mean ± standard deviation across the 25 resamples to enable robust, distribution-aware comparisons. For interpretability, we additionally fitted a logistic-regression model (solver = liblinear) on standardized predictors and applied SHapley Additive exPlanations (SHAP; LinearExplainer) to quantify feature contributions, highlighting clinical variables with consistently high impact on MASLD prediction.

3. Results

3.1. Baseline Characteristics

Baseline demographic, anthropometric, clinical, and biochemical characteristics of participants according to hepatic steatosis status are summarized in Table 1. Among 644 individuals, 322 (50%) had ultrasound-detected hepatic steatosis (MASLD) and 322 (50%) had normal liver echogenicity.
Participants with MASLD were younger on average (59.8 ± 16.0 vs. 62.4 ± 19.1 years, p = 0.004). Sex distribution and educational status were comparable between groups (p > 0.05). Anthropometric measures revealed substantial differences: individuals with hepatic steatosis exhibited greater body weight (79.8 ± 18.2 vs. 70.4 ± 14.6 kg, p < 0.001), higher body mass index (BMI) (29.0 ± 6.6 vs. 26.2 ± 5.8 kg/m², p < 0.001), and larger waist circumference (95.7 ± 18.2 vs. 87.7 ± 17.2 cm, p < 0.001). They were also slightly taller (165.9 ± 10.0 vs. 164.2 ± 10.2 cm, p = 0.043). Regular weekly exercise was significantly less frequent in the MASLD group (13.7% vs. 22.1%, p = 0.005).
Hemodynamic parameters showed modest but significant elevations in the MASLD cohort: systolic blood pressure (126.6 ± 17.3 vs. 124.3 ± 16.1 mmHg, p = 0.026), diastolic blood pressure (75.2 ± 11.1 vs. 72.6 ± 9.7 mmHg, p < 0.001), and heart rate (82.7 ± 13.2 vs. 80.4 ± 12.9 bpm, p = 0.031).
Regarding comorbidities, diabetes mellitus (51.2% vs. 36.0%, p < 0.001) and dyslipidemia (32.0% vs. 18.3%, p < 0.001) were significantly more prevalent in the MASLD group, while hypertension and cardiovascular diseases did not differ significantly. Obstructive sleep apnea was more common among MASLD participants (1.6% vs. 0%, p = 0.025). Medication use paralleled disease prevalence: metformin (25.8% vs. 12.4%, p < 0.001), SGLT2 inhibitors (14.0% vs. 8.1%, p = 0.017), and statins (20.2% vs. 12.1%, p = 0.005) were all used more frequently in MASLD.
Hematologic evaluation showed slightly higher hemoglobin levels (11.8 ± 2.6 vs. 11.1 ± 2.6 g/dL, p < 0.001) and modestly lower lymphocyte counts (p = 0.004) in the MASLD group, whereas other cell counts were comparable.
Biochemically, participants with MASLD had a more adverse metabolic profile characterized by higher fasting glucose (144.5 ± 81.2 vs. 126.1 ± 63.3 mg/dL, p < 0.001), HbA1c (7.11 ± 2.78 vs. 6.51 ± 2.34%, p < 0.001), and triglycerides (170.9 ± 116.7 vs. 134.4 ± 153.6 mg/dL, p < 0.001). Total cholesterol was slightly higher (p = 0.039), while low-density lipoprotein (LDL) and high-density lipoprotein (HDL) cholesterol did not differ significantly.
Liver enzymes were numerically elevated in the steatosis group, with alanine aminotransferase (ALT) showing a statistically significant increase (p < 0.001). Albumin was higher in MASLD (37.7 ± 4.6 vs. 36.0 ± 5.1 g/L, p < 0.001), while bilirubin fractions, blood urea nitrogen (BUN), creatinine, estimated glomerular filtration rate (eGFR), and thyroid indices were comparable (p > 0.05).
Overall, participants with hepatic steatosis exhibited greater adiposity, insulin resistance, metabolic derangements, and slightly elevated hepatic transaminases, consistent with the expected metabolic dysfunction–associated phenotype of MASLD (Table 1). Derived anthropometric and metabolic indices encompassing adiposity, cardiovascular, hepatic, hematologic, and renal markers are summarized in Table 2.

3.2. Model Development and Evaluation

We trained and evaluated multiple supervised classifiers to discriminate ultrasound-detected MASLD from non-MASLD using routinely collected clinical, anthropometric, and biochemical variables. Model performance was assessed using repeated stratified cross-validation and summarized by accuracy, sensitivity, specificity, predictive values, F1 score, Youden’s J, balanced accuracy, and AUROC (Table 3).

3.3. Elastic Net–Based Variable Selection

The Elastic Net procedure converged and produced a sparse solution, shrinking many coefficients to zero while retaining a compact set of informative predictors. To avoid information leakage, preprocessing and selection were implemented inside a single scikit-learn pipeline during cross-validation. Numeric variables were median-imputed and standardized (z-score); categorical variables were mode-imputed and one-hot encoded with unknown levels ignored at transform time. Predictors (or one-hot levels) with non-zero coefficients after regularization were considered selected. Because one-hot encoding yields multiple columns per original variable, variable-level importance was summarized as the L2 norm of all associated coefficients (across levels, and classes if applicable).
Based on aggregated variable-level importance, the top 20 variables associated with ultrasound-detected hepatic steatosis were (in descending order of aggregated importance): Weight (kg), Ponderal Index, Fibrosis-4 Index (FIB-4), BUN/Creatinine Ratio, Height (cm), aspartate aminotransferase (AST) (AST)-to-Platelet Ratio Index (APRI), Castelli II, VAI (Visceral Adiposity Index), LDL Cholesterol (mg/dL), Triglyceride–glucose index adjusted for waist circumference (TyG-WC), uric acid (UA)/Creatinine Ratio, BUN (mg/dL), Nonalcoholic Fatty Liver Disease (NAFLD) Fibrosis Score, Albumin (g/L), AST (IU/L), Triglyceride–glucose index adjusted for BMI (TyG-BMI) , ALT (IU/L), Weekly Exercise History, Creatinine (mg/dL), and A Body Shape Index (ABSI). These variables appear in descending aggregated importance in Supplementary Figure 1, while encoded-level effects (e.g., per one-hot level) are summarized in Supplementary Figure 2. In the logistic framework, positive coefficients indicate higher log-odds of hepatic steatosis and negative coefficients indicate lower log-odds. This feature-selection step establishes a fixed 20-variable panel for all subsequent model development and reporting.

3.4. Accuracy

Overall accuracy was moderate. The highest mean accuracies were observed for Logistic Regression and Gradient Boosting (each 0.65 ± 0.03), followed by Random Forest and Support Vector Machine (SVM)/XGBoost (≈ 0.63 ± 0.03–0.04). Lower-tier models achieved ≤ 0.61 on average Multilayer Perceptron (MLP) 0.61 ± 0.04; k-NN 0.59 ± 0.03; Decision Tree 0.58 ± 0.04; Naïve Bayes 0.58 ± 0.06; AdaBoost 0.57 ± 0.04). Thus, Logistic Regression and Gradient Boosting were the most accurate learners.

3.5. F1 Score

F1 scores mirrored accuracy: Logistic Regression and Gradient Boosting led with 0.65 ± 0.04, while Random Forest/XGBoost were slightly lower (≈ 0.62 ± 0.03–0.04). SVM/MLP were around 0.60 ± 0.04; k-NN 0.59 ± 0.04, Decision Tree 0.58 ± 0.05, Naïve Bayes 0.59 ± 0.11, and AdaBoost 0.57 ± 0.05. Hence, Logistic Regression and Gradient Boosting achieved the best precision–recall balance.

3.6. Sensitivity

Mean sensitivity was highest for Gradient Boosting (0.65 ± 0.06) and Logistic Regression (0.64 ± 0.06). Naïve Bayes reached a similar mean (0.65 ± 0.20) but with very wide dispersion, indicating instability. SVM traded sensitivity (0.57 ± 0.04) for higher specificity (see below).

3.7. Specificity

Specificity peaked with SVM (0.69 ± 0.06), followed by Random Forest (0.67 ± 0.05) and Logistic Regression (0.67 ± 0.06). Gradient Boosting yielded 0.65 ± 0.06. Thus, the most conservative false-positive control was achieved by SVM.

3.8. Youden’s J

Youden’s J was highest for Logistic Regression and Gradient Boosting (each 0.30 ± 0.07), then Random Forest (0.27 ± 0.07), and SVM/XGBoost (≈ 0.25 ± 0.06–0.07). Lower-tier models were ≤ 0.21 (e.g., MLP 0.21 ± 0.07; k-NN 0.18 ± 0.07; Decision Tree 0.16 ± 0.08; Naïve Bayes 0.15 ± 0.12; AdaBoost 0.15 ± 0.08). Accordingly, Logistic Regression and Gradient Boosting maximized the sensitivity–specificity composite.

3.9. AUROC

Mean AUROC was highest for Logistic Regression (0.71 ± 0.04), followed by Random Forest (0.69 ± 0.04), Gradient Boosting (0.68 ± 0.04), SVM (0.68 ± 0.04), and XGBoost (0.67 ± 0.03). Remaining models were ≤ 0.65 (MLP 0.65 ± 0.03, Naïve Bayes 0.63 ± 0.06, k-NN 0.62 ± 0.04, Decision Tree 0.58 ± 0.04, AdaBoost 0.57 ± 0.04).

3.10. Balanced Accuracy

Balanced accuracy corroborated the above: Logistic Regression (0.66 ± 0.06) and Gradient Boosting (0.65 ± 0.06) led, with Random Forest (0.64 ± 0.04), SVM (0.63 ± 0.05), and XGBoost (0.62 ± 0.06) close behind; other models were ≤ 0.60.

3.11. ROC Visualization

Mean ROC curves (Figure 1) showed a reproducible lift above chance for the top-tier models, consistent with their AUROC ranking in Table 3. Upper-envelope curves corresponded to Logistic Regression, Random Forest, Gradient Boosting, SVM, and XGBoost. (Figure 1; Table 3)

3.12. Predictive Values (PPV/NPV)

PPV/NPV reflected each model’s sensitivity–specificity balance. For example, Logistic Regression achieved PPV 0.66 ± 0.04 and NPV 0.65 ± 0.03, while SVM showed PPV 0.65 ± 0.05 with lower NPV (0.61 ± 0.03) owing to its specificity-oriented profile. Random Forest and Gradient Boosting remained in the mid-0.60s for both indices. Hence, Logistic Regression and Gradient Boosting offered the most balanced predictive value profiles among top performers (Table 3).

3.13. SHAP Summaries and Directionality

To elucidate model behavior, we computed SHAP summary plots from a logistic-regression explainer fitted on standardized predictors (Figure 3). The global importance profile showed a right-skewed distribution, indicating that a compact subset of the selected variables accounts for most of the predictive signal. The direction of effects was clinically coherent: features with higher SHAP magnitudes systematically increased (positive SHAP) or decreased (negative SHAP) the predicted probability of MASLD in line with their regularized coefficients. Local (beeswarm) patterns revealed heterogeneous but directionally stable effects across individuals, with no single feature exerting idiosyncratic influence limited to a narrow subgroup. Collectively, the Elastic Net ranking and SHAP attributions were concordant, reinforcing that the model relies on interpretable, routinely available parameters, and supporting the plausibility and generalizability of observed discrimination.

4. Discussion

MASLD has emerged as the most prevalent chronic liver condition worldwide, paralleling the global rise in obesity, type 2 diabetes, and metabolic syndrome. Early identification of individuals at risk is critical, yet conventional diagnostic modalities such as ultrasonography, CAP, or MRI-PDFF remain costly, operator dependent, and impractical for population-level screening [13, 14]. In this study, we developed and validated ML models leveraging routine clinical and biochemical parameters to predict ultrasound-detected hepatic steatosis. Among evaluated algorithms, Logistic Regression and Gradient Boosting achieved the highest performance, with AUROC 0.70 and balanced accuracy 0.65, outperforming traditional rule-based indices such as the FLI and HSI, whose reported AUROC values typically range between 0.62–0.68 in external validations [7, 9, 15, 16].
The comparable performance of Logistic Regression and Gradient Boosting suggests that the relationships between predictors and hepatic fat accumulation, while potentially nonlinear, are largely captured by additive or weakly interacting effects. The modest yet consistent AUROC (0.70) aligns with recent ML-based steatosis prediction studies that also relied on non-imaging clinical data [17]. For example, Cubillos et al. showed that a novel deep learning (DL) approach, which converts tabular clinical data into image-like representations, outperformed traditional machine learning models and the HSI for predicting steatotic liver disease (SLD). Using data from 2,999 patients, their best DL model achieved high diagnostic accuracy (AUC = 0.87, sensitivity = 0.95, specificity = 0.64), demonstrating the superior predictive capability of DL-based methods for non-invasive SLD detection [18]. Lim et al. developed and validated machine learning–based survival models to predict the time to onset of MASLD in individuals without baseline disease. Using data from over 25,000 Korean participants for model development and 16,000 Chinese participants for independent validation, they trained random survival forest and extra survival tree models based on routine clinical and laboratory variables. Both models demonstrated strong predictive performance, with c-indices around 0.75 in the external cohort. The study showed that ML survival models can accurately estimate individualized risk and timing of MASLD onset, supporting personalized prediction and tailored follow-up strategies in clinical practice [19]. Our findings extend these observations by demonstrating model reproducibility across multiple algorithms and providing rigorous cross-validation estimates with embedded feature selection, thereby mitigating overfitting and information leakage.
Elastic Net regularization identified a concise set of 20 predictors reflecting both metabolic and hepatic injury pathways. Anthropometric indices (Weight, Ponderal Index, Height, A Body Shape Index) captured central and overall adiposity, consistent with the pivotal role of excess fat mass in hepatic lipid deposition [20, 21]. Derived composite indices such as VAI, TyG-BMI, and TyG-WC integrate dyslipidemia and insulin resistance and are increasingly recognized as robust surrogates for visceral adiposity and hepatic steatosis [22, 23].
Liver injury markers including ALT, AST, and fibrosis surrogates (FIB-4, APRI, NAFLD Fibrosis Score) contributed substantially, underscoring the continuum between metabolic steatosis and early fibrotic remodeling [24-26]. Renal and nitrogenous markers (BUN, Creatinine, BUN/Creatinine ratio, UA/Creatinine ratio) emerged as informative correlates—an observation supported by emerging data linking hyperuricemia and renal-hepatic axis dysfunction to steatosis and metabolic syndrome progression [27, 28]. The inclusion of Castelli II index (LDL/HDL ratio) and albumin further reflects the interplay between lipid transport, synthetic function, and systemic inflammation [29, 30].
Our model’s discrimination compares favorably with prior ML frameworks for MASLD screening using routine data. Peng et al. developed and validated five machine learning models; logistic regression, random forest, XGBoost, gradient boosting, and SVM, to predict MASLD using clinical and biochemical variables. In a cohort of 578 ultrasound-evaluated participants and an external MRI-based validation set (n = 131), key predictors included visceral adiposity index, abdominal circumference, BMI, ALT, ALT/AST ratio, age, HDL-C, and triglycerides. Among the models, XGBoost achieved the highest predictive accuracy (AUC = 0.94 after tuning), outperforming others. The authors concluded that XGBoost offers a reliable, noninvasive tool for early identification of high-risk NAFLD patients in clinical settings [31]. Verschuren et al. developed a mechanism-based, non-invasive biomarker panel to detect fibrosis in MASLD [32]. Using a translational approach that integrated findings from a diet-induced MASLD mouse model with human liver transcriptomics and serum proteomics, they identified three key biomarkers; Insulin-Like Growth Factor Binding Protein 7 (IGFBP7), Scavenger Receptor Cysteine-Rich Type 5 Domain-Containing Protein (SSc5D), and Semaphorin 4D (Sema4D). When modeled using Light Gradient Boosting Machine (LightGBM), this panel accurately predicted fibrosis stages (AUCs: 0.82 for F0/F1, 0.89 for F2, 0.87 for F3/F4), outperforming established markers such as FIB-4, APRI, and FibroScan. The findings demonstrate that this three-protein blood-based panel can reliably identify both mild and advanced MASLD fibrosis, offering a promising non-invasive diagnostic tool. Most published models converge around moderate discrimination (AUROC 0.68–0.75), reflecting both the intrinsic overlap between healthy and metabolically dysregulated individuals and the absence of imaging-derived features [33]. Importantly, our pipeline’s strict cross-validation and embedded preprocessing design enhance external generalizability and minimize optimistic bias, a limitation in earlier single-split studies [21].
Interpretability remains central to the translation of ML tools into clinical workflows. SHAP analysis confirmed that model decisions were biologically plausible and aligned with established MASLD pathophysiology [34]. Higher weight, VAI, TyG-BMI, and FIB-4 consistently increased predicted risk, while higher albumin and lower creatinine were protective. The concordance between Elastic Net coefficients and SHAP attributions reinforces model transparency and trustworthiness. Such interpretability facilitates clinician acceptance and supports integration into electronic health record (EHR)–based decision support systems, allowing automated, low-cost pre-screening for individuals warranting confirmatory imaging or lifestyle intervention.
From a public health perspective, scalable ML models based solely on routine clinical and biochemical data offer a pragmatic path toward early MASLD identification in primary care. They can augment conventional scores by incorporating complex, multidimensional patterns without requiring novel biomarkers or imaging. Future work should focus on external validation across diverse ethnic groups and healthcare systems, incorporation of longitudinal data to predict disease progression such as fibrosis development, and integration of genetic and metabolomic predictors for enhanced precision [35, 36].
Our study’s limitations include reliance on ultrasound as the reference standard, which, while widely available, may underestimate mild steatosis and is operator dependent. The moderate sample size limits the exploration of rare interactions, and absence of external validation constrains generalizability. Nonetheless, the consistent cross-validation performance, coherent biological directionality, and robustness across classifiers support the reliability of the findings.
In conclusion, we developed interpretable machine-learning models capable of detecting ultrasound-defined MASLD using only routinely collected clinical and biochemical parameters. Logistic Regression and Gradient Boosting achieved the best discrimination and calibration, with transparent feature importance aligning with known metabolic and hepatic pathways. This pragmatic, data-driven approach may support early risk stratification and targeted allocation of imaging or specialist resources, complementing—not replacing—existing diagnostic pathways.

Author Contributions

Conceptualization, C.A., G.S., A.S., M.G., F.C. and S.K.; methodology, C.A., G.S., A.S., M.G., F.C. and S.K.; software, C.A., G.S. and A.S.; validation, C.A., G.S., A.S., M.G., F.C. and S.K.; formal analysis, C.A., G.S., A.S., M.G., F.C. and S.K.; investigation, C.A., G.S., A.S., M.G., F.C., and S.K.; resources, C.A., M.G., F.C., and S.K.; data curation, G.A. and A.S.; writing—original draft preparation, C.A., G.A., and A.S.; writing—review and editing, C.A., G.A., A.S., M.G., F.C., and S.K.; visualization, G.S., and A.S.; supervision, C.A., G.S., and A.S.; project administration, C.A., G.S., A.S.,M.G., F.C., and S.K.; funding acquisition, None. All authors have read and agreed to the published version of the manuscript.

Funding

This research received no external funding.

Institutional Review Board Statement

The study protocol was reviewed and approved by the Scientific Research Evaluation and Ethics Committee of Ankara Etlik City Hospital, Ankara, Türkiye (Approval Date and ID: 22.10.2025, AEŞH-BADEK-2025-590).

Informed Consent Statement

Informed consent for participation was obtained from all subjects involved in the study.

Data Availability Statement

The data presented in this study are available on reasonable request from the corresponding author due to ethical and institutional restrictions.

Conflicts of Interest

The authors declare no conflicts of interest.

Abbreviations

The following abbreviations are used in this manuscript:
MASLD
Metabolic dysfunction–associated steatotic liver disease
ML
Machine learning
CAP = Controlled Attenuation Parameter
MRI-PDFF = Magnetic Resonance Imaging–Proton Density Fat Fraction
AUROC = Area Under the Receiver Operating Characteristic Curve
SHAP = Shapley Additive Explanations
BMI = Body Mass Index
FIB-4 = Fibrosis-4 Index
BUN = Blood Urea Nitrogen
APRI = Aspartate Aminotransferase to Platelet Ratio Index
FLI = Fatty Liver Index
HSI = Hepatic Steatosis Index
SAGA = Stochastic Average Gradient Augmented
SAMME = Stagewise Additive Modeling using a Multiclass Exponential loss function
ROC = Receiver Operating Characteristic
PPV = Positive predictive values
NPV = Negative predictive values
LDL = Low-Density Lipoprotein
HDL = High-Density Lipoprotein
eGFR = estimated glomerular filtration rate
AST = Aspartat aminotransferaz
ALT = Alanine Aminotransferase
ABSI = A Body Shape Index
NAFLD = Nonalcoholic Fatty Liver Disease
UA = Uric Acid
WC = Waist Circumference
VAI = Visceral Adiposity Index
TyG-WC = Triglyceride–glucose index adjusted for waist circumference
TyG-BMI = Triglyceride–glucose index adjusted for BMI
SVM = Support Vector Machine
MLP = Multilayer Perceptron
DL = Deep learning
SLD = Steatotic Liver Disease
IGFBP7 = Insulin-Like Growth Factor Binding Protein 7
SSc5D = Scavenger Receptor Cysteine-Rich Type 5 Domain-Containing Protein
Sema4D = Semaphorin 4D
LightGBM = Light Gradient Boosting Machine
EHR = Electronic health record

References

  1. Chan, W. , et al., Metabolic Dysfunction-Associated Steatotic Liver Disease (MASLD): A State-of-the-Art Review. JOURNAL OF OBESITY & METABOLIC SYNDROME, 2023. 32(3): p. 197-213.
  2. Li, Y. , et al., Updated mechanisms of MASLD pathogenesis. LIPIDS IN HEALTH AND DISEASE, 2024. 23(1).
  3. Hong, S. , et al., From NAFLD to MASLD: When metabolic comorbidity matters. ANNALS OF HEPATOLOGY, 2024. 29(2).
  4. Zazueta, A. , et al., Alteration of Gut Microbiota Composition in the Progression of Liver Damage in Patients with Metabolic Dysfunction-Associated Steatotic Liver Disease (MASLD). INTERNATIONAL JOURNAL OF MOLECULAR SCIENCES, 2024. 25(8).
  5. Fan, J. , et al., Guideline for the Prevention and Treatment of Metabolic Dysfunction-associated Fatty Liver Disease (Version 2024). JOURNAL OF CLINICAL AND TRANSLATIONAL HEPATOLOGY, 2024. 12(11): p. 955-974.
  6. Lu, H. , et al., Identification of hub gene for the pathogenic mechanism and diagnosis of MASLD by enhanced bioinformatics analysis and machine learning. PLOS ONE, 2025. 20(5).
  7. DiBattista, J. , et al., Accuracy of Non-invasive Indices for Diagnosing Hepatic Steatosis Compared to Imaging in a Real-World Cohort. DIGESTIVE DISEASES AND SCIENCES, 2022. 67(11): p. 5300-5308.
  8. Wu, J. , et al., Population-specific cut-off points of fatty liver index for the diagnosis of hepatic steatosis. JOURNAL OF HEPATOLOGY, 2021. 75(3): p. 726-728.
  9. Su, P. , et al., Comparison of Machine Learning Models and the Fatty Liver Index in Predicting Lean Fatty Liver. DIAGNOSTICS, 2023. 13(8).
  10. Frey, L. , et al., Use of machine learning for early prediction of short-term mortality in veterans with metabolic dysfunction-associated steatotic liver disease. PLOS ONE, 2025. 20(10).
  11. Chen, H. , et al., Development and validation of machine learning models for MASLD: based on multiple potential screening indicators. FRONTIERS IN ENDOCRINOLOGY, 2025. 15.
  12. Soliman, R., A. Helmy, and G. Shiha, Precision in Diagnosis of Liver Fibrosis in MASLD: Machine Learning-Based Scores May Be More Accurate Than Conventional NITs. LIVER INTERNATIONAL, 2025. 45(4).
  13. Huang, D., H. El-Serag, and R. Loomba, Global epidemiology of NAFLD-related HCC: trends, predictions, risk factors and prevention. NATURE REVIEWS GASTROENTEROLOGY & HEPATOLOGY, 2021. 18(4): p. 223-238.
  14. Lazarus, J. , et al., A global action agenda for turning the tide on fatty liver disease. HEPATOLOGY, 2024. 79(2): p. 502-523.
  15. Bedogni, G. , et al., The Fatty Liver Index: a simple and accurate predictor of hepatic steatosis in the general population. BMC GASTROENTEROLOGY, 2006. 6.
  16. Alqahtani, S. , et al., Identification and Characterization of Cefazolin-Induced Liver Injury. CLINICAL GASTROENTEROLOGY AND HEPATOLOGY, 2015. 13(7): p. 1328-+.
  17. Daghestani, M. , et al., Adverse Effects of Selected Markers on the Metabolic and Endocrine Profiles of Obese Women With and Without PCOS. FRONTIERS IN ENDOCRINOLOGY, 2021. 12.
  18. Cubillos, G. , et al., Development of a novel deep learning method that transforms tabular input variables into images for the prediction of SLD. SCIENTIFIC REPORTS, 2025. 15(1).
  19. Lim, D. , et al., Use of Machine Learning to Predict Onset of NAFLD in an All-Comers Cohort-Development and Validation in 2 Large Asian Cohorts. GASTRO HEP ADVANCES, 2024. 3(7): p. 1005-1011.
  20. Fabbrini, E., S. Sullivan, and S. Klein, Obesity and Nonalcoholic Fatty Liver Disease: Biochemical, Metabolic, and Clinical Implications. HEPATOLOGY, 2010. 51(2): p. 679-689.
  21. Demirci, S. and S. Sezer, Fatty Liver Index vs. Biochemical-Anthropometric Indices: Diagnosing Metabolic Dysfunction-Associated Steatotic Liver Disease with Non-Invasive Tools. DIAGNOSTICS, 2025. 15(5).
  22. Qian, X. , et al., Value of triglyceride glucose-body mass index in predicting nonalcoholic fatty liver disease in individuals with type 2 diabetes mellitus. FRONTIERS IN ENDOCRINOLOGY, 2025. 15.
  23. Sheng, G. , et al., The usefulness of obesity and lipid-related indices to predict the presence of Non-alcoholic fatty liver disease. LIPIDS IN HEALTH AND DISEASE, 2021. 20(1).
  24. Xuan, Y. , et al., Elevated ALT/AST ratio as a marker for NAFLD risk and severity: insights from a cross-sectional analysis in the United States. FRONTIERS IN ENDOCRINOLOGY, 2024. 15.
  25. Rigor, J. , et al., Noninvasive fibrosis tools in NAFLD: validation of APRI, BARD, FIB-4, NAFLD fibrosis score, and Hepamet fibrosis score in a Portuguese population. POSTGRADUATE MEDICINE, 2022. 134(4): p. 435-440.
  26. Ouzan, D. , et al., Using the FIB-4, automatically calculated, followed by the ELF test in second line to screen primary care patients for liver disease. SCIENTIFIC REPORTS, 2024. 14(1).
  27. Yang, C. , et al., A Bidirectional Relationship Between Hyperuricemia and Metabolic Dysfunction-Associated Fatty Liver Disease. FRONTIERS IN ENDOCRINOLOGY, 2022. 13.
  28. Francoz, C. , et al., Hepatorenal Syndrome. CLINICAL JOURNAL OF THE AMERICAN SOCIETY OF NEPHROLOGY, 2019. 14(5): p. 774-781.
  29. Bucurica, S. , et al., Exploring the Relationship between Lipid Profile, Inflammatory State and 25-OH Vitamin D Serum Levels in Hospitalized Patients. BIOMEDICINES, 2024. 12(8).
  30. Belalcazar, S. , et al., CONVENTIONAL BIOMARKERS FOR CARDIOVASCULAR RISKS AND THEIR CORRELATION WITH THE CASTELLI RISK INDEX-INDICES AND TG/HDL-C. ARCHIVOS DE MEDICINA, 2020. 20(1): p. 11-22.
  31. Xiao, L. , et al., Development and Validation of Machine Learning-Based Marker for Early Detection and Prognosis Stratification of Nonalcoholic Fatty Liver Disease. ADVANCED SCIENCE, 2025. 12(33).
  32. Verschuren, L. , et al., Development of a novel non-invasive biomarker panel for hepatic fibrosis in MASLD. NATURE COMMUNICATIONS, 2024. 15(1).
  33. Yu, Y. , et al., Predicting metabolic dysfunction associated steatotic liver disease using explainable machine learning methods. SCIENTIFIC REPORTS, 2025. 15(1).
  34. Koliaki, C. , et al., Metabolically Healthy Obesity and Metabolic Dysfunction-Associated Steatotic Liver Disease (MASLD): Navigating the Controversies in Disease Development and Progression. CURRENT OBESITY REPORTS, 2025. 14(1).
  35. Weng, S. , et al., Prediction of Fatty Liver Disease in a Chinese Population Using Machine-Learning Algorithms. DIAGNOSTICS, 2023. 13(6).
  36. Collins, G. , et al., TRIPOD plus AI statement: updated guidance for reporting clinical prediction models that use regression or machine learning methods. BMJ-BRITISH MEDICAL JOURNAL, 2024. 385.
Figure 1. Receiver-operating characteristic (ROC) curves for machine-learning classifiers predicting ultrasound-detected Metabolic Dysfunction–Associated Steatotic Liver Disease (MASLD). Mean ROC curves (solid lines) and standard deviation envelopes (shaded bands) were derived across 25 resamples. Logistic Regression, Gradient Boosting, Random Forest, Support Vector Machine (SVM), and XGBoost demonstrated the highest discriminative performance, with Area Under the Receiver Operating Characteristic Curve (AUROC) values ranging from 0.67–0.71.
Preprints 184207 g001
Figure 2. Elastic Net–based variable selection for Metabolic Dysfunction–Associated Steatotic Liver Disease (MASLD) prediction. Ranked importance of the top 20 variables based on aggregated coefficient L2 norms from the Elastic Net logistic model. Weight, Ponderal Index, Fibrosis Index-4 (FIB-4), and blood urea nitrogen (BUN)/Creatinine ratio emerged as leading predictors, reflecting both metabolic and hepatic injury components.
Preprints 184207 g002
Figure 3. Shapley Additive Explanations (SHAP) summary plot for logistic regression model explaining Metabolic Dysfunction–Associated Steatotic Liver Disease (MASLD) prediction. Each dot represents a SHAP value for a single observation; color indicates variable magnitude (red = high, blue = low). Positive SHAP values increase the predicted probability of MASLD. Key contributors included Weight, Fibrosis-4 Index (FIB-4), and Visceral Adiposity Index (VAI), consistent with established pathophysiological drivers of hepatic fat accumulation.
Preprints 184207 g003
Table 1. Baseline demographic, anthropometric, clinical, and biochemical characteristics of participants according to ultrasonographic hepatic steatosis status.
Features Normal USG Hepatosteatosis in USG p value
Number (%) 322 (50) 322 (50) -
Demographic and Anthropometric Characteristics
Age 62,36 ± 19,12 [60,26 - 64,46] 59,81 ± 15,95 [58,06 - 61,56] 0.004 (mwu)
Sex (Female) 179 (55.59) 170 (52.8) 0.477 (chi2)
Educational Status 57 (17.7) 57 (17.7) 1.0 (chi2)
Smoking 131 (40.68) 144 (44.72) 0.3 (chi2)
Height (cm) 164,19 ± 10,18 [163,08 - 165,31] 165,91 ± 9,98 [164,82 - 167,01] 0.043 (mwu)
Weight (kg) 70,43 ± 14,58 [68,83 - 72,03] 79,82 ± 18,24 [77,82 - 81,82] <0.001 (mwu)
Waist Circumference (cm) 87,71 ± 17,17 [85,83 - 89,59] 95,65 ± 18,24 [93,65 - 97,65] <0.001 (mwu)
Body Mass Index 26,24 ± 5,77 [25,61 - 26,87] 29,02 ± 6,57 [28,3 - 29,74] <0.001 (mwu)
Weekly Exercise History 71 (22,05) 44 (13,66) 0.005 (chi2)
Hemodynamic Parameters
SBP (mmHg) 124,29 ± 16,14 [122,52 – 126,06] 126,64 ± 17,28 [124,75 – 128,54] 0.026 (mwu)
DBP (mmHg) 72,63 ± 9,73 [71,56 – 73,69] 75,15 ± 11,1 [73,93 – 76,37] <0.001 (mwu)
Heart Rate (beats/min) 80,35 ± 12,87 [78,94 – 81,76] 82,67 ± 13,16 [81,23 – 84,11] 0.031 (mwu)
Clinical Comorbidities and Medication Use
Diabetes Mellitus 116 (36,02) 165 (51,24) <0.001 (chi2)
Hypertension 157 (48,76) 175 (54,35) 0.156 (chi2)
Dyslipidemia 59 (18,32) 103 (31,99) <0.001 (chi2)
Atherosclerotic Cardiovascular Disease 73 (22,67) 82 (25,47) 0.407 (chi2)
Cerebrovascular Disease 14 (4,35) 17 (5.28) 0.581 (chi2)
Polycystic Ovary Syndrome (in females) 1 (0.56) 2 (1.18) 0.563 (chi2)
Obstructive Sleep Apnea Syndrome 0 (0) 5 (1.55) 0.025 (chi2)
Metformin Use 40 (12,42) 83 (25,78) <0.001 (chi2)
Pioglitazone Use 3 (0.93) 4 (1.24) 0.704 (chi2)
SGLT2i Use 26 (8,07) 45 (13,98) 0.017 (chi2)
Statin Use 39 (12,11) 65 (20,19) 0.005 (chi2)
Hematologic Parameters
Hemoglobin (g/dL) 11,12 ± 2,56 [10,84 – 11,4] 11,81 ± 2,61 [11,52 – 12,09] <0.001 (t-test)
WBC (10³/µL) 8,41 ± 3,6 [8,01 – 8,8] 8,82 ± 3,52 [8,43 – 9,2] 0.11 (mwu)
Lymphocyte Count (10³/µL) 2,16 ± 3,04 [1,83 – 2,5] 2,1 ± 1,52 [1,93 – 2,27] 0.004 (mwu)
Neutrophil Count (10³/µL) 5,83 ± 3,34 [5,46 – 6,19] 5,96 ± 3,35 [5,59 – 6,33] 0.63 (mwu)
Monocyte Count (10³/µL) 0,74 ± 0,78 [0,66 – 0,83] 0,79 ± 0,84 [0,69 – 0,88] 0.339 (mwu)
Platelet Count (10³/µL) 253,55 ± 113,88 [241,07 – 266,04] 262,55 ± 103,84 [251,16 – 273,93] 0.29 (mwu)
Biochemical Parameters
Fasting Plasma Glucose (mg/dL) 126,06 ± 63,27 [119,12 – 133] 144,47 ± 81,2 [135,57 – 153,37] <0.001 (mwu)
BUN (mg/dL) 28,06 ± 23,42 [25,49 – 30,63] 27,79 ± 23,97 [25,16 – 30,42] 0.71 (mwu)
Creatinine (mg/dL) 1,28 ± 1,08 [1,16 – 1,4] 1,19 ± 0,8 [1,1 – 1,28] 0.658 (mwu)
eGFR (mL/min/1.73 m²) 70,74 ± 34,64 [66,94 – 74,54] 73,12 ± 33,29 [69,47 – 76,77] 0.287 (mwu)
Total Cholesterol (mg/dL) 152,09 ± 52,52 [146,34 – 157,85] 159,67 ± 54,58 [153,69 – 165,66] 0.039 (mwu)
LDL Cholesterol (mg/dL) 91,07 ± 39,71 [86,72 – 95,42] 94,37 ± 40,61 [89,92 – 98,82] 0.271 (mwu)
HDL Cholesterol (mg/dL) 38,64 ± 14,27 [37,07 – 40,2] 37,32 ± 13,71 [35,81 – 38,82] 0.202 (mwu)
Triglycerides (mg/dL) 134,36 ± 153,57 [117,53 – 151,2] 170,91 ± 116,66 [158,12 – 183,7] <0.001 (mwu)
AST (IU/L) 38,76 ± 87,87 [29,13 – 48,4] 43,94 ± 93,24 [33,71 – 54,16] 0.198 (mwu)
ALT (IU/L) 40,6 ± 98,78 [29,77 – 51,43] 39,87 ± 78,22 [31,3 – 48,45] <0.001 (mwu)
GGT (IU/L) 66,91 ± 106,53 [55,23 – 78,59] 88,3 ± 175,22 [69,09 – 107,51] 0.167 (mwu)
HbA1c (%) 6,51 ± 2,34 [6,26 – 6,77] 7,11 ± 2,78 [6,81 – 7,41] <0.001 (mwu)
Albumin (g/L) 36,03 ± 5,05 [35,47 – 36,58] 37,69 ± 4,56 [37,19 – 38,19] <0.001 (mwu)
Direct Bilirubin (mg/dL) 0,3 ± 0,64 [0,23 – 0,37] 0,31 ± 0,56 [0,25 – 0,37] 0.714 (mwu)
Indirect Bilirubin (mg/dL) 0,35 ± 0,27 [0,32 – 0,38] 0,4 ± 0,45 [0,35 – 0,45] 0.488 (mwu)
TSH (mIU/L) 2,02 ± 3,1 [1,68 – 2,36] 2,65 ± 6,72 [1,91 – 3,38] 0.12 (mwu)
Free T4 (ng/dL) 1,26 ± 0,27 [1,23 – 1,29] 1,24 ± 0,23 [1,21 – 1,26] 0.49 (mwu)
Uric Acid (mg/dL) 5,53 ± 2,06 [5,3 – 5,75] 5,75 ± 1,79 [5,55 – 5,94] 0.096 (mwu)
Ferritin (mg/dL) 221,65 ± 251,39 [194,09 – 249,21] 241,63 ± 305,89 [208,1 – 275,17] 0.227 (mwu)
Vitamin B12 (ng/L) 448,49 ± 294,9 [416,16 – 480,82] 445,07 ± 269,07 [415,57 – 474,57] 0.199 (mwu)
Alkaline Phosphatase (IU/L) 111,11 ± 96,62 [100,51 – 121,7] 107,58 ± 92,81 [97,41 - 117,76] 0.561 (mwu)
Abbreviations: MASLD: Metabolic dysfunction–associated steatotic liver disease; USG: Ultrasonography; BMI: Body mass index; SBP: Systolic blood pressure; DBP: Diastolic blood pressure; HR: Heart rate; DM: Diabetes mellitus; HTN: Hypertension; DLP: Dyslipidemia; ASCVD: Atherosclerotic cardiovascular disease; CVD: Cerebrovascular disease; PCOS: Polycystic ovary syndrome; OSA: Obstructive sleep apnea; SGLT2i: Sodium–glucose cotransporter-2 inhibitor; Hb: Hemoglobin; WBC: White blood cell; AST: Aspartate aminotransferase; ALT: Alanine aminotransferase; GGT: Gamma-glutamyl transferase; BUN: Blood urea nitrogen; eGFR: Estimated glomerular filtration rate; LDL-C: Low-density lipoprotein cholesterol; HDL-C: High-density lipoprotein cholesterol; TG: Triglycerides; HbA1c: Glycated hemoglobin; TSH: Thyroid-stimulating hormone; FT4: Free thyroxine; UA: Uric acid; ALP: Alkaline phosphatase; APRI: AST-to-platelet ratio index; FIB-4: Fibrosis-4 index; VAI: Visceral adiposity index; TyG-BMI: Triglyceride-glucose index adjusted for BMI; TyG-WC: Triglyceride-glucose index adjusted for waist circumference; ABSI: A body shape index.
Table 2. Comparison of derived body composition, metabolic, cardiovascular, hepatic, hematologic, and renal indices between participants with and without ultrasonographic hepatic steatosis.
Features Normal USG Hepatosteatosis in USG p value
Number (%) 322 (50) 322 (50) -
Body Composition Indices
Waist-to-Height Ratio 0,54 ± 0,11 [0,52 - 0,55] 0,58 ± 0,11 [0,57 - 0,59] <0.001 (mwu)
A Body Shape Index 0,08 ± 0,01 [0,08 - 0,08] 0,08 ± 0,01 [0,08 - 0,08] 0.074 (mwu)
Body Fat Percentage 35,63 ± 10,98 [34,43 - 36,84] 38,08 ± 11,74 [36,8 - 39,37] 0.006 (t-test)
Ponderal Index 16,13 ± 4,43 [15,65 - 16,62] 17,59 ± 4,39 [17,11 - 18,07] <0.001 (mwu)
Conicity Index 1,23 ± 0,17 [1,21 - 1,25] 1,27 ± 0,16 [1,25 - 1,28] 0,004 (t-test)
Relative Fat Mass 31,84 ± 10,38 [30,7 - 32,97] 34,4 ± 10,04 [33,3 - 35,5] 0.002 (t-test)
Metabolic Indices
Triglyceride-Glucose Index 8,76 ± 0,75 [8,68 - 8,84] 9,14 ± 0,81 [9,05 - 9,22] <0.001 (t-test)
TyG/HDL Ratio 4,73 ± 11,37 [3,49 - 5,98] 5,6 ± 5,85 [4,96 - 6,24] <0.001 (mwu)
AIP (Atherogenic Index of Plasma) 0,12 ± 0,34 [0,09 - 0,16] 0,25 ± 0,33 [0,22 - 0,29] <0.001 (t-test)
LAP (Lipid Accumulation Product) 43,9 ± 84,95 [34,59 - 53,22] 68,88 ± 62,3 [62,05 - 75,71] <0.001 (mwu)
VAI (Visceral Adiposity Index) 3,31 ± 7,41 [2,5 - 4,12] 3,95 ± 4,2 [3,49 - 4,41] <0.001 (mwu)
TyG-BMI 230,16 ± 55,79 [224,05 - 236,28] 266,41 ± 71,26 [258,6 - 274,22] <0.001 (mwu)
TyG-WC 769,58 ± 171 [750,83 - 788,33] 876,31 ± 195 [854,93 - 897,69] <0.001 (t-test)
TyG-WHtR 4,7 ± 1,08 [4,58 - 4,82] 5,29 ± 1,2 [5,16 - 5,42] <0.001 (mwu)
Cardiovascular Indices
Castelli I 4,41 ± 2,68 [4,12 - 4,7] 4,7 ± 2,26 [4,46 - 4,95] 0.004 (mwu)
Castelli II 2,55 ± 1,38 [2,4 - 2,7] 2,75 ± 1,33 [2,6 - 2,89] 0.047 (mwu)
Non-HDL Cholesterol 113,46 ± 49,47 [108,03 - 118,88] 122,36 ± 52,14 [116,64 - 128,07] 0.02 (mwu)
Remnant Cholesterol 22,39 ± 30,81 [19,01 - 25,77] 27,99 ± 26,75 [25,06 - 30,92] <0.001 (mwu)
Pulse Pressure 51,66 ± 12,98 [50,24 - 53,09] 51,49 ± 14,05 [49,95 - 53,03] 0.783 (mwu)
Rate Pressure Product 9977,79 ± 2025,54 [9755,71 - 10199,87] 10463,94 ± 2157,03 [10227,45 - 10700,43] <0.001 (mwu)
Liver Indices
De Ritis Ratio 1,25 ± 0,56 [1,19 - 1,32] 1,19 ± 0,63 [1,12 - 1,26] 0.006 (mwu)
APRI (AST-to-Platelet Ratio Index) 0,77 ± 5,61 [0,16 - 1,39] 0,87 ± 5,69 [0,25 - 1,5] 0.893 (mwu)
FIB4 2,23 ± 5,71 [1,6 - 2,85] 2,43 ± 8,33 [1,52 - 3,35] 0.088 (mwu)
Hepatic Steatosis Index 36,08 ± 8,07 [35,19 - 36,96] 39,41 ± 7,95 [38,53 - 40,28] <0.001 (t-test)
NAFLD Fibrosis Score -0,93 ± 1,99 [-1,15 - -0,71] -0,88 ± 2,06 [-1,11 - -0,65] 0.768 (t-test)
Albumin-Bilirubin Score -2,41 ± 0,56 [-2,47 - -2,35] -2,51 ± 0,59 [-2,57 - -2,44] 0.003 (mwu)
HALP Score 43,02 ± 54,53 [37,04 - 49] 44,43 ± 57,84 [38,09 - 50,77] 0.024 (mwu)
Immune/Hematologic Scores
NLR 3,79 ± 2,9 [3,47 - 4,11] 3,64 ± 3,09 [3,3 - 3,98] 0.16 (mwu)
PLR 158,85 ± 96,2 [148,3 - 169,4] 148,72 ± 79,59 [139,99 - 157,44] 0.401 (mwu)
MLR 0,43 ± 0,27 [0,4 - 0,46] 0,45 ± 0,53 [0,39 - 0,5] 0.279 (mwu)
SII 985,99 ± 936,22 [883,35 - 1088,64] 962,46 ± 1118,44 [839,83 - 1085,08] 0.682 (mwu)
SIRI 2,8 ± 2,92 [2,48 - 3,12] 2,94 ± 3,67 [2,54 - 3,35] 0.644 (mwu)
Prognostic Nutritional Index (PNI) 46,84 ± 16,49 [45,04 - 48,65] 48,19 ± 9,37 [47,16 - 49,22] <0.001 (mwu)
Renal Indices
BUN Creatinine Ratio 33,74 ± 71,53 [25,89 - 41,58] 29,68 ± 54,69 [23,68 - 35,67] 0.359 (mwu)
UHR (Uric Acid-to-HDL Ratio) 0,17 ± 0,12 [0,16 - 0,18] 0,18 ± 0,1 [0,17 - 0,19] 0.031 (mwu)
UA/Creatinine Ratio 6,5 ± 7,65 [5,66 - 7,34] 6,48 ± 6,05 [5,81 - 7,14] 0.055 (mwu)
Abbreviations: USG: Ultrasonography; MASLD: Metabolic dysfunction–associated steatotic liver disease; BMI: Body mass index; WHtR: Waist-to-height ratio; ABSI: A Body Shape Index; PI: Ponderal Index; CI: Conicity Index; RFM: Relative Fat Mass; TyG: Triglyceride–glucose index; TyG/HDL: Triglyceride–glucose to HDL cholesterol ratio; AIP: Atherogenic Index of Plasma; LAP: Lipid Accumulation Product; VAI: Visceral Adiposity Index; TyG-BMI: Triglyceride–glucose index adjusted for BMI; TyG-WC: Triglyceride–glucose index adjusted for waist circumference; TyG-WHtR: Triglyceride–glucose index adjusted for waist-to-height ratio; Castelli I: Total cholesterol to HDL cholesterol ratio; Castelli II: LDL cholesterol to HDL cholesterol ratio; Non-HDL-C: Non–high-density lipoprotein cholesterol; RC: Remnant cholesterol; PP: Pulse pressure; RPP: Rate pressure product; AST: Aspartate aminotransferase; ALT: Alanine aminotransferase; APRI: AST-to-platelet ratio index; FIB-4: Fibrosis-4 index; HSI: Hepatic Steatosis Index; NFS: NAFLD Fibrosis Score; ALBI: Albumin–bilirubin score; HALP: Hemoglobin–albumin–lymphocyte–platelet score; NLR: Neutrophil-to-lymphocyte ratio; PLR: Platelet-to-lymphocyte ratio; MLR: Monocyte-to-lymphocyte ratio; SII: Systemic immune–inflammation index; SIRI: Systemic inflammation response index; PNI: Prognostic Nutritional Index; BUN/Cr: Blood urea nitrogen-to-creatinine ratio; UHR: Uric acid-to-HDL cholesterol ratio; UA/Cr: Uric acid-to-creatinine ratio
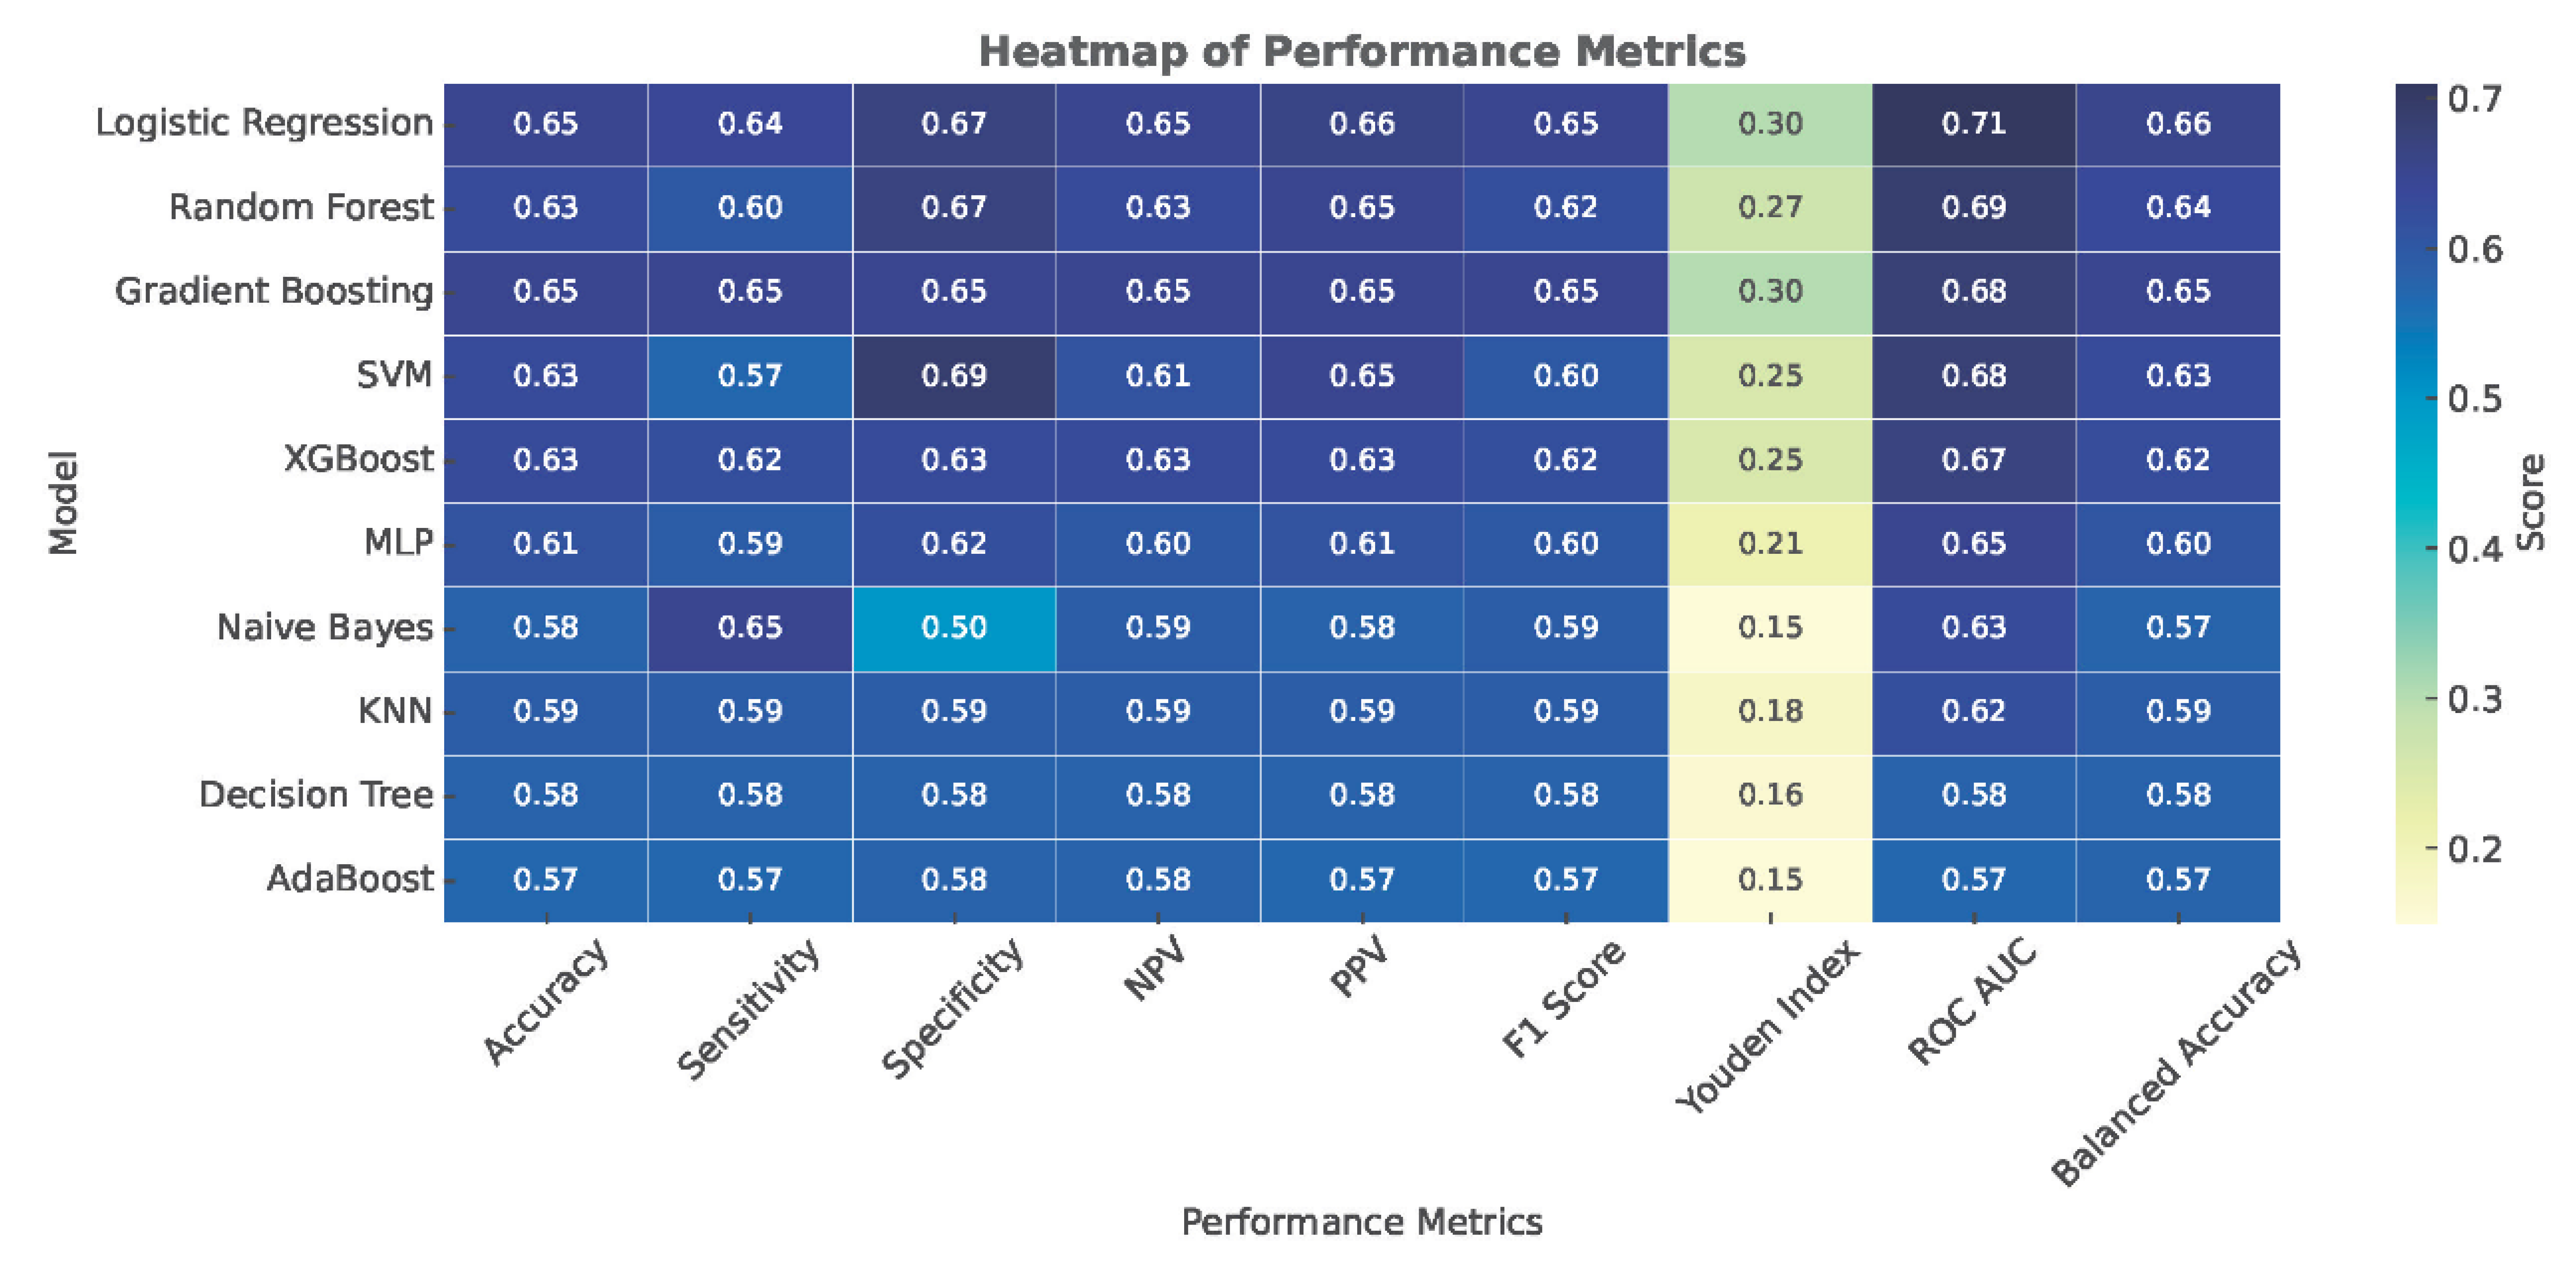
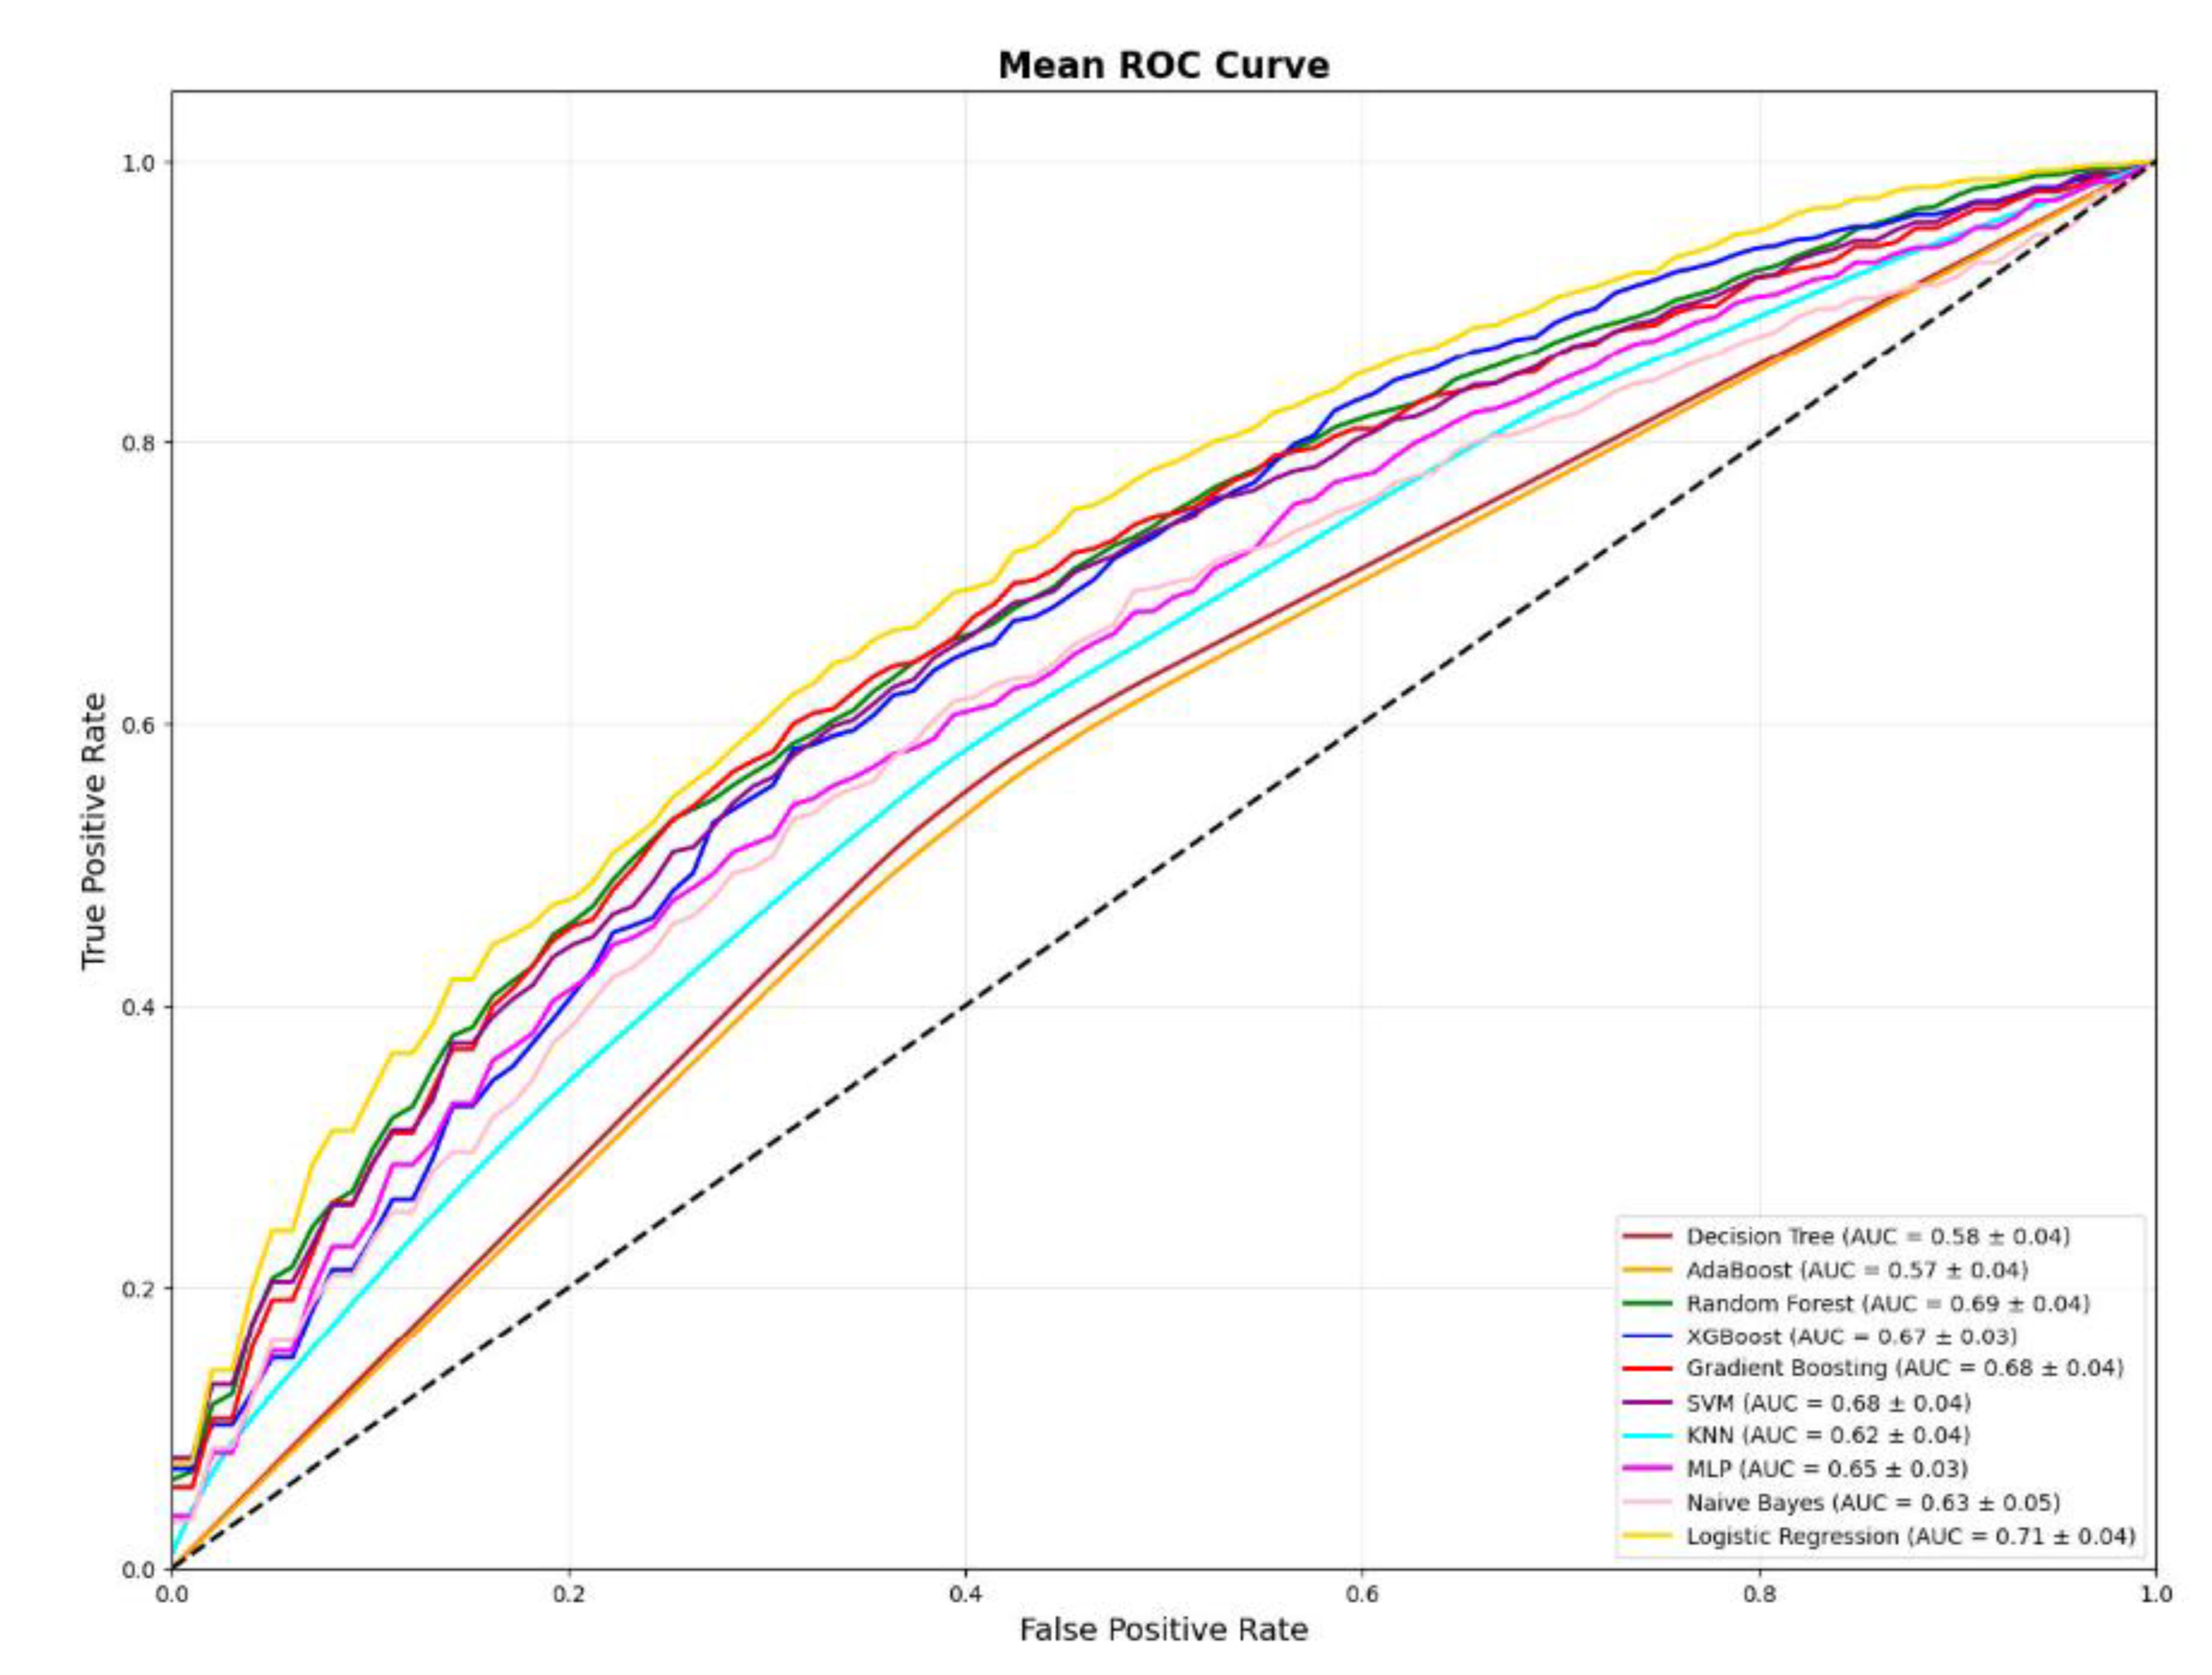
Table 3. Comparative performance of machine learning classifiers for prediction of ultrasound-detected metabolic dysfunction–associated steatotic liver disease (MASLD).
Model Accuracy Sensitivity Specificity NPV PPV F1 Score Youden Index ROC AUC Balanced Accuracy
Logistic Regression 0.65 ± 0.03 0.64 ± 0.06 0.67 ± 0.06 0.65 ± 0.03 0.66 ± 0.04 0.65 ± 0.04 0.30 ± 0.07 0.71 ± 0.04 0.66 ± 0.06
Random Forest 0.63 ± 0.03 0.60 ± 0.04 0.67 ± 0.05 0.63 ± 0.03 0.65 ± 0.04 0.62 ± 0.04 0.27 ± 0.07 0.69 ± 0.04 0.64 ± 0.04
Gradient Boosting 0.65 ± 0.03 0.65 ± 0.06 0.65 ± 0.06 0.65 ± 0.04 0.65 ± 0.04 0.65 ± 0.04 0.30 ± 0.07 0.68 ± 0.04 0.65 ± 0.06
SVM 0.63 ± 0.04 0.57 ± 0.04 0.69 ± 0.06 0.61 ± 0.03 0.65 ± 0.05 0.60 ± 0.04 0.25 ± 0.07 0.68 ± 0.04 0.63 ± 0.05
XGBoost 0.63 ± 0.03 0.62 ± 0.05 0.63 ± 0.06 0.63 ± 0.03 0.63 ± 0.04 0.62 ± 0.03 0.25 ± 0.06 0.67 ± 0.03 0.62 ± 0.06
MLP 0.61 ± 0.04 0.59 ± 0.05 0.62 ± 0.04 0.60 ± 0.04 0.61 ± 0.04 0.60 ± 0.04 0.21 ± 0.07 0.65 ± 0.03 0.60 ± 0.04
Naive Bayes 0.58 ± 0.06 0.65 ± 0.20 0.50 ± 0.22 0.59 ± 0.09 0.58 ± 0.06 0.59 ± 0.11 0.15 ± 0.12 0.63 ± 0.06 0.57 ± 0.21
KNN 0.59 ± 0.03 0.59 ± 0.06 0.59 ± 0.06 0.59 ± 0.04 0.59 ± 0.03 0.59 ± 0.04 0.18 ± 0.07 0.62 ± 0.04 0.59 ± 0.06
Decision Tree 0.58 ± 0.04 0.58 ± 0.06 0.58 ± 0.05 0.58 ± 0.04 0.58 ± 0.04 0.58 ± 0.05 0.16 ± 0.08 0.58 ± 0.04 0.58 ± 0.06
AdaBoost 0.57 ± 0.04 0.57 ± 0.07 0.58 ± 0.05 0.58 ± 0.04 0.57 ± 0.04 0.57 ± 0.05 0.15 ± 0.08 0.57 ± 0.04 0.57 ± 0.06
Disclaimer/Publisher’s Note: The statements, opinions and data contained in all publications are solely those of the individual author(s) and contributor(s) and not of MDPI and/or the editor(s). MDPI and/or the editor(s) disclaim responsibility for any injury to people or property resulting from any ideas, methods, instructions or products referred to in the content.
Copyright: This open access article is published under a Creative Commons CC BY 4.0 license, which permit the free download, distribution, and reuse, provided that the author and preprint are cited in any reuse.
Prerpints.org logo

Preprints.org is a free preprint server supported by MDPI in Basel, Switzerland.

Subscribe

Disclaimer

Terms of Use

Privacy Policy

Privacy Settings

© 2025 MDPI (Basel, Switzerland) unless otherwise stated