1. Introduction
The cocoa tree (
Theobroma cacao L.) is one of the most important tropical fruit trees, mainly due to the commercial value of its almonds, which are the raw material for the chocolate industry [
1]. In 2023, the world produced approximately 5,600,100.42 t of almonds, with emphasis on Ivory Coast (2,377,442.05 t), Ghana (653,700 t), Indonesia (641,741.02 t), Ecuador (375,719.14 t) and Brazil (296,145 t). Together, these countries are responsible for more than 77% of the world production of cocoa almonds [
2].
A of the most limiting factors in the production of cocoa crops is water availability. For crops to develop well, annual rainfall of 1,500 to 2,000 mm is required, well distributed [
3]. Traditionally, the main commercial cocoa-producing plantations are located in regions where water demand is satisfactorily met by the crop [
4]. However, climate change has been one of the obstacles to agricultural production [
1]. A of the changes observed is the rainfall regime, which in excess can reduce the soil's drainage capacity [
5], in addition to causing flooding in riverside regions, causing waterlogging of cultivated soils.
Soil flooding can result in a reduction in gas concentration, resulting in low availability (hypoxia) or complete lack (anoxia) of oxygen [
6], causing metabolic and physiological disorders in plants [
7], such as the production of free radicals and oxidative stress [
8], leading to cell lysis, in addition to a reduction in the synthesis of photosynthetic pigments [
9], decreased gas exchange [
10], a drop in the photosynthetic rate [
11] stomatal closure [
12] and loss in the translocation of carbohydrates from leaves to roots, thus occurring an accumulation of photosynthates in the leaves [
13]. All of these factors can limit plant development and growth, as well as reducing productivity.
Therefore, studies that seek to understand the effects of flooding on different plant species are important to understand the best management methods, in addition to selecting genotypes that can serve as an alternative to minimize the damage caused by stress. Thus, the objective of this study was to evaluate the physiological, biochemical and anatomical changes in response to flooding and the recovery capacity of Theobroma cacao L. rootstocks.
2. Materials and Methods
2.1. Experiment Conduction and Seedling Production
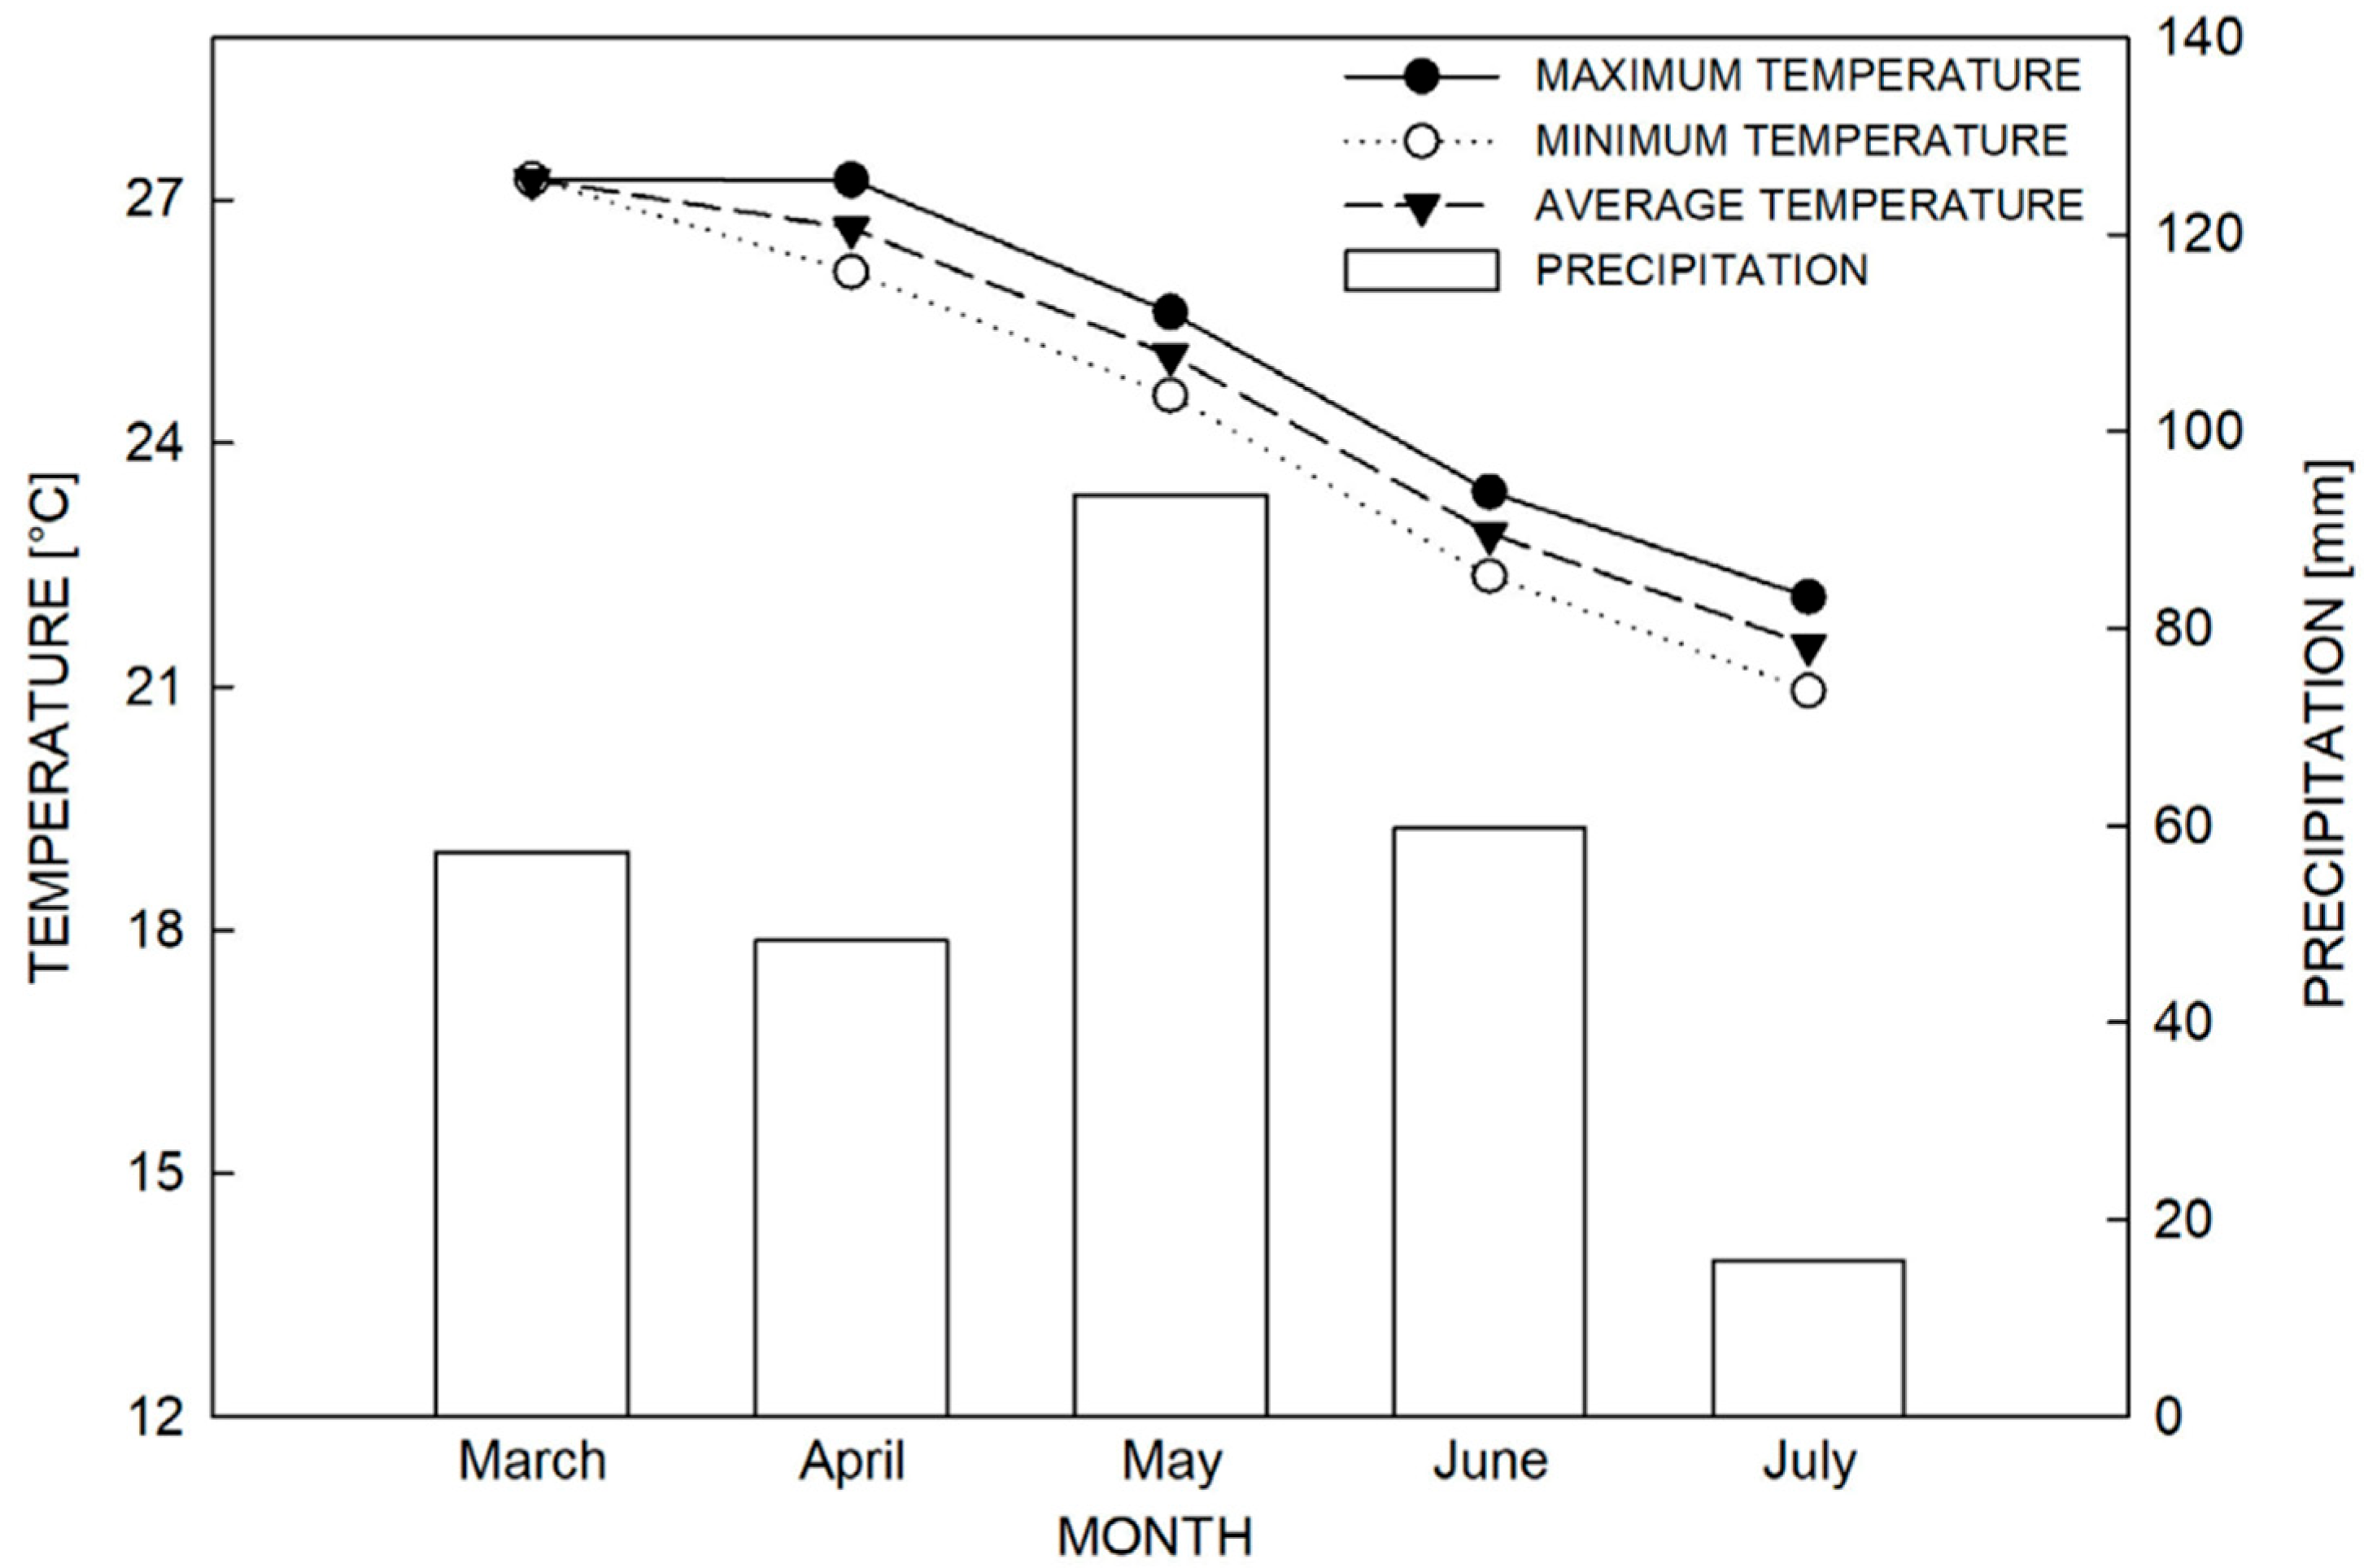
The study was conducted at the Capixaba Institute for Research, Technical Assistance and Rural Extension (INCAPER), located in the municipality of Linhares, Espírito Santo, under the geographic coordinates: 19º25'00.1” S and 40º04'35.3” W. The climate data during the experimental period were monitored through an automatic meteorological station (
Figure 1).
The cocoa seedlings used were of the PS-1319 genotype as scion, with the TSH-1188, Cepec-2002, Pará, Esfip-02, SJ-02 genotypes as rootstock. For the production of the seedlings, the full cleft top grafting technique was used, performed 5 months after sowing the rootstock [
14]. Two months after grafting, the seedlings were transplanted into polyethylene bags (25 x 35 cm), with one plant per bag, containing a sandy loam substrate with the following chemical characteristics: 0.008 kg m
–3 of phosphorus, 0.024 kg m
–3 of potassium, 0.007 kg m
–3 of sulfur, 0.222 kg m
–3 of iron, 0.0026 kg m
–3 of zinc, 0.0006 kg m
–3 of copper, 0.015 kg m
–3 of manganese, 0.00024 kg m
–3 of boron and 0.005 kg m
–3 of sodium; 0.0486 kg m
–3 of magnesium, 0.44088 kg m
–3 of calcium and 9 kg m
–3 of organic matter.
The plants were transferred to masonry tanks lined with white canvas, under 50% incident radiation, using a shade cloth, and acclimated for 60 days before being submitted to treatments. Irrigation was carried out by sprinkling over 45 m, divided into three times a day. Foliar nitrogen fertilization and pest control were carried out when necessary.
At nine months of age, the plants were subjected to flooding for 60 days, maintaining the water level up to the collection and replacing when necessary, with dissolved oxygen of 0.00898 kg m–3 resulting from the average of three readings, taken after 3 days without water replacement. The analyses were performed according to the Standard Methods for the Examination of Water & Wastewater 23rd 2017 (SMEWW) and NBR (when applicable) version. Non-flooded plants, maintained with irrigation (45 m per day), were evaluated as controls. After 60 days of flooding, 40 plants were maintained for 30 days under the same conditions as the control, to evaluate the recovery capacity of the genotypes evaluated.
The treatments were arranged in a randomized block experimental design, in a factorial scheme (5 x 2). The first factor consisted of five different cocoa rootstocks (TSH-1188, Cepec-2002, Pará, Esfip-02 and SJ-02). The second factor consisted of two conditions, flooded and non-flooded. Thus, four replicates per treatment were evaluated, with a plot consisting of 10 plants.
2.2. Gas Exchanges and Chlorophyll Relative Content
Gas exchange and relative chlorophyll content (SPAD) were assessed at 5, 7, 9, 11, 13, 17, 19, 24, 29, 41, 48, and 55 days after flooding, and during recovery at 7, 14, 21, and 29 days after flooding was suspended. Two plants per replicate were used between 7:00 and 10:00 a.m., in fully expanded leaves in the median portion of the plant, at the third node of one leaf per plant. Gas exchange was performed using an infrared gas analyzer (IRGA), model LI-6400 (LI-COR, Lincoln, NE, USA), with a saturating irradiance of 1,000 [μmol(photon) m–2 s–1] photons, a temperature of 25°C, and a CO2 of 400 ppm. From these data, the following were calculated: the ratio between intra/extracellular CO2 concentrations (Ci/Ca); net photosynthetic rate (PN) [μmol(CO2) m–2 s–1]; stomatal conductance (gs) [mmol(H2O) m–2 s–1]; transpiration rate (E) [mmol(H2O) m–2 s–1]; and the intrinsic water use efficiency (WUE) [mol(CO2) mol(H2O)–1]. A portable chlorophyll meter (SPAD-502, Minolta®, Japan) was used to determine the relative chlorophyll content.
2.3. Stem and Leaf Anatomical Evaluations
For anatomical evaluations, one plant per block was used. Lenticel formation was qualitatively assessed by visual evaluation. Stem fixation was performed in FAA solution (formalin (5%), acetic acid (5%) and ethyl alcohol (90%) in 100 ml) at 70% for fifteen days and then transferred to 70% alcohol, and leaves were fixed directly in 70% alcohol. Histological sections according to [
15] were obtained freehand with the aid of a stainless steel blade. Stem and leaf cross sections were subjected to clarification with sodium hypochlorite solution and then washed in distilled water until excess hypochlorite was removed. Sections were stained with safrablau (safranin + Astra blue) (Gerlach 1969) and kept in distilled water; paradermal sections of leaves were made using the epidermal impression technique. The temporary slides were observed under a bright field microscope (Euromex). The images were captured with a microcamera (CMEX 5), and the biometric measurements of the tissues were performed with the ImageFocus 4 software. The parameters evaluated for the leaf were stomatal density, polar diameter/equatorial diameter (PD/DE) ratio, and for the stem, the lenticel length and lenticel height.
2.4. Photosynthetic Pigments
Pigment extraction was performed 60 days after flooding. Chlorophyll and carotenoid contents were determined using 1-2 cm fragments from the median region of the leaf blade, discarding the central vein, from completely expanded and fresh leaves, from the third node below the apex of the plants, chosen at random. The extraction and quantification of chlorophyll
a,
b and total were performed according to the methodology of [
16]. The extraction and quantification of carotenoids were performed according to the methodology described by [
17], using the molar absorptivity coefficients of [
18].
2.5. Carbohydrate Extraction and Quantification
After 60 days of flooding and 30 days after the stress was suspended, leaves and roots of the plants were collected to quantify the levels of total soluble sugars (TSS), reducing sugars (RS), and starch. The plant material was dried in an air circulation and renewal oven (TE-394/3, Tecnal) at 70°C until constant weight, ground in a Willye type mill (TE-650, Tecnal and brand) with a 0.6 mm mesh 30 sieve (TE-650C), and stored in a freezer at –18°C (CHA22, Consul) until extracts were obtained. The extracts were obtained according to [
19], using 0.2 g of leaves and 0.3 g of roots. For the quantification of total soluble sugars (TSS) and starch, the Anthrone method [
20] was used, with modifications, using 2 mL of anthrone solution at 0.19% in sulfuric acid at 93.33%, in a reaction volume of 3 mL, subjected to 100ºC for 3 minutes. Reducing sugars (RS) were quantified according to the protocol described by [
21], through the Dinitrosalicylic Acid (DNS) method.
2.6. Statistical Analysis
The data were subjected to analysis of variance using the F test at 5% probability. Subsequently, the means were compared using the
Scott-Knott cluster test at a significance level of 5% and the
Dunnett test. Statistical analysis was performed using the
SISVAR [
22] and R programs [
23].
3. Results
3.1. The Recovery of Gas Exchanges and SPAD
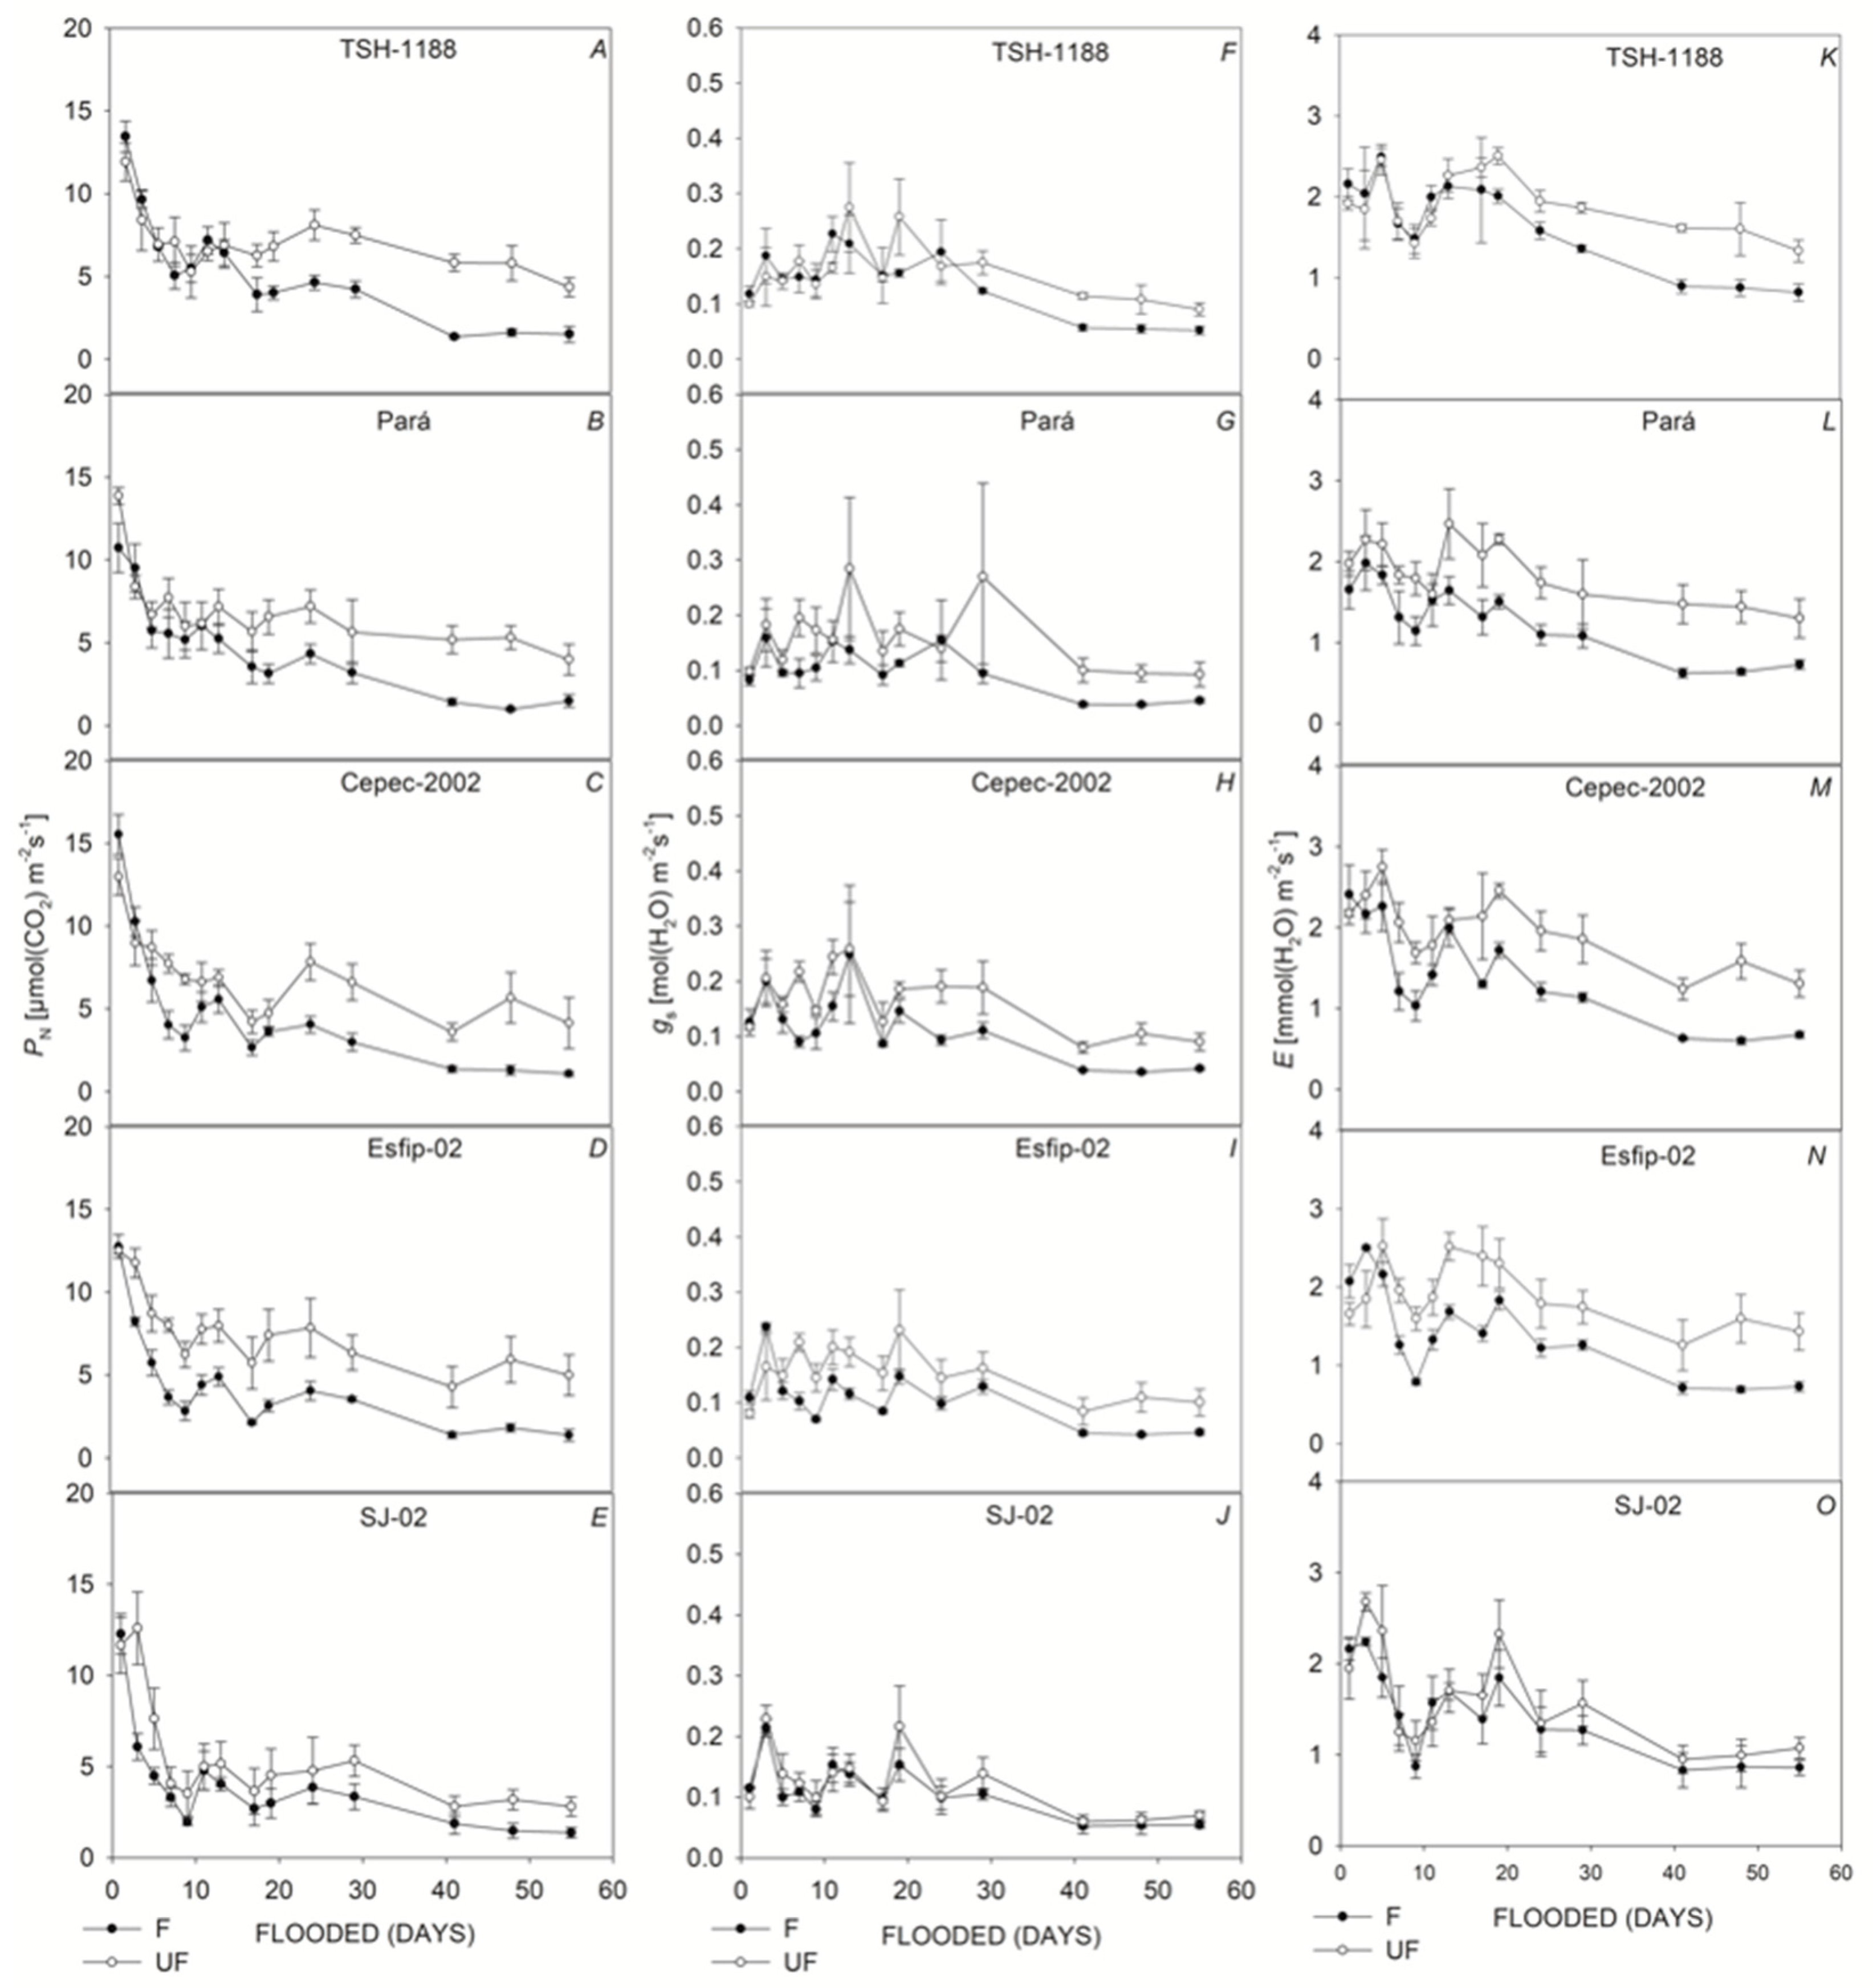
All genotypes showed decreases in net photosynthetic rate (
PN) (
Figure 2A,E), stomatal conductance (
gs) (
Figure 2F,J), transpiration rate (
E) (
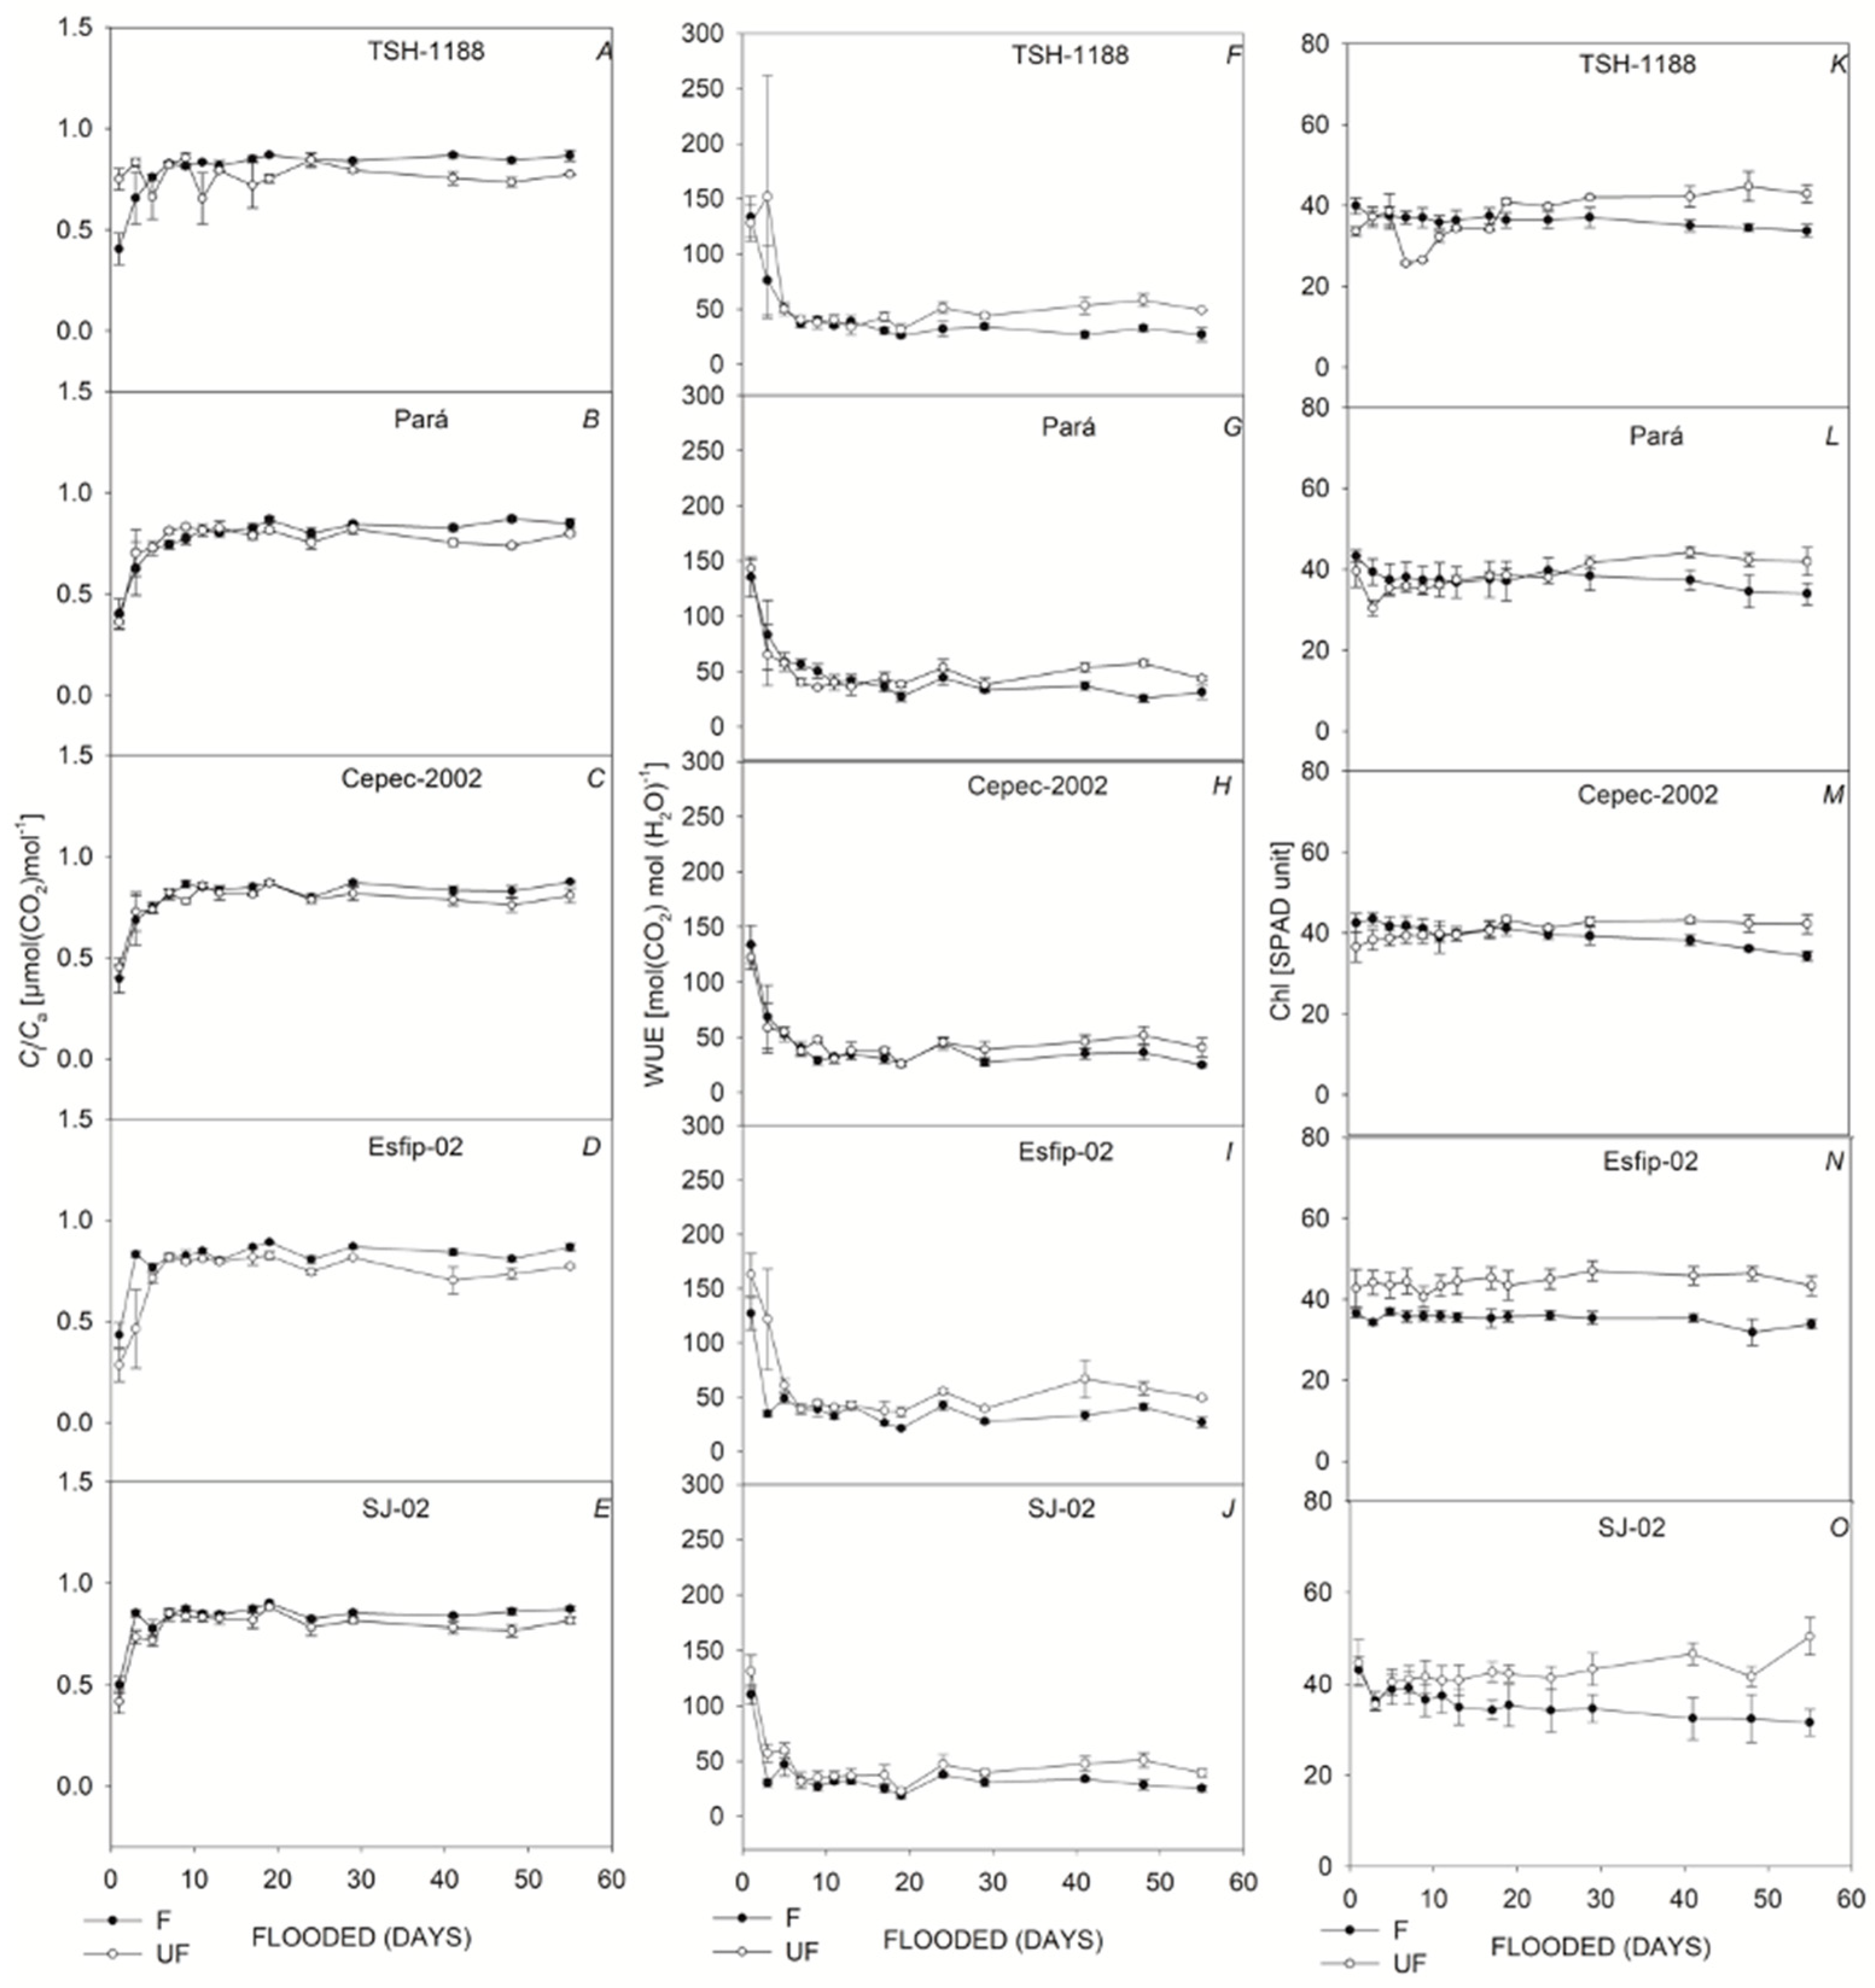
Figure 2K,O), intrinsic water use efficiency (WUE) (
Figure 3F,J), and relative chlorophyll content (SPAD unit) in leaves (
Figure 3K,O). However, there was an increasing increase in the ratio of intra/extracellular CO
2 concentrations (
Ci/
Ca) (
Figure 3A,E) under flooding compared to the non-flooded environment. The Esfip-02 genotype showed more sensitive behavior at the beginning of flooding (
Figure 2 and
Figure 4D,I, N), while SJ-02 was more stable, since its behavior in the flooded environment did not differ from the behavior during the non-flooded environment when compared to the other genotypes studied (Figures 2E and 3J,O). All genotypes, after 40 days of flooding, showed stability in the parameters, maintaining photosynthesis below 2 [μmol(CO
2) m
–2 s
–1], conductance below 0.1 [(H
2O) m
–2 s
–1] and transpiration below 1.0 [(H
2O) m
–2 s
–1] (
Figure 2).
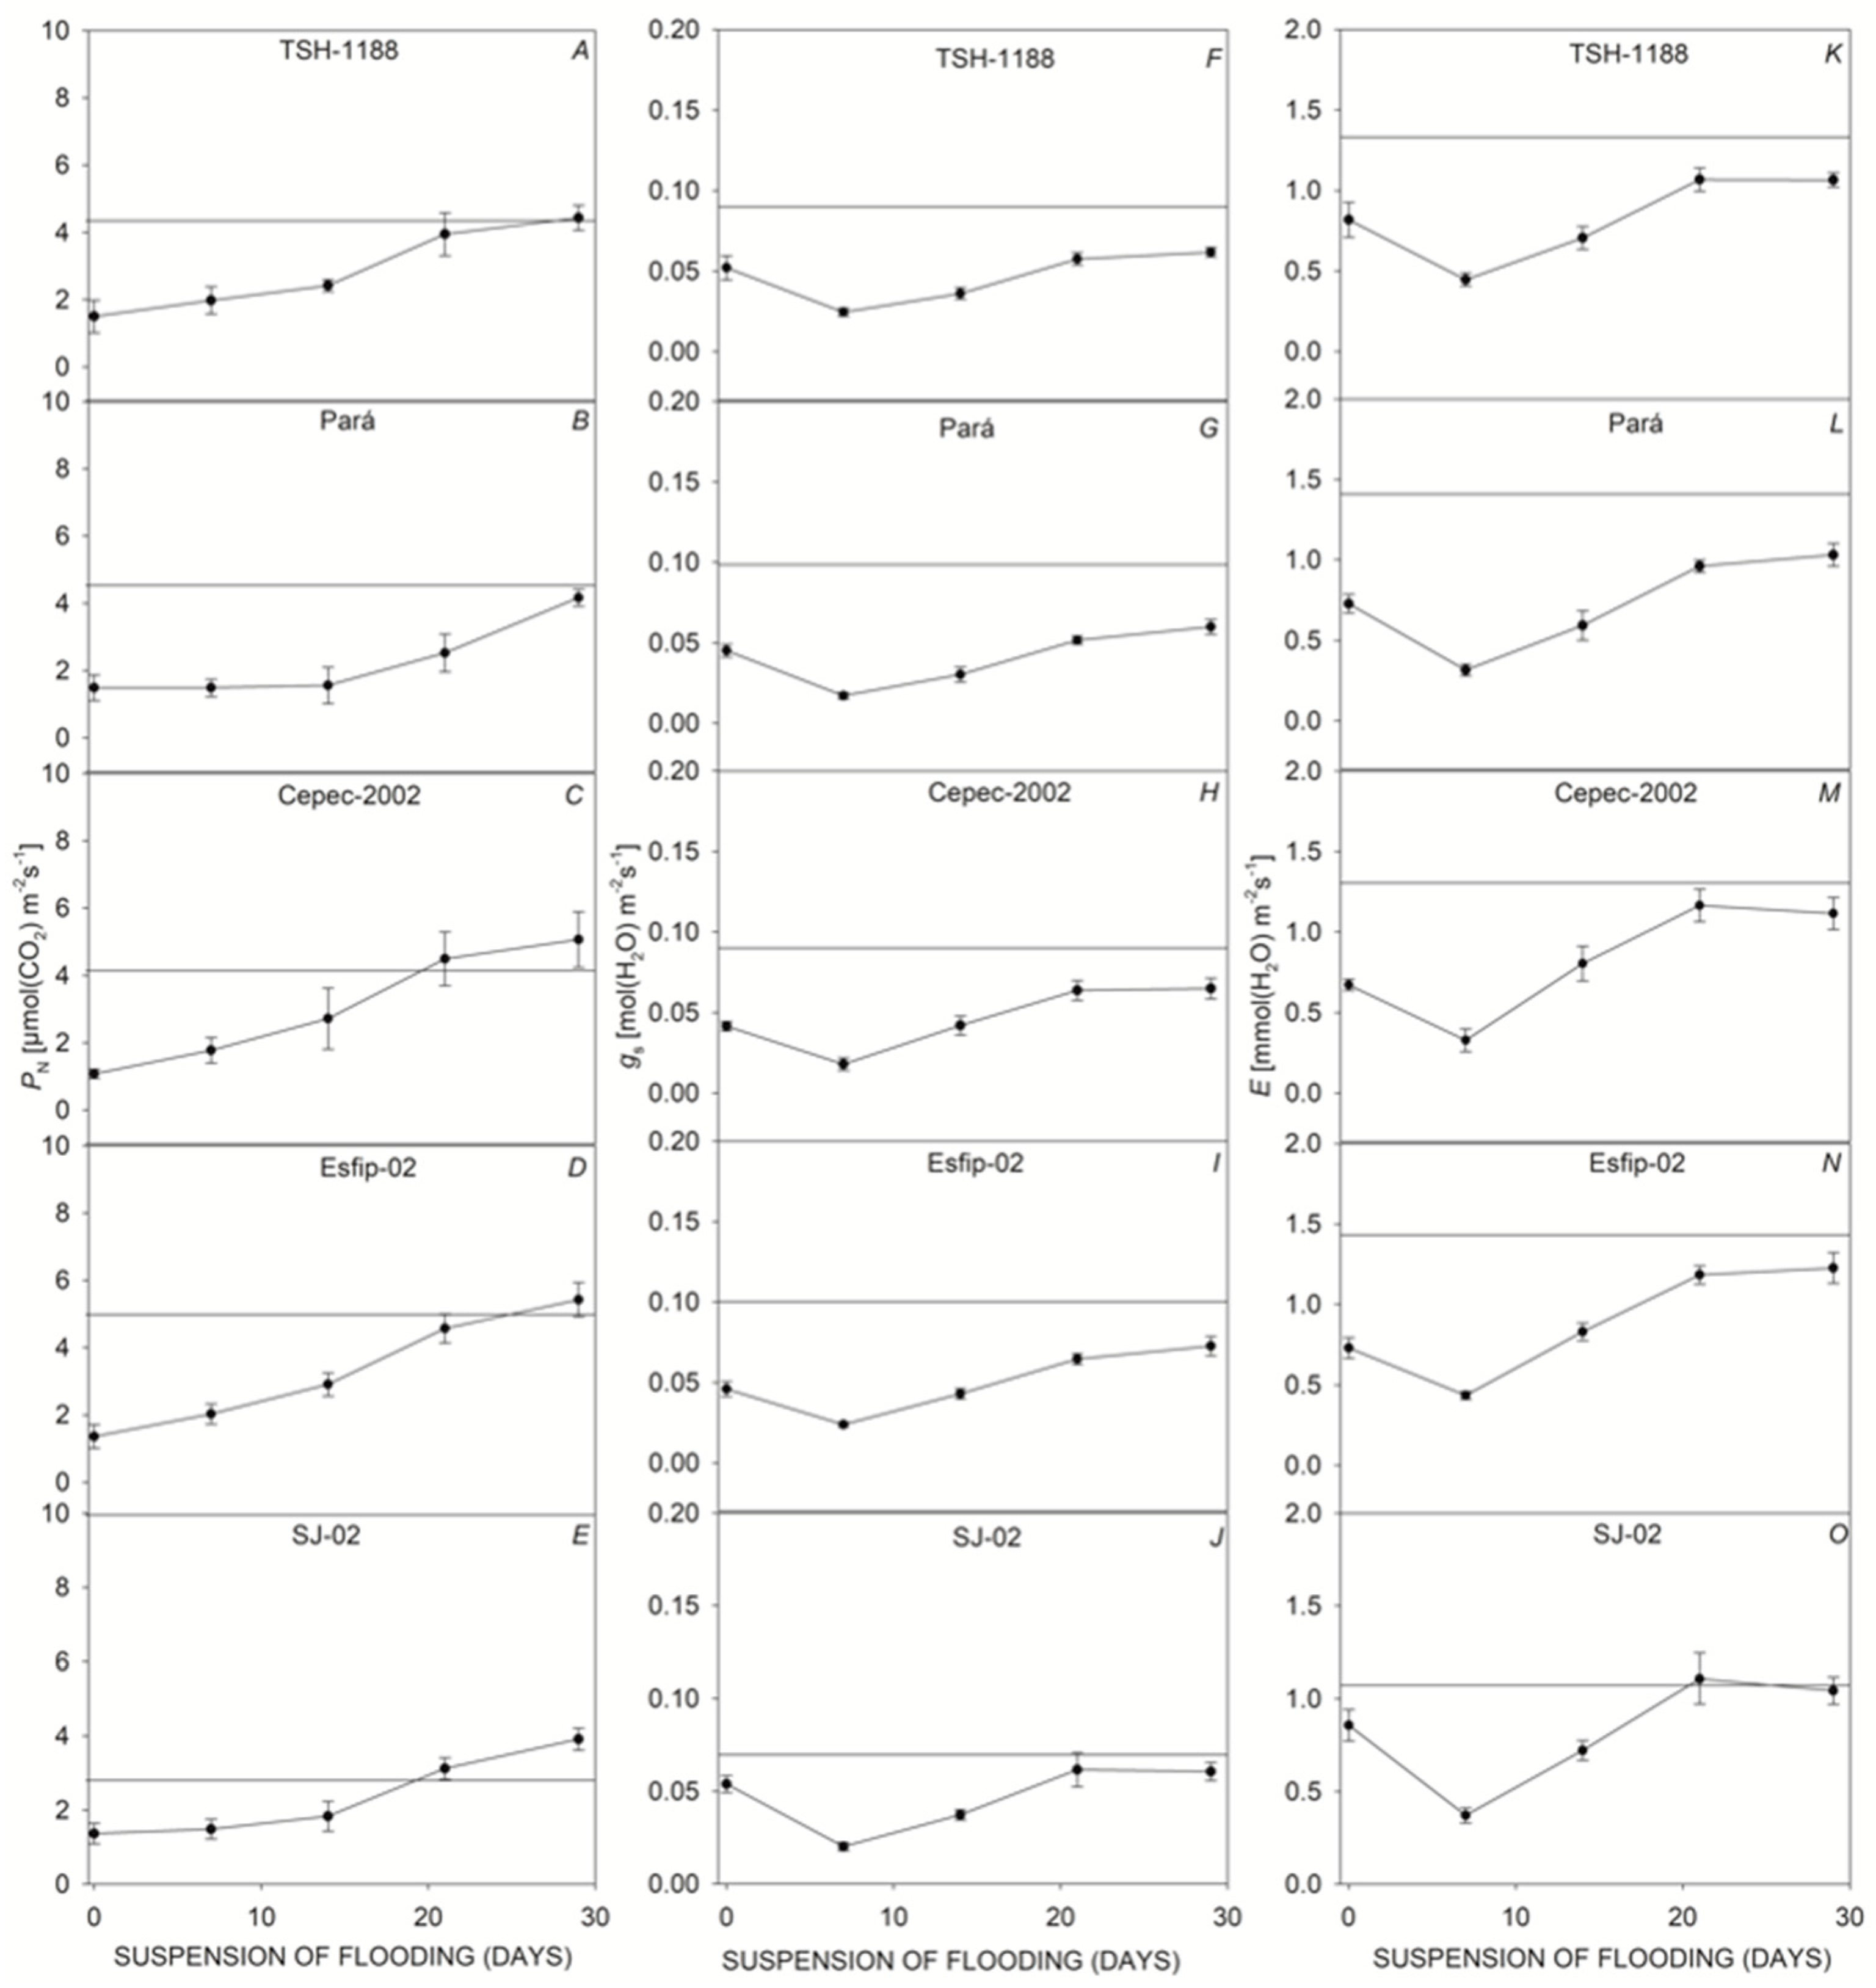
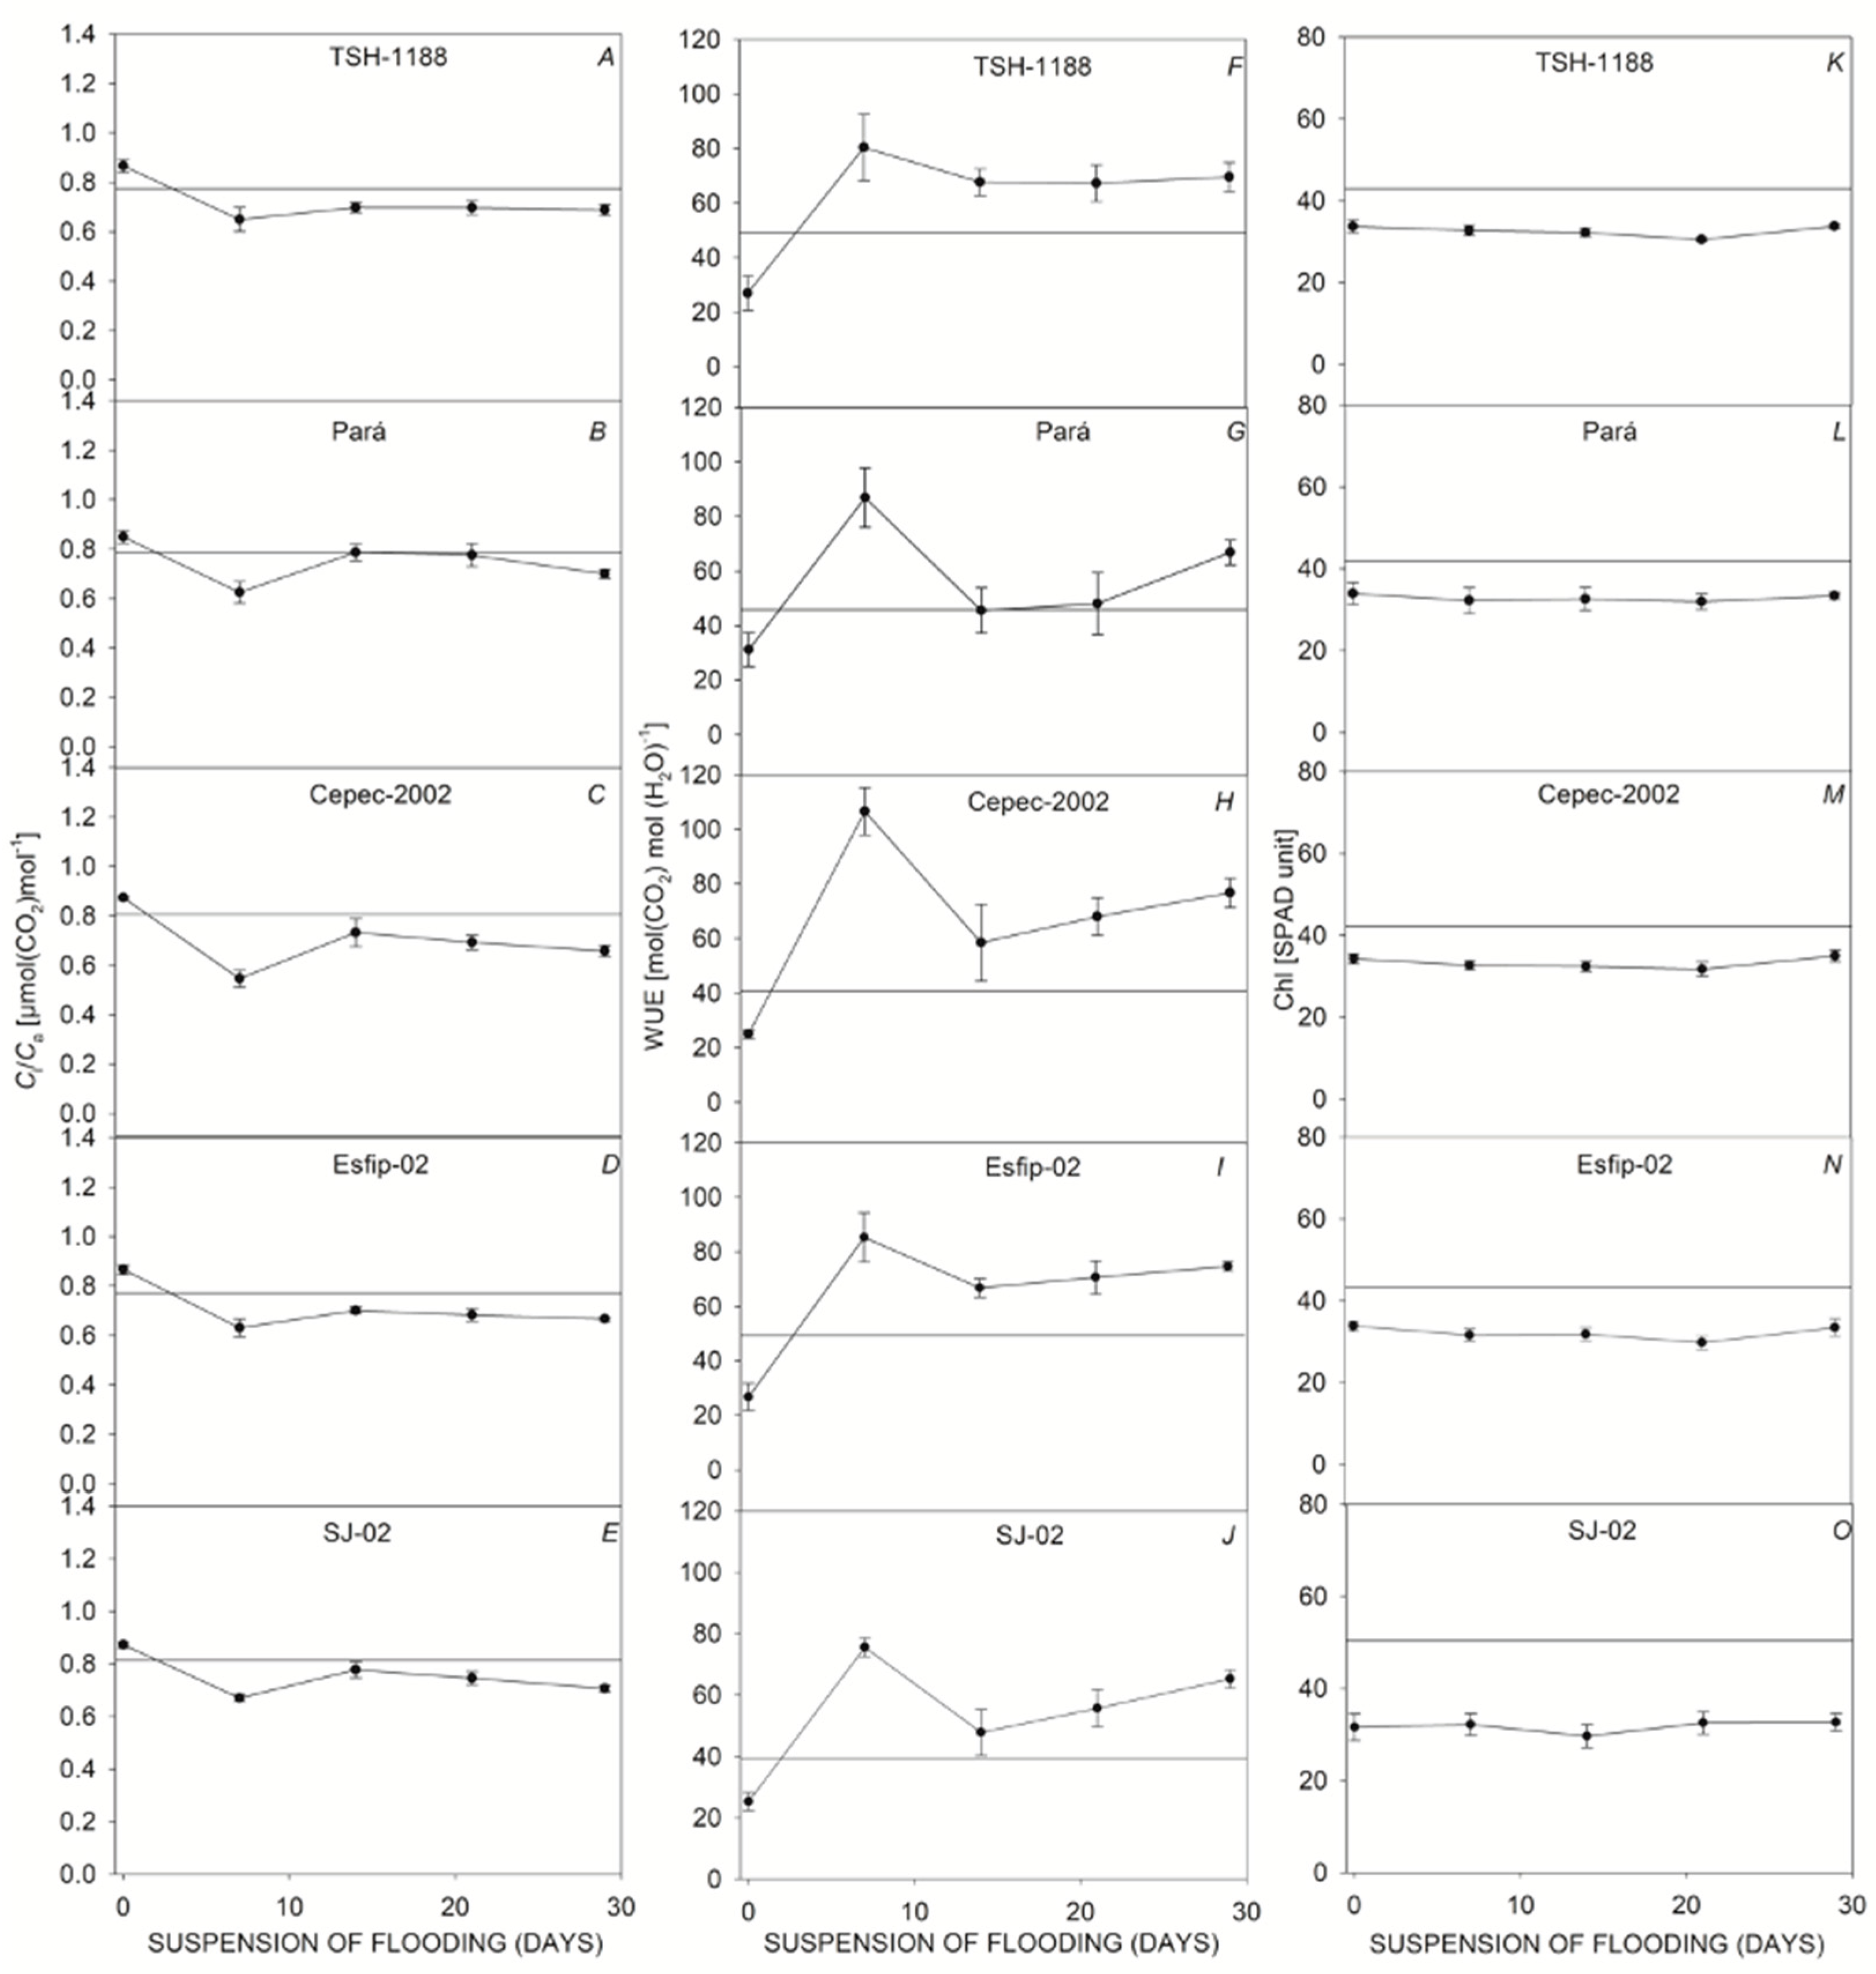
After recovery, all genotypes restored photosynthesis (
Figure 4A,E), transpiration (
Figure 4K,O), WUE (
Figure 5K,O) and carbon concentration ratio. However, at 29 days of recovery, the genotypes Cepec-2002 (
Figure 5H), Esfip-02 (
Figure 5I) and SJ-02 (
Figure 5J) reduced internal carbon. The genotypes TSH-1188 (
Figure 4F) and Pará (
Figure 4G) were unable to return stomatal conductance to the non-flooded condition level after only 30 days of recovery, while the genotypes Pará (
Figure 5B) and Cepec-2002 (
Figure 5C) were unable to recover their SPAD.
3.2. Stem and Leaf Anatomy
Since the ninth day of flooding, all plants presented hypertrophied lenticels, which remained until the end of the experimental period and after the flooding was removed, the stem began to reduce the openings. The length of the lenticels was statistically equal in the genotypes under flooding, and only SJ-02 and Pará did not reduce the length of the lenticels after recovery (
Table 1), but there was a reduction in the height of the lenticels after the suspension of the stress (
Table 1). The stomatal density increased for SJ-02 and Esfip-02 under flooding, while only SJ-02 reduced the DP/DE ratio in flooding when compared to the other environments (
Table 1).
3.3. Flooding on Pigment Contents
There was no statistical difference between the genotypes for chlorophyll content, which was only affected by the environment. Flooding caused a reduction in the content of photosynthetic pigments (
Table 2). Carotenoid content differed among the genotypes studied, with Esfip-02 and Cepec-2002 presenting the highest values among the five rootstocks evaluated (
Table 2). Among the environments, carotenoid content was degraded by flooding (
Table 2).
3.4. Flooding and Recovery on the Carbohydrates
All genotypes showed accumulation of reducing sugar and total soluble sugar in the leaves during flooding. After flooding was suspended, only SJ-02 did not reduce the accumulation of reducing sugar in the leaves. Except for Pará, soluble sugar in the leaves was reduced during flooding suspension for the other genotypes (
Table 3). During flooding, TSH-1188 accumulated more reducing sugar and less soluble sugar, on the other hand, Esfip-02 and Cepec-2002 showed the opposite behavior (
Table 3). In the root system, the accumulation of total soluble sugar increased with flooding, while starch content increased during recovery and the genotypes Esfip-02, SJ-02 and TSH-1188 accumulated greater amounts of starch in the roots. In the leaves, flooding caused starch accumulation, which reduced after recovery (
Table 3).
4. Discussion
4.1. Gas Exchange and SPAD
Theobroma cacao L. plants had distinct behaviors in relation to the different genotypes and flooded, non-flooded and control environments to which they were subjected. When kept under flooding, the plants showed negative behavior in relation to gas exchange (
Figure 2 and
Figure 4). The reduction in net photosynthetic rate under flooding may be related to stomatal closure by photoinhibition [
24] or to photochemical impairment, causing limitation in leaf gas exchange [
25]. The rootstock SJ-02 showed low photosynthetic rates in control plants. However, due to the low photosynthetic rates in relation to the other rootstocks, the effect of flooding was not very pronounced in SJ-02.
Flooding conditions caused a reduction in
gs in all rootstocks (
Figure 2F, J). However, SJ-02 did not show any difference in its behavior between environments when compared to the other genotypes (
Figure 2J). Reduced
gs values can be associated with degradation of the root system, since the roots are unable to maintain water absorption in the anoxic environment [
5]. Thus, the lower the stomatal conductance generated by the increased stress time, the greater the loss in photosynthesis, since the plants are unable to produce ATP and NADPH2 and begin to dissipate the absorbed light energy, increasing the chances of photoinhibition [
26].
When stomatal limitations occur, there is consequently a reduction in CO
2 capture, and thus reductions in the
Ci/
Ca ratio, this reduction being related to the reduction of
gs. However, it should be noted that all rootstocks presented
Ci/
Ca values close to or greater than 0.7 (
Figure 3A,E), which according to [
13], is indicative that stomatal restriction was not sufficient to limit the
Ci/
Ca ratio [
27].
The stress generated by flooding conditions induced a reduction in water use efficiency in all genotypes, with the most pronounced reductions in the TSH-1188 and Esfip-02 genotypes (
Figure 3F,J). Unlike the data observed in our studies, for flooded water conditions, when plants present high values of WUE, it is indicative of greater physiological plasticity, given the stressful conditions of the environment [
28,
29]. Thus, the increase in water use efficiency during flooding indicates that the plant is using more water in this environment [
30]. Therefore, it is possible to verify with the data presented in our study that the cacao plants had a reduced water absorption capacity by the roots.
In addition to stomatal closure, chlorophyll degradation and the accumulation of soluble sugar in the leaves during flooding contributed to the reduction of photosynthesis [
31]. High values of the SPAD index indicate that the FSII is not compromised [
5], but this did not occur with the rootstocks studied, since all showed a decline in their green index (
Figure 3K,O). Possibly associated with the increase in acetaldehyde and acetic acid and the action of ethylene [
32], in the leaves, through chlorophyll degradation [
33].
After stress suspension, all rootstocks reestablished A (
Figure 2A,E), E (
Figure 2K,O), and WUE (
Figure 3K,O). Also, the genotypes Pará (
Figure 3B) and Cepec-2002 (
Figure 3C) managed to recover the SPAD index values. The genotypes Esfip-02 (
Figure 2I), SJ-02 (
Figure 2J), and Cepec-2002 (
Figure 2H) recovered their
gs. This is an indication that the plants managed to reestablish water absorption and reactivate the photosynthesis process. Possibly, the recovery in gas exchange can be associated with better management of reactive oxygen compounds, improving photosynthetic acclimation after flooding [
8].
4.2. Stem and Leaf Anatomy
In different studies, the appearance of lenticels on the stem of cocoa trees has been observed during flooding, after 3, 8, 10, 12 days of the plants under this condition [
3,
13,
34,
35]. In our studies, all rootstocks showed the formation of lenticels after nine days of flooding, with no differences between them in the flooded condition. The length of the lenticels remained the same during recovery, except for the SJ-02 and Pará genotypes, and their height regressed when the plants were removed from the flooding and placed to recover (
Table 1).
Lenticels are structures that facilitate the transport of oxygen to the roots and protect the tissues from toxic substances arising from fermentation [
36]. The presence of hypertrophied lenticels promotes the release of toxic compounds that are formed by the roots [
37], such as the production of lactate, acetaldehyde and ethanol [
38]. Among these compounds, the most harmful during flooding is ethanol. When the plant is unable to eliminate all the ethanol produced, it causes darkening of the root system and consequent death, impairing the growth of new roots [
5].
The increase in stomatal density in the SJ-02, Pará and Esfip-02 genotypes during flooding contributed to the conservation of CO
2 assimilation, being an essential strategy to increase photosynthesis and tolerate stress conditions [
39], as observed for these genotypes during the recovery process. On the other hand, the TSH-1188 and Cepec-2002 rootstocks showed a reduction in stomatal density during flooding, associated with stomatal closure. This response can be considered as a form of protection by plants to avoid excessive water loss [
40], becoming a survival mechanism against water saturation of the root system [
27].
The return of stomatal density similar to the non-flooded environment of the genotypes after the suspension of flooding stress confirms that changes in the density and size of stomata in leaves developed in flooded environments is a sign of plasticity of the species to adapt to the environment [
39]. The Pará rootstock did not present statistical differences between the three environments (
Table 1), showing that it was the only one that did not present plasticity.
4.3. Pigment Contents
Flooding negatively influenced pigments, reducing the plants' light absorption capacity. Chlorophyll and carotenoids are directly linked to the photosynthetic capacity of plants, as they have functions in the absorption and transfer of light energy to the PSII [
41], and are essential for plant development [
42]. The stressful condition generated by excess water and reduced oxygen concentration in the roots limits the presence of nitrogen and magnesium in the leaves, which are constituents of pigments [
43].
Analyzing the environments, it was found that flooding degraded carotenoids. Meanwhile, among the genotypes, Cepec-2002 and Esfip-02 presented higher carotenoid values (
Table 2). Carotenoids are responsible for protecting the photosystems against photodegradation against photooxidation [
44]. With the reduction of this pigment, we can confirm that the cocoa plants suffered photodegradation, caused by the long period of flooding and consequent photosynthetic decline [
45].
4.4. The Carbohydrates
Flooding stress on the root system generates changes in plants due to the lack of oxygen in the roots, leading the plant to adapt, such as the accumulation of metabolites in the aerial part [
25], since the plant tends to save energy to ensure its survival, thus tending to maintain a balance in the distribution of photoassimilates until the flooding is suspended [
46]. This fact explains the accumulation of reducing sugar (RS) in the leaves of plants kept under flooding, with emphasis on the TSH-1188 genotype (
Table 3). It is also known that plants under flooding store carbohydrates as a way to prevent oxidative stress [
47].
The data obtained in this study also indicate that there was an accumulation of total soluble sugar (TSS) in the leaves of the genotypes in the flooded environment, with higher TSS in the leaves of the Esfip-02 and Cepec-2002 genotypes (
Table 3). The increase in soluble sugars in the leaves contributed to the osmoregulation of the plants. This accumulation in the leaves probably reduces A rates and contributes to a satisfactory pressure potential and maintains the water content inside the cells, thus avoiding and reducing the damage caused by stress [
31,
32,
33,
34,
35,
36,
37,
38,
39,
40,
41,
42,
43,
44,
45,
46,
47,
48]. It should be noted that the TSS produced tends to accumulate in the aerial part of the plants, as there is less translocation from the leaf to the roots due to the compromise of the phloem, which can cause damage to photosynthetic rates [
49].
The increased accumulation of carbohydrates in the TSS root system observed in plants under flooding, as presented in our studies, is reported as a survival mechanism in environments with flooding stress [
19,
20,
21,
22,
23,
24,
25,
26,
27,
28,
29,
30,
31,
32,
33,
34,
35,
36,
37,
38,
39,
40,
41,
42,
43,
44,
45,
46,
47,
48,
49,
50]. Thus, under this type of stress, plants were unable to utilize carbohydrates, which is a sign of low tolerance to flooding [
31]. Thus, this adaptation allows the plant to modify its gene expression, responsible for conferring tolerance to stressful conditions [
51].
Under flooded conditions, the lower rate of transport from the phloem to the roots results in the accumulation of starch, as observed in the leaves and roots of plants when compared to the non-flooded environment. The root system under anoxia requires large amounts of sugars for anaerobic respiration [
52]. The maintenance of glycolysis and the induction of fermentation during flooding are potential characteristics that confer tolerance to flooding [
25]. Since the formation of carbohydrates is dependent on the efficient capture of light energy and oxygen supplies, the reduction of oxygen caused by flooding hinders photosynthesis and respiration, consequently forming carbohydrates [
53].
Plant survival to flooding may be related to the ability to maintain carbohydrate levels [
54]. The data obtained demonstrate that during recovery from stress, there was a reduction in RS, TSS and starch in the leaves, with no differences between the rootstocks (
Table 3). This fact is related to the increase in biosynthesis through the use of stored carbohydrates, thus the plants suffered less stress during recovery [
55].
It is worth noting that the adaptation of cocoa plants to the flooded environment is related to a series of factors that allow the plants to survive in stressful and non-ideal conditions for their development. Furthermore, the morphophysiological modifications of the plants, such as the appearance of lenticels, stomatal density, carbohydrate and photosynthetic pigment contents are essential for the adaptive success of the species.
5. Conclusions
The time of exposure of the rootstocks to flooding caused limitations in net photosynthetic rate, stomatal conductance and transpiration.
The SJ-02 rootstock showed the lowest gas exchange rates of the control plants and when placed in flooding there were no considerable variations.
The photosynthetic pigments were degraded during flooding, the Cepec-2002 and Esfip-02 rootstocks showed greater accumulation of carotenoids.
There was an accumulation of soluble sugars in the leaves and roots during flooding, the Cepec-2002 and Pará rootstocks accumulated less starch in the roots.
After recovery, the rootstocks showed the ability to normalize their gas, carbohydrate and anatomical exchange processes, showing that the root system was able to reestablish its functions.
Author Contributions
Conceptualization, E.N.S., S.D-A and CASS ; Methodology, S.D-A., M.L.P.B.P, and V.S.O; Software, V.S.O., J.C. and C.S.D ; Validation, A.R.F, T.C.S, B.C.N., E.N.S., and S.D-A.; Formal analysis, V.S.O. and L.O.A; Investigation, M.L.P.B.P, T.R.F, B.C.N. and J.C. Resources, E.N.S., and S.D.A.; Data curation, V.S.O. and M.L.P.B.P; Writing—original draft preparation, V.S.O. and M.L.P.B.P; Writing—review and editing, V.S.O, and S.D-A.; Visualization, V.S.O. and J.C.; Supervision, V.S.O, J.A.M.F and S.D-A.; Project administration, E.N.S. and S.D-A.; Funding acquisition, E.N.S. and S.D-A. All authors have read and agreed to the published version of the manuscript.
Funding
Please add: This research was funded by Secretaria da Agricultura, Abastecimento, Aqui- cultura e Pesca (SEAG) e Fundacao de Amparo a Pesquisa e Inovacao do Espirito Santo - FAPES, grant number DI 004/2022 SEAG/FAPES - Banco de projetos Fase III.
Conflicts of Interest
“The authors declare no conflicts of interest.”
Abbreviations
The following abbreviations are used in this manuscript:
|
Ci/Ca
|
ratio between intra/extracellular CO2 concentrations |
| Chl a
|
chlorophyll a |
| Chl b |
chlorophyll b
|
| DNS |
Dinitrosalicylic Acid method |
| E |
transpiration |
| FAA 70% |
formaldehyde, acetic acid, and 70% ethanol |
|
gs
|
stomatal conductance |
| INCAPER |
Capixaba Institute for Research, Technical Assistance and Rural Extension |
| PD/DE |
ratio polar diameter/equatorial diameter |
|
PN
|
net photosynthetic rate |
| RS |
reducing sugars |
| SPAD |
Soil Plant Analysis Development |
| TSS |
total soluble sugars |
| WUE |
water use efficiency |
References
- Lahive, F.; Hadley, P.; Daymond, A. J. The physiological responses of cacao to the environment and the implications for climate change resilience. A review. Agron. Sustainable Dev. 2019, 39, 1. [CrossRef]
- Food and Agriculture Organization of the United Nations – FAO.: Faostat. Disponível em: <http://www.fao.org/faostat/en/#data/QC>. Access fev. 2025.
- Oliveira, V. S.; Pinheiro, A. P. B.; Cerri Neto B; Arantes, S. D.; Silva, C. A.; Crasque, J.; Pinto, M. L. P. B.; Santos, G. P.; Pagoto, A. L. R.; Nascimento, A. L.; Machado Filho, J. A.; Posse, R. P.; Posse, S. C. P.; Souza, C. A. S.; Schmildt, O.; Schmildt, E. R. Effect of Flooding Under the Gas Exchange of Cocoa Seedlings. Journal of Agricultural Science. 2019, 11, 16. [CrossRef]
- Souza, C. A. S.; Aguilar, M. A. G.; Dias. L. A. S.; Siqueira, P. R. Relações hídrica e irrigação. In: Souza C.A.S.; Dias L.A.S.; Aguilar M.A.G.; Borém, A. Cacau: do plantio à colheita. Pp. 287. Ed. UFV, Viçosa, 2016.
- Vidal, D. B.; Andrade, I. L. M. M.; Dalmolin, Â.; Mielke, M. Photosynthesis and growth of copaiba seedlings subjected to soil flooding. Floresta e Ambient. 2019, 26, 1. [CrossRef]
- Sairam, R. K.; Kumutha, D.; Ezhilmathi, K.; Deshmukh, P. S.; Srivastava, G. C. Physiology and biochemistry of waterlogging tolerance in plants. Biol Plant. 2008, 52. [CrossRef]
- Bailey-Serres, J.; Voesenek, L. A. C. J. Flooding stress: aclimations and genetic diversity. Annu. Rev. Plant Biol. 2008, 59. [CrossRef]
- Yeung, E.; Bailey-Serres, J.; Sasidharan, R. After The Deluge: Plant Revival Post-Flooding. Trends Plant Sci. 2019, 24, 5. [CrossRef]
- Rosa, D. B. C. J.; Scalon, S. D. P. Q.; Cremon, T.; Dresch, D. M. Gas exchanges and antioxidant activity in Copaifera langsdorffii desf. seedlings after flooding. Am. J. Plant Sci. 2018, 9, 5. [CrossRef]
- Jackson, M. B.; Colmer, T. D. Response and adaptation by plants to flooding stress. Ann. Bot. 2005, 96. [CrossRef]
- Chen, X.; Visser, E. J.; De Kroon, H.; Pierik, R. Fitness consequences of natural variation in flooding induced shoot elongation in Rumex palustris. New Phytol. 2011, 190. [CrossRef]
- Herrera, A.; Tezara, W.; Marin, O.; Rengifo, E. Estomatal and non estomatal limitations of photosynthesis in trees of a tropical seasonally flooded forest. Physiol. Plant. 2008, 134, 1. [CrossRef]
- Bertolde, F. Z.; Almeida, A. A. F.; Pirovani, C. P.; Gomes, F. P.; Ahnert, D.; Baligar, V. C.; Valle, R. R. Physiological and biochemical responses of Theobroma cacao L. genotypes to flooding. Photosynthetica. 2012, 50. [CrossRef]
- Sodré, G. A. Formação de mudas de Cacaueiro, onde nasce a boa cacauicultura. CEPLAC/CEPEC. Boletim Técnico, 2013.
- Dousseau, S.; Alvarenga, A. A.; Castro, E. M.; Soares, R. P.; Emrich, E. B; Melo, L. A. Anatomia foliar de Tabebuia serratifolia (Vahl) Nich. (Bignoniaceae) propagadas in vitro, in vivo e durante a aclimatização. Cienc. Agrotecnol. 2008, 32. [CrossRef]
- Arnon, D. I. Copper enzymes in isolates choroplasts. Polyphenoloxidade in Beta vulgaris. Plant Physiol. 1949, 24, 1. [CrossRef]
- Duke, S. O.; Kenyon, W.H. Effects of dimethazone (FMC 57020) on chloroplast development II. Pigment synthesis and photosynthetic function in cowpea (Vigna unguiculata L.) primary leaves. Pestic. Biochem. Physiol. 1986, 25, 1. [CrossRef]
- Sandmann, G.; Böger, P. Comporison of the bleaching activity of Norflurazon and Oxyfluorfen. Weed Sci. 1983, 31. [CrossRef]
- Zanandrea, I.; Alves, J. D.; Deuner, S.; Goulart, P. F. P.; Henrique, P. D. C.; Silveira, N. M. Tolerance of Sesbania virgata plants to flooding. Aust. J. Bot. 2010, 57. [CrossRef]
- Yemm, E. W.; Willis, A. I. The estimation of carbohydrates in plant extracts by anthrone. Biochem. J. 1954, 57. [CrossRef]
- Miller, G.L. (1959) Use of Dinitrosalicylic Acid Reagent for Determination of Reducing Sugar. Journal of Analytical Chemistry. 1959, 31.
- Ferreira D.F. Sisvar 4.3 Sistema de Análises Estatísticas – UFLA, Lavras 1999.
- R Core Team. R: A language and environment for statistical computing. – R Foundation for Statistical Computing, Vienna, Austria, 2025. https://www.R-project.org/.
- Dalmolin, A. C.; Dalmagro, H. J.; Lobo, F.; Antunes, M. Z.; Ortíz, C. E. R.; Vourlitis, G. L. Photosynthetic light and carbon dioxide response of the invasive tree Vochysia divergens Pohl to experimental flooding and shading. Photosynthetica. 2013, 51, 3. [CrossRef]
- Branco, M. C. S.; Almeida, A. A. F.; Dalmolin, Â. C.; Ahnert, D.; Baligar, V. C. Influence of low light intensity and soil flooding on cacao physiology. Sci. Hortic. 2017, 217, 15. [CrossRef]
- Klumb, E. K.; Braga, E. J. B.; Bianchi, V. J. Differential expression of genes involved in the response of Prunus spp. rootstocks under soil flooding. Sci. Hortic. 2019. [CrossRef]
- Mielke, M. S.; De Almeida, A. A. F.; Gomes, F. P.; Aguilar, M. A. G.; Mangabeira, P. A. O. Leaf gas exchange, chlorophyll fluorescence and growth responses of Genipa americana seedlings to soil flooding. Environ. Exp. Bot. 2003, 50. [CrossRef]
- Li, F.; Bao, W.; Wu, N.; You, C. Growth, biomass partitioning, and water-use efficiency of a leguminous shrub (Bauhinia faberi var. Microphylla) in response to various water availabilities. New For. 2008, 36. [CrossRef]
- Silva, C. E. M.; Gonçalves, J. F. C.; Feldpausch, T. R. Water-use efficiency of tree species following calcium and phosphorus application on an abandoned pasture, central amazonia, Brazil. . Environ. Exp. Bot. 2008, 64. [CrossRef]
- Mielke, M. S.; De Almeida, A. A. F.; Gomes, F. P.; Mangabeira, P. A. O.; Silva, D. D. C. Effects of soil flooding on leaf gas exchange and growth of two neotropical pioneer tree species. New For. 2005, 29, 2. [CrossRef]
- Camison, Á.; Martín, M. Á.; Dorado, F. J.; Moreno, G.; Solla, A. Changes in carbohydrates induced by drought and waterlogging in Castanea sativa. Trees. 2019. [CrossRef]
- Lourenço L. F. G.; Guerreiro R. G. O.; Romagnolo, M. B.; Pastorini, L.; Souza, L. A. Efeito do alagamento e da seca sobre o crescimento e fisiologia de Peltophorum dubium (Fabaceae). Rev. Agro. Amb. 2024, 17 e12664. [CrossRef]
- Ouyang, W.; Struik, P. C.; Yin, X.; Yang, J. Stomatal conductance, mesophyll conductance, and transpiration efficiency in relation to leaf anatomy in rice and wheat genotypes under drought. Journal of Experimental Botany. 2017, 68, 18. [CrossRef]
- Rehem, B. C.; De Almeida, A. A. F.; Mielke, M. S.; Gomes, F. P.; Valle, R. R. Photosynthetic and growth responses of Theobroma cacao L. clones to waterlogging. J. Trop. Agric. 2010, 48, 2.
- Almeida, J.; Tezara, W.; Herrera, A. Physiological responses to drought and experimental water deficit and waterlogging of four clones of cacao (Theobroma cacao L.) selected for cultivation in Venezuela. Agric. Water Manage. 2016, 171. [CrossRef]
- Kreuzwieser, J.; Rennenberg, H. Molecular and physiological responses of trees to waterlogging stress. Plant Cell Environ. 2014, 37. [CrossRef]
- Yu, B.; Zhao, C. Y.; Li, J.; Li, J. Y.; Peng, G. Morphological, physiological, and biochemical responses of Populus euphratica to soil flooding. Photosynthetica. 2015, 53. [CrossRef]
- Voesenek, L. A.; Bailey-Serres J. Flood adaptive traits and processes: an overview. New Phytol. 2015, 206. [CrossRef]
- Melo, L. A. D.; Melo, H. C. D.; Davide, A. C.; Castro, E. M. D.; Santos, J. D. P. D. Estaquia e efeito da deficiência hídrica ou inundação sobre características morfoanatômicas de Cestrum axillare Vell. Ci. Fl. 2017, 27, 1. [CrossRef]
- Chaves, M. M; Flexas, J.; Pinheiro, C. Photosynthesis under drought and salt stress: regulation mechanisms from whole plant to cell. Ann. Bot. 2009, 103, 4. [CrossRef]
- Nogueira, N. O.; Martins, L. D.; Tomaz, M. A.; Andrade, F. V.; Passos, R. R. Teor de nitrogênio, clorofila e relação clorofila-carotenoide em café arábica em solo submetido a diferentes corretivos de acidez. Rev. Bras. Ciênc. Agrár. 2013, 8, 3. [CrossRef]
- Nascimento, R.; Deuner, S.; Ferreira, L. S.; Badinelli, P. G.; Kerber, R. S. Crescimento e teores de clorofila e carotenóides em três cultivares de soja em função da adubação com magnésio. Rev. Ceres. 2009, 56, 3.
- Zaidi, P.H.; Maniselvan, P.; Yadav, P.; Singh, A.K.; Sultana, R.; Dureja, P.; Singh, R.P.; Srinivasan, G. Stress-adaptive changes in tropical maize (Zea mays L.) under excessive soil moisture estress. Maydica. 2007, 52.
- Streit, N. M.; Canterle, L. P.; Canto, M. W.; Hecktheuer, L. H. H. As clorofilas. Ciênc. Rural. 2005, 35, 3. [CrossRef]
- Pezeshki, S. R. Wetland plant responses to soil flooding. Environ. Exp. Bot. 2001, 46, 3. [CrossRef]
- Colmer, T. D.; Voesenek, L. A. C. J. Flooding tolerance: suites of plants traits in variable environments. Funct. Plant Biol. 2009, 36. [CrossRef]
- Tamang, G.; Fukao, T. Plant adaptation to multiple stresses during submergence and following desubmergence. Int. J. Mol. Sci. 2015, 16, 12. [CrossRef]
- Mechri, B.; Tekaya, M.; Hammami, M.; Effects of drought stress on phenolic accumulation in greenhouse-grown olive trees (Olea europaea). Biochemical Systematics and Ecology. 2020, 92,104112. [CrossRef]
- Ferner, E.; Rennenberg, H.; Kreuzwieser, J. Effect of flooding on C metabolism of flood-tolerant (Quercus robur) and non-tolerant (Fagus sylvatica) tree species. Tree physiol. 2012, 32. [CrossRef]
- Qin, X.; Li, F.; Chen, X.; Xie, Y. Growth responses and non-structural carbohydrates in three wetland macrophyte species following submergence and de-submergence. Acta physiologiae plantarum. 2013, 35. [CrossRef]
- Gangola, M.P.; Ramadoss, B. R. Sugars play a critical role in abiotic stress tolerance in plants. In: Wani S.H. (ed). Biochemical, physiological and molecular avenues for combating abiotic stress tolerance in plants. Pp. 17-38. Academic Press, London 2018. [CrossRef]
- Bertolde, F. Z.; Almeida, A. A. F.; Corrêa, R. X.; Gomes, F. P.; Gaiotto, F. A.; Baligar, V. C.; Loguércio, L. L. Molecular, physiological and morphological analysis of waterlogging tolerance in clonal genotypes of Theobroma cacao L. Tree Physiol. 2010, 30, 1. [CrossRef]
- Sasidharan, R.; Hartman, S.; Liu, Z.; Martopawiro, S.; Sajeev, N.; Van Veen, H.; Voesenek, L. A. Signal dynamics and interactions during flooding stress. Plant physiol. 2018, 176, 2. [CrossRef]
- Winkel, A.; Visser, E. J.; Colmer, T. D.; Brodersen, K. P.; Voesenek, L. A.; Sand-Jensen, K.; Pedersen, O. Leaf gas films, underwater photosynthesis and plant species distributions in a flood gradient. Plant Cell Environ. 2016, 39, 7. [CrossRef]
- Ye, X. Q.; Meng, J. L.; Zeng, B.; Wu, M. Improved flooding tolerance and carbohydrate status of flood-tolerant plant Arundinella anomala at lower water temperature. PloS one. 2018, 13, 3. [CrossRef]
Figure 1.
Total precipitation [mm], relative humidity [%] and maximum [°C], average [°C], and minimum temperatures [°C] recorded at the Linhares weather station (ES) from May to July 2019, during the acclimatization process and evaluation of the experiment. Source: INCAPER, 2019.
Figure 1.
Total precipitation [mm], relative humidity [%] and maximum [°C], average [°C], and minimum temperatures [°C] recorded at the Linhares weather station (ES) from May to July 2019, during the acclimatization process and evaluation of the experiment. Source: INCAPER, 2019.
Figure 2.
A-E – net photosynthetic rate (PN), F-J – gs stomatal conductance (F-J), and K-O – E transpiration (E) of unflooded (UF) and flooded (F) of cocoa genotypes TSH–1188 (A,F,K), Pará (B,G,L), Cepec–2002 (C,H,M), Esfip–02 (D,I,N) and SJ–02 (E,J,O) evaluated during 55 days of flooding.
Figure 2.
A-E – net photosynthetic rate (PN), F-J – gs stomatal conductance (F-J), and K-O – E transpiration (E) of unflooded (UF) and flooded (F) of cocoa genotypes TSH–1188 (A,F,K), Pará (B,G,L), Cepec–2002 (C,H,M), Esfip–02 (D,I,N) and SJ–02 (E,J,O) evaluated during 55 days of flooding.
Figure 3.
A-E – Ratio of intra/extracellular CO2 concentrations (Ci/Ca), F-J – water use efficiency (WUE), K-O – Chl (SPAD unit) of unflooded (UF) and flooded (F) plants of cocoa genotypes TSH–1188 (A,F,K), Pará (B,G,L), Cepec–2002 (C,H,M), Esfip–02 (D,I,N) and SJ–02 (E,J,O) evaluated during 55 days of flooding.
Figure 4.
A-E – net photosynthetic rate (PN), F-J – gs stomatal conductance (F-J), and K-O – E transpiration (E) of TSH–1188 (A,F,K), Pará (B,G,L), Cepec–2002 (C,H,M), Esfip–02 (D,I,N) and SJ–02 (E,J,O), evaluated during recovery after the suspension of flooding. The starting point represents the last assessment (55 days of flooding) and the reference line represents the last assessment of the control.
Figure 5.
A-E – Ratio of intra/extracellular CO2 concentrations (Ci/Ca), F-J – water use efficiency (WUE), K-O – Chl (SPAD unit) of TSH–1188 cocoa (A,F,K), Pará (B,G,L), Cepec–2002 (C,H,M), Esfip–02 (D,I,N) and SJ–02 (E,J,O) genotypes, evaluated during recovery after the flooding interruption. The starting point represents the last assessment (55 days of flooding) and the reference line represents the last assessment of the control.
Table 1.
Leaf and stem anatomical characteristics (Stomatal density, ratio polar diameter/equatorial diameter (DP/DE ratio), Lenticel length and Lenticel height), evaluated in flooded and non-flooded plants after 60 days of flooding and recovered after 30 days of flooding suspension in the five assessed cocoa genotypes.
| |
Genotypes |
|
| Treatment |
Cepec-2002 |
SJ-02 |
Esfip-02 |
Pará |
TSH-1188 |
Means |
| Stomatal density |
|
| Non-flooded |
35.96bA |
33.70bC |
35.16bB |
34.83bA |
40.48aA |
|
| Flooded |
25.16cB |
42.74aA |
43.38aA |
32.25bA |
29.35bC |
|
| Recovered |
33.54bA |
37.58aB |
32.74bB |
31.61bA |
35.64aB |
|
| DP/DE ratio |
|
| Non-flooded |
0.92aA |
1.0aA |
1.0aA |
1.05aA |
0.97aA |
|
| Flooded |
1.07aA |
0.75bB |
0.97aA |
0.95aA |
0.85bA |
|
| Recovered |
0.97aA |
0.95aA |
1.0aA |
1.0aA |
0.97aA |
|
| Lenticel length |
|
| Non-flooded |
0aB |
0aC |
0aB |
0aC |
0aB |
|
| Flooded |
0.55aA |
0.65aA |
0.63aA |
0.61aA |
0.58aA |
|
| Recovered |
0.54bA |
0.50bB |
0.67aA |
0.50bB |
0.58bA |
|
| Lenticel height |
|
| Non-flooded |
0 |
0 |
0 |
0 |
0 |
0C |
| Flooded |
0.55 |
0.65 |
0.63 |
0.61 |
0.58 |
0.22A |
| Recovered |
0.54 |
0.5 |
0.67 |
0.5 |
0.58 |
0.15B |
Table 2.
Analysis of Chlorophyll (Chl a, Chl b and Chl total) [μg mL-1] and Total carotenoids [μg mL-1] in flooded and non-flooded environments evaluated after 60 days of flooding.
Table 2.
Analysis of Chlorophyll (Chl a, Chl b and Chl total) [μg mL-1] and Total carotenoids [μg mL-1] in flooded and non-flooded environments evaluated after 60 days of flooding.
| |
Genotypes |
|
| Environment |
Cepec-2002 |
SJ-02 |
Esfip-02 |
Pará |
TSH-1188 |
Means |
| Chl a
|
| Non-flooded |
9.12 |
10.24 |
11.15 |
9.27 |
6.9 |
9.33A |
| Flooded |
7.46 |
5.7 |
5.85 |
6.58 |
6.57 |
6.43B |
| Chl b
|
| Non-flooded |
10.0925 |
11.57 |
13.14 |
9.8725 |
7.415 |
10.418A |
| Flooded |
9.5125 |
6.0025 |
6.8125 |
7.6975 |
8.425 |
7.69B |
| Chl total |
| Non-flooded |
19.2 |
21.8 |
24.28 |
19.14 |
14.31 |
19.75A |
| Flooded |
16.96 |
11.7 |
12.66 |
14.28 |
14.99 |
14.12B |
| Total carotenoids |
| Non-flooded |
619.68 |
555.83 |
684.9 |
513.76 |
579.59 |
590.75A |
| Flooded |
551.88 |
392.23 |
616.04 |
469.39 |
472.13 |
500.33B |
| Means |
585.78a |
474.03b |
650.47a |
491.58b |
525.86b |
|
Table 3.
Quantification of carbohydrates reducing sugar (RS) [mg g–1] DM of leaf, total soluble sugar (TSS) [mg g–1] DM of leaf, and root of five genotypes of non-flooded, flooded, and recovered cocoa.
Table 3.
Quantification of carbohydrates reducing sugar (RS) [mg g–1] DM of leaf, total soluble sugar (TSS) [mg g–1] DM of leaf, and root of five genotypes of non-flooded, flooded, and recovered cocoa.
| |
Genotype |
|
| Environment |
Esfip-02 |
Cepec-2002 |
SJ-02 |
Pará |
TSH-1188 |
Means |
| RS Leaf |
| Non-flooded |
43.40aC |
42.51aC |
38.11aB |
37.91aC |
45.65aC |
|
| Flooded |
77.42bA |
77.75bA |
58.42cA |
78.49bA |
101.12aA |
|
| Recovered |
60.36aB |
63.05Ab |
57.23aA |
53.49aB |
65.62aB |
|
| TSS Leaf |
| Non-flooded |
60.83aB |
54.33aB |
52.33aB |
50.73aC |
70.42aB |
|
| Flooded |
134.47aA |
137.43aA |
115.26bA |
108.14bA |
98.43bA |
|
| Recovered |
61.61aB |
73.63aB |
65.24aB |
79.98aB |
69.80aB |
|
| Starch Leaf |
| Non-flooded |
120.99 |
127.13 |
127.98 |
120.63 |
119.97 |
123.34C |
| Flooded |
150.54 |
155.7 |
157.58 |
144.74 |
147.82 |
151.28A |
| Recovered |
138.13 |
139.79 |
137.18 |
144.42 |
147.76 |
141.46B |
| Starch Root |
| Non-flooded |
143.98 |
130.15 |
152.65 |
132.14 |
150.3 |
141.84 C |
| Flooded |
182.01 |
124.48 |
188.29 |
156.26 |
190.8 |
168.36 B |
| Recovered |
211.94 |
167.66 |
187.02 |
178.63 |
197.31 |
188.51 A |
| Means |
179.31a |
140.76b |
175.99a |
155.67b |
179.47a |
|
| TSS Root |
| Non-flooded |
52.26 |
27.32 |
37.5 |
31.27 |
32.55 |
36.18C |
| Flooded |
104.09 |
95.96 |
70.84 |
89.87 |
72.87 |
86.72A |
| Recovered |
83.31 |
42.02 |
81.08 |
56.23 |
71.66 |
67.46B |
|
Disclaimer/Publisher’s Note: The statements, opinions and data contained in all publications are solely those of the individual author(s) and contributor(s) and not of MDPI and/or the editor(s). MDPI and/or the editor(s) disclaim responsibility for any injury to people or property resulting from any ideas, methods, instructions or products referred to in the content. |
© 2025 by the authors. Licensee MDPI, Basel, Switzerland. This article is an open access article distributed under the terms and conditions of the Creative Commons Attribution (CC BY) license (http://creativecommons.org/licenses/by/4.0/).