Submitted:
10 November 2025
Posted:
11 November 2025
You are already at the latest version
Abstract
The 1964 M7.5 Niigata Earthquake remains one of the most significant natural laboratories for understanding seismic-induced soil liquefaction and its dependence on geological setting. Among global field case histories, Niigata stands out for the exceptional docu-mentation of liquefaction triggering, lateral spread displacements, and soil–structure interaction. This paper reexamines the event from an engineering–geologic perspective, emphasizing how Holocene coastal and fluvial depositional processes beneath the Echigo Plain controlled the spatial and stratigraphic distribution of liquefaction during the 1964 earthquake. The most severe ground deformations occurred in fluvially reworked sands derived from three major Holocene dune and barrier-island systems (CSD1,2,3) formed along the paleo-shoreline of the Sea of Japan. The largest of these, a mid-Holocene transgressive barrier complex deposited 50–60 m of beach and aeolian sand between 8 and 5 ka B.P., now lies buried 5–8 km inland beneath fine-grained alluvial deposits. Tectonic downwarping and deltaic progradation by the Shinano and Agano Rivers re-distributed these sands into loose, saturated fluvial facies beneath modern Niigata City. Quantitative geotechnical analyses demonstrate that liquefaction occurs within these reworked Holocene units rather than anthropogenic fills.
Keywords:
Holocene
; geology
; aeolian sands
; barrier-island deposits
; fluvial reworking
; seismic
; earthquake
; liquefaction susceptibility
1. Introduction
The 1964 Niigata Mw=7.5 earthquake remains a watershed event in the history of geotechnical earthquake engineering and soil mechanics. The widespread liquefaction, settlement, and lateral displacement of the city’s alluvial and reclaimed ground resulted in catastrophic failures of buildings, bridges, and port facilities, offering unprecedented insights into soil-structure interaction and cyclic mobility of saturated sand deposits. These effects have been comprehensively documented in subsequent decades through detailed field investigations, laboratory testing, and aerial photographic analyses. This paper examines in greater depth the regional Holocene geology beneath the Echigo Plain, which exerted a first-order control on the amplification of ground motion, pore-pressure generation, and resulting liquefaction manifestations during the 1964 event. The same stratigraphic and geomorphic framework continues to pose a persistent hazard to the modern urban infrastructure of Niigata. Moreover, this case is not isolated: along the entire Tohoku coastline of the Sea of Japan, earthquake damage patterns are dominantly governed by Quaternary depositional environments and their tectonic modification (e.g., Fukui, 1948; Niigata, 1964; Nihon Kai-Chubu, 1983; Niigata Chuetsu, 2004; Niigata Chuetsu-Oki, 2007).
2. Regional and Geologic Setting
The western margin of Tōhoku is tectonically delineated by the Niigata–Kobe Tectonic Zone (NKTZ), a seismically active corridor accommodating deformation between the Eurasian and Okhotsk/North American plates [1,2]. This zone serves as the dominant source of crustal strain accumulation and intraplate seismicity. Niigata City occupies the western edge of the Echigo Plain—a large, subsiding coastal alluvial basin fronting the Sea of Japan—whose geomorphology has been shaped by repeated phases of marine transgression, deltaic progradation, and active fault-controlled subsidence. The Shinano and Agano Rivers, the principal fluvial systems draining the plain (Figure 1), built extensive Holocene floodplains and natural levees, which were among the most severely liquefied zones in 1964 due to their loose, saturated sandy sediments and shallow groundwater conditions. Complimenting the geomorphic map of the Echigo plain is a geologic map of the region [3] simplified to present the critical geomorphic and geological units presented here (Figure 2). Within Figure 2 are inset areas for the Ohgata-Ebigase Neighborhood, Niigata Station area, and Kawagishi-cho Echigo neighborhoods.
To the surprise of researchers, the inland reaches of these river systems were largely unaffected by liquefaction during later events such as the 2004 Niigata Chuetsu earthquake [4,5] and the 2007 Niigata Chuetsu-Oki earthquake [6]. This spatial contrast emphasizes that the coastal geomorphic and sedimentologic features of the Echigo Plain—rather than earthquake magnitude or distance alone—control the liquefaction susceptibility and deformation patterns observed.
2.1. Coastal Sand Dune I (CSD1)
The Echigo Plain is exceptional in Japan for its thick Quaternary alluvial prism, exceeding 140 m in places due to long-term tectonic downwarping and sediment accumulation. During the early Holocene marine transgression (ca. 8,000–5,000 years B.P.), a prominent coastal barrier-island complex composed of beach and aeolian dune sands developed along the shoreline [7,8]. This 50–60 m thick barrier deposit, designated Coastal Sand Dune I (CSD1), now lies 5–8 km inland from the present coastline, having been subsequently planed off and buried beneath younger floodplain silts and fine sands. Surface exposures of CSD1 occur locally at Kameda in Kohnan Ward and at Ota and Sasaki in Kita Ward. CSD1 consists of well-sorted fine- to coarse-grained sands, with Standard Penetration Test (SPT) N-values typically between 20 and 40, indicative of medium-dense to dense relative states [7,8]. These competent sands exhibited only limited liquefaction in 1964. Stratigraphically, CSD1 is capped by the distinctive 5,000 y.b.p. Numazawa volcanic ash layer, providing a key tephrochronological marker within the Echigo sequence [9].
In mid-Holocene time, the CSD1 barrier island extended continuously across the plain, interrupted only by the paleo–Shinano River. The paleo-channel of the Agano River has not been conclusively identified but was likely confluent with the Shinano system south of the barrier complex during the Holocene highstand [7,8].
2.2. Coastal Sand Dunes 2 and 3 (CSD2, CSD3)
Continued subsidence of the Echigo Plain, averaging one to four meters per millennium, has progressively downwarped its western margin due to movement along the Kakuda–Yahiko fault zone. This tectonic subsidence facilitated rapid westward progradation of deltaic and beach-ridge complexes. The second major sand ridge system (CSD2) was active from approximately 3000–2000 years B.P. and is widely exposed across urban Niigata, from the right bank of the Shinano River to the coastal plain northeast of the Agano River mouth. West of the Shinano, these deposits are masked by floodplain overbank sediments. The youngest coastal complex, CSD3 (≤2000 years B.P. to present), forms the active foredune belt along the modern shoreline [10]. CSD2 and CSD3 consist of well-sorted aeolian and littoral sands reworked from older CSD1 deposits and fluvially transported by the Shinano and Agano Rivers. Similar to CSD1, their SPT N-values of 20–40 correspond to medium-dense states and they showed little to no liquefaction in 1964, highlighting the importance of depositional environment and relative density in governing liquefaction resistance
3. Hydrologic and Anthropogenic Modification
The Holocene evolution of the Echigo drainage system has been complex, with repeated avulsions and anthropogenic modifications. Before 1731, the Agano River flowed southwest and joined the Shinano near present-day Bandai Island, its outlet to the Sea of Japan obstructed by the CSD3 dune complex near the current Niigata Airport. During the Tokugawa Shogunate, in 1731, the Matsugasaki Waterway was excavated through CSD1 to create a direct outlet for the Agano River to the Sea. This hydraulic realignment, combined with later canalization, levee construction, and infilling of floodplains, significantly altered the subsurface stratigraphy. By the 20th century, the Agano’s original floodplain—up to 1.5 km wide—had been confined to a narrow 10-m-wide canal (Tsusen River) lined by reclaimed and urbanized ground. These anthropogenic fills and reworked native sands proved highly liquefiable in 1964.This section may be divided by subheadings. It should provide a concise and precise description of the experimental results, their interpretation, as well as the experimental conclusions that can be drawn.
4. Liquefaction During the 1964 Earthquake
The hydrological and geomorphological transformations that culminated in the 18th century dramatically increased Niigata’s vulnerability to liquefaction. Subsequent analyses by the JSCE, PWRI, and numerous universities [11] provided fundamental correlations between in-situ test parameters, soil density, and cyclic resistance. Hamada [12], as part of the NCEER Technical Report 92-001, conducted a landmark mapping of surface manifestations and lateral spread displacements using aerial imagery and field reconnaissance—analogous in approach to Collins and Foster’s (1949) documentation of the Fukui earthquake [13].
The Ohgata–Ebigase neighborhoods in Higashi and the Niigata Station–Hotel Niigata area exhibited lateral spreads of 3–6 m, predominantly within native Holocene sands of unit Bms, derived from fluvial reworking of CSD1 and CSD2 materials. Displacements occurred on gradients less than 1°, illustrating that even minimal slopes can drive extensive lateral spreading in liquefied strata. The Kawagishi-cho district, globally recognized for the bearing capacity failures of multi-story structures, revealed continuous liquefaction from 2.5–13.5 m depth within native riverbed sands overlain by reclaimed fill [11]. These sands, classified by Hamada [11] as Alluvial soil -1 (As-1) and Alluvial soil -2 (As-2), correspond to paleo–Shinano channel deposits formed during the Tokugawa era.
The depth and continuity of the liquefied layer demonstrate that liquefaction extended through native sediment profiles, not merely artificial fills. For example, at the Ohgata primary school area of the Ohgata–Ebigase neighborhoods in Higashi Ward, Figure 3a is the GSJ geological map [3] with an inset 3b that is a modified map [11] showing displacement vectors from lateral spreading of the surface layers. Figure 4, a cross-section at the Ohgata school shows the fill deposit resides almost entirely above the water table and the zone of soil liquefaction falling entirely within As-1 and As-2 (stippled region is the estimated liquefaction zone, Figure 4). That is, the human-placed fills have no contribution to the observed liquefaction damage.
At Ohgata–Ebigase neighborhood, the properties of the fill are not relevant to the liquefaction occurrence. Similarly, at the central district near Niigata Station and Hotel Niigata sites, Figure 5a and 5b, the fills play essentially no role in the liquefaction performance of the underlying soil deposits either because it is above the water table or represents a thin veneer above the liquefied (stippled region) in native alluvium As-1 and As-2. Figure 6 presents a cross-section of the upper 20 meters of soil and shows that the man-made fill is a thin layer, largely above the water table, and that the liquefaction occurred in the native alluvium As-1 and As-2.
At the site of the famous bearing capacity failures of the Kawagishi-cho apartment buildings and the collapsed Showa bridge, the fill does intersect the but generally lies above the liquefied zone As-1 Figure 7a and 7b. The cross section for the Kawagishi-cho neighborhood and Shinano River are presented in Figure 8. At Kawagishi-cho apartment buildings famously suffered bearing capacity failure rotating the structures in liquefied soil (Figure 9). One of the apartment structures recorded the world’s first ground motions in liquefied soil. Beneath the foundation of the Showa Bridge the structural piers sat entirely on native As-1 liquefied materials. Thus, it can be observed that the liquefaction hazard of Niigata City is due almost entirely to the reworking of CSD1 and CSD2 sands by the natural migration of the Shinano River, and the opening of the Agano River channel to the sea that allowed for the development of land along the narrowed and channelized Tsusen River.
The 1964 Niigata event generated widespread liquefaction throughout the city, with lateral spreads of 3–6 m observed on slopes of less than 1° [12]. Detailed stratigraphic and geotechnical investigations [11] identified the primary liquefied units as native Holocene sands (As-1 and As-2) corresponding to fluvially reworked CSD1 and CSD2 deposits.
Cross sections (Figure 4 and Figure 6) from the Ohgata–Ebigase and Niigata Station areas show that liquefaction occurred entirely within these native sands, while man-made fills above the water table remained stable. At Kawagishi-cho, well-documented bearing failures of apartment structures occurred within liquefied As-1 strata (Figure 8). The piers of the Showa Bridge similarly rested on liquefied native sands. These observations confirmed that Niigata’s liquefaction hazard arises from the buried Holocene stratigraphy rather than surface reclamation materials.
5. Analytical Frameworks: Stress- and Energy-Based Evaluation
Seismic soil liquefaction triggering is modelled traditionally in two principal analytical frameworks: the cyclic stress-based and energy-based approaches. The conventional stress-based method forms the foundation of geotechnical earthquake engineering practice, wherein the cyclic shear stresses induced by earthquake shaking are related to the soil’s cyclic resistance capacity, expressed as a ratio of cyclic stress demand to cyclic resistance or capacity of the soil. The cyclic stress framework [14,15] quantifies the relationship between the imposed cyclic stresses from seismic loading and the corresponding resistance of the soil under undrained conditions.
In practice, the cyclic stress ratio (CSR)—defined as the normalized measure of seismic demand—is expressed as:
where is the peak horizontal ground acceleration, is gravitational acceleration, and are the total and effective vertical overburden stresses, respectively, and is the depth reduction factor accounting for soil mass participation. This formulation represents the seismic energy input in terms of equivalent cyclic shear stresses acting within the soil profile.
Considerable effort has been devoted to developing robust and standardized procedures for normalizing the computed cyclic stress ratio (CSR) to a consistent reference framework representative of common boundary conditions. This normalization enables comparison across different seismic and geostatic environments by reducing CSR to an equivalent reference state defined by an effective overburden stress of 1 atm, an earthquake moment magnitude of , and a static shear stress ratio (slope) of zero [16,17]. The CSR approach was modelled originally on the Niigata event, and so the magnitude normalization, Km, is a convenient 1.0. Likewise, the floodplain of the Shinano river is essential level (Ka = 1) and the liquefaction features occur at shallow depths of typically the upper ten meters of the soil column (Ks=1.0).
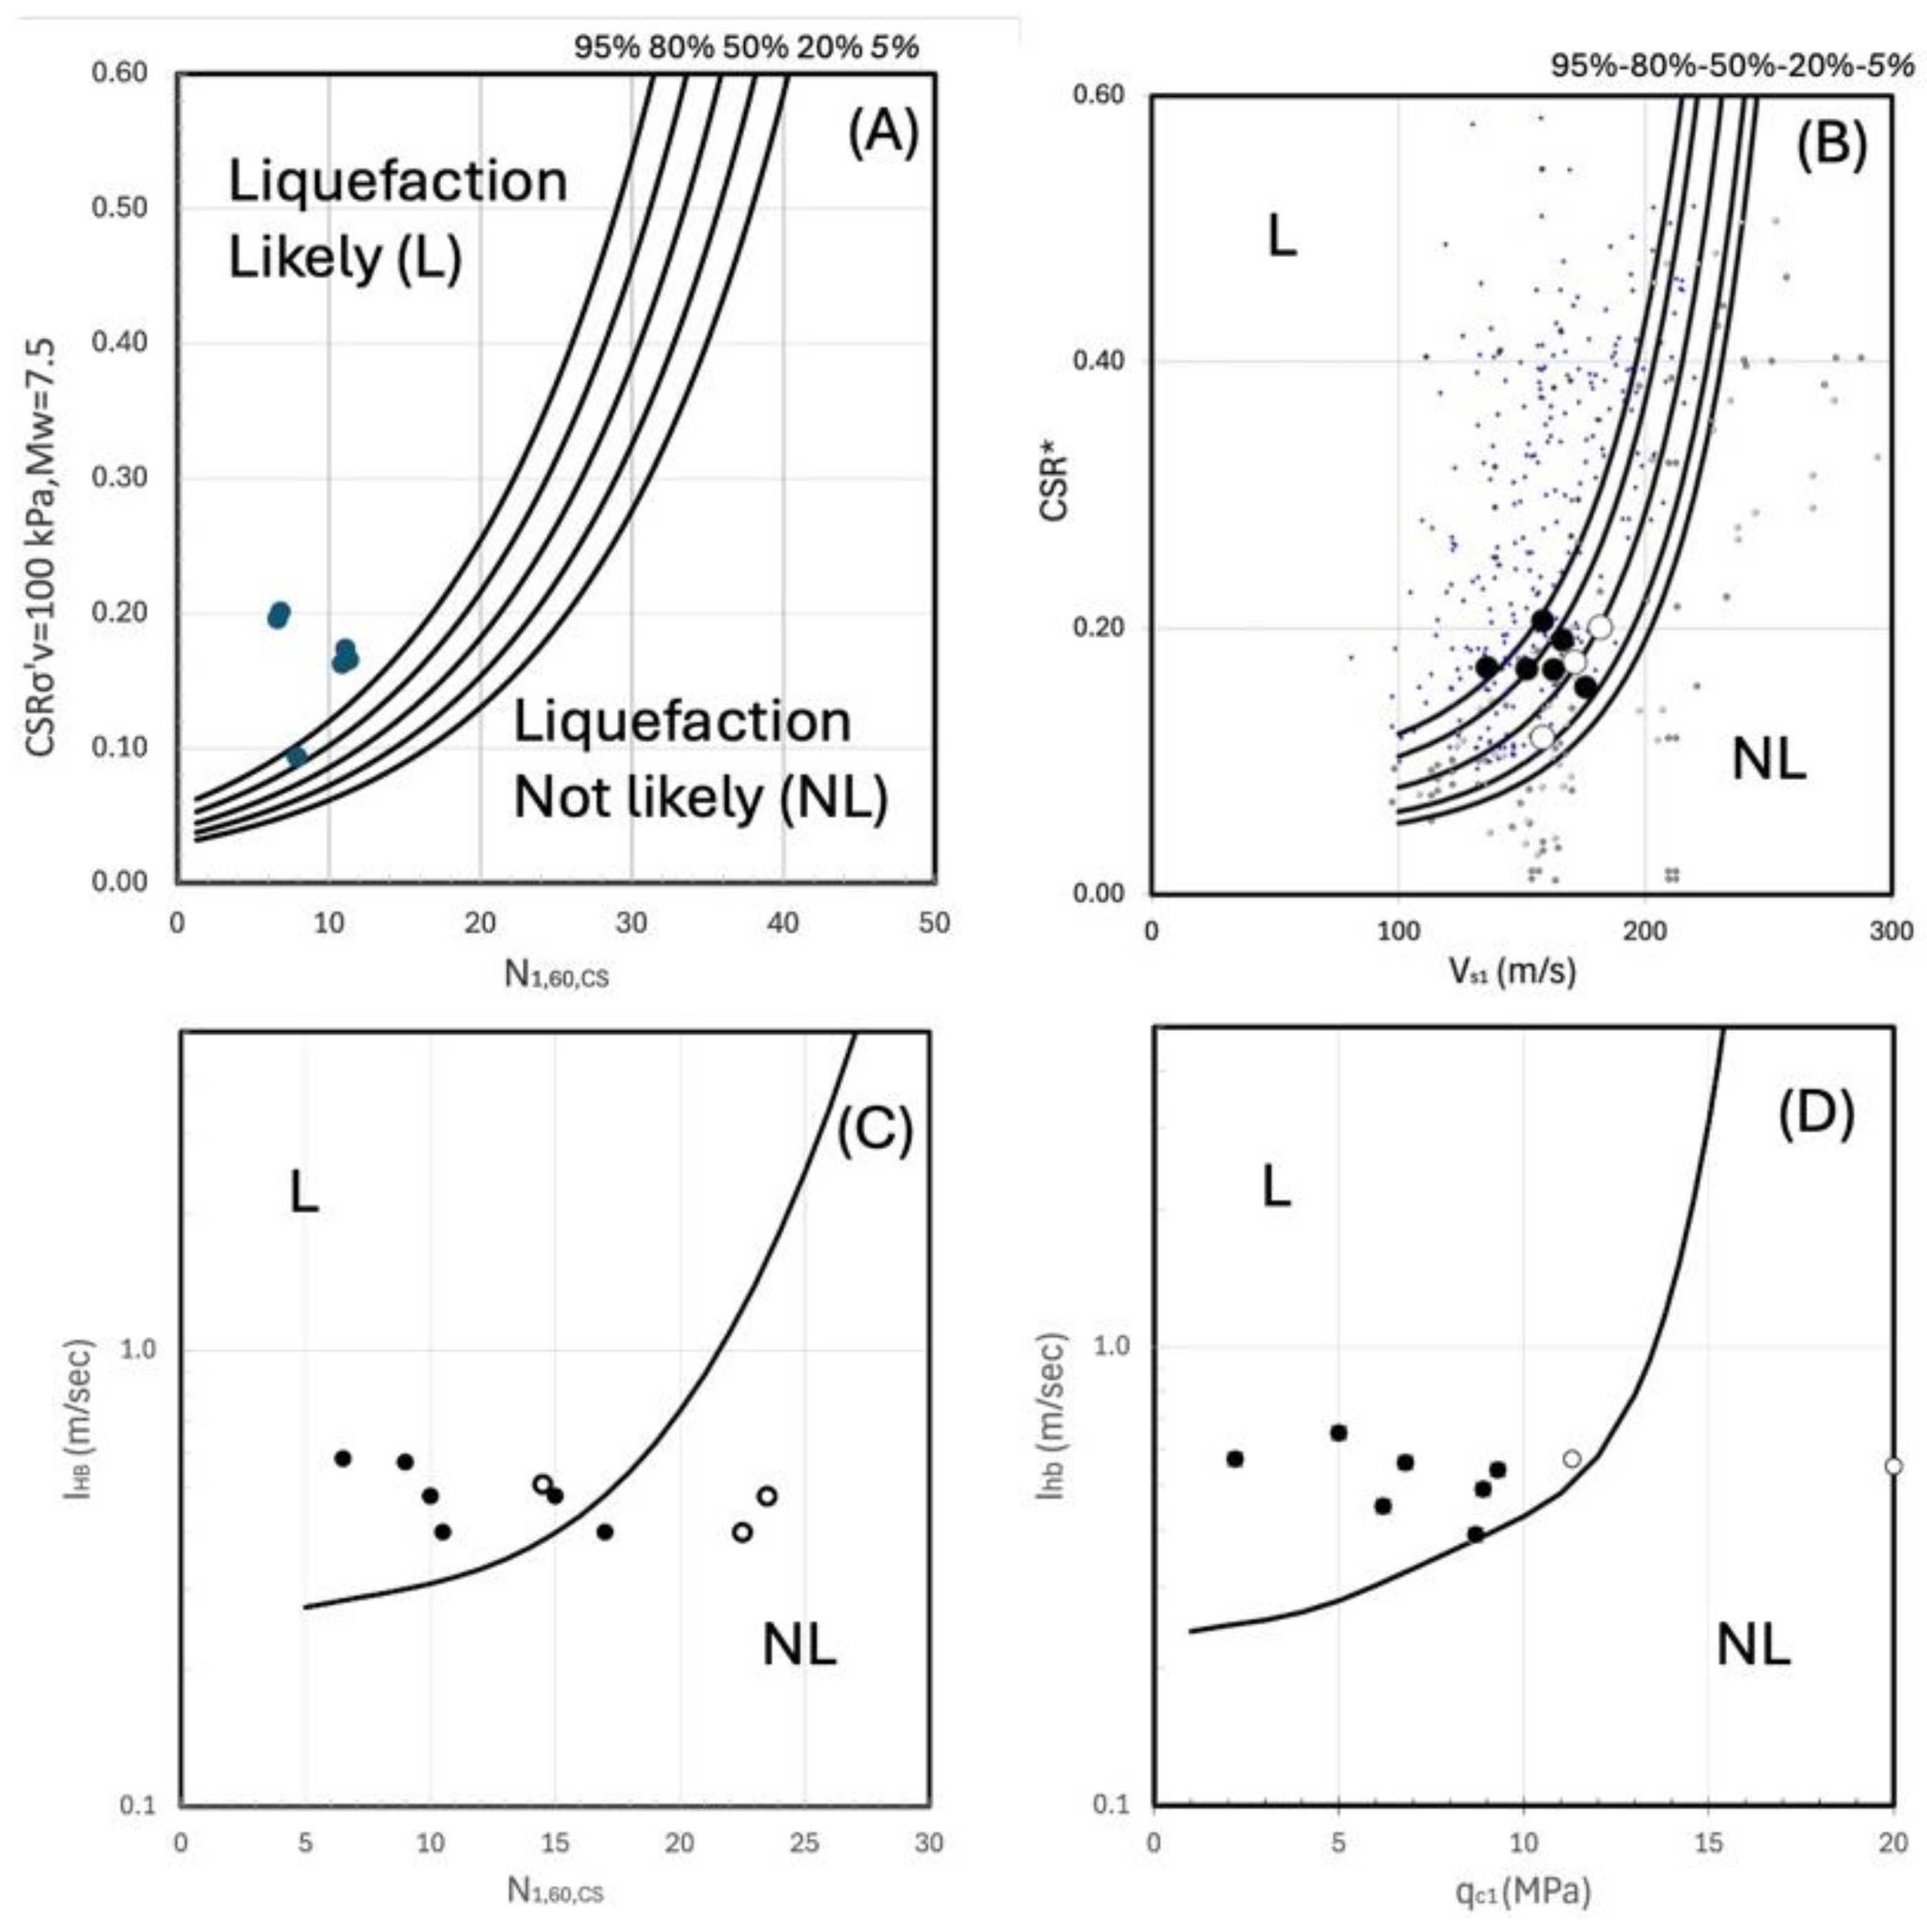
Current state-of-practice frameworks rely on in-situ testing procedures such as the Standard Penetration Test (SPT), Cone Penetration Test (CPT), and Shear Wave Velocity (Vs) profiling to characterize the cyclic resistance of soil deposits. These methods derive strength and stiffness proxies directly from the natural soil fabric and stress history measured in the field, thereby minimizing sampling bias. The most recent probabilistic CSR frameworks are presented with Niigata field data in Figure 10a for the Standard penetration test-, and Figure 10b and shear wave velocity test-data sets. Contours of likelihood of initial seismic soil liquefaction are plotted and are the result of Bayesian updating analysis and system reliability probabilistic modeling [17,18]. All of the standard penetration test data fall to the left, or the 50% probability of liquefaction occurrence line in Figure 10a. For the shear wave velocity data set three non-liquefaction points (open circles) reside on the 50% probability line or lower. Five of six points where liquefaction was observed after the 1964 event (solid black circles) reside in the zone of liquefaction probability greater than 50% apart from one point that was observed to have liquefied with a probability of 32%. The fine points in Figure 10b represent the entire data set used to model the probability boundaries. These points are shown here, so that the reader can understand where the Niigata dataset fit within a larger global shear wave velocity data set for liquefaction potential.
The data from Niigata, Japan are plotted against a field energy-based method, Arias Intensity, in Figure 10c and 10d for the standard penetration test and cone penetration test data sets. Foundational studies [19,20,21] demonstrated strong correlations between energy and the excess pore pressure ratio , suggesting that energy-based metrics may more accurately represent liquefaction onset.
Procedures employing Arias Intensity () as a quantitative indicator of the energy of earthquake shaking strength [20,22] used the mathematically defined time integral of the square of ground motion acceleration normalized by the gravitational acceleration, g.
where is the ground acceleration as a function of time, is gravitational acceleration, and is the total duration of strong shaking. This cumulative energy formulation inherently captures the effects of seismic demand characteristics—amplitude, duration, and frequency content— thereby offering a more mechanistic link to excess pore pressure generation. Arias Intensity provides a scalar representation of the total seismic energy imparted per unit mass at a site.
The two-component cumulative Arias Intensity (Ih) provides a physically meaningful measure of the total seismic energy demand imparted to the soil deposit by earthquake shaking. In Figure, 10c and 10d, a deterministic boundary line separating likely liquefaction from non-liquefaction performance separate solid points of observed liquefaction from open points of no observation of liquefaction during the 1964 event. For the standard penetration test, five of the six observed, liquefaction points lie to the left and above the boundary curve., With one point being a false negative. Two points of no observed liquefaction fall in the non-liquefaction zone, and one false positive is found to the left of the curve. The observed damage. For the con penetration test, all the observed, liquefaction points, lie above into the left of the boundary curve, indicating an accurate assessment of liquefaction. Two non-liquefaction points are present, one near the boundary curve, and one significantly stiffer. In general, the energy-based method performs well in characterizing the observed damage. The analytical methods for assessing field performance work well, to quantify, liquefaction potential and support the geologic evidence of specific coastal Sand dune deposits, being the primary source of the liquefaction hazard in Niigata city.
6. The 2024 Noto Earthquake: Evidence of Persistent Hazard
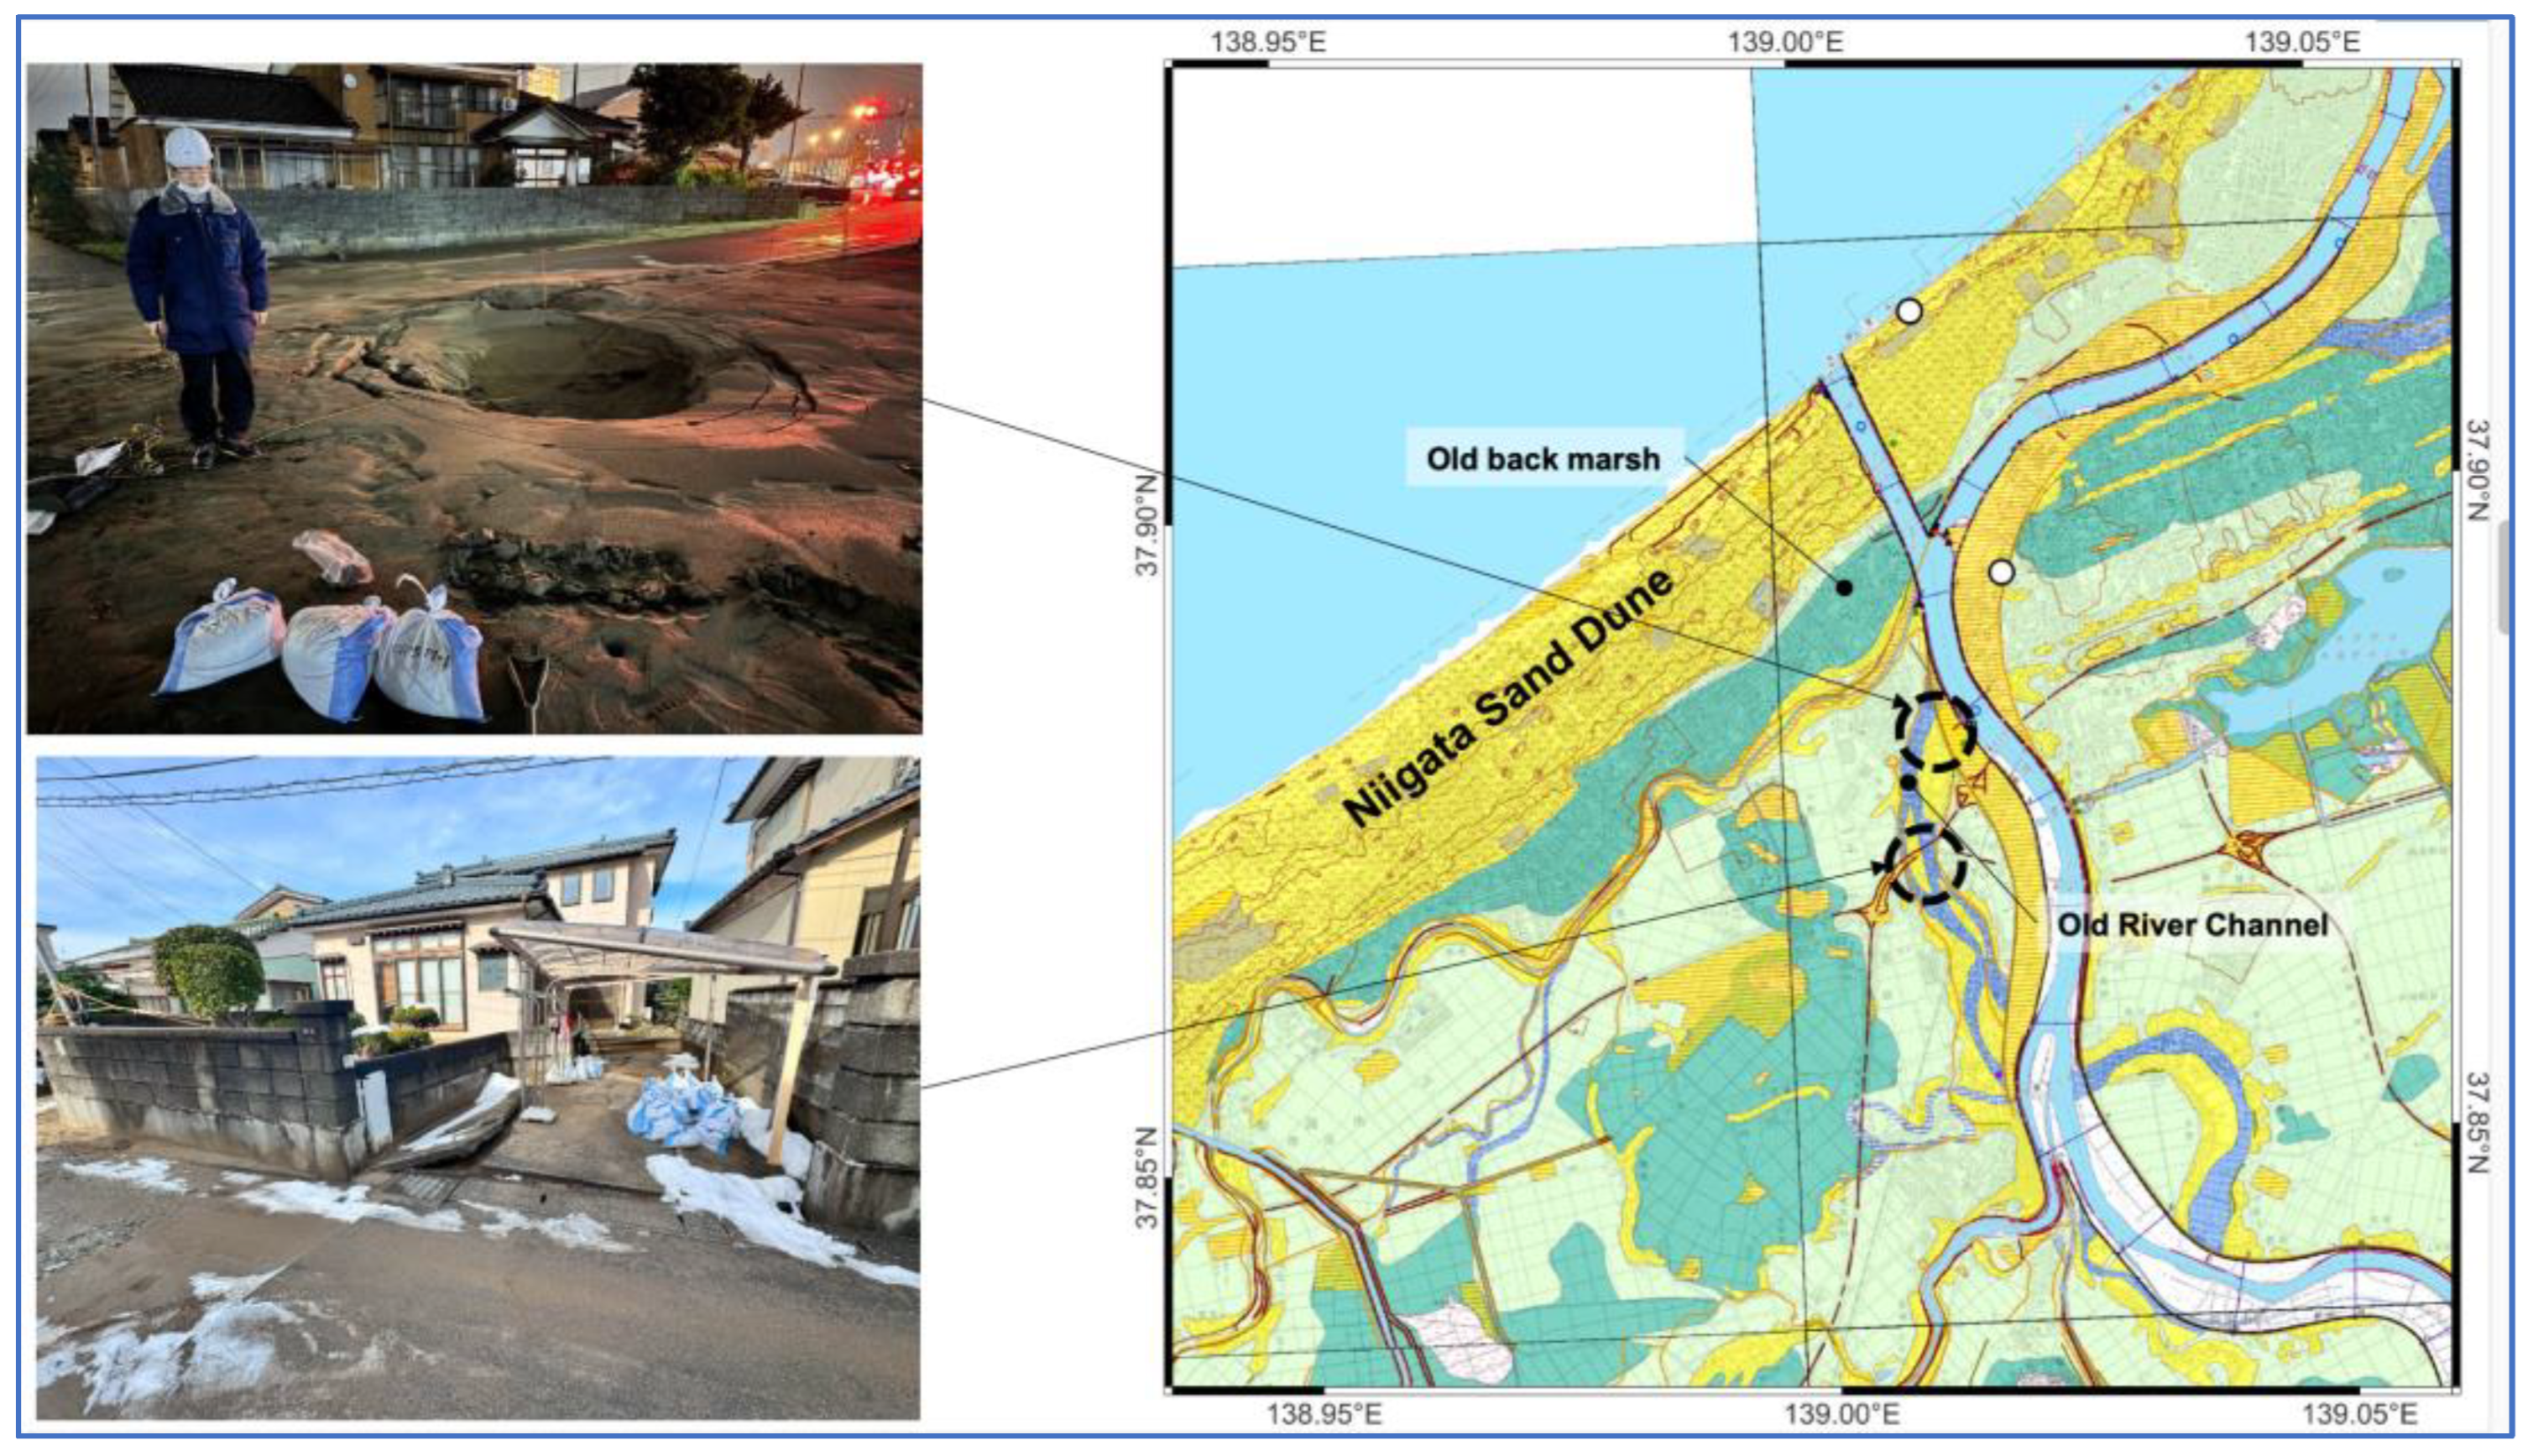
On January 1, 2024, for a magnitude 7.5 earthquake occurred you’re the tip of the northeast corner of the Noto peninsula. On the peninsula, peak ground accelerations between 1.5 and 2.78G were measured at K-NET sites ISK001, ISK003, and ISK006 [23]. At the significant source-distance of 155km, peak ground accelerations of low levels of 0.08 to 0.17G were recorded in the southwest corner of Niigata city. Even with those low levels of acceleration, liquefaction was observed, in former meanders of the Shinano river. Hundreds of residential water main breaks occurred at the boundary between CSD3 dune sand and fine-grained over bank deposits, and where CSD1 and CSD2 reworked sands are found near the Shinano River. These recent observations indicate that Niigata city is still threatened by highly liquefiable native foundation soils.
Figure 11.
Liquefaction observations in reworked CSD1CSD2 and CST three sand in residential neighborhoods of southwest Niigata (Updated version from EERI QQB presentation on Feb. 23, 2024 , Geotechnical Damage caused by M7.5 Noto Peninsula Earthquake of January 1, 2024 [23].
Figure 11.
Liquefaction observations in reworked CSD1CSD2 and CST three sand in residential neighborhoods of southwest Niigata (Updated version from EERI QQB presentation on Feb. 23, 2024 , Geotechnical Damage caused by M7.5 Noto Peninsula Earthquake of January 1, 2024 [23].
7. Conclusions
The 1964 Niigata earthquake demonstrated unequivocally that regional geology governs local liquefaction performance. The city’s susceptibility arises from a combination of:
- Thick mid-Holocene barrier-island sands (CSD1) emplaced 5–8 ka B.P.
- Ongoing tectonic subsidence driving deltaic progradation.
- Fluvial reworking of dense coastal sand dunes into loose, saturated facies (As-1, As-2);
- Late-Holocene dune accretion (CSD3) supplying uncemented sands; and
- Anthropogenic modification of river channels and hydraulic regimes.
Both cyclic stress- and energy-based frameworks confirm that the most hazardous foundation soils are the fluvially reworked sands derived from CSD1–CSD3. The recurrence of liquefaction during the distant 2024 Noto earthquake highlights the continuing risk posed by these Holocene sediments. Integrating detailed engineering–geologic mapping with probabilistic liquefaction models is therefore essential for seismic resilience planning in Niigata and comparable coastal plains worldwide [24].
Funding
This research was funded by the Pacific Engineering Research Center, the Japan Ministry of Education, and the United States Geological Survey.
Data Availability Statement
Acknowledgments
The author is deeply appreciative of the guidance and advice received while studying and testing many hundreds of Japanese liquefaction case histories using shear wave-, CPT-, and SPT-field methods over the past two decades. Among the many researchers who helped on these projects, I would like to thank Professors Ishihara (Tokyo/Chuo), Yasuda (Denki), Towhata (Tokyo), Tokimatsu (TiTech), Tanaka (Kobe), Kokusho (Chuo), and Konagai (Tokyo) for their thoughtful counsel guiding these studies. This article is a revised and expanded version of a paper entitled “Geology is the key: Understanding the liquefaction susceptibility of Niigata City soil.”. which was presented at 8th International Conference on Earthquake Geotechnical Engineering, Osaka, Japan on May 7–10, 2024.
Conflicts of Interest
The author declares no conflicts of interest. The funders had no role in the design of the study; in the collection, analyses, or interpretation of data; in the writing of the manuscript; or in the decision to publish the results.
Abbreviations
The following abbreviations are used in this manuscript:
|
As-1 As-2 B.P. CPT CSD1 CSD2 CSD3 CSR JSCE Kybp NKTZ PWRI SPT Ts Vs |
Alluvial soil-1 Alluvial soil-2 Before the present Cone Penetration Test Coastal Sand Dune deposit -1 Coastal Sand Dune deposit -2 Coastal Sand Dune deposit -3 Cyclic Stress Ratio Japan Society of Civil Engineers Thousands of years before present Niigata–Kobe Tectonic Zone Public Works Research Institute Standard Penetration Test Placed fill-soil Shear Wave Velocity |
References
- Tada, T., T., Sagiya, and S. Miyazaki, The deforming Japanese Islands as Viewed with GPS, Kagaku 67, 917-927, (1997).
- Sagiya, T., Miyazaki, S., Tada, T. Continuous GPS array and crustal deformation in Japan. PAGEOPH 157, 2303–2322, (2000).
- Kamoi Y., Yasui S., Urabe A. NIIGATA AND UCHINO, Geological Survey of Japan, AIST16-G00890, (2016).
- Bardet J.P. et al. (2004) Preliminary observations of the Niigata-ken Chuetsu, Japan, earthquake of October 23, 2004. GEER Association Report No. GEER-009.
- Rathje, E.M., Kayen, R., and Woo, K.-S. “Remote Sensing Observations of Landslides and Ground Deformation from the 2004 Niigata Ken Chuetsu Earthquake,” Soils and Foundations, Japanese Geotechnical Society, 46(6), pp. 831-842. (2006).
- Kayen, R., et al. “Geoengineering and Seismological Aspects of the Niigata-Ken Chuetsu-Oki Earthquake of 16 July 2007,” Earthquake Spectra, EERI, 25(4), 777-802, (2009).
- Urabe, A., et al.. Holocene coastal evolution of the Echigo Plain, Niigata, Japan. Eng. Geol. 72(3–4), 305–321, (2004a).
- Urabe, A. Takahama, N., and Yabe, H. Identification and characterization of a subsided barrier island in the Holocene alluvial plain, Niigata, central Japan, Quaternary International, v.115–116, p.93-104, (2004b).
- Numazawa collaborative research group. Geology and petrology of Numazawa Volcano. Earth Science (Chikyu Kagaku) 53, 53–70, (1999).
- Niigata ancient dune research group. Niigata sand dunes and archaeological relics—The geohistory of the formation of Niigata Sand Dune, Part I. The Quaternary Research, 13, 57–65, (1974).
- Ishihara, K., Koga, Y.. Case studies of liquefaction in the 1964 Niigata Earthquake. Soils and Foundations 21(3), 35–52, (1981).
- Hamada, M. Large ground deformations and their effects on lifelines: the 1964 Niigata Earthquake. NCEER Tech. Rep. 92–001, (1992).
- Collins, J.L. and Foster, H.L. The Fukui Earthquake Hokuriku Region, Japan, 28 June 1948, Volume I, Geology, U.S.Army Office of the Engineer, General Headquarters, Far East Command, (1949).
- Seed, H. B., and Idriss, I. M. “Simplified procedure for evaluating soil liquefaction potential.” J. Soil Mech. Found Div., 97(SM9), 1249–1273.,(1971).
- Seed, H. B., Tokimatsu, K., Harder, L. F., and Chung, R. M. “The influence of SPT procedures in soil liquefaction resistance evaluations.” J. Geotech. Eng., 111(12), 1425–1445. (1985).
- Cetin KO, Seed RB, Der Kiureghian A, Tokimatsu K, Harder Jr LF, Kayen RE, et al. SPT-Based probabilistic and deterministic assessment of seismic soil liquefaction potential. ASCE J. of Geotechnical and Geoenviromental Engineering; 2004;130(12):1314-1340, (2004).
- Cetin,K.O., Seed, R.B., Kayen, R.E., Moss, R.E.S., Bilge, H.T., Ilgac, M., Chowdhury K. (2018) SPT-based probabilistic and deterministic assessment of seismic soil liquefaction triggering hazard. Soil Dynamics and Earthquake Engineering, Volume 115, Pages 698-709, ISSN 0267-7261, (2018).
- Kayen R, Moss R, Thompson E, Seed R, Cetin K, Kiureghian A et al. Shear-wave velocity–based probabilistic and deterministic assessment of seismic soil liquefaction potential. Journal of Geotechnical Geoenviron. Eng. 407 - 419. (2013). [CrossRef]
- Berrill, J.B., Davis, R.O. Energy dissipation and seismic liquefaction of sands: revised model. Soils and Foundations 25(2), 106–118, (1985).
- Kayen, R.E., Mitchell, J.K., Assessment of liquefaction potential by energy-based method. J. Geotech. Geoenviron. Eng. 123(12), 1172–1184 (1997).
- Kokusho, T.: State of the practice on energy-based liquefaction evaluation and research significance. Geosciences 10(4), 792–863 (2024).
- Arias, A., A measure of earthquake intensity, in Hansen, R., ed., Seismic design for nuclear power plants: Cambridge, Mass., Massachusetts Institute of Technology Press, p. 438-483, (1970).
- Hemanta Hazarika, Shotaro Kubota, Anurag Sahare, Shiro Ohta, Tsuyoshi Tanaka, Tomohiro Ishizawa, Masanori Murai, Takashi Fujishiro, Yuji Michi, Yutao Hu, Taichi Hyodo, Tatsunori Matsumoto, Takaji Kokusho (2025) Damage due to Liquefaction and Associated Lateral Flow during the 2024 Noto Peninsula Earthquake, Japan. Geotechnical Extreme Event Reconnaissance Association GEER Association Report 084 doi.org/10.18118/G61T1J (2025).
- Kayen, R., Geology is the key: Understanding the liquefaction susceptibility of Niigata City soil. Paper SS5-02, 8th International conference on earthquake, geotechnical engineering, Osaka, JAPAN, 7–10, May 2024.
Figure 1.
Mid-Holocene barrier island, and distribution of coastal sand dunes CSD1, CSD2, and CSD3 of the Echigo Plain (modified from [7,8]).
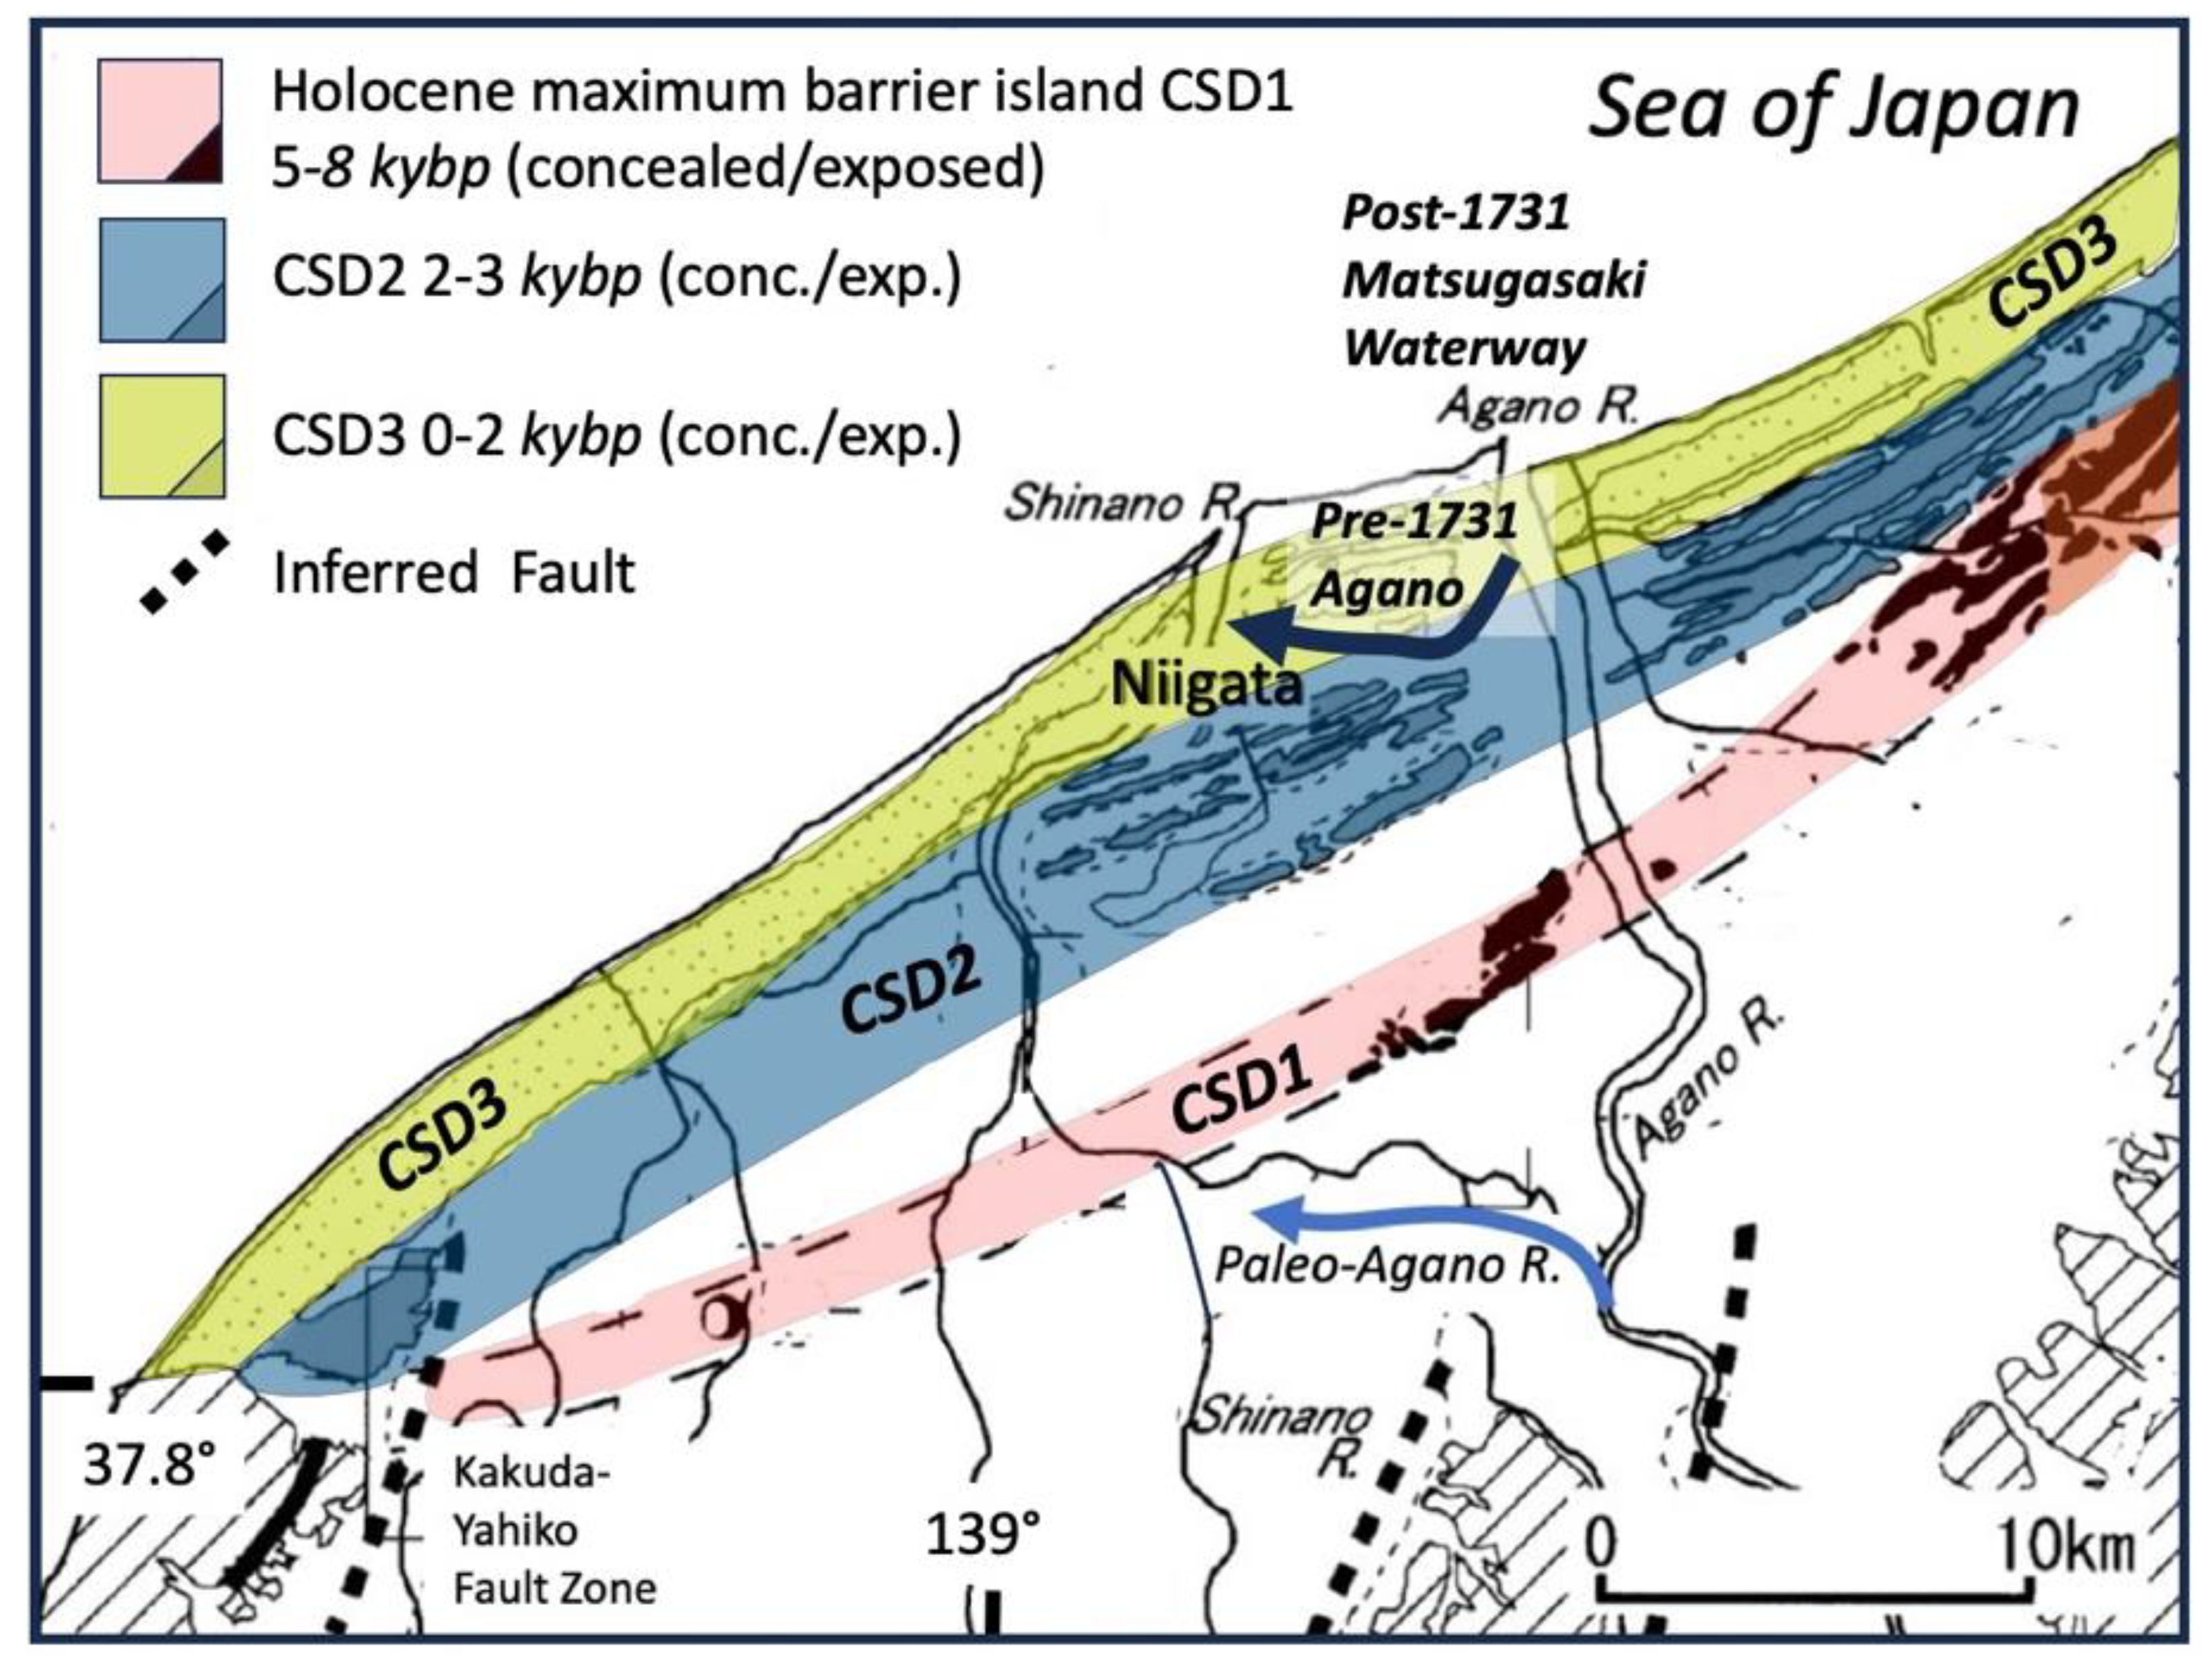
Figure 2.
Geologic map modified from the Geological Survey of Japan for Niigata and Uchino, GSJ-G050-07009 [3]. Legend is shortened and simplified to present only the Holocene deposits of the Echigo Plain.
Figure 2.
Geologic map modified from the Geological Survey of Japan for Niigata and Uchino, GSJ-G050-07009 [3]. Legend is shortened and simplified to present only the Holocene deposits of the Echigo Plain.
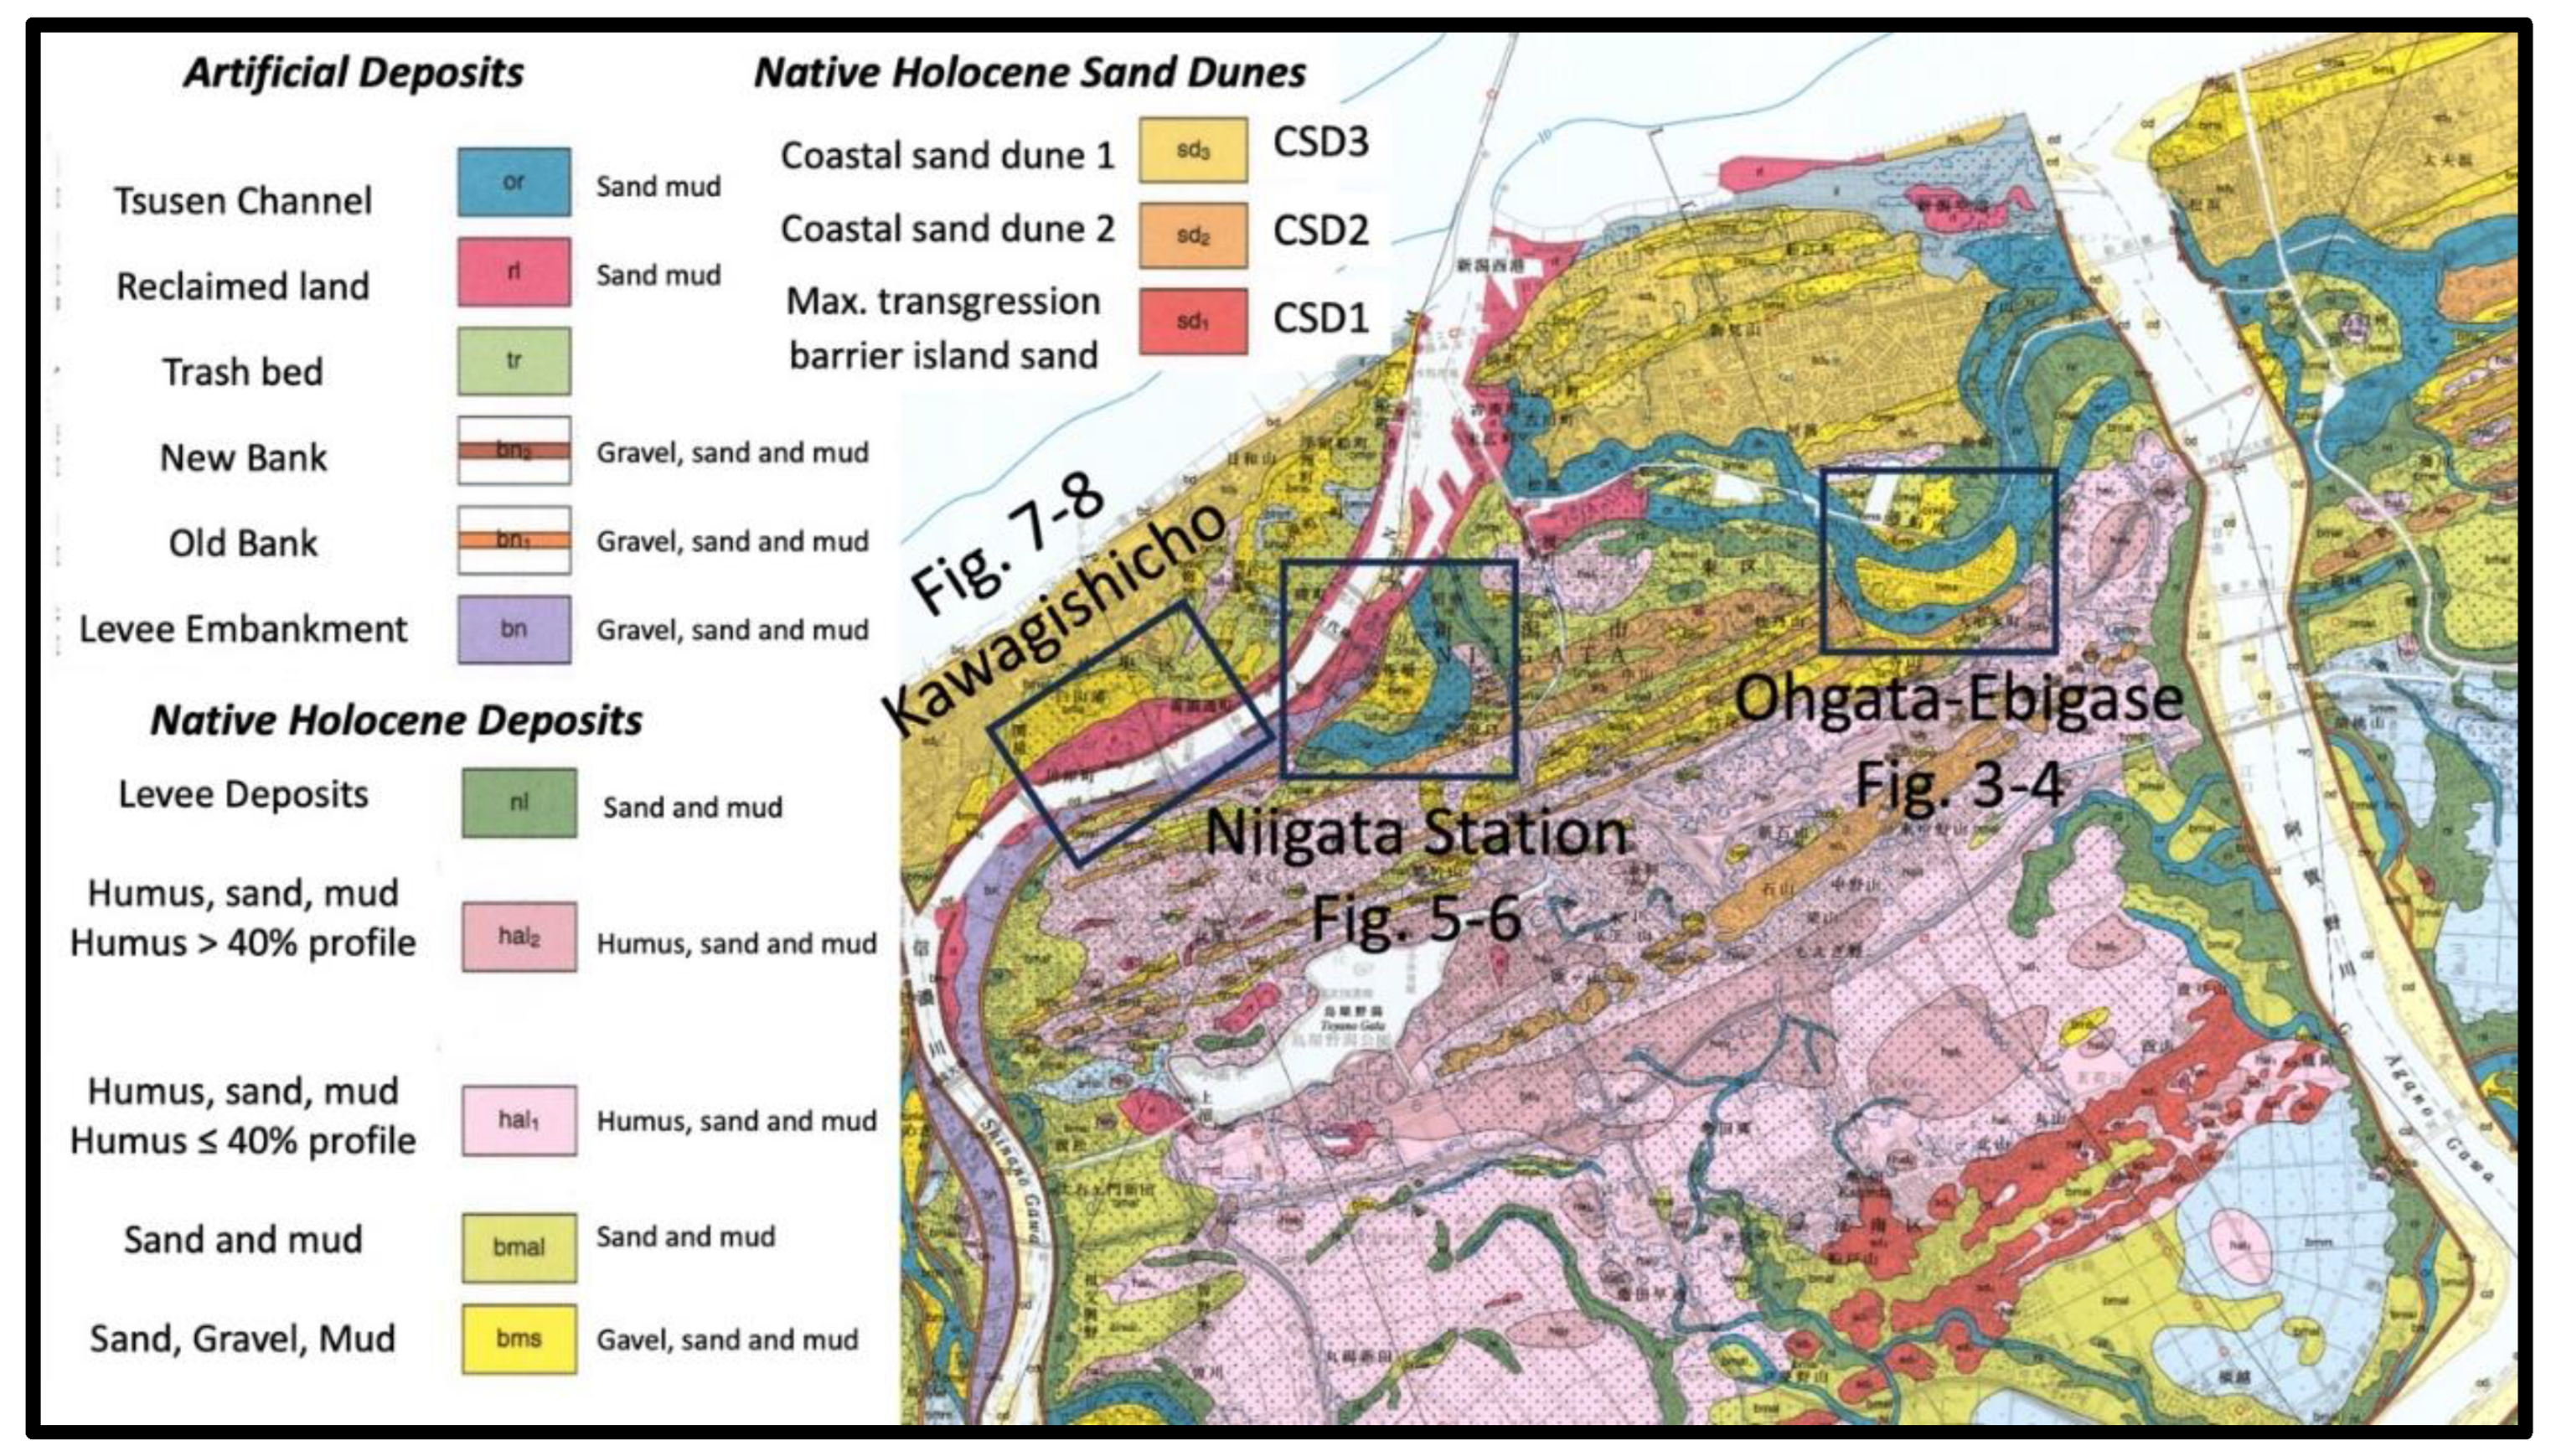
Figure 3.
a. Ohgata-Ebigase Neighborhood adjacent to Tsusen River geologic map per legend in Figure 2 (GSJ, 2016); 3b liquefaction-induced lateral spread vectors and magnitudes. (modified from Hamada, 1992).
Figure 3.
a. Ohgata-Ebigase Neighborhood adjacent to Tsusen River geologic map per legend in Figure 2 (GSJ, 2016); 3b liquefaction-induced lateral spread vectors and magnitudes. (modified from Hamada, 1992).
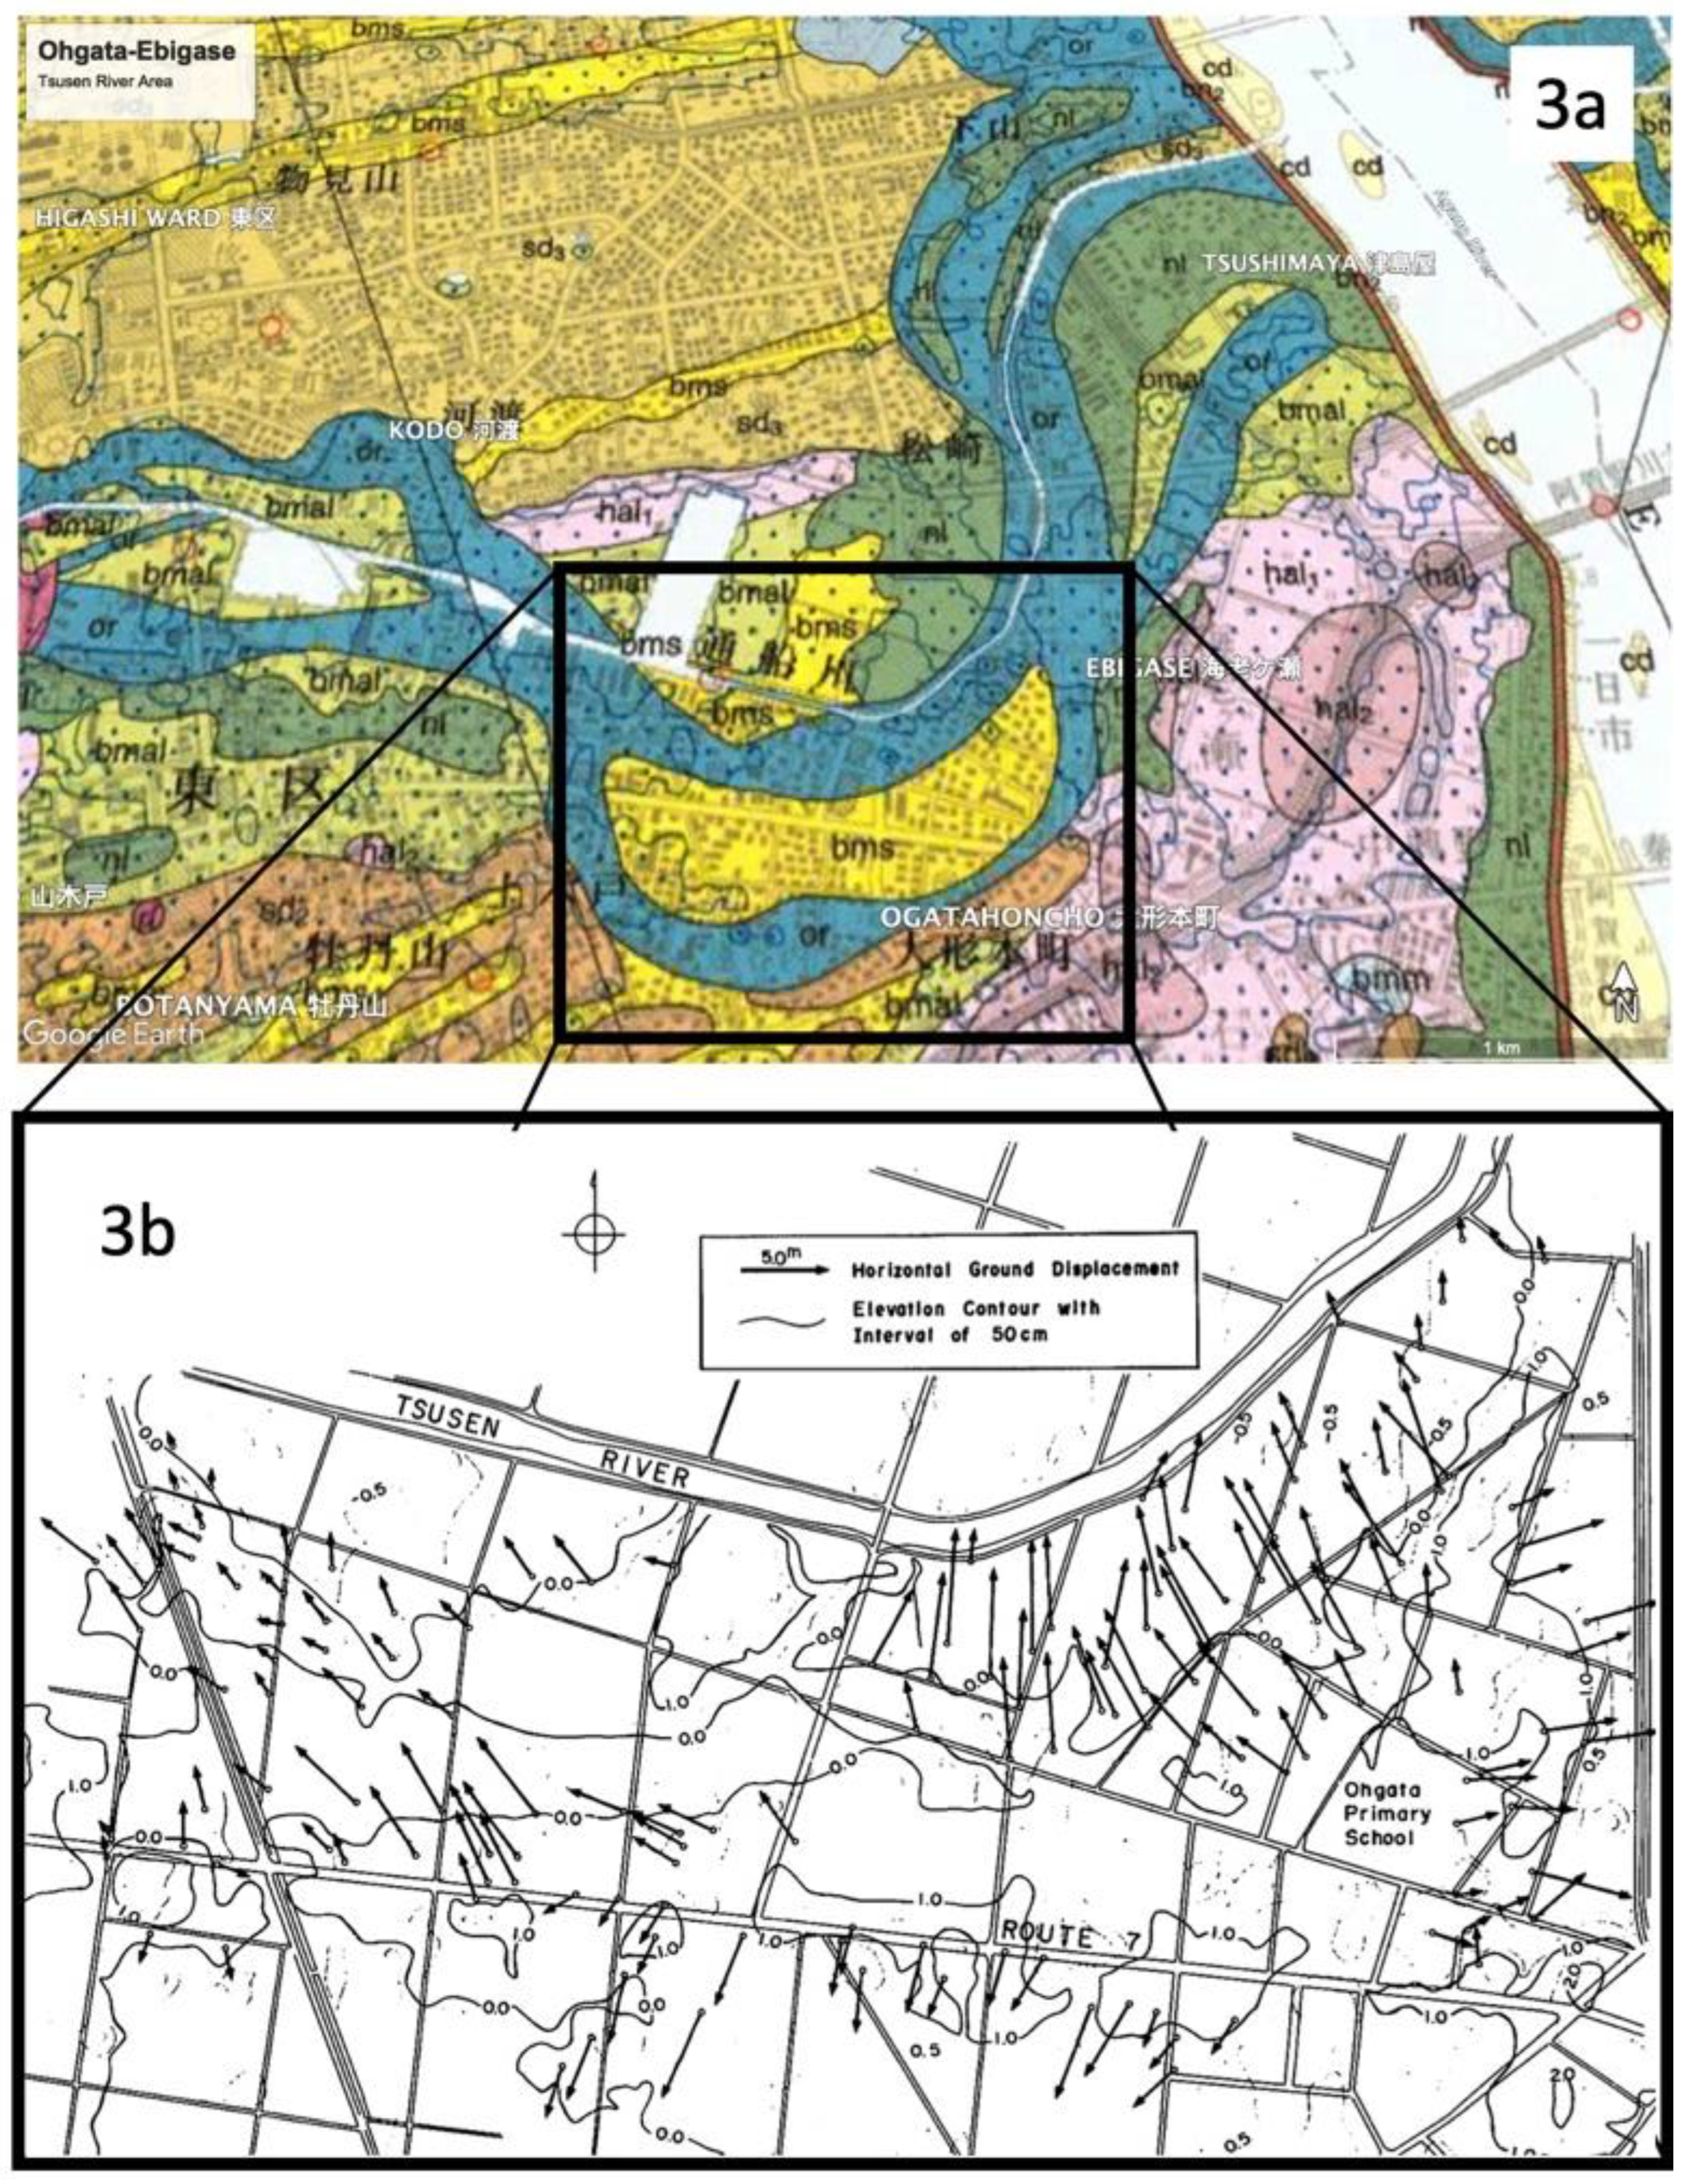
Figure 4.
Ohgata Primary School – to- Tsusen river cross-section. Placed fill is in red, liquefied zone is stippled (modified from [12)).
Figure 4.
Ohgata Primary School – to- Tsusen river cross-section. Placed fill is in red, liquefied zone is stippled (modified from [12)).
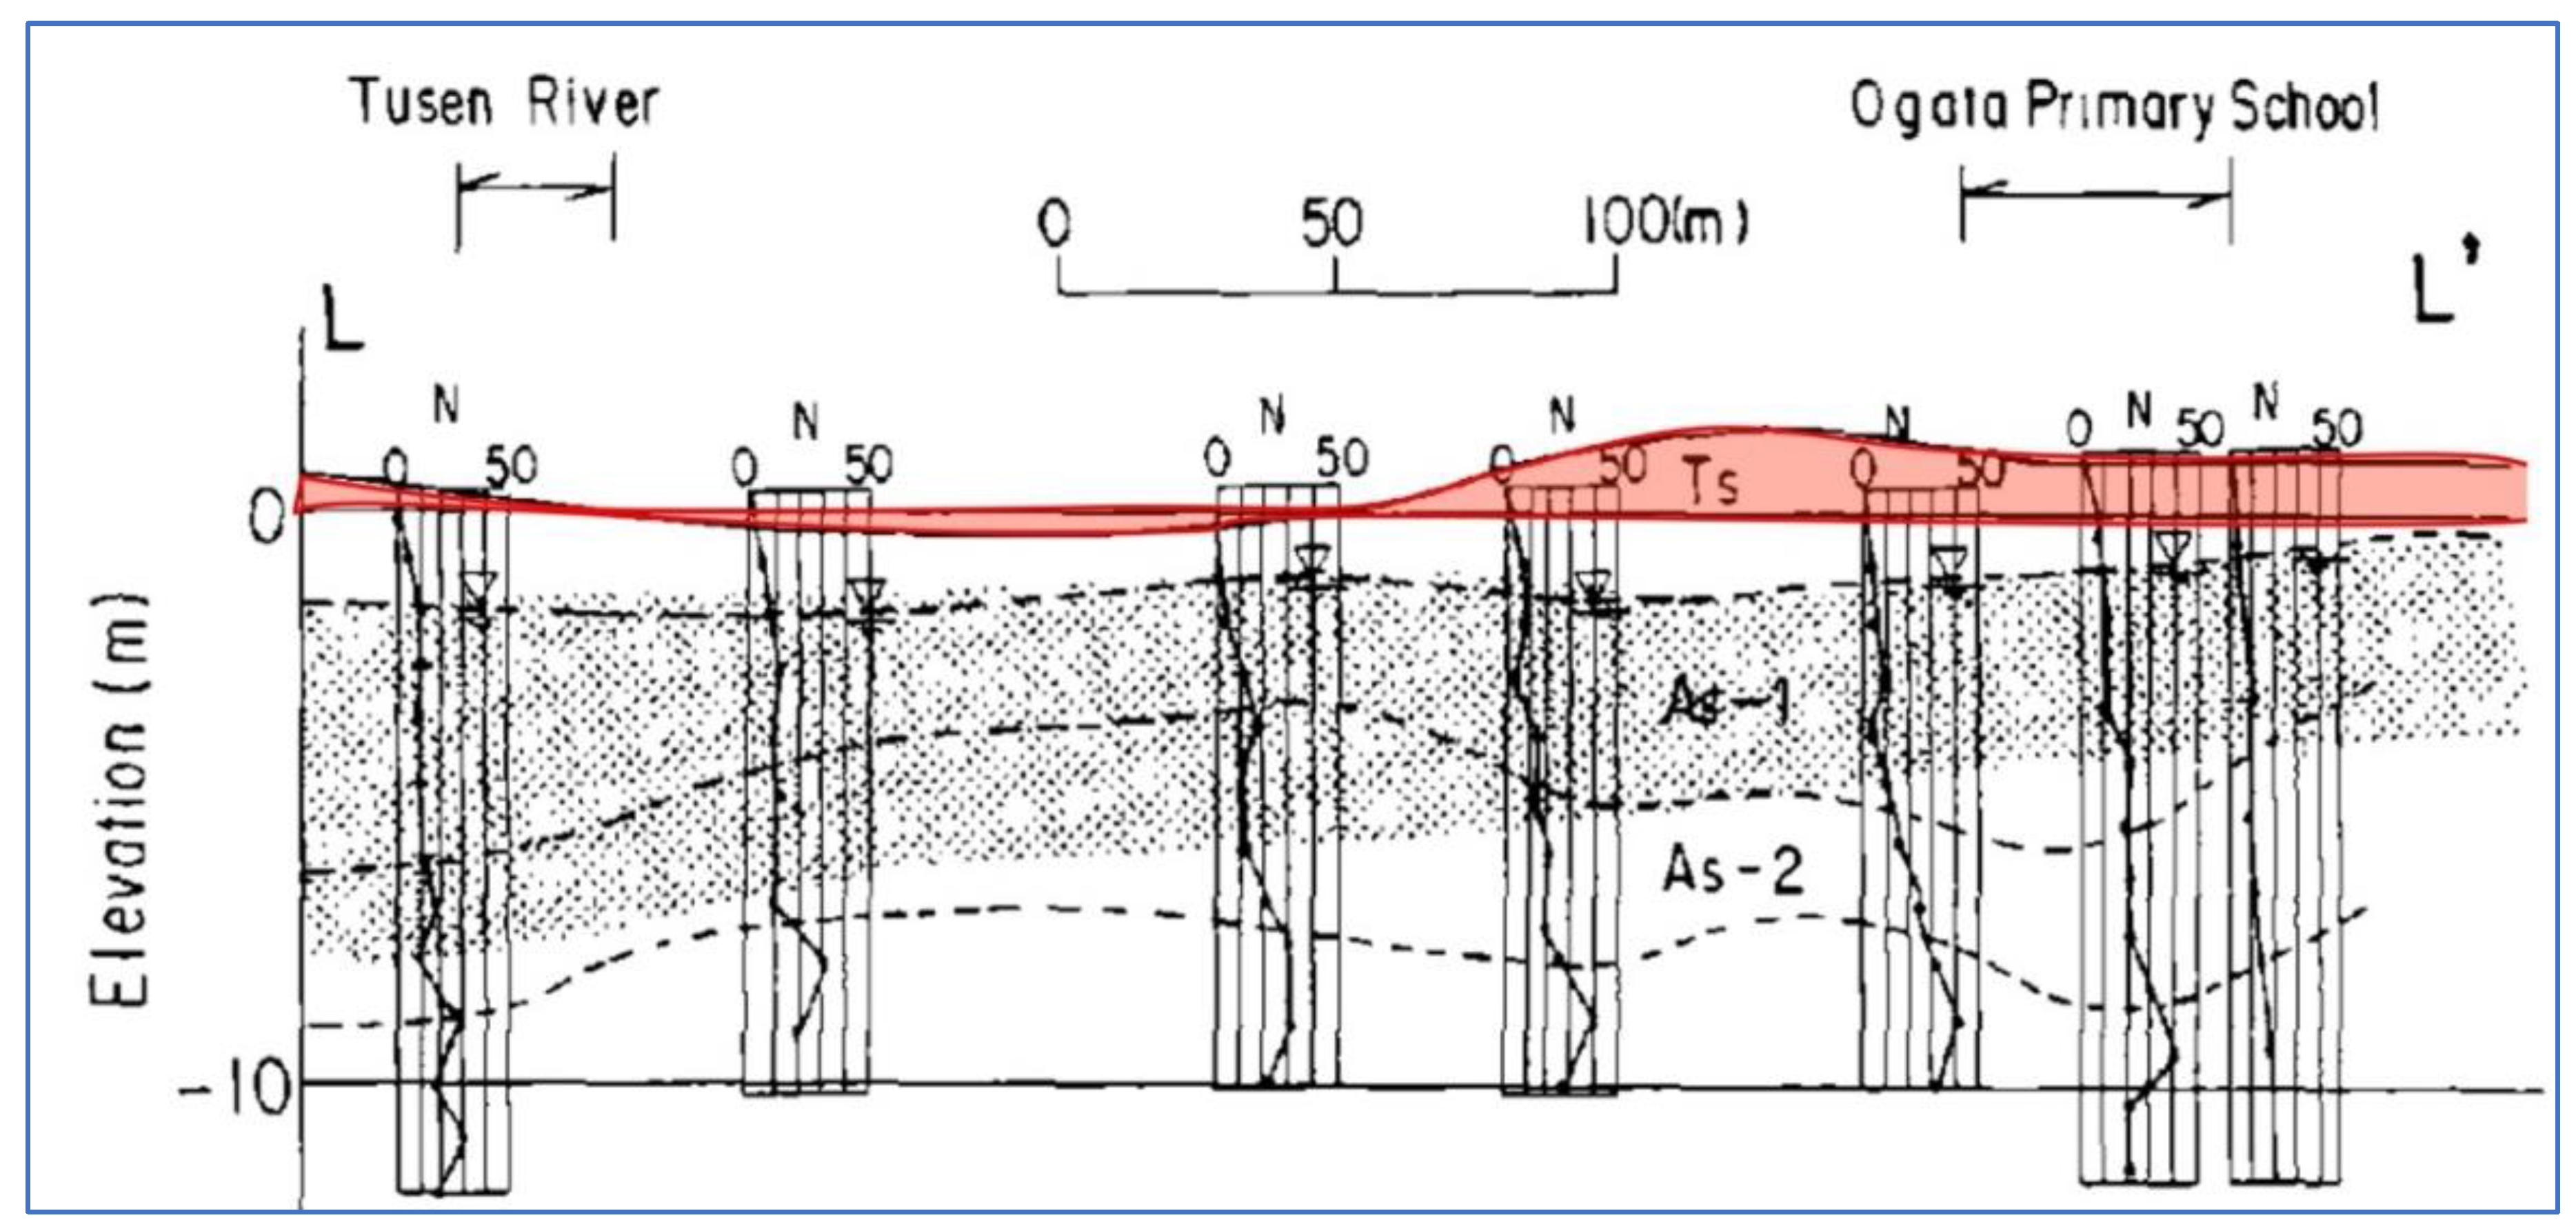
Figure 5.
a. Niigata Station and Hotel Niigata area geologic map per legend in Figure 2 [ref.3]; 5b liquefaction-induced lateral spread vectors and magnitudes.
Figure 5.
a. Niigata Station and Hotel Niigata area geologic map per legend in Figure 2 [ref.3]; 5b liquefaction-induced lateral spread vectors and magnitudes.
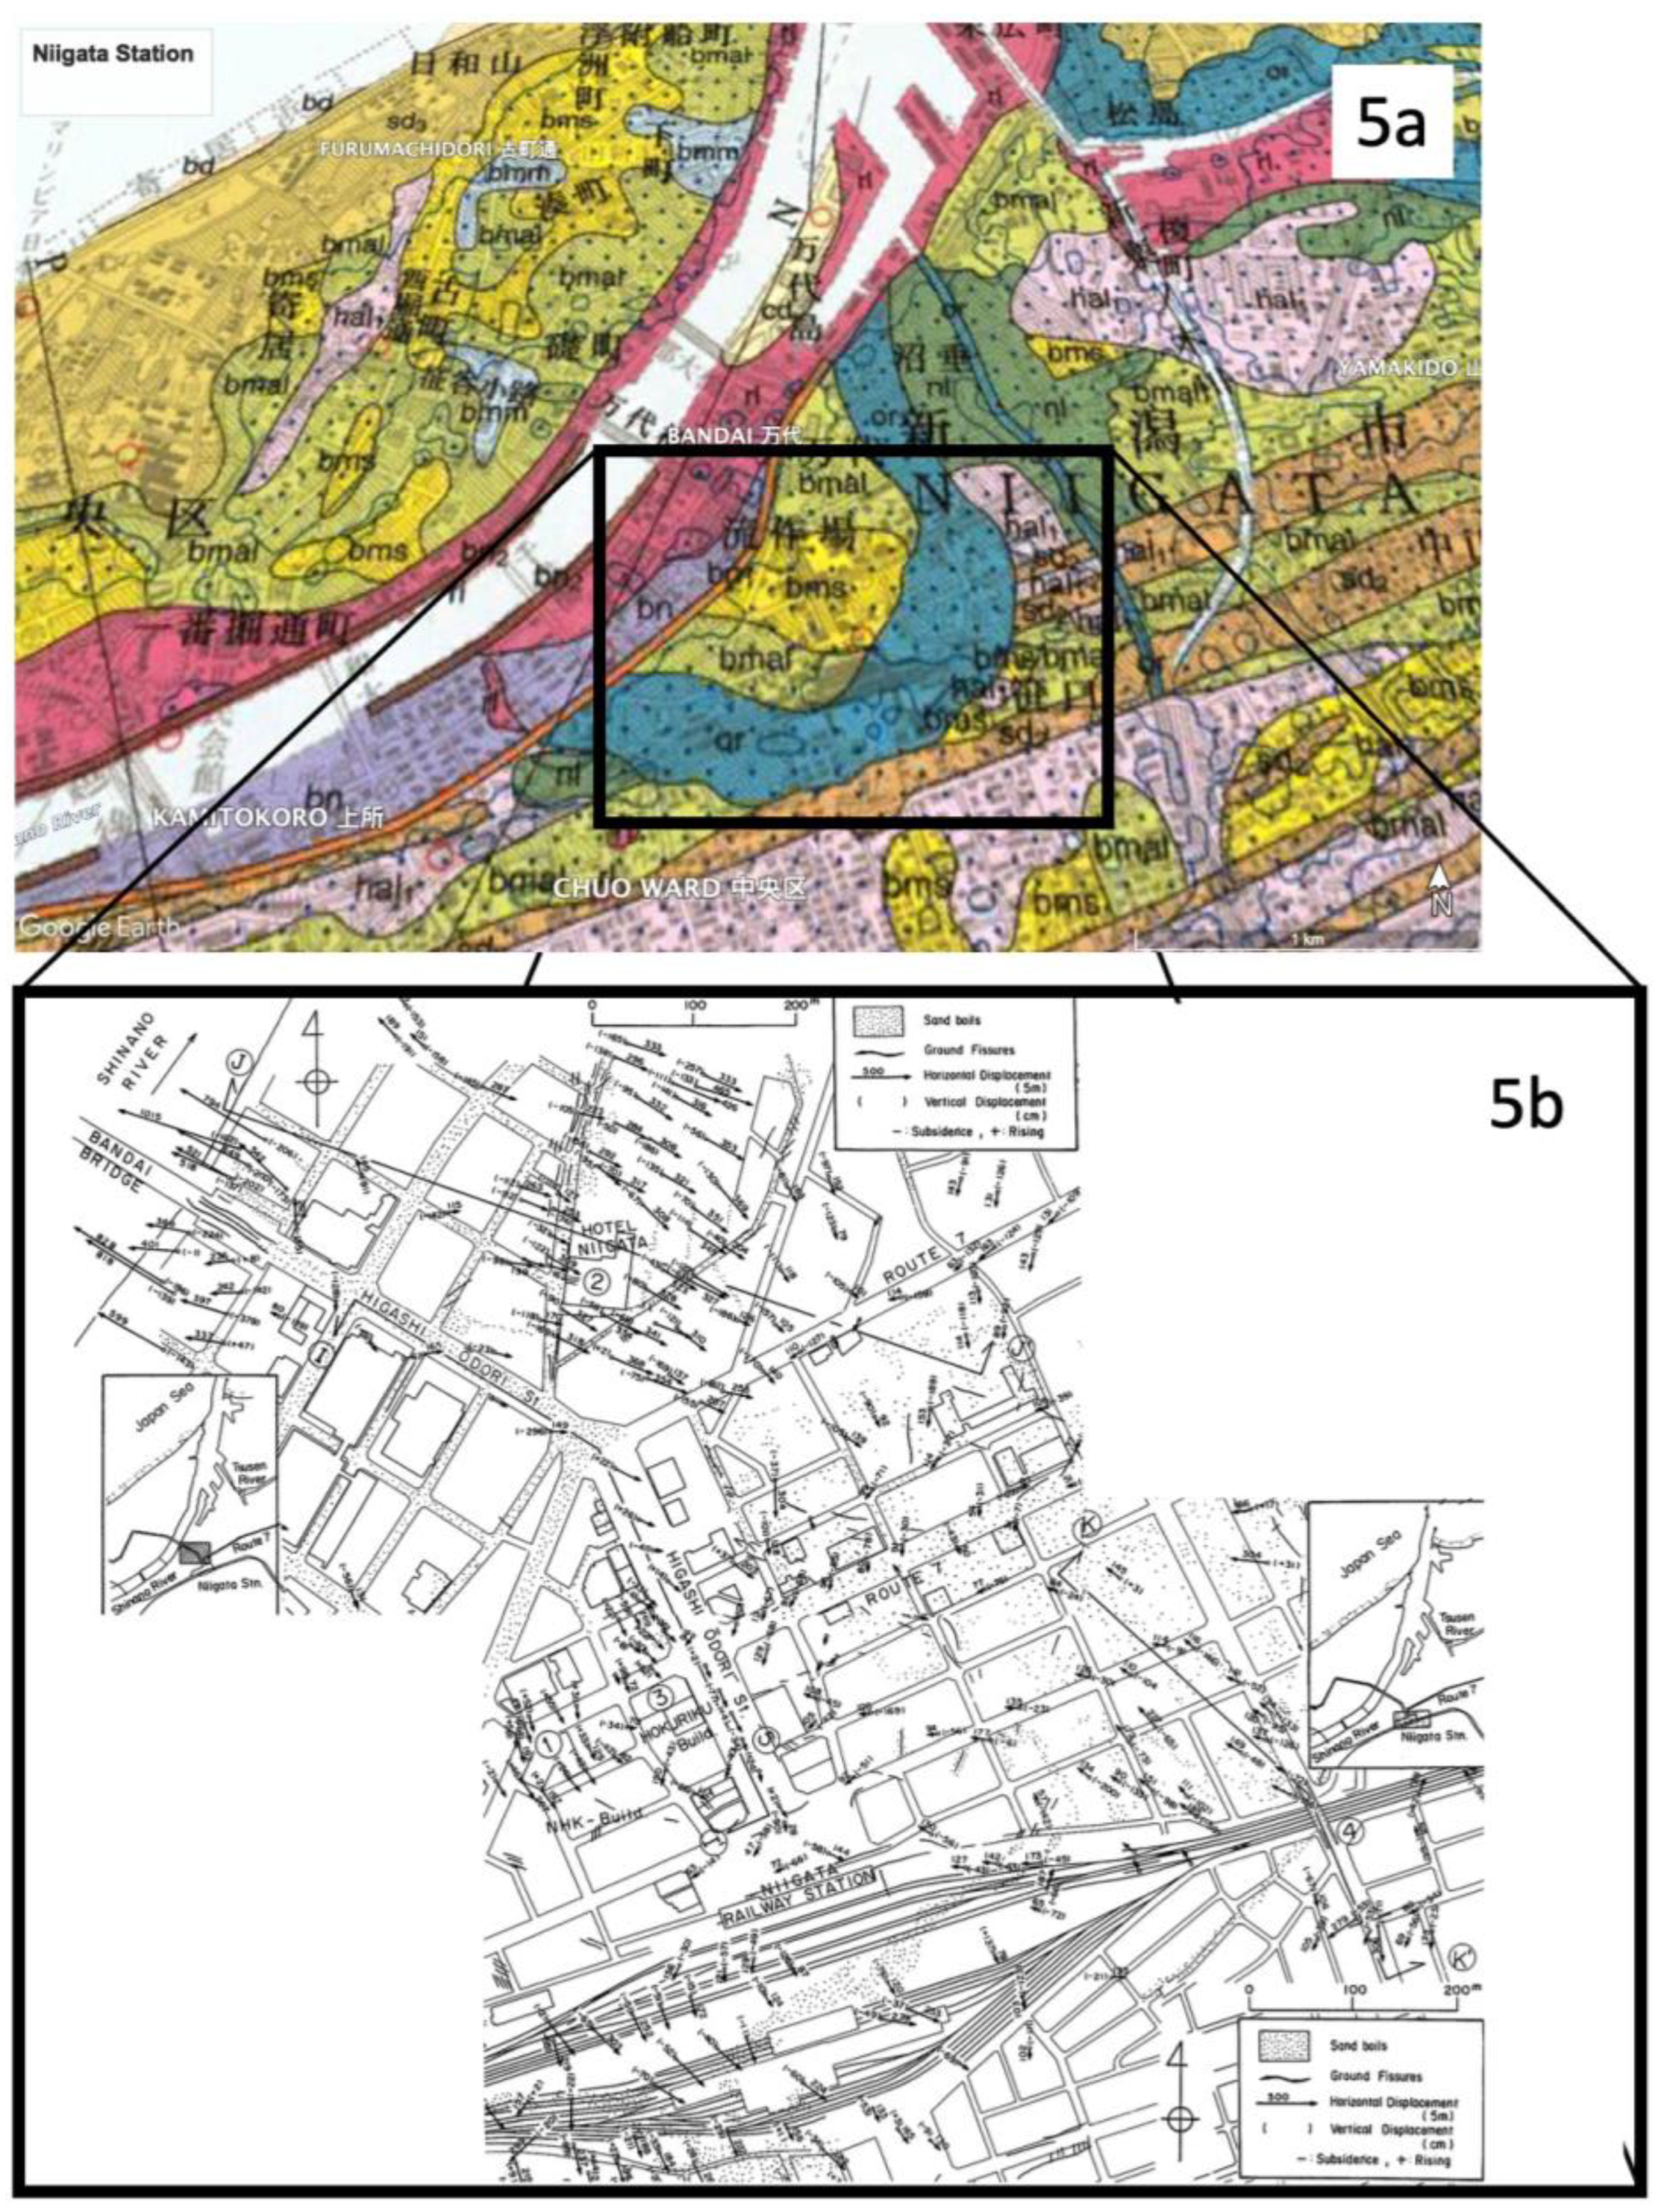
Figure 6.
Niigata Station-Hotel Niigata cross-section. Placed fill is in red, liquefied zone is stippled (modified from [12]).
Figure 6.
Niigata Station-Hotel Niigata cross-section. Placed fill is in red, liquefied zone is stippled (modified from [12]).
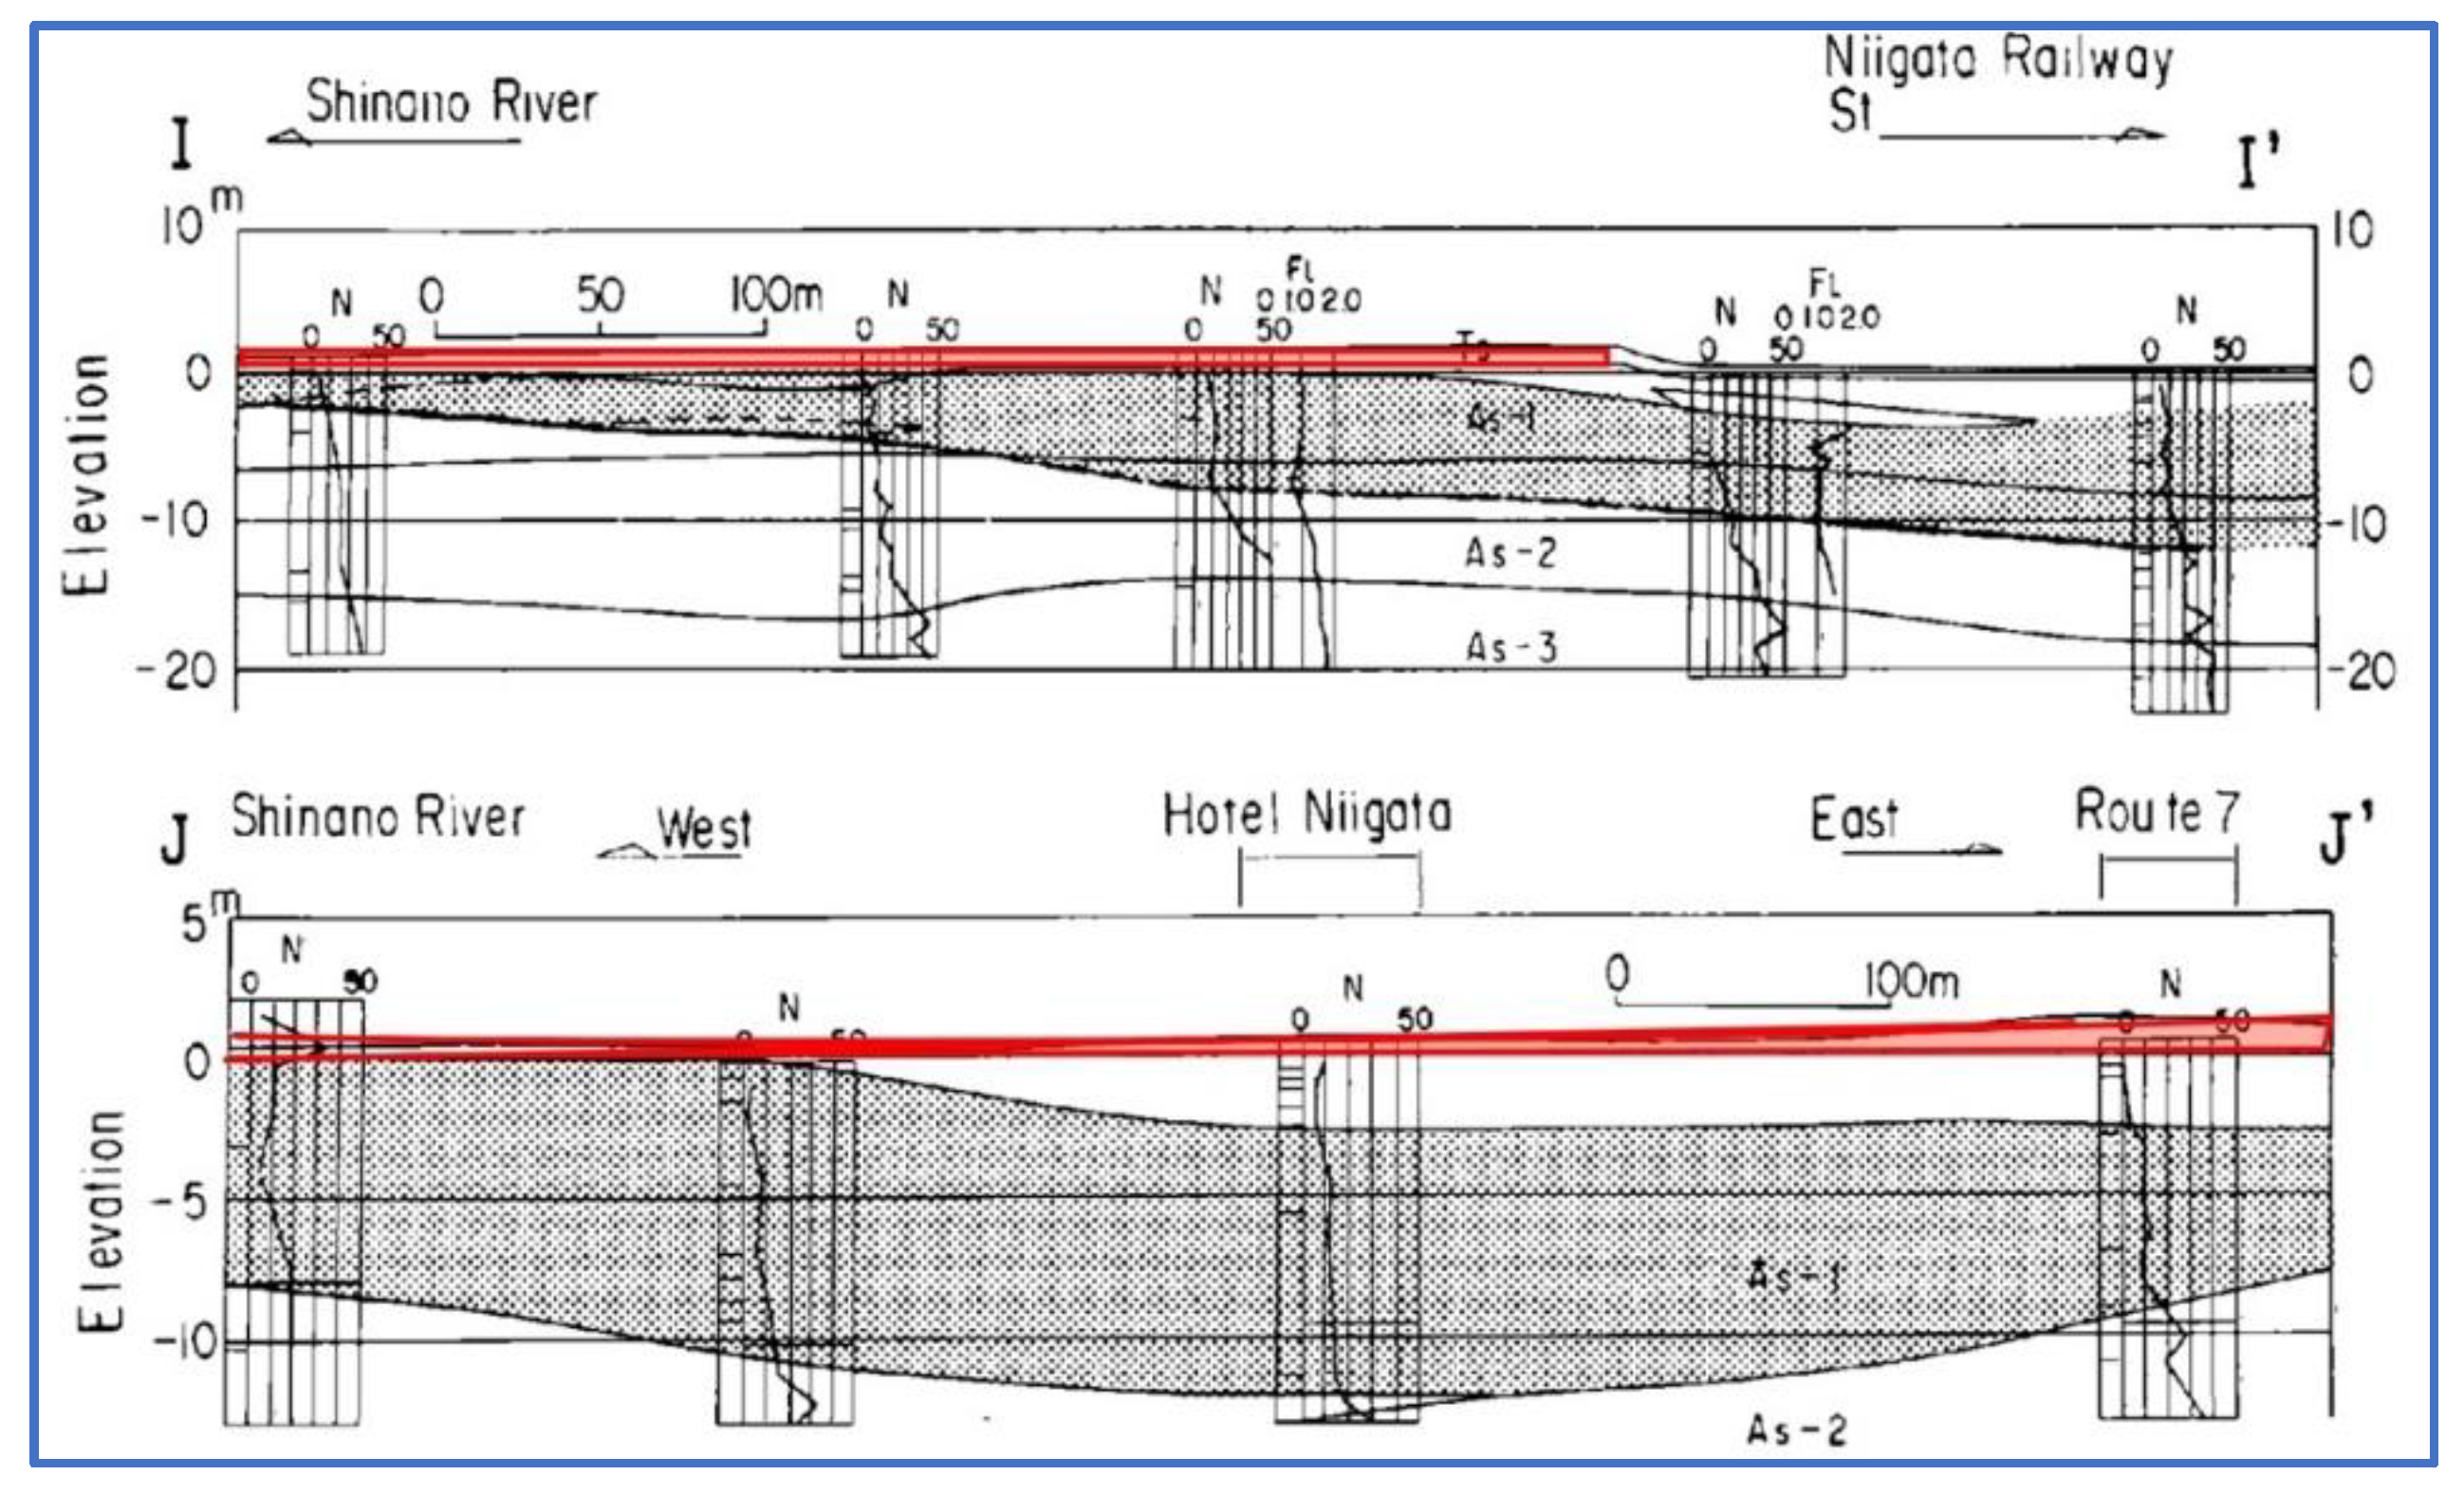
Figure 7.
a. Kawagishi-cho Neighborhood adjacent to the Shinano River geologic map per legend in Figure 2 [ref. 3]; 3b liquefaction-induced lateral spread vectors and magnitudes (modified from [12]).
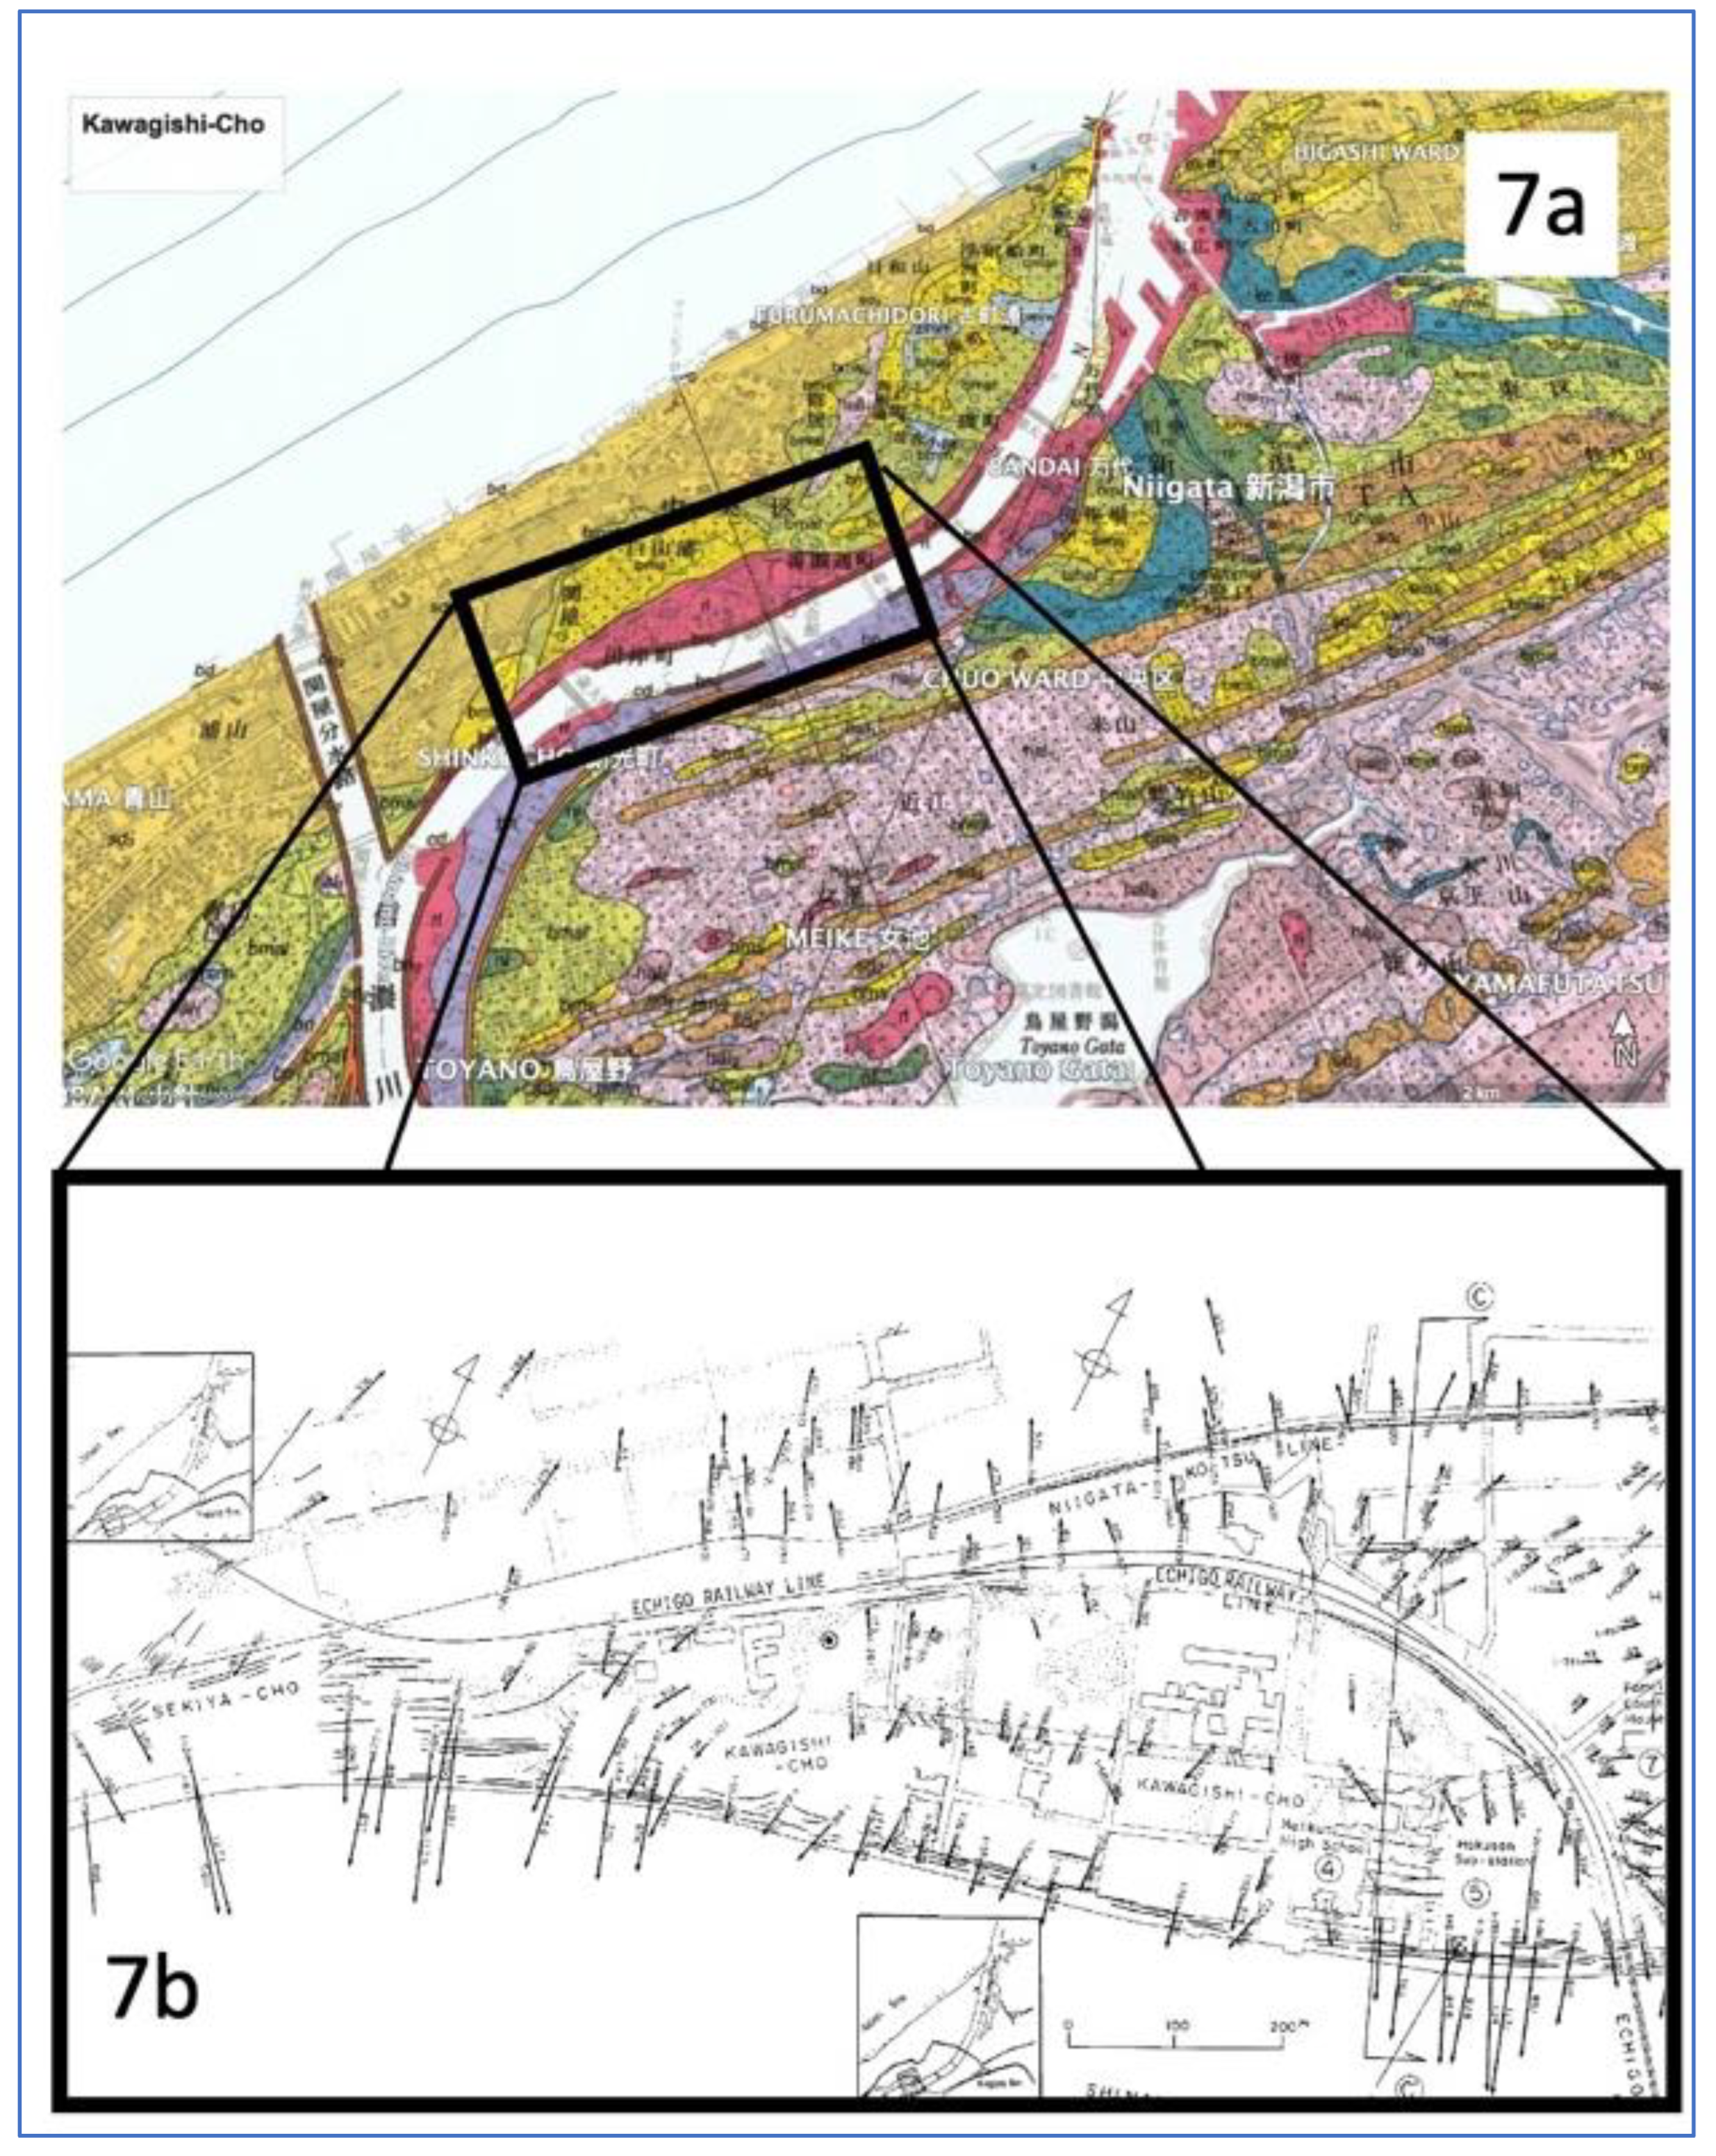
Figure 8.
Kawagishi-cho area cross-section Placed fill is in red, liquefied zone is stippled (modified from [12]).
Figure 8.
Kawagishi-cho area cross-section Placed fill is in red, liquefied zone is stippled (modified from [12]).
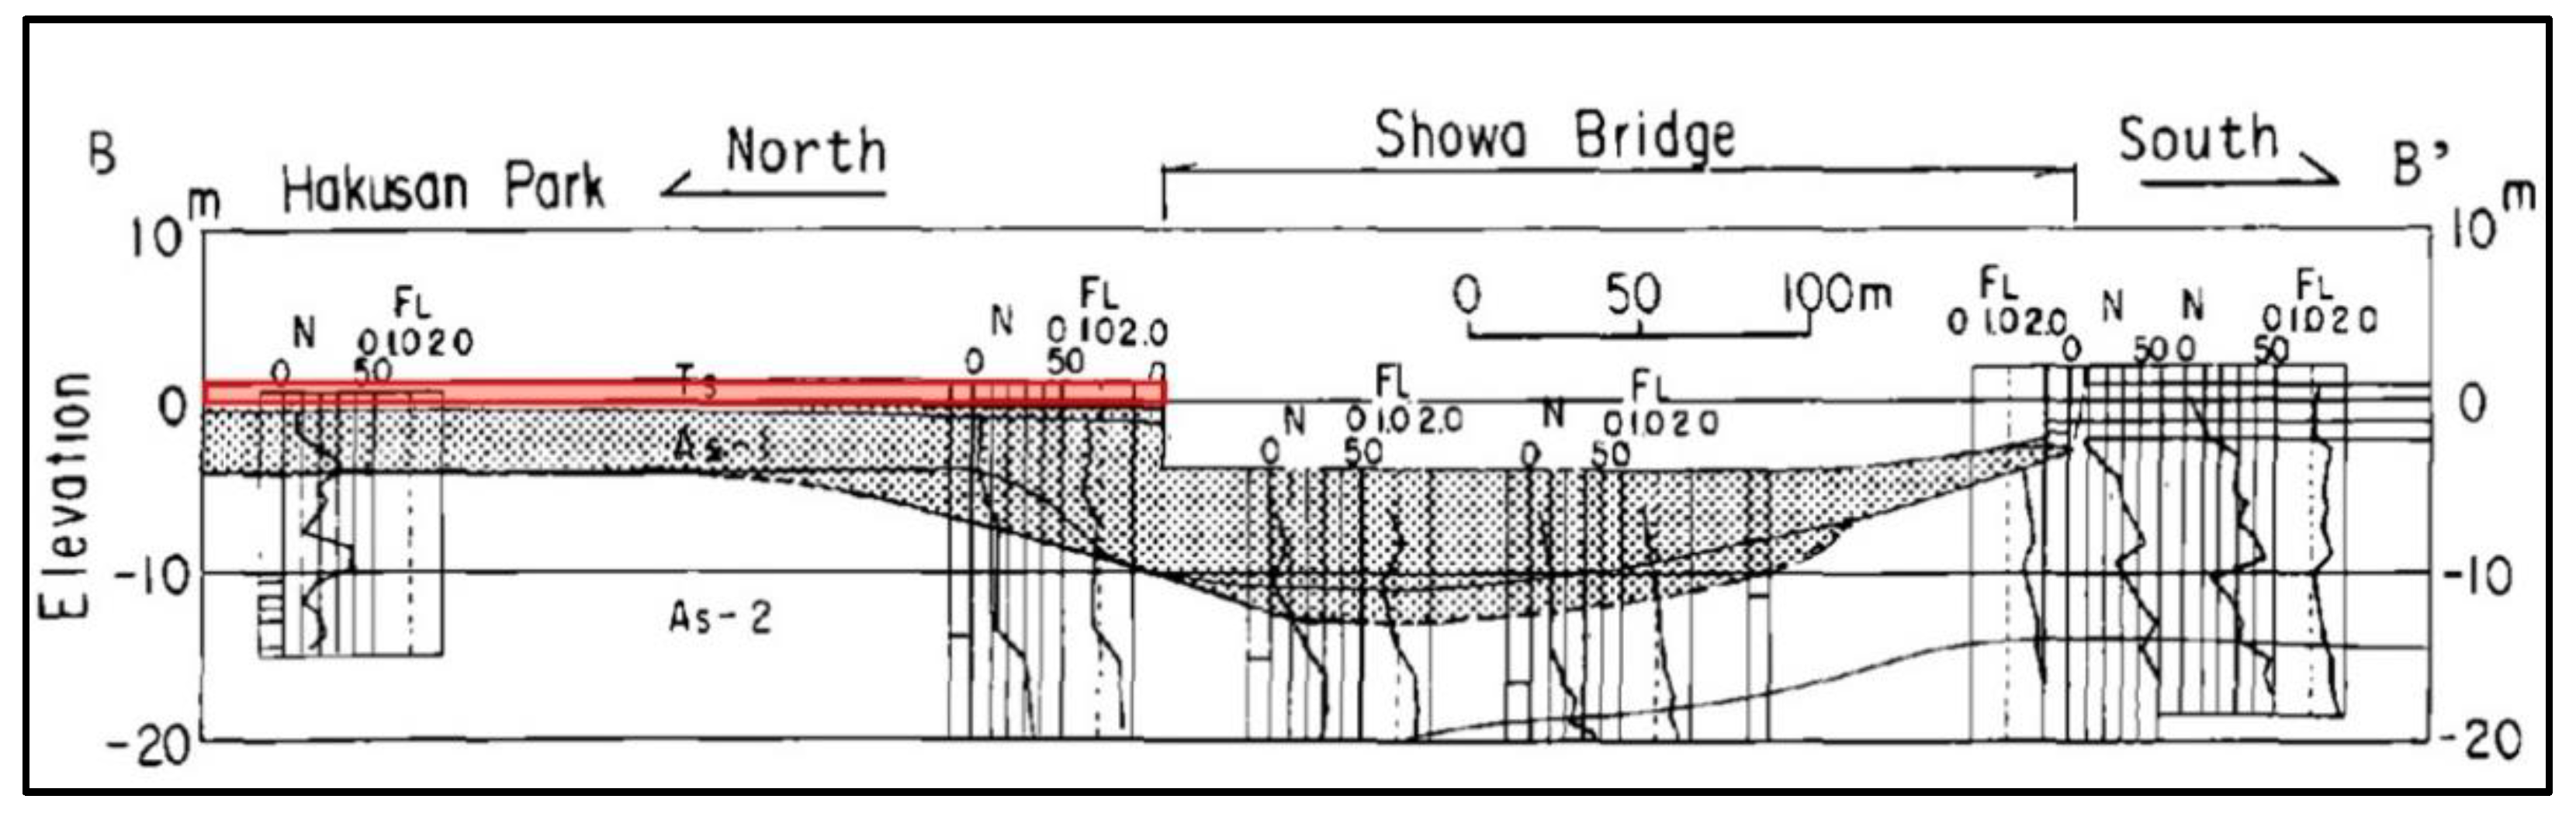
Figure 9.
Rotations of four-story residential apartment buildings at Kawagishi-cho, Niigata in 1964 (Photo, USGS Archive).
Figure 9.
Rotations of four-story residential apartment buildings at Kawagishi-cho, Niigata in 1964 (Photo, USGS Archive).
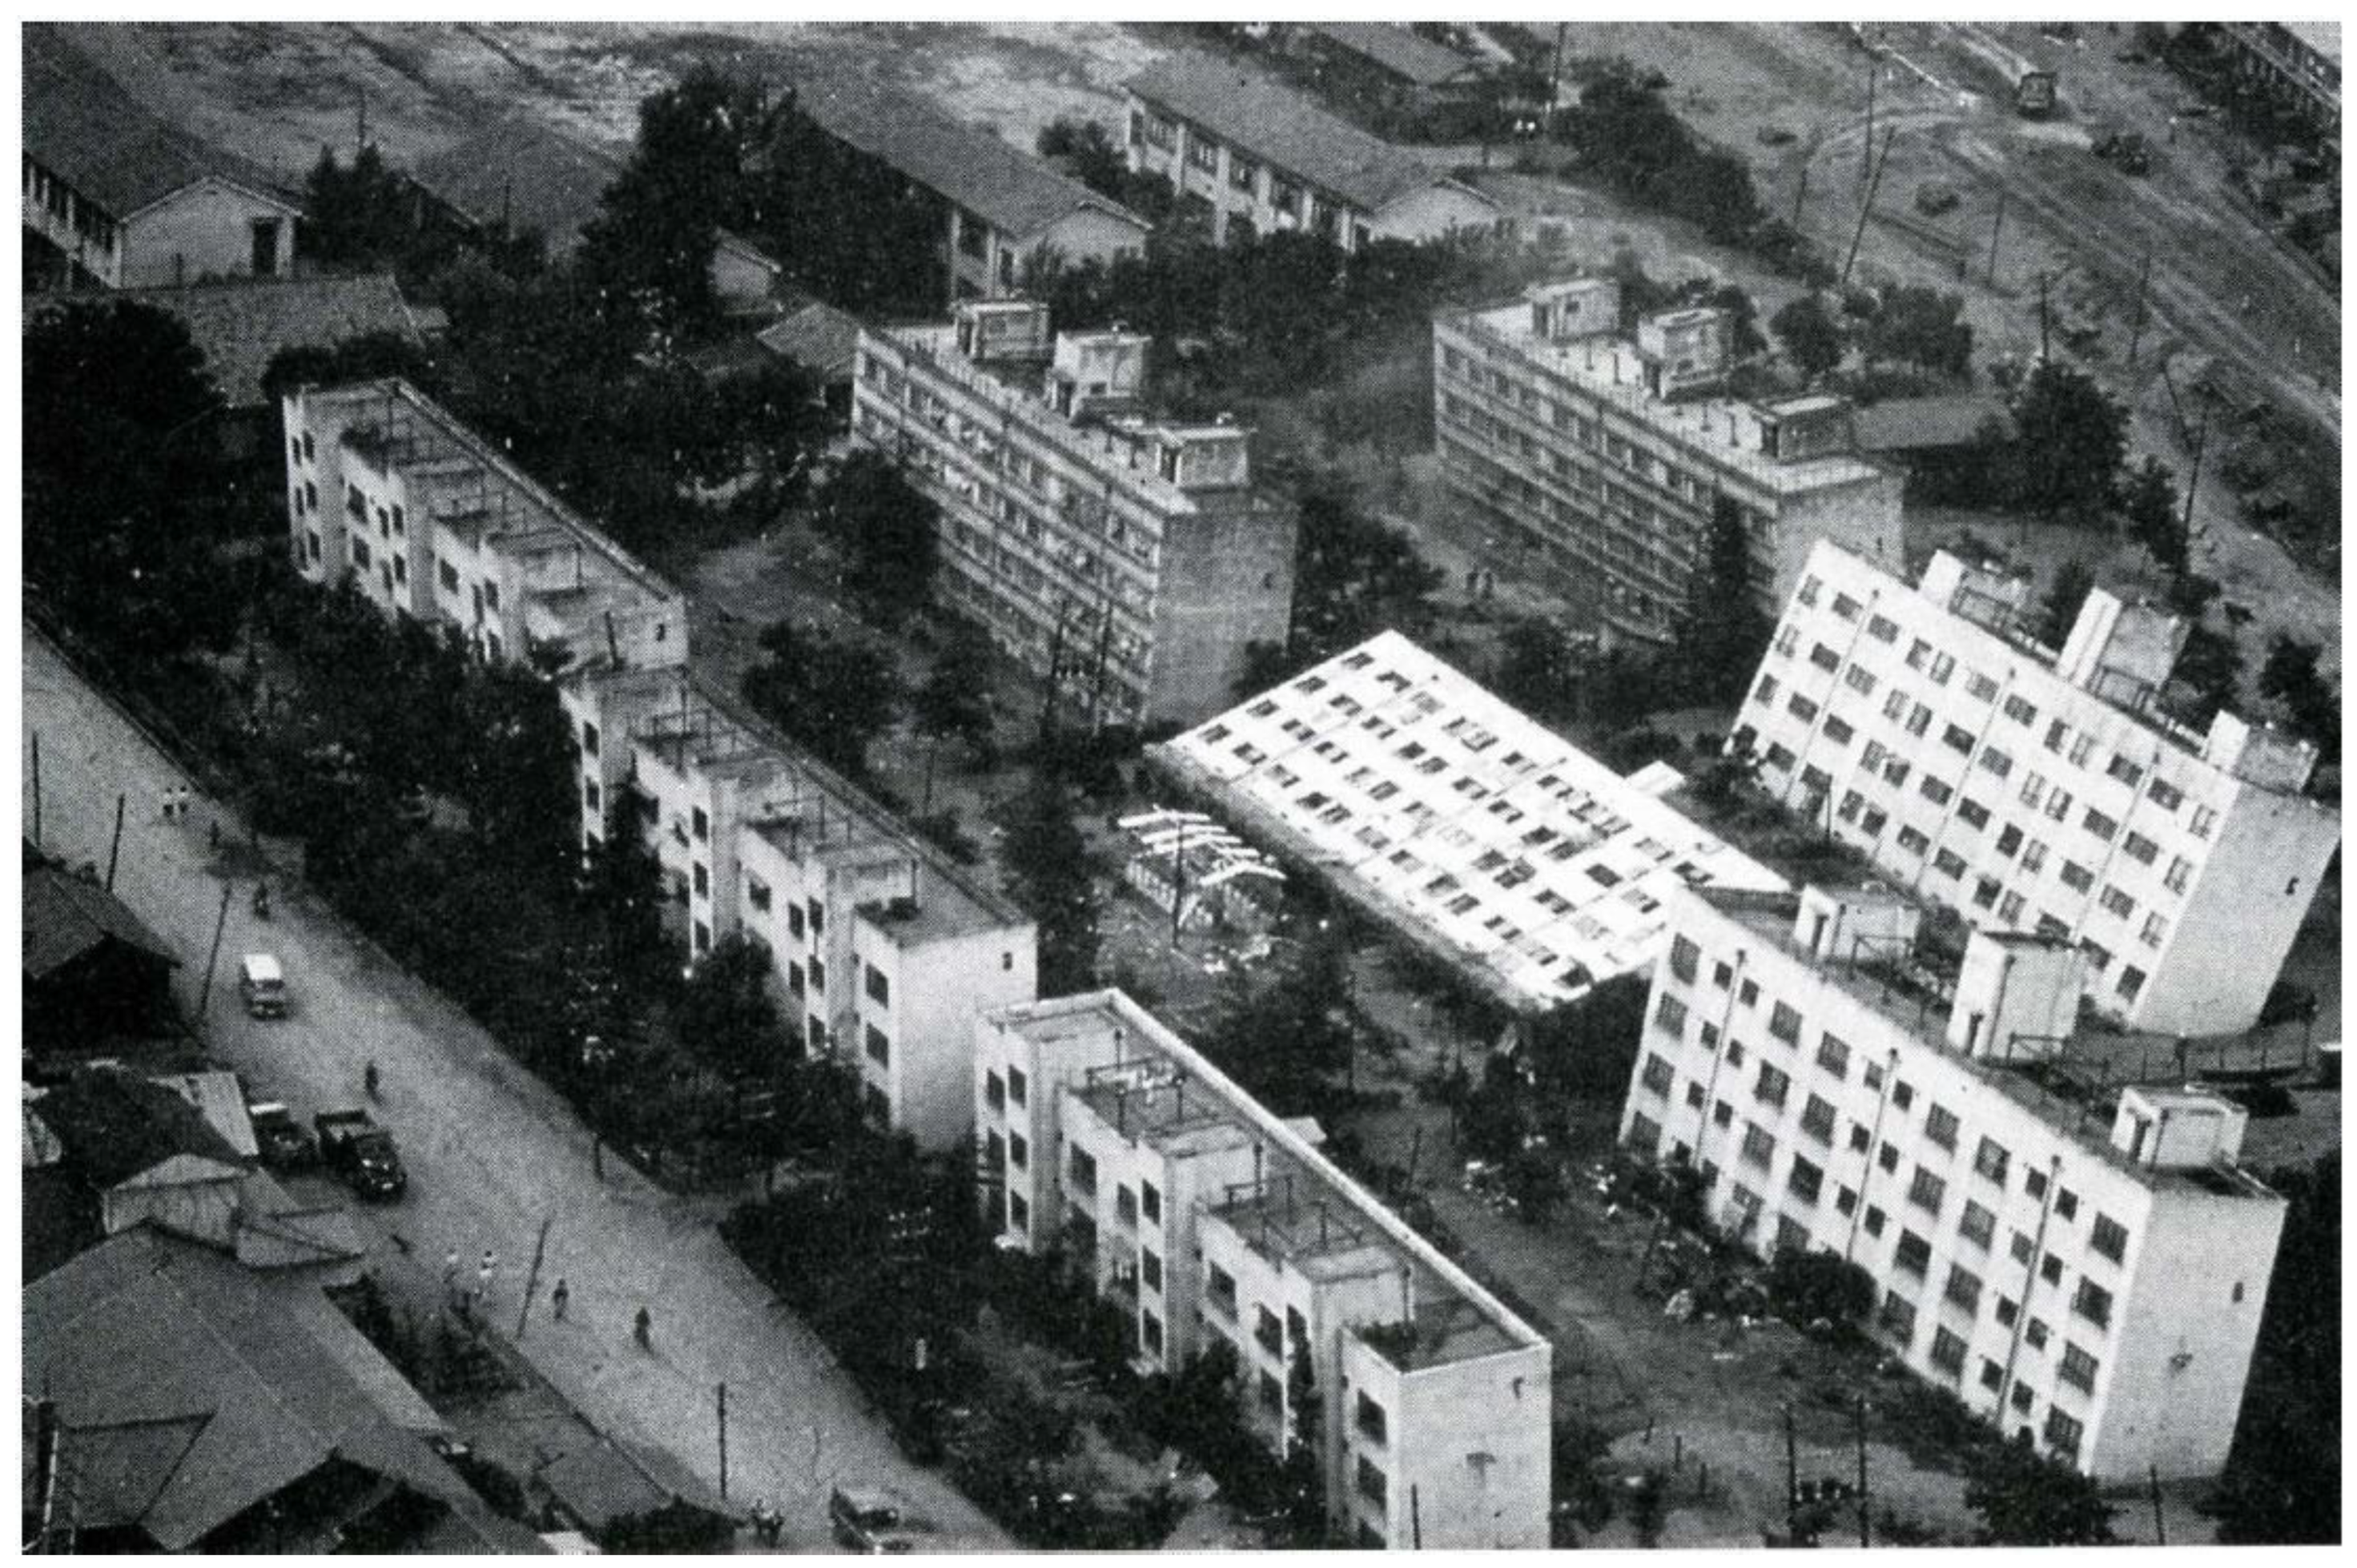
Figure 10.
a. Probabilistic relationship between magnitude corrected cyclic stress ratio and SPT blow count; (b) magnitude corrected cyclic stress ratio and VS, shear wave velocity required to cause liquefaction by (a) [17]; (b) [18]. Figure 10c Arias Intensity versus SPT blow count (c) and (d) Arias Intensity versus qc1 cone penetration resistance [18]. .
Disclaimer/Publisher’s Note: The statements, opinions and data contained in all publications are solely those of the individual author(s) and contributor(s) and not of MDPI and/or the editor(s). MDPI and/or the editor(s) disclaim responsibility for any injury to people or property resulting from any ideas, methods, instructions or products referred to in the content. |
© 2025 by the authors. Licensee MDPI, Basel, Switzerland. This article is an open access article distributed under the terms and conditions of the Creative Commons Attribution (CC BY) license (http://creativecommons.org/licenses/by/4.0/).
Copyright: This open access article is published under a Creative Commons CC BY 4.0 license, which permit the free download, distribution, and reuse, provided that the author and preprint are cited in any reuse.


