
Submitted:
12 June 2024
Posted:
12 June 2024
You are already at the latest version
Abstract
Coseismic landslides have the potential to cause catastrophic disasters. Thus, it is of crucial importance to conduct a comprehensive regional assessment of susceptibility to coseismic landslides. This study rigorously interprets 13,759 coseismic landslides triggered by the 2022 Luding earthquake within the seismic zone. Employing the Newmark method, we systematically assess the susceptibility to coseismic landslides through the application of six distinct displacement regression models. The efficacy of these models is validated against the actual landslide inventory using the area under the curve. A hazard map of coseismic landslides is generated based on the displacement regression model with the highest degree of fit. The results show that Moxi Town, Detuo Town, the flanks of the Daduhe River, Wandonghe River, Hailuogou River, and Yanzigou River are high susceptibility areas for coseismic landslides. The study explores factors influencing model fit, revealing that the inclusion of both epicentral distance and the distance to seismogenic fault and in displacement prediction enhances model performance. Nevertheless, in close proximity to fault zones, the distance to seismogenic fault exerts a more significant influence on the spatial distribution density of coseismic landslides compared to the epicentral distance. Conversely, in regions situated further from fault zones, the epicentral distance has a greater impact on the spatial distribution density of coseismic landslides compared to the distance to seismogenic fault. These findings contribute to a nuanced understanding of coseismic landslide susceptibility and offer valuable insights for future Newmark method-based coseismic landslide displacement calculations.
Keywords:
2022 Luding earthquake
; coseismic landslide susceptibility
; Newmark displacement regression model
; the distance to seismogenic fault
; epicentral distance
1. Introduction
Coseismic landslides are a geological event where a rock or soil mass, which is approaching or is already at a critical state, experiences premature sliding triggered by an earthquake [1]. Coseismic landslides pose immense hazards, sometimes surpassing the damage caused by earthquakes themselves. In recent years, the occurrence of powerful earthquakes worldwide, such as the 2008 Wenchuan earthquake (Ms8.0), the 2010 Yushu earthquake (Ms7.1), the 2018 Indonesia earthquake (Ms7.4), and the 2023 Turkey earthquake (Ms7.8), has drawn significant attention to the evaluation of coseismic landslide susceptibility. This has become a critical and challenging issue in the academic and engineering fields.
According to the China Earthquake Networks Center (https://news.ceic.ac.cn/), on September 5, 2022, a magnitude 6.8 earthquake occurred in Moxi Town, Luding County, Ganzi Tibetan Autonomous Prefecture, Sichuan Province, southwestern China. The epicenter was located at 29.59°N, 102.08°E, with a focal depth of 16 km. This earthquake triggered numerous landslides in mountainous areas, resulting in a total of 93 fatalities and 20 people missing, as well as enormous economic losses [2]. Considering the immense hazards posed by coseismic landslides, conducting a regional analysis of the susceptibility to such events is of vital significance for post-disaster reconstruction and ensuring people’s well-being.
The commonly used methods for analyzing the regional susceptibility to coseismic landslides can be roughly categorized into three types: the engineering geological analysis method, the statistical regression analysis method, and the mechanical analysis method. The engineering geological analysis method is a comprehensive qualitative method based on understanding of slope stability and engineering experience. In the early stages of landslide research, due to the limitations of research methods and the complex geological conditions of slopes, this method was commonly used for evaluation of the seismic stability of slopes [3]. The statistical regression method is based on analyzing factors that influence the development of coseismic landslides, summarizing regularities, and making predictions. By summarizing the distribution patterns of post-coseismic landslides and studying the relationships between landslides and seismic parameters as well as other influencing factors, the susceptibility trends of coseismic landslides can be extrapolated based on established statistical patterns. Alternatively, semi-quantitative predictions can be made based on expert knowledge, such as comprehensive index methods. Predictive analyses can also be conducted using models such as cluster analysis, information entropy, evidence weight, discriminant analysis, and logistic regression [4,5,6,7]. However, this method has several limitations: (1) it heavily relies on basic data, and if the inventory of landslides is not comprehensive, the analysis results may have significant errors and cannot be applied to potential seismic source areas; (2) although several factors are considered, they are often not independent of each other; and (3) the lack of consideration of dynamic mechanisms makes the physical significance of the prediction process unclear [8].
The method of mechanical modeling is based on the principles of mechanics, involving analyzing the instability mechanism and sliding process of slopes to quantitatively characterize mechanical or kinematic parameters. It provides a basis for the analysis of seismic landslide susceptibility, with clear physical significance. Terzaghi first proposed the pseudo-static method [9]. This method simplifies seismic motion by treating it as a constant body force acting on the potential sliding mass during static limit equilibrium calculations. In this method, the vertical component of the seismic motion is characterized as having a negligible impact on the seismic stability of slopes, so only the horizontal component of the seismic motion is considered. However, this method has some theoretical flaws: (1) the magnitude and direction of the pseudo-static force are constant and unchanged [10]; (2) the safety factor of the pseudo-static method can only indicate whether the slope is stable and cannot determine whether the slope will fail when the safety factor is less than 1 [10,11]; (3) under certain conditions, the minimum safety factor of the circular sliding surface cannot be determined, so the position of the critical circular sliding surface cannot be obtained [12]; (4) the pseudo-static method only considers the horizontal component of seismic motion and ignores the influence of the vertical component [13]; (5) the selection of the pseudo-static coefficient lacks a reasonable theoretical basis and can only be determined empirically based on engineering practice [11]. Clough and Chopra first introduced the finite element method into the analysis of soil dynamic response, marking the introduction of numerical analysis methods into the field of dynamic response analysis of slopes [14]. However, numerical analysis methods also have certain limitations: they have high computational and time costs, and determining the model scope and boundary conditions is difficult. Therefore, they are commonly used to analyze individual slopes [8].
Newmark proposed the method of permanent displacement calculation based on the rigid block model, which calculates the permanent displacement of slopes under seismic action, thereby evaluating the stability of slopes under seismic action [15]. The application of Newmark’s proposed method to multiple strong earthquake records has yielded favorable outcomes, enhancing the validity of this approach for application to individual slopes [16]. Building upon the foundation of Newmark’s theory, the utilization of a decoupling approximation mindset has addressed the shortcomings of traditional assumptions concerning deep-seated landslides [17]. Additionally, the implementation of a fully nonlinear decoupled one-dimensional dynamic analysis technique, alongside a nonlinear fully coupled sliding-block model, has further simplified the utilization of this method for seismic displacement prediction [18]. Subsequently, a simplified methodology was employed to forecast earthquake-induced permanent displacement. This approach utilized a nonlinear fully coupled sliding-block model, integrating critical acceleration, a dominant sliding-block period, and seismic spectral acceleration as contributing factors [19]. Considering the variability in the natural period observed during the dynamic response of slopes, a unified and streamlined model was developed to enhance the accuracy of predicting earthquake-induced sliding displacements in both rigid and flexible landslide masses [20].
In a systematic study, Jibson et al. examined using the Newmark method for evaluating regional coseismic landslide susceptibility, focusing on the Oat Mountain area north of the epicenter of the 1994 Northridge earthquake near Los Angeles [21,22]. They presented the calculation process of the Newmark method for regional coseismic landslide susceptibility zoning and produced a susceptibility zoning map for the study area. Many scholars have since applied the Newmark method for assessing regional seismic landslide susceptibility. Chen et al. analyzed and predicted potential seismic landslide hazard zones in the Lushan earthquake area in 2013 based on the Newmark model [23]. Through comparison with actual interpreted landslides, they found the model to be an effective method for predicting coseismic landslides. Similar research was conducted on the 2014 Ludian earthquake, further confirming the validity of the methodology [24]. Wang et al. proposed a rapid assessment method for seismic landslide hazards based on a simplified Newmark displacement model, taking the heavily affected area of the 2008 Wenchuan earthquake as an example [25]. They conducted a rapid assessment of seismic landslide hazards in the area, demonstrating the reliability of the method through comparisons with post-earthquake landslide results. Zhang et al. constructed a new model for evaluating seismic slope stability considering the influence of velocity pulse seismic motion on permanent displacements, based on the Newmark model established by Jibson [26,27]. The model has the potential to measure the probability of shallow slope failure during future earthquakes in a range from very low to very high by generating seismic landslide hazard maps for near-fault regions. Zang et al. developed an improved model based on the Newmark model, considering the joint roughness coefficient (JRC) and unconfined compressive strength (JCS) of rock joints [28]. They compared the improved model with the traditional Newmark model using the distribution of landslides induced by the 2014 Ludian earthquake, finding that the improved model had a better fit with the actual landslide distribution. Liu et al. carried out a rapid assessment of coseismic landslides induced by the 2022 Luding earthquake using the Newmark method, delineating hazardous areas and providing recommendations for post-earthquake disaster prevention and mitigation [29]. This study also validated the effectiveness of the Newmark cumulative displacement method in rapid assessment of coseismic landslides.
In the Newmark method, the permanent displacement value is obtained by integrating the time during which the seismic acceleration exceeds the critical acceleration of the slope [15]. In the regional analysis process, it is often necessary to rasterize the study area using GIS techniques. Therefore, it is not practical to calculate the permanent displacement values for each grid cell using the standard Newmark method. To address this issue, some scholars have studied the relationship between Newmark permanent displacement and seismic motion parameters, establishing simple and practical mathematical regression models for rapid prediction of seismic landslide susceptibility in regional analysis. Ambraseys and Menu were the first to conduct such research [30]. They selected 50 sets of strong ground motion records from 11 earthquakes and proposed a relationship between Newmark permanent displacement and the ratio of slope critical acceleration to PGA. Jibson (1993) proposed a relationship between and Arias intensity (), based on 11 strong earthquake records. Later, in 1998 and 2000 (Jibson et al. 1998, 2000), this formula was improved using 555 strong earthquake records from 13 seismic events[21,22,31]. However, the majority of the selected earthquake data in this model had relatively small peak ground acceleration, leading to distorted results when the critical acceleration was larger. Therefore, Jibson selected 2,270 strong earthquake records from 30 global seismic events and fitted regression formulas for displacement with different combinations of seismic motion parameters [27]. Subsequently, several scholars derived displacement regression formulas with various parameter combinations based on different seismic motion records, such as , the ratio of to PGA, PGA, peak ground velocity (PGV), and [32,33,34,35]. These regression formulas facilitate the use of the Newmark model in the susceptibility assessment of coseismic landslides. However, some issues should be addressed. The determination of these regression formulas is specific to certain geological backgrounds and particular seismic events. Therefore, their applicability should be validated rather than solely considering the number of factors or the size of the database.
We obtained a comprehensive inventory of landslides caused by the 2022 Luding earthquake. In this paper, we will summarize six types of displacement regression models, choosing the best-fitting model by comparing the predicted displacement with the inventory of actual landslides. The impact of parameters on the fitting of regression models is also explored. Finally, a hazard map of landslides posed by the Luding earthquake is provided using the best-fitting regression model.
2. Study Area
The study area is located at the intersection of Ganzi Autonomous Prefecture and Ya’an City in the northwest of Sichuan Province, China (Figure 1). The area covers approximately 964.8 km2 and includes the epicenter, the seismogenic fault, and most of the landslides triggered by the Luding earthquake. The elevation ranges from 874 to 4668 m, with the highest point situated at the Wanglangbao mountain in the central-left part of the area and the lowest point in the valley of the Daduhe River in the central area. The Daduhe River flows through the study area from north to south, characterized by deep valleys, developed tributaries, and steep slopes on both sides. Deep valleys also contribute to slope instability. The vertical relief between the valley bottoms and the mountain ridges can create significant pressure on the slopes. Additionally, the rapid changes in elevation within a short distance can cause stress concentration, making the slopes more vulnerable to failure. The predominant lithologies in the study area vary in age from the Paleoproterozoic to the Mesozoic, including diorite and picrite of the Paleoproterozoic, rhyolite porphyry and granite of the Sinian Formation, limestone, dolomite, and slate of the Devonian, quartzite, dolomite, and limestone of the Permian, sandstone of the Triassic, and conglomerate of the Quaternary period. The distribution of lithologies is shown in Figure 2.
The seismogenic fault of the Luding earthquake is the Moxi fault, the southern section of the Xianshuihe fault zone, which is situated in the compressional boundary zone between the Sichuan–Yunnan Block and the Yangtze Block [36]. The Xianshuihe fault system serves as the northeast boundary fault of the material extrusion from the Qinghai–Tibet Plateau to the southeast and is one of the most active fault systems in China’s continental interior [37,38]. The left-lateral strike-slip fault motion is decomposed onto other adjacent fault zones, such as the Anning River, Dalingshan, and Zemu River fault zones, in the eastern region. The left-lateral shearing strike-slip motion then occurs along the Xiaojianghe fault zone and extends into Yunnan, crossing the well-known Honghe fault and extending into Myanmar.
3. Materials and Methodology
3.1. Sources of Data
The required data primarily includes a digital elevation model (DEM) of the study area, details on the lithology and its physical-mechanical parameters, and information on PGA and PGV that describe seismic effects. The slope of the study area was extracted from the DEM using basic slope algorithms on a GIS platform. The seismic parameter Ia was fitted based on the distance to seismogenic fault and lithology using empirical formulas [39]. The sources of data are listed in Table 1.
3.2. Inventory of the Landslides Induced by the 2022 Luding Earthquake
An accurate and detailed compilation database of landslides serves as the foundation for susceptibility assessment of landslides. Therefore, we employed a combined approach of visual interpretation based on optical satellite imagery and field investigations to establish a landslide catalog. The optical satellite imagery used in this study was obtained from Planet satellite data, captured in July 2022 and September 29, 2022. Comparing the image features before and after the earthquake enhances the accuracy of the interpreted results for the coseismic landslides. The distribution of these interpreted coseismic landslides is illustrated in Figure 1.
3.3. Methodology
In 1965, Newmark proposed a model that conceptualizes a sliding mass in nature as a rigid body sliding on a slope (Figure 3). The model evaluates the stability of soil and rock masses by calculating the permanent cumulative displacement of the soil and rock masses under seismic actions. The rigid body itself has a critical acceleration, which represents the minimum seismic acceleration required for the rigid body to overcome the base friction and start sliding. The stability of the slope is related to the of the sliding mass, and can be expressed as:
where, is the critical acceleration, is the safety factor, is the gravitational acceleration, and can be expressed as the slope angle of the sliding block.
The safety factor can be determined by the model’s infinite slope limit equilibrium equation:
where, represents the effective internal cohesion, represents the bulk density of the sliding block, represents the thickness of the sliding block, represents the slope angle of the sliding block, represents the effective internal friction angle, represents the water content of the sliding block, and represents the bulk density of water.
In this case, if an external load acceleration is applied to the sliding block, the difference between the external load acceleration and the critical acceleration can be integrated (Figure 4A) to obtain the sliding velocity of the sliding block (Figure 4B), and integrating the velocity will yield the cumulative displacement of the sliding mass (Figure 4C). The stability of the slope is determined by the magnitude of the displacements.
4. Results and Analysis
4.1. Static Factor-of-Safety Map
In this study, a 30m × 30m digital elevation model (DEM) was selected from the Geospatial Data Cloud (https://www.gscloud.cn/search), and a slope map of the study area was generated from the DEM using the GIS platform (Figure 5). The static safety factor can be calculated using Eq. 2, where the first term on the right-hand side of Eq. 2 represents the cohesion of the landslide mass, and the thickness of the sliding mass is empirically taken as 3 m. The second term represents the frictional component, while the third term represents the decrease in frictional strength of the slope due to the pore pressure of water. Since the water content of the landslide in Luding area is very low, the influence of pore water pressure is not considered when calculating the static safety factor in this study. Only the effects of material cohesion and internal friction angle on the safety factor are considered. The rock types and their physical-mechanical parameters in the study area are shown in Table 2. According to the Newmark model, a smaller static safety factor indicates a more unstable slope. However, when calculating the , any parts where the static safety factor is less than 1 will result in a negative . Therefore, in this study, the parts where the static safety factor is less than 1 are all defined as 1.01, just slightly above the limit equilibrium state, to avoid negative [21,22]. According to Keefer’s research, the minimum slope angle for most coseismic landslides is 5° [1]. The areas with slope angles less than 5° had very high safety factors during the Luding earthquake and will not be considered in the calculation. The resulting static safety factor ranges from 1 to 13.6, as shown in Figure 6.
The safety factor is primarily associated with regional rock strength and terrain data, as is evident from Figure 6. It can be observed that the safety factor in the mountainous regions on both sides of the study area is lower compared to the river valley plain area in the middle. This can be further corroborated by comparing it with the slope map (Figure 5), where areas with higher slopes exhibit lower safety factors, indicating greater danger.
4.2. Critical Acceleration Map
According to the Newmark method, the of potential sliding masses can be analyzed through a pseudo-static analysis of the static safety factor and the regional slope angle. The spatial distribution map of (Figure 7) is calculated using Eq. 1. The of the sliding mass is determined by the topography and lithology of the mass, independent of the seismic shaking induced by earthquakes. Therefore, the spatial distribution map of illustrates the sensitivity of coseismic landslides [21,22]. Lower values of indicate greater susceptibility to a coseismic landslide.
4.3. Predicted Displacement
4.3.1. Seismic Motion Map
The seismic parameters widely used in the Newmark model primarily include , , and . The maps of PGA and PGV were obtained from the USGS, with the epicenter of the Luding earthquake reported to be at a latitude of 29.679° N and a longitude of 102.236° E. However, according to the China Earthquake Networks Center (CENC) and our field investigations, the actual epicenter of the Luding earthquake is at a latitude of 29.59° N and a longitude of 102.08° E (https://news.ceic.ac.cn). We utilized the GIS platform to compute the relative deviation between the actual epicenter and the erroneous epicenter, based on which we conducted a calibration of the positions for PGA and PGV. The calibrated distribution map and distribution map are shown in Figure 8A and B, respectively. The range is from 0.1 g to 0.46 g, while the range is from 8 m/s to 52 m/s. is mainly obtained through empirical attenuation formulas based on the relationship between earthquake magnitude, epicentral distance, and distance from the seismogenic fault. Several scholars have fitted attenuation formulas for different parameters based on seismic records [40,41]. In this study, we chose the empirical attenuation formula for developed by Wang et al. based on the analysis of 40 strong-motion records from southwestern China [41]:
where, is the distance from the seismogenic fault.
It is important to emphasize that the attenuation formula yields a total value of from north–south and east–west directions, while and are the average values in these two horizontal directions. To facilitate comparison, we divided by two to obtain an average value in the horizontal direction. The resulting distribution map of is shown in Figure 9, with a maximum value of 19.24 m/s and a minimum value of 5.93 m/s.
4.3.2. Comparative Analysis of Regression Models
The Newmark permanent displacement is calculated by performing a double integration of the seismic acceleration that exceeds the slope’s critical acceleration over time. In regional analysis, it is unfeasible to apply the standard Newmark method to compute permanent displacement for individual grid cells. To solve this problem, many scholars have studied the relationship between Newmark permanent displacement and seismic motion parameters, establishing some simple and practical mathematical regression models for rapid prediction of seismic landslide susceptibility at the regional scale [21,22,27,30,31,32,33,34,35]. The ratio of to is referred to as the acceleration ratio (AR). The mathematical regression formula for Newmark permanent displacement can be categorized into six types based on the parameter combinations: (1) AR; (2) and ; (3) AR and ; (4) AR and ; (5) AR, , and ; (6) AR, , , and .
For each type, in accordance with previous studies, the Newmark displacement regression formula with the highest coefficient of determination (R2) was selected to compare the fitting degree between the predicted displacements and the distribution of landslides triggered by the 2022 Luding earthquake. The specific regression formulas are shown in Table 3.
The area under the ROC curve (AUC) served as a measure of the fitting degree. An AUC value less than or equal to 0.5 indicates a model fit worse than random prediction, while an AUC value of 1.0 indicates a perfect fit with the landslide distribution [7]. By plotting the ROC curve using these values, the fit of the six models can be compared. The displacement values obtained from the calculation model can be divided into intervals according to the natural breakpoints. By arranging the intervals in descending order based on their areas as a proportion of the total area, the x-axis can be defined. Similarly, the y-axis can be defined by arranging the intervals in descending order based on the proportion of landslide area within each interval as a proportion of the total study area landslide area. Figure 10 demonstrates that the regression equation proposed by Saygili et al. [33], incorporating four parameters, i.e., AR, , , and (Eq. 9), exhibits the highest degree of fit to the coseismic landslides, with an AUC value of 0.61.
4.3.3. Newmark Displacement Map
The Newmark permanent displacement distribution was calculated using Eq. 9 and is illustrated in Figure 11. The predicted displacements range from 0 to 504 cm. The low-displacement zone is primarily distributed in the plains on both sides of the Daduhe River valley, while the high-displacement zone is mainly distributed near the epicenter and on the steep slopes on both sides of the fault. However, unlike the distribution of the static safety factor (Figure 6) and critical acceleration (Figure 7), Newmark displacements show a distribution of displacements on the northwest side of the study area that are greater than those on the southeast side. In other words, the level of danger is higher on the northwest side compared to the southeast side. This can be attributed to the fact that the epicenter of the Luding earthquake is located on the northwest side of the study area; thus, the Newmark displacement distribution pattern for the Luding earthquake prediction, as depicted in Figure 11, reflects the influence of seismic action on slope stability.
4.4. Spatial Probability of Coseismic Landslide
Jibson et al. employed the Weibull curve to fit the calculated results of the Newmark method with the actual landslide distribution, and found a good fit between the curve and the data[21,22]. Therefore, in this study, the Weibull curve was adopted to fit the Newmark displacement with the actual landslide distribution. The principle involves rasterizing the calculated displacements, using the proportion of actual landslides within each displacement interval as the y-axis and the displacement as the x-axis, and fitting the data points with the Weibull curve. The fitting result is shown in Figure 12 (R2=0.87). As the displacement increases, the proportion of actual landslides within the displacement interval also increases, indicating a larger landslide-to-displacement ratio. After 200 cm, this ratio stabilizes, with a maximum proportion of approximately 8.6%. Reflecting the fitted curve data onto the study area yields a spatial probability distribution map of coseismic landslides (Figure 13), where the majority of landslides are located in the high-hazard areas (indicated with a red color). This demonstrates that the distribution map effectively represents the hazardous zones of coseismic landslides.
5. Discussion
Figure 13 shows that the higher probability areas of coseismic landslides are mainly located at Moxi and Detuo. The overall northwestern part of the study area poses a greater hazard of coseismic landslides compared to the southeastern part, which is consistent with the findings of Liu et al. [29]. The higher probability areas, where landslides are prone to occur, are concentrated along the Xianshuihe fault belt (Figure 13), which indicates that the seismogenic fault plays an important role in determining the spatial distribution of coseismic landslides [42]. The higher probability areas of coseismic landslides are also concentrated in steep slopes on both sides of the Daduhe, Yanzigou, Hailuogou, and Wandonghe river valleys (Figure 13). Greater slope gradients significantly increase the occurrence of coseismic landslides.
Among the six different regression models, the model proposed by Saygili et al. [32], which utilized AR, , , and , achieved the highest AUC value and exhibited good fit with the distribution of landslides induced by the 2022 Luding earthquake. However, this is not solely attributed to the number of seismic parameters used in the model, as Saygili et al. achieved an AUC value of 0.57 with their three-parameter model (AR, , and ), whereas Xu et al. obtained an AUC value of 0.60 with their two-parameter model (AR and ), which is higher than Saygili’s three-parameter model [32,34]. Therefore, the number of seismic parameters in the model is not the primary factor contributing to its good fit with actual landslides. This study suggests that the reason behind the good fit of the four-parameter model lies in the correlation between the distribution of and (Figure 8A and B) with the epicentral distance, as well as the correlation between the distribution of (Figure 9) and the distance to seismogenic fault. Similarly, Xu et al. (2012) achieved the second-highest AUC value with their two-parameter model (AR and ), which also incorporated and [34]. Both models considered the influence of epicentral distance and the distance to seismogenic fault on seismic parameters, resulting in a good fit with the actual distribution of coseismic landslides. Therefore, it can be indicated that considering both epicentral distance and the distance to seismogenic fault when incorporating seismic parameters in the Newmark model has a favorable impact on the prediction results.
To enhance our understanding of the influence exerted by epicentral distance and the distance to seismogenic fault on the spatial distribution of seismic landslides, we conducted a comparative study. Figure 14 shows that the density of coseismic landslides reaches its peak near the Xianshuihe fault, followed by an approximately monotonic decrease as the distance to seismogenic fault increases. When the distance to seismogenic fault reaches 15 km, the density of coseismic landslides nearly diminishes to zero. Conversely, landslides are seldom distributed in the vicinity of the epicenter, with their prevalence peaking as the epicentral distance extends to 7 km. Subsequently, the density of coseismic landslides exhibits a fluctuating decrease with further increases in epicentral distance, ultimately approaching zero at an epicentral distance of 35 km. It is deduced that when the predicted region encompasses or is in close proximity to the seismogenic fault, precedence should be given to the influence of the distance to seismogenic fault, followed by the impact of the epicentral distance. Conversely, when the predicted region is situated far from the seismogenic fault, the fault’s influence on coseismic landslides becomes less pronounced. In such instances, the distribution density of coseismic landslides is primarily influenced by the epicentral distance, with additional considerations required for factors such as lithology and topography.
In the study by Jin et al., a comparison between Eq. 5 and Eq. 7 was conducted using data from the 2013 Lushan Ms7.0 earthquake [35]. It was found that Eq. 5 exhibited a significantly smaller root mean square error compared to Eq. 7. However, in the present investigation, Eq. 5 yielded the lowest AUC value of 0.55, diverging from the findings reported by Jin et al. This discrepancy can be attributed to the approach employed by Jin et al., where Eq. 5 was fitted to the seismic records by inputting values within the range from 0.01 to 0.15 in increments of 0.01. The model coefficients were subsequently readjusted based on these standardized values. Notably, this process overlooked the consideration of region-specific critical accelerations influenced by lithology and topography. In contrast, our study validated the model results using the actual distribution of landslide occurrences, resulting in outcomes differing from those reported by Jin et al.. Consequently, it is recommended that future coseismic hazard assessments employing the Newmark method should involve the refitting of model coefficients based on historical earthquake data specific to the study area. Subsequent displacement predictions using the revised model are crucial for obtaining accurate and region-specific results.
When computing permanent displacement using the Newmark displacement regression formula Eq. 4 in a regional analysis, only the grid cell where is greater than is taken into account. This precaution is taken due to the model’s formula violating mathematical laws, resulting in a negative value in the logarithmic component when considering the grid cell where exceeds (Table 3). However, this rationale is consistent with the principles of the Newmark method. As the Newmark displacement originates from the double integration of the segment where exceeds [15], the following question arises: should a similar procedure be applied when employing alternative Newmark displacement regression formulas for regional analysis, focusing solely on grid cells where surpasses ? To address this question, we conducted a comparative analysis using the Newmark displacement regression formula with the highest degree of fit (Eq. 9). In one scenario, calculations were performed exclusively for grid cells in the region where exceeds , assuming stability and no sliding for other grid cells. In the second scenario, computations were carried out for all grid cells in the region, regardless of whether the in a particular grid cell exceeded or not. Simultaneously, the magnitude of the AUC values was employed to compare the accuracy of the two calculation methods. The results indicated that when exclusively considering the grid cells where is smaller than , the resulting AUC value was 0.6094, whereas, without imposing this condition, the model yielded an AUC value of 0.6092. It can be deduced that this condition exerts a negligible impact on the overall calculation. Nevertheless, in practical coseismic landslide occurrences, some landslides do take place in the grid cells where exceeds . Although the calculated displacement values for these grid cells in the theoretical model are relatively small, they still pose a certain level of hazard. Relying solely on calculations that consider the grid cells where is greater than might not accurately predict hazardous areas. Therefore, it is advisable to omit this condition when utilizing Newmark displacement regression models for calculation to obtain more comprehensive and reliable results.
As mentioned in the introduction section, statistical analysis is also an important method for assessing the susceptibility of coseismic landslides. Previous studies have shown that slope gradient and the distance to seismogenic fault are two important factors influencing the distribution density of coseismic landslides [42,43]. Research conducted by Jibson et al. has demonstrated that the Newmark modeling procedure is slope-driven [21,22]. Consequently, the Newmark method adeptly delineates the impact of slope gradient on the spatial distribution of coseismic landslides. The study presented in this paper demonstrates that the epicentral distance and the distance to seismogenic fault can influence the predictive performance of the Newmark method, thereby affecting the accuracy of coseismic landslide susceptibility assessments. Constrained by the seismic parameter data obtained, the distribution of and appears in concentric circular shapes, without reflecting the influence of the seismogenic fault. This somewhat diminishes the impact of the distance to seismogenic fault on the Newmark method, resulting in a decrease in the AUC value. Continuous improvement in subsequent research endeavors is required to address this limitation. Furthermore, the study area selected in this paper does not revolve around the epicenter but rather centers on the seismogenic fault. Additionally, efforts were made to encompass as many interpreted coseismic landslides as possible. However, this approach may not objectively reflect the influence of epicentral distance on the assessment outcomes of coseismic landslide susceptibility, thus contributing to the relatively modest AUC values observed. From the foregoing discussion, it is evident that the selection of fundamental data such as terrain and seismic parameters significantly impacts the assessment accuracy of the Newmark method. This amplifies the complexity of its application and underscores the need for dedicated analysis and special consideration in future applications.
6. Conclusion
This study conducted a susceptibility assessment of coseismic landslides triggered by the 2022 Luding Ms6.8 earthquake using six different Newmark displacement regression models and explored the factors affecting the applicability of the models. The main conclusions are as follows:
(1) The 2022 Luding earthquake induced 13,759 landslides within an area of 964.8 km2. These landslides were predominantly concentrated along steep mountain slopes on both sides of the fault and in the valley area on the right bank of the Daduhe River. The prediction outcomes designate Moxi Town, Detuo Town, both sides of the Daduhe River, Wandonghe River, Hailuogou River, and Yanzigou River as high susceptibility areas for coseismic landslides.
(2) The model composed of seismic parameters such as AR, , , and demonstrates a commendable fit to the distribution of coseismic landslides. Conversely, models that solely account for and yield unsatisfactory fitting results. Consequently, when employing the Newmark displacement method for susceptibility assessment of coseismic landslides, it becomes imperative to validate the fitting formula, taking into account the specific geological and environmental conditions.
(3) In the proximity of the fault, priority should be given to considering the influence of distance to seismogenic fault and epicentral distance when assessing the susceptibility of coseismic landslides. However, when situated far from the fault, the impact of distance to seismogenic fault on landslides diminishes. In such cases, attention should be directed towards factors like epicentral distance, topography, and lithology, which become more significant in influencing susceptibility.
Author Contributions
Conceptualization, M.Z. and J.P.; methodology, T.L. and M.Z.; validation, T.L.; formal analysis, T.L. and M.Z.; investigation, T.L.; resources, M.Z. and C.X.; data curation, M.Z.; writing—original draft preparation, T.L. and M.Z.; writing—review and editing, M.Z., J.P., and C.X.; project administration, M.Z. and J.P.; funding acquisition, M.Z. All the authors have read and agreed to the published version of the manuscript.
Funding
This research was funded by the National Natural Science Foundation of China (grant nos. 42207215 and 41825018).
Acknowledgments
The authors thank the National Natural Science Foundation of China (Grant Nos. 42207215 and 41825018). We also appreciate the insightful comments from the reviewing experts and academic editor, which significantly enhanced the quality of this manuscript.
Conflicts of Interest
The authors declare no competing interests.
References
- Keefer, D.K. Landslides caused by earthquakes. Geological Society of America Bulletin, 1984, 95(4): 406-421.
- Fan, X.M.; Wang, X.; Dai, L.X.; Fang, C.Y.; Deng, Y.; Zou, C.B.; Tang, M.G.; Wei, Z.L.; Dou, X.Y.; Zhang, J.; et al. Characteristics and spatial distribution pattern of M S 6.8 Luding earthquake occurred on September 5, 2022. Journal of Engineering Geology, 2022, 30(5): 1504-1516.
- Sun, Y.K., Mou, H.C.; Yao, B,K. Slope stability analysis. Beijing: Science Press, China, 1988.
- Parise, M.; Jibson, R.W. A seismic landslide susceptibility rating of geologic units based on analysis of characteristics of landslides triggered by the 17 January, 1994 Northridge, California earthquake. Engineering geology, 2000, 58(3-4): 251-270. [CrossRef]
- Marzorati, S.; Luzi, L.; De, A.M. Rock falls induced by earthquakes: a statistical approach. Soil Dynamics and Earthquake Engineering, 2002, 22(7): 565-577. [CrossRef]
- Wang, Y.Q.; Gao, Y.P.; Xin, H.B. A research on prediction of seismic stability of slopes by grey clustering method. Industrial Construction, 2002, 32(6): 44-47.
- Miles, S.B.; Keefer, D.K. Evaluation of CAMEL—comprehensive areal model of earthquake-induced landslides. Engineering Geology, 2009, 104(1-2): 1-15. [CrossRef]
- Zang, M.D. A probabilistic framework for mapping hazards of coseismic landslides. University of Chinese Academy of Sciences, Beijing, 2019.
- Karl, Terzaghi. Mechanism of Landslides. Application of Geology to Engineering Practice, Sidney Paige, 1950.
- Seed, H.B. Stability of earth and rockfill dams during earthquakes. Publication of: Wiley (John) and Sons, Incorporated, 1973. [CrossRef]
- Jibson, R.W. Methods for assessing the stability of slopes during earthquakes—A retrospective. Engineering Geology, 2011, 122(1-2): 43-50. [CrossRef]
- Wu, X.Y.; Law, K.T.; Selvadural, A.S. Examination of the pseudo-static limit equilibrium method for dynamic stability analysis of slopes. Proc. 44th Canadian Geotechnical Conference, Calgary. 1991: 1961-1968.
- Ling, H.I.; Cheng, A.H. Rock sliding induced by seismic force. International Journal of Rock Mechanics and Mining Sciences, 1997, 34(6): 1021-1029.
- Clough, R.W.; Chopra, A.K. Earthquake stress analysis in earth dams. Journal of the Engineering Mechanics Division, 1966, 92(2): 197-211.
- Newmark, N.M. Effects of earthquakes on dams and embankments. Geotechnique, 1965, 15(2): 139-160. [CrossRef]
- Franklin, A.G.; Chang, F.K. Earthquake Resistance of Earth and Rock-fill Dams: Report 5, Permanent Displacements of Earth Embankments by Newmark Sliding Block Analysis. Department of Defense, Department of the Army, Corps of Engineers, Waterways Experiment Station, Soils and Pavements Laboratory, 1977.
- Makdisi, F.I.; Seed, H.B. Simplified procedure for estimating dam and embankment earthquake-induced deformations. Journal of the Geotechnical Engineering Division, 1978, 104(7): 849-867. [CrossRef]
- Bray., J.D.; Rathje, E.M. Bray. J.D.; Rathje, E.M. Earthquake-induced displacements of solid-waste landfills. Journal of Geotechnical and Geoenvironmental Engineering, 1998, 124(3): 242-253.
- Bray, J.D.; Travasarou, T. Simplified procedure for estimating earthquake-induced deviatoric slope displacements. Journal of geotechnical and geoenvironmental engineering, 2007, 133(4): 381-392. [CrossRef]
- Rathje, E.M.; Antonakos, G. A unified model for predicting earthquake-induced sliding displacements of rigid and flexible slopes. Engineering Geology, 2011, 122(1-2): 51-60. [CrossRef]
- Jibson, R.W.; Harp, E.L.; Michael, J.A. A method for producing digital probabilistic seismic landslide hazard maps: an example from the Los Angeles, California, area. Washington, DC, USA: US Department of the Interior, US Geological Survey, 1998. [CrossRef]
- Jibson, R.W.; Harp, E.L.; Michael, J.A. A method for producing digital probabilistic seismic landslide hazard maps. Engineering geology, 2000, 58(3-4): 271-289. [CrossRef]
- Chen, X.L.; Yuan, R.M.; Yu, L. Applying the Newmark’s model to the assessment of earthquake-triggered landslides during the Lushan earthquake. Seismology and Geology, 2013, 35(3): 661-670.
- Chen, X.L.; Liu, C.; Wang, M. A method for quick assessment of earthquake-triggered landslide hazards: a case study of the Mw6. 1 2014 Ludian, China earthquake. Bulletin of Engineering Geology and the Environment, 2019, 78: 2449-2458. [CrossRef]
- Wang, T.; Wu, S.R.; Shi, J.S.; Xin, P. Case study on rapid assessment of regional seismic landslide hazard based on simplified Newmark displacement model: Wenchuan Ms 8.0 earthquake. Journal of Engineering Geology, 2013, 21(1): 16-24.
- Zhang, Y.B.; Xiang, C.L.; Chen, Y.L.; Xiao, L.; Yu, P.C.; Chang, Z.W. Permanent displacement models of earthquake-induced landslides considering near-fault pulse-like ground motions. Journal of Mountain Science, 2019, 16(6): 1244-1257. [CrossRef]
- Jibson, R.W. Regression models for estimating coseismic landslide displacement. Engineering geology, 2007, 91(2-4): 209-218. [CrossRef]
- Zang, M.D.; Qi, S.W.; Zou, Y.; Sheng, Z.P.; Blanca, S.Z. An improved method of Newmark analysis for mapping hazards of coseismic landslides. Natural Hazards and Earth System Sciences, 2020, 20(3): 713-726. [CrossRef]
- Liu, J.M.; Wang, T.; DU, J.J.; Chen, K.; Huang, J.H.; Wang, H.J.; Ruan, Q.Q.; Feng, F. Emergency rapid assessment of landslides induced by the Luding MS6.8 earthquake in Sichuan of China. Hydrogeology & Engineering Geology, 2023, 50(2): 84-94.
- Ambraseys, N.N.; Menu, J.M. Earthquake-induced ground displacements. Earthquake engineering & structural dynamics, 1988, 16(7): 985-1006.
- Jibson, R.W. Predicting earthquake-induced landslide displacements using Newmark’s sliding block analysis. Transportation Research Record, 1993.
- Saygili, G.; Rathje, E.M. Empirical predictive models for earthquake-induced sliding displacements of slopes. Journal of geotechnical and geoenvironmental engineering, 2008, 134(6): 790-803. [CrossRef]
- Rathje, E.M.; Saygili, G. Probabilistic assessment of earthquake-induced sliding displacements of natural slopes. Bulletin of the New Zealand Society for Earthquake Engineering, 2009, 42(1): 18-27. [CrossRef]
- Xu, G.X.; Yao, L.K.; Li, C.H.; Wang, X.F. Predictive models for permanent displacement of slopes based on recorded strong-motion data of Wenchuan earthquake. Chinese Journal of Geotechnical Engineering, 2012, 34(6): 1131-1136.
- Jin, J.L.; Wang, Y.; Gao, D.; Yuan, R.M. Yang, X.Y. New evaluation models of Newmark displacement for Southwest China. Bulletin of the Seismological Society of America, 2018, 108(4): 2221-2236.
- Yang Z, Dai D, Zhang Y, Zhang, X.M.; Liu, J. Rupture process and aftershock focal mechanisms of the 2022 M6. 8 Luding earthquake in Sichuan. Earthquake Science, 2022, 35(6): 474-484. [CrossRef]
- Zhang, P.Z. Current Tectonic Deformation, Strain Distribution and Deep Dynamic Process in the Western Sichuan of the Eastern Margin of the Tibetan Plateau. Science in China (Series D), 2008, 38(9): 1041-1056.
- Bai, M.K.; Chevalier, M.L.; Li, H.B.; Pan, J.W.; Wu, Q.; Wang, S.G.; Liu, F.C.; Jiao, L.Q.; Zhang, J.J.; Zhang, L.; et al. Late Quaternary slip rate and earthquake hazard along the Qianning segment, Xianshuihe fault. Acta Geol Sin, 2022, 96(7): 2312-2332.
- Wang, X.Y.; Wang, D.W. Relationships between the Wenchuan earthquake-induced landslide and peak ground velocity, Sichuan, China. Geological Bulletin of China, 2011, 30(1): 159-165.
- Xie, J.J.; Wen, Z.P.; Gao, M.T.; Hu, J.X.; He, S.L. Characteristics of near-fault vertical and horizontal ground motion from the 2008 Wenchuan earthquake. Chinese Journal of Geophysics, 2010, 53(4): 555-565. [CrossRef]
- Wang, X.Y.; Nie, G.Z.; Ma, M.J. Evaluation model of landslide hazards induced by the 2008 Wenchuan earthquake using strong motion data. Earthquake Science, 2011, 24: 311-319. [CrossRef]
- Zou, Y.; Qi, S.W.; Guo, S.F.; Zheng, B.W.; Zhan, Z.F.; He, N.W.; Huang, X.L.; Hou, X.K.; Liu, H.Y. Factors controlling the spatial distribution of coseismic landslides triggered by the Mw 6.1 Ludian earthquake in China. Engineering Geology, 2022, 296: 106477. [CrossRef]
- Qi, S.W.; Xu, Q. Lan, H.X.; Zhang, B.; Liu, J.Y. Spatial distribution analysis of landslides triggered by 2008.5. 12 Wenchuan Earthquake, China. Engineering geology, 2010, 116(1-2): 95-108. [CrossRef]
Figure 1.
Map of the study area showing the inventoried landslides.
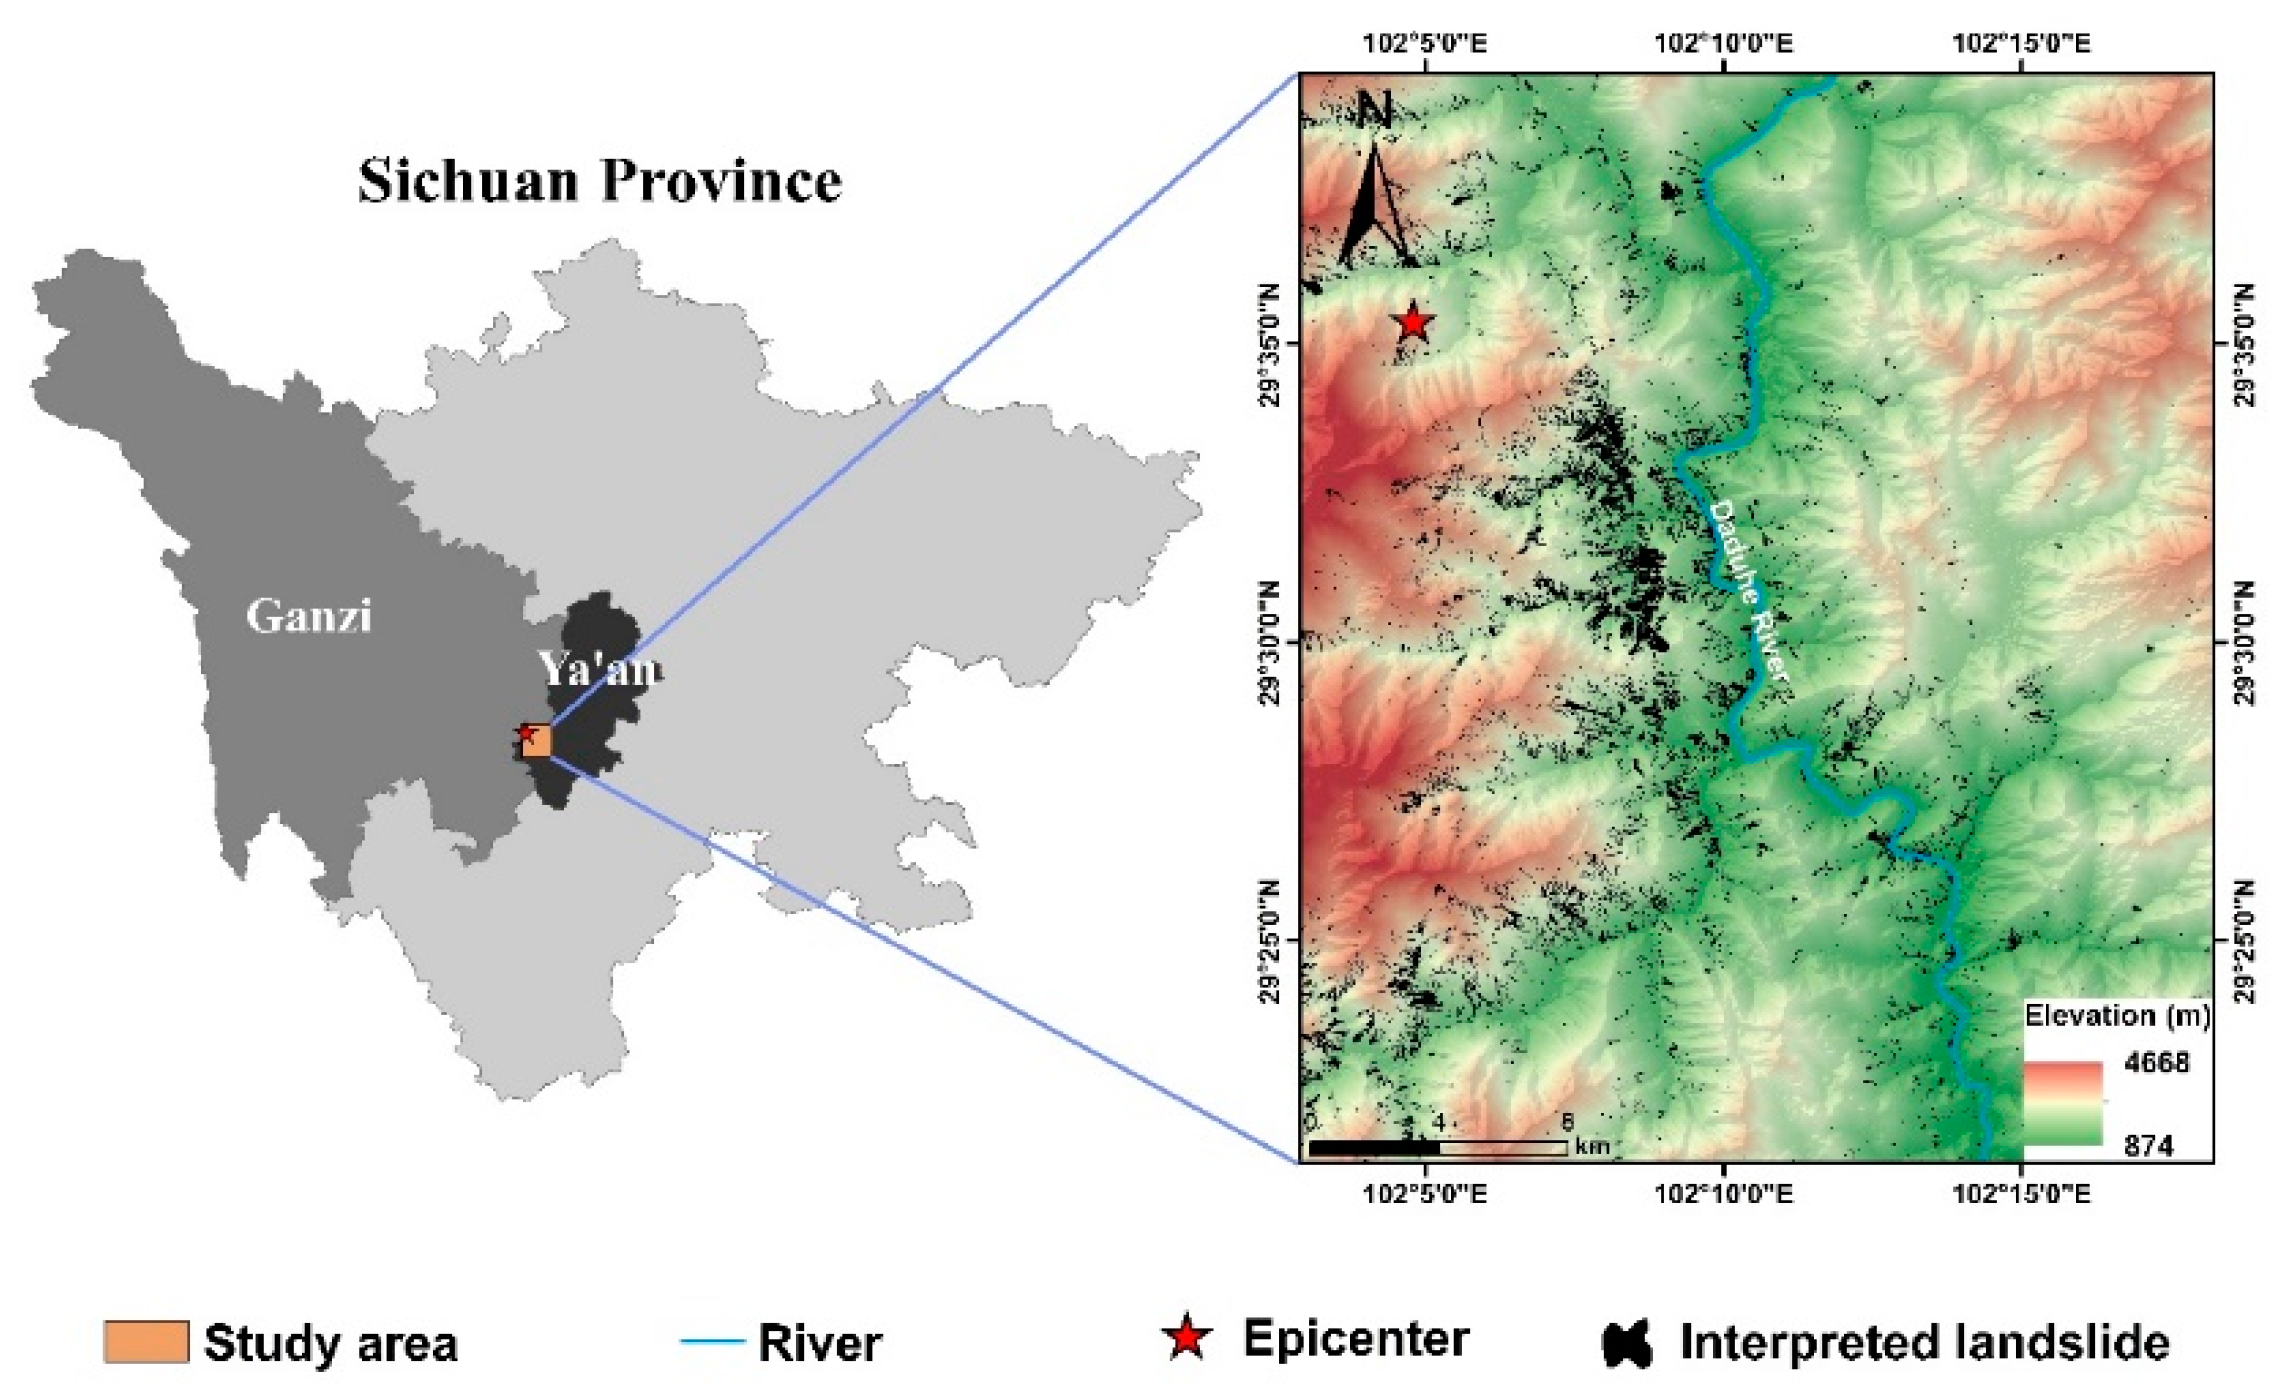
Figure 2.
Geological map of the study area showing lithology and faults.
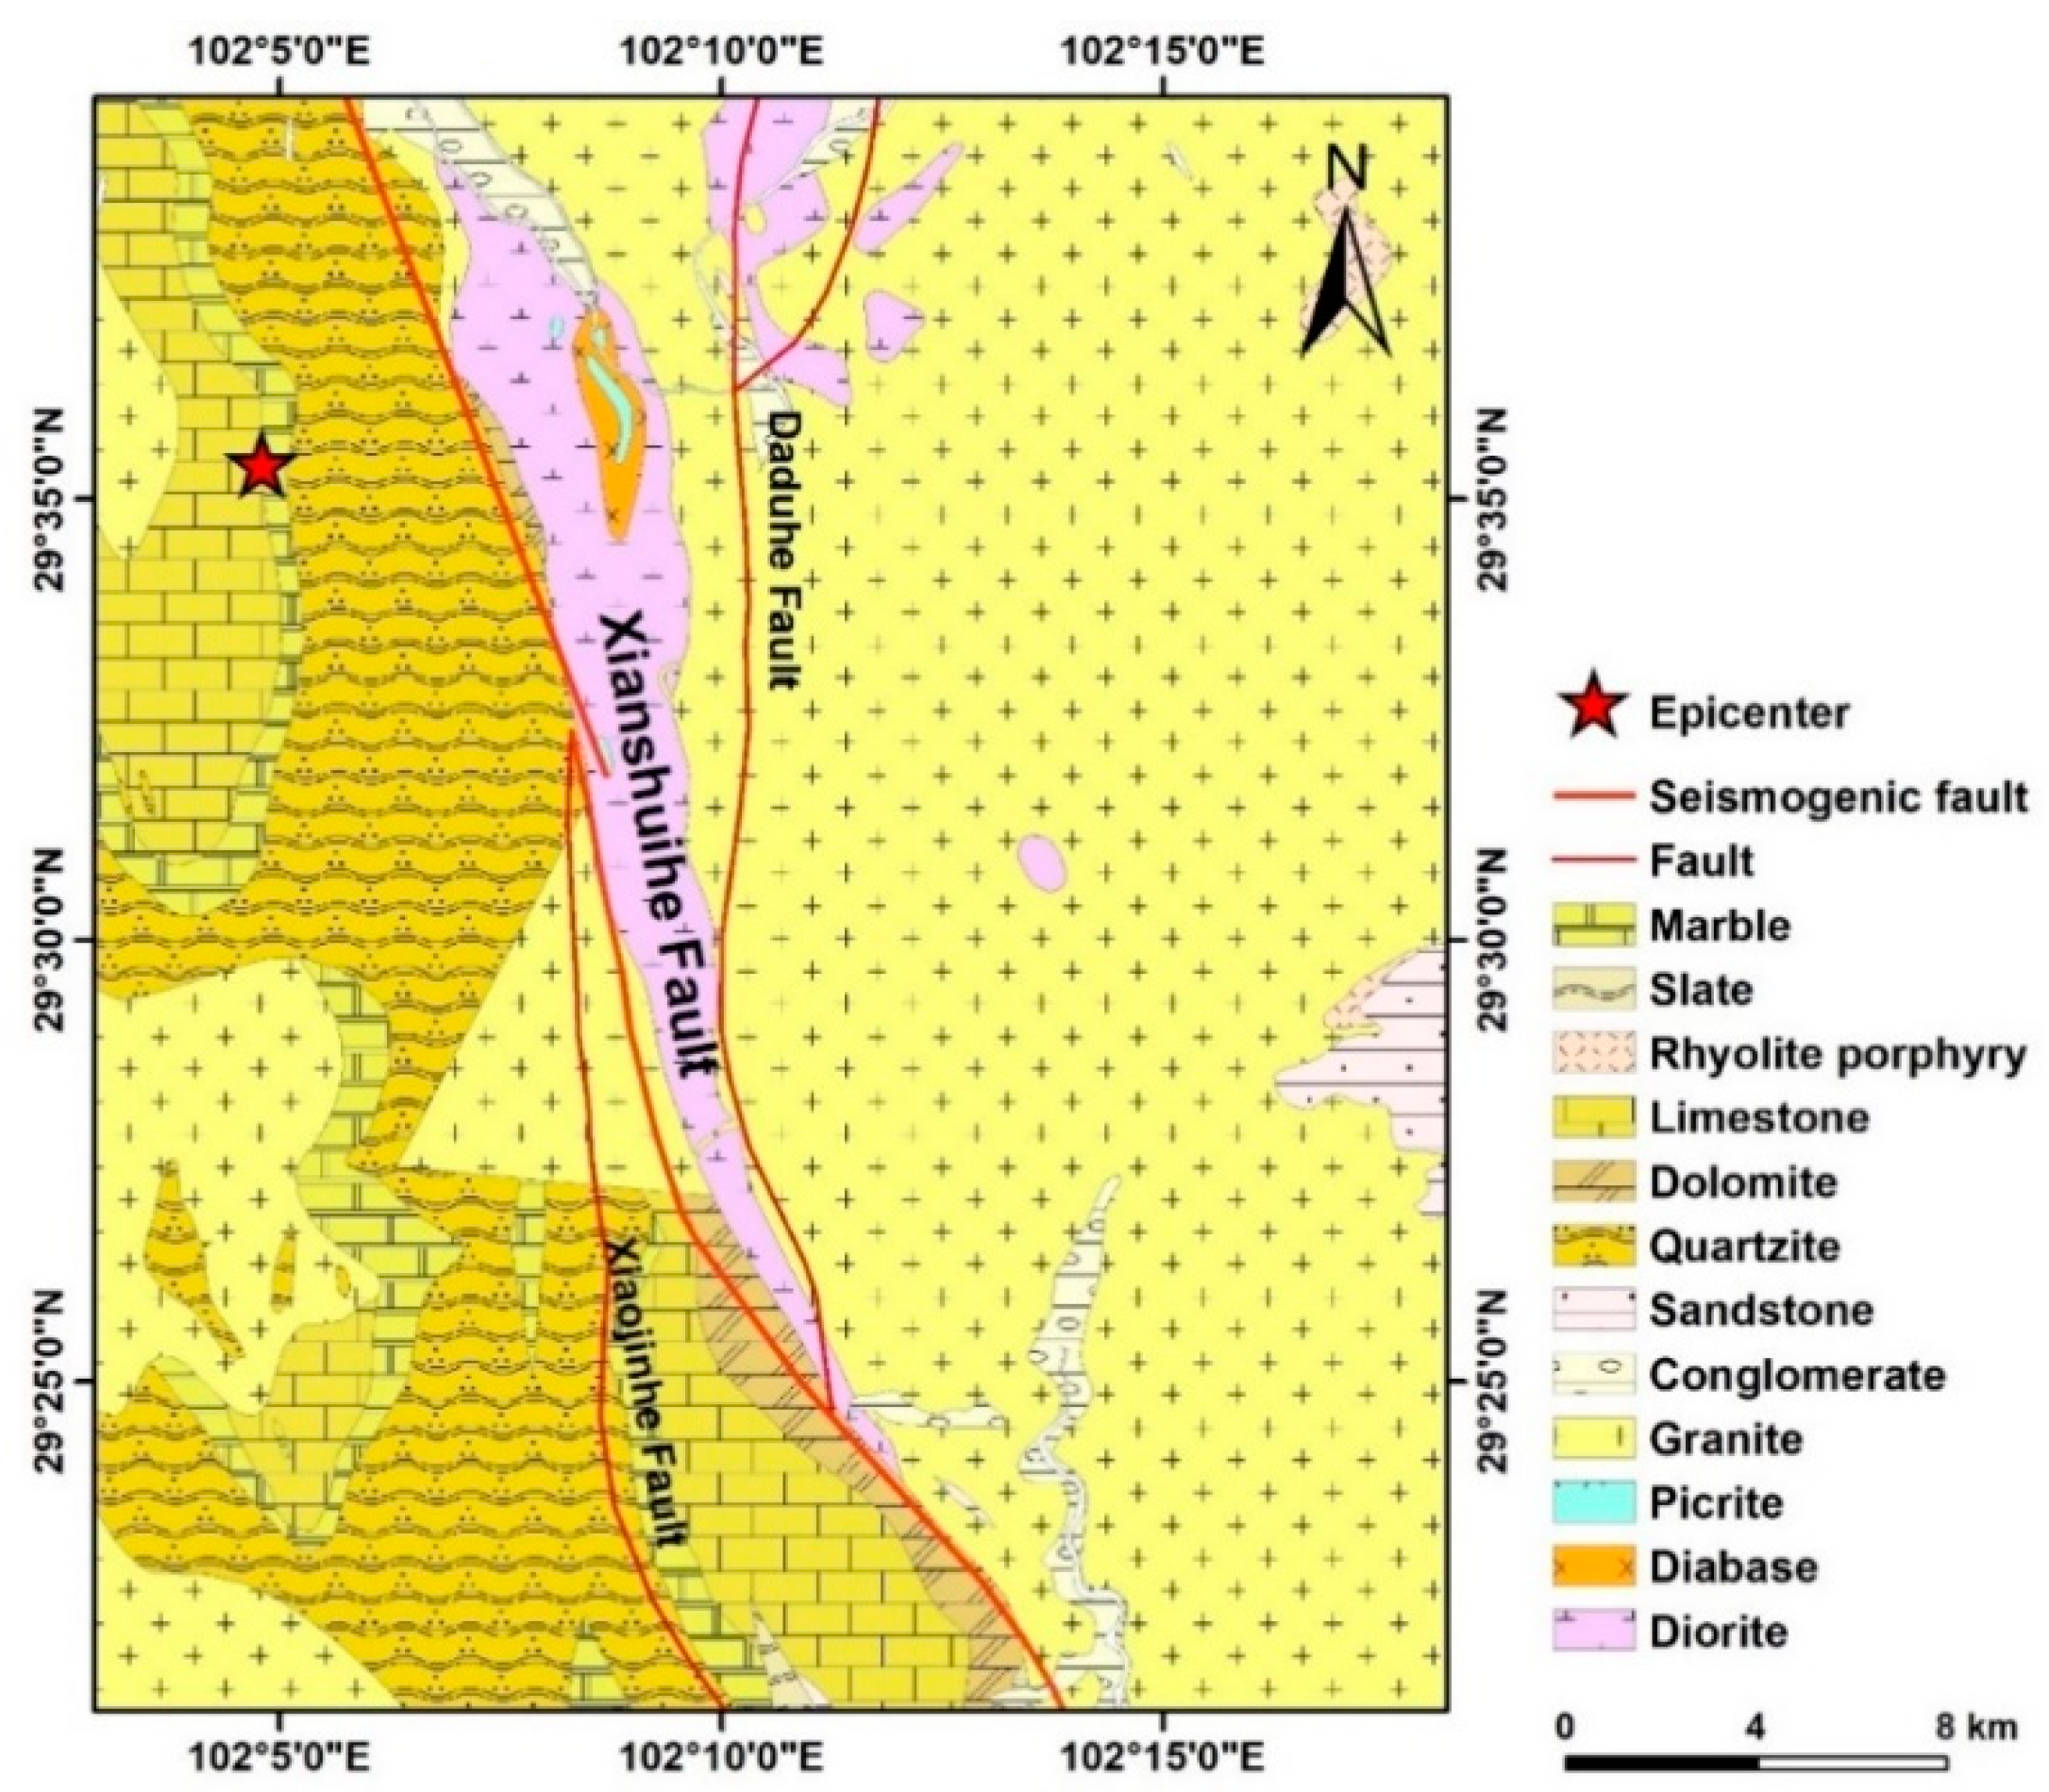
Figure 3.
Sliding-block model used for the Newmark analysis [22].
Figure 3.
Sliding-block model used for the Newmark analysis [22].
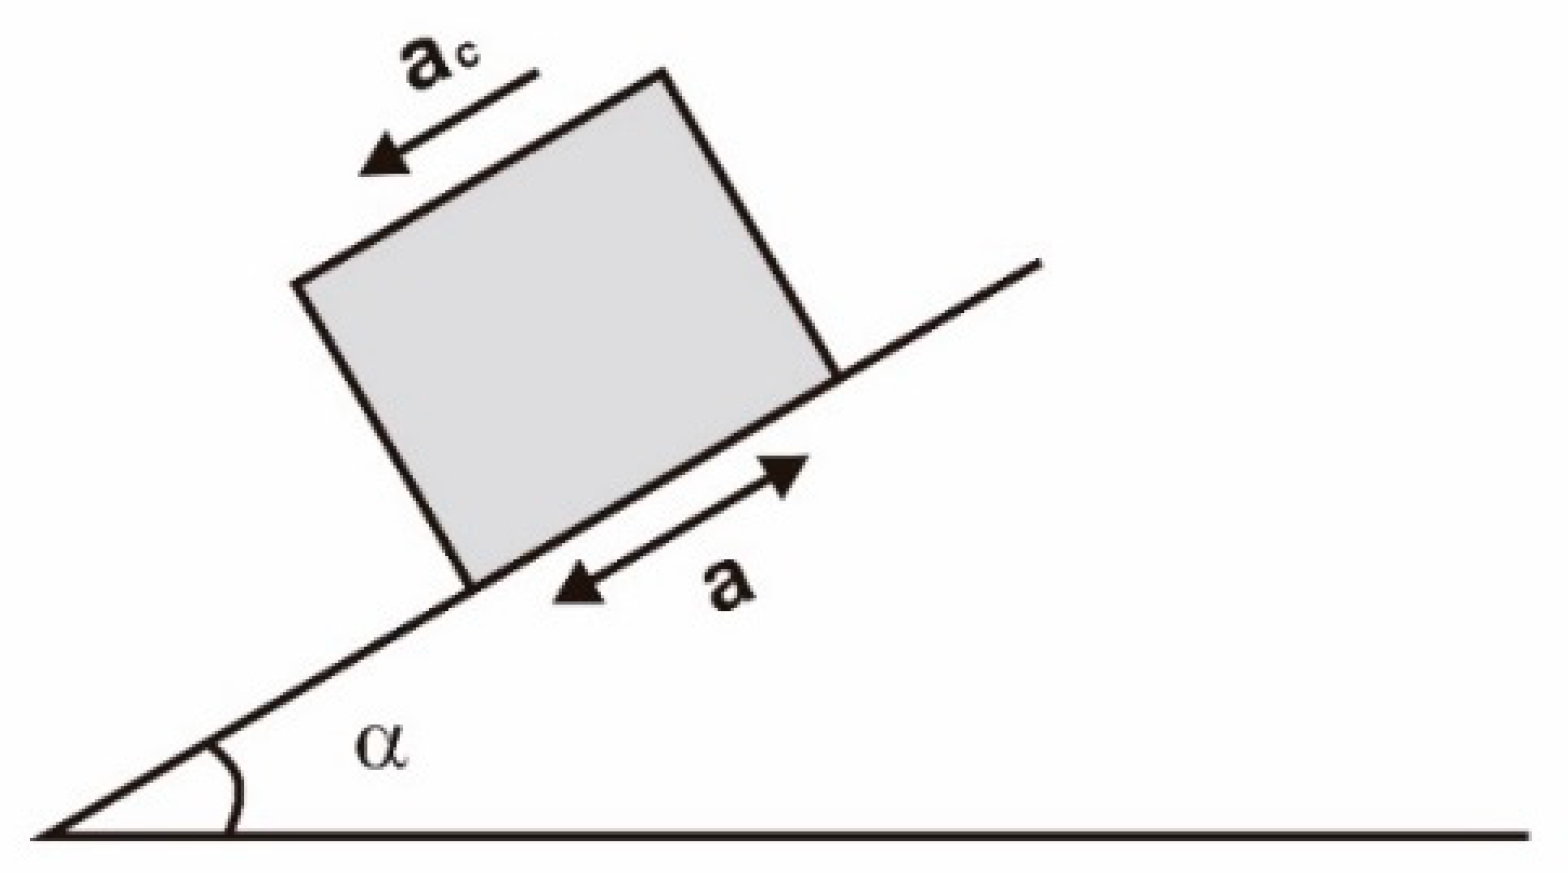
Figure 4.
Demonstration of the Newmark-analysis algorithm [22].
Figure 4.
Demonstration of the Newmark-analysis algorithm [22].
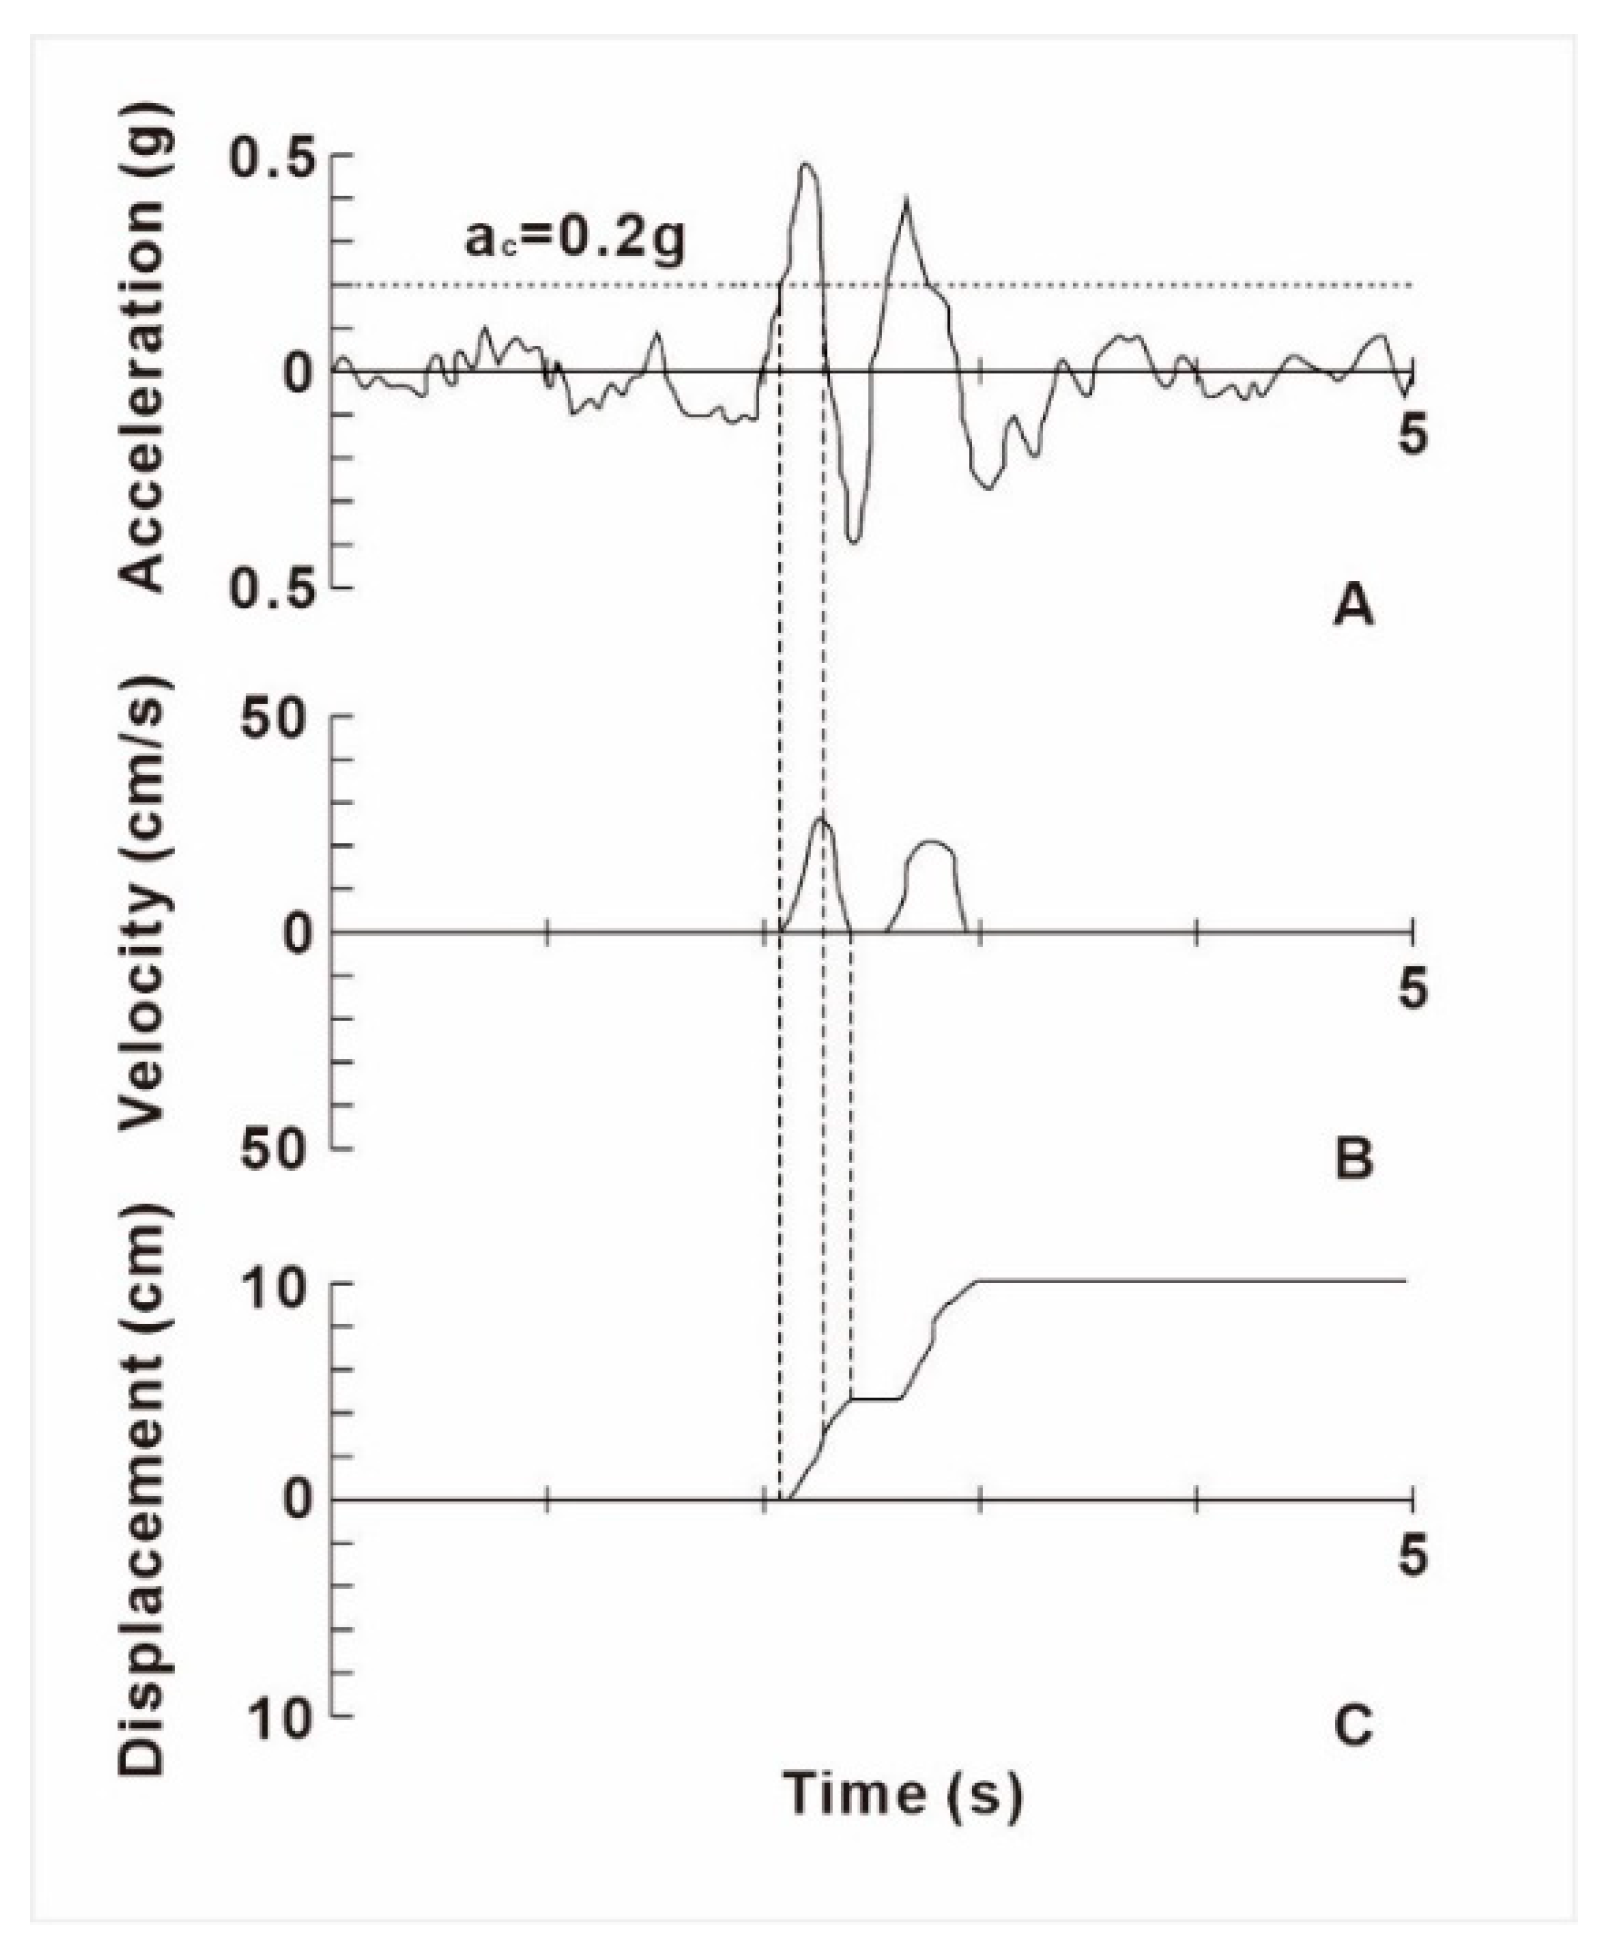
Figure 5.
Slope map derived from the DEM of the study area.
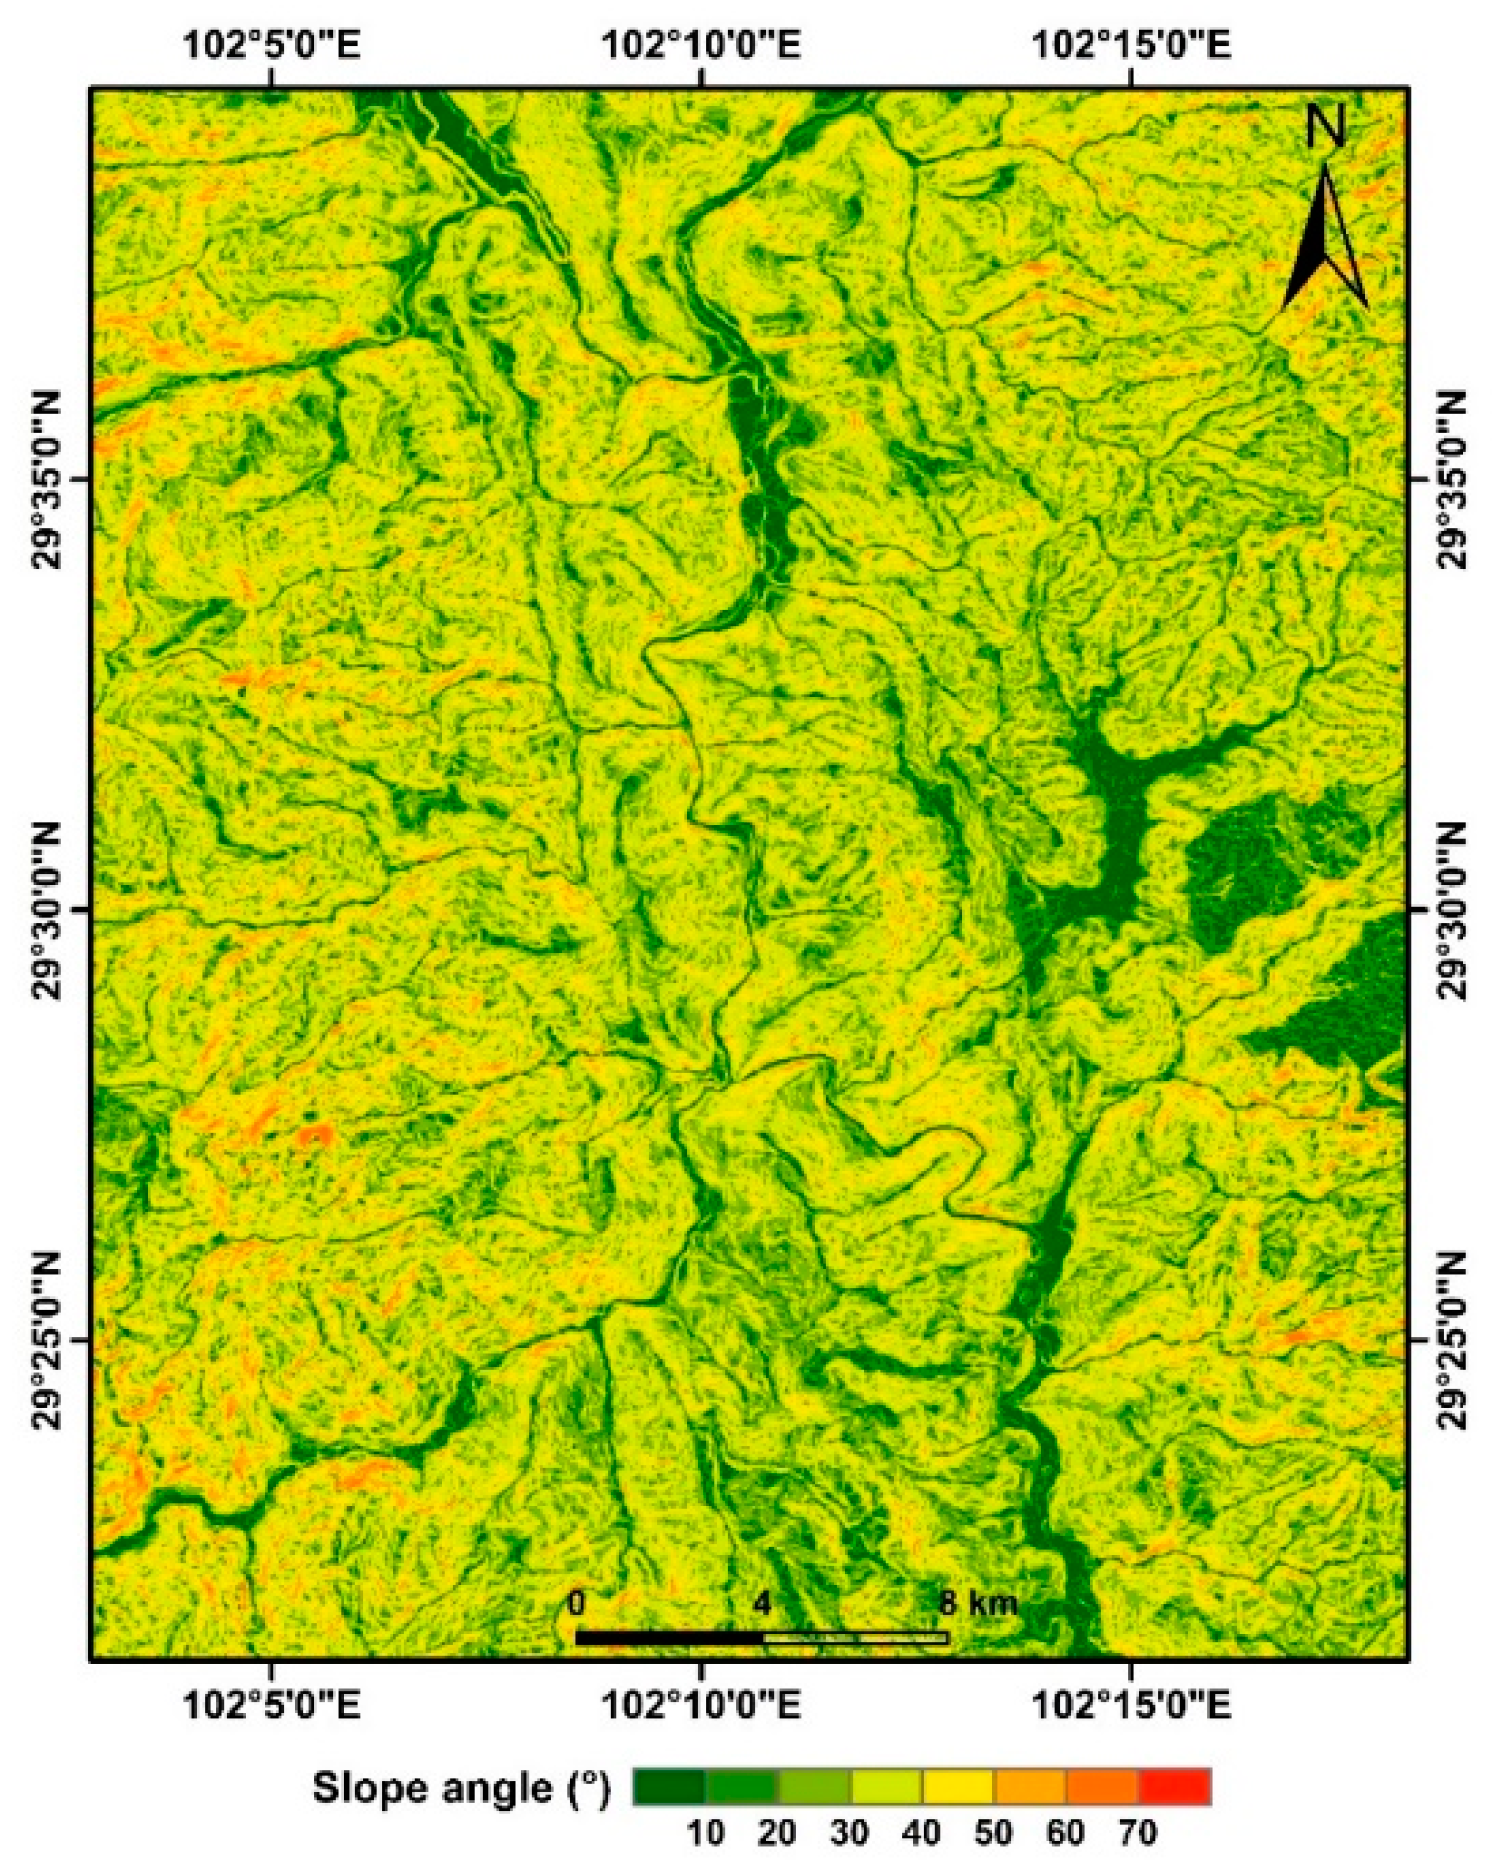
Figure 6.
Static factor-of-safety map of the study area.
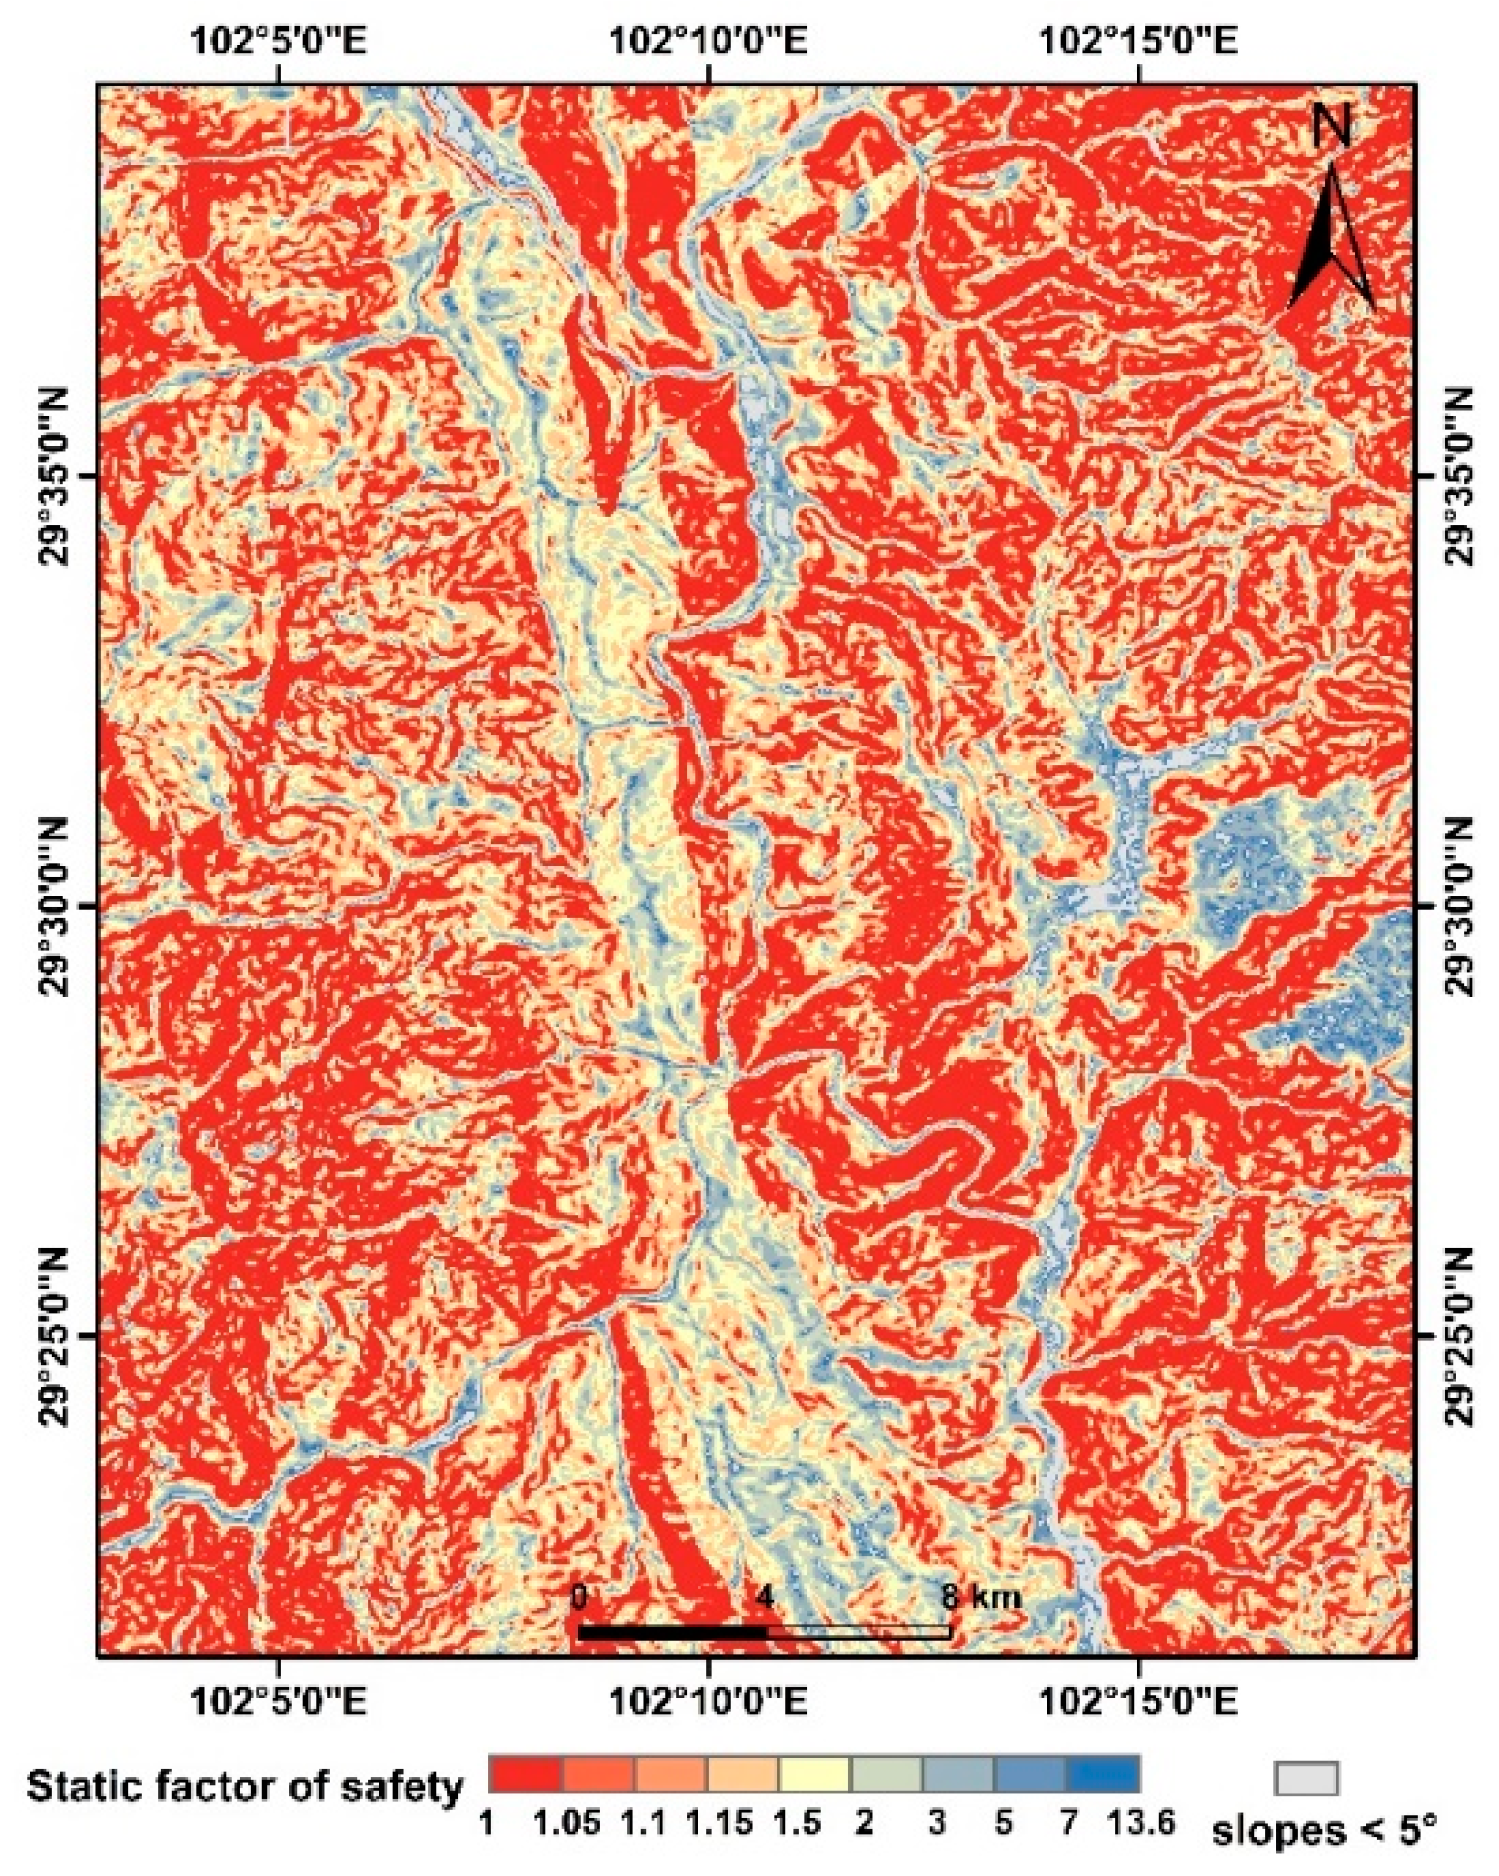
Figure 7.
Map showing in the study area.
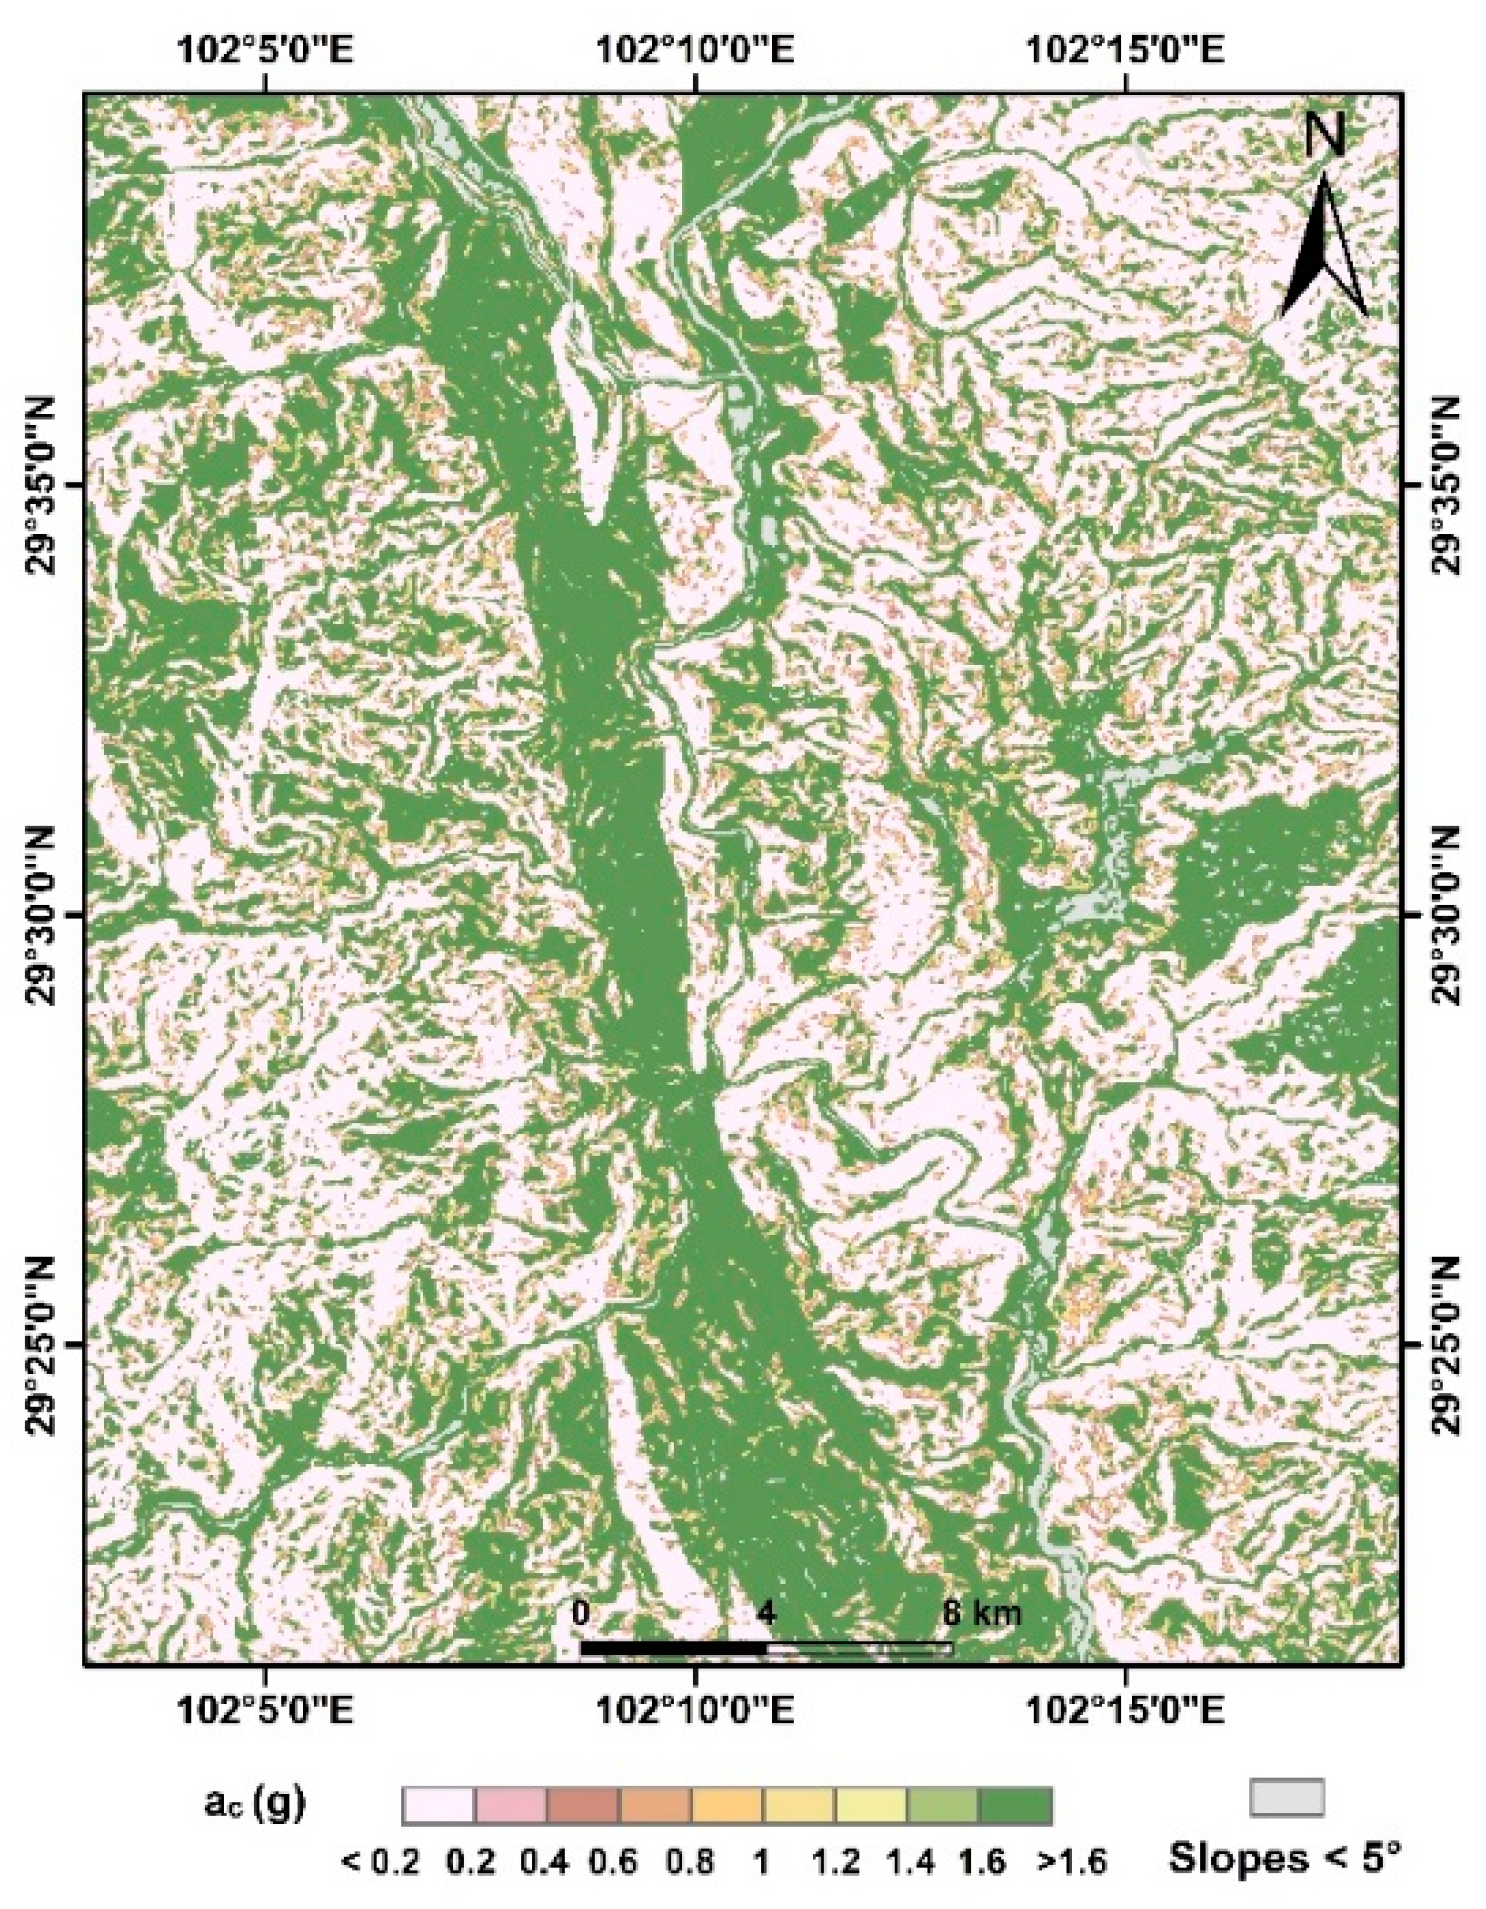
Figure 8.
Contour map of seismic motion produced by the Luding earthquake. (a) PGA and (b) PGV.
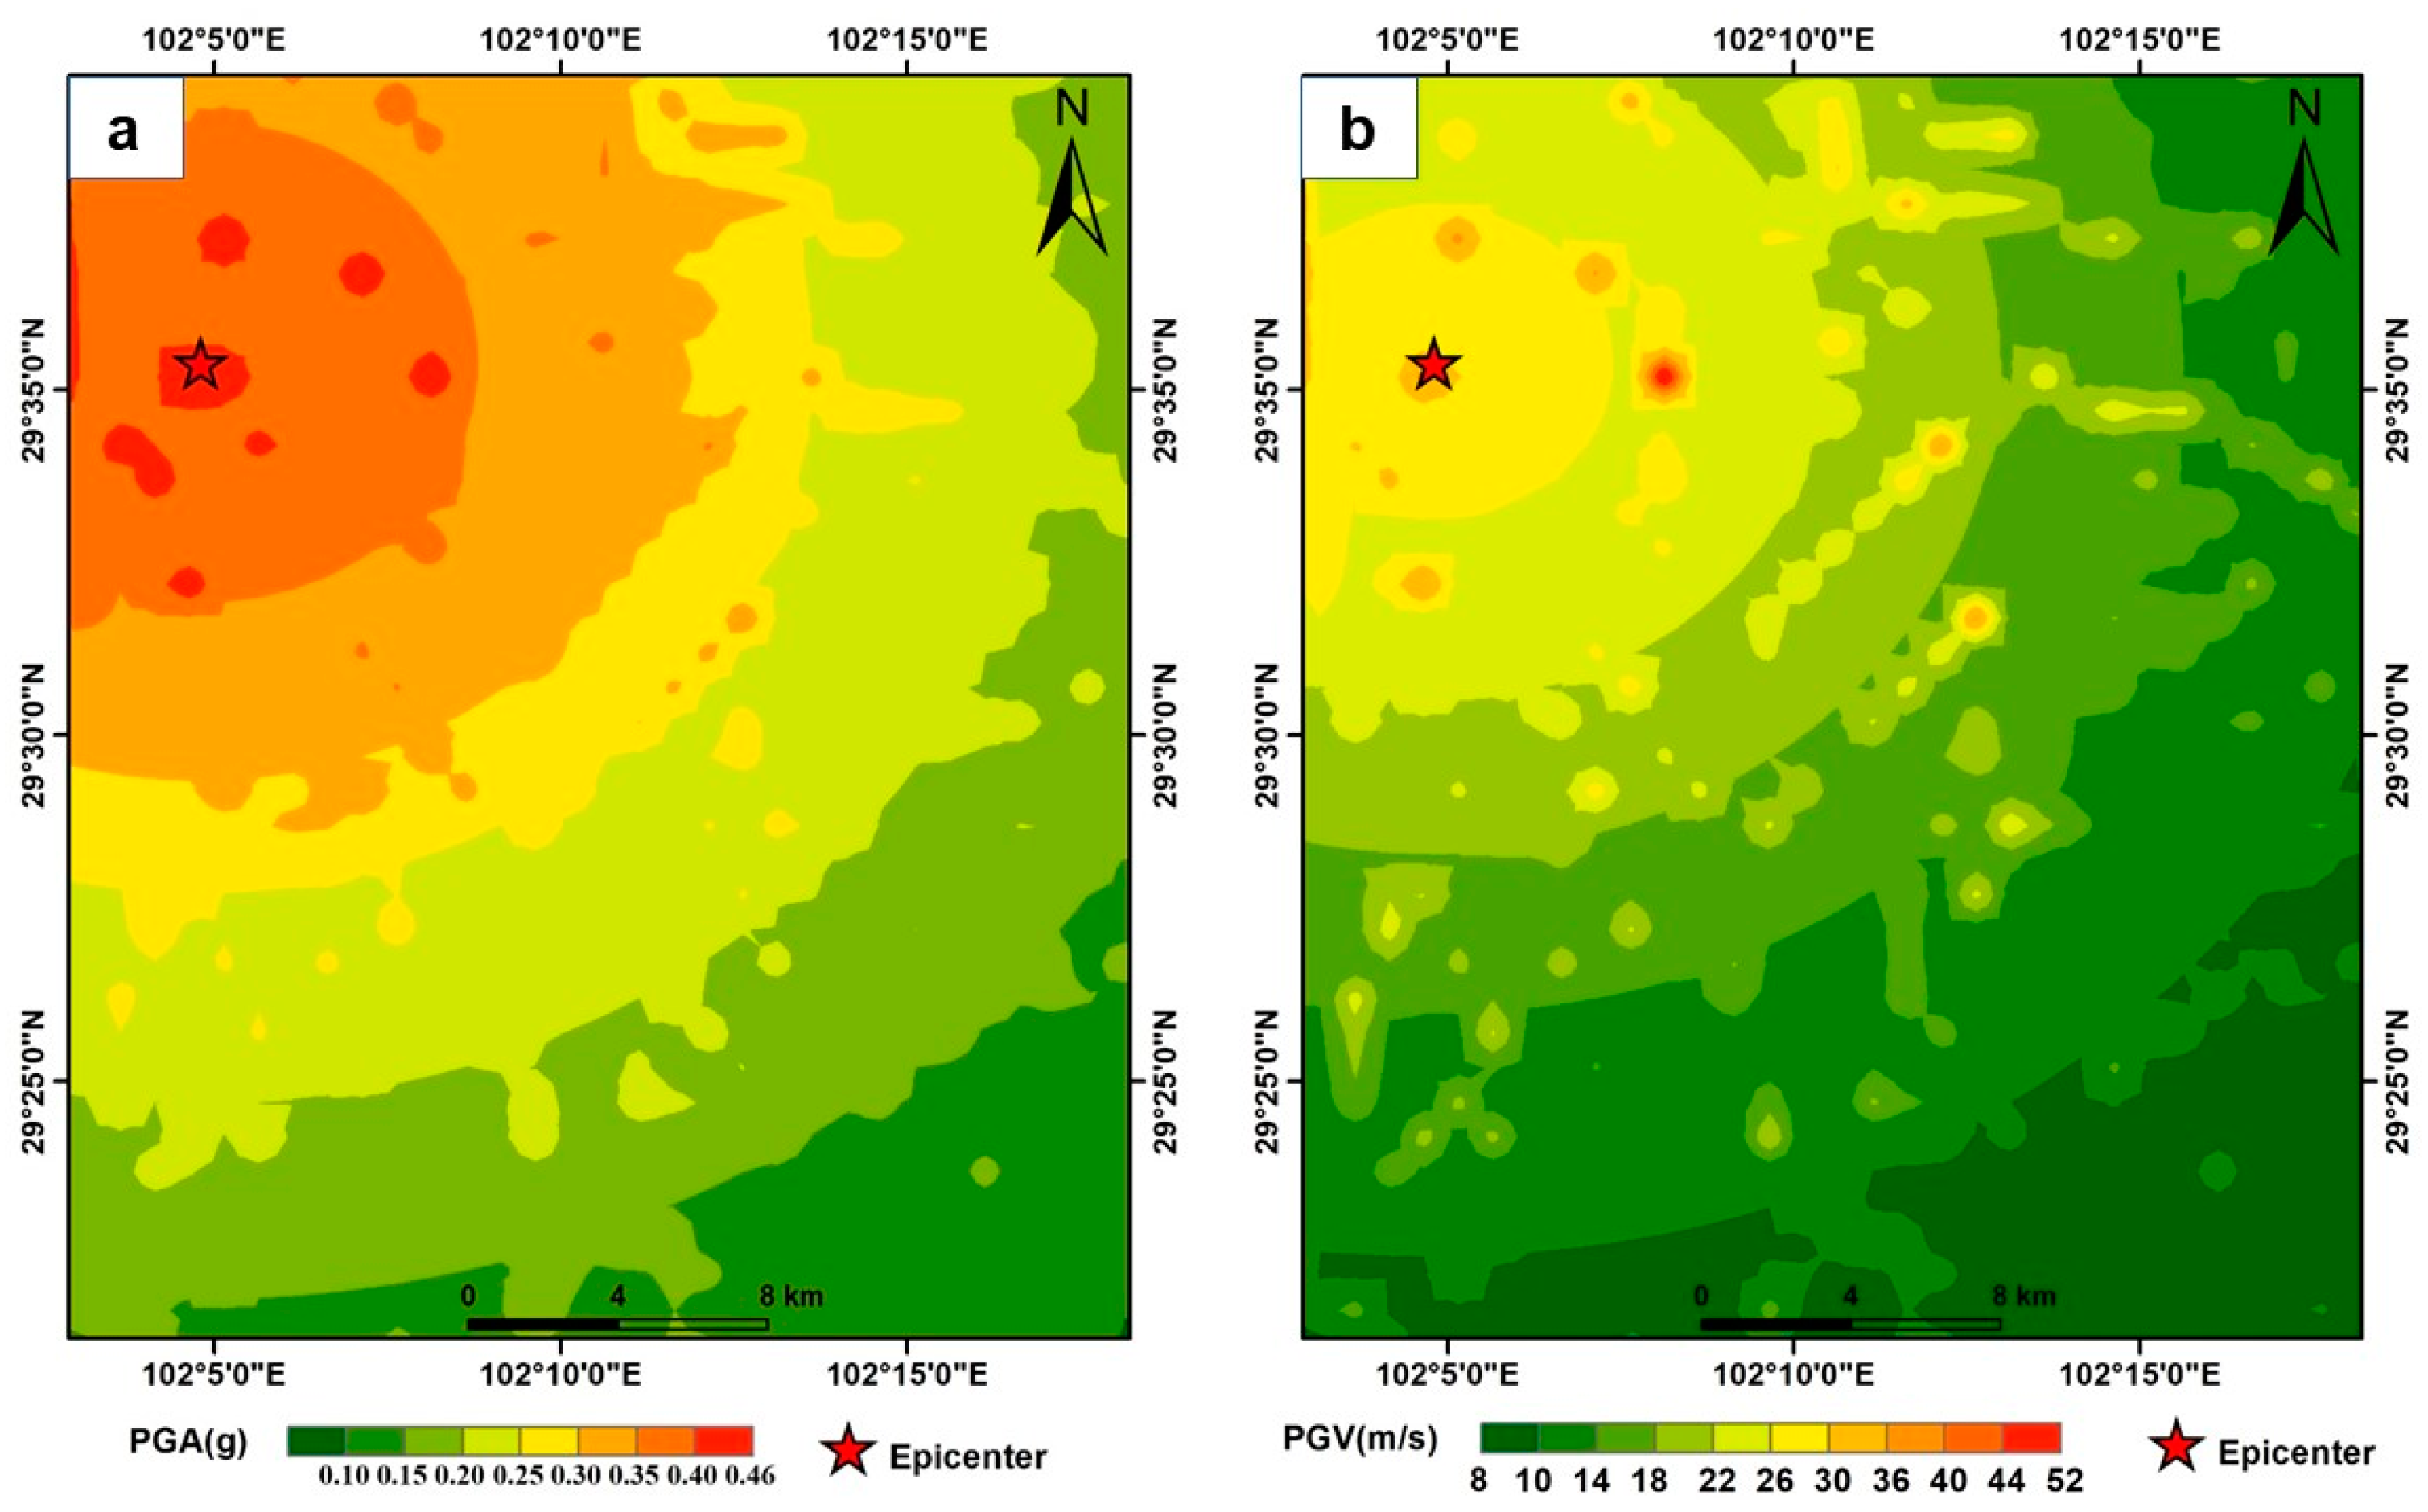
Figure 9.
Contour map of produced by the Luding earthquake in the study area.
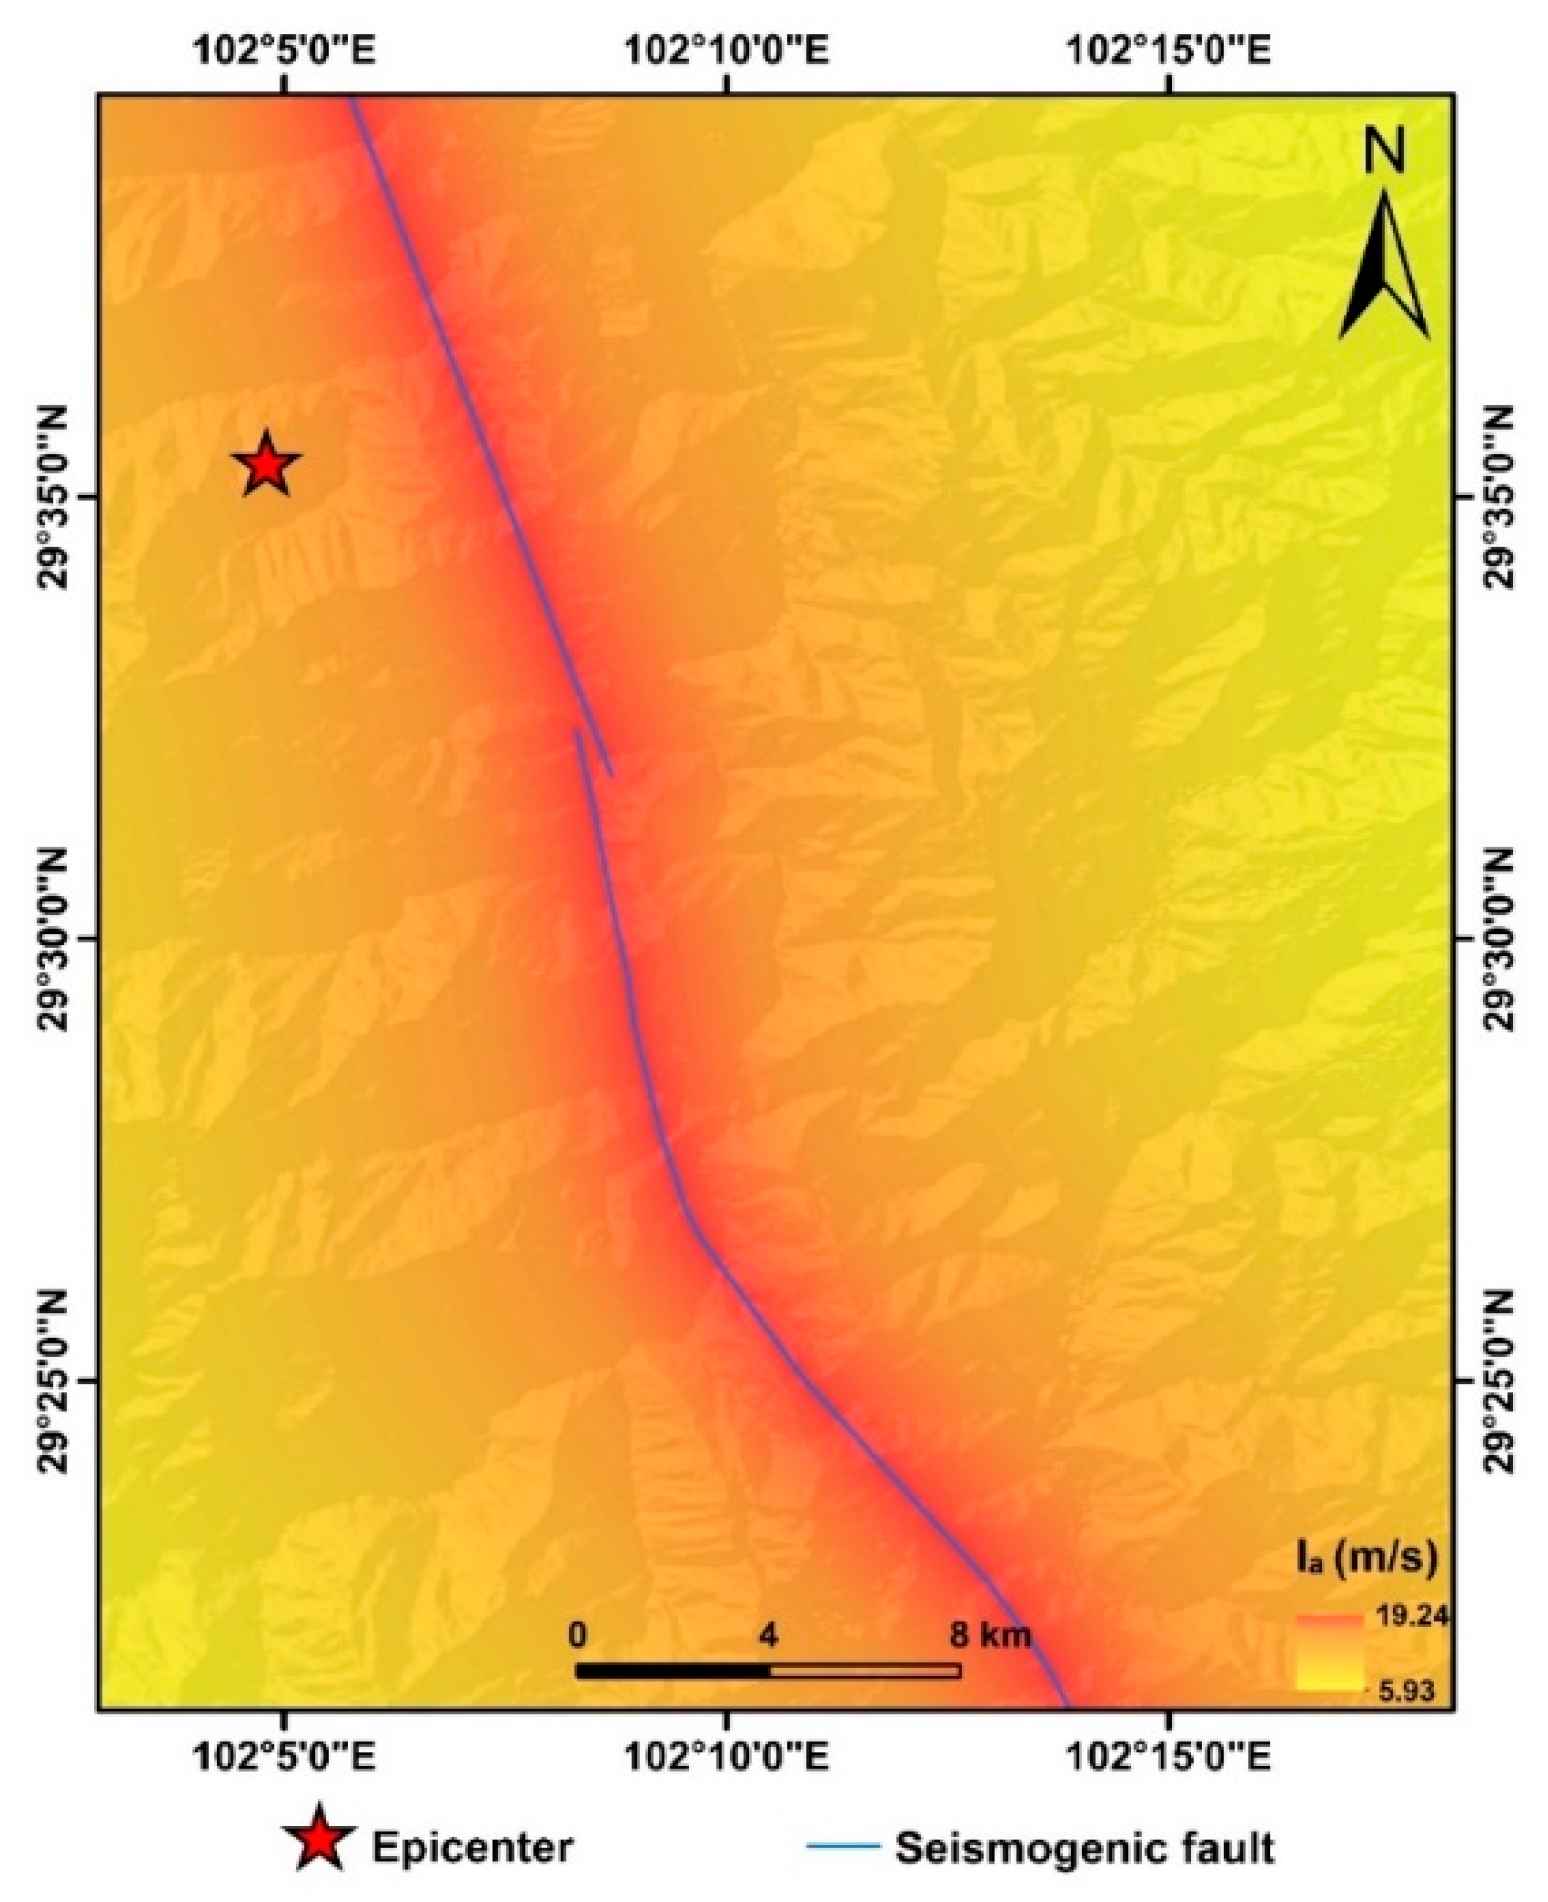
Figure 10.
Comparison of area under the ROC curve for six different displacement formulas.
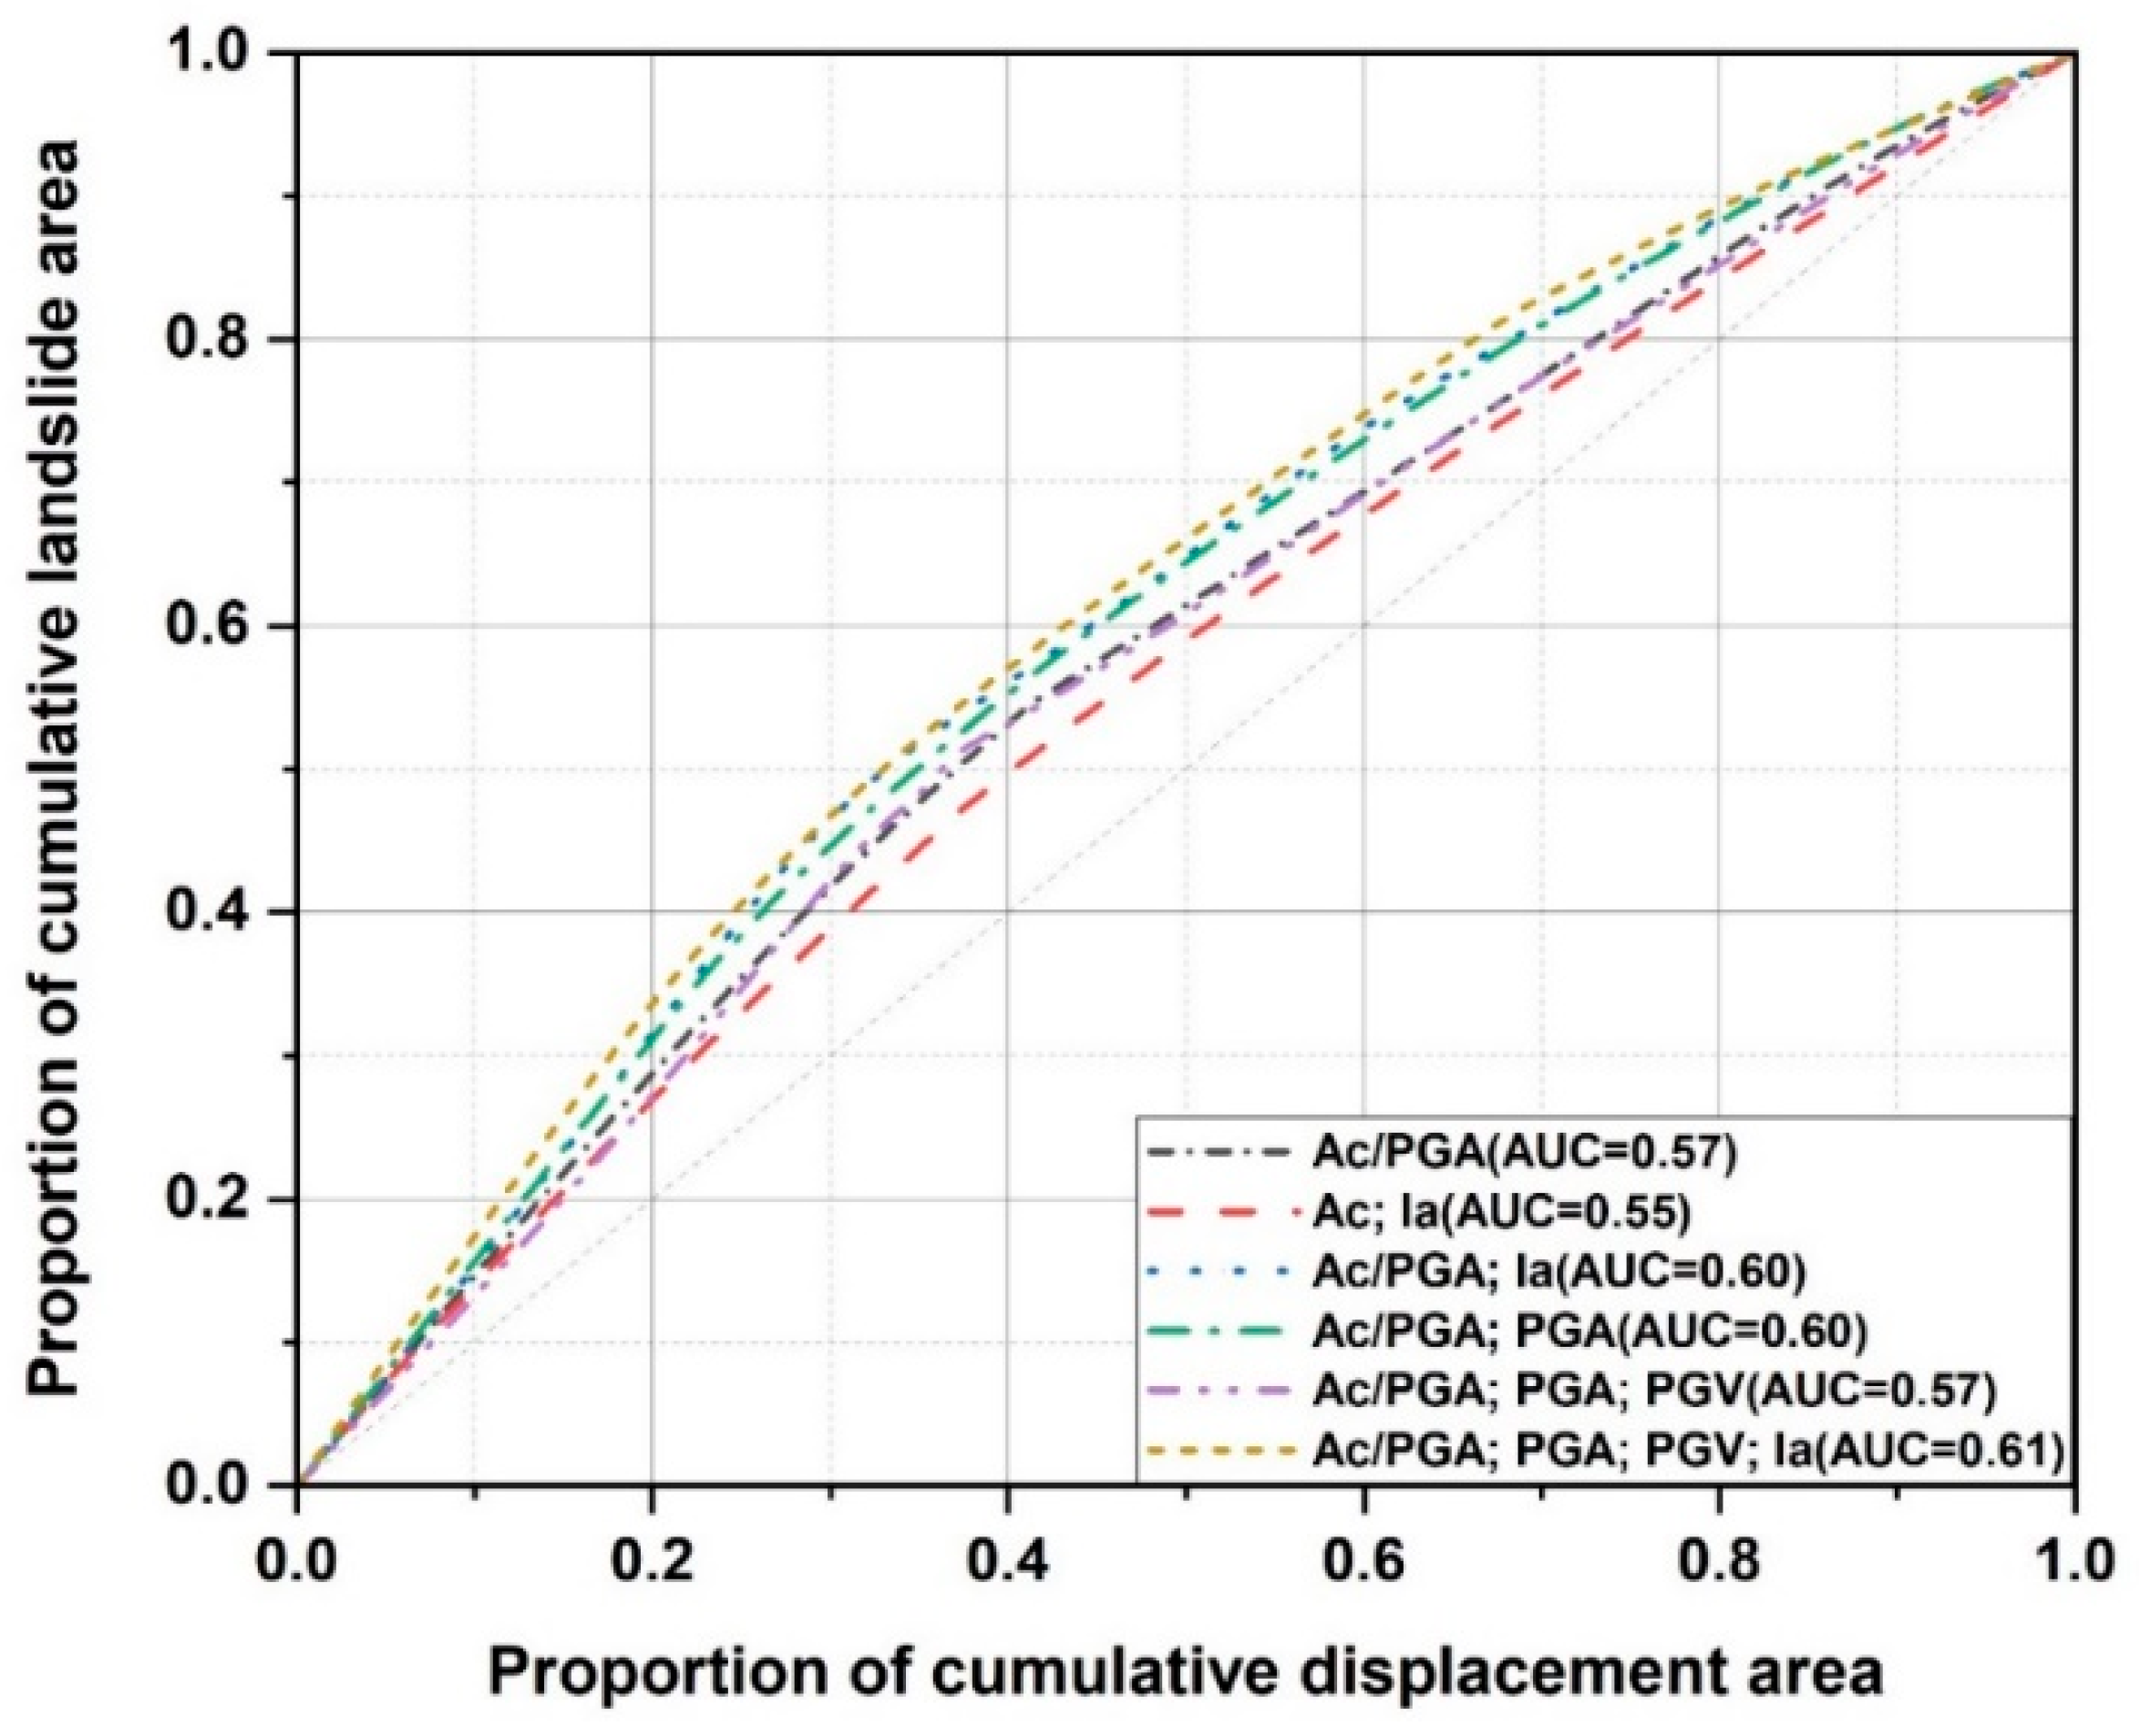
Figure 11.
Map showing predicted displacements in the study area.
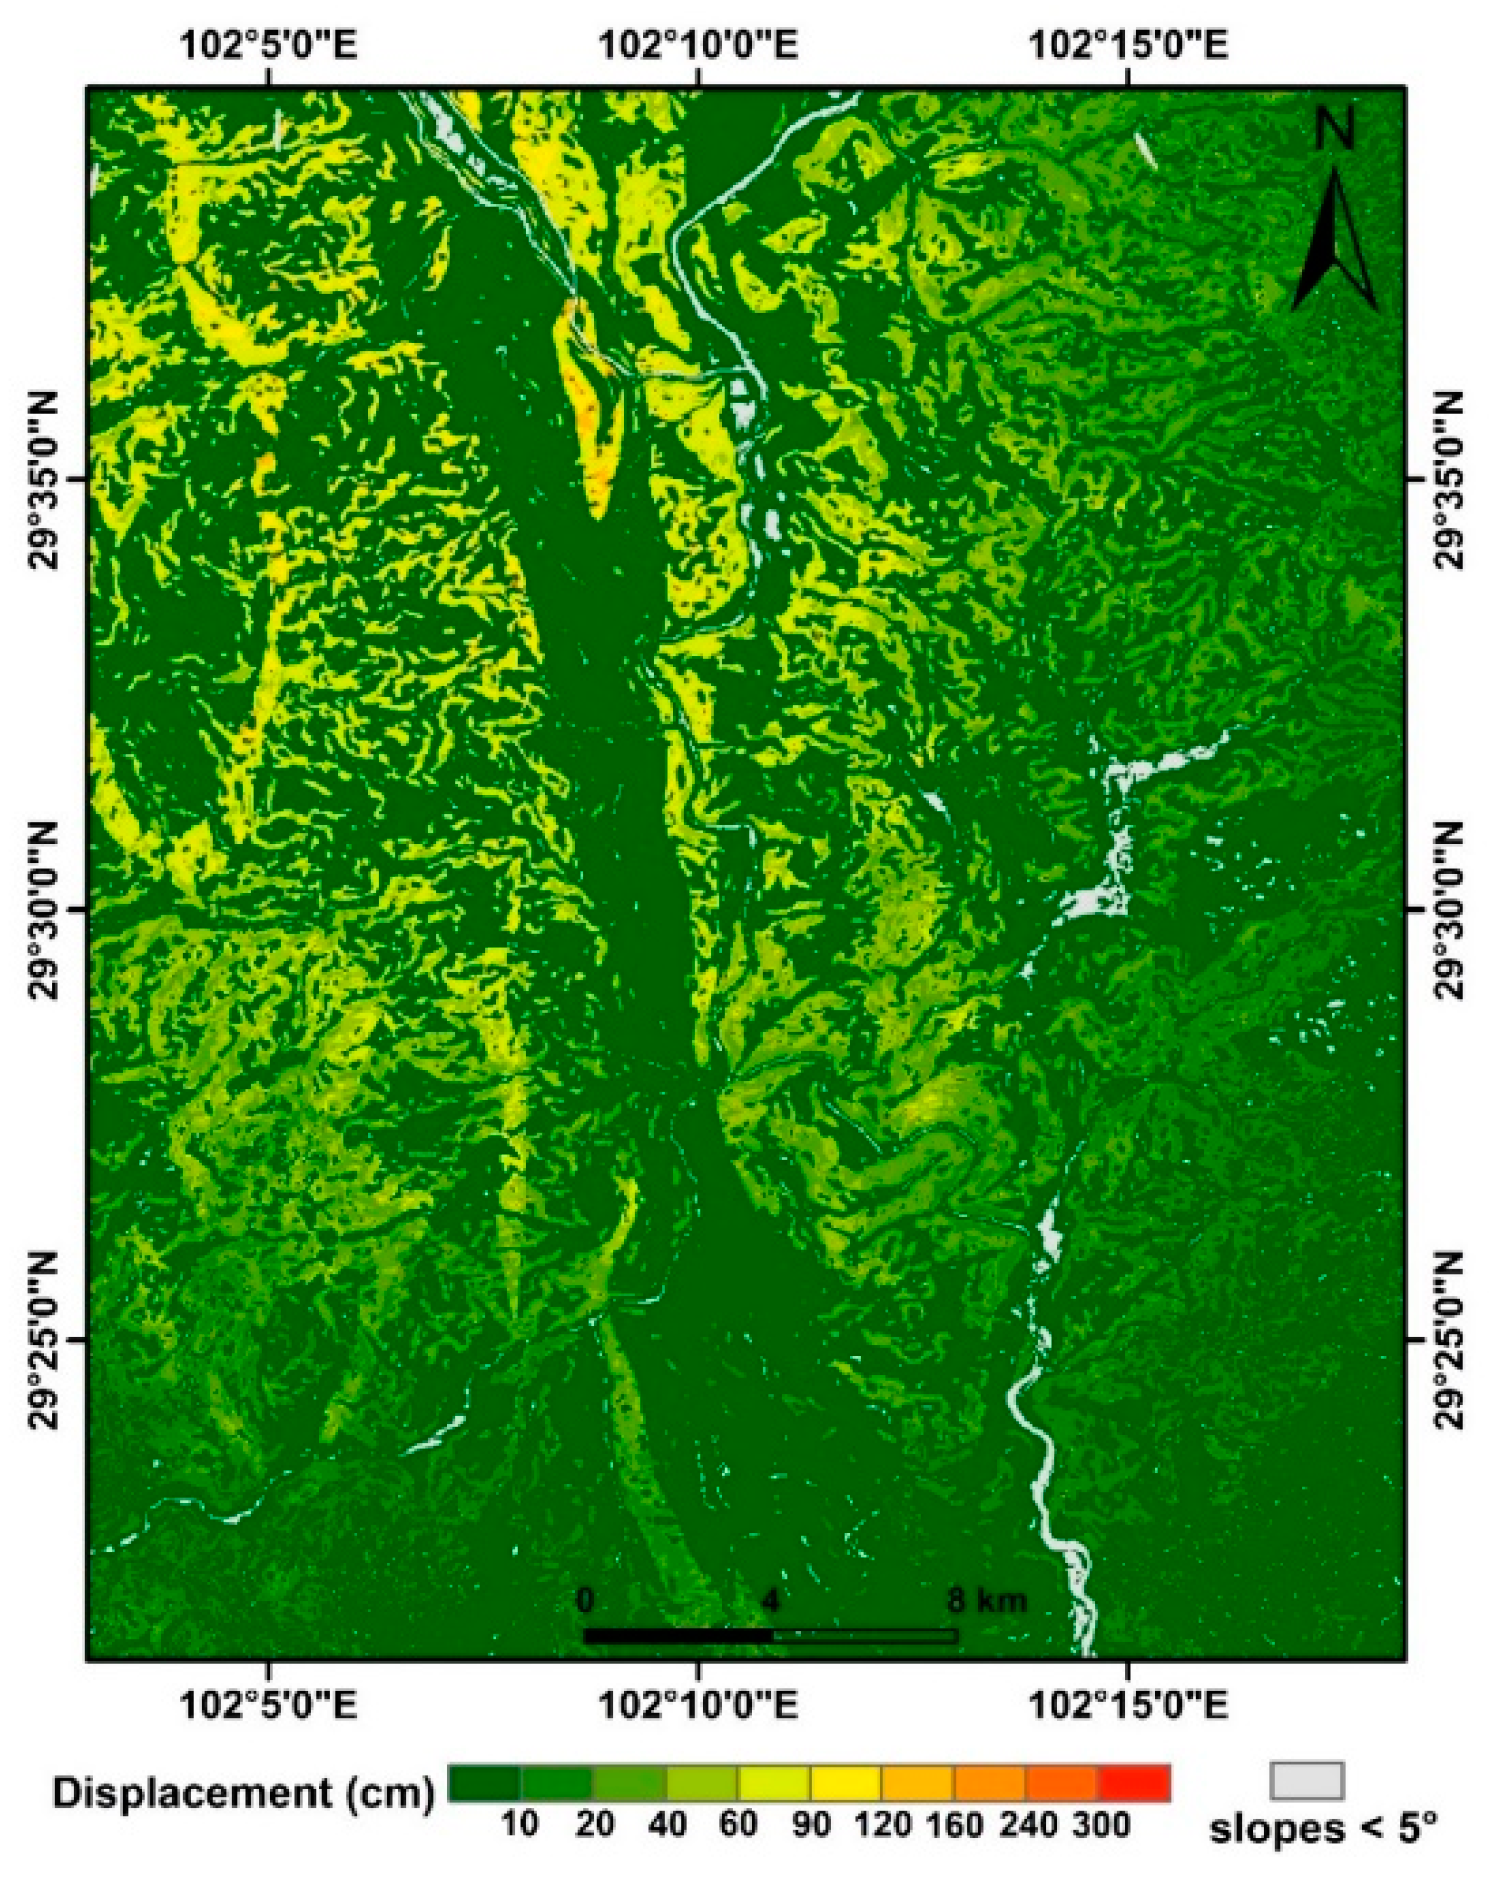
Figure 12.
Proportion of landslide cells as a function of Newmark displacement. Each dot represents the proportion of a Newmark displacement bin; the red line is the fitting curve of the data using a modified Weibull function.
Figure 12.
Proportion of landslide cells as a function of Newmark displacement. Each dot represents the proportion of a Newmark displacement bin; the red line is the fitting curve of the data using a modified Weibull function.
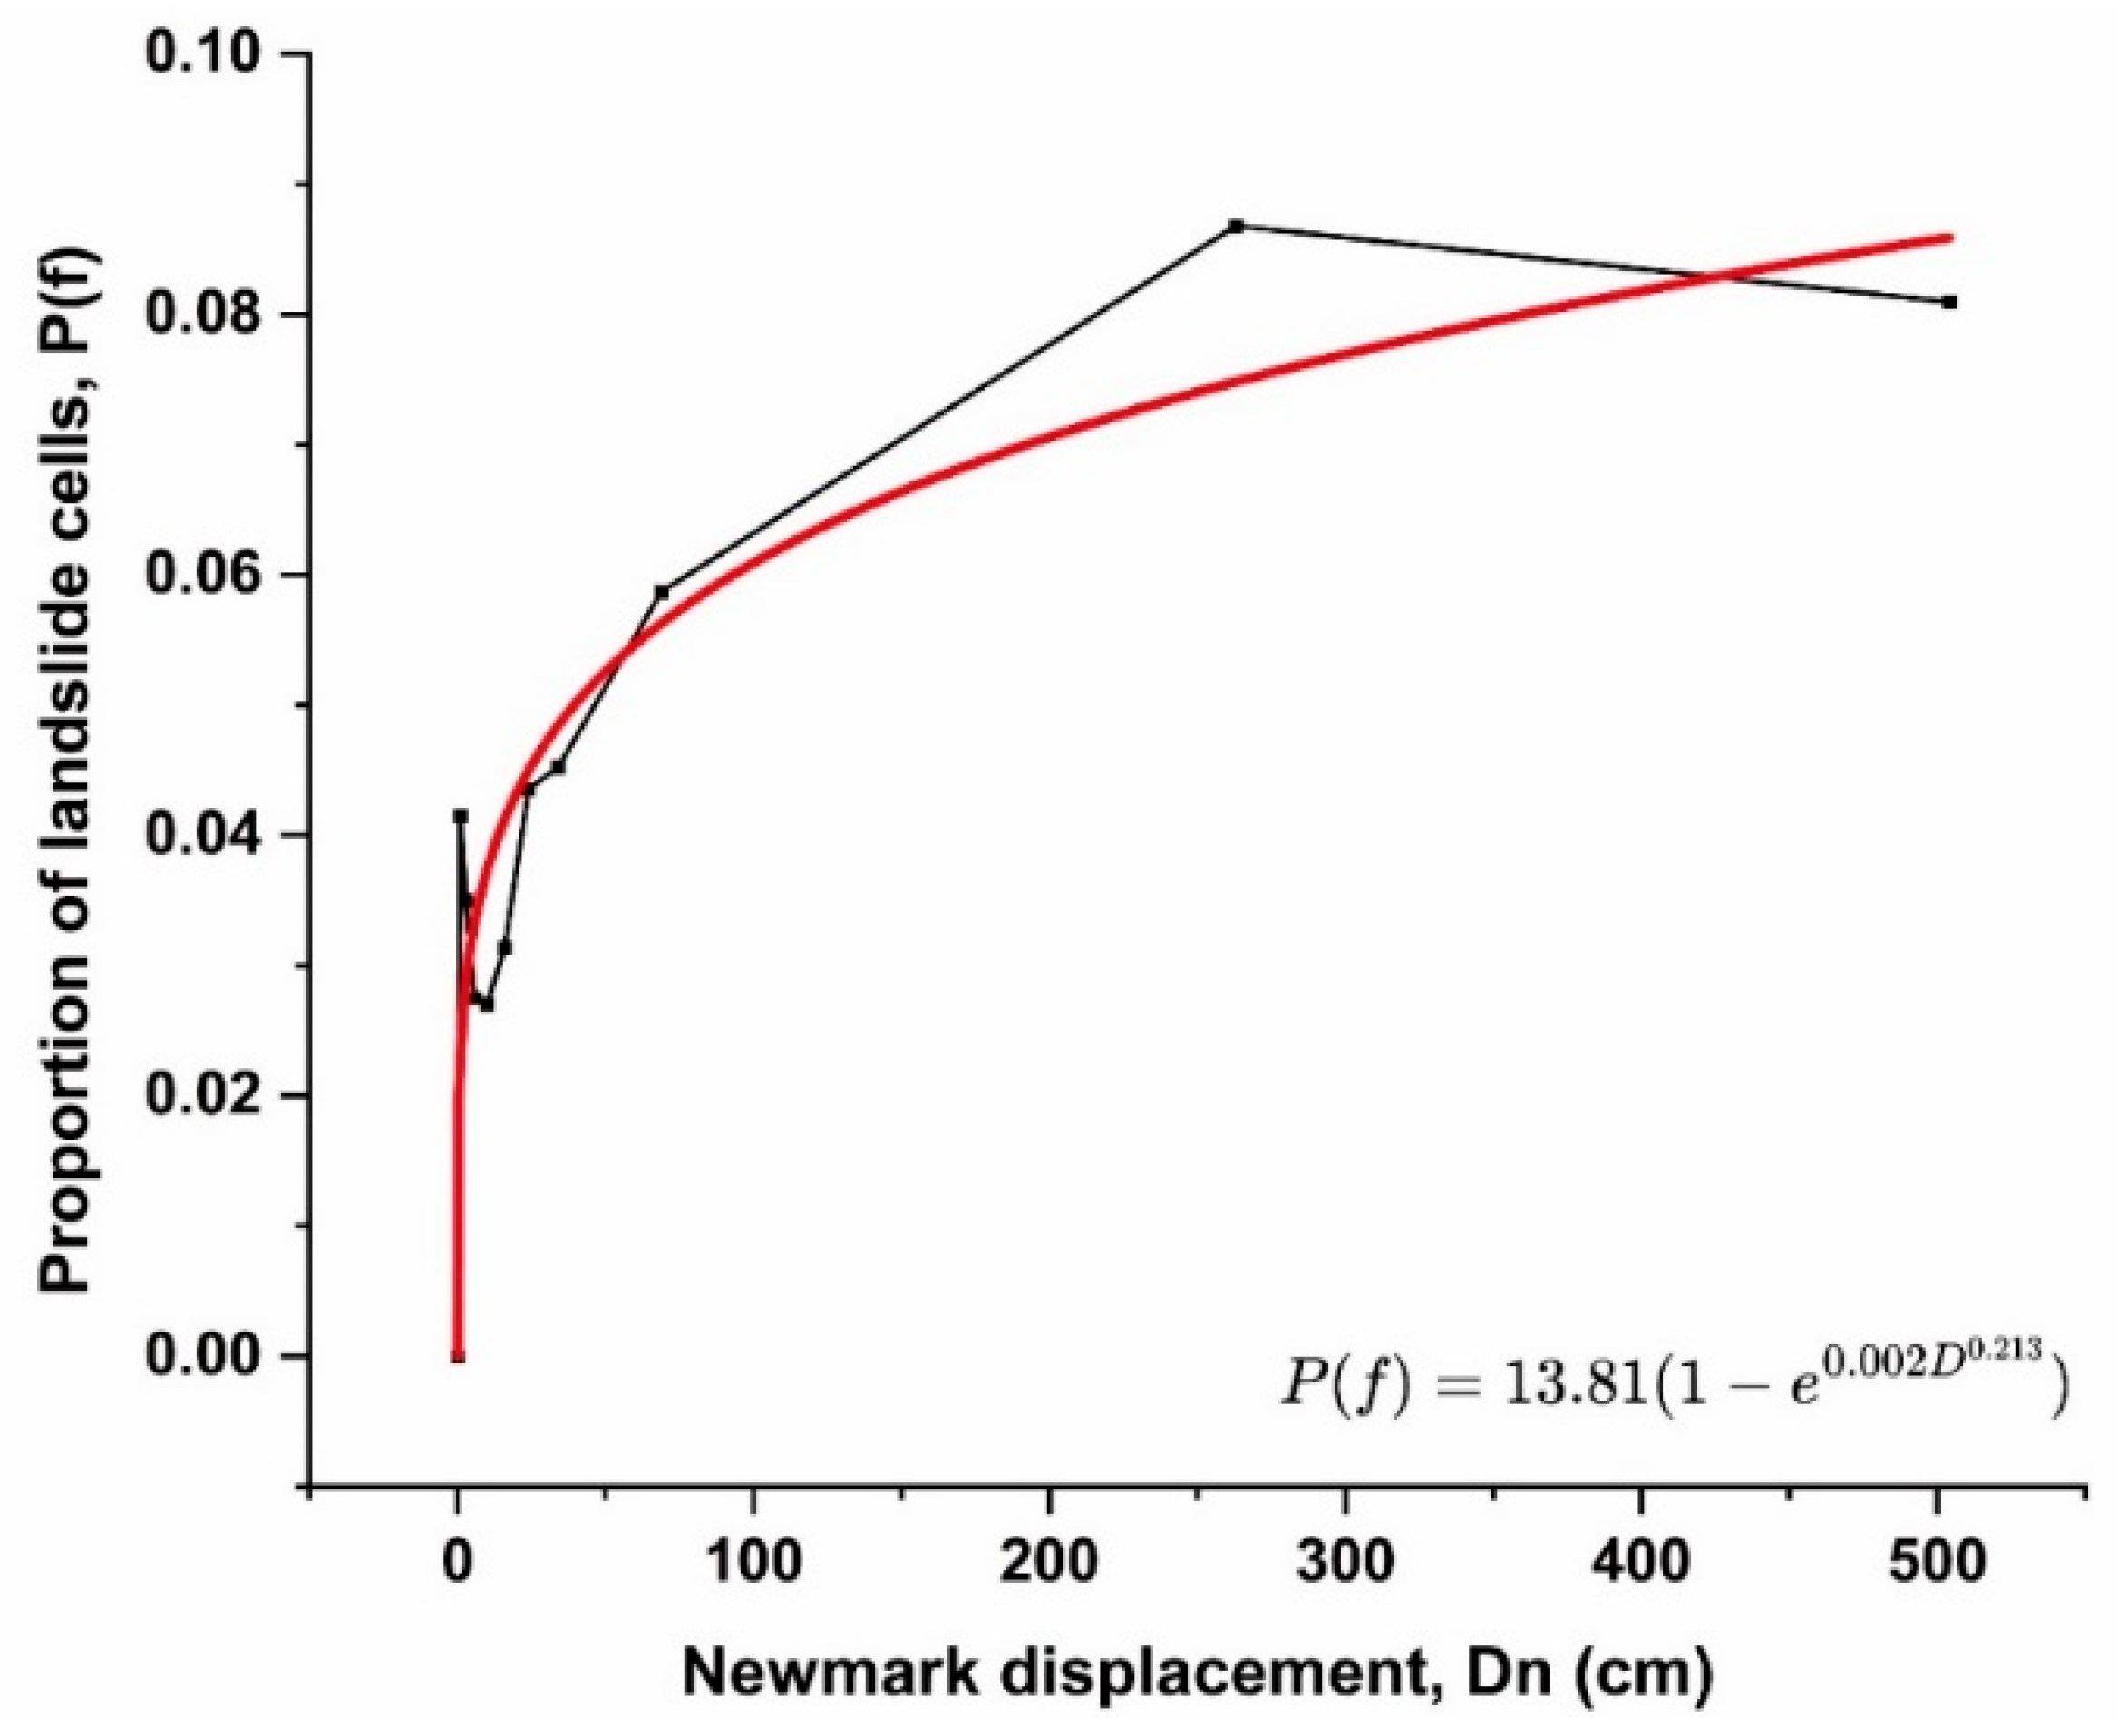
Figure 13.
Map showing the spatial probability distribution of seismic landslides obtained from the Newmark model, which has the best fit to the actual landslide distribution.
Figure 13.
Map showing the spatial probability distribution of seismic landslides obtained from the Newmark model, which has the best fit to the actual landslide distribution.
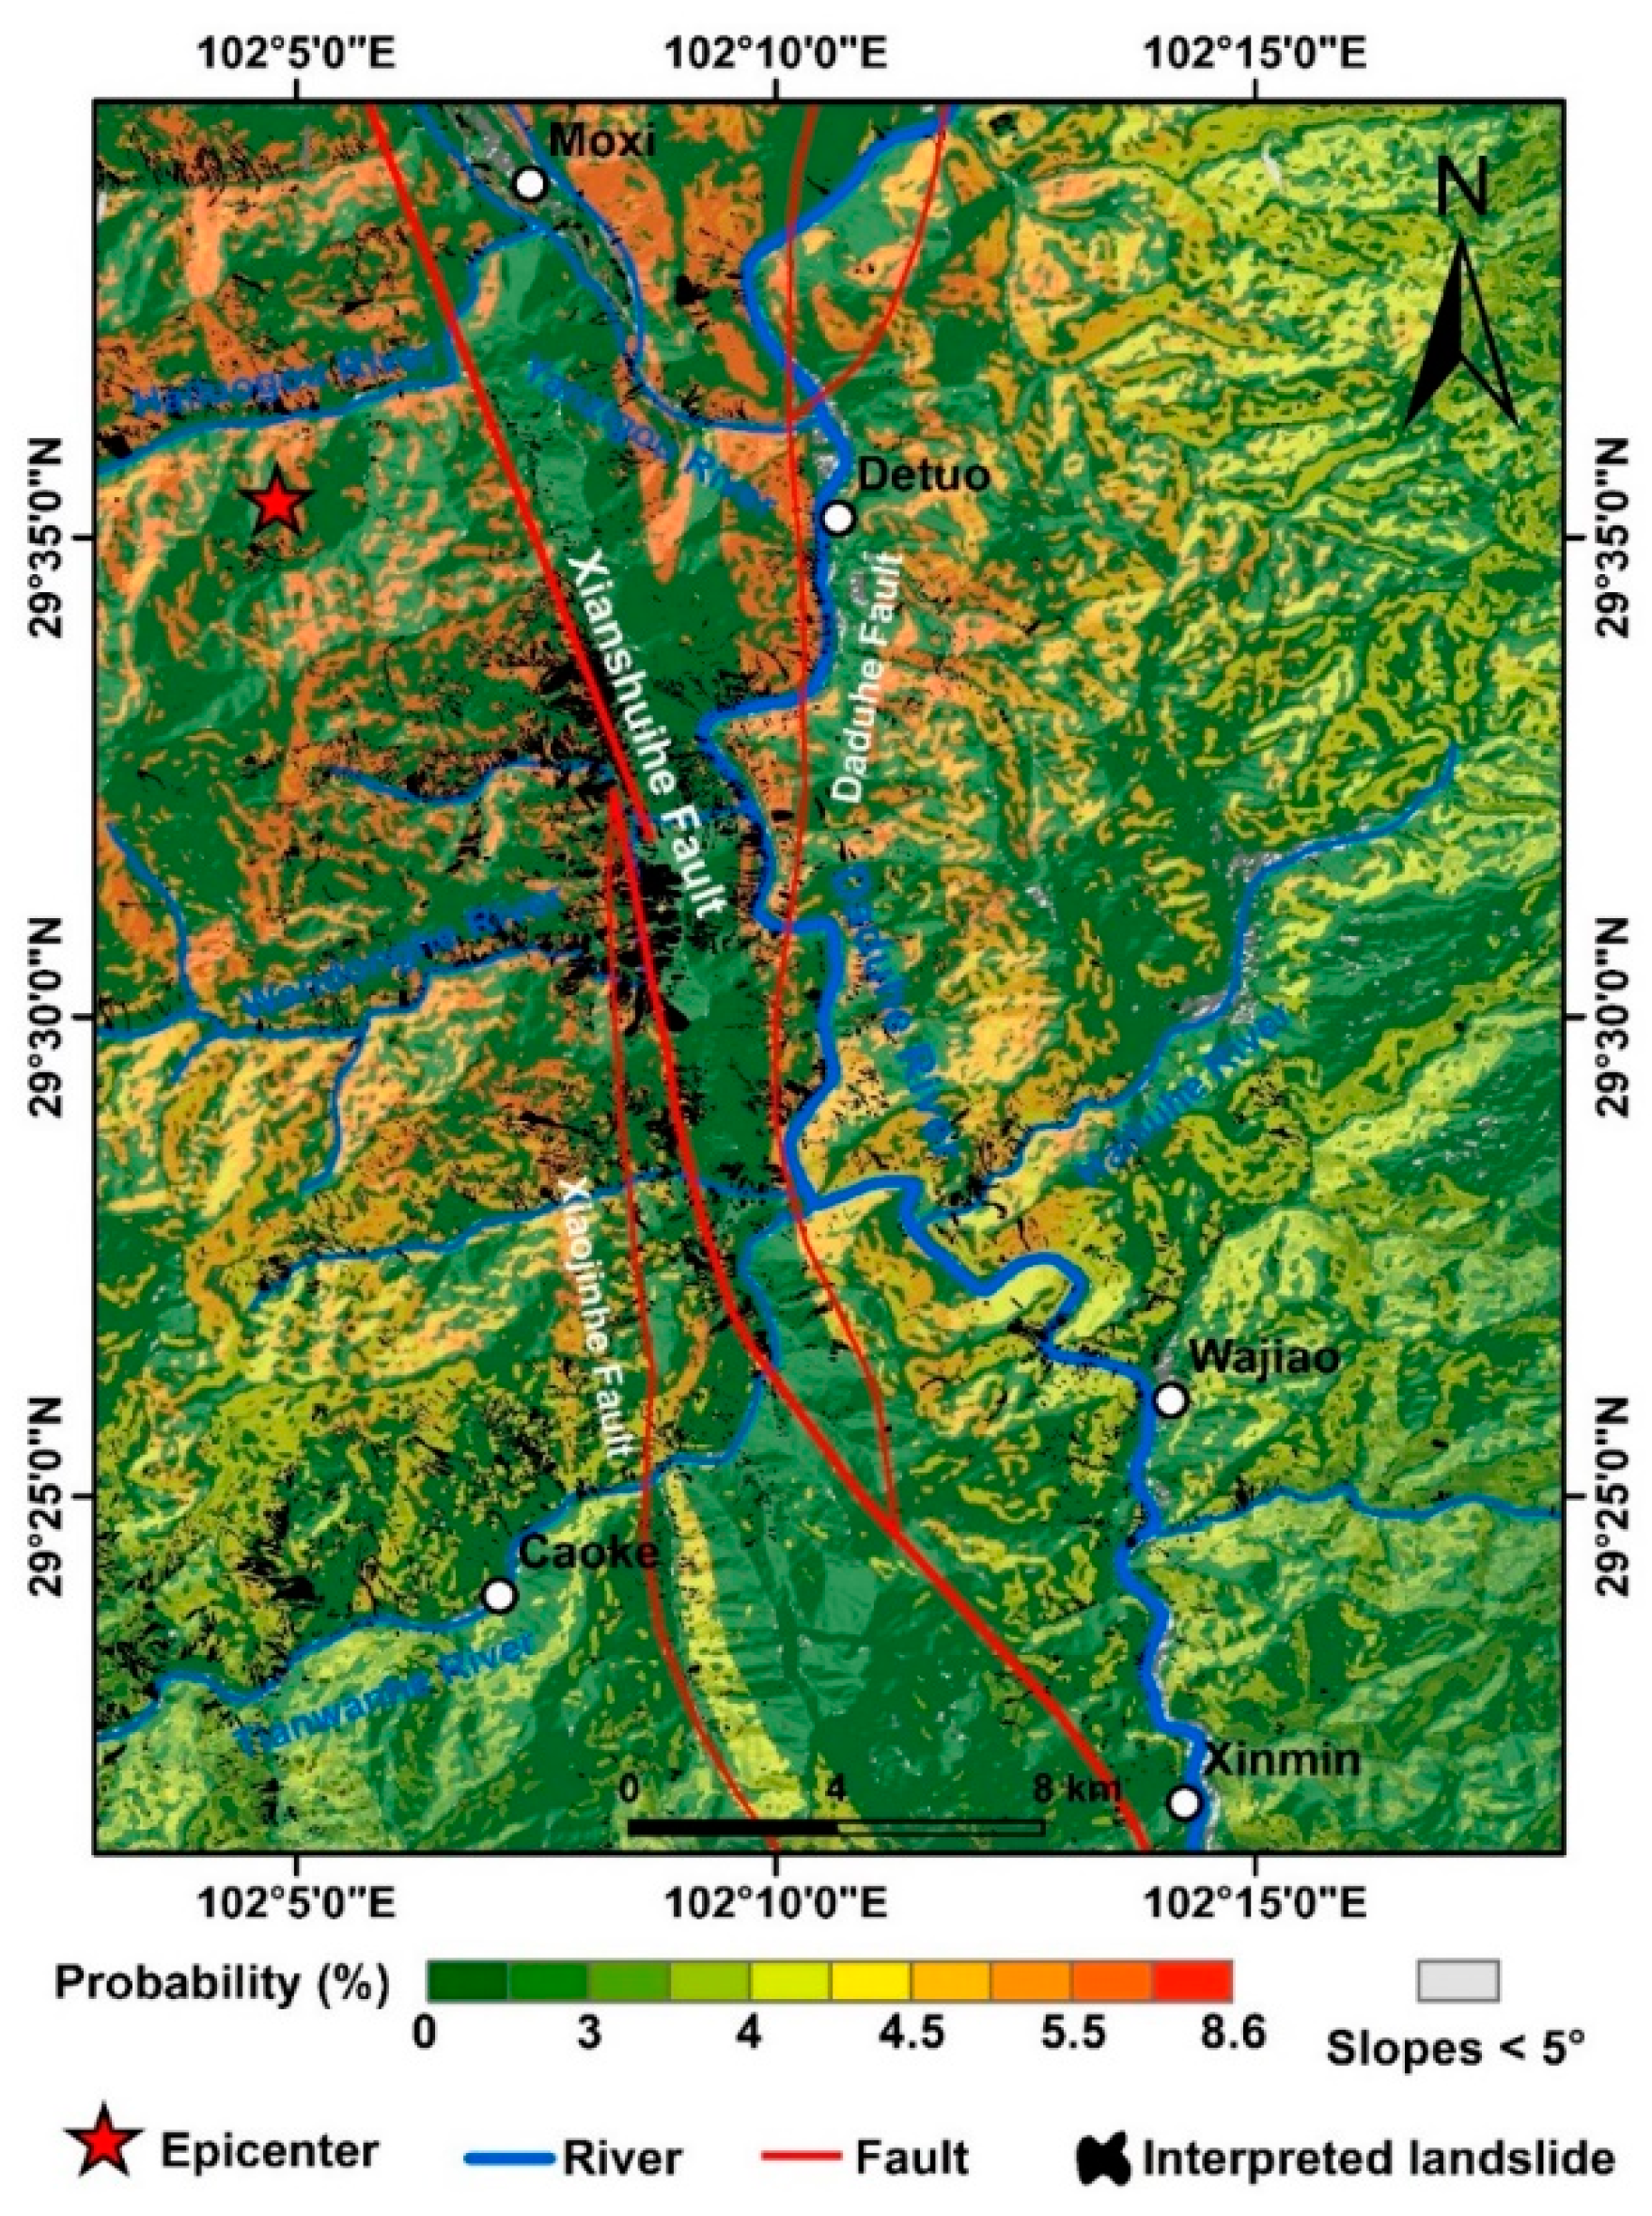
Figure 14.
Map showing the change in landslide density with increasing distance from the epicenter and the seismogenic fault.
Figure 14.
Map showing the change in landslide density with increasing distance from the epicenter and the seismogenic fault.
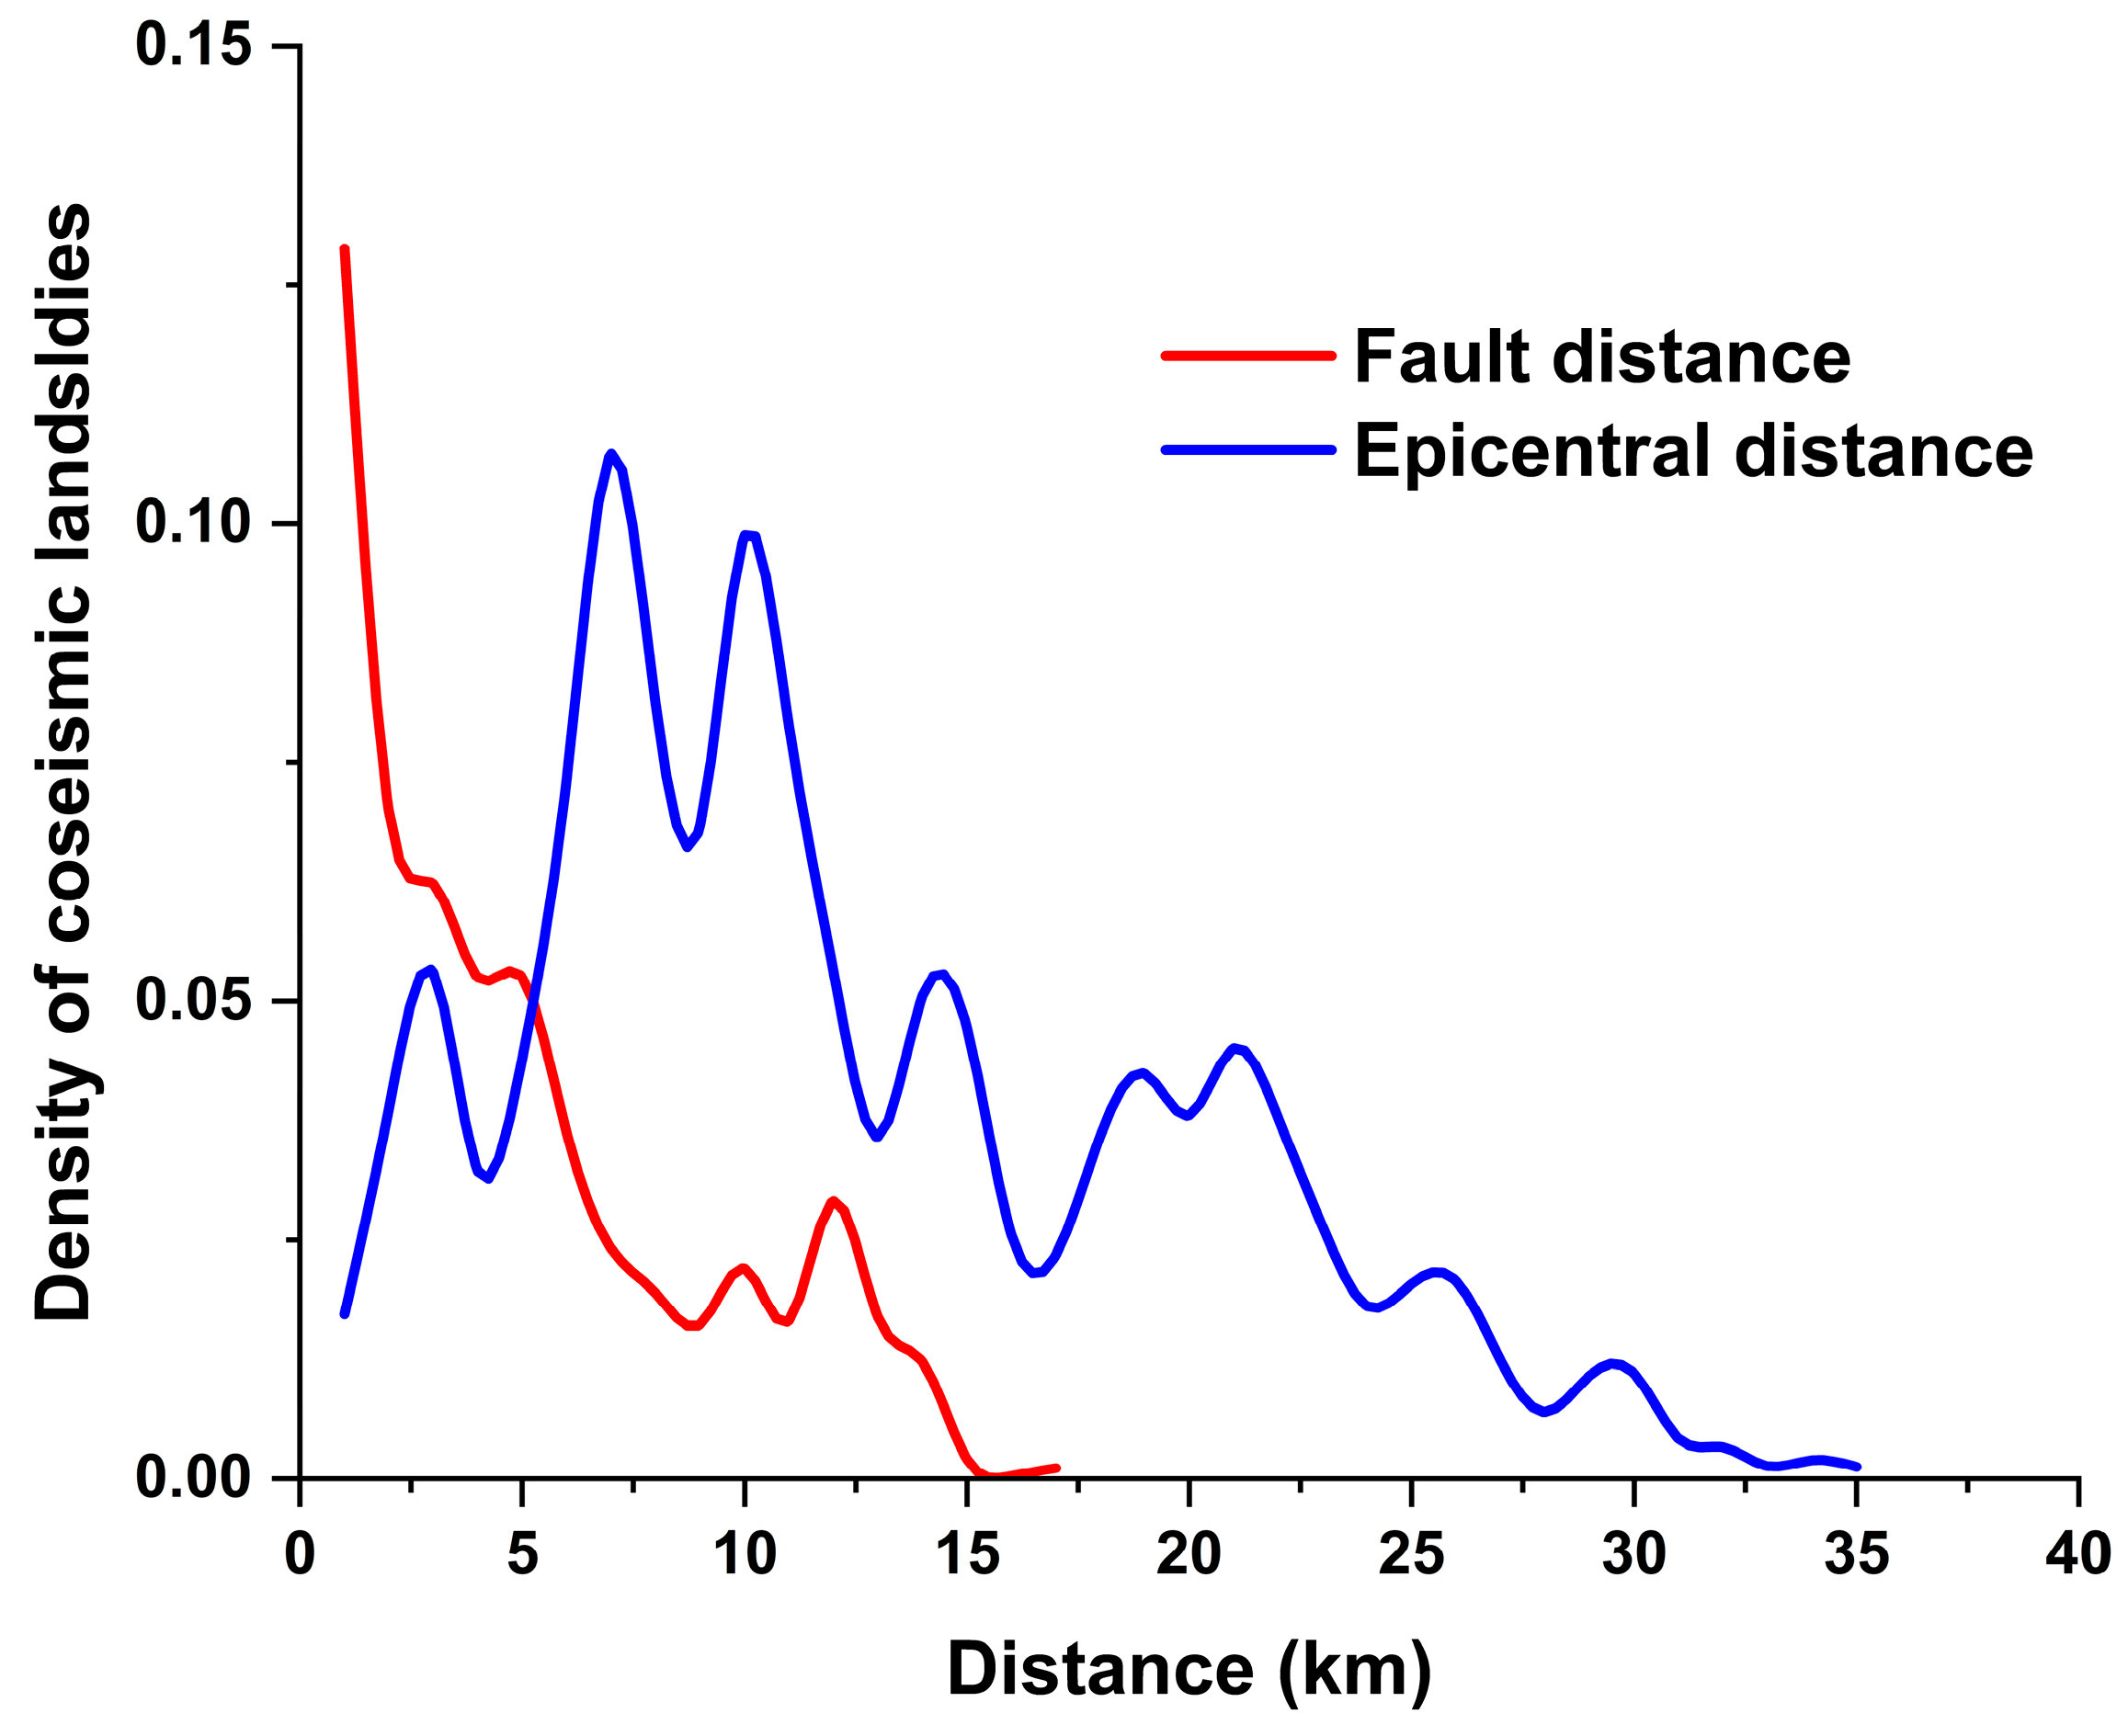

Table 1.
Sources of data required for the calculation.
| Characteristic factor | Spatial resolution | Source |
|---|---|---|
| Elevation | 30 m | Geospatial Data Cloud (https://www.gscloud.cn/) |
| Lithology | 1:200000 | National Geological Data Museum (https://www.ngac.cn/) |
| \ | United States Geological Survey (USGS) (https://www.usgs.gov) | |
| \ | United States Geological Survey (USGS) (https://www.usgs.gov) |
Table 2.
Physical and mechanical parameters of rocks in the study area.
| Rock type | /Mpa | /° | /kN·m-3 |
|---|---|---|---|
| Dolomite | 0.036 | 43 | 25.9 |
| Slate | 0.011 | 28 | 26.5 |
| Marble | 0.051 | 31 | 26.4 |
| Granite | 0.031 | 35 | 26.1 |
| Limestone | 0.030 | 45 | 21.5 |
| Diabase | 0.010 | 24.5 | 27.5 |
| Picrite | 0.045 | 50 | 31.3 |
| Conglomerate | 0.034 | 35 | 21.5 |
| Rhyolite porphyry | 0.035 | 33 | 25 |
| Sandstone | 0.025 | 42 | 26.5 |
| Diorite | 0.040 | 50 | 26.9 |
| Quartzite | 0.037 | 40 | 26 |
Disclaimer/Publisher’s Note: The statements, opinions and data contained in all publications are solely those of the individual author(s) and contributor(s) and not of MDPI and/or the editor(s). MDPI and/or the editor(s) disclaim responsibility for any injury to people or property resulting from any ideas, methods, instructions or products referred to in the content. |
© 2024 by the authors. Licensee MDPI, Basel, Switzerland. This article is an open access article distributed under the terms and conditions of the Creative Commons Attribution (CC BY) license (http://creativecommons.org/licenses/by/4.0/).
Copyright: This open access article is published under a Creative Commons CC BY 4.0 license, which permit the free download, distribution, and reuse, provided that the author and preprint are cited in any reuse.


