
Submitted:
09 June 2025
Posted:
10 June 2025
You are already at the latest version
Abstract
Coseismic landslides are geological events in which slopes, either on the verge of instability or already in a fragile state, experience premature failure due to seismic shaking. On September 5, 2022, a Ms 6.8 earthquake struck Luding County, Sichuan Province, China, triggering numerous landslides that caused severe casualties and property damage. This study systematically interprets 13,717 coseismic landslides in the Luding earthquake's epicentral area, analyzing their spatial distribution concerning various factors, including elevation, slope gradient, slope aspect, plan curvature, profile curvature, surface cutting degree, topographic relief, elevation coefficient variation, lithology, distance to faults, epicentral distance, peak ground acceleration (PGA), distance to rivers, fractional vegetation cover (FVC), and distance to roads. The Analytic Hierarchy Process (AHP) was improved by incorporating the modified landslide relative frequency (mLRF) to address the subjectivity inherent in expert scoring for factor weighting. The improved AHP, combined with the Pearson correlation analysis, was used to identify the dominant controlling factor and assess the landslide susceptibility. The accuracy of the model was verified using the area under the receiver operating characteristic (ROC) curve (AUC). Results reveal that 34% of the study area falls into very high and high susceptibility zones, primarily along the Moxi segment of the Xianshuihe Fault and both sides of the Dadu River valley. Tianwan, Caoke, Detuo, and Moxi are at particularly high risk of coseismic landslides. The coefficient of elevation variation, slope aspect, and slope gradient are identified as the dominant controlling factors for landslide development. The reliability of the proposed model was evaluated by calculating the AUC, yielding a value of 0.845, demonstrating high reliability. This study advances coseismic landslide susceptibility assessment and provides scientific support for post-earthquake reconstruction in Luding.
Keywords:
2022 Luding earthquake
; Coseismic landslide susceptibility
; Analytic Hierarchy Process
; Frequency Ratio
; Pearson correlation coefficient
1. Introduction
Landslides are widespread natural disasters around the world, and earthquakes are considered one of the main triggers of landslides. The damage caused by coseismic landslides is often more severe than the direct damage caused by the earthquake itself [1]. China is situated at the junction of two major global seismic belts—the Pacific Ring of Fire and the Eurasian seismic belt. Due to the compression from the Pacific, Indian, and Philippine Sea plates, the seismic fault zones in the region are highly developed, making China a country prone to frequent earthquakes [2]. For example, the globally recognized Wenchuan earthquake (Ms 8.0) in 2008, the Yushu earthquake (Ms 7.1) in 2010, the Ya'an earthquake (Ms 7.0) in 2013, the Ludian earthquake (Ms 6.5) in 2014, and the Jiuzhaigou earthquake (Ms 7.0) in 2017 have all resulted in widespread coseismic landslides. China is geographically characterized by numerous mountains and hills, with mountainous areas covering about 70% of the country's land. This vast mountainous terrain provides abundant geographical conditions for coseismic landslides. In particular, the mountainous canyon regions of western China feature highly complex geological conditions, with densely distributed active faults and frequent strong earthquakes, leading to severe coseismic landslides. On September 5, 2022, at 12:52 PM, a magnitude 6.8 earthquake struck Luding County, Ganzi Prefecture, Sichuan Province, with the epicenter located at 102.08°E, 29.59°N and a focal depth of 16 km, reaching a maximum intensity of IX. The earthquake triggered numerous landslides, resulting in significant casualties and property damage. Therefore, conducting regional coseismic landslide susceptibility assessments is of great significance for earthquake disaster prevention, mitigation, and future urban planning in seismic zones.
Coseismic landslide susceptibility assessment refers to the evaluation of the likelihood of landslides occurring in a specific area after an earthquake. An objective, detailed, and accurate coseismic landslide inventory map forms the basis of coseismic landslide susceptibility assessments [3,4]. Several research teams have used multi-source remote sensing satellite images or drone aerial images from before and after the earthquake to interpret the coseismic landslides induced by the Luding earthquake and have constructed corresponding coseismic landslide inventories. However, due to cloud cover, these coseismic landslide inventories have significantly missed the high-altitude mountainous areas above 2500 m on the western side of the seismogenic fault [5,6,7,8]. Shao et al. used cloud-free post-earthquake remote sensing images to conduct a comprehensive interpretation of landslides in the entire Luding earthquake-affected area [9]. They provided a more complete supplement to previous landslide inventories, resulting in the most comprehensive and reliable coseismic landslide inventory for Luding to date. Therefore, We use this updated landslide inventory as the fundamental data for the coseismic landslide susceptibility assessment.
The methods for assessing coseismic landslide susceptibility can be broadly divided into three categories: engineering geological analysis, statistical regression models, and mechanics-based analysis methods. The engineering geological analysis method is a comprehensive evaluation approach based on an understanding of slope stability and engineering experience [10]. On the one hand, the historical analysis method can be used to study the developmental history of the slope and predict its future evolution. On the other hand, based on extensive field geological surveys, the structural analogy method evaluates the stability of slopes under similar geological conditions. Statistical regression models summarize and predict patterns based on the analysis of factors influencing the development of coseismic landslides. By studying the distribution patterns of past landslides, the relationships between landslides and factors like seismic activity, topography, lithology, and geological structures are explored. Susceptibility trends are extrapolated based on existing statistical rules or through semi-quantitative assessments using expert knowledge. For example, methods like the comprehensive index method [11], or quantitative assessments using statistical techniques such as cluster analysis [12], frequency ratio (FR) [13], information method [14], and weights of evidence model [15], as well as machine learning algorithms like logistic regression [16], artificial neural networks [17], and support vector machines [18], can also be employed. The third method is mechanics-based analysis, which includes pseudo-static methods [19], limited sliding displacement method [20,21,22], numerical simulations [23], and physical model testing [24,25,26,27]. These methods are based on the physical mechanisms of coseismic landslides and use mathematical or physical models to quantitatively assess slope stability under seismic conditions.
The development of coseismic landslides is influenced by various factors such as seismic activity, topography, and geological conditions, making it a multi-criteria decision-making problem. The Analytic Hierarchy Process (AHP), first proposed by Saaty, is a classic and powerful method used for multi-criteria analysis [28,29,30,31]. The AHP method has been widely applied in assessing typhoon damage [32], landslides [33,34], spontaneous coal combustion hazards [35], avalanches [36], flood hazards [37,38,39], and other natural disasters. The AHP method is also one of the effective approaches for assessing coseismic landslide susceptibility [40]. However, the traditional method has three main limitations: first, it relies on expert judgment for pairwise comparisons, introducing subjectivity and failing to quantify the weight of each factor. Second, in the absence of a disaster database, the results of the AHP method are expressed as a range of scores rather than the actual probability of disaster occurrence. Third, in seismic landslide susceptibility assessment, including more influencing factors does not always enhance the analysis. On the contrary, low-correlation factors may compromise the accuracy of the evaluation.
In response to the aforementioned issues, this paper focuses on the landslides induced by the Luding Ms 6.8 earthquake. Based on remote sensing interpretation and field validation, the landslide inventory for the 2022 Luding earthquake was refined. On this basis, the highest point of the landslide scarp (the highest elevation of the landslide's back scarp) was extracted as the primary data, and the dataset was divided into a training set (70%) and a test set (30%). Using the FR-AHP-Pearson coupling algorithm, the sensitivity of each influencing factor to coseismic landslides was analyzed. Factors with strong autocorrelation and low sensitivity were excluded, and a coseismic landslide susceptibility assessment model for the Luding earthquake was constructed, leading to the establishment of landslide susceptibility zones. Finally, 30% of non-landslide samples and 30% of landslide samples were randomly selected to form a test set, and the model's accuracy was validated using the area under the receiver operating characteristic (ROC) curve (AUC). The findings of this paper provide valuable scientific guidance for post-earthquake reconstruction and the strategic planning of future disaster prevention and mitigation in seismic zones.
2. Study Area
At 12:52 PM on September 5, 2022, a Ms 6.8 earthquake occurred in Luding County, Ganzi Prefecture, Sichuan Province. According to data from the China Earthquake Networks Center, the epicenter of the Luding earthquake was located in the Hailuogou Glacier Forest Park near Moxi Town (102.08°E, 29.59°N), with a focal depth of approximately 16 km and a maximum seismic intensity of IX. This earthquake triggered numerous landslides, resulting in 93 fatalities, 25 missing persons, over 270 injuries, and widespread damage to houses and roads [5,41]. The seismogenic fault of the earthquake was the Moxi segment of the Xianshuihe Fault, located on the southeastern margin of the Tibetan Plateau, with a left-lateral strike-slip fault mechanism [42]. In this study, the area on both sides of the Moxi segment of the Xianshuihe Fault, where coseismic landslides are densely distributed, was selected as the study area to assess landslide susceptibility. The study area covers approximately 963.77 km².
The study area, located in the Hengduan Mountains on the southeastern margin of the Tibetan Plateau, features typical alpine gorge terrain. The topography generally slopes from west to east and from north to south, with significant elevation changes. The highest elevation in the study area is 4668 m at Wanglangbao, in the northwest, while the lowest elevation is 874 m, located in the lower reaches of the Dadu River. The average elevation is 2312 m, with a relative height difference of 3736 m. The study area lies in a typical subtropical monsoon climate zone, influenced by the southeast monsoon, southwest monsoon, and cold air from the Tibetan Plateau. The annual average temperature is 15.5°C, and the average annual precipitation is 664.4 mm [8]. The largest river flowing through the study area is the Dadu River, which runs from north to south, with an overall flow direction of 171°. The river channel within the area is approximately 50 km long, with a vertical drop of about 266 m and an average slope of 5.32‰. The river is rugged and wide. The Dadu River is a primary tributary of the Minjiang River, joining it at the southern part of Leshan City. There are three major tributaries of the Dadu River within the study area: the Moxi River, Wandong River, and Tianwan River, all of which are primary tributaries on the right bank of the Dadu River.
The exposed strata in the study area, from oldest to youngest, include the Sinian, Silurian, Devonian, Carboniferous, Permian, Triassic, and Quaternary systems. According to the 2022 geological cloud 1:200,000 regional vector geological map, granite has the highest proportion in the area and is mainly distributed on the eastern side of the seismogenic fault zone. Quartzite and marble of the Permian system form the second-largest lithological component in the area, predominantly distributed on the western side of the study area. Additionally, limestone and marble of the Permian system are primarily distributed near the earthquake epicenter, while limestone and slate of the Devonian system are mainly found in the southern and central parts of the study area, south of the Xianshuihe Fault. Quaternary sediments are mainly distributed along both banks of the Dadu River and its tributaries, including Holocene alluvial layers, Pleistocene alluvial layers, gravel, and clay. Other strata in the area are less widely distributed. Due to prolonged intense tectonic activity and weathering, the rock masses are fractured, and structural surfaces are well-developed.
Since the Neogene, due to the uplift of the Tibetan Plateau, neotectonic movements have been intense. The uplift of the Tibetan Plateau is generally divided into four main stages [43]. The first stage is Himalayan stage (45 to 8 Ma BP), during which the Tibetan Plateau primarily underwent progressive northward compression and uplift, causing the overall uplift of the Sichuan-Yunnan block and resulting in eastward compression [44]. The second stage is Qiangtang stage (3.6 to 3.4 Ma BP), the Hengduan Mountains experienced significant uplift, and the plateau began to move eastward, leading to strong tectonic activity in the Sichuan-Yunnan region [45]. The third stage occurred Between 2.6 and 2.5 Ma BP, the Jinsha River-Xianshuihe Fault zone gradually transitioned from compressive-shear to left-lateral strike-slip [46,47]; and The fourth stage is Kunhuang stage (1.2 to 0.5 Ma BP), the plateau experienced accelerated uplift, shaping the current tectonic and geomorphological features [48]. Over the past 300 years, 17 earthquakes with magnitudes greater than 6.5 have occurred along the Xianshuihe Fault zone. The spatially closest earthquake to this event was the 1786 Kangding earthquake [49], while the most recent earthquake in time was the 1973 Luhuo earthquake [50]. Based on the data recorded by seismic stations within 150 km of the epicenter, a peak ground acceleration (PGA) zoning map was generated for the study area, with values ranging from 0.23 to 0.65g.
The visual interpretation of landslides was performed using a human-machine interactive approach, based on field surveys and optical satellite imagery. The optical satellite images used in this study were obtained from Planet satellite data captured in July 2022 and on September 29, 2022. Contrasting high-resolution remote sensing images before and after the earthquake, a total of 13,717 landslides were identified within the study area, with a total landslide area of 39.27 km². The largest landslide covered an area of 120,747 m², while the smallest was 16 m², with an average landslide area of approximately 3,451 m² [51]. The distribution of the interpreted coseismic landslides is illustrated in Figure 1.
3. Materials and Methodology
3.1. Sources of Data
The datasets required for the landslide susceptibility assessment of the 2022 Luding earthquake are listed in Table 1. They include: ① a remote sensing-interpreted seismic landslide inventory database, ② a 30m resolution digital elevation model (DEM), ③ a 1:200,000 scale vector geological map, ④ a satellite imagery map at a 1:200,000 scale, and ⑤ a vector PGA distribution map of the 2022 Luding earthquake.
3.2. Coseismic Landslide Susceptibility Assessment Methods
3.2.1 Analytical hierarchy process
AHP was proposed by American operations researcher Saaty in 1973. It is a decision-making method that combines qualitative and quantitative analysis to solve multi-criteria problems [31]. AHP is widely used in landslide susceptibility assessments. The basic steps of the AHP method include:
- (1)
- Establish a hierarchical structure model, clarifying the relationships between influencing factors. The hierarchical structure model is established by the recursive relationships among the influencing factors in the criterion layer and sub-criterion layer.
- (2)
- Construct the judgment matrix. The judgment matrix is the core of the AHP method. It involves pairwise comparisons of the relative importance of influencing factors in the sub-criterion layer under the criterion layer, forming a judgment matrix. In traditional AHP, the relative importance of two factors is qualitatively expressed as equally important, slightly important, moderately important, strongly important, and extremely important, and is quantified using a scale of 1, 3, 5, 7, and 9. In this paper, the modified Landslide Relative Frequency (mLRF) value is used to assign a quantitative index to each factor to construct the judgment matrix.
- (3)
- Conduct a consistency check. To ensure that the weight distribution obtained from the judgment matrix is reasonable, consistency checks are performed using equations (1) and (2).In this equation, CI represents the consistency index, λmax is the maximum eigenvalue of the judgment matrix, and n is the order of the matrix. If CI =0, it indicates perfect consistency in the matrix. Conversely, the larger the CI value, the worse the consistency of the matrix. Typically, a CI value below 0.1 is generally deemed acceptable in practice. When n is greater than 3, to eliminate the influence of n on CI, the average random consistency index (RI) is introduced, with values taken from Table 2. CR is the consistency ratio, and a CR value of less than 0.1 is generally required. If the CR value is below 0.1, the matrix passes the consistency test; otherwise, the matrix needs to be revised.
- (4)
- Calculate the overall weight of each influencing factor. After passing the consistency test, normalize the weight of each influencing factor at all levels to compute the comprehensive weight value (), and create a ranking table of the comprehensive weights of the influencing factors.
3.2.2 Frequency ratio
The FR statistical approach is a research approach that calculates the probability of landslides occurring within different classification intervals of each landslide influencing factor, thereby determining the correlation between the influencing factors and the location of landslides [52,53]. In this study, the FR method was employed to analyze the correlations between coseismic landslides and 15 influencing factors. The FR is defined by Equation (6). An FR value less than 1 indicates that the factor interval is less prone to coseismic landslides, FR > 1 indicates that the factor interval is more prone to coseismic landslides, and FR = 1 suggests that the result is indeterminate [54]. However, the single FR model overlooks the weight of each influencing factor. To address this limitation, mLRF was adopted to quantify the correlations, as defined in Equation (4).
In the equation: represents the influencing factor; represents the classification under the influencing factor; is the frequency ratio of the th division of the th influencing factor; is the modified landslide relative frequency; is the number of landslides in the th division of the th influencing factor; is the total number of landslides in the study area; is the number of grid cells occupied by the th division of the th influencing factor; and is the total number of grid cells in the study area.
3.2.3 Pearson correlation coefficient
The Pearson correlation coefficient is a statistical measure used to assess the strength of the linear relationship between two continuous variables. Given two variables, X and Y, where variable X contains n sample observations and variable Y contains n observations, the Pearson correlation coefficient is defined as follows [55]:
The value of r ranges between [-1, 1]. The larger the value, the stronger the linear relationship between variables and . When = 1, and are perfectly positively correlated; when = -1, and are perfectly negatively correlated; and when = 0, and are uncorrelated. Generally, if the correlation coefficient > 0.5, variables and are considered to have a high correlation.
3.3. Methodology Flow
(1) Collect and organize data such as the DEM, remote sensing images, roads, rivers, and landslide information of the study area. Use the elevation raster layer as the base map, extract the highest elevation point from the landslide surface vector data obtained by remote sensing interpretation as the landslide initiation point. This will serve as the fundamental data for subsequent analysis. The data is then split into training and testing sets in a 7:3 ratio.
(2) Extract 15 factors including elevation, slope gradient, slope aspect, plan curvature, profile curvature, surface cutting degree, topographic relief, elevation coefficient variation, lithology, distance to faults, epicentral distance, PGA, distance to rivers, FVC and distance to roads. Except for lithology, which is a discrete variable, all other factors are continuous data and are used for subsequent correlation analysis between influencing factors.
(3) Use the natural breaks method in the GIS platform to classify the 15 influencing factors, apply the FR method to obtain the FR values for each classification, and analyze the spatial distribution characteristics of coseismic landslides.
(4) Calculate the mLRF values for the 15 influencing factors, use these mLRF values as quantitative indicators for expert scoring in the AHP method to determine the weights of the 15 influencing factors, and perform a correlation test between the factors using Pearson's coefficient method, excluding factors with strong correlation but low weight values.
(5) After filtering the factors, the remaining factor FR layers and their filtrated weights are substituted into Equation (6) for weighted overlay. This yields the coseismic landslide susceptibility index for the study area, which is then classified using the natural breaks method to create the landslide susceptibility zonation map for the 2022 Luding earthquake.
Note: OLSI is the susceptibility index; is the normalized weight value of the filtrated influencing factors; and is the filtrated frequency ratio layer of the influencing factors.
(6) Slope units were delineated using hydrological analysis. A number of slope units equal to the size of the testing set were randomly selected. The highest elevation points of the slopes (initiation points) are extracted, and the ROC curve is used to test the rationality of the coseismic landslide susceptibility zonation results, validate the accuracy of the coseismic landslide susceptibility assessment, and analyze the main controlling factors of coseismic landslides in the study area.
The specific process of coseismic landslide susceptibility assessment is illustrated in Figure 2.
4. Results and Analysis
4.1. Selection of Coseismic Landslide Influencing Factors
When assessing susceptibility to adverse geological conditions, the selection process for influencing factors must be rigorous [56]. Earthquake-triggered landslides, as a highly destructive geological disaster, are influenced by a combination of factors, including topographical conditions, geological conditions, seismic motion, rivers, and human engineering activities. In terms of topographical conditions, elevation, slope gradient, slope aspect, plan curvature, profile curvature, surface cutting depth, topographic roughness, and elevation variation coefficient reflect surface morphology and topographic relief, which are crucial for assessing susceptibility to coseismic landslides. Regarding geological conditions, the lithology of strata significantly affects the formation and distribution of coseismic landslides. Distance to faults, epicenter distance, and PGA illustrate the correlation between coseismic landslides and their inducing factors. Additionally, distance to rivers and FVC are also important factors affecting the susceptibility to coseismic landslides. Finally, the terrain in the Luding area is steep, and highways are often built in valleys; excavation of roads may disturb the surrounding slopes. Landslides triggered by the Luding earthquake were mostly distributed on both sides of the roads, while slopes without road construction rarely experienced landslides. This indicates that human engineering activities, particularly road excavation, may play a critical role in exacerbating landslide occurrences.
Based on a comprehensive consideration of the above factors, we selected the relevant influencing factors based on existing data, including elevation, slope gradient, slope aspect, plan curvature, profile curvature, surface cutting degree, topographic relief, elevation coefficient variation, lithology, distance to faults, epicentral distance, PGA, distance to rivers, FVC and distance to roads [3,57,58]. The selection of these factors aims to comprehensively reflect the various influencing factors of coseismic landslide occurrence, providing a scientific basis for subsequent susceptibility assessments of coseismic landslides.
4.2. Analysis of the Correlation Between Influencing Factors and Coseismic Landslide Distribution
After determining the influencing factors of coseismic landslide susceptibility, to enhance the reliability of subsequent correlation testing between the factors, the factors should be converted into continuous data wherever possible, as shown in Figure 3. The lithology, a discrete variable, was classified according to its actual state, while the remaining continuous data were classified using the reclassification tool. Secondly, a total of 13,717 coseismic landslides were identified in the study area. The landslide samples were split into a training set (9,602 landslides) and a testing set (4,115 landslides) in a 7:3 ratio. Finally, using Equation (1), the frequency ratiofor each classification of influencing factors was calculated. This metric quantifies the occurrence frequency of coseismic landslides per unit area and visually reflects the susceptibility of landslides in different regions. Further, a statistical table of FR values for each classification of influencing factors was created (Table 3). Spatial distribution layers of coseismic landslide susceptibility factors (Figure 3) and corresponding relationship curves (Figure 4) were plotted to analyze the spatial distribution patterns of coseismic landslides. The results are as follows:
(1) Topographic Conditions: As shown in Figure 5A, within the elevation ranges of 874~1994m and 3279~4668m, the FR value decreases significantly with increasing elevation. In the elevation range of 1994~3279m, the FR value shows a slight decrease with increasing elevation, but the change is not pronounced. The susceptibility of coseismic landslides is strongly positively correlated with slope, surface dissection depth, terrain roughness, and elevation variation coefficient, with the highest FR values and slopes in the last two grades of these factors (Figures 5B, 5F~5H). Plan curvature is calculated based on slope direction, describing the terrain characteristics in the horizontal direction [59]. Within the plan curvature range of -23.60~0.17, the FR value slightly decreases as the curvature increases, while in the range of 0.17~23.57, the FR value increases with curvature. Profile curvature describes the complexity of the terrain [60,61]. Within the profile curvature range of -24.10~0.07, the FR value decreases as the curvature increases, while in the range of 0.07~23.88, the FR value increases with curvature.
(2) Geological Conditions: Lithology is a crucial influencing factor, as different lithologies exhibit varying strengths, playing a decisive role in slope stability [62]. As shown in Figure 5E, granite occupies the largest proportion of the study area, accounting for 52.77% of the total area, followed by quartzite, which covers 19.60%. Approximately 69% of coseismic landslides occur evenly distributed across granite and quartzite formations. Pyroxene peridotite and marble regions show the highest FR values, with the greatest density of coseismic landslide development.
(3) Seismic motion conditions: Within 5 km of the fault, the FR value slightly decreases with increasing distance from the fault, with FR values remaining above 1; beyond 5 km from the fault, the FR value shows a clear negative correlation with the fault distance (Figure 5J, Table 3). The Xianshuihe Fault zone, the source fault zone of the Luding earthquake, shows a concentration of large landslides as depicted in Figure 5. Figure 6K demonstrates that the FR value increases with the epicentral distance initially and then shows reduced volatility; the FR value peaks in the 4-6 km range, with a maximum value of 1.92, indicating the highest density of coseismic landslide occurrences within 4-6 km of the fault. Analysis of PGA shows that approximately 85% of coseismic landslides occur within the 0.23-0.42 g PGA range, with a significant positive correlation between FR and PGA. The FR value is highest at 0.37-0.42 g PGA, reaching 1.58, indicating the greatest density of coseismic landslides. Within the 0.42-0.65 g PGA range, the FR value decreases initially and then increases with stronger ground motion, with the minimum FR value corresponding to the 0.51-0.55 g PGA range.
(4) Rivers and FVC: Table 3 shows that the number of coseismic landslides and the FR values both exhibit a significant negative correlation with distance to rivers. Within 0-800 m of rivers, the number of coseismic landslides is the highest, accounting for 25.48% of the total landslides; in the 400-800 m range, the maximum FR value is 1.68. This indicates that river erosion at the base of slopes plays a controlling role in the development of coseismic landslides. FVC reflects the degree of vegetation cover, ranging from 0 to 1, with higher FVC values indicating denser vegetation cover. Table 3 and Figure 5N show that, overall, the number of coseismic landslides is positively correlated with FVC; within the 0-40.23% FVC range, there is a clear positive correlation between FR and FVC. When FVC exceeds 40.23%, the FR value increases slightly with FVC, but the change is minimal; within the 62.50-71.88% FVC range, the FR value is highest, indicating the greatest density of coseismic landslides.
(5) Human Engineering Activities: As shown in Figure 5O, within a distance of 0-2800 m from roads, the FR value decreases slightly with increasing distance from roads, but the change is minimal. When the distance from roads exceeds 2800 m, the FR value gradually decreases with increasing distance, and approaches zero when the distance exceeds 5200 m. The density of coseismic landslides is highest within the 0-400 m range from roads.
4.3. Determination of initial weights for influence factors
After the relationship between each influence factor and coseismic landslide susceptibility was established, the mLRF values for all 15 factors were calculated based on their corresponding FR raster layers, as described in Equation (4). The results are presented in Table 4.
Constructing the judgment matrix is a crucial step for determining the weights of influence factors. The core step in constructing the judgment matrix is to compare the influence factors pairwise to determine their relative importance. Traditional AHP methods rely on expert judgment to determine the relative importance of influence factors, which is highly subjective. This study uses the mLRF values of the influence factors to quantitatively represent their relative importance, thereby effectively reducing the subjectivity of the AHP method. The pairwise comparison of the 15 influence factors resulted in the judgment matrix shown in Figure 5.
Figure 5.
Judgment matrix of influence factors (a. Elevation;b. Slope gradient;c. Slope aspect;d. Plan curvature;e. Profile curvature;f. Surface cutting degree;g. Topographic relief;h. Elevation coefficient variation; i. Lithology;j. Distance to faluts;k. Epicentral distance;l. PGA;m. Distance to rivers;n. FVC;o. Distance to roads)
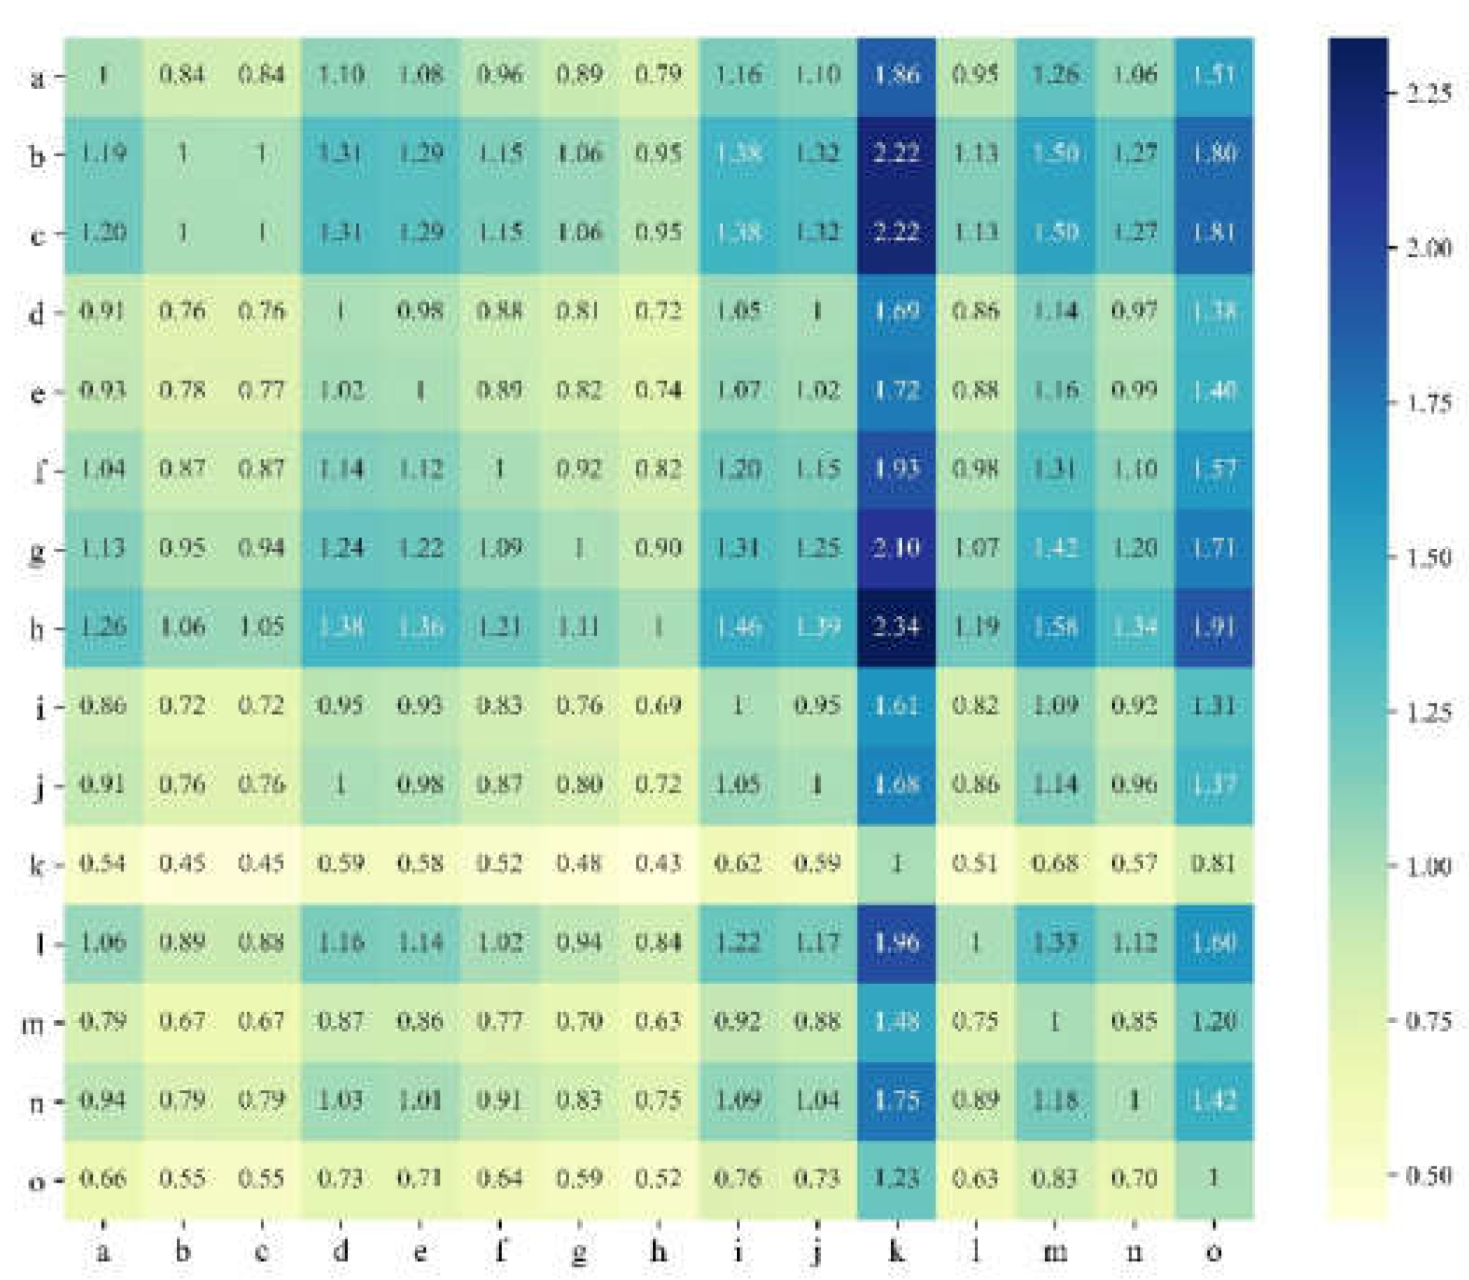
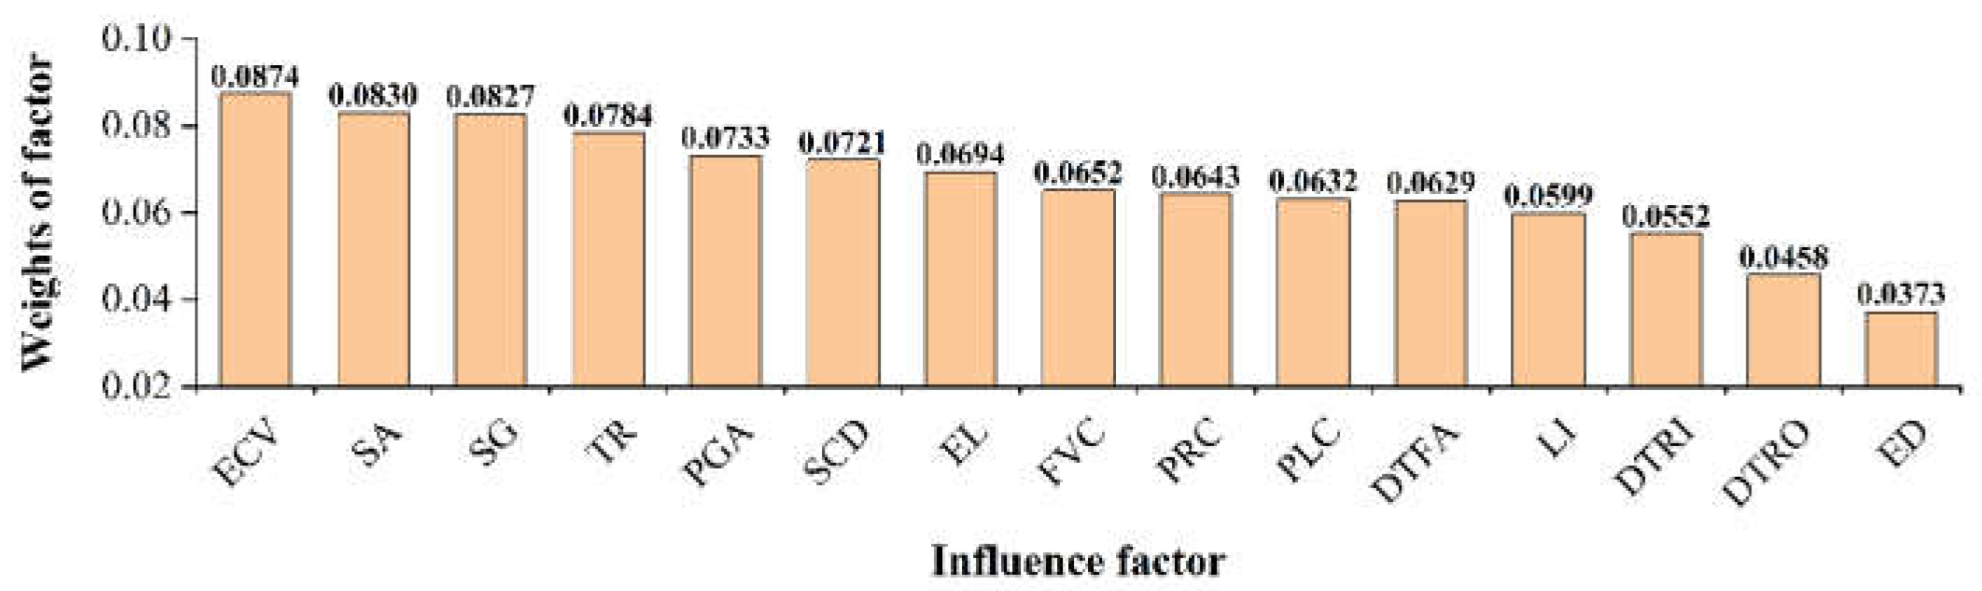
The eigenvector of the maximum eigenvalue of the judgment matrix, after normalization, can be used as the weight vector. The maximum eigenvalue of the judgment matrix was calculated to be 15, with the corresponding eigenvector being {0.264, 0.314, 0.315, 0.240, 0.244, 0.274, 0.298, 0.332, 0.228, 0.239, 0.142, 0.278, 0.210, 0.248, 0.174}. After normalization, the weight ranking of the influence factors for coseismic landslides was obtained (Figure 6). The CR value of the judgment matrix, calculated using Equations (1) and (2), was found to be, which is well below 0.1, indicating that the weight allocation of the influence factors is reasonable.
Figure 6.
Initial weight ranking of influence factors (ECV. Elevation coefficient variation;SA. Slope aspect;SG. Slope gradient;TR. Topographic relief;PGA. Peak ground acceleration;SCD. Surface cutting degree;EL. Elevation;FVC. Fractional vegetation cover;PRC. Profile curvature;PLC. Plan curvature;DTFA. Distance to faluts;LI. Lithology;DTRI. Distance to rivers;DTRO. Distance to roads;ED. Epicentral distance)
4.4. Correlation analysis of influence factors and normalization of filtrated weights
In assessing coseismic landslide susceptibility, high autocorrelation among influence factors can lead to redundancy and reduce modeling accuracy [63]. Using the multi-value extraction tool on the GIS platform, raster values from the 15 layers shown in Figure 4 were extracted to the attribute table of the landslide initiation points in the testing set. This attribute table was then imported into SPSS software, where Pearson correlation analysis was performed to examine the relationships between the 15 influence factors, as shown in Figure 7. If the correlation coefficient r satisfies, the correlation between the two factors is considered low [64]. The results indicate that elevation has significant correlations with elevation variation coefficient, distance to road, PGA, and distance to fault. Distance to epicenter shows strong correlation with PGA, plan curvature with profile curvature, and surface cutting depth with terrain roughness. Based on the obtained weights in Section 3.3, factors with smaller weights were removed. Consequently, elevation, distance to epicenter, planar curvature, and surface cutting depth were excluded. Finally, the weights of the remaining factors were renormalized, resulting in the final influence factor weight ranking for the Luding study area (Figure 8). Figure 8 shows that the elevation variation coefficient is the most important influence factor with a weight of 0.1152, followed by slope aspect and slope degree, both with weights around 0.11. Compared to other influence factors, distance to road is the least important factor, with a weight of 0.0605.
4.5. Mapping of coseismic landslide susceptibility zoning
After the filtrated weights of the influence factors were obtained, the FR raster layers derived in Section 3.2, together with the weights presented in Figure 8, were applied in Equation (6). A weighted overlay of the filtered FR raster layers and their corresponding weights was then performed to compute the coseismic landslide susceptibility index for the study area. Based on the values of the coseismic landslide susceptibility index, the study area is classified into five categories using the natural breaks method: non-susceptible, low susceptibility, moderate susceptibility, high susceptibility, and very high susceptibility (Figure 9).
As shown in Figure 9, the areas of very high and high landslide susceptibility are mainly distributed along both sides of the Dadu River and near the Xianshuihe Fault zone. The very high susceptibility area accounts for 12.97% of the total study area, while the high susceptibility area covers 23.84% of the study area (Figure 10). According to Figure 10, as landslide susceptibility increases, both the number of landslides and the FR value also increase. The landslide susceptibility assessment results are highly consistent with the actual distribution of coseismic landslides.
4.6. Validation of coseismic landslide susceptibility zoning results
The accuracy of the coseismic landslide susceptibility zoning results was evaluated using the Area Under the ROC Curve. The ROC curve plots the true positive rate against the false positive rate under various threshold values. AUC values ranges from 0.5 to 1.0, where values greater than 0.7 indicate good model performance and values exceeding 0.9 suggest excellent predictive accuracy [65].
In this study, 30% of the landslide initiation points (4,115 in total) were randomly selected as the testing dataset. Slope units were extracted using the hydrological analysis method in the ArcGIS (Figure 2), resulting in 44,018 units across the study area. Excluding the slopes containing all landslide initiation point from the training and testing sets, the study area's elevation raster layer was used as the base map. After excluding units containing all training or testing landslides, raster center points with the highest elevation in each slope were extracted as landslide initiation points, yielding 30,513 samples. For slope units lacking raster center point coverage, a total of 8,846 slope center points were extracted. During data preprocessing, 180 slope units near the boundary of the study area were identified as lacking valid raster center points and were thus excluded. The remaining 43,838 slope units were retained, from which 4,115 landslide initiation points were randomly selected to form the testing dataset for model validation. Using the multi-value extraction tool, susceptibility index values corresponding to the testing points were obtained. Subsequently, the ROC curve was plotted and the AUC value was calculated. As shown in Figure 11, the AUC value of 0.8445 demonstrates a high level of accuracy for the coseismic landslide susceptibility zoning model.
5. Discussion
5.1. Controlling factors of the coseismic landslides
The high and very high susceptibility zones of landslides triggered by the Luding earthquake show a strong consistency with the actual distribution of coseismic landslides interpreted through remote sensing (Figure 10 and Figure 11), validating the accuracy of the coseismic landslide susceptibility zones presented in this study. The results indicate that the elevation variation coefficient is the primary controlling factor for coseismic landslides. The elevation variation coefficient, which is the ratio of the standard deviation of elevation to the mean elevation, reflects the degree of surface erosion and incision within the region. A higher elevation variation coefficient indicates more significant surface erosion and incision [66]. There is a clear positive correlation between the susceptibility of coseismic landslides and the elevation variation coefficient (Figure 4H), meaning that regions with more pronounced surface erosion and incision typically reflect higher tectonic activity, intense river downcutting, and the development of steep slopes. Additionally, it suggests that these slopes have experienced long-term unloading deformation, with highly developed rock mass fractures, resulting in poor overall rock quality and lower strength, conditions that are conducive to the occurrence of coseismic landslides. Furthermore, Yang et al. proposed using two quantitative geomorphic parameters, slope gradient and elevation variation coefficient, to identify active faults [67]. They discovered that in the high mountain gorge region of the Yarlung Tsangpo River, east of Namcha Barwa, the elevation variation coefficient map revealed discontinuous, linear low-value bands along active fractured fault zones. A similar phenomenon was observed in this study at the location of the Xianshuihe Fault zone, reinforcing the applicability of using the elevation variation coefficient as a quantitative geomorphic parameter to identify active faults. Additionally, the high elevation variation coefficient of the slopes on both sides of the Xianshuihe Fault at this location indicates severe slope erosion, providing material sources for the development of large landslides near the fault zone. This also reflects the basic fact that the rocks along the fault's fractured zone are less resistant to erosion than the surrounding bedrock.
Slope aspect emerged as the second most important factor, likely due to three reasons. First, research on the 2008 Wenchuan earthquake found that slopes aligned with the direction of fault movement were more susceptible to landslides [68]. A similar pattern was observed in landslides triggered by the Luding earthquake, where the initial slope directions of most landslides in the western mountain gorge region were S, SE, and E, consistent with the SE strike-slip direction of the fault (Figure 3C), further supporting this observation. This reflects that the SE extension of the seismogenic fault was a primary cause of landslides, as seismic surface waves encountered free faces, where wave reflection and other effects caused tension cracks and ejection failures in the slope’s surface rock. Second, remote sensing images (Figure 1) show that in the western mountain gorge region of the study area, most coseismic landslides developed on sunward-facing slopes, with very few on shaded slopes. Snow cover was observed on shaded mountain tops, indicative of glacial geomorphology. Glaciers can play a role in moderating seismic activity and controlling landslide scale. Where glacier thickness approaches local slope height, glaciers can reduce the topographic amplification effect of seismic shaking [69]. Sunward-facing slopes, exposed to solar radiation, had melted snow cover, and glacier retreat exposed steeper, higher terrain, enhancing the topographic amplification of seismic shaking [66]. This amplification effect is most pronounced near steep slopes, mountain tops, and ridges [70,71]. Third, as shown in Figures 4N and 4I, in the western part of the study area, vegetation cover was found to be lower on shaded slopes and higher on sunward-facing slopes. Coseismic landslides primarily developed on hard rocks, such as quartzite and granite. Roots of plants can secrete organic acids that absorb minerals from rocks, altering their composition. Roots can infiltrate rock fissures, gradually expanding them. This process, particularly in already fractured rocks, can cause rock disintegration, providing ample material for coseismic landslide development. In summary, the role of slope aspect as the second most important factor is driven by a complex mechanism that integrates multiple factors influencing the development of coseismic landslides.
Slope gradient is the third most important factor, with a clear positive correlation between the susceptibility to coseismic landslides and slope gradient (Figure 4C). This finding aligns with the distribution patterns of landslides triggered by the 2008 Wenchuan earthquake, the 2010 Yushu earthquake, and the 2017 Jiuzhaigou earthquake, where slope gradient also held significant weight in the susceptibility studies of coseismic landslides [28,70,71]. Steeper slopes are more unstable, and thus, have higher susceptibility to coseismic landslides. Distance to rivers is the factor with the lowest weight. As shown in Figure 3M, in the western part of the study area, the Hailiu River and Sala Pond River, two tributaries of the Dadu River, are far from the seismogenic fault. Both the elevation variation coefficient and slope gradient are small, indicating gentle slopes and low topographic relief, which result in a sparse distribution of coseismic landslides, reducing the influence of rivers on landslides. The elevation variation coefficient, derived from elevation factors, reflects geomorphological differences. Roads and faults are located near valleys, and from the valley to the mountain peak, elevation increases with distance from roads and faults. Furthermore, seismic waves have an elevation amplification effect: the higher the elevation, the greater the PGA. Therefore, elevation, the elevation variation coefficient, distance to roads, PGA, and distance to faults are highly correlated. Seismic energy is typically concentrated near the epicenter. In the central and northern parts of the study area, PGA generally decreases with increasing distance from the epicenter. Plan curvature and profile curvature describe the terrain features in the horizontal and vertical directions. Coseismic landslides tend to develop on convex or concave surfaces in the horizontal direction and at curvature transition points in the profile (Figures 3D and 3E). Surface dissection depth and terrain relief describe the degree of surface erosion and topographic variation, both of which are factors reflecting geomorphological differences. The greater the surface dissection, the more steep and tall slopes develop. These slopes tend to have a long history of unloading deformation, with highly fractured rock masses, which promote the occurrence of coseismic landslides. Therefore, epicentral distance is strongly correlated with PGA, plan curvature, profile curvature, surface cutting degree, and topographic relief.
5.2. Influence of the seismogenic fault
The spatial distribution of coseismic landslides in Figure 1 reveals that the orientation of the Dadu River’s tributary valleys on the western side of the study area is nearly perpendicular to the Xianshuihe Fault. Furthermore, the "locked section" of the Xianshuihe Fault, where large landslides are densely concentrated, is clearly observable. This is highly consistent with the "locked section effect" proposed by Xu and Li based on the distribution characteristics of landslides from the 2008 Wenchuan earthquake [72]. Earthquakes typically release accumulated energy through strong shaking or surface deformation, with the energy most concentrated near the seismogenic fault [1]. The "locked section effect" occurs when the locked section is displaced during the earthquake and further sheared and ruptured, releasing additional energy. This results in more intense local shaking, forming secondary seismic sources and leading to the concentrated development of large landslides [72]. Therefore, the phenomenon of densely developed large landslides induced by the Luding earthquake in the locked section of the Xianshuihe Fault further corroborates that the Xianshuihe Fault is the seismogenic fault for this event. The 1999 Chi-Chi Mw 7.6 earthquake in Taiwan, the 2005 Kashmir Mw 7.6 earthquake in Pakistan, and the 2008 Wenchuan earthquake all exhibited the hanging wall effect, where more large landslides developed on the hanging wall of the thrust fault than on the footwall. The number of landslides on the western side of the Xianshuihe Fault is greater than on the eastern side [9]. This observation aligns with the fact that most aftershocks of the Luding earthquake occurred on the western side of the Xianshuihe Fault [73]. This is considered an indication of the hanging wall effect, leading to the hypothesis that the Xianshuihe Fault exhibits both strike-slip and thrust motion. To verify this hypothesis, we conducted field investigations and discovered traces of thrust-fold contact between the hanging wall of the Xianshuihe Fault and the fault zone (Figure 12). The measured strike and dip of the fault zone were 256°∠42°. After the Luding earthquake, some research teams processed InSAR data and obtained coseismic surface displacements. The results showed a maximum uplift of approximately 15 cm on the west side of the Xianshuihe Fault and a maximum subsidence of 14 cm on the east side [73,74]. Furthermore, the results of coseismic fault modeling indicated that the deformation field in the epicentral area and to the north was dominated by sinistral strike-slip motion, with a minor thrust component [75,76]. In light of the above findings, we propose that the Moxi segment of the Xianshuihe Fault may include a thrust component in its kinematics. This hypothesis requires further verification by future research teams.
5.3. Research Prospects and Disaster Mitigation Recommendations
Landslide inventories are crucial data for landslide susceptibility assessment, especially the quality of the landslide inventory [77]. The quality of a landslide inventory depends on various factors, such as scale, data collection, and the quality of remote sensing imagery [78]. However, most existing landslide inventories are incomplete, as they do not distinguish between landslide initiation zones and deposition zones [79]. In this study, we updated the landslide inventory for the Luding coseismic landslides based on remote sensing imagery and field investigations. We extracted the highest elevation points of the landslide polygons as the initiation zones of the coseismic landslides [69], using these as input for the model to improve the quality of the Luding coseismic landslide inventory.
From an administrative unit perspective, the zones with the highest susceptibility to landslides induced by the Luding earthquake are primarily concentrated in the townships of Tianwan, Caoke, Detuo, and Moxi. These townships show high landslide susceptibility, and efforts should be made to enhance InSAR-based hazard identification and dynamic monitoring of deformed bodies to prevent further exacerbation of potential landslide hazards during rainfall. In the Wandong Township area, the fractured slope rock mass, influenced by the Xianshuihe Fault Zone, has led to a high density of landslides. A large number of landslide deposits have formed a small barrier dam in the upper reaches of the Wandong River. Although the dam has breached, a substantial amount of loose material remains in the riverbed, which could easily trigger debris flows during rainfall events. This poses a significant challenge for post-earthquake reconstruction, highlighting the need for special attention to the potential geological disaster chain risks in this area. In contrast to the monotonic use of a single method for evaluating coseismic landslide susceptibility by other scholars [28,71,80], this study applied the AHP-FR-Pearson coupled algorithm to assess the landslides triggered by the Luding earthquake. The FR method reduced the subjectivity inherent in AHP, while the Pearson coefficient method minimized the correlation between influencing factors. The results indicate that the susceptibility map obtained using the AHP-FR-Pearson coupled algorithm achieved a prediction accuracy of 84.45%. The database used in this study is relatively large. In future research, we plan to apply more complex algorithms, such as random forests and convolutional neural networks.
6. Conclusions
This study applied the AHP-FR-Pearson coupled algorithm to conduct a susceptibility assessment of coseismic landslides triggered by the 2022 Luding Ms 6.8 earthquake, based on landslide initiation points data. In addition, the controlling factors affecting the spatial distribution of coseismic landslides were systematically analyzed. The main conclusions are as follows:
(1) An updated landslide inventory associated with the Luding earthquake was developed, identifying 13,717 landslides across the study area, with a cumulative area of 39.27 km².
(2) The study area was classified into five susceptibility levels, with very high and high susceptibility zones concentrated along the Dadu River and the Moxi segment of the Xianshuihe Fault. Particularly, towns such as Tianwan, Caoke, Detuo, and Moxi fall within the very high susceptibility zone, warranting focused landslide hazard investigations.
(3) The elevation variation coefficient, slope aspect, and slope gradient are the main controlling factors of coseismic landslide distribution. Coseismic landslide susceptibility is highest when the elevation variation coefficient is between 0.1 and 0.134, the slope aspect is southeast, and the slope gradient ranges from 70° to 76.63°.
(4) The coseismic landslide susceptibility model established using the FR-AHP-Pearson models achieved a prediction accuracy of 0.8445, indicating high accuracy, and can be widely applied in coseismic landslide susceptibility assessment.
Author Contributions
Conceptualization, M.Z. and Z.S.; methodology, J.W. and M.Z.; validation, J.W. and T.L.; formal analysis, J.W. and M.Z.; investigation, J.W. and M.L.; resources, M.Z. and C.X.; data curation, M.Z.; writing—original draft preparation, J.W. and M.Z.; writing—review and editing, M.Z., C.X. and Z.S.; project administration, M.Z. and Z.S.; funding acquisition, M.Z. All authors have read and agreed to the published version of the manuscript.
Funding
This research was funded by the National Natural Science Foundation of China (grant nos. 42207215 and 41825018).
Data Availability Statement
The original contributions presented in the study are included in the article; further inquiries can be directed to the corresponding authors.
Acknowledgments
The authors thank the National Natural Science Foundation of China (Grant Nos. 42207215 and 41825018). We also appreciate the insightful comments from the reviewing experts and academic editor, which significantly enhanced the quality of this manuscript.
Conflicts of Interest
The authors declare no competing interests.
References
- Keefer, D.K. Landslides caused by earthquakes. Geol. Soc. Am. Bull. 1984, 95, 406–421. [Google Scholar] [CrossRef]
- Deng, Q.D.; Zhang, P.Z.; Ran, Y.K.; Yang, X.P.; Min, W.; Chen, L.C. Active tectonics and earthquake activities in china. Geosci. Front. 2003, 10, 66–73. [Google Scholar]
- Xu, C.; Xu, X.W.; Dai, F.C.; Wu, Z.D.; He, H.L.; Shi, F.; Wu, X.Y.; Xu, S.N. Application of an incomplete landslide inventory, logistic regression model and its validation for landslide susceptibility mapping related to the May 12, 2008 Wenchuan earthquake of China. Nat. Hazards. 2013, 68, 883–900. [Google Scholar] [CrossRef]
- Xu, C.; Xu, X.W.; Wu, X.Y.; Dai, F.C.; Yao, X.; Yao, Q. Detailed catalog of landslides triggered by the 2008 Wenchuan earthquake and statistical analyses of their spatial distribution. J. Eng. Geol. 2013, 21, 25–44. [Google Scholar]
- Fan, X.M.; Wang, X.; Dai, L.X.; Fang, C.Y.; Deng, Y.; Zou, C.B.; Tang, M.G.; Wei, Z.L.; Dou, X.Y.; Zhang, J.; et al. Characteristics and spatial distribution pattern of M S 6.8 Luding earthquake occurred on September 5, 2022. J. Eng. Geol. 2022, 30, 1504–1516. [Google Scholar]
- Xiao, Z.; Xu, C.; Huang, Y.; He, X.; Shao, X.; Chen, Z.; Xie, C.; Li, T.; Xu, X. Analysis of Spatial Distribution of Landslides Triggered by the Ms 6.8 Luding Earthquake in China on September 5, 2022. Geoenvironmental Disasters 2023, 10, 3. [Google Scholar] [CrossRef]
- Ma, S.; Lu, Y.; Xia, C.; Liu, X.; Qi, W.; Yuan, R. Brief Report of Landslides Triggered by the 2022 Ms 6.8 Luding Earthquake, Sichuan, China. Landslides 2023, 20, 2695–2707. [Google Scholar] [CrossRef]
- Ma, S.; Shao, X.; Xu, C.; Chen, X.; Lu, Y.; Xia, C.; Qi, W.; Yuan, R. Distribution Pattern, Geometric Characteristics and Tectonic Significance of Landslides Triggered by the Strike-Slip Faulting 2022 Ms 6.8 Luding Earthquake. Geomorphology 2024, 453, 109138. [Google Scholar] [CrossRef]
- Shao, X.; Ma, S.; Xu, C.; Xie, C.; Li, T.; Huang, Y.; Huang, Y.; Xiao, Z. Landslides Triggered by the 2022 Ms. 6.8 Luding Strike-Slip Earthquake: An Update. Eng. Geol. 2024, 335, 107536. [Google Scholar] [CrossRef]
- Sun, Y.K. Stability analysis of slopes in rock. Chinese Journal of Rock Mechanics and Engineering 1986, 5, 91G102. [Google Scholar]
- Tang, C.; Huang, C.X.; Wan, Y. Lijiang Earthquake and the induced rockfalls and slumps in Yunnan. Journal of Natural Disasters 1997, 6, 76–84. [Google Scholar]
- Tang, R.X.; Kulatilake, P.H.S.W.; Yan, E.C.; Cai, J.S. Evaluating Landslide Susceptibility Based on Cluster Analysis, Probabilistic Methods, and Artificial Neural Networks. Bull. Eng. Geol. Environ. 2020, 79, 2235–2254. [Google Scholar] [CrossRef]
- Lee, S.; Talib, J.A. Probabilistic Landslide Susceptibility and Factor Effect Analysis. Environ. Geol. 2005, 47, 982–990. [Google Scholar] [CrossRef]
- Wang, L.; Chang, M.; Xing, Y.L. Risk assessment of landslide geological hazards based on information method model and GIS. Hazards. Environ. Prot. 2021, 14–20. [Google Scholar]
- Chen, J.; Li, J.; Qin, X.; Dong, Q.; Sun, Y. RS and GIS-Based Statistical Analysis of Secondary Geological Disasters after the 2008 Wenchuan Earthquake. Acta. Geologica. Sinica – English. Edition. 2009, 83, 776–785. [Google Scholar] [CrossRef]
- Xu, C.; Dai, F.C.; Xu, S.N.; Xu, X.W.; He, H.L.; Wu, X.Y.; Shi, F. Application of logistic regression model on the Wenchuan earthquake triggered landslide hazard mapping and its validation. Hydrogeology and Engineering Geology 2013, 40, 98–104. [Google Scholar]
- Zhang, Y.B.; Xu, P.F.; Lin, J.F.; Wu, X.N.; Liu, J.; Xiang, C.L.; He, Y.Y.; Yang, C.F.; Xu, C. Earthquake-triggered landslide susceptibility prediction in Jiuzhaigou based on BP neural network. J. Eng. Geol. 2024, 32, 133–145. [Google Scholar]
- Xu, C.; Dai, F.; Xu, X.; Lee, Y.H. GIS-Based Support Vector Machine Modeling of Earthquake-Triggered Landslide Susceptibility in the Jianjiang River Watershed, China. Geomorphology 2012, 145–146, 70–80. [Google Scholar] [CrossRef]
- Terzaghi, K.; Peck, R.B.; Mesri, G. Soil Mechanics in Engineering Practice; John Wiley & Sons, 1996; ISBN 978-0-471-08658-1.
- Newmark, N.M. Effects of Earthquakes on Dams and Embankments. Géotechnique 1965, 15, 139–160. [Google Scholar] [CrossRef]
- Jibson, R.W.; Harp, E.L.; Michael, J.A. A Method for Producing Digital Probabilistic Seismic Landslide Hazard Maps. Eng. Geol. 2000, 58, 271–289. [Google Scholar] [CrossRef]
- Zang, M.; Qi, S.; Zou, Y.; Sheng, Z.; Zamora, B.S. An Improved Method of Newmark Analysis for Mapping Hazards of Coseismic Landslides. Nat. Hazards Earth Syst. Sci. 2020, 20, 713–726. [Google Scholar] [CrossRef]
- Clough, R.W.; Chopra, A.K. Earthquake Stress Analysis in Earth Dams. Journal of the Engineering Mechanics Division 1966, 92, 197–211. [Google Scholar] [CrossRef]
- Clough, R.W.; Pirtz, D. Earthquake Resistance of Rock-Fill Dams. Journal of the Soil Mechanics and Foundations Division 1956, 82, 1–26. [Google Scholar] [CrossRef]
- Yang, G.; Qi, S.; Wu, F.; Zhan, Z. Seismic Amplification of the Anti-Dip Rock Slope and Deformation Characteristics: A Large-Scale Shaking Table Test. Soil. Dyn. Earthq. Eng. 2018, 115, 907–916. [Google Scholar] [CrossRef]
- He, J.; Qi, S.; Zhan, Z.; Guo, S.; Li, C.; Zheng, B.; Huang, X.; Zou, Y.; Yang, G.; Liang, N. Seismic Response Characteristics and Deformation Evolution of the Bedding Rock Slope Using a Large-Scale Shaking Table. Landslides 2021, 18, 2835–2853. [Google Scholar] [CrossRef]
- Zang, M.D.; Yang, G.X.; Dong, J.Y.; Qi, S.W.; He, J.X.; Liang, N. Experimental Study on Seismic Response and Progressive Failure Characteristics of Bedding Rock Slopes. J. Rock. Mech. Geotech. 2022, 14, 1394–1405. [Google Scholar] [CrossRef]
- Xu, C.; Dai, F. C.; Yao, X.; Chen, J.; Tu, X. B.; Sun, Y.; Wang, Z. Y. GIS-based landslide susceptibility assessment using analytical hierarchy process in Wenchuan earthquake region. Chinese Journal of Rock Mechanics and Engineering 2009, 28, 3978–3985. [Google Scholar]
- Saaty, R.W. The Analytic Hierarchy Process—What It Is and How It Is Used. Mathematical Modelling 1987, 9, 161–176. [Google Scholar] [CrossRef]
- Zou, F. B.; Fu, Z.; Fan, L. F.; Wu, H.; Guo, Z. Evaluation of landslide susceptibility in eastern Tibet based on frequency ratio and AHP model. Journal of Natural Disasters 2023, 32, 235–242. [Google Scholar]
- Saaty, T.L. A Scaling Method for Priorities in Hierarchical Structures. Journal of Mathematical Psychology 1977, 15, 234–281. [Google Scholar] [CrossRef]
- Cheng, S. P.; Wang, R. Y. Analyzing hazard potential of typhoon damage by applying grey analytic hierarchy process. Nat. Hazard. 2004, 33, 77–103. [Google Scholar] [CrossRef]
- Zhang, G.; Cai, Y.; Zheng, Z.; Zhen, J.; Liu, Y.; Huang, K. Integration of the Statistical Index Method and the Analytic Hierarchy Process Technique for the Assessment of Landslide Susceptibility in Huizhou, China. Catena 2016, 142, 233–244. [Google Scholar] [CrossRef]
- Gorsevski, P.V.; Jankowski, P.; Gessler, P.E. An heuristic approach for mapping landslide hazard by integrating fuzzy logic with analytic hierarchy process. Control. Cybern. 2006, 35, 121–146. [Google Scholar]
- Lang, L.; Fu-bao, Z. A Comprehensive Hazard Evaluation System for Spontaneous Combustion of Coal in Underground Mining. Int. J. Coal. Geol. 2010, 82, 27–36. [Google Scholar] [CrossRef]
- Nefeslioglu, H.A.; Sezer, E.A.; Gokceoglu, C.; Ayas, Z. A Modified Analytical Hierarchy Process (M-AHP) Approach for Decision Support Systems in Natural Hazard Assessments. Comput. Geosci-UK. 2013, 59, 1–8. [Google Scholar] [CrossRef]
- Sarmah, T.; Das, S.; Narendr, A.; Aithal, B.H. Assessing Human Vulnerability to Urban Flood Hazard Using the Analytic Hierarchy Process and Geographic Information System. Int. J. Disast. Risk. Re. 2020, 50, 101659. [Google Scholar] [CrossRef]
- Luu, C.; Von Meding, J.; Kanjanabootra, S. Assessing Flood Hazard Using Flood Marks and Analytic Hierarchy Process Approach: A Case Study for the 2013 Flood Event in Quang Nam, Vietnam. Nat. Hazards. 2018, 90, 1031–1050. [Google Scholar] [CrossRef]
- Stefanidis, S.; Stathis, D. Assessment of Flood Hazard Based on Natural and Anthropogenic Factors Using Analytic Hierarchy Process (AHP). Nat. Hazards. 2013, 68, 569–585. [Google Scholar] [CrossRef]
- Kohno, M.; Higuchi, Y.; Ono, Y. Evaluating Earthquake-Induced Widespread Slope Failure Hazards Using an AHP-GIS Combination. Nat. Hazards. 2022, 116, 1485–1512. [Google Scholar] [CrossRef]
- Tie, Y.B.; Zhang, X.Z.; Lu, J.Y.; Liang, J.T.; Wang, D.H.; Ma, Z.G.; Li, Z.L.; Lu, T.; Shi, S.W.; Liu, M.S.; et al. Characteristics of geological hazards and it’s mitigations of the Ms6. 8 earthquake in Luding County, Sichuan Province. Hydrogeology & Engineering Geology 2022, 49, 1–12. [Google Scholar]
- Wang, X.; Fang, C.Y.; Tang, X.C.; Dai, L.X.; Fan, X.M.; Xu, Q. Research on emergency evaluation of landslides induced by the Luding Ms 6.8 earthquake. Geomatics and Information Science of Wuhan University 2023, 48, 25–35. [Google Scholar]
- Peng, J.B.; Ma, R.Y.; Lu, Q.Z.; Li, X.A.; Shao, T.Q. Geological hazards effects of uplift of Qinghai-Tibet Plateau. Advances in Earth Science 2004, 19, 457–466. [Google Scholar]
- Harrison, T.M.; Copeland, P.; Kidd, W.S.F.; Yin, A. Raising Tibet. Science 1992, 255, 1663–1670. [Google Scholar] [CrossRef]
- Chen, F.B. Hengduan event: An important tectonic event of the late Cenozoic in eastern Asia. J. Mt. Res. 1992, 4, 195–204. [Google Scholar]
- Cui, Z.; Wu, Y.; Liu, G.; Ge, D.; Pang, Q.; Xu, Q. On Kunlun-Yellow River Tectonic Movement. Sci. China Ser. D-Earth Sci. 1998, 41, 592–600. [Google Scholar] [CrossRef]
- Zhang, Y.; Chen, W.; Yang, N. 40Ar/39Ar Dating of Shear Deformation of the Xianshuihe Fault Zone in West Sichuan and Its Tectonic Significance. Sci. China. Ser. D. 2004, 47, 794–803. [Google Scholar] [CrossRef]
- Li, J.J. The Environmental Effects of the Uplift of the Qinghai-Xizang Plateau. Quaternary Science Reviews 1991, 10, 479–483. [Google Scholar]
- Bai, M.; Chevalier, M.L.; Leloup, P.H.; Li, H.; Pan, J.; Replumaz, A.; Wang, S.; Li, K.; Wu, Q.; Liu, F.; et al. Spatial Slip Rate Distribution Along the SE Xianshuihe Fault, Eastern Tibet, and Earthquake Hazard Assessment. Tectonics 2021, 40, e2021TC006985. [Google Scholar] [CrossRef]
- Bai, M.; Chevalier, M.L.; Pan, J.; Replumaz, A.; Leloup, P.H.; Métois, M.; Li, H. Southeastward Increase of the Late Quaternary Slip-Rate of the Xianshuihe Fault, Eastern Tibet. Geodynamic and Seismic Hazard Implications. Earth. Planet. Sc. Lett. 2018, 485, 19–31. [Google Scholar] [CrossRef]
- Huang, Y.; Xie, C.; Li, T.; Xu, C.; He, X.; Shao, X.; Xu, X.; Zhan, T.; Chen, Z. An Open-Accessed Inventory of Landslides Triggered by the MS 6.8 Luding Earthquake, China on September 5, 2022. Earthq. Res. Adv. 2023, 3, 100181. [Google Scholar] [CrossRef]
- Huang, F.; Yao, C.; Liu, W.; Li, Y.; Liu, X. Landslide Susceptibility Assessment in the Nantian Area of China: A Comparison of Frequency Ratio Model and Support Vector Machine. Geomat. Nat. Haz. Risk. 2018, 9, 919–938. [Google Scholar] [CrossRef]
- Kumar, A.; Sharma, R.K.; Bansal, V.K. GIS-Based Comparative Study of Information Value and Frequency Ratio Method for Landslide Hazard Zonation in a Part of Mid-Himalaya in Himachal Pradesh. Innov. Infrastruct. Solut. 2019, 4, 28. [Google Scholar] [CrossRef]
- Pradhan, B.; Lee, S. Delineation of Landslide Hazard Areas on Penang Island, Malaysia, by Using Frequency Ratio, Logistic Regression, and Artificial Neural Network Models. Environ. Earth. Sci. 2010, 60, 1037–1054. [Google Scholar] [CrossRef]
- Rogers, G.S. A Course in Theoretical Statistics. Technometrics 1969. [Google Scholar] [CrossRef]
- Gokceoglu, M.E. , Candan Assessment of Landslide Susceptibility for a Landslide-Prone Area (North of Yenice, NW Turkey) by Fuzzy Approach. Environ. Geol. 2002, 41, 720–730. [Google Scholar] [CrossRef]
- Ma, S.; Chen, J.; Wu, S.; Li, Y. Landslide Susceptibility Prediction Using Machine Learning Methods: A Case Study of Landslides in the Yinghu Lake Basin in Shaanxi. Sustainability. 2023, 15, 15836. [Google Scholar] [CrossRef]
- Ma, S.; Shao, X.; Xu, C. Potential Controlling Factors and Landslide Susceptibility Features of the 2022 Ms 6.8 Luding Earthquake. Remote. Sens. 2024, 16, 2861. [Google Scholar] [CrossRef]
- Atkinson, P.M.; Massari, R. Autologistic Modelling of Susceptibility to Landsliding in the Central Apennines, Italy. Geomorphology 2011, 130, 55–64. [Google Scholar] [CrossRef]
- Guo, Z.Z.; Yin, K.L.; Huang, F.M.; Fu, S.; Zhang, W. Evaluation of landslide susceptibility based on landslide classification and weighted frequency ratio model. Chinese Journal of Rock Mechanics and Engineering 2019, 38, 287–300. [Google Scholar]
- Huang, F.M.; Yin, K.L.; Jiang, S.H.; Huang, J.S.; Cao, Z.S. Landslide susceptibility assessment based on clustering analysis and support vector machine. Chinese Journal of Rock Mechanics and Engineering 2018, 37, 156–167. [Google Scholar]
- Wang, Y.; Yuan, R.M. Evaluation of landslide susceptibility in Qiaojia section of the Jinsha River Based on frequency ratio and AHP model. Journal of Hebei GEO University 2023, 46, 131–140. [Google Scholar]
- Ma, S.; Chen, J.; Wu, S. Distribution characteristics and susceptibility assessment of landslide hazard in Yinghu Town, Ankang City, Shanxi Province. Geoscience 2023, 1–17. [Google Scholar]
- Gao, H.X.; Yin, K.L. Discuss on the correlations between landslides and rainfall and threshold for landslide early-warning and prediction. Rock. Soil. Mech. 2007, 28, 1055–1060. [Google Scholar]
- Lee, S.; Pradhan, B. Landslide Hazard Mapping at Selangor, Malaysia using frequency ratio and logistic regression models. Landslides 2007, 4, 33–41. [Google Scholar] [CrossRef]
- Ou, Y.X. Study on Regional Terrain Factors of Soil Erosion. Master, Northwest University, 2011.
- Yang, X.P.; Wang, P.; Li, X.F.; Xie, C.; Zhou, B.G.; Huang, X.N. Application of topographic slope and elevation variation coefficient in identifying the motuo active fault zone. Seismol. Egology. 2019, 41, 419–435. [Google Scholar]
- Chen, X.L.; Hui, H.J.; Zhao, Y.H. Study on the fault mechanics influences on the landslides distribution: a case study from the Wenchuan earthquake. Seismology and Geology 2014, 36(2), 358–367. [Google Scholar]
- Gorum, T.; Fan, X.; van Westen, C.J.; Huang, R.Q.; Xu, Q.; Tang, C.; Wang, G. Distribution Pattern of Coseismic landslides Triggered by the 12 May 2008 Wenchuan Earthquake. Geomorphology 2011, 133, 152–167. [Google Scholar] [CrossRef]
- Ma, S.Y.; Xu, C.; Tian, Y.Y.; Xu, X.W. Application of logistic regression model for hazard assessment of earthquake-triggered landslides: a case study of 2017 Jiuzhaigou (China) Ms7.0 event. Seismology and Egology 2019, 41, 162–177. [Google Scholar]
- Xu, C.; Xu, X.W. Logistic regression model and its validation for hazard mapping of landslides triggered by Yushu earthquake. J. Eng. Geol. 2012, 20, 326–333. [Google Scholar]
- Xu, Q.; Li, W.L. Distribution of large-scale landslides induced by the Wenchuan earthquake. J. Eng. Geol. 2010, 18, 818–826. [Google Scholar]
- Han, B.Q.; Liu, Z.J.; Chen, B.; Li, Z.H.; Yu, C.; Zhang, Y.; Peng, J.B. Coseismic deformation and slip distribution of the 2022 Luding M W 6.6 earthquake revealed by InSAR observations. Geomatics and Information Science of Wuhan University 2023, 48, 36–46. [Google Scholar]
- Meng, Q.; Wang, Z.; Zhang, H. Seismicity Changes and Numerical Simulation of Coseismic Deformation Following the 2022 Ms6.8 Luding Earthquake in Sichuan, China. Sci. China Earth Sci. 2024, 67, 2507–2521. [Google Scholar] [CrossRef]
- Xu, J.; Ji, L.Y.; Liu, C.J. Regional deformation background and coseismic deformation characteristics of the 2022 Luding Ms 6.8 earthquake. Seismology and Egology 2024, 46, 645–664. [Google Scholar]
- Liang, H.; Wu, Y.; Shao, Z.; Li, J.; Li, Y.; Yi, S.; Yang, F.; Zhuang, W.; Wang, H.; Zhan, W.; et al. Coseismic Slip and Deformation Mode of the 2022 Mw 6.5 Luding Earthquake Determined by GPS Observation. Tectonophysics 2023, 865, 230042. [Google Scholar] [CrossRef]
- Chang, K.T.; Merghadi, A.; Yunus, A.P.; Pham, B.T.; Dou, J. Evaluating Scale Effects of Topographic Variables in Landslide Susceptibility Models Using GIS-Based Machine Learning Techniques. Sci. Rep. 2019, 9, 12296. [Google Scholar] [CrossRef]
- Guzzetti, F.; Mondini, A.C.; Cardinali, M.; Fiorucci, F.; Santangelo, M.; Chang, K.T. Landslide Inventory Maps: New Tools for an Old Problem. Earth-Sci. Rev. 2012, 112, 42–66. [Google Scholar] [CrossRef]
- Korup, O.; Stolle, A. Landslide Prediction from Machine Learning. Geology Today 2014, 30, 26–33. [Google Scholar] [CrossRef]
- Liu, L.N.; Xu, C.; Xu, X.W.; Chen, J. GIS-based landslide hazard evaluation using AHP method in the 2013 Lushan earthquake region. Journal of catastrophology 2014, 29, 183–191. [Google Scholar]
Figure 1.
Map of the study area showing the inventoried landslides.
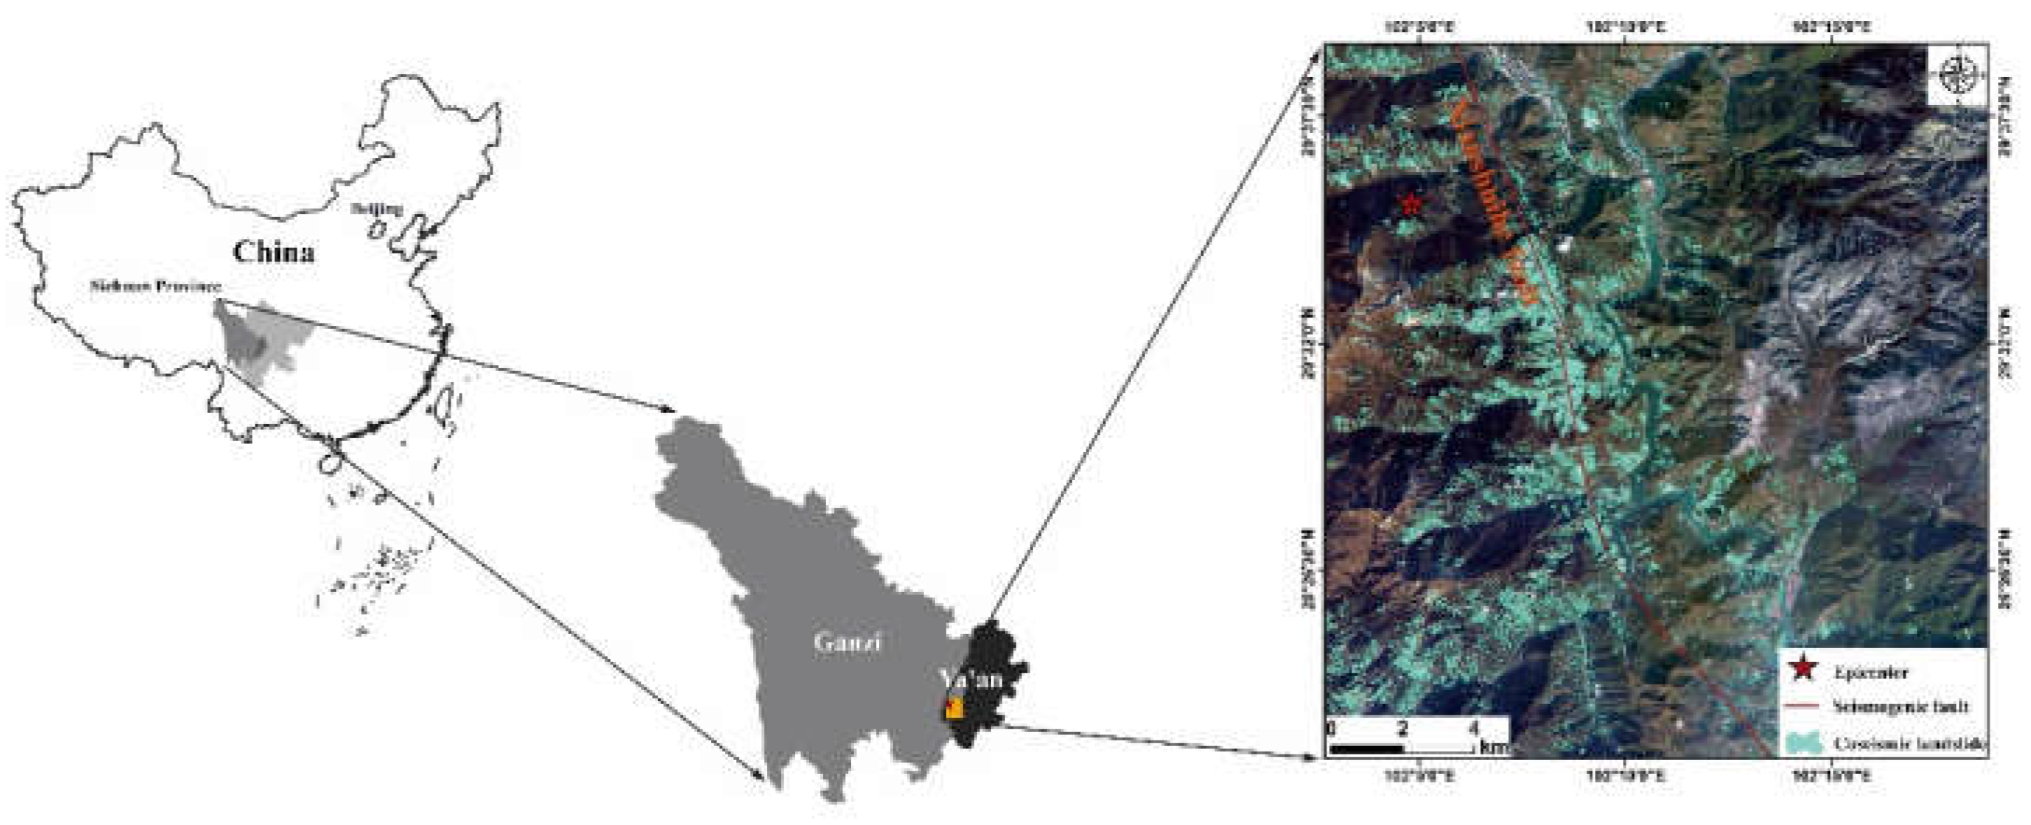
Figure 2.
Technical route map for coseismic landslide susceptibility assessment in Luding.
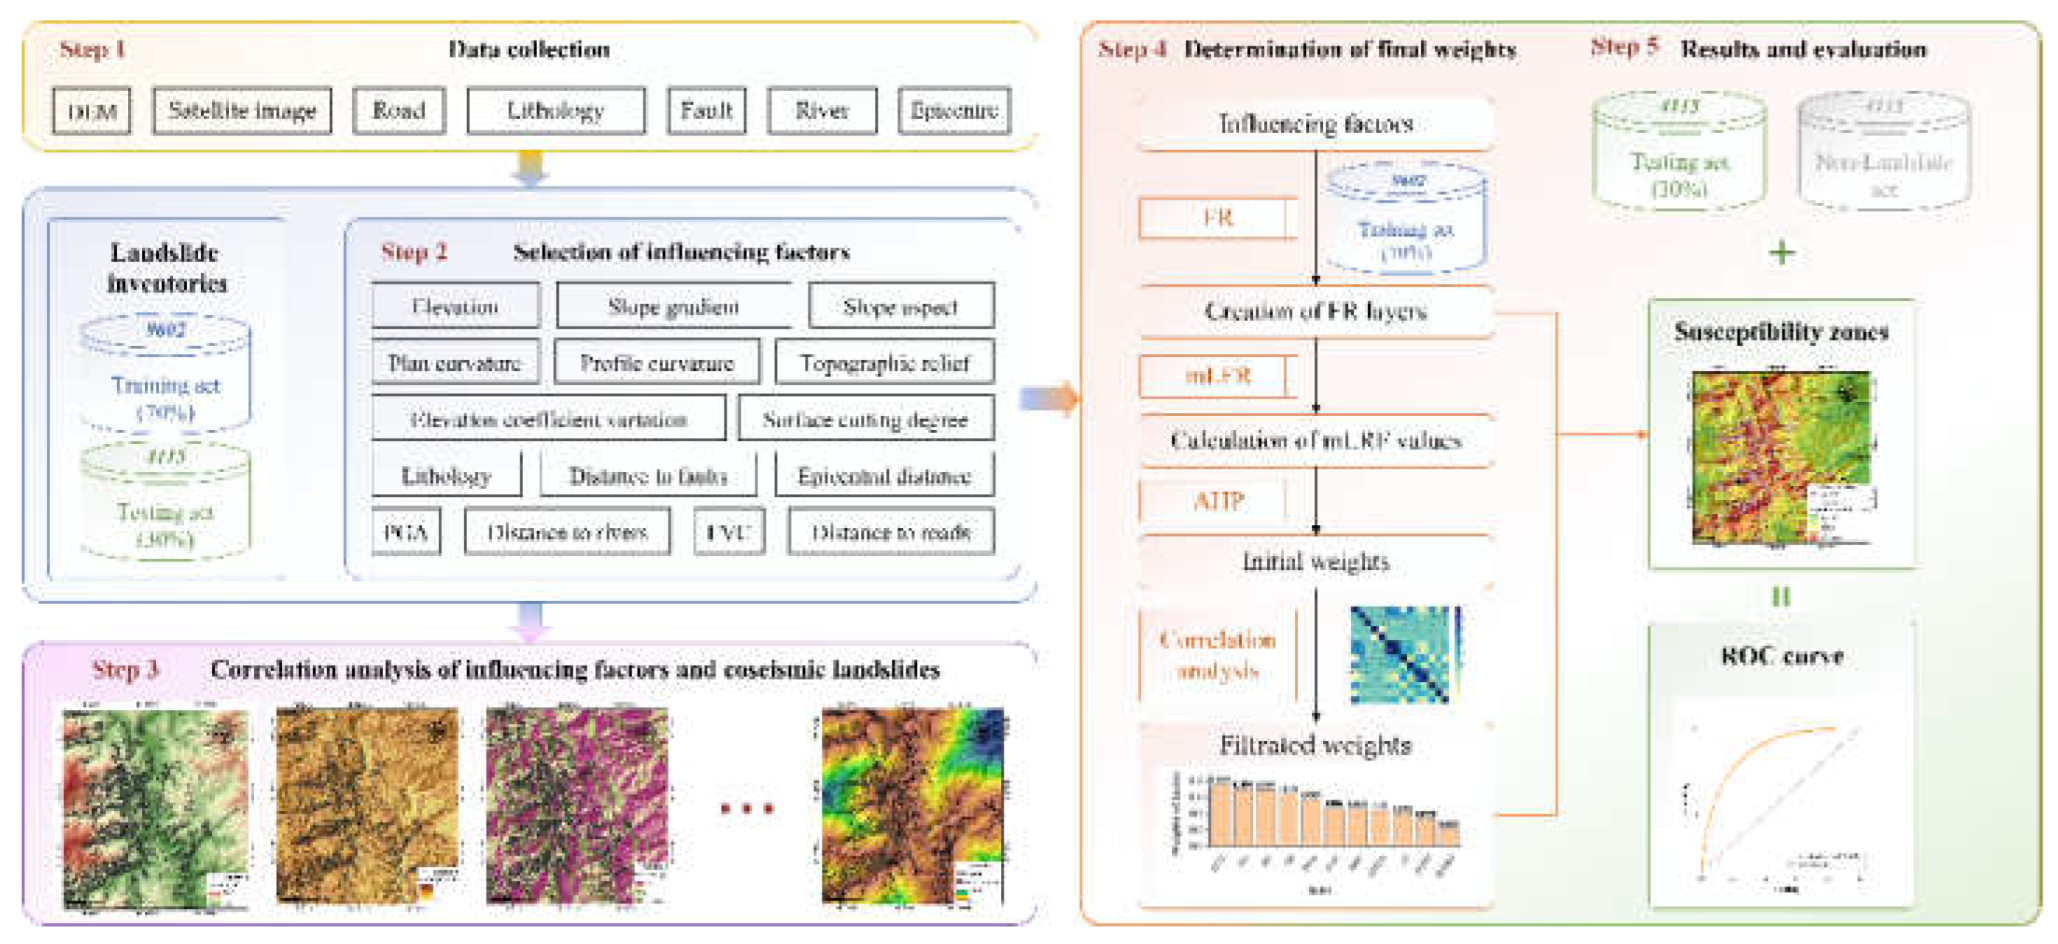
Figure 3.
Spatial distribution of coseismic landslide susceptibility factors (A. Elevation;B. Slope gradient;C. Slope aspect;D. Plan curvature;E. Profile curvature;F. Surface cutting degree;G. Topographic relief;H. Elevation coefficient variation;I. Lithology;J. Distance to faluts;K. Epicentral distance;L. PGA;M. Distance to rivers;N. FVC;O. Distance to roads).
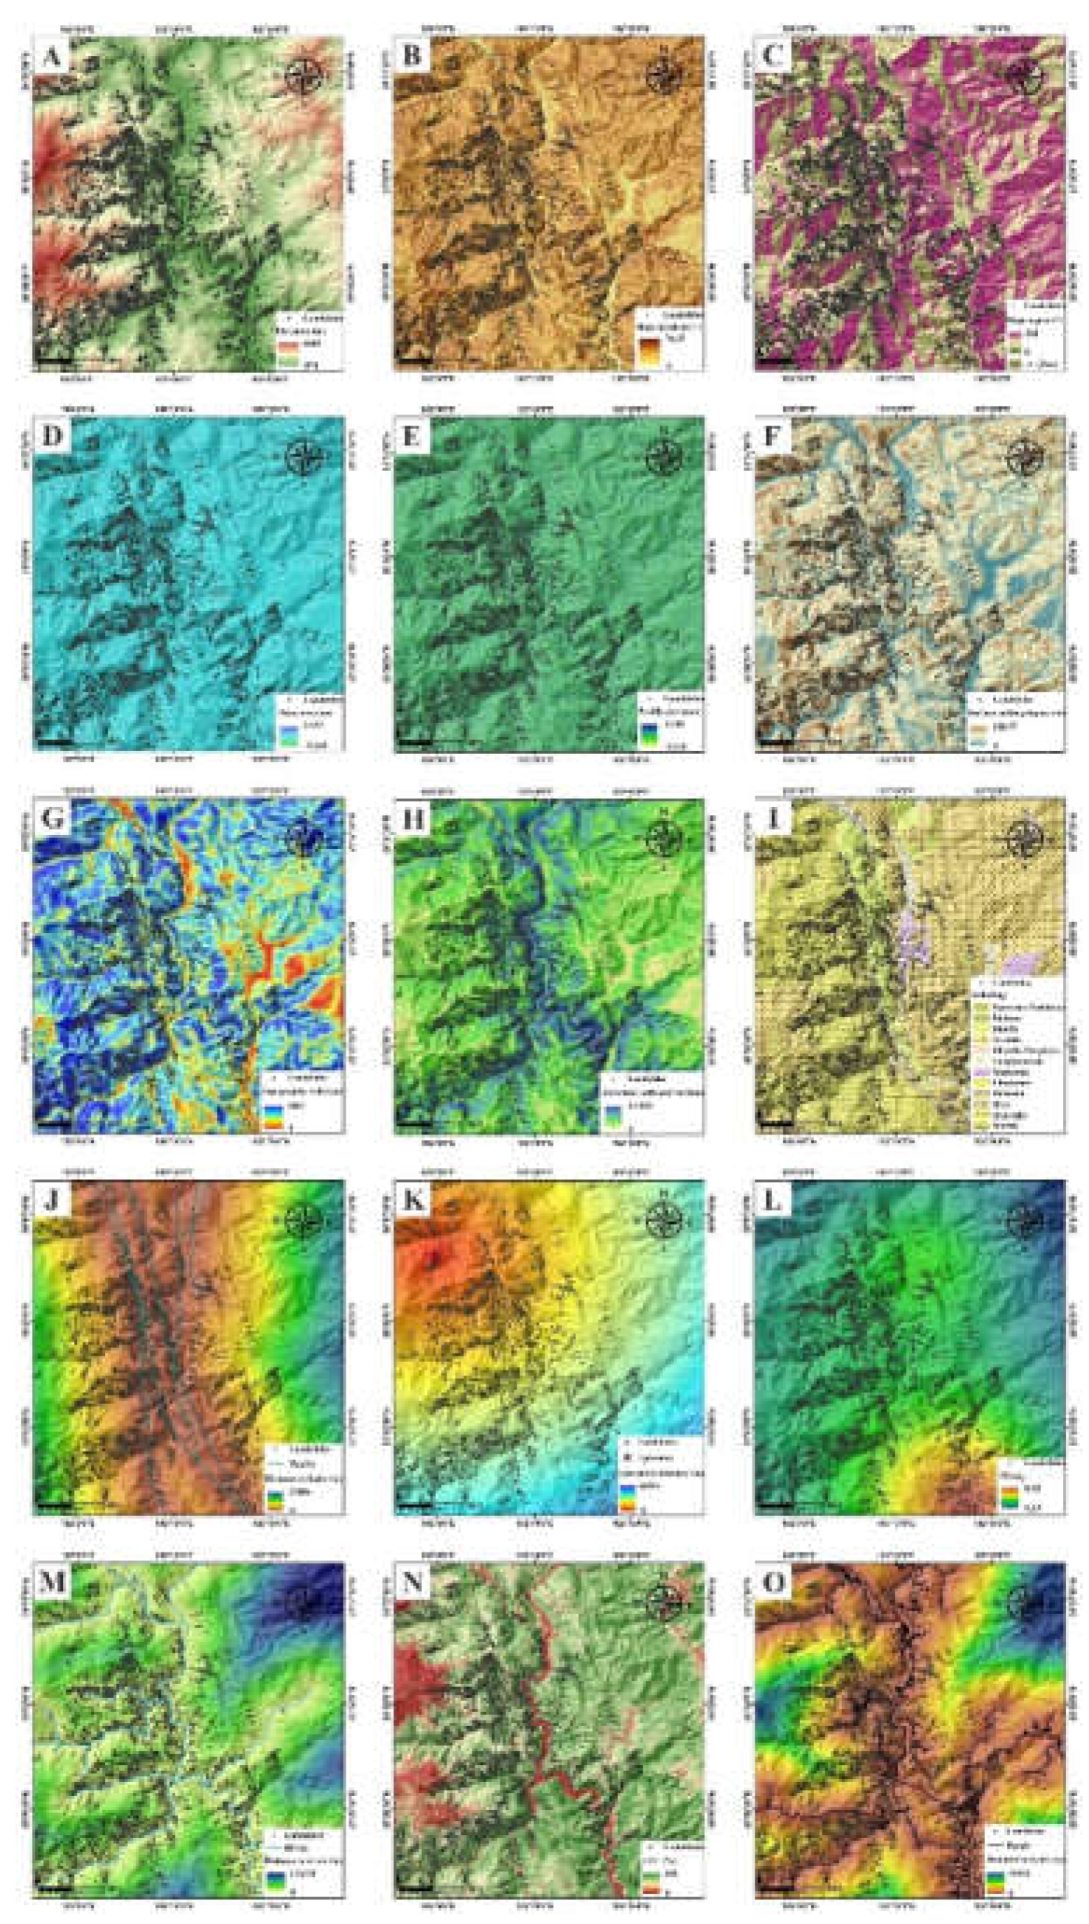
Figure 4.
Relationship between factor zoning and landslide distribution in the study area (A. Elevation;B. Slope gradient;C. Slope aspect;D. Plan curvature;E. Profile curvature;F. Surface cutting degree;G. Topographic relief;H. Elevation coefficient variation;I. Lithology;J. Distance to faluts;K. Epicentral distance;L. PGA;M. Distance to rivers;N. FVC;O. Distance to roads)
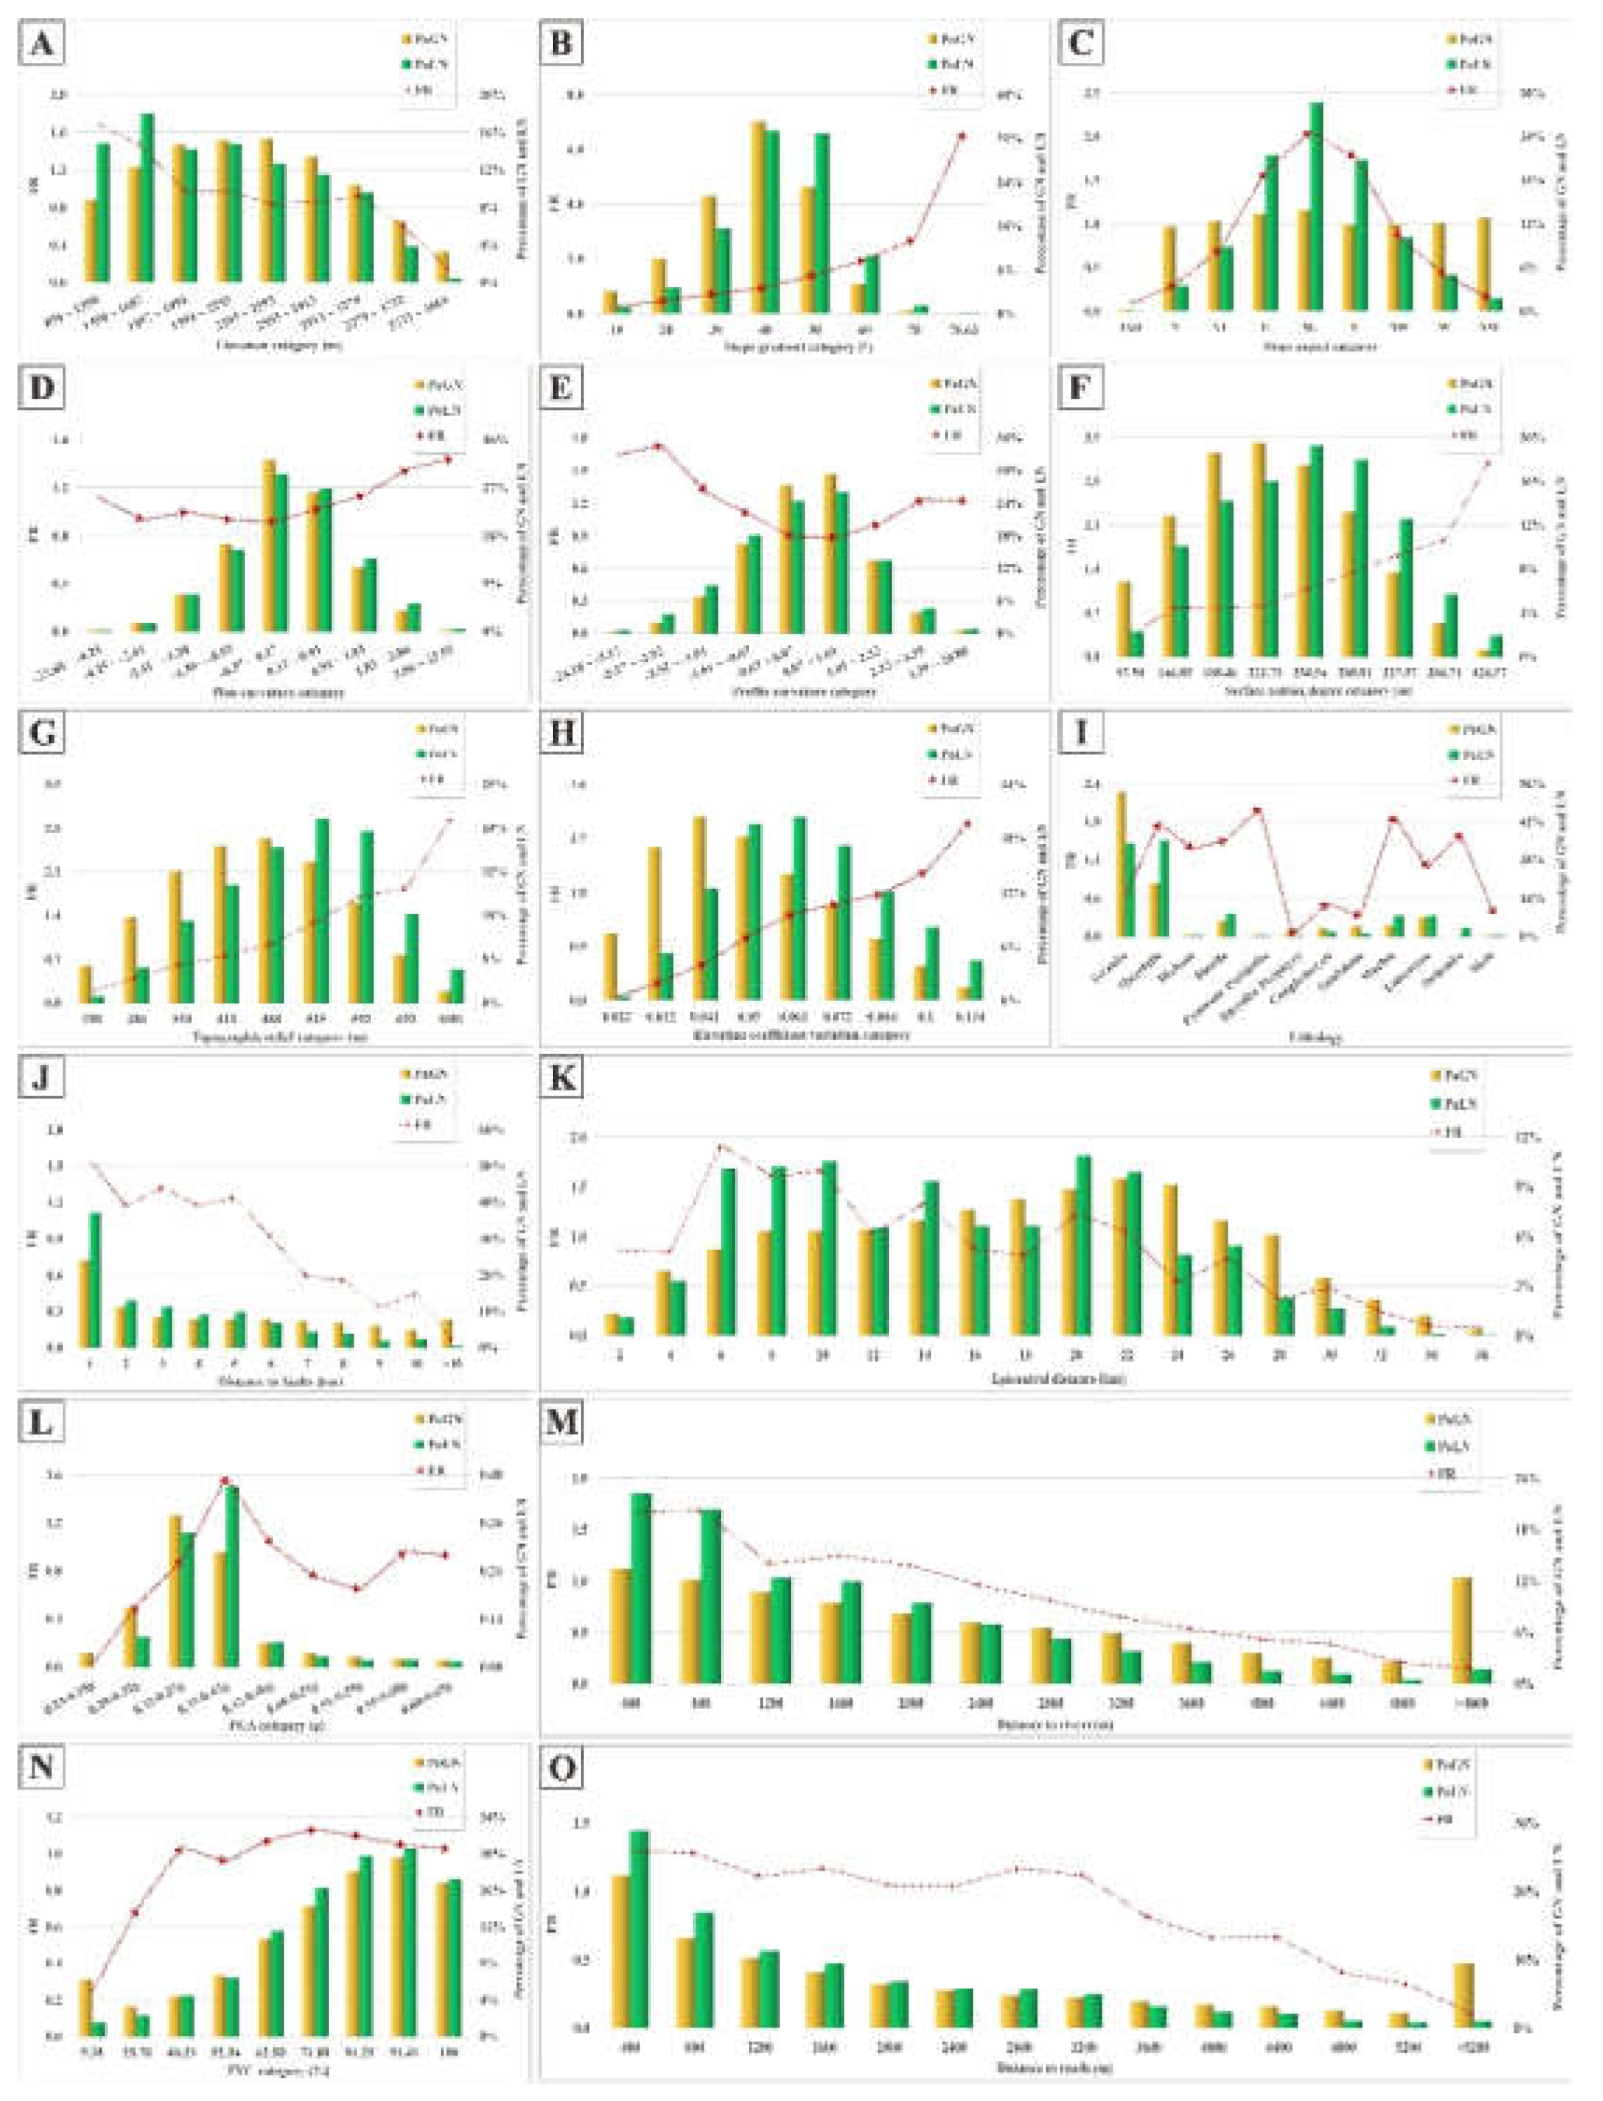
Figure 7.
Pearson correlation coefficient matrix (a. Elevation;b. Slope gradient;c. Slope aspect;d. Plan curvature;e. Profile curvature;f. Surface cutting degree;g. Topographic relief;h. Elevation coefficient variation;j. Distance to faluts;k. Epicentral distance;l. PGA;m. Distance to rivers;n. FVC;o. Distance to roads)
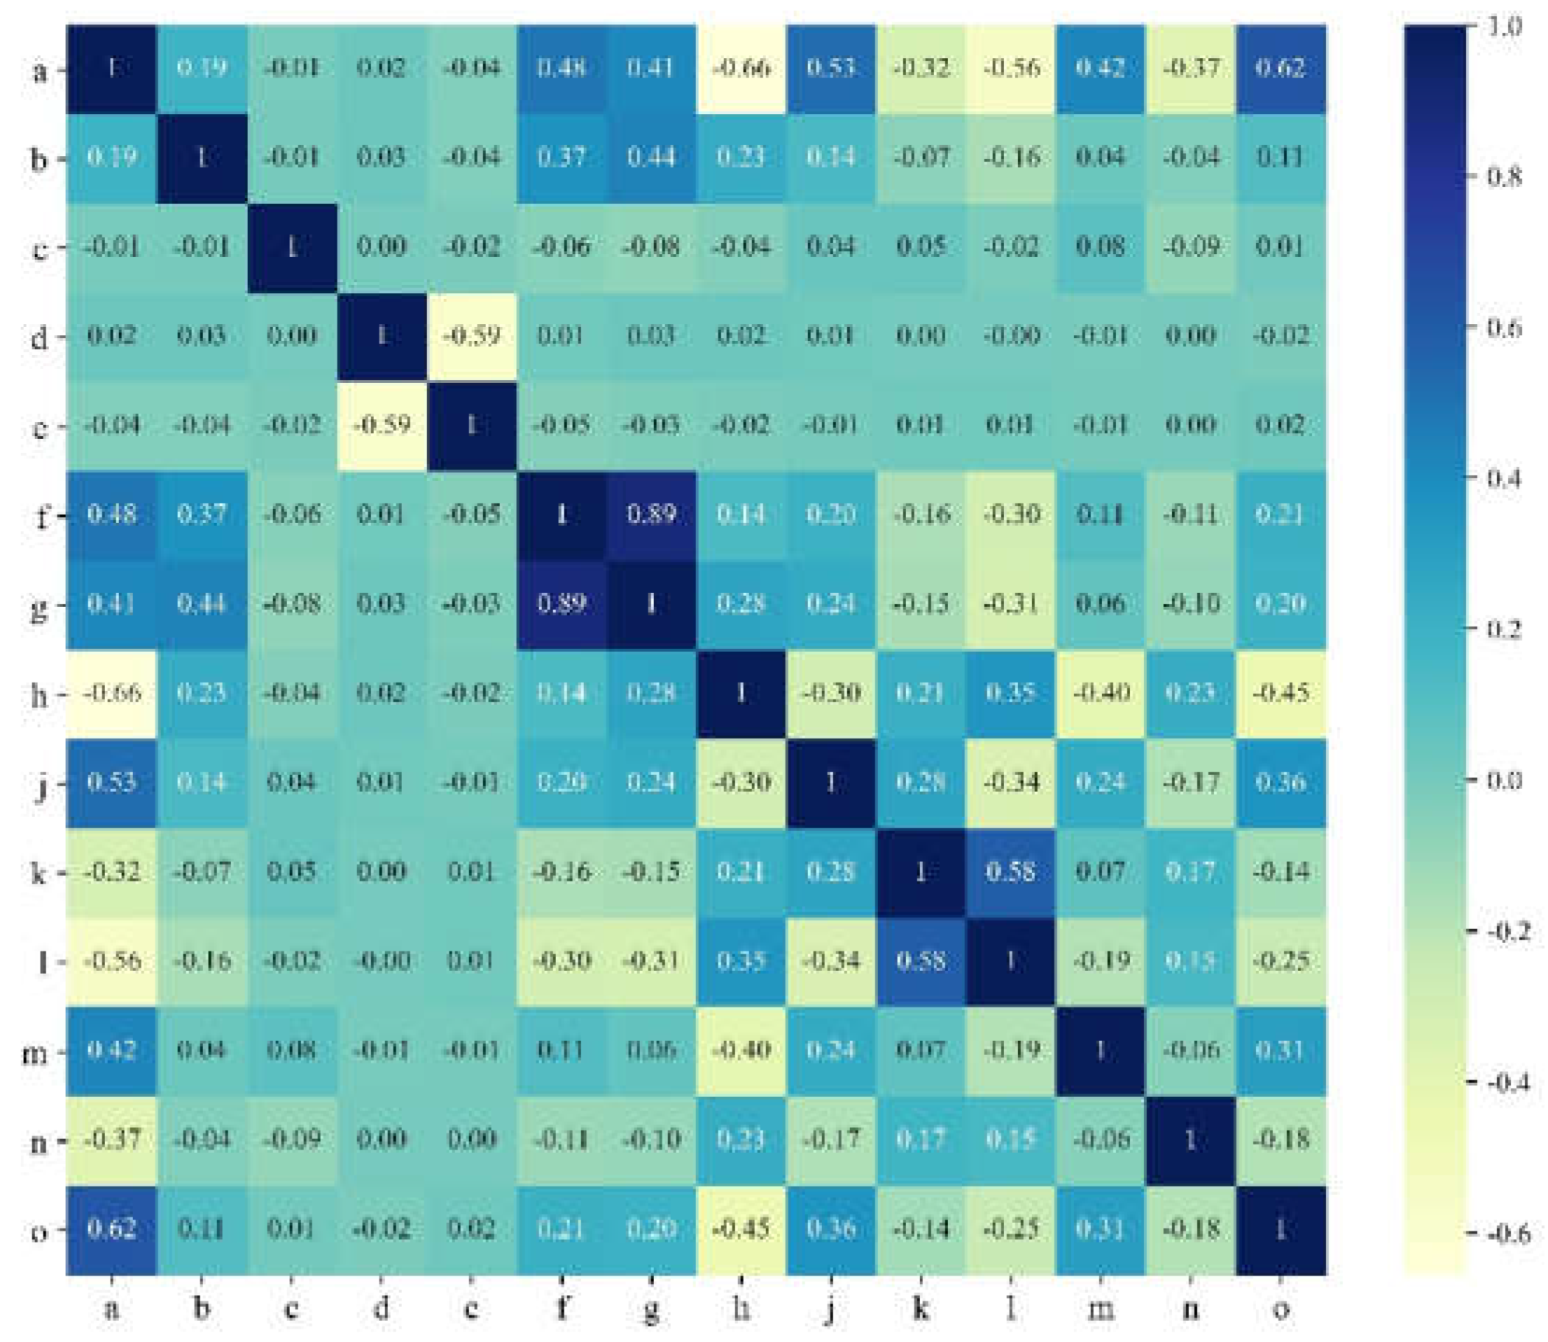
Figure 8.
Filtrated ranking of influence factors by weight (ECV. Elevation coefficient variation;SA. Slope aspect;SG. Slope gradient;TR. Topographic relief;PGA. Peak ground acceleration; FVC. Fractional vegetation cover;PRC. Profile curvature;DTFA. Distance to faults;LI. Lithology;DTRI. Distance to rivers;DTRO. Distance to roads)
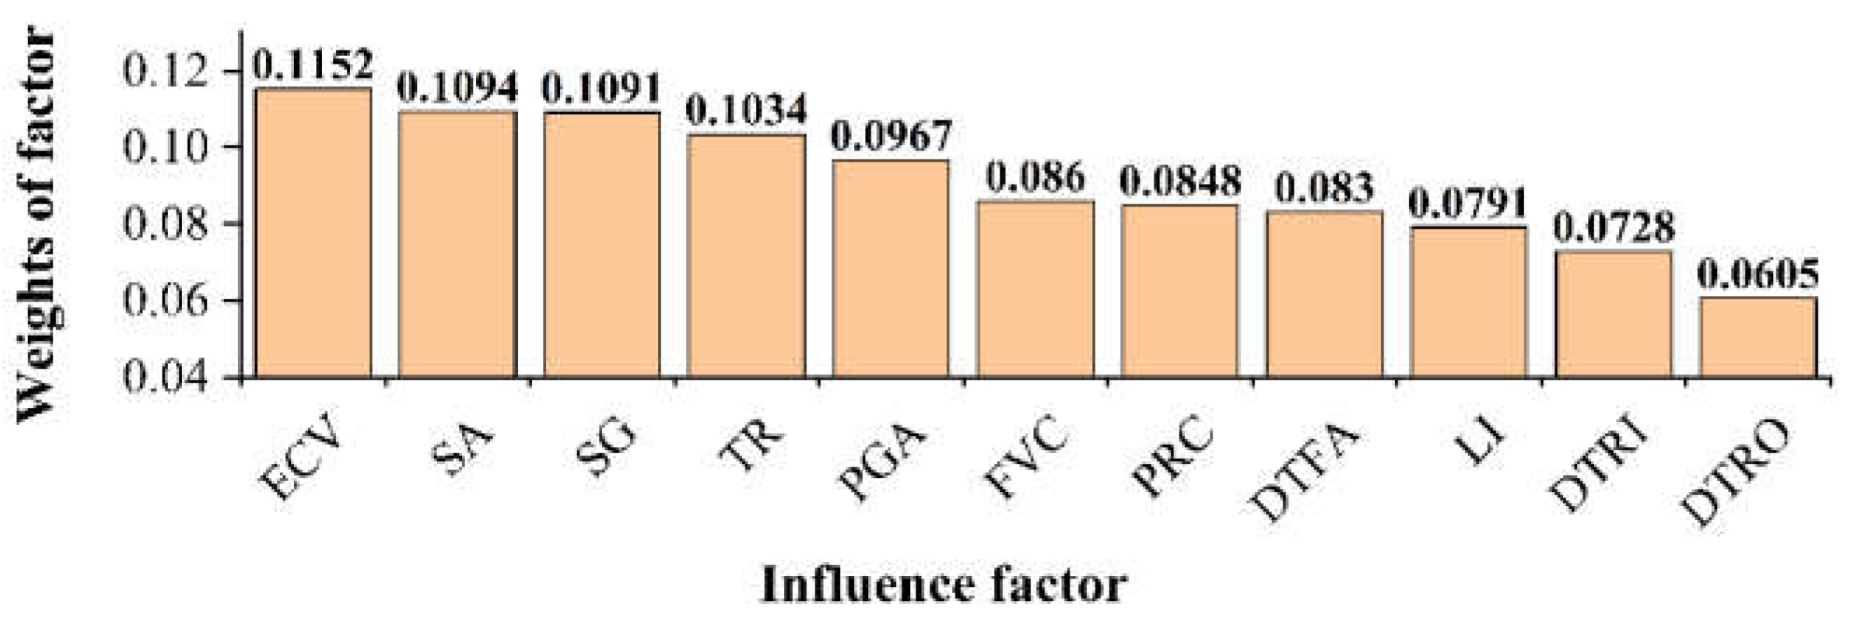
Figure 9.
Luding coseismic landslide susceptibility zoning map
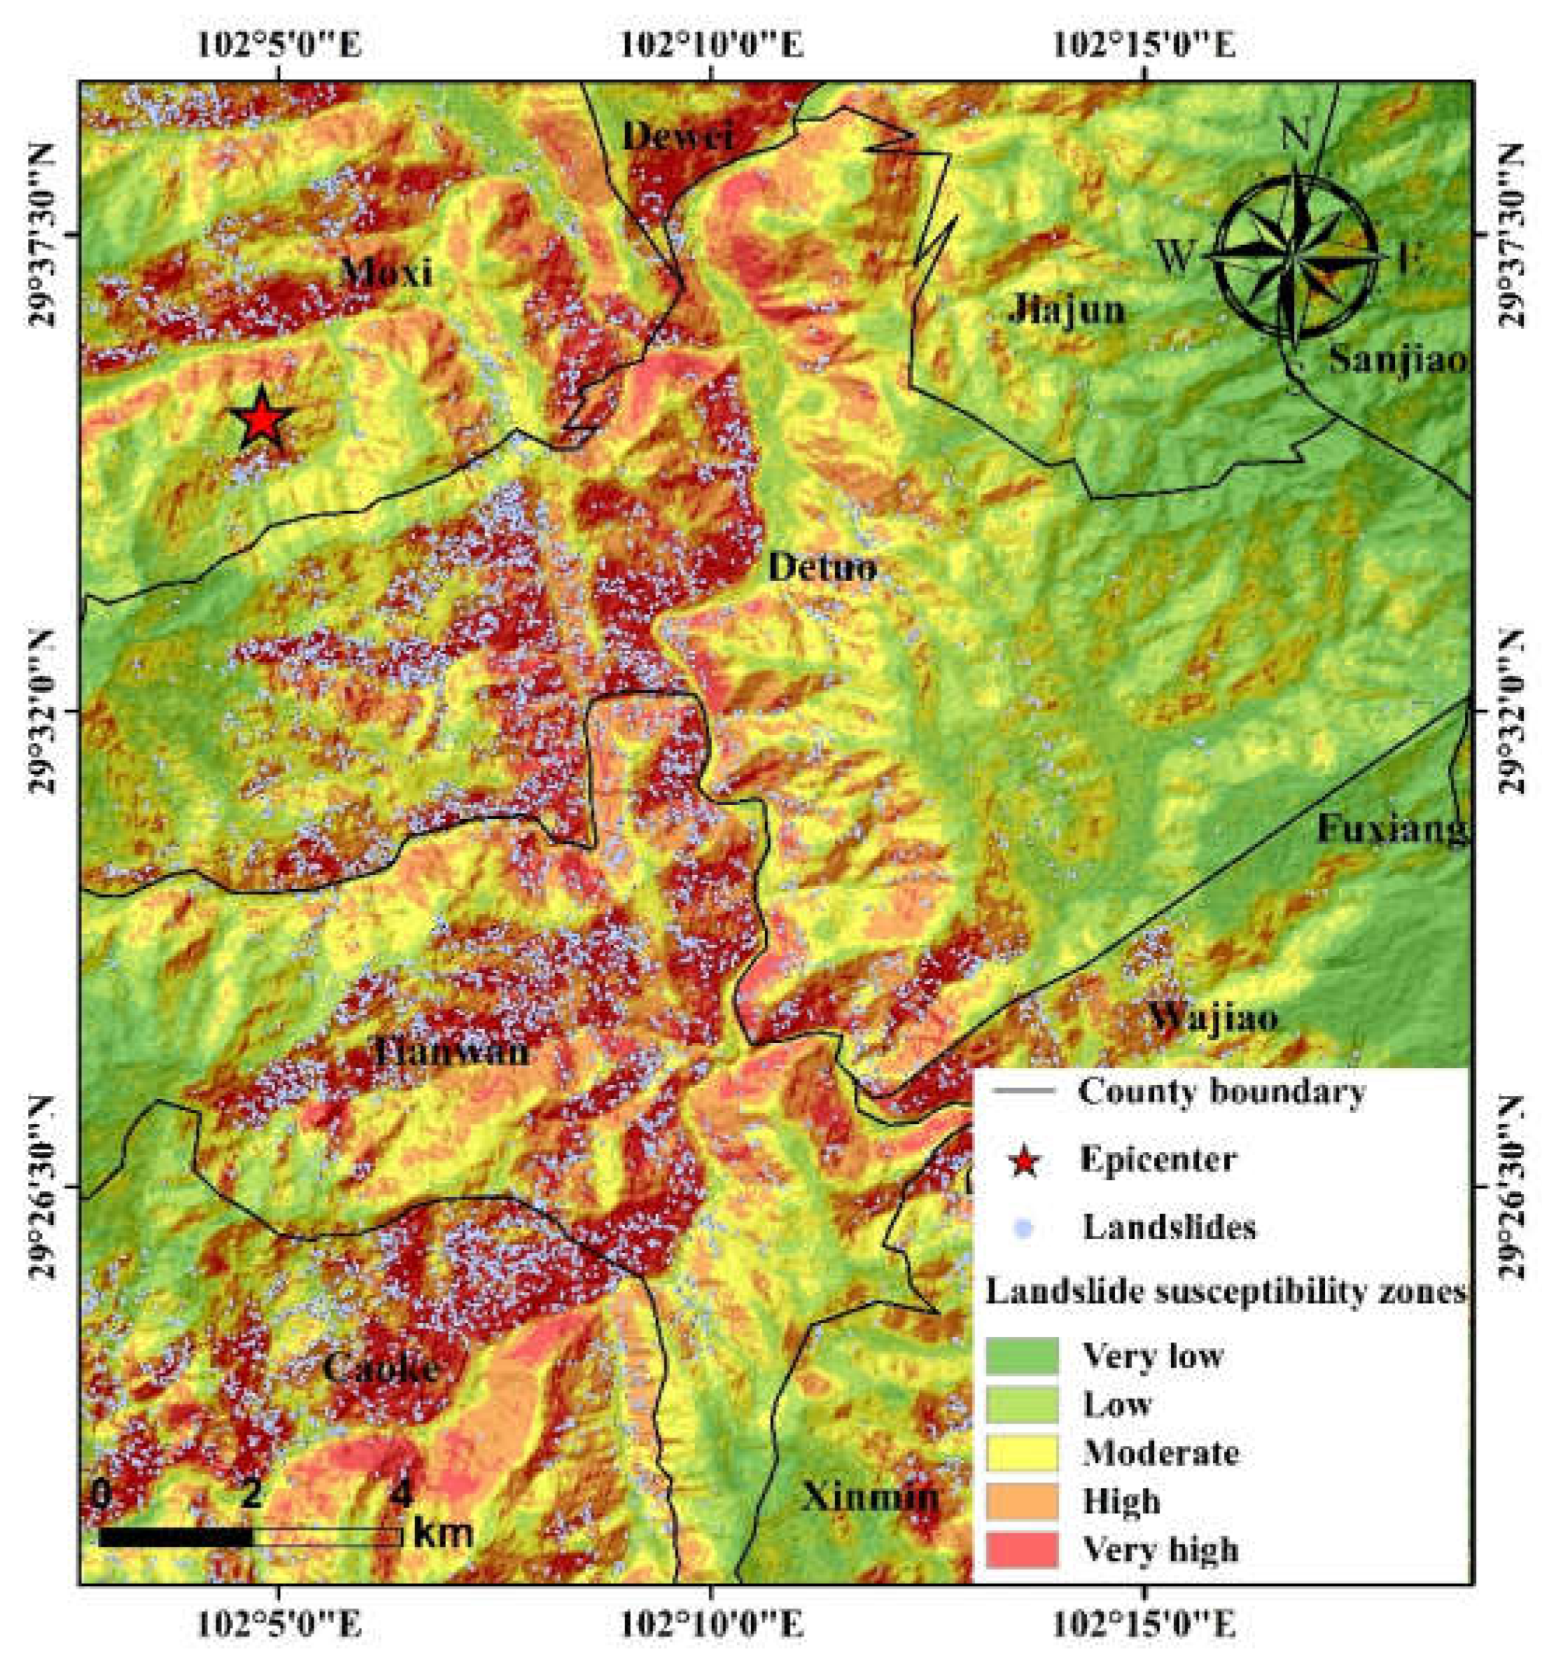
Figure 10.
Luding seismic landslide susceptibility zoning statistical chart

Figure 11.
The ROC curve of susceptibility assessment model in the study area
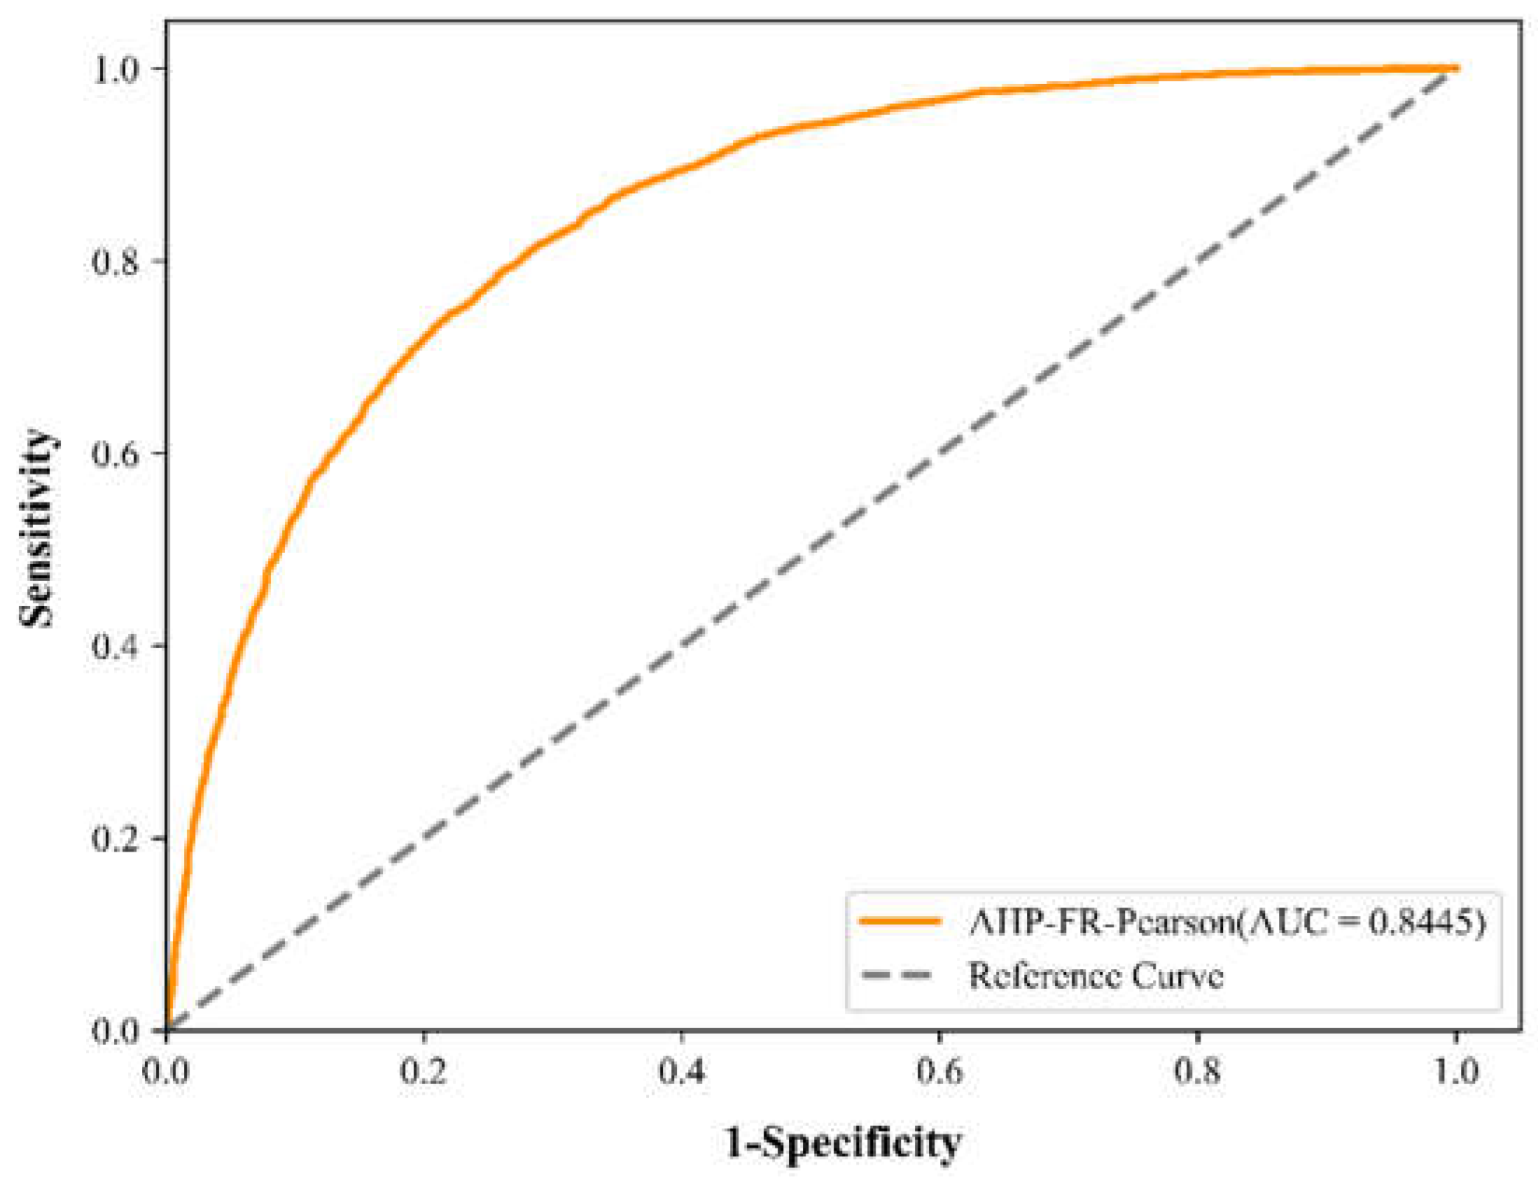
Figure 12.
a. Location map of the Xianshuihe Fault. b. The exposed fault on the left bank of Shiyue River
Figure 12.
a. Location map of the Xianshuihe Fault. b. The exposed fault on the left bank of Shiyue River
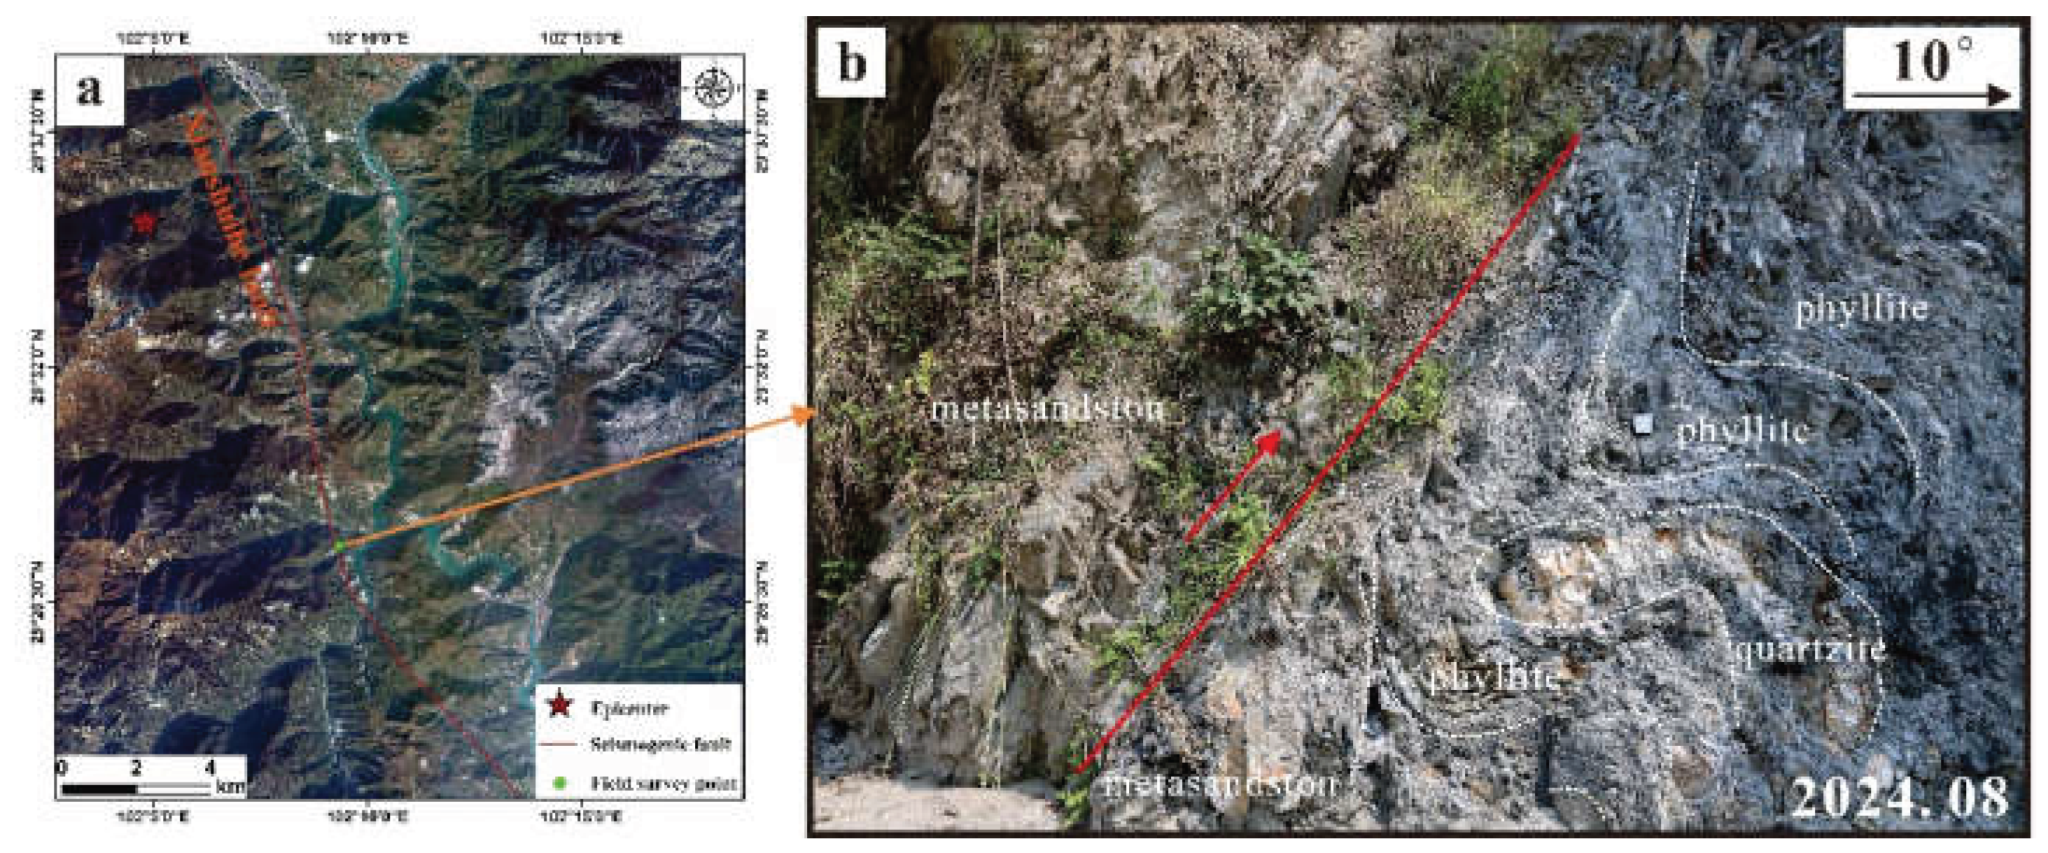

Table 1.
Sources of data required for the coseismic landslide susceptibility assessment
| Data | Source | Spatial Resolution |
| Coseismic landslide inventory |
Data collection, remote-sensing interpretation, and field survey |
-- |
| Satellite image |
https://www.ovital.com, (accessed on 28 November 2022) |
1:200,000 |
| DEM |
https://www.gscloud.cn/, (accessed on 28 November 2022) |
30m |
| River network |
Manual sketching | -- |
| Strata chronology |
https://geocloud.cgs.gov.cn, (accessed on 28 November 2022) |
1:200,000 |
| PGA |
https://data.earthquake.cn/index.html, (accessed on 21 May 2024) |
-- |
| Fractional vegetation cover, (FVC) |
https://www.gscloud.cn/, (accessed on 14 April 2020) |
30m |
| Road network |
https://www.usgs.gov, (accessed on July 2023) |
-- |
Table 2.
Values of the random index (RI)
| n | 1 | 2 | 3 | 4 | 5 | 6 | 7 | 8 | 9 | 10 | 11 | 12 | |||
| RI | 0 | 0 | 0.52 | 0.89 | 1.12 | 1.26 | 1.36 | 1.41 | 1.46 | 1.49 | 1.52 | 1.54 | |||
| n | 13 | 14 | 15 | ||||||||||||
| RI | 1.56 | 1.58 | 1.59 | ||||||||||||
Table 3.
Classification and FR Calculation of Influencing Factors in the Luding Study Area
| Factor | Category | GN | PoGN/% | LN | PoLN/% | FR |
|---|---|---|---|---|---|---|
| Elevation (m) |
874~1350 | 97,195 | 8.77 | 1,426 | 14.85 | 1.69 |
| 1350~1687 | 136,720 | 12.34 | 1,726 | 17.98 | 1.46 | |
| 1687~1994 | 162,671 | 14.68 | 1,366 | 14.23 | 0.97 | |
| 1994~2293 | 168,688 | 15.23 | 1,423 | 14.82 | 0.97 | |
| 2293~2593 | 169,076 | 15.26 | 1,220 | 12.71 | 0.83 | |
| 2593~2913 | 148,534 | 13.41 | 1,111 | 11.57 | 0.86 | |
| 2913~3279 | 115,295 | 10.41 | 916 | 9.54 | 0.92 | |
| 3279~3772 | 73,015 | 6.59 | 370 | 3.85 | 0.58 | |
| 3772~4668 | 36,607 | 3.30 | 44 | 0.46 | 0.14 | |
| Slope gradient (°) |
0~10 | 47,928 | 4.14 | 106 | 1.10 | 0.27 |
| 10~20 | 116,982 | 10.09 | 457 | 4.76 | 0.47 | |
| 20~30 | 249,684 | 21.54 | 1,501 | 15.63 | 0.73 | |
| 30~40 | 406,867 | 35.10 | 3,211 | 33.44 | 0.95 | |
| 40~50 | 267,965 | 23.12 | 3,152 | 32.83 | 1.42 | |
| 50~60 | 63,187 | 5.45 | 1,027 | 10.70 | 1.96 | |
| 60~70 | 6,353 | 0.55 | 143 | 1.49 | 2.72 | |
| 70~76.63 | 91 | 0.01 | 5 | 0.05 | 6.63 | |
| Slope aspect |
Flat | 1,476 | 0.13 | 1 | 0.01 | 0.08 |
| N | 133,656 | 11.53 | 339 | 3.53 | 0.31 | |
| NE | 143,745 | 12.40 | 846 | 8.81 | 0.71 | |
| E | 155,501 | 13.42 | 2,052 | h | 1.59 | |
| SE | 161,245 | 13.91 | 2,741 | 28.55 | 2.05 | |
| S | 137,116 | 11.83 | 2,003 | 20.86 | 1.76 | |
| SW | 138,676 | 11.96 | 964 | 10.04 | 0.84 | |
| W | 139,842 | 12.07 | 479 | 4.99 | 0.41 | |
| NW | 147,800 | 12.75 | 177 | 1.84 | 0.14 | |
| Plan curvature |
-23.60~-4.25 | 2,470 | 0.22 | 24 | 0.25 | 1.12 |
| -4.25~-2.41 | 18,271 | 1.65 | 147 | 1.53 | 0.93 | |
| -2.41~-1.30 | 77,700 | 7.01 | 673 | 7.01 | 1.00 | |
| -1.30~-0.57 | 181,833 | 16.41 | 1,467 | 15.28 | 0.93 | |
| -0.57~0.17 | 357,933 | 32.31 | 2,842 | 29.60 | 0.92 | |
| 0.17~0.91 | 289,483 | 26.13 | 2,581 | 26.88 | 1.03 | |
| 0.91~1.83 | 134,102 | 12.11 | 1,324 | 13.79 | 1.14 | |
| 1.83~3.86 | 42,493 | 3.84 | 500 | 5.21 | 1.36 | |
| 3.86~23.57 | 3,516 | 0.32 | 44 | 0.46 | 1.44 | |
| Profile curvature |
-24.10~-5.17 | 3,151 | 0.28 | 45 | 0.47 | 1.65 |
| -5.17~-2.92 | 21,982 | 1.98 | 330 | 3.44 | 1.73 | |
| -2.92~-1.61 | 74,337 | 6.71 | 841 | 8.76 | 1.31 | |
| -1.61~-0.67 | 183,253 | 16.54 | 1,741 | 18.13 | 1.10 | |
| -0.67~0.07 | 302,088 | 27.27 | 2,332 | 24.29 | 0.89 | |
| 0.07~1.01 | 325,494 | 29.38 | 2,494 | 25.97 | 0.88 | |
| 1.01~2.32 | 149,281 | 13.48 | 1,303 | 13.57 | 1.01 | |
| 2.32~4.39 | 41,576 | 3.75 | 446 | 4.64 | 1.24 | |
| 4.39~23.88 | 6,639 | 0.60 | 70 | 0.73 | 1.22 | |
| Surface cutting degree (m) |
0~97.90 | 79,119 | 6.88 | 222 | 2.31 | 0.34 |
| 97.90~146.85 | 147,439 | 12.82 | 966 | 10.06 | 0.78 | |
| 146.85~188.46 | 214,469 | 18.65 | 1,364 | 14.21 | 0.76 | |
| 188.46~222.73 | 224,425 | 19.51 | 1,533 | 15.97 | 0.82 | |
| 222.73~254.54 | 200,972 | 17.48 | 1,853 | 19.30 | 1.10 | |
| 254.54~288.81 | 152,662 | 13.27 | 1,723 | 17.94 | 1.35 | |
| 288.81~327.97 | 88,849 | 7.73 | 1,209 | 12.59 | 1.63 | |
| 327.97~386.71 | 34,814 | 3.03 | 542 | 5.64 | 1.86 | |
| 386.71~626.57 | 7,265 | 0.63 | 190 | 1.98 | 3.13 | |
| Topographic relief (m) |
0~198 | 48,204 | 4.19 | 77 | 0.80 | 0.19 |
| 198~286 | 111,878 | 9.73 | 385 | 4.01 | 0.41 | |
| 286~354 | 172,706 | 15.02 | 901 | 9.38 | 0.62 | |
| 354~413 | 205,773 | 17.89 | 1,297 | 13.51 | 0.75 | |
| 413~468 | 215,716 | 18.76 | 1,699 | 17.69 | 0.94 | |
| 468~525 | 185,284 | 16.11 | 2,015 | 20.99 | 1.30 | |
| 525~592 | 131,587 | 11.44 | 1,882 | 19.60 | 1.71 | |
| 592~692 | 63,682 | 5.54 | 972 | 10.12 | 1.83 | |
| 692~1081 | 15,184 | 1.32 | 374 | 3.90 | 2.95 | |
| Elevation coefficient variation |
0~0.022 | 86,266 | 7.50 | 39 | 0.41 | 0.05 |
| 0.022~0.032 | 195,854 | 17.03 | 507 | 5.28 | 0.31 | |
| 0.032~0.041 | 235,005 | 20.43 | 1,198 | 12.48 | 0.61 | |
| 0.041~0.050 | 209,791 | 18.24 | 1,885 | 19.63 | 1.08 | |
| 0.050~0.061 | 161,978 | 14.08 | 1,955 | 20.36 | 1.45 | |
| 0.061~0.072 | 121,916 | 10.60 | 1,645 | 17.13 | 1.62 | |
| 0.072~0.084 | 78,653 | 6.84 | 1,164 | 12.12 | 1.77 | |
| 0.084~0.100 | 43,398 | 3.77 | 780 | 8.12 | 2.15 | |
| 0.100~0.134 | 17,153 | 1.49 | 429 | 4.47 | 3.00 | |
| Lithology | Granite | 588,053 | 52.77 | 3,285 | 34.21 | 0.65 |
| Quartzite | 218,447 | 19.60 | 3,357 | 34.96 | 1.78 | |
| Diabase | 4,328 | 0.39 | 51 | 0.53 | 1.37 | |
| Diorite | 62,841 | 5.64 | 819 | 8.53 | 1.51 | |
| Pyroxene Peridotite |
1,147 | 0.10 | 20 | 0.21 | 2.02 | |
| Rhyolite Porphyry | 11,391 | 1.02 | 1 | 0.01 | 0.01 | |
| Conglomerate | 34,617 | 3.11 | 156 | 1.62 | 0.52 | |
| Sandstone | 43,685 | 3.92 | 118 | 1.23 | 0.31 | |
| Marble | 45,286 | 4.06 | 742 | 7.73 | 1.90 | |
| Limestone | 80,147 | 7.19 | 743 | 7.74 | 1.08 | |
| Dolomite | 21,710 | 1.95 | 302 | 3.15 | 1.61 | |
| Slate | 2,734 | 0.25 | 8 | 0.08 | 0.34 | |
| Distance to faults (km) |
0~1 | 265,559 | 23.96 | 3,569 | 37.17 | 1.55 |
| 1~2 | 123,623 | 11.15 | 1,251 | 13.03 | 1.17 | |
| 2~3 | 94,661 | 8.54 | 1,084 | 11.29 | 1.32 | |
| 3~4 | 86,185 | 7.78 | 874 | 9.10 | 1.17 | |
| 4~5 | 86,015 | 7.76 | 925 | 9.63 | 1.24 | |
| 5~6 | 85,028 | 7.67 | 668 | 6.96 | 0.91 | |
| 6~7 | 80,908 | 7.30 | 409 | 4.26 | 0.58 | |
| 7~8 | 75,844 | 6.84 | 367 | 3.82 | 0.56 | |
| 8~9 | 68,026 | 6.14 | 197 | 2.05 | 0.33 | |
| 9~10 | 54,866 | 4.95 | 213 | 2.22 | 0.45 | |
| >10 | 87,594 | 7.90 | 45 | 0.47 | 0.06 | |
| Epicentral distance (km) |
0~2 | 14,445 | 1.30 | 108 | 1.12 | 0.86 |
| 2~4 | 43,336 | 3.91 | 317 | 3.30 | 0.84 | |
| 4~6 | 58,179 | 5.25 | 969 | 10.09 | 1.92 | |
| 6~8 | 70,309 | 6.34 | 979 | 10.20 | 1.61 | |
| 8~10 | 70,319 | 6.34 | 1,010 | 10.52 | 1.66 | |
| 10~12 | 71,046 | 6.41 | 630 | 6.56 | 1.02 | |
| 12~14 | 77,362 | 6.98 | 894 | 9.31 | 1.33 | |
| 14~16 | 84,071 | 7.59 | 632 | 6.58 | 0.87 | |
| 16~18 | 91,041 | 8.21 | 637 | 6.63 | 0.81 | |
| 18~20 | 98,106 | 8.85 | 1,048 | 10.91 | 1.23 | |
| 20~22 | 105,230 | 9.49 | 950 | 9.89 | 1.04 | |
| 22~24 | 101,305 | 9.14 | 467 | 4.86 | 0.53 | |
| 24~26 | 77,000 | 6.95 | 518 | 5.39 | 0.78 | |
| 26~28 | 67,456 | 6.09 | 220 | 2.29 | 0.38 | |
| 28~30 | 38,581 | 3.48 | 160 | 1.67 | 0.48 | |
| 30~32 | 24,355 | 2.20 | 50 | 0.52 | 0.24 | |
| 32~34 | 13,026 | 1.18 | 11 | 0.11 | 0.10 | |
| 34~36 | 3,142 | 0.28 | 2 | 0.02 | 0.07 | |
| PGA (g) | 0.23~0.28 | 38,026 | 0.03 | 8 | 0.00 | 0.02 |
| 0.28~0.32 | 163,975 | 0.15 | 731 | 0.08 | 0.51 | |
| 0.32~0.37 | 417,883 | 0.38 | 3222 | 0.34 | 0.89 | |
| 0.37~0.42 | 316,673 | 0.29 | 4333 | 0.45 | 1.58 | |
| 0.42~0.46 | 65,876 | 0.06 | 582 | 0.06 | 1.02 | |
| 0.46~0.51 | 39,937 | 0.04 | 258 | 0.03 | 0.75 | |
| 0.51~0.55 | 26,671 | 0.02 | 149 | 0.02 | 0.64 | |
| 0.55~0.60 | 21,544 | 0.02 | 179 | 0.02 | 0.96 | |
| 0.60~0.65 | 17,440 | 0.02 | 140 | 0.01 | 0.93 | |
| Distance to rivers (m) |
0~400 | 148,315 | 13.38 | 2,136 | 22.25 | 1.66 |
| 400~800 | 134,153 | 12.10 | 1,958 | 20.39 | 1.68 | |
| 800~1200 | 118,299 | 10.67 | 1,194 | 12.43 | 1.16 | |
| 1200~1600 | 105,732 | 9.54 | 1,141 | 11.88 | 1.25 | |
| 1600~2000 | 91,529 | 8.26 | 910 | 9.48 | 1.15 | |
| 2000~2400 | 79,834 | 7.20 | 661 | 6.88 | 0.96 | |
| 2400~2800 | 71,936 | 6.49 | 503 | 5.24 | 0.81 | |
| 2800~3200 | 64,927 | 5.86 | 365 | 3.80 | 0.65 | |
| 3200~3600 | 52,775 | 4.76 | 243 | 2.53 | 0.53 | |
| 3600~4000 | 40,134 | 3.62 | 151 | 1.57 | 0.43 | |
| 4000~4400 | 34,065 | 3.07 | 114 | 1.19 | 0.39 | |
| 4400~4800 | 29,070 | 2.62 | 52 | 0.54 | 0.21 | |
| >4800 | 137,540 | 12.41 | 174 | 1.81 | 0.15 | |
| FVC (%) | 0~9.38 | 67,244 | 6.27 | 149 | 1.55 | 0.25 |
| 9.38~25.78 | 34,617 | 3.23 | 216 | 2.25 | 0.70 | |
| 25.78~40.23 | 46,581 | 4.34 | 432 | 4.50 | 1.04 | |
| 40.23~52.34 | 71,718 | 6.69 | 615 | 6.40 | 0.96 | |
| 52.34~62.50 | 114,147 | 10.65 | 1,103 | 11.49 | 1.08 | |
| 62.50~71.88 | 152,996 | 14.27 | 1,555 | 16.19 | 1.13 | |
| 71.88~81.25 | 194,045 | 18.10 | 1,902 | 19.81 | 1.09 | |
| 81.25~91.41 | 210,436 | 19.63 | 1,971 | 20.53 | 1.05 | |
| 91.41~100 | 180,312 | 16.82 | 1,659 | 17.28 | 1.03 | |
| Distance to roads (m) |
0~400 | 247,036 | 22.29 | 2,778 | 28.93 | 1.30 |
| 400~800 | 146,964 | 13.26 | 1,627 | 16.94 | 1.28 | |
| 800~1200 | 112,597 | 10.16 | 1,082 | 11.27 | 1.11 | |
| 1200~1600 | 89,952 | 8.12 | 911 | 9.49 | 1.17 | |
| 1600~2000 | 71,538 | 6.45 | 648 | 6.75 | 1.05 | |
| 2000~2400 | 62,065 | 5.60 | 559 | 5.82 | 1.04 | |
| 2400~2800 | 53,843 | 4.86 | 546 | 5.69 | 1.17 | |
| 2800~3200 | 48,932 | 4.42 | 472 | 4.92 | 1.11 | |
| 3200~3600 | 43,076 | 3.89 | 301 | 3.13 | 0.81 | |
| 3600~4000 | 38,803 | 3.50 | 221 | 2.30 | 0.66 | |
| 4000~4400 | 34,277 | 3.09 | 197 | 2.05 | 0.66 | |
| 4400~4800 | 28,333 | 2.56 | 99 | 1.03 | 0.40 | |
| 4800~5200 | 25,066 | 2.26 | 69 | 0.72 | 0.32 | |
| >5200 | 105,827 | 9.55 | 92 | 0.96 | 0.10 |
Note: GN represents the number of grids, PoGN is the percentage of grid numbers; LN represents the number of landslides, PoLN is the percentage of landslide numbers; FR is the value of frequency ratio.
Table 4.
Modified landslide relative frequency for each influence factor
| Factor | Elevation | Slope gradient |
Slope aspect |
Plan curvature |
Profile curvature |
|---|---|---|---|---|---|
| mLRF | 0.1235 | 0.1472 | 0.1476 | 0.1124 | 0.1144 |
| Factor | Surface cutting degree |
Topographic relief |
Elevation coefficient variation |
Lithology | Distance to faults |
| mLRF | 0.1282 | 0.1394 | 0.1554 | 0.1066 | 0.1119 |
| Factor | Epicentral distance |
PGA | Distance to rivers |
FVC | Distance to roads |
| mLRF | 0.0664 | 0.1304 | 0.0982 | 0.116 | 0.0816 |
Disclaimer/Publisher’s Note: The statements, opinions and data contained in all publications are solely those of the individual author(s) and contributor(s) and not of MDPI and/or the editor(s). MDPI and/or the editor(s) disclaim responsibility for any injury to people or property resulting from any ideas, methods, instructions or products referred to in the content. |
© 2025 by the authors. Licensee MDPI, Basel, Switzerland. This article is an open access article distributed under the terms and conditions of the Creative Commons Attribution (CC BY) license (http://creativecommons.org/licenses/by/4.0/).
Copyright: This open access article is published under a Creative Commons CC BY 4.0 license, which permit the free download, distribution, and reuse, provided that the author and preprint are cited in any reuse.


