
Submitted:
07 November 2025
Posted:
10 November 2025
You are already at the latest version
Abstract
Extratropical cyclones are the main drivers of high-energy wave events along the southern coast of Brazil, frequently generating coastal storms and hazardous conditions. This study analyzes the occurrence and characteristics of extreme wave events between 2001 and 2020 along the coastal zone from Arroio Chuí to Cabo de Santa Marta, based on warnings of sea state hazards issued by the Brazilian Navy Hydrographic Center. Events were selected using the 95th percentile of significant wave height, considering only episodes with waves exceeding 4.0 m reaching the coast. To avoid double-counting, consecutive warnings within two days were grouped as a single event. Reanalysis data from ERA5 were used to describe the associated atmospheric and oceanographic patterns. A total of 51 high-impact coastal storm events were identified, with seasonal distribution showing higher frequency during winter (19 cases) and autumn (15 cases). Out of these events, 25 were associated with adverse navigation conditions at the coastal bar, accounting for 355 hours of impracticability. Results highlight the dominant role of strong winds and frontal systems in generating extreme sea states and their socio-economic impacts. The study provides a climatological baseline for the region and contributes to improving forecasts and risk management strategies under changing climate conditions.
Keywords:
extratropical cyclones
; wave
; extreme events
1. Introduction
At mid and high latitudes, the main drivers of high-energy waves are extratropical cyclones, which are well known for their strong winds and large fetch areas [1]. An extratropical cyclone is a meteorological system characterized by a low-pressure center formed by the convergence of cold polar and warm tropical air masses, as described in the model of Bjerknes and Solberg (1922) [2]. These systems are generally associated with cold fronts, enhance tropospheric instability, and favor storm development. Acting as planetary temperature regulators, extratropical cyclones transport cold air toward lower latitudes and warm air toward higher latitudes [3]. Most frontal systems originate from baroclinic waves at mid-latitudes, with spatial scales of approximately 3,000 km, embedded in the westerlies [4]. Their trajectory and intensity are influenced by multiple atmospheric components, such as stationary planetary waves, subtropical jet strength, ridges and troughs, 500 hPa subsidence, pressure gradients between land and ocean, and wind intensity in oceanic convergence zones [5]. The southern coast of Brazil is frequently affected by these systems, which, even when generated offshore, enhance sea agitation and propagate waves toward the coast [6], often resulting in storm surges or coastal storms.
A coastal storm can be defined as the rise in sea level driven by the combined effect of astronomical tide and storm surge, accompanied by above-normal wave amplitudes [7]. Astronomical tides result from the gravitational pull of celestial bodies, mainly the Sun and Moon, whereas storm surges are driven by wind and atmospheric pressure variations [8]. The key factor in coastal storm generation is the wind fetch, the oceanic area where momentum is effectively transferred from air to sea [9]. For this process to occur, winds must blow with sufficient intensity, duration, and favorable direction, ensuring efficient kinetic energy transfer [1]. The resulting effects include capillary waves, surface gravity waves, and variations in mean sea level [9]. Cyclones and fronts create the necessary conditions for meteorological tides. When they occur near coastal areas, they can induce water accumulation along the shoreline, potentially causing severe damage.
The coast of Rio Grande do Sul is minimally affected by astronomical tides, with an average amplitude of only 0.47 m [10]. Conversely, coastal storms are significant, largely because the region is frontogenetic—favorable to the formation of frontal systems. Studies focusing on South America attribute this characteristic to strong baroclinicity and the availability of energy and entropy for cyclone development [11,12]. An investigation into extratropical cyclone distribution identified the Southern Cone as the area with the highest frequency of occurrence [13]. Cyclones affect the region year-round, with peak frequency during winter (JJA) [11,12,14].
Ocean-related hazards linked to cyclones, such as extreme waves and coastal storms, are frequently reported in the western South Atlantic. These events are associated with coastal erosion, infrastructure damage, navigation risks, and offshore industry accidents [1], ultimately causing property loss, destruction of natural habitats, and human casualties [15]. The coast of Rio Grande do Sul is both densely populated and recurrently exposed to these systems, placing communities and local economies at considerable risk.
A study on climate change and Brazilian coastal vulnerability, based on the Intergovernmental Oceanographic Commission (IOC) framework, identified Rio Grande as the only municipality in the state classified as highly vulnerable [16]. This classification considers natural risks, such as coastal storms, storm surges, flooding, and erosion; cumulative shoreline retreat; technological risks, such as industrial expansion; and social risks related to habitability and community resilience. Nearly the entire population of Rio Grande is considered exposed to social risk, as the city lies on low-lying, reclaimed terrain and coexists with one of Brazil’s largest ports, along with a growing naval, industrial, and petrochemical complex [16]. These factors place the municipality among the most vulnerable under scenarios of climate change.
The executive report Impacts and Risks of Climate Change on Brazilian Public Ports [17], published in 2019 by the National Agency for Waterway Transport (ANTAQ), notes that approximately 14.2% of Brazil’s Gross Domestic Product (GDP) is tied to the port sector. The report highlights that, due to its function, infrastructure, and location, the sector is directly exposed to climate change impacts. Strong winds and storms were the main events disrupting logistics chains and port operations, and their frequency has been increasing. Reported effects include coastal storms, flooding, and shoreline erosion, all of which amplify risks to port activities [17]. In its risk classification, the Port of Rio Grande is ranked at very high climate risk for storms and sea-level rise, and high risk for strong winds. These findings underscore the potential for disrupted operations, higher maintenance costs, and reduced infrastructure durability.
The Oil and Energy sector is also closely tied to the ocean and coastal areas, making it highly exposed to these impacts. Coastal storms can lead to partial or total loss of infrastructure, including pipeline displacement, loss of autonomous equipment, and environmental accidents caused by damage to nearshore facilities. Studies project that adverse weather and oceanic conditions will increasingly impact ports and maritime transport, including heavier rainfall disrupting cargo operations, blocked channels from intensified storms, and increased risks to navigation and docking maneuvers [17].
Studying high-energy wave events provides insights into the mean and seasonal behavior of the coastal environment, particularly the sea-state conditions that damage coastal infrastructure and threaten human life. The social and economic impacts of meteorological systems associated with extreme coastal storms are especially relevant for the Rio Grande port region.
In this context, this study aims to determine the atmospheric and oceanic patterns associated with high-impact coastal storm events along the coast of Rio Grande do Sul. Specifically, it seeks to: (i) quantify the number of high-impact coastal storms in a 20-year historical series (2001–2020) based on severe weather warnings issued by the Brazilian Navy’s Hydrography Center (CHM); (ii) identify the atmospheric and oceanic patterns associated with these events; and (iii) assess their impacts on the operability of the Port of Rio Grande.
2. Materials and Methods
2.1. Study Area
The study area (Figure 1) includes the entire ALFA zone (A), as defined by the Brazilian Navy Hydrography Center (CHM), extending along the coast from Arroio Chuí (Rio Grande do Sul state - RS) to Cabo de Santa Marta (Santa Catarina state - SC). This region is highly baroclinic and therefore favorable to the development of extratropical cyclones, making it an important cyclogenetic zone [11,19,20]. Frontal systems and the associated passage of extratropical cyclones occur throughout the year in southern Brazil, contributing to high precipitation frequency [21,22]. As a result, the area is subject year-round to storm events characterized by strong winds, lightning, and hail, often producing rough sea conditions along the southern coast of Brazil.
The morphosedimentary dynamics of the region are strongly influenced by extreme events [23]. The shallow continental shelf favors the formation of submerged sandbanks, which act as refraction zones and amplify wave heights during coastal storms [23]. In parallel, the prevailing longshore drift (SW-NE) drives an asymmetric redistribution of sediments along the coast, creating sectors more prone to coastal erosion [24], a condition already documented at Balneário Hermenegildo and Cabo de Santa Marta. Extreme wave events occur mainly in winter, with episodes exceeding 7 m in height [1]. Therefore, the study area is consistently exposed to conditions in which such events affect both sea state and navigation.
2.2. Data
The data used in this study include Marine Weather Warnings issued by the Brazilian Navy Hydrography Center (CHM), ERA5 reanalysis data, and pilotage reports documenting the operational conditions of the Rio Grande Bar.
The Marine Weather Warnings are reports that identify atmospheric and oceanic conditions relevant to navigation, considering factors such as wind intensity and direction, fog, sea state, and coastal storm occurrence. These warnings are issued and published immediately by the Brazilian Navy and subsequently incorporated into METEOROMARINHA bulletins and other forecast products. Generated from meteorological forecasts, they are validated within 24 hours using data from multiple platforms. Once synthesized, they are made publicly available on the CHM website and through other channels, such as the National Network of Coastal Stations.
The ERA5 reanalysis used in this study corresponds to the most recent fifth-generation product of the European Centre for Medium-Range Weather Forecasts (ECMWF). ERA5 has a horizontal resolution of 31 km, with 137 atmospheric levels from the surface (10 m) up to 80 km (0.01 hPa) [25]. Data are available from 1940 to the present at https://cds.climate.copernicus.eu/. This reanalysis integrates observations collected from ships, aircraft, radiosondes, and satellites into a continuously updated data assimilation system, which enhances its reliability. Like other modern reanalysis products, ERA5 effectively represents wave patterns [26].
The Rio Grande Pilotage reports consist of documents describing the observed weather and sea conditions, as well as the navigability of the bar during and around each event analyzed. These reports also record the duration and reasons for bar closures, aiming to exclude downtime associated with phenomena such as fog—which reduces visibility—or signaling issues related to equipment conditions. Only reports explicitly attributing bar inoperability to wind and wave events were considered in this study.
2.3. Methodology
The methodology is based on previous studies [27,28] that used coastal storm data obtained from Marine Weather Warnings issued by the Brazilian Navy Hydrography Center (CHM) [29]. These reports are issued whenever one or more predefined atmospheric or oceanic conditions are forecast. For the present study, however, only coastal storm events characterized by waves higher than 4 meters reaching the coast with a favorable direction, without subsequent cancellation, and occurring within the study area over a 20-year historical period (2001–2020), were considered. The dataset analyzed in this study is the same as that used by [28], who examined the atmospheric patterns associated with coastal storms of different magnitudes for the same period using the same method. For the period investigated, 433 coastal storm events were identified in the Marine Weather Warnings. Nevertheless, the approaches differ significantly from [28]. While [28] conducted a comprehensive climatological study analyzing all coastal storm events and their relationship with atmospheric baroclinicity, the present study focuses exclusively on extreme events. Furthermore, this study also aims to assess the local impacts within specific areas of the study region that were affected by the analyzed events.
Using the same dataset as the previous study, we applied a simple formula to calculate the 95th percentile of wave height reported in the warnings. This process extracted the 5% of warnings with the most extreme wave height values (4 meters or higher), which are defined in this study as high-impact coastal storm events. To avoid overlapping events generated by the same meteorological system, all warnings separated by two days or less were considered as a single coastal storm event. Once the events were consolidated, their seasonal frequency distribution was calculated according to the meteorological calendar, that is: spring (September, October, November), summer (December, January, February), autumn (March, April, May), winter (June, July, August), as well as the annual distribution of events.
The ERA5 reanalysis dataset was retrieved for the following atmospheric variables: zonal and meridional wind components (at 10 m above the surface) and mean sea level pressure (MSLP). For the oceanographic variables, significant wave height and wind-wave direction were used. All variables have a temporal resolution of 6 hours (0, 6, 12, and 18 UTC).
First, the data were separated to account for all events individually and by season. Then, the fields were calculated using simple averages—both total and seasonal—for each variable: pressure and wind fields, and wave height and direction fields. The averaging was applied only to the days corresponding to the Marine Weather Warnings.
In addition, an Empirical Orthogonal Function (EOF) analysis was applied to identify the dominant spatial patterns of mean sea level pressure and significant wave height fields. The EOF method is a type of map series analysis that organizes all variability within the evolving field into temporal modes, aiming to decompose it into stationary oscillations represented by time series. Each EOF corresponds to an oscillation, that is, an oscillatory pattern [30]. The EOF application process began by removing the temporal means to obtain the anomalies of the input data. Next, an m × n matrix was constructed, where m corresponds to the observed time steps and n to the spatial points (grid). Then, the covariance matrix was calculated to quantify how the points co-vary over time. The decomposition of eigenvalue (from largest to smallest) and eigenvector allowed the identification of the dominant patterns. Finally, the data were projected onto the eigenvectors to obtain the principal components.
Pilotage records from the Port of Rio Grande are not available for the entire study period. Therefore, the analysis of the relationship between the events and bar practicability spans from 2007 to 2016. A spreadsheet was compiled containing all available data on bar practicability, which was then cross-referenced with the events identified in the Marine Weather Warnings. Subsequently, the total number of hours of impacting bar practicability due to natural conditions was calculated, along with the number of occurrences recorded during the event period. The average duration and percentage of records associated with coastal storm conditions were also computed, excluding hours related to visual factors like reduced visibility or deficient signaling along the internal navigation channel. Finally, a case study was conducted on two events during the analyzed period that coincided with changes in bar practicability, to highlight the patterns observed under severe weather conditions.
3. Results and Discussion
3.1. Distribution of Coastal Storm Events
Figure 2 shows the annual and seasonal distribution of high-impact coastal storm events in the study area between 2001 and 2020. In this study, 51 high-impact coastal storms were identified, specifically between 2002 and 2016, within the same study area. Specifically, no high-impact events were detected in 2000, 2001, 2017, 2018, 2019, or 2020. It is important to note, however, that coastal storm events did occur in those years [28], but they did not have the characteristics considered in this study. According to the previous study [28], 433 coastal storm events were identified during the same period and within the same area, with peak occurrence in 2015 and 2016—a period associated with a very strong El Niño event [27].
Of the 51 events (Figure 2), 19 occurred during winter (JJA), 15 during autumn (MAM), 12 during spring (SON), and 5 during summer (DJF). The peaks of occurrence are observed in autumn and winter, when cyclogenesis frequency is higher, whereas the lowest occurrence is found in summer, in agreement with previous studies [12,28]. The results also indicate an increasing trend in the number of events over the study period.
The year with the highest number of high-impact coastal storm events was 2015. A high frequency of events was also observed in 2008, despite the prevailing La Niña conditions. In absolute terms, both years recorded similar numbers of warnings (14 in 2015 and 13 in 2008). However, while each warning in 2015 corresponded to a distinct event, the 14 warnings issued in 2008 accounted for only 10 events, highlighting the clustering of events in that year. A climatological study of extratropical cyclones in southern Brazil showed that, during the first decade of this century, long-lived cyclones occurred more frequently than in the years after 2008, which may help explain the temporal behavior of the events in that year [31]. In addition, meteorological conditions, such as the development of semi-stationary atmospheric blocking systems, may have contributed to the longer duration of these events. The high number of events in 2015 is mainly associated with the positive phase of ENSO in the region. During the 2015/2016 El Niño, additional factors also contributed to the increased occurrence of cyclones over the Atlantic, which in turn favored the development of coastal storms [27]. Besides El Niño, negative geopotential height anomalies over southeastern South America and the Atlantic Ocean during the spring of 2015 modulated low-level jets and enhanced the transport of moisture from tropical to subtropical regions [27].
3.2. Analysis of Composite Fields of Pressure and Significant Wave Height
Figure 3 shows the composite fields of mean sea level pressure and seasonal mean winds, as well as the overall mean for the analyzed period, considering high-impact coastal storm events.
During summer (Figure 3a), the pressure and wind fields reveal a low-pressure system located to the north of the Alpha area, with a central pressure of 1006 hPa. This seasonal mean pattern differs from the other seasons, as only five high-impact coastal storms were recorded during this period between 2001 and 2020. The 10-m wind field shows that, during coastal storm occurrences in summer, southeasterly winds predominate over the Alpha zone. The interaction between these two circulation patterns promotes the formation of a fetch, driven by the pressure gradient that favors an easterly/southeasterly wind flow [27,32].
In autumn and winter (Figure 3b, c), a mean high-pressure center is observed over Argentina. It reflects the incursion of polar air masses into the region following the passage of frontal systems. Such conditions favor predominantly southerly winds blowing perpendicular to the coast, creating favorable settings for onshore wind-driven setup, also associated with Ekman transport [28]. This pattern resembles the overall mean (Figure 3e), suggesting that the atmospheric conditions driving high-energy events throughout the year become especially active during autumn and winter. It is worth emphasizing that coastal storm events are most frequent in MAM and JJA.
In spring (Figure 3d), a weakening of the conditions observed in MAM and JJA can be noted, with a decrease in the mean pressure gradient. The composite field is characterized by a low-pressure system centered at 40°S and 45°W, located offshore. In addition, the prevailing winds during high-impact coastal storm events in SON are southerly. These conditions associated with high-impact events differ from those reported in [28], where, during coastal storm events in general, the pressure and wind fields resemble the summer pattern.
The maps in Figure 4 show the seasonal composite fields of significant wave height and wave direction based on the identified coastal storm events. During summer (Figure 4a), waves associated with coastal storms exhibit a predominantly shore-normal direction. The mean significant wave height ranges between 2.0 and 2.5 m, with higher values occurring farther offshore. As observed by [27,28], the peak frequency of events occurs mainly during the autumn and winter months. This pattern is evident in the total average (Figure 4e), which displays significant wave height values like those in the autumn (Figure 4b) and winter (Figure 4c) maps. The total mean (Figure 4e) also shows that the highest wave heights occur south of 35°S. However, significant wave heights extend along the entire coastline of the study area. The predominant wave direction is from the southeast, evident in all seasons and in the overall mean, in agreement with [26], who identified this propagation pattern for storm-generated waves.
Furthermore, it can be observed that the energetic wave pattern established during autumn and winter near the coast persists into the spring months (Figure 4d), with higher wave heights concentrated in the southern portion of the study area. The overall mean field indicates that this pattern is representative of the spatial extent of energetic waves throughout most of the year, except during summer. [23], when analyzing wave behavior along the southern coast of Brazil, also identified similar seasonal patterns in both wave energy and wave period.
During autumn and winter (Figure 4b, c), an increase in wave energy is observed throughout the study area, particularly at latitudes higher than 34°S and in regions closer to the coast. This characteristic was also identified by [23], who observed higher wave heights at latitudes above 33°S using Topex/Poseidon satellite data, and associated this pattern with historical maps showing the persistence of high-wave-height cores in this region, which intensify during autumn and reach their maximum in winter. The southerly winds evident in the mean pressure and wind fields for the same period favor the incidence of waves that approach the coast of the state almost perpendicularly, promoting water piling up in the coastal zone [4]. A more pronounced change in the wave incidence angle is also observed compared with summer, with waves coming mainly from the southern quadrant. This change in wave behavior is likely a result of the interaction with the intensified southerly winds during this period, driven by the high-pressure system over Argentina (Figure 3b), in addition to the effects of Ekman transport and beach morphodynamics [23].
During spring (Figure 4d), the conditions observed in the previous season persist, although with less intensity in terms of wave energy and spatial extent of influence within the study area. The predominant propagation direction remains mostly perpendicular to the coastline, with high-energy waves still reaching shallower regions. However, two distinct wave propagation patterns can be identified before the waves reach the nearshore zone. In the southernmost part of the study area, particularly near the coast, waves predominantly approach from the southern quadrant. In contrast, near Cabo de Santa Marta, at the northern limit of the study area, a southeastward pattern is observed. These hybrid characteristics of the wave field were also described by [33], who identified lower wave heights associated with the influence of the South Atlantic Subtropical High at lower latitudes, and higher waves approaching mainly from the southeast and south, generated by extratropical cyclones.
3.3. Determination of the Dominant Patterns During Coastal Storm Events
The Empirical Orthogonal Function (EOF) analysis was applied to coastal storm events to identify the dominant modes of variability, that is, the main spatial patterns associated with anomalies in atmospheric pressure and significant wave height during high-impact episodes. The EOF loadings are dimensionless and represent the relative amplitude of these anomalies. Figure 5 presents the first and second EOFs, which together explain approximately 85–90% of the total variance in the seasonal pressure fields associated with coastal storms over the study region.
The first EOFs (Figure 5a,c,e,g,i) depict the dominant low-pressure pattern at higher latitudes, centered near 40–45° S over the southwestern Atlantic. This configuration characterizes the cyclonic systems responsible for coastal storm generation, particularly during autumn (56%) and winter (61%), when extratropical cyclones are most active. During summer, the same pattern explains nearly 74% of the total variance, although with weaker amplitude, reflecting reduced baroclinic activity. The persistence of this low-pressure center south of the study area aligns with the results of [28], who described it as the primary synoptic structure associated with coastal storms across all seasons.
The second EOFs (Figure 5b, d, f, h, j) highlight a dipole pattern between the continent and the adjacent ocean, representing the interaction between high- and low-pressure systems that modulate coastal storm intensity. This configuration is most pronounced during MAM and JJA, when a low-pressure anomaly develops over the ocean and a high-pressure anomaly dominates the continent, enhancing the meridional pressure gradient and thus the wind fetch along the coast. This pattern is consistent with previous synoptic analyses [4,27], which identified the development of southerly-to-northerly wind fetches as the main driver of coastal coastal storms. Likewise, [34] reported that these wind fetches, established by the pressure gradient between the cyclone and anticyclone, favor northward water transport into the Patos Lagoon, contributing to elevated water levels in the lagoon and in nearby coastal areas, such as the city of Rio Grande.
The EOF analysis of significant wave height (Figure 6) revealed clear seasonal patterns of wave variability along the South and Southeast Brazilian coast. During summer (DJF), the leading mode (72.3%) indicates the dominance of pressure systems farther offshore, associated with low-energy easterly swells. In comparison, the second mode (16.1%) indicates minor variations associated with low-pressure systems located near 30–35°S. In autumn (MAM), the first mode (39.1%) marks the transition to the high-energy season, with increasing influence of extratropical cyclones and southwesterly winds, whereas the second mode (21.9%) represents north–south shifts in cyclone activity. In winter (JJA), the dominant mode (34.2%) depicts intense extratropical wave generation driven by cyclones from the La Plata Basin, corresponding to the most frequent and severe coastal storms, while the second mode (16.1%) reflects reduced wave energy. During spring (SON), the leading mode (44.7%) maintains the winter pattern but with weaker intensity. The second EOF mode (Figure 6h) during SON highlights a storm surge pattern driven by a pressure gradient, as shown in Figure 5h. On an annual scale, the first mode (41.7%) captures the seasonal contrast between low- and high-energy regimes, and the second mode (18.1%) represents interannual modulation associated with large-scale climate variability. The first mode of the Empirical Orthogonal Function (EOF) of significant wave height is predominantly associated with the low-pressure systems illustrated in Figure 5 (EOF 1), where wave generation is largely driven by cyclonic activity. The second mode primarily represents the influence of the pressure gradient, particularly during the MAM and JJA seasons, facilitating the development of wind streaks and the consequent accumulation of water along the coastline.
Previous studies have shown that the seasonal pattern represented by EOF2 is consistent with synoptic analyses of coastal storm events, revealing the formation of a wind fetch zone driven by the pressure gradient between adjacent cyclonic and anticyclonic systems [23,30]. According to [1], this atmospheric configuration is most frequent during extreme wave events. The intensification of the wind fetch, resulting from the interaction between the cyclone and the anticyclone, enhances wave generation and propagation toward the coast, ultimately leading to high-impact coastal storms along the southern and southeastern Brazilian shoreline.
3.4. Case Study
Of the 51 analyzed events, 25 recorded adverse conditions affecting the navigability of the Rio Grande bar due to natural causes, mainly strong winds and high-energy waves. In total, 355 hours of inoperability were registered between 2007 and 2016, indicating that during this period the bar remained closed for an average of 14 hours per day, considering only days with severe weather conditions. Approximately 90% of this downtime was associated with rough seas and stormy weather conditions. These situations demonstrate a clear cause-and-effect relationship between the occurrence of coastal storms and the operational capacity of the Rio Grande Port area, corroborating findings reported in documents issued by ANTAQ.
Furthermore, during the analyzed period, several events were recorded with inoperability lasting between 18 and 30 consecutive hours, due to winds exceeding 30 kt and waves higher than 4 meters, as reported by the pilotage service. Of the 355 hours of impaired operability, more than 150 correspond to the most energetic periods, including the strong El Niño in 2015 and La Niña in 2008, which also comprise the events analyzed in this study.
Between April 30 and May 4, 2008, a high-impact coastal storm event affected the coast of Rio Grande do Sul, rendering the Rio Grande bar inoperable from 21:00 on May 2 until 07:30 on May 4 due to winds reaching up to 37 kt, as reported by the pilotage service. The event was widely covered by various news outlets, which reported damages along the entire coastline of Rio Grande do Sul and Santa Catarina, including road closures and flooding [35]. The rough sea conditions were documented in the severe weather warnings issued by the Brazilian Navy’s Hydrography Center (CHM). The analysis of the synoptic fields for this event made it possible to identify and understand the atmospheric factors that may have contributed to the occurrence of this coastal storm.
The first noteworthy aspect concerns the cyclone’s formation close to the coast, as indicated by the deepening of a low-pressure system in Figure 7 (a, c, e). This condition enhances the action of stronger winds in the coastal zone. As discussed throughout this study, systems that generate higher wave heights near the coast tend to develop mainly from the autumn months onward. In this case, the system originated from the development of a low-pressure center in the region. Upon reaching the coastline, between northern Rio Grande do Sul and southern Santa Catarina, it intensified over the ocean. Contact with the ocean surface favors the system’s development. Localized heat sources or relative maxima of instability are examples of factors that can promote cyclogenesis [32]. According to [35], the formation of a dipole-type blocking pattern contributed to the intensification of a surface anticyclone located to the south/east of the cyclone, which in turn helped maintain the cyclone in a quasi-stationary position. The same authors reported that the atypical and slow movement of the cyclone toward the south—and at times toward the southwest—was associated with the advection of cyclonic absolute vorticity in the mid-troposphere and warm air advection in its southern sector. After the weakening of the blocking system, the surface cyclone moved away from the southern coast of Brazil.
The second aspect concerns the atmospheric pressure fields and the observed relationship between a surface low-pressure system and a subsequent high-pressure system — an arrangement that promotes the formation of wind corridors, driving the flow of both systems over the ocean toward the continent. This configuration is depicted in Figure 7 (a, c, e), just below the low-pressure center. The interaction between the low-tropospheric flow and the ocean surface, through the transfer of momentum and energy between the atmosphere and the ocean, results in the agitation of seawater, generating ocean waves [27].
The analysis of wave height and direction fields supports the patterns identified throughout this study. These patterns have also been reported in previous works, such as [34], where the authors observed that the highest wave heights coincide with wind maxima, particularly evident in Figure 7 (d, f). The severe weather warnings reported forecasted waves reaching up to 6 meters in height. In the figures, it is possible to observe that values exceeding 4.5 meters occurred very close to the coast, while the ERA5 reanalysis data indicated a maximum wave height of 6.6 meters at 18 UTC. These values are consistent with the maximum reported by [36,37] for the same region.
In addition to 2008, another highly energetic year was 2015, marked by the onset of the positive phase of ENSO and positive sea surface temperature anomalies across the equatorial Pacific. The occurrence of El Niño promotes conditions that favor the development of systems responsible for ocean agitation in the study region [27], especially during strong El Niño events such as that of 2015/2016.
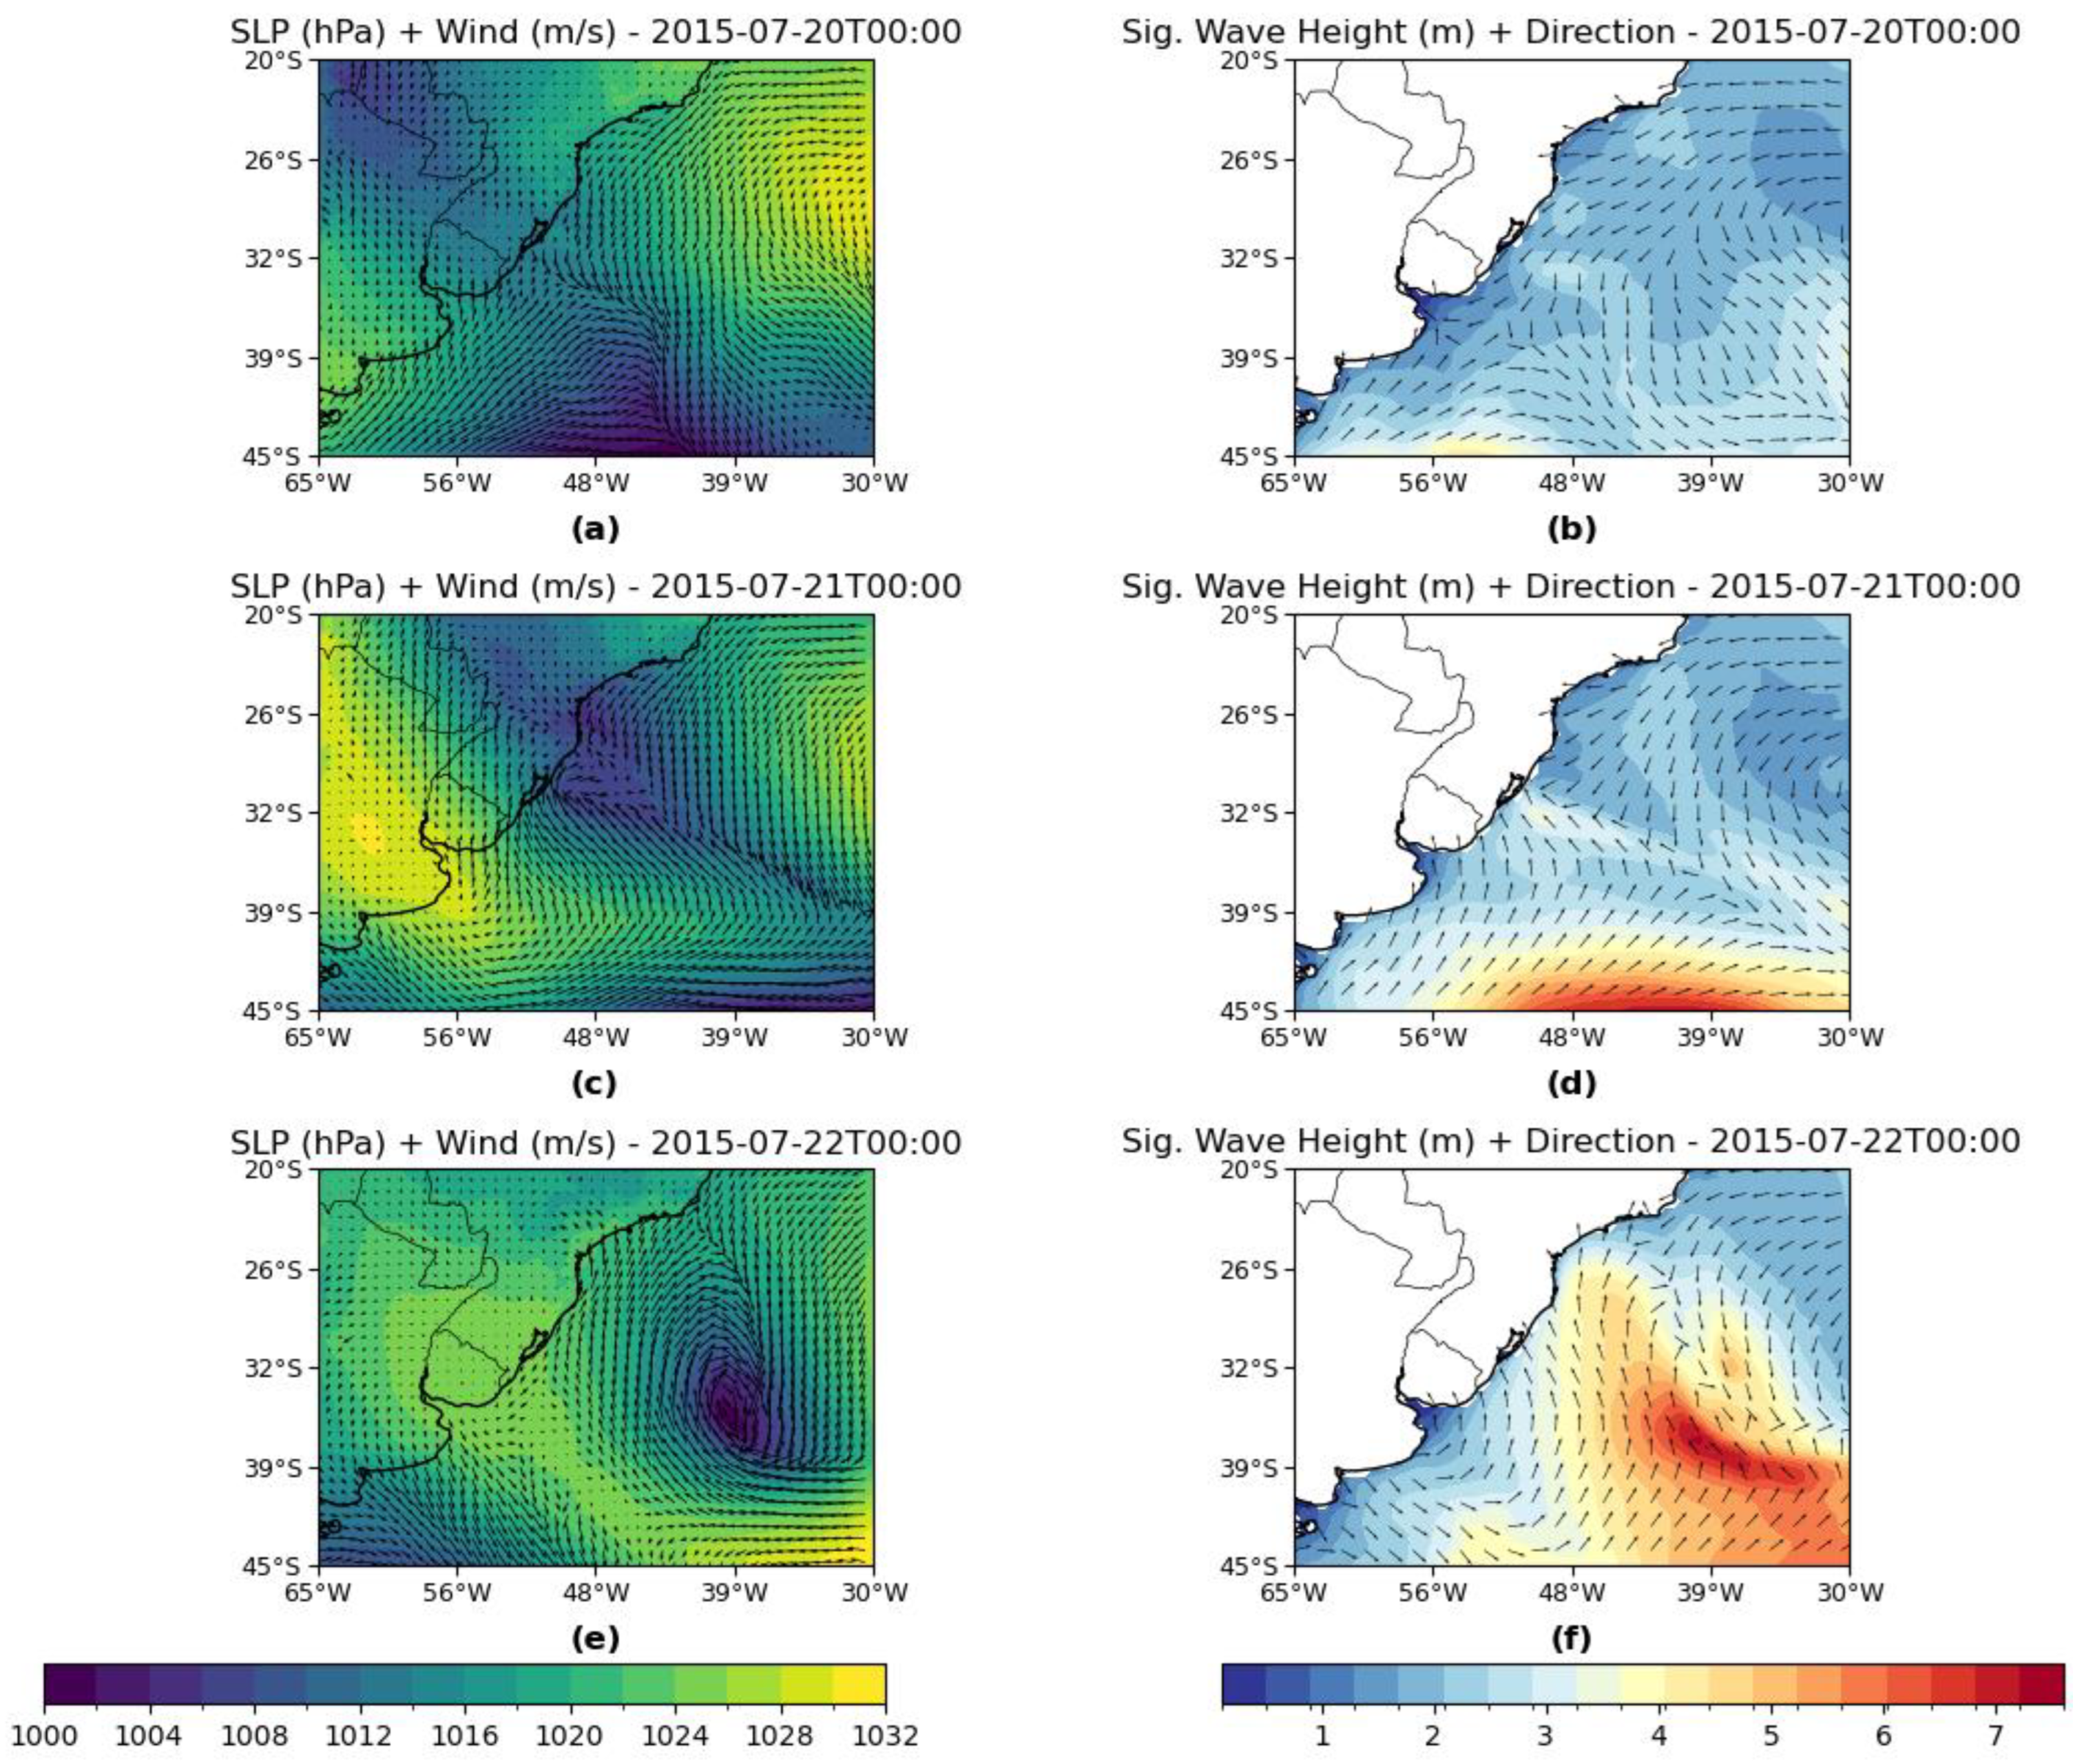
On July 20, 2015, another high-impact coastal storm event struck the coast of Rio Grande do Sul. The episode was characterized by strong southerly winds, with gusts reaching up to 30 kt, and high-energy waves, as reported in both severe weather warnings and pilotage records. The pressure and wind fields (Figure 8a) reveal the influence of a low-pressure system located near 45°S, with the cyclone’s frontal band extending over the coast of Rio Grande do Sul. On July 21 (Figure 8c), the formation of another low-pressure system was observed along the coast of Rio Grande do Sul. By July 22 (Figure 8e), this system had moved farther offshore, and the frontal band was already positioned along the southeastern coast of Brazil. Under these conditions, a well-defined wind fetch developed, associated with a strong pressure gradient that enhanced the generation of high-energy waves across the study area. According to [27], this coastal storm event corresponds to Pattern 3, characterized by a post-frontal high-pressure system centered over Uruguay.
The highest wave heights were recorded between July 21 (Figure 8d) and July 22 (Figure 8f). On the third day, with the system fully developed and moving away from the coast, the continuation of the wind fetch can be observed, followed by a continental high-pressure system in its rear (Figure 8f). The wind vectors indicate a shift in direction, blowing predominantly from the southwest, in contrast to the wave propagation, which remains nearly perpendicular to the coast—likely associated with swell generated by the offshore cyclone.
The analysis of both events clearly demonstrates how systems with different formations can produce similar high-energy outcomes. As observed in Events 07 (2008) and 37 (2015), the interaction between a surface low-pressure system and a subsequent high-pressure system led to the development of intense wind fetches and, consequently, high-energy waves [27]. This type of configuration reappears in several other events analyzed (not shown), explaining its recurrence in the composite fields and its identification as a significant pattern in the EOF analysis, as also reported by [7].
Overall, the synoptic analysis of cases such as those in May 2008 and July 2015 provides a clear visualization of the atmospheric and oceanic processes associated with high-impact coastal storm events. Furthermore, these cases are highly representative, as they highlight the main features identified in both the wave and pressure–wind fields, consistent with the key patterns found throughout this study and in previous works such as [27,28].
4. Conclusions
This study aimed to identify the main meteo-oceanographic components responsible for the occurrence of high-energy coastal storm events along the southern coast of Brazil between 2000 and 2020. It also sought to examine the relationship between these systems and their impact on coastal and port areas, particularly the city of Rio Grande.
A total of 51 coastal storm events were identified within the study period in the Alpha Zone, with the majority occurring during the winter months, followed by autumn, spring, and summer. The years 2008 and 2015 stood out as the most energetic, while 2002, 2004, 2009, 2010, and 2012 exhibited fewer high-impact events. No events meeting the study’s selection criteria were recorded in 2001, 2003, 2005, 2006, or after 2016. The coupling between atmospheric and oceanic components was clearly observed in both pressure–wind and wave fields and further reinforced by the dominant spatial patterns revealed through EOF analysis.
The case studies of high-impact events (Events 07 and 37) illustrated, at the synoptic scale, how variations in atmospheric pressure and wind fields translate into oceanic responses that directly affect the operational practicability of the Rio Grande channel. The findings indicate that high-impact coastal storm events associated with extratropical cyclones tend to occur more frequently during the colder months. These events are typically linked to meteorological configurations that favor extensive wind fetches, predominantly from the south and southeast, resulting in waves propagating nearly perpendicular to the coastline throughout the study area.
In this sense, the present work represents a step toward a broader understanding of the meteoceanographic patterns associated with high-energy coastal events. Future research should apply additional analytical approaches to enable intercomparison among datasets and to validate the patterns identified here. Although the ERA5 reanalysis proved to be a reliable data source, the integration of alternative observational datasets could further improve the robustness of the results. Likewise, further exploration of the relationship between coastal storm events and the operational practicability of the Rio Grande channel remains an important research avenue.
Building on these results, future studies should investigate the links between environmental variables and their impacts, following the approach presented in the ANTAQ report, and, where possible, quantify the socio-economic consequences of these events. Extending these analyses to other coastal regions may reveal broader spatial risk patterns. At the same time, a more detailed investigation of previously identified phenomena can enhance our understanding of the processes driving high-energy events. Overall, this study contributes not only to advancing scientific knowledge but also to strengthening coastal management and resilience in the face of climate change and extreme marine events.
Author Contributions
Conceptualization, L.P.M., J.P.M. and J.B.S.; methodology, L.P.M., J.P.M., J.B.S. and D.G.B.; investigation, L.P.M. and J.P.M.; data curation, L.P.M. and D.G.B.; writing—original draft preparation, L.P.M. and J.P.M; writing—review and editing, L.P.M., J.P.M, J.B.S., D.G.B., E.S.G. and H.N.A. All authors have read and agreed to the published version of the manuscript.
Funding
This research was funded by Conselho Nacional de Desenvolvimento Científico e Tecnológico (CNPq) of Brazil, grant number 406769/2021–4 and 406763/2022–4.
Data Availability Statement
The reanalysis products are available as follows: ERA5 hourly data on single levels from 1940 to present is from https://cds.climate.copernicus.eu/datasets/reanalysis-era5-single-levels?tab=download.
Acknowledgments
To the Human Resources Program in Petroleum, Natural Gas, and Biofuels of the Federal University of Rio Grande – PRH 22/FURG, for granting a research scholarship to the first author. We thank the Brazilian Navy for providing the Adverse Weather Warning and the Piloting Authority of the Port of Rio Grande (RG Pilots) for supplying the operational conditions.
Conflicts of Interest
The authors declare no conflicts of interest.
Abbreviations
The following abbreviations are used in this manuscript:
| CHM | Centro de Hidrografia da Marinha (Brazilian Navy Hydrographic Center) |
| ERA5 | ECMWF Reanalysis version 5 |
| ECMWF | European Centre for Medium-Range Weather Forecasts |
| EOF | Empirical Orthogonal Function |
| ENSO | El Niño–Southern Oscillation |
| DJF | December–January–February |
| MAM | March–April–May |
| JJA | June–July–August |
| SON | September–October–November |
| MSLP | Mean Sea Level Pressure |
| SWH | Significant Wave Height |
| SST | Sea Surface Temperature |
| ANTAQ | Agência Nacional de Transportes Aquaviários (National Waterway Transport Agency) |
| UTC | Coordinated Universal Time |
References
- Gramcianinov, C.B.; Camargo, R.; Campos, R.M.; Soares, C.G.; Silva Dias, P.L. Impact of extratropical cyclone intensity and speed on extreme wave trends in the Atlantic Ocean. Climate Dynamics 2023, 60, 1447–1466. [CrossRef]
- Henry, A.J. J. Bjerknes and H. Solberg on the life cycle of cyclones and the polar front theory of atmospheric circulation. Monthly Weather Review 1922, 50, 468–473. [CrossRef]
- Marrafon, V.H.; Reboita, M.S. Characteristics of precipitation in South America revealed through climate indices. Brazilian Journal of Climatology 2021, 26(16), 663–676. (in Portuguese).
- Saraiva, J.M.; Bedran, C.; Carneiro, C. Monitoring of storm surges on Cassino Beach, RS, Brazil. Journal of Coastal Research 2003, 19(2), 323–331.
- Eguchi, B.; Albino, J. Influence of climate variability modes on coastal storm events in southern Espírito Santo, Brazil. Brazilian Journal of Climatology 2021, 17, 165–183. (in Portuguese).
- Pond, S.; Pickard, G.L. Introductory Dynamical Oceanography, 2nd ed.; Pergamon Press: New York, NY, USA, 1986; 321 pp.
- Bitencourt, D.P.; Quadro, M.F.L.; Calbeti, N.O. Analysis of two storm surge events on the southern coast of Brazil during the summer of 2002. In Proceedings of the XII Brazilian Congress of Meteorology, Foz do Iguaçu, Brazil, 2002; pp. 3910–3917. (in Portuguese).
- Truccolo, E.C. Meteorological tides and local wind stress in São Francisco do Sul, SC. Master’s Thesis, Federal University of Santa Catarina, Florianópolis, Brazil, 1998; 116 pp. (in Portuguese).
- Marone, E.; Camargo, R. Meteorological tides on the coast of Paraná State: The event of 18 August 1993. Nerítica 1994, 8, 73–85. (in Portuguese).
- Garcia, C.A.E. The environment and biota of the Patos Lagoon estuary: Tides and currents. In The Coastal and Marine Ecosystems of the Extreme South of Brazil; Seeliger, U.; Odebrecht, C.; Castello, J.P., Eds.; Ecoscientia Press: Rio Grande, Brazil, 1997; pp. 18–21.
- Sinclair, M.R. An objective cyclone climatology for the Southern Hemisphere. Monthly Weather Review 1994, 122, 2239–2256. [CrossRef]
- Mendes, D.; Souza, E.P.; Marengo, J.A.; Mendes, M.C.D. Climatology of extratropical cyclones over the South American–Southern Ocean sector. Theoretical and Applied Climatology 2009, 100, 239–250. [CrossRef]
- Necco, G.V. Behavior of cyclonic vortices in the South American region during the FGGE: Trajectories and developments. Meteorológica 1982, 13, 21–34. (in Portuguese).
- Gan, M.A.; Rao, V.B. Surface cyclogenesis over South America. Monthly Weather Review 1991, 119, 1293–1302. [CrossRef]
- Murty, T.S. Storm Surges—Meteorological Ocean Tides; Friesen Printers Ltd.: Ottawa, Canada, 1984; 897 pp.
- Nicolodi, J.L.; Petermann, R.M. Climate change and vulnerability of the Brazilian coastal zone: Environmental, social and technological aspects. Journal of Integrated Coastal Zone Management 2010, 10, 151–177. (in Portuguese).
- ANTAQ. Impacts and Risks of Climate Change on Brazilian Public Coastal Ports—Executive Summary; National Waterway Transport Agency: Brasília, Brazil, 2021. Available online: https://www.gov.br/antaq/pt-br.
- Gan, M.A.; Seluchi, M.E. Cyclones and cyclogenesis. In Weather and Climate in Brazil; Cavalcanti, I.F.A. et al., Eds.; Oficina de Textos: São Paulo, Brazil, 2009; pp. 111–126. (in Portuguese).
- Reboita MS, Rocha RP da, Ambrizzi T, Gouveia CD. Trend and teleconnection patterns in the climatology of extratropical cyclones over the Southern Hemisphere [Internet]. Climate Dynamics. 2015 ; 45 1929-1944. Available from: . [CrossRef]
- Mendes, D.; Souza, E.P.; Trigo, I.F.; Miranda, P.M.A. On precursors of South American cyclogenesis. Tellus A: Dynamic Meteorology and Oceanography 2007, 59, 114–121. [CrossRef]
- Reboita, M.S.; Simões, M.; Gan, M.A.; Ambrizzi, T. Precipitation regimes in South America: A literature review. Brazilian Journal of Meteorology 2010, 25, 185–204. (in Portuguese).
- Pampuch, L.A.; Ambrizzi, T. Frontal systems over South America—Part II: Monthly monitoring in NCEP/NCAR Reanalysis I data. Science and Nature Journal 2016, 38, 105–110. (in Portuguese).
- Cuchiara, D.C.; Fernandes, E.H.L.; Strauch, J.C.D.S.; Calliari, L.J. Numerical modeling of wave behavior along the coast of Rio Grande do Sul. Brazilian Journal of Coastal Studies 2006.
- Parise, C.K.; Calliari, L.J.; Krusche, N. Extreme storm surges in southern Brazil: Atmospheric conditions and shore erosion. Brazilian Journal of Oceanography 2009, 57, 175–188. [CrossRef]
- Hersbach, H.; Bell, B.; Berrisford, P.; et al. The ERA5 global reanalysis. Quarterly Journal of the Royal Meteorological Society 2020, 146, 1999–2049. [CrossRef]
- Eguchi, B.; Klumb-Oliveira, L. Storm wave climate along the Brazilian coast using 41 years of ECMWF ERA5 reanalysis data. Brazilian Journal of Climatology 2023, 32, 544–565. (in Portuguese).
- Machado, J.P.; Miranda, G.S.B.; Gozzo, L.F.; Custódio, M.D.S. Atmospheric conditions associated with storm surge events on the southern and southeastern coast of Brazil during the 2015/2016 El Niño. Brazilian Journal of Meteorology 2019, 34, 529–544. (in Portuguese).
- Marinho, Y.B.; Machado, J.P.; Saraiva, J.M.B. Atmospheric patterns associated with storm surge events along the southern coast of Brazil. Brazilian Journal of Climatology 2024, 35, 124–154. (in Portuguese).
- Brazilian Navy Hydrography Center (CHM). Severe Weather Warnings. Available online: https://www.marinha.mil.br/chm/dados-do-smm-avisos-de-mau-tempo.
- Bjornsson, H.; Venegas, S.A. A Manual for EOF and SVD Analyses of Climate Data; CCGCR Report No. 97-1; Climate Research Branch, Environment Canada: Montreal, Canada, 1997; 52 pp.
- Jantsch, M. Climatology of extratropical cyclones and storm surges on the southern and southeastern coast of Brazil between 1979 and 2020. Master’s Thesis, Federal University of Pelotas, Pelotas, Brazil, 2024; 150 pp. (in Portuguese).
- Cavalcanti, I.F.A. Weather and Climate in Brazil; Oficina de Textos: São Paulo, Brazil, 2009; 463 pp. (in Portuguese).
- Reboita, M.S.; Krusche, N. Provisional climatological normals from 1991 to 2010 for Rio Grande, RS. Brazilian Journal of Meteorology 2018, 33(1), 165–179. (in Portuguese).
- Möller, O.O.; Castaing, P.; Salomon, J.C.; Lazure, P. The influence of local and non-local forcing effects on the subtidal circulation of Patos Lagoon. Estuaries 2001, 24, 297–311. [CrossRef]
- Reboita, M.S.; Iwabe, C.M.N.; Rosmeri, P.R.; Ambrizzi, T. Analysis of a semi-stationary cyclone on the southern coast of Brazil associated with atmospheric blocking. Brazilian Journal of Meteorology 2009, 24(4), 407–422. (in Portuguese).
- Parise, C.K. Study of wave variability in the South Atlantic Ocean and the energy contribution of an intense extratropical cyclone to offshore wave spectra near Rio Grande do Sul. Ph.D. Thesis, Federal University of Rio Grande, Rio Grande, Brazil, 2010; 210 pp. (in Portuguese).
- Pianca, C.; Mazzini, P.L.F.; Siegle, E. Brazilian offshore wave climate based on NWW3 reanalysis. Brazilian Journal of Oceanography 2010, 58, 53–70. [CrossRef]
Figure 1.
Map of the study area.
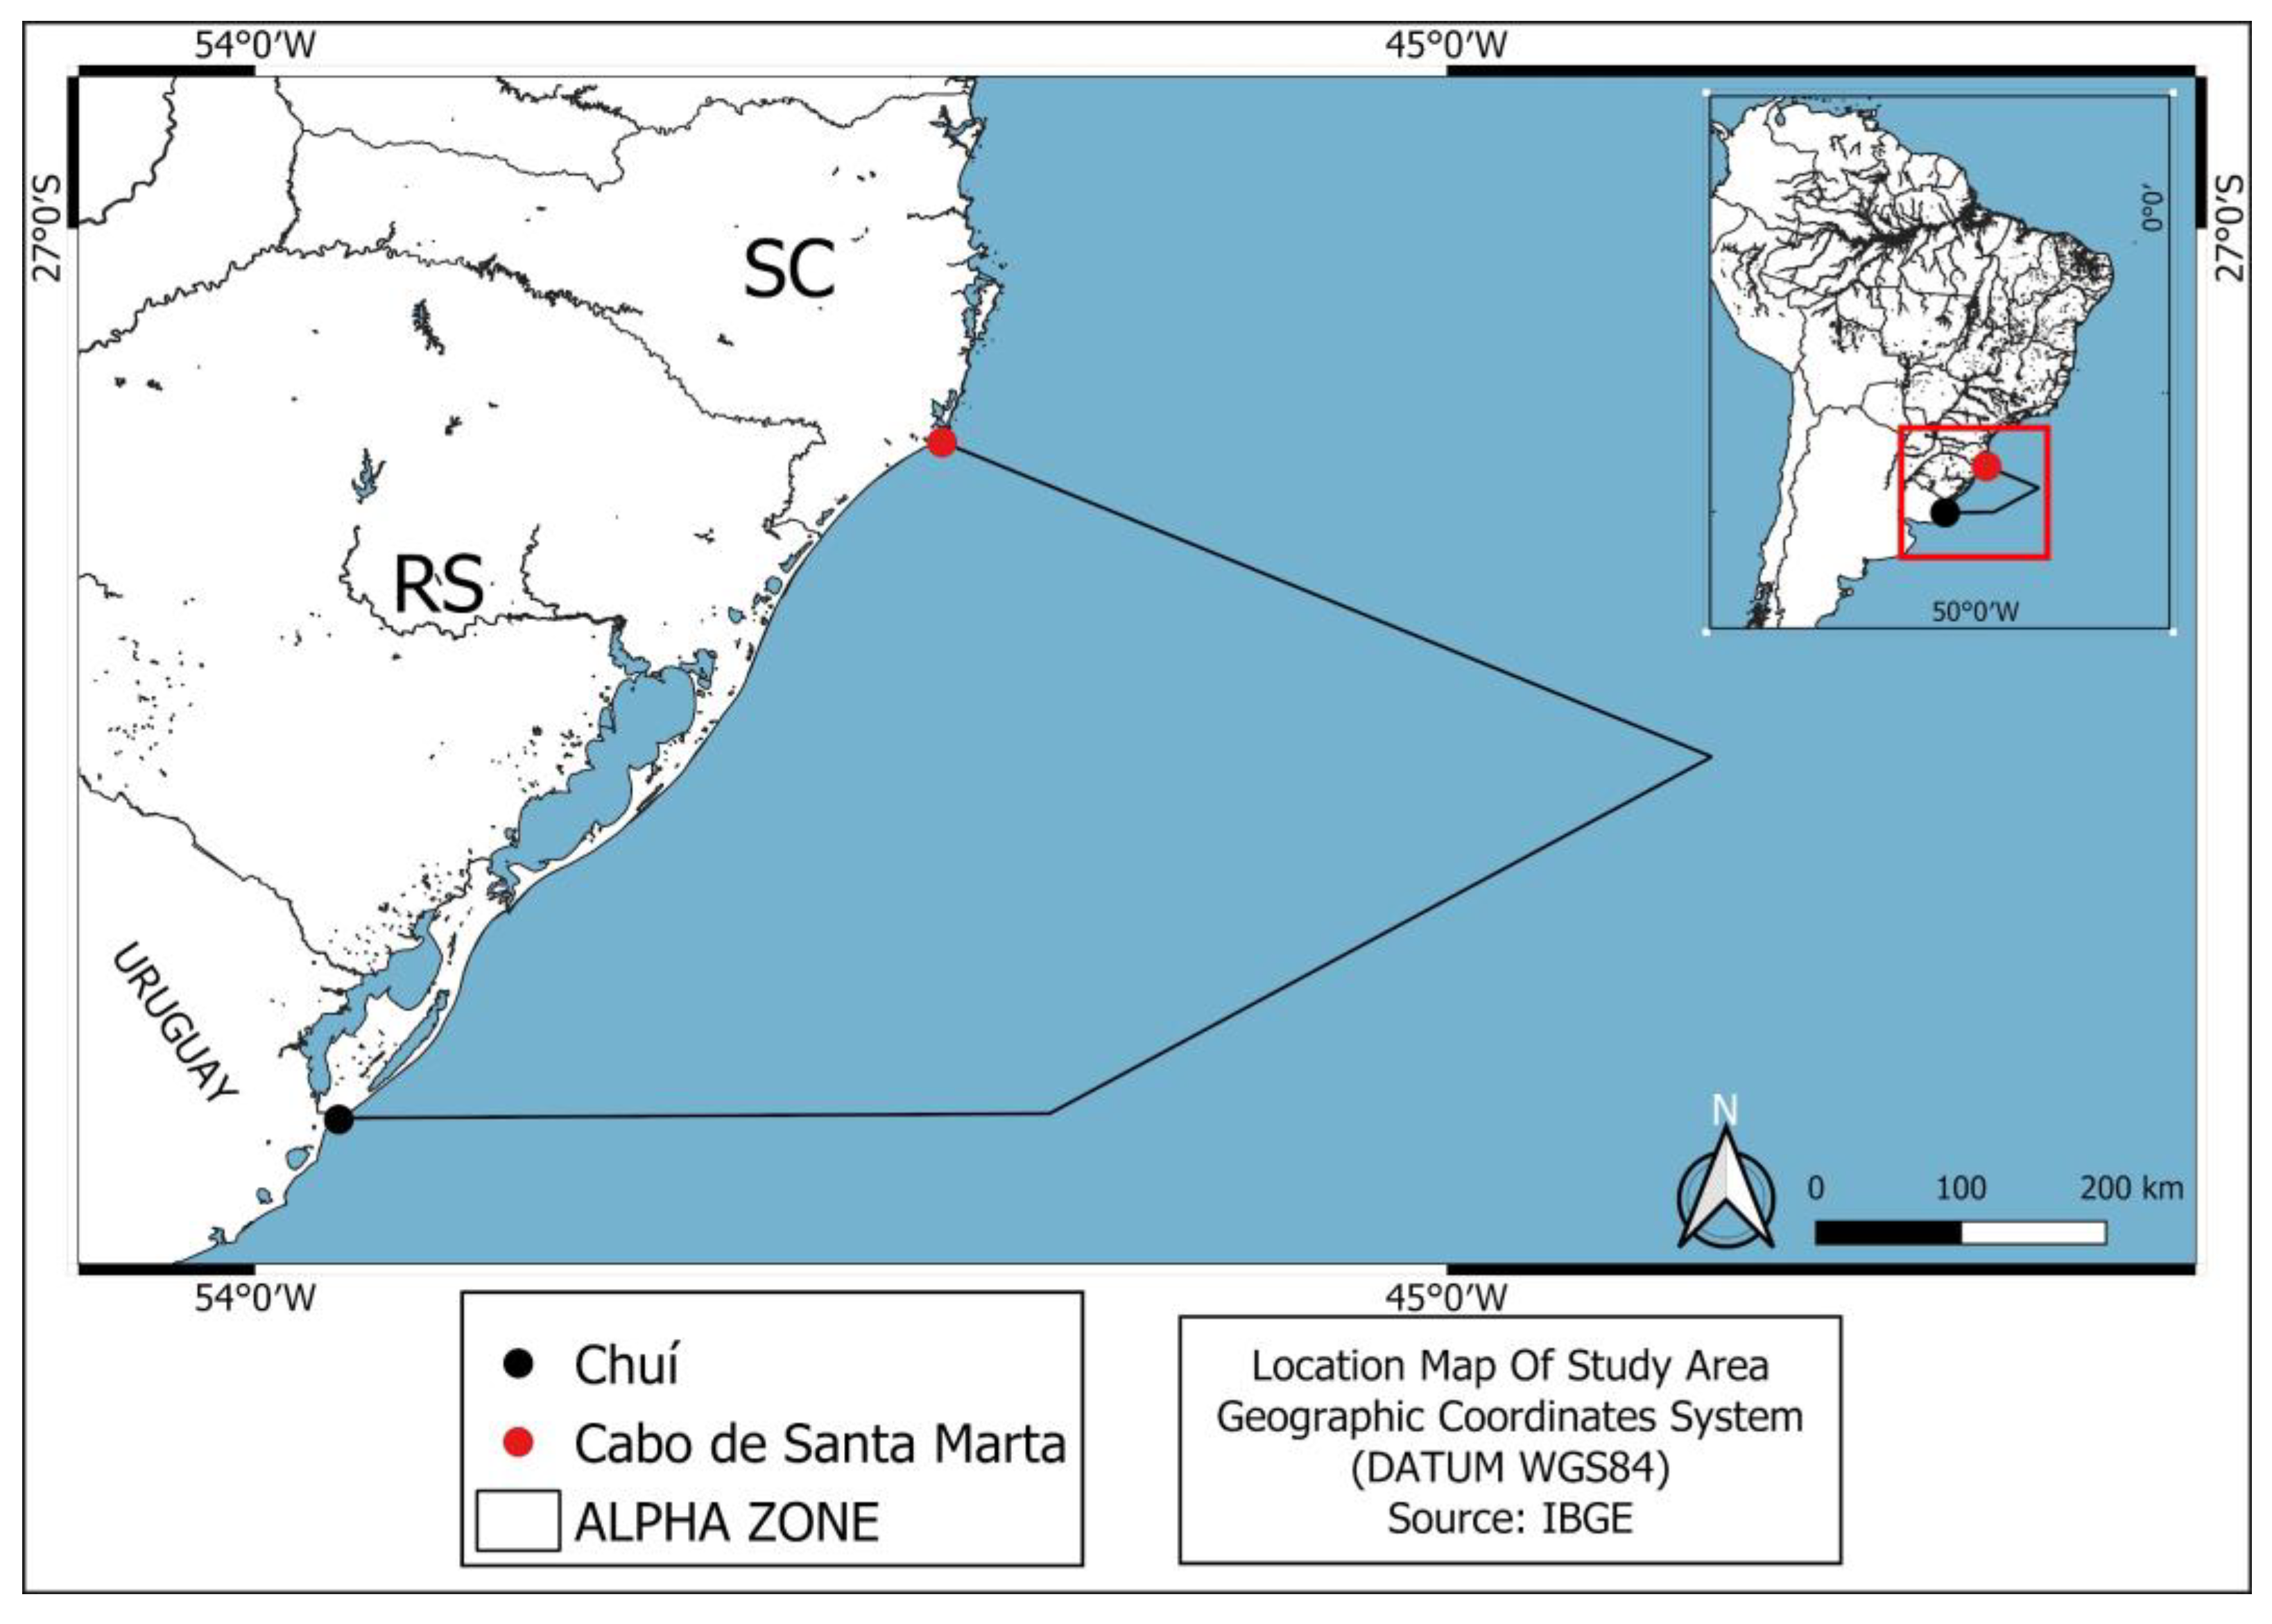
Figure 2.
Seasonal and annual frequency distribution of coastal storm events between 2002 and 2016.
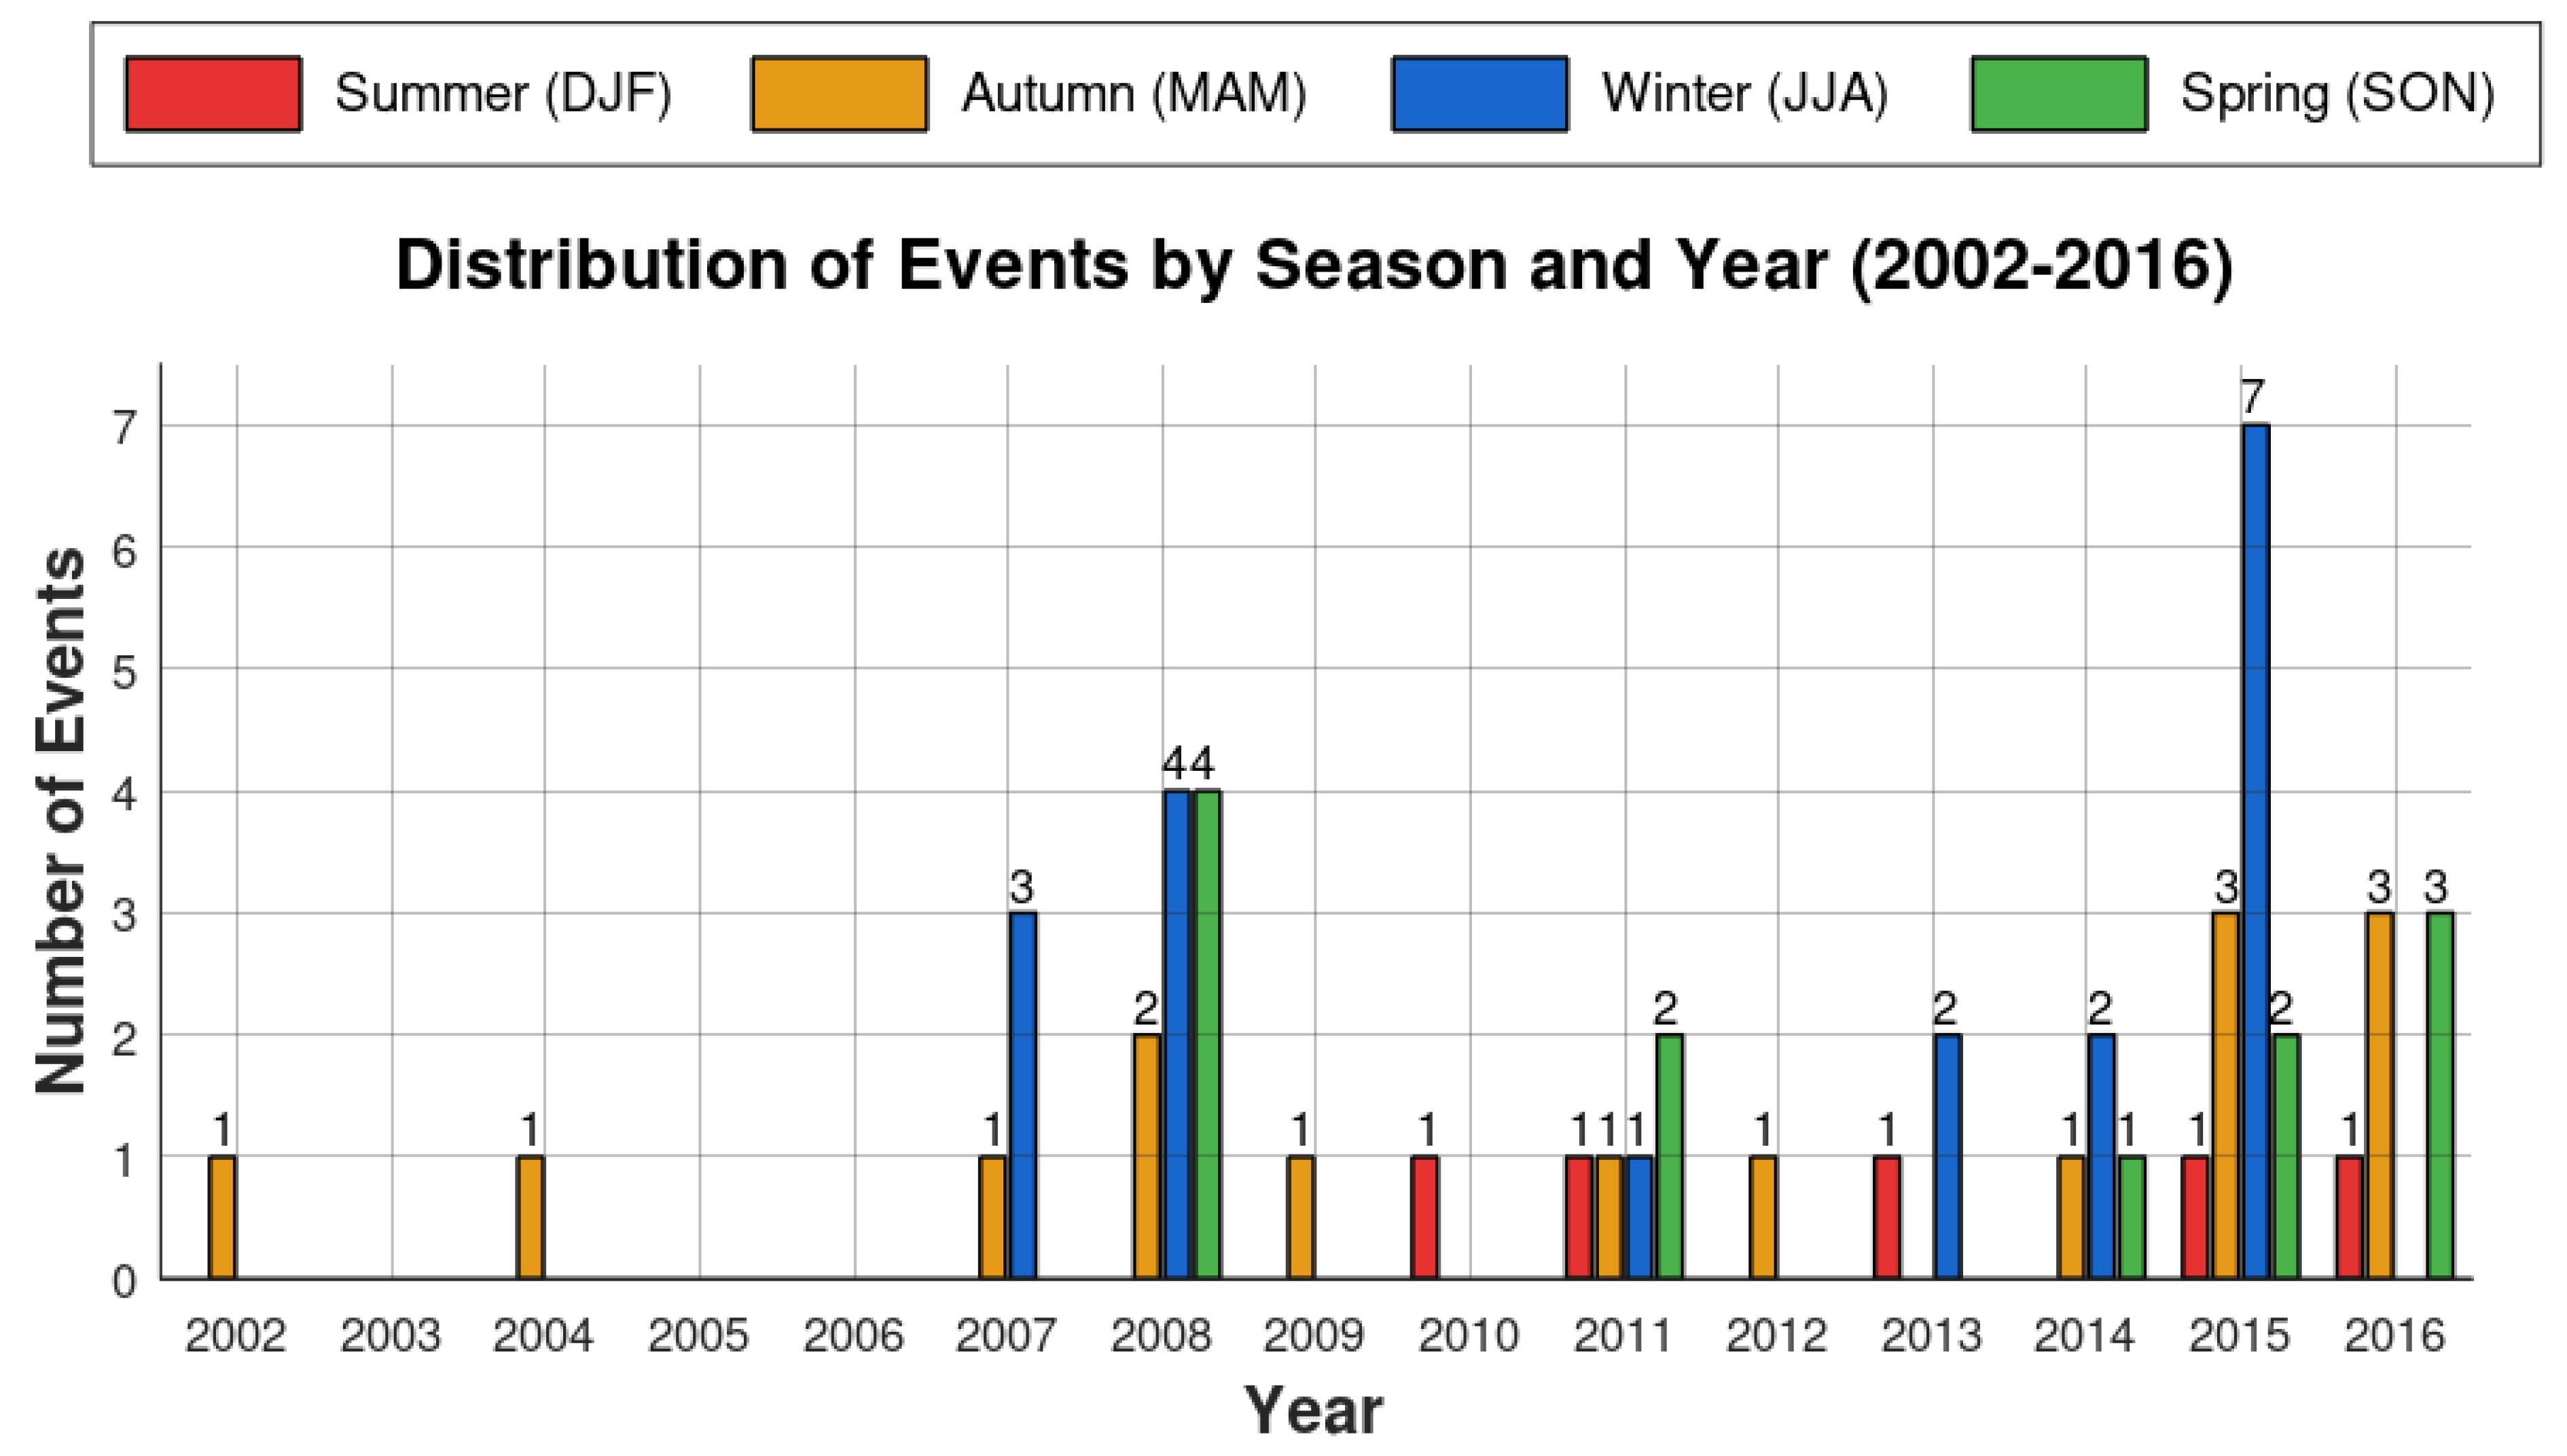
Figure 3.
Seasonal composite fields of mean sea level pressure (hPa) and mean wind during coastal storm events between 2002 and 2016. Summer (a), Autumn (b), Winter (c), Spring (d), and Total mean (e).
Figure 3.
Seasonal composite fields of mean sea level pressure (hPa) and mean wind during coastal storm events between 2002 and 2016. Summer (a), Autumn (b), Winter (c), Spring (d), and Total mean (e).
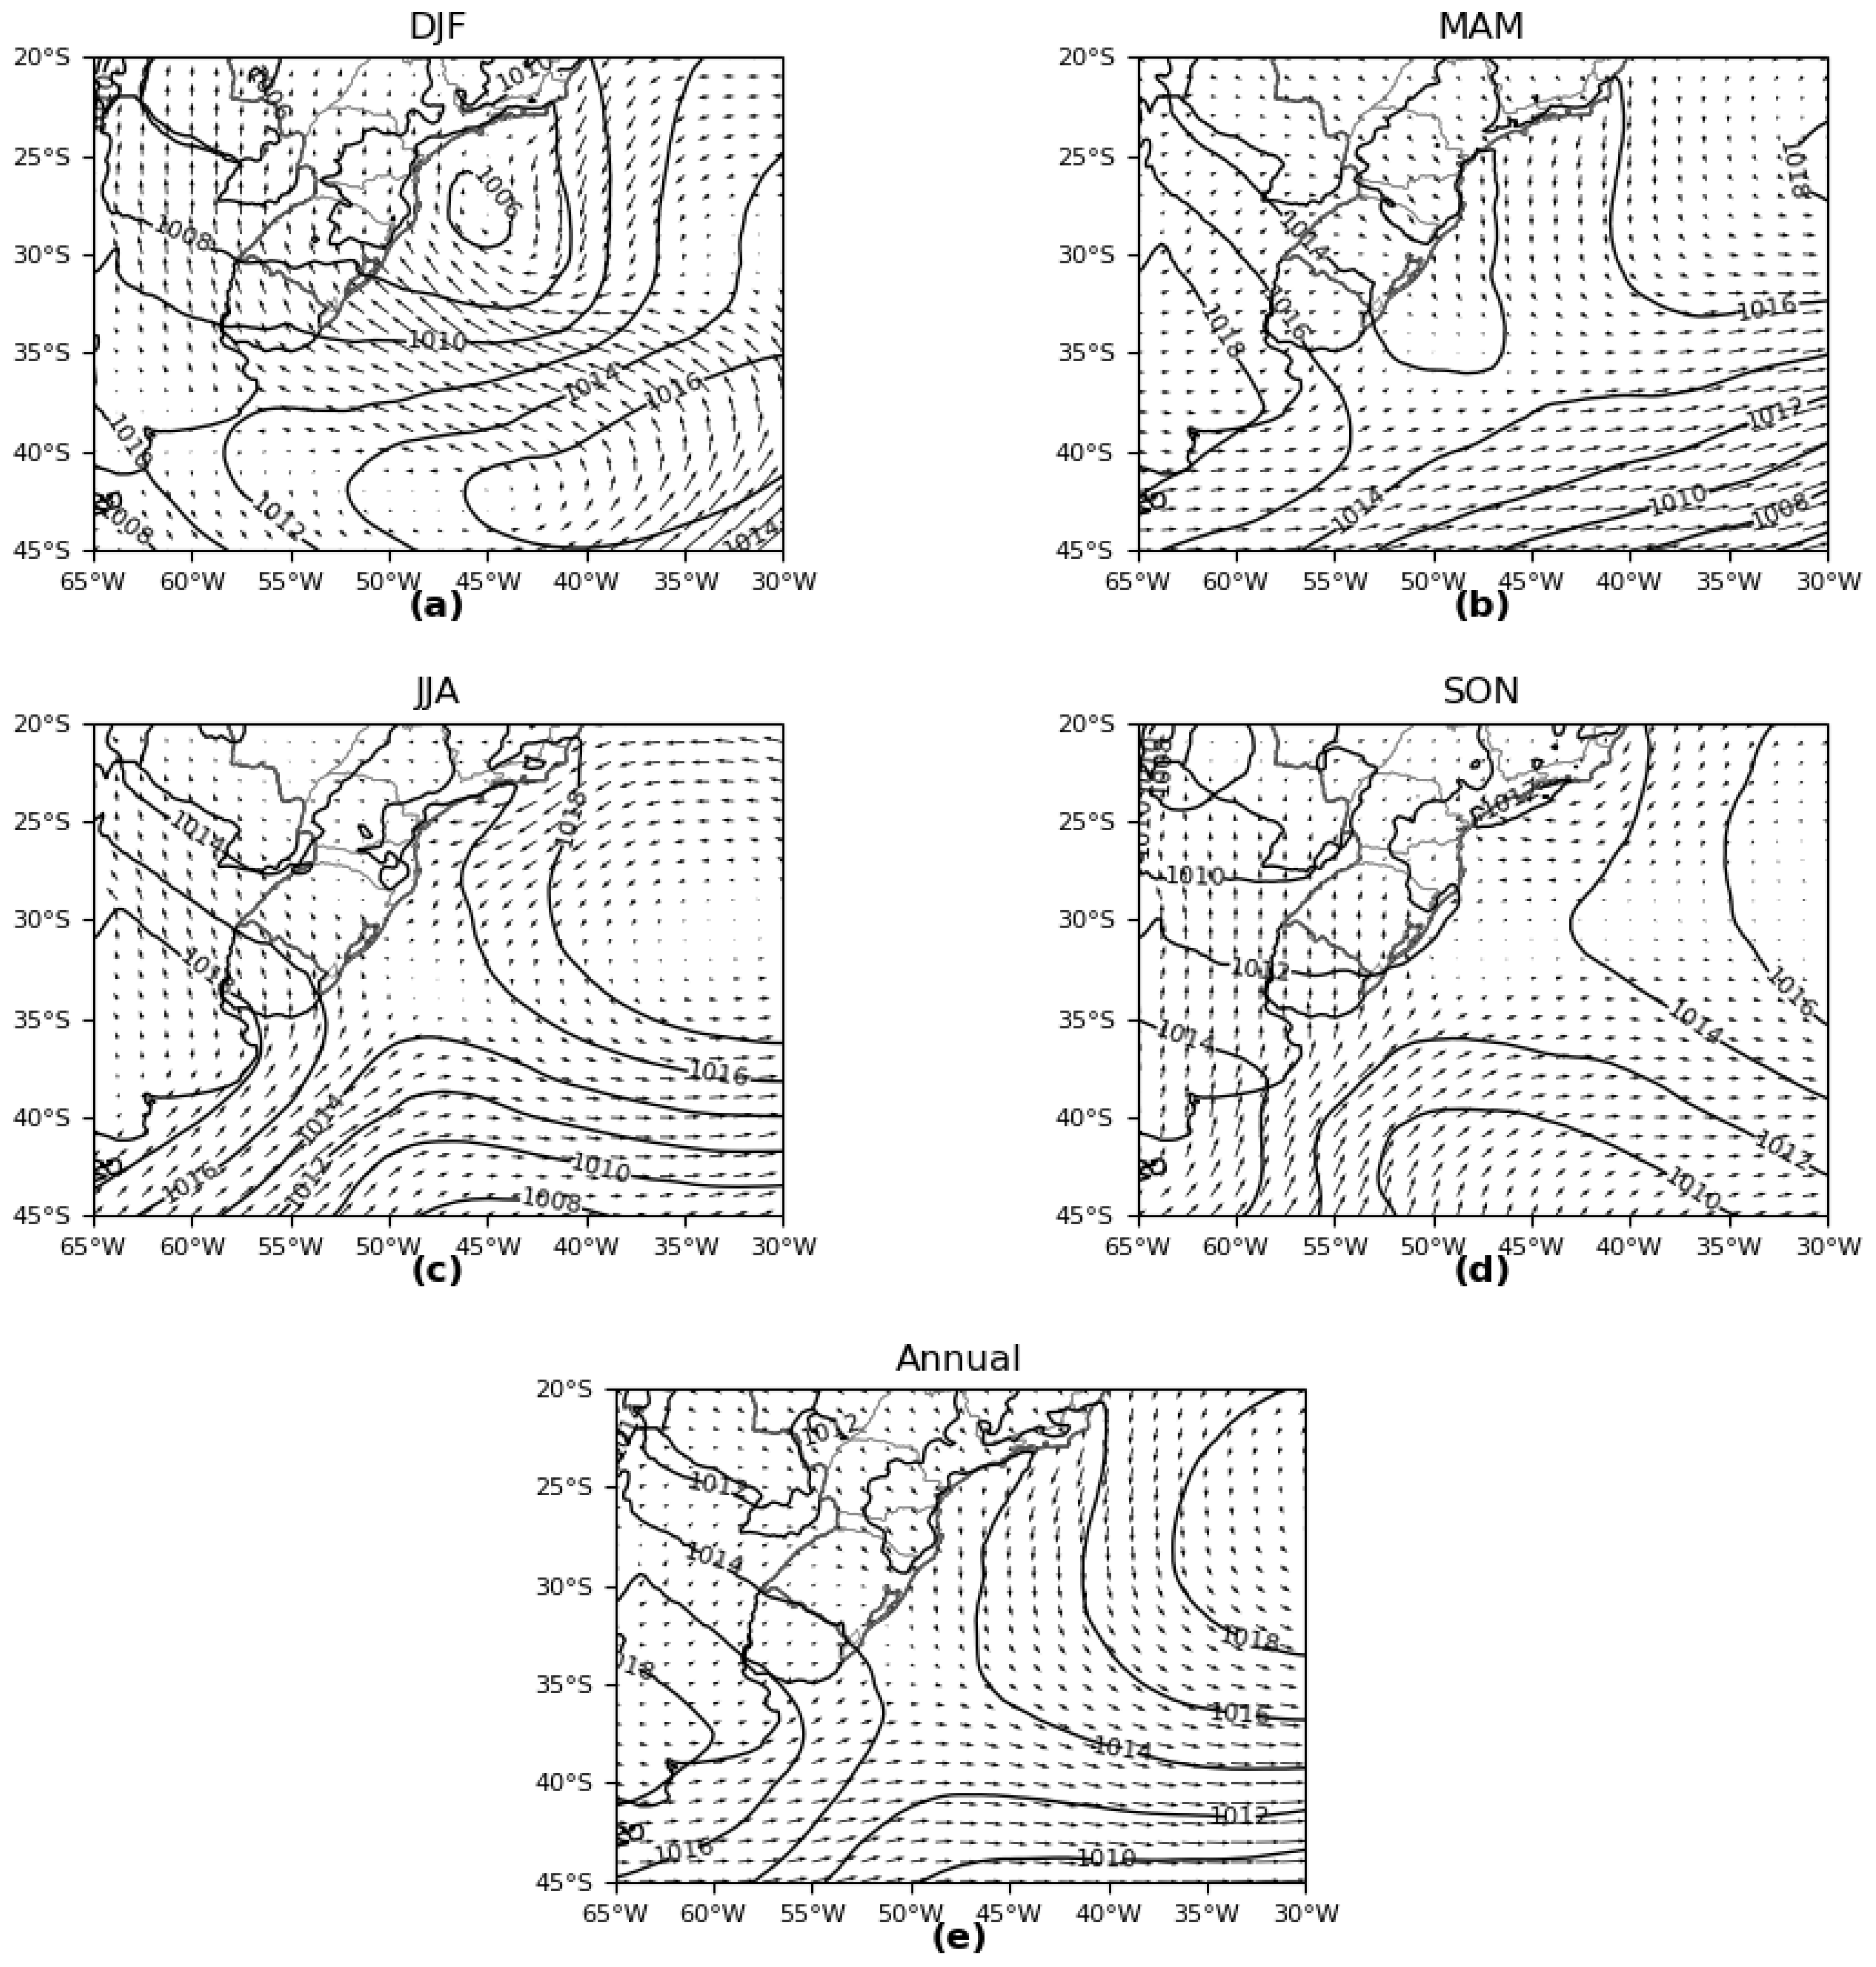
Figure 4.
Seasonal composite fields of significant wave height (m) and mean wave direction for coastal storm events between 2002 and 2016. Summer (a), Autumn (b), Winter (c), Spring (d), and Total mean (e).
Figure 4.
Seasonal composite fields of significant wave height (m) and mean wave direction for coastal storm events between 2002 and 2016. Summer (a), Autumn (b), Winter (c), Spring (d), and Total mean (e).
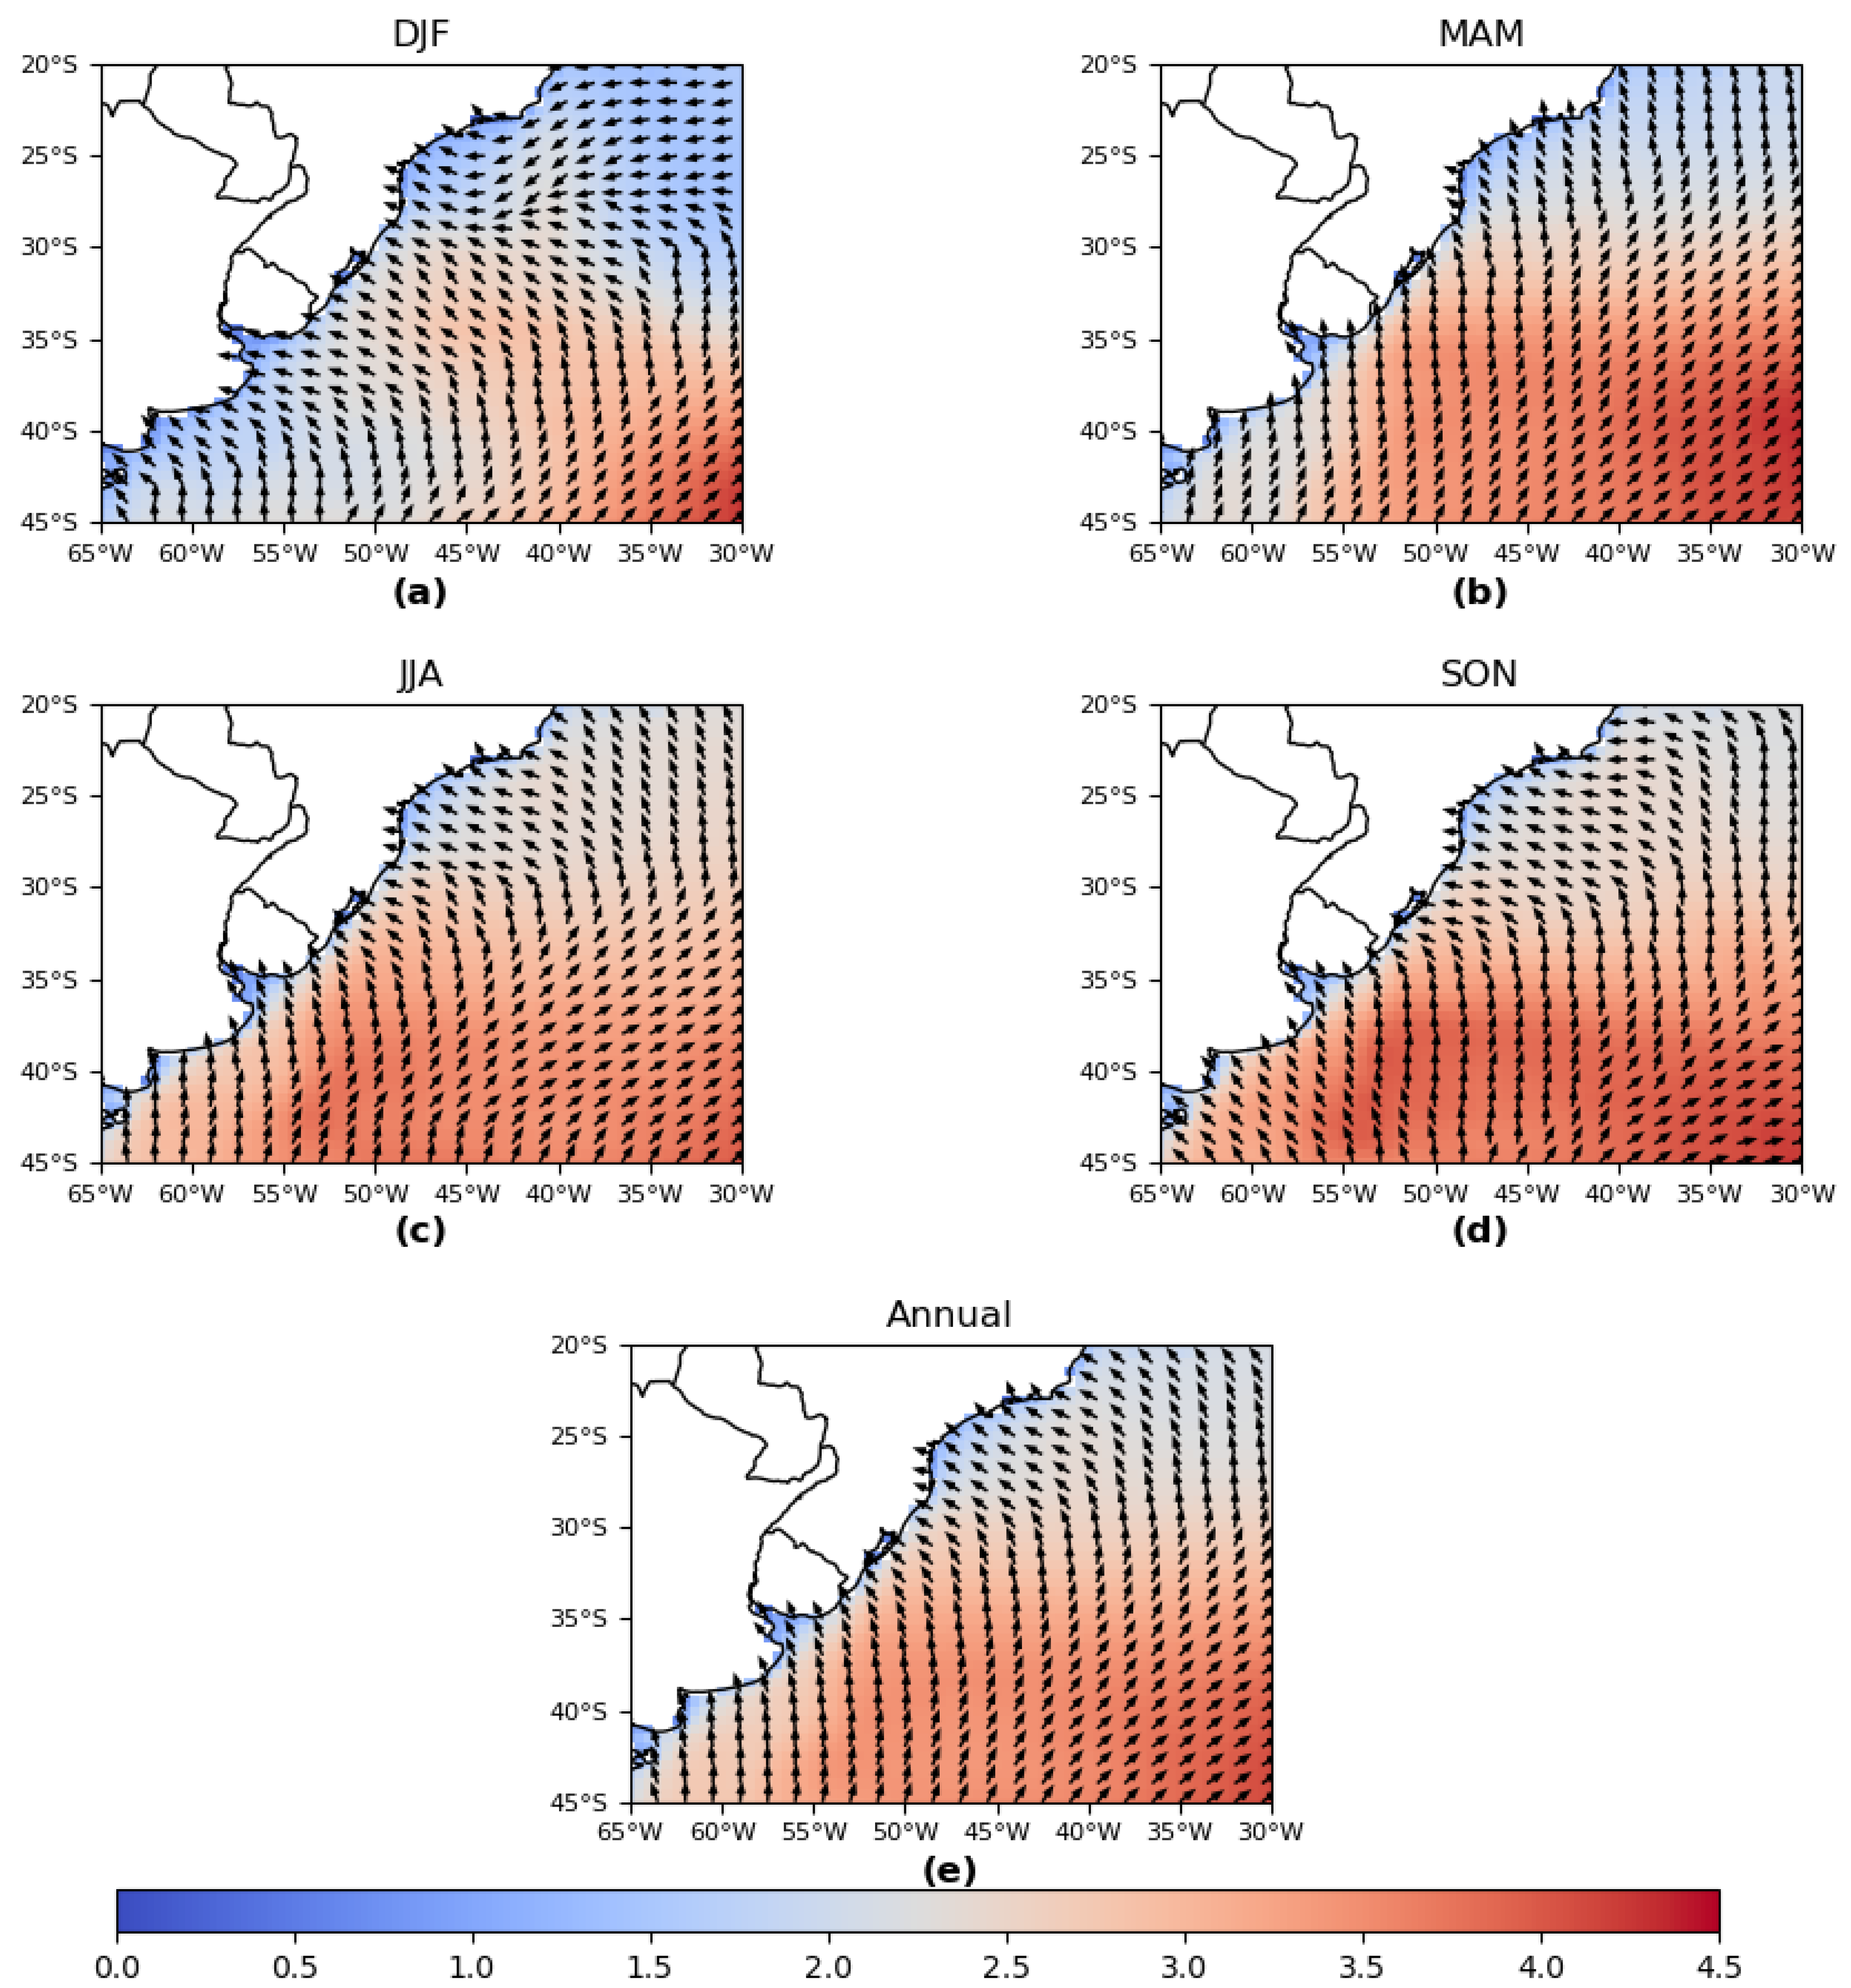
Figure 5.
Spatial patterns of EOFs 1 and 2 of mean sea level pressure fields during coastal storm events between 2002 and 2016. EOF 1 DJF (a), EOF 2 DJF (b), EOF 1 MAM (c), EOF 2 MAM (d), EOF 1 JJA (e), EOF 2 JJA (f), EOF 1 SON (g), EOF 2 SON (h), EOF 1 Total mean (i); and EOF 2 Total mean (j).
Figure 5.
Spatial patterns of EOFs 1 and 2 of mean sea level pressure fields during coastal storm events between 2002 and 2016. EOF 1 DJF (a), EOF 2 DJF (b), EOF 1 MAM (c), EOF 2 MAM (d), EOF 1 JJA (e), EOF 2 JJA (f), EOF 1 SON (g), EOF 2 SON (h), EOF 1 Total mean (i); and EOF 2 Total mean (j).
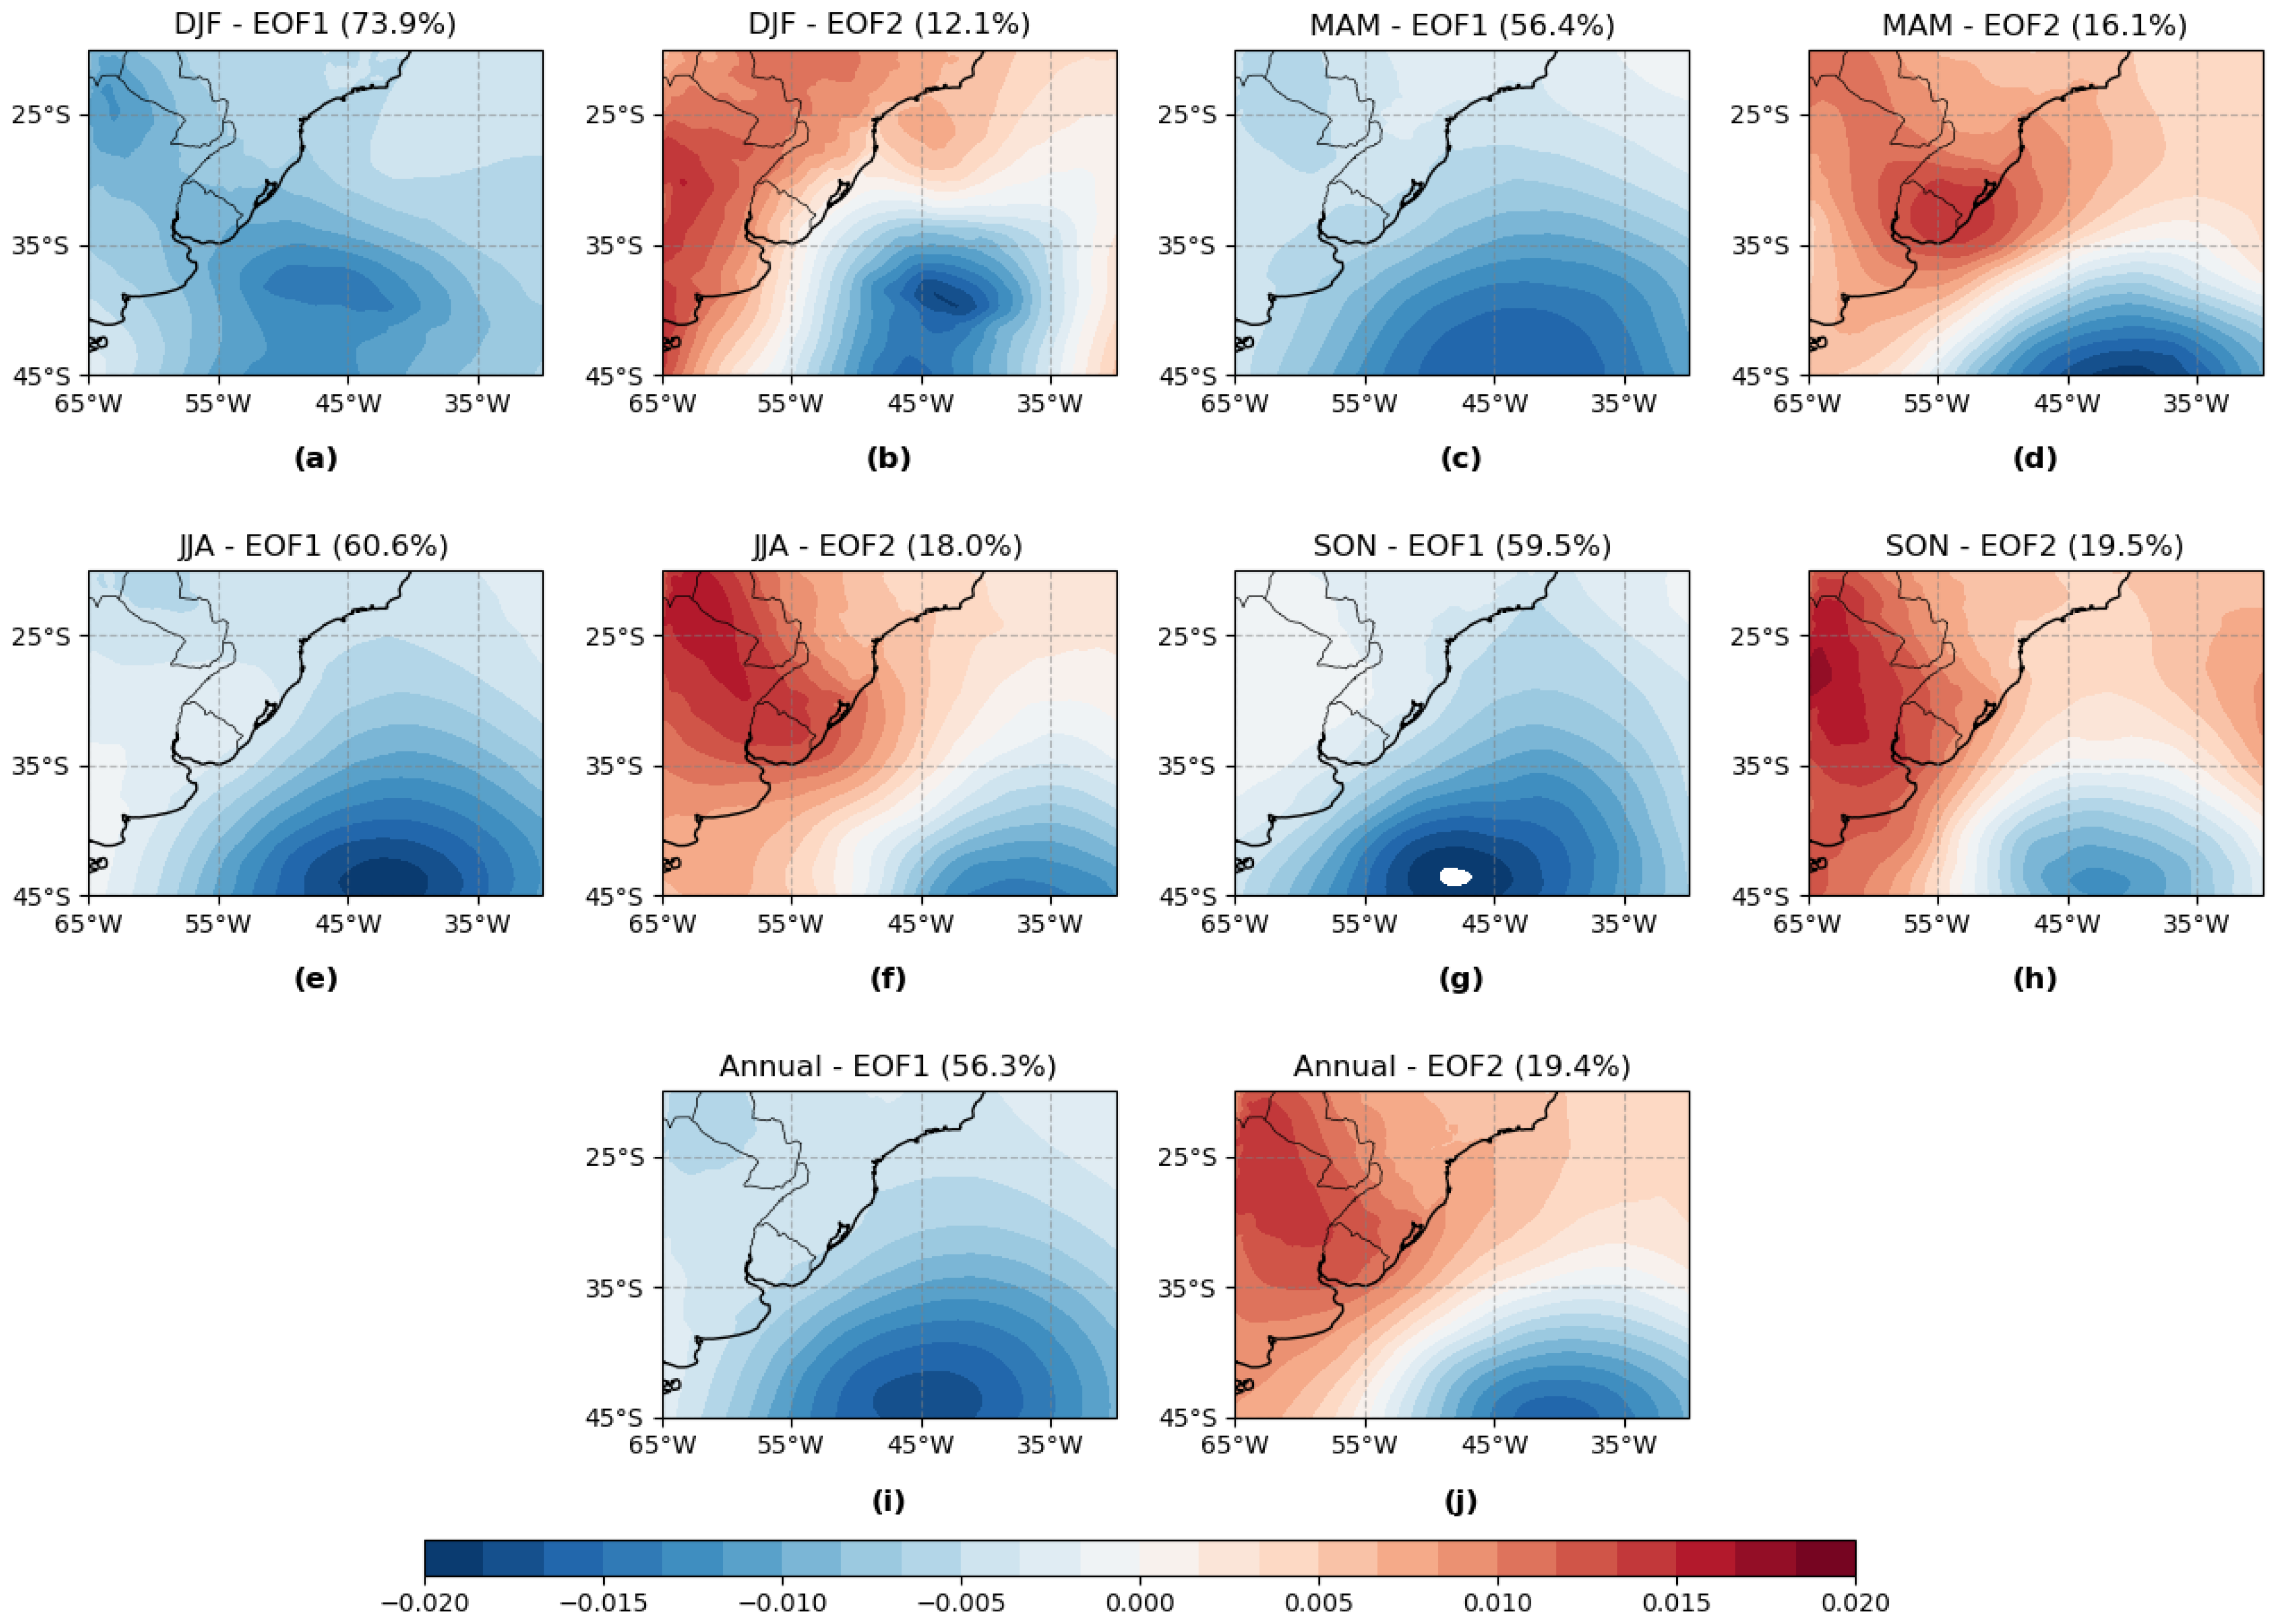
Figure 6.
Spatial patterns of EOFs 1 and 2 of significant wave height fields during coastal storm events between 2002 and 2016. EOF 1 DJF (a), EOF 2 DJF (b), EOF 1 MAM (c), EOF 2 MAM (d), EOF 1 JJA (e), EOF 2 JJA (f), EOF 1 SON (g), EOF 2 SON (h), EOF 1 Total mean (i); and EOF 2 Total mean (j).
Figure 6.
Spatial patterns of EOFs 1 and 2 of significant wave height fields during coastal storm events between 2002 and 2016. EOF 1 DJF (a), EOF 2 DJF (b), EOF 1 MAM (c), EOF 2 MAM (d), EOF 1 JJA (e), EOF 2 JJA (f), EOF 1 SON (g), EOF 2 SON (h), EOF 1 Total mean (i); and EOF 2 Total mean (j).
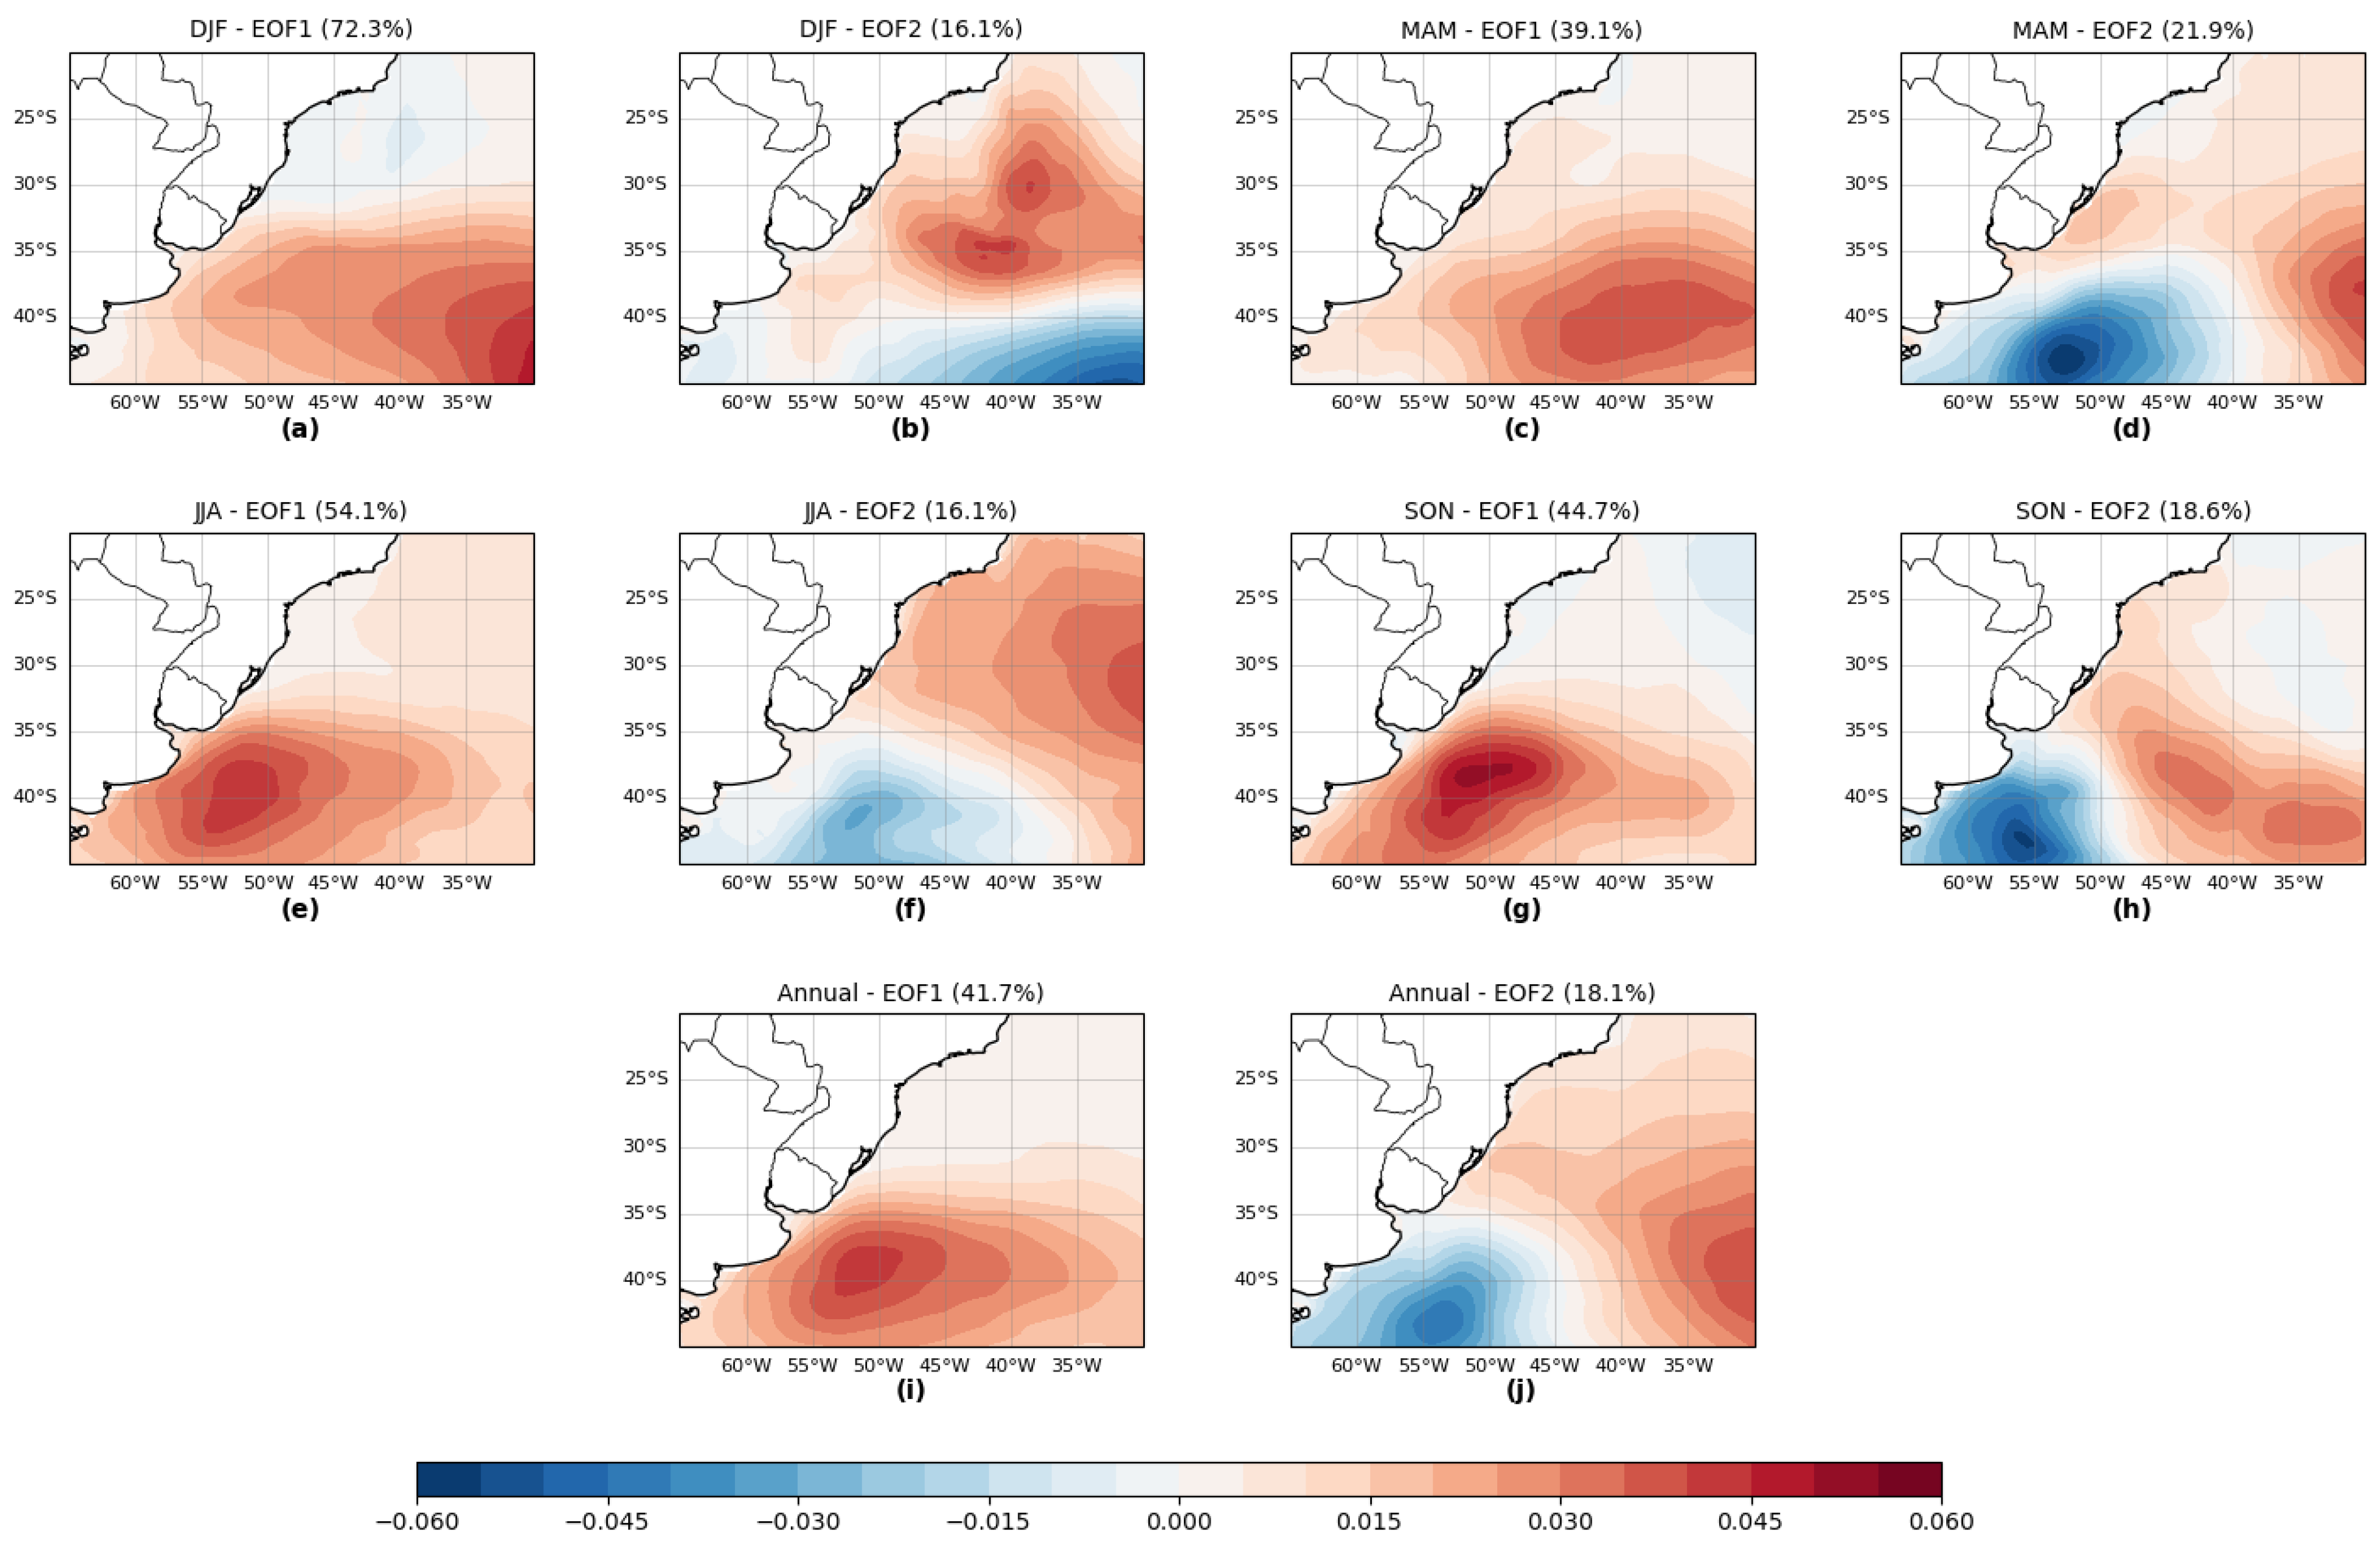
Figure 7.
Event 07: Mean sea level pressure and 10-m wind fields, and significant wave height and (m) direction fields during the three days of severe weather warning and bar inoperability at 18 UTC from May 02, 2008 to May 04, 2008.
Figure 7.
Event 07: Mean sea level pressure and 10-m wind fields, and significant wave height and (m) direction fields during the three days of severe weather warning and bar inoperability at 18 UTC from May 02, 2008 to May 04, 2008.
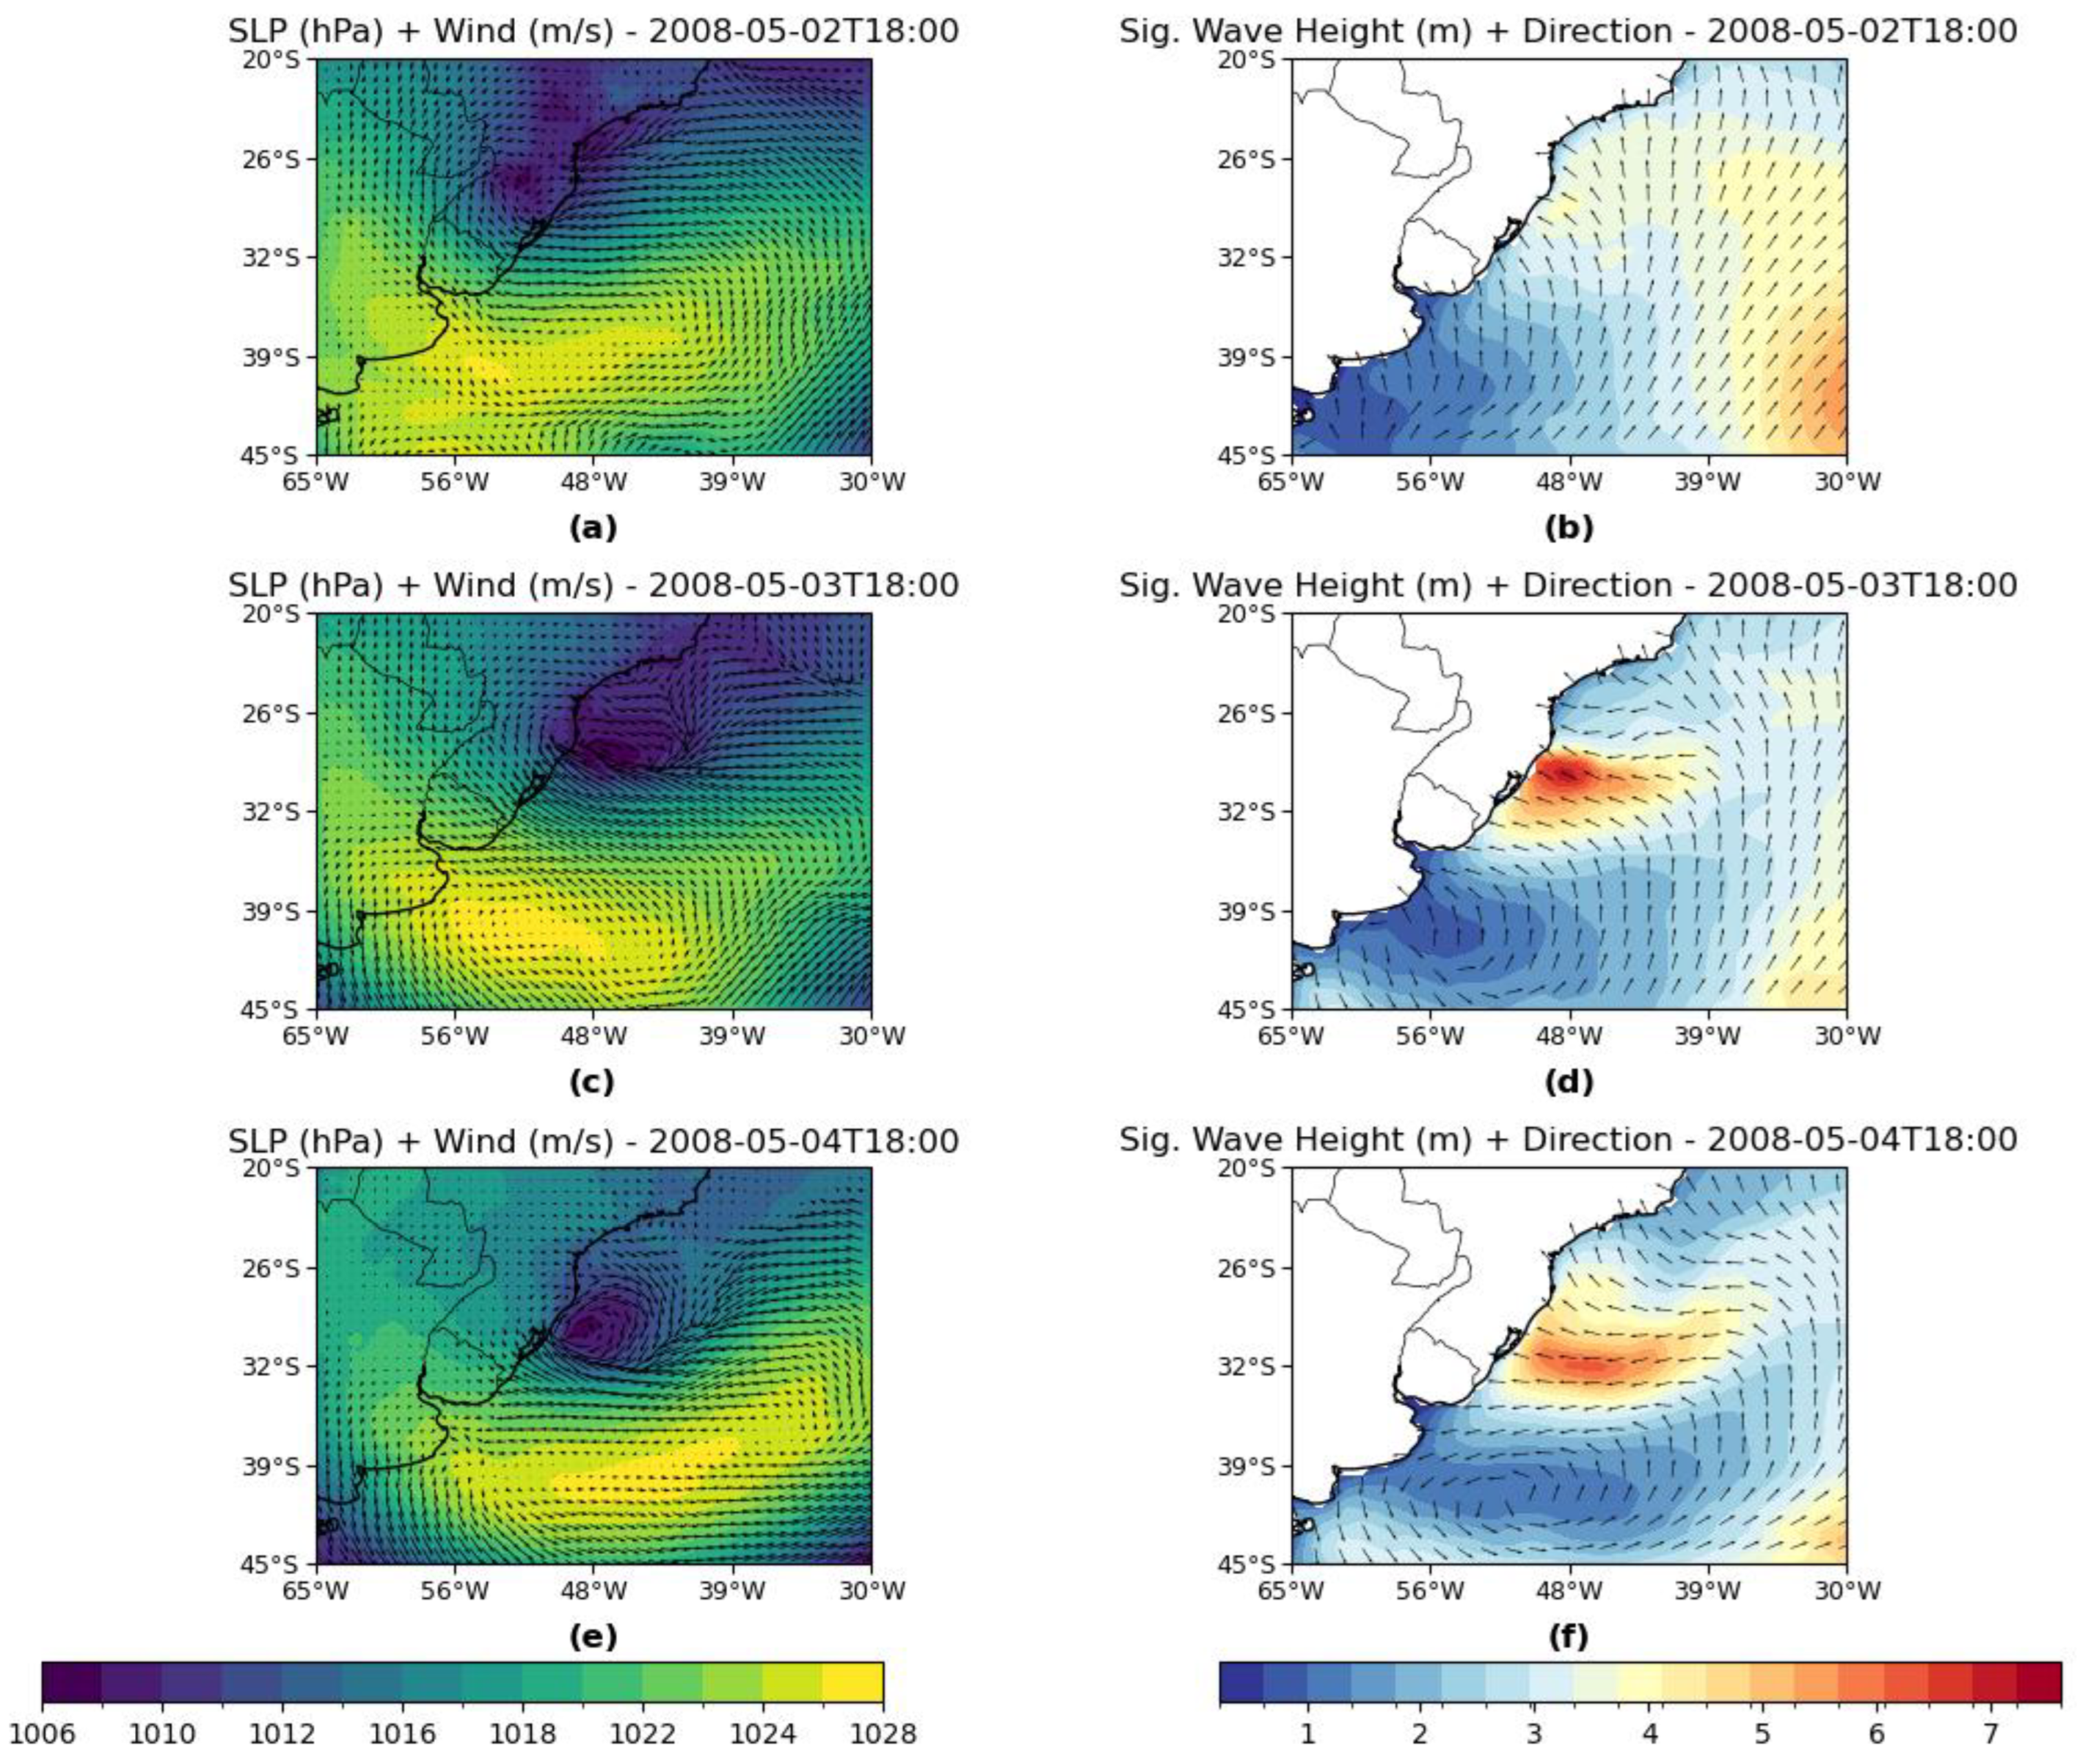
Figure 8.
Event 37: Mean sea level pressure and 10-m wind fields, and significant wave height and (m) direction fields during the three days of severe weather warning and bar inoperability at 00 UTC from July 20, 2015 to July 22, 2015.
Figure 8.
Event 37: Mean sea level pressure and 10-m wind fields, and significant wave height and (m) direction fields during the three days of severe weather warning and bar inoperability at 00 UTC from July 20, 2015 to July 22, 2015.
Disclaimer/Publisher’s Note: The statements, opinions and data contained in all publications are solely those of the individual author(s) and contributor(s) and not of MDPI and/or the editor(s). MDPI and/or the editor(s) disclaim responsibility for any injury to people or property resulting from any ideas, methods, instructions or products referred to in the content. |
© 2025 by the authors. Licensee MDPI, Basel, Switzerland. This article is an open access article distributed under the terms and conditions of the Creative Commons Attribution (CC BY) license (http://creativecommons.org/licenses/by/4.0/).
Copyright: This open access article is published under a Creative Commons CC BY 4.0 license, which permit the free download, distribution, and reuse, provided that the author and preprint are cited in any reuse.


