
Submitted:
04 November 2025
Posted:
10 November 2025
You are already at the latest version
Abstract
This study presents a data-driven framework for segmenting customers in the highly competitive Korean credit card market using a large-scale, anonymized dataset from a leading issuer. We applied a systematic feature reduction process, reducing an initial set of 565 variables to 138 informative attributes. Principal Component Analysis was then employed to transform these features into three interpretable dimensions: Spending Volume, Credit & Loan Dependency, and Membership & Credit. We evaluated multiple clustering algorithms, including K-means, Hierarchical Clustering, and Self-Organizing Maps, finding that K-means clustering with three segments provided the highest internal validity and clearest interpretability along the value-risk axes. The analysis identified three distinct customer segments: (1) High-Value, Low-Risk Customers characterized by high spending and stable repayment; (2) Low-Value, Low-Risk Customers, representing the largest, most conservative segment; and (3) High-Risk Customers, who exhibit active spending but a high dependency on loans and installments, coupled with a higher delinquency rate yet long membership tenure. Our findings provide actionable managerial implications for differentiated strategies in value creation, customer activation, and risk-aware relationship management. To the best of our knowledge, this is the first empirical study to segment customers using actual behavioral data from the Korean credit card industry, offering a practical model for precision marketing and risk management in the digital finance era.
Keywords:
customer segmentation
; credit card industry
; machine learning
; k-means clustering
; principal component analysis
; data-driven marketing
; risk management
; South Korea
1. Introduction
For decades, firms have regarded customer segmentation as a fundamental strategy for identifying heterogeneous customer characteristics and providing customized services [1,2]. Customer segmentation is a technique that classifies and manages customers with similar attributes to simultaneously improve marketing effectiveness and customer satisfaction. Its significance is particularly salient in the financial sector, where it functions as a strategic instrument for deriving increased value from existing customers [3]. In particular, credit card customers exhibit high transaction frequency, diverse consumption patterns, and heterogeneous credit behaviors, which are directly linked to financial risk management, thereby distinguishing them from customers in general consumer markets [4]. Furthermore, the ongoing digital transformation and the emergence of the big data era have exposed financial institutions to unprecedented data environments, encompassing tens of millions of transactional records, hundreds of thousands of customer attributes, and vast amounts of information generated across multiple channels [5-7]. In this context, it has become essential for financial institutions to use big data and advanced artificial intelligence methods to achieve more precise customer segmentation. Compared to traditional approaches, these data-driven techniques allow firms to create more targeted marketing strategies, improve customer relationship management, and strengthen their competitiveness in the fast-changing financial market. In this study, we examine the Korean credit card industry and apply machine learning methods to identify detailed customer segments, showing how advanced analytical approaches can generate value for both firms and customers.
The Korean credit card market is characterized by exceptionally high usage rates and intense competition on a global scale. These days, credit cards have become an indispensable means of payment in nearly all economic activities in Korea, to the extent that daily life is possible without cash, as card payment is accepted at almost every type of merchant. By 2024, approximately 129.8 million credit cards had been issued domestically, far exceeding the total population of about 51 million [8]. This implies that most adults hold more than one card, with the average number of credit cards per person reaching four. Credit card use has also been encouraged by government policies, such as income tax deductions on annual spending, further reinforcing widespread adoption and significantly reducing the reliance on cash payments. The domestic market is dominated by four major issuers—Shinhan Card, KB Kookmin Card, Hyundai Card, and Samsung Card—each serving more than 10 million customers [8]. To retain existing customers and attract new ones, card companies compete fiercely by introducing increasingly sophisticated and diverse products and services. In this competitive landscape, card issuers analyze extensive customer data—including account linkages, transaction patterns, consumption behaviors, demographics, and occupational information—comprising hundreds of thousands of attributes to implement personalized marketing and risk management strategies. In this study, we utilize large-scale customer data collected by a leading Korean credit card company to conduct segmentation analysis. By applying data-driven approaches, this research aims to derive insights into precision customer management and its strategic implications.
A lot of research has examined customer segmentation across diverse industries, and several review studies have synthesized these efforts, presenting both traditional approaches and emerging data-driven techniques [9-11]. In the financial domain, segmentation studies have focused on understanding customer value, predicting risk, and improving retention, with applications spanning banking, insurance, and securities [12-15]. Within the credit card industry in particular, prior work has explored segmentation based on transaction frequency, spending categories, debt repayment behaviors, and lifestyle characteristics. These studies collectively demonstrate the importance of segmentation for financial institutions. With the rise of big data and machine learning, more recent studies have begun to adopt advanced algorithms to identify more dynamic customer segments [4,15-24]. The following table summarizes those prior studies on credit card customer segmentation, organized chronologically by the country of investigation and the clustering methods employed.
As shown in Table 1, credit card customer segmentation has been examined in a wide range of countries using diverse analytical methods. Despite these extensive efforts, to the best of our knowledge, no prior study has conducted segmentation analysis using actual credit card customer data from Korea. Building on this evolving body of literature, our study seeks to contribute by applying machine learning methods to Korean credit card customers, thereby offering novel insights into segmentation practices in the context of the digital era. The remainder of this paper is organized as follows. Section 2 presents an exploratory analysis of the credit card customer dataset. Section 3 describes the segmentation process using unsupervised machine learning techniques and visualization methods. Section 4 analyzes the characteristics of the identified customer segments and discusses corresponding marketing strategies. Finally, Section 5 concludes the paper with a summary of key findings and directions for future research.
2. Exploratory Analysis of the Korean Credit Card Customer Dataset
This section provides an exploratory analysis of the Korean credit card customer dataset used in this study. Specifically, we employ a publicly available dataset released by a Korean credit card company through a national data analytics competition, which can be freely accessed at https://dacon.io/competitions/official/236460/overview/description. The dataset contains large-scale customer information, including membership records, credit information, transaction approvals, and billing statements for hundreds of thousands of customers, with all personally identifiable information removed. For the purpose of this study, we randomly sampled 40,000 customers, a subset expected to be sufficiently representative of the overall population while avoiding unnecessary computational complexity.
The dataset consists of anonymized credit card customers, each described by 565 variables encompassing demographic attributes, membership and card ownership status, credit and delinquency records, transaction history, and marketing channel preferences. This comprehensive dataset provides a rich basis for exploratory analysis and subsequent customer segmentation. When the diverse variables in the dataset are grouped into similar categories, they can be summarized as shown in Table 2.
Table 2 summarizes the dataset by grouping the 565 variables into eight categories. The majority relate to transactions and spending (335) and credit and risk (110). Membership and card attributes (53), along with billing and payment variables (77), capture account-level details, while demographics (12) provide essential background information. Additional variables on marketing response (9), points and mileage (34), and metadata (2) complement the dataset. Let us now examine the representative characteristics of each category in more detail. As a starting point, Figure 1 presents the distribution of two key demographic attributes, gender and age group, which illustrate the basic customer profile in the dataset.
Figure 1 illustrates the demographic composition of the sampled Korean credit card customers. The gender distribution indicates a relatively balanced representation between male and female customers. The age distribution shows that the majority of customers fall within the 30s to 50s categories. This demographic profile indicates that the credit card market in Korea is strongly concentrated among working-age adults, which is consistent with the role of credit cards as a primary payment method in daily economic activities.
Beyond demographics, the dataset also provides a wide range of financial variables that capture customers’ interactions with credit card services. These include information on monthly spending, installment usage, delinquency history, loan applications, and credit limits. In the following table, the distributions of the monthly spending in full payment and the delinquency status are presented.
Figure 2 presents the distributions of monthly lump-sum spending and delinquency status. The histogram of monthly spending shows a highly right-skewed distribution, where the majority of customers spend relatively small amounts while a smaller proportion makes very high expenditures. The median of the monthly lump-sum spending is 2,281,000KRW. On the other hand, the delinquency status indicates that most customers do not have delinquency records, with only a small minority (2.1%) experiencing overdue payments. In addition, the dataset provides highly detailed information on spending behavior. For example, shopping-related transactions are categorized by specific types of merchants, such as department stores, marts, supermarkets, convenience stores, outlets, online platforms, and other retail channels. This granularity allows for a more nuanced understanding of consumption patterns across different retail contexts. Figure 3 illustrates the correlation heatmap of spending across these shopping categories.
Figure 3 depicts the correlation structure among shopping-related expenditures across various merchant categories. The results reveal relatively strong correlations between mart and supermarket spending and between supermarket and other retail expenditures. Convenience store spending also shows moderate correlations with supermarket and mart expenditures. In contrast, online shopping displays weaker correlations with offline categories, suggesting that online consumption constitutes a distinct spending channel. Overall, the shopping-related categories exhibit moderate to strong positive correlations, while the observed differences across categories suggest heterogeneity in customer behavior, and such detailed information can be effectively utilized in customer segmentation to identify distinct spending profiles. In addition to shopping expenditures, the dataset also provides extensive information on financially risky products such as cash advances and card loans. Figure 4 presents histograms of the interest rates associated with cash advances and card loans, offering further insight into the financial vulnerability of certain customer segments.
Figure 4 illustrates the distributions of interest rates for cash advances and card loans. The histogram of CA interest rates shows several distinct peaks, with most customers concentrated in the 14–15% range. This indicates that cash advance rates are stratified across different customer groups, likely reflecting variations in credit risk profiles. By contrast, the distribution of card loan interest rates reveals that the majority of customers report zero values due to the absence of card loan usage. Among active borrowers, interest rates are typically clustered between 15% and 17%, indicating the high borrowing costs associated with card loans. In addition, the dataset contains variables that capture customer responses to marketing activities. Figure 5 summarizes the unsubscribe rates across different marketing channels.
Figure 5 presents the unsubscribe rates across different marketing channels. The results indicate that customers are most likely to opt out of SMS and telemarketing, suggesting that direct and intrusive forms of communication are less favored. In contrast, unsubscribe rates for direct mail and email are somewhat lower. Moreover, the dataset also includes detailed information on customer benefits such as reward points and mileage. Figure 6 presents the distributions of reward points and mileage accumulated over a one-year period.
Figure 6 illustrates the distributions of reward points and mileage accumulated by credit card customers over a one-year period. Both variables exhibit highly right-skewed distributions, similar to the spending variables, with the majority of customers earning relatively small amounts and only a minority accruing very large benefits. To better visualize these long-tailed distributions, the y-axis is presented on a logarithmic scale.
In summary, the exploratory analysis demonstrates that the dataset provides a comprehensive view of credit card customers across multiple dimensions, including demographics, spending behavior, credit risk, marketing responsiveness, and customer benefits. These diverse attributes not only highlight the heterogeneity of customer profiles but also offer a rich foundation for applying advanced segmentation techniques. Building on these insights, the next section presents the methodology and results of customer segmentation using machine learning approaches.
3. Methodology for Customer Segmentation
Building on the exploratory analysis in Section 2, this section describes the methodology for customer segmentation. The process begins with data preprocessing, where the raw dataset is cleaned and transformed into a consistent and analyzable format. To further enhance the quality of the analysis, feature selection is conducted using filtering techniques, resulting in a compact dataset that retains the most informative attributes. Subsequently, multiple clustering algorithms are applied to partition customers into distinct groups. The performance of these clustering results is then evaluated using established validation metrics, from which the most suitable segmentation outcome is selected and further interpreted. Section 3.1 introduces the preprocessing and feature selection procedures in detail.
3.1. Preprocessing and Feature Selection
Given the large number of variables in the dataset, it is essential to reduce redundancy and eliminate attributes that contribute little meaningful information. This step not only prevents duplication but also ensures that the segmentation analysis is performed on a more compact and interpretable dataset. In the field of machine learning, preprocessing is widely recognized as a crucial procedure because it transforms raw data into an understandable and readable form, thereby enabling the extraction of meaningful insights [19]. In this study, variable reduction is carried out through a series of several procedures, each designed to refine the dataset by retaining the most relevant features. The following subsections introduce these procedures in detail.
3.1.1. Variable Reduction with Missing Values
In practice, real-world datasets are rarely complete and often contain missing values. The credit card customer dataset used in this study also included a subset of variables with missing entries. Upon closer inspection, 26 variables were found to contain more than 100 missing values. Since these variables were not considered critical for segmentation and their removal was unlikely to impact the robustness of the analysis, they were excluded from the dataset as the first step of the preprocessing.
3.1.2. Numeric Variable Filtering
The second step in preprocessing is to retain only the numerical variables from the dataset. Since categorical variables are relatively few in number and are not easily compatible with numerical attributes in subsequent procedures such as statistical computation and clustering analysis, they are excluded from further consideration. After removing categorical features, a total of 518 numerical variables remain. This number is still sufficiently large to capture diverse aspects of customer behavior, including spending amounts and credit activities, which are central to segmentation analysis.
3.1.3. Variance Threshold
The next step in feature reduction is the application of a variance threshold. Variables with extremely low variance across customers are unlikely to contribute to meaningful segmentation, as they provide little information in distinguishing one group from another. By removing such near-constant variables, the dataset becomes more efficient to process and focuses attention on features that exhibit meaningful variability across customers. In this study, the threshold was set to zero, and variables for which all customers shared identical values were removed. Through this procedure, the total number of variables was reduced from 565 to 469, thereby eliminating redundant attributes and retaining only those features with meaningful variation across the customer base.
3.1.4. Correlation Filtering
The fourth step in feature reduction is correlation filtering. Even after removing zero-variance variables, many features may still exhibit high pairwise correlations, leading to redundancy in the dataset. For example, the variable Monthly Lump-Sum Spending shows an absolute correlation above 0.7 with 44 other variables. All of which are potential sources of multicollinearity and thus candidates for removal. Notably, among them, six variables exhibit correlations above 0.9, indicating a substantial degree of redundancy within the dataset. The dataset contains a considerable number of variables that exhibit redundancy, including this one. Highly correlated variables do not provide additional information for clustering but instead increase computational complexity and may bias the segmentation results. Therefore, it is important to identify and remove one of each pair of variables that are strongly correlated, thereby retaining only a representative set of features. In this study, variables with high absolute correlations were removed as part of the feature reduction process. The detailed filtering procedure is described below.
Correlation Filtering Procedure
Step 1. Select numeric variables and sort by name
Step 2. Compute absolute correlation matrix
Step 3. Initialize remaining = all variables
Step 4. For each variable in order:
if still in remaining:
remove other variables with |corr| ≥ threshold
Step 5. Final dataset = variables in remaining
This step ensures that the resulting dataset is both compact and free from multicollinearity, which contributes to more reliable and interpretable clustering outcomes. In this study, the threshold was set to 0.7 in the above procedure, which reduced the dataset to 160 remaining variables. Consequently, since this step removes the largest number of variables compared to the other steps, it can be regarded as the most critical stage of feature selection in this study.
3.1.5. VIF Filtering
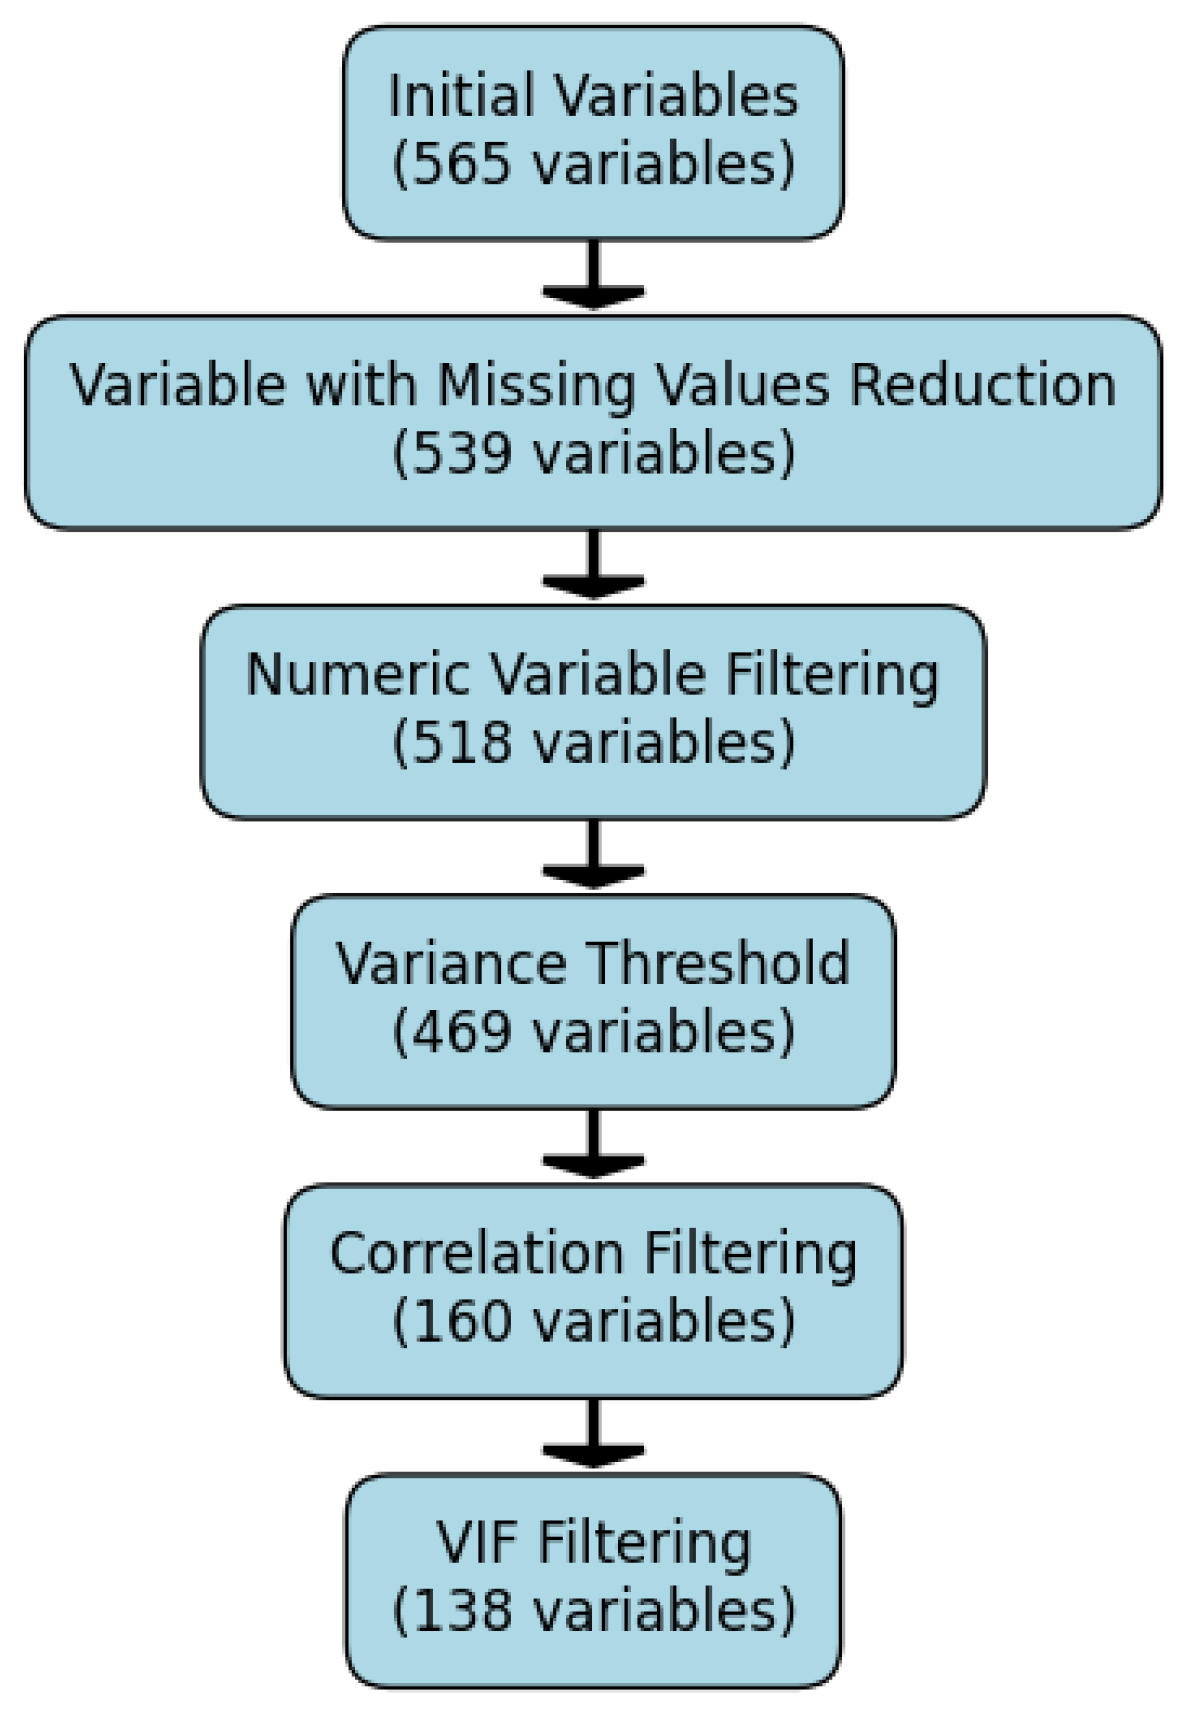
The final step in feature reduction is the application of Variance Inflation Factor (VIF) filtering to further address multicollinearity among the remaining variables. VIF is a widely used diagnostic metric that quantifies how much the variance of a regression coefficient is inflated due to multicollinearity. Variables with excessively high VIF values provide redundant information and can distort clustering outcomes. In this study, the VIF threshold is set to 10 to identify and remove variables with severe multicollinearity. In the final step, 22 additional variables were removed, resulting in a total of 138 variables retained for the subsequent clustering stage. The following figure provides a summary of the feature selection process.
Figure 7.
Summary of feature selection procedures and the number of variables retained at each step.
Figure 7.
Summary of feature selection procedures and the number of variables retained at each step.
3.2. Principal Component Analysis (PCA)
Before applying clustering algorithms, it is necessary to address the high dimensionality of the dataset. Although feature selection has already reduced the number of variables from 565 to 138, the dataset still contains a large number of correlated attributes that may complicate clustering and hinder interpretability. To further reduce dimensionality while preserving the essential variability in the data, this study applies Principal Component Analysis (PCA). PCA is a widely used technique that transforms the original correlated variables into a smaller set of uncorrelated components, referred to as principal components (PCs), which capture the maximum variance in the dataset. By representing the data in terms of these principal components, the analysis not only alleviates redundancy but also facilitates visualization and enhances the robustness of subsequent clustering. Such reasons explain why the use of PCA prior to clustering is commonly observed in existing customer segmentation studies [4,7,9,17-19,23,24].
In this study, PCA was applied to the 138 variables retained in Section 3.1. As noted earlier, all of these variables are numerical, which makes them suitable for PCA. Prior to applying PCA, the data were standardized to ensure comparability across variables measured on different scales. To determine the appropriate number of principal components, a scree plot of the explained variance ratios is demonstrated as follows.
Figure 8 presents the scree plot of explained variance ratios for the first 20 principal components derived from the dataset. The plot shows a sharp decline in variance contribution after the first two components, with the curve flattening noticeably from the third component onward. The elbow criterion suggests that the optimal number of components to retain is three, as indicated by the red marker. This selection balances dimensionality reduction with information retention, ensuring that the reduced feature space preserves the most significant variation in the data while eliminating redundancy. To further interpret the extracted components, the top loading variables for each of the three principal components were identified. Specifically, for each component, the five variables with the highest absolute loading values were selected, as these contribute most significantly to the variance explained by that component. Table 3 summarizes these top-loading variables.
Table 3 summarizes the five most influential variables for each of the top three principal components. The first component (PC1) is primarily associated with overall card usage and consumption patterns. High loadings on variables such as retail spending at general merchants and marts, primary transportation expenditures, benefit amounts received, and normal principal repayment indicate that this component captures customers’ overall consumption intensity. Accordingly, PC1 can be interpreted as a Spending Volume factor. The second component (PC2) is dominated by variables related to borrowing and installment usage, including installment duration and amounts with or without interest, card loan activity, and cash advance duration. This pattern demonstrates customers’ reliance on credit-based services and deferred payments, suggesting that PC2 represents a Credit & Loan Dependency factor. The third component (PC3) emphasizes features linked to credit history and repayment structures. Strong loadings from membership tenure, recurring payment amounts, initial credit limits, and lump-sum loan limits, along with secondary payment industry spending, indicate that this component reflects long-term credit relationships and repayment behaviors. Thus, PC3 can be interpreted as a Membership & Credit factor.
From the perspective of credit card companies, PC1 provides a key measure of valuable customers, as it reflects the intensity of spending and the breadth of consumption activities. In contrast, PC2 primarily captures risk-related behaviors, such as reliance on loans, cash advances, and long-term installment usage, making it an important indicator of potential financial vulnerability. PC3, while less distinct, incorporates characteristics relevant to both customer value and risk. These interpretations are particularly valuable because they establish a conceptual framework that can later be integrated with the clustering outcomes.
3.3. Clustering Algorithms
The next step is to segment customers into distinct groups using clustering algorithms. Clustering, an unsupervised learning technique, partitions customers based on similarities in their behavioral and financial attributes without the need for predefined labels. As with PCA, all variables were standardized (z-score normalization) prior to clustering to ensure comparability across scales. In this study, several clustering methods are employed to ensure robustness and to capture different aspects of customer heterogeneity. The results obtained from these methods are evaluated using visual inspection and internal validation metrics to determine the most appropriate segmentation outcome. In the following subsections, each clustering method applied in this study is introduced in detail.
3.3.1. K-Means Clustering
K-means, one of the most widely used clustering algorithms, partitions observations into k clusters by minimizing the within-cluster sum of squares, thereby ensuring that customers assigned to the same group are as similar as possible while maximizing differences across groups [26]. Due to its simplicity and efficiency, K-means has become one of the most widely used algorithms in the financial sector for analyzing credit card customer behavior, assessing risk, and identifying customer segments for marketing strategy development [6,7,18,19,21,23,25].
In this study, the K-means algorithm was applied to the 138 variables finally selected in Section 3.1. Before performing clustering, determining the appropriate number of clusters (k) is essential. Considering that three principal components were extracted through PCA in Section 3.2, the candidate values of k were set to 2, 3, and 4 in order to enable a meaningful interpretation of clustering results based on these components. The final number of clusters was determined by comparing clustering validity indices and visually examining the results. Specifically, two widely used clustering metrics—the silhouette score and the Davies–Bouldin Index (DBI)—were employed to evaluate the outcomes [27,28]. Table 4 summarizes the silhouette scores and DBI values for the K-means results with k set to 2, 3, and 4.
Table 4 presents the evaluation results of K-means clustering with the number of clusters set to 2, 3, and 4. A higher silhouette score indicates better clustering quality, while a lower DBI reflects greater separation between clusters. From the silhouette perspective, the case of k=4 shows a substantially lower value compared to the other two options, suggesting weaker cluster cohesion and separation. Conversely, in terms of DBI, k=4 yields the highest value, which also indicates poor clustering performance. Since neither metric provides a dominant result across all cases, it is difficult to determine the optimal number of clusters based solely on these indices. Therefore, this study further investigates the visual clustering structure. Specifically, using the first two principal components (PC1 and PC2) derived in Section 3.2, the positions of 40,000 customers are plotted in a two-dimensional space, with cluster assignments distinguished by color. The resulting visualizations for k=2,3, and 4 are presented in the following figures.
Figure 9 illustrates the clustering results obtained by applying K-means with k = 2, 3, and 4, plotted on a two-dimensional space defined by the first two principal components (PC1 and PC2). These visualizations can complement the quantitative indices in Table 4 and provide additional insights into the overall interpretability. Considering the interpretation of PC1 and PC2 in Section 3.2 as customer value and risk, respectively, the clustering outcome with k=3 appears to offer the most natural segmentation. Specifically, customers in Cluster 1 can be interpreted as high-value customers with relatively high PC1 scores, while Cluster 3 represents high-risk customers with higher PC2 scores. Cluster 2, concentrated around the origin of PC1 and PC2, corresponds to the low-value and low-risk segment, which accounts for more than half of the customer base. In contrast, the cases of k=2 and k=4 are less straightforward to interpret in terms of value and risk dimensions. Therefore, this study adopts k=3 as the final number of clusters, as it provides the most meaningful and interpretable segmentation.
3.3.2. Hierarchical Clustering
Hierarchical clustering offers a different perspective by building a tree-like structure (dendrogram) that represents nested groupings of customers [29]. Unlike K-means, it does not require the number of clusters to be specified in advance and instead reveals a hierarchy of potential partitions. This approach is particularly useful for exploring the relationships among customer groups at different levels of granularity. In this study, agglomerative hierarchical clustering with Ward’s linkage method is used, as it minimizes the increase in within-cluster variance at each merging step.
Based on the clustering results from K-means, hierarchical clustering was also performed with the number of clusters set to three. The evaluation yielded a silhouette score of 0.1520 and a DBI of 4.5051. Compared with the K-means results (0.2279, 3.7880 for silhouette and DBI, respectively), the hierarchical approach produced inferior scores on both metrics. To further assess the effectiveness of hierarchical clustering, the clustering results were visualized in the same manner as the graphs presented in Section 3.3.1, as shown below.
Figure 10 shows the hierarchical clustering results with the number of clusters set to three, projected onto the two-dimensional space defined by PC1 and PC2. Compared with the K-means results in Figure 9, the clusters appear less distinctly separated, which corresponds to the relatively lower silhouette score and higher DBI value. Furthermore, the visual distribution indicates that the hierarchical approach tends to produce overlapping regions between clusters, limiting interpretability from the perspective of customer value and risk segmentation. These findings reinforce that, although hierarchical clustering provides complementary insights, K-means with k=3 remains the more interpretable solution for this dataset.
3.3.3. Self-Organizing Map (SOM) Clustering
The Self-Organizing Map (SOM) is a type of artificial neural network that performs clustering by projecting high-dimensional data onto a lower-dimensional grid [30]. This allows not only the identification of clusters but also their visualization in a topological space. SOM is particularly effective in capturing nonlinear relationships and preserving neighborhood structures in the data, making it well-suited for complex customer segmentation tasks.
Similar to the K-means and hierarchical clustering approaches, the number of clusters was set to three. To achieve this, a 3-by-1 topology was configured in the SOM. The evaluation results yielded a silhouette score of 0.1534 and a DBI of 4.3167 and these values are not superior to those obtained from K-means clustering (0.2279 and 3.7880 for silhouette and DBI, respectively). The corresponding visualization of clustering results, analogous to Figure 9 and Figure 10, is presented below.
Figure 11 presents the clustering results obtained from the SOM with a 3-by-1 topology, projected onto the two-dimensional space defined by PC1 and PC2. Compared with the K-means and hierarchical clustering results shown in Figure 9 and Figure 10, the SOM clusters also exhibit overlapping regions, which is reflected in the lower silhouette score and higher DBI value than those of K-means. While SOM provides a nonlinear approach that can capture complex relationships in the data, its clustering outcome in this case is not substantially superior to the other methods.
3.3.4. Summary of Clustering Results
To summarize the clustering outcomes across the three methods, Table 5 shows the silhouette scores and DBI values for the K-means, hierarchical, and SOM clustering results when the number of clusters was set to three.
As shown in Table 5, K-means achieves the highest silhouette score and the lowest DBI value among the three methods. The visual inspection of the clustering results (Figure 9, Figure 10 and Figure 11) further confirms that the segmentation obtained from K-means with k=3 provides the most natural and interpretable structure in terms of customer value (PC1) and risk (PC2). Therefore, in this study, K-means clustering with three clusters is adopted as the final segmentation method, as it delivers the best overall internal validity (highest Silhouette, lowest DBI) and the most interpretable structure along the value (PC1) and risk (PC2) dimensions.
4. Analytical Interpretation of the Customer Segmentation
Based on the K-means clustering results with k=3, the customers are segmented into three distinct groups. To better understand the characteristics of these clusters, this section provides a comprehensive interpretation using statistical summaries, tabular comparisons, graphical analysis, and visualization techniques.
4.1. Cluster Profiles
Interpreting the clusters through the principal component framework (Section 3.2), the three segments can be described as follows:
- Cluster 1 (Premium Customers): Defined by high PC1 scores, indicating strong spending activity.
- Cluster 2 (Standard Customers): Positioned near the origin of PC1 and PC2, showing modest spending and limited use of installment or loan products.
- Cluster 3 (Subprime Customers): Characterized by higher PC2 scores, indicating risky financial behaviors.
Let us redraw the clustering results by K-means with k=3 as previously illustrated in Figure 9. The following figure enhances the two-dimensional visualization by adding vertical and horizontal dashed lines at the zero values of PC1 and PC2, respectively. In addition, the number of customers assigned to each cluster is displayed.
Figure 12 presents the K-means clustering results for k=3, enhanced with reference lines at the zero values of PC1 and PC2 to improve interpretability of the customer value–risk space. Cluster 1 (High-Value Customers), located on the right side with higher PC1 scores, represents customers with strong spending capacity. Most of their PC2 values are below zero, indicating relatively low risk. Cluster 3 (High-Risk Customers), extending upward with higher PC2 scores, consists of customers with elevated risk levels; however, many of them also have PC1 values above zero, suggesting notable spending activity. In other words, Cluster 1 corresponds to customers who are both high-value and low-risk, combining strong consumption with financial stability, whereas Cluster 3 represents customers who, despite their high spending, are prone to higher risk. The figure also displays the size of each segment. The largest proportion of customers (70.4%) belongs to Cluster 2 (Low-Value, Low-Risk Customers), located near the origin of both PC1 and PC2, which represents the low-value and low-risk segment.
4.2. Demographic Characteristics of Clusters
To gain a deeper understanding of the customer segments, this subsection examines the demographic composition of each cluster in terms of gender, age group, and residential region. summarize these distributions.
Figure 13 reveals distinct patterns across clusters. In Cluster 1, males represent the majority, indicating that men are more dominant among high-spending customers. In Cluster 2, the gender distribution becomes more balanced, while in Cluster 3, the trend reverses—female customers account for the larger share. This suggests that female customers are more likely to belong to the higher-risk segment, whereas high-value consumption is primarily driven by male customers.
Figure 14 also shows meaningful differentiation. Customers in their 30s and 40s constitute the largest portion across all clusters, reflecting the core age group of active credit-card users. However, Cluster 1 contains a slightly higher proportion of customers in their 30s, whereas Cluster 3 includes a relatively greater share of those in their 50s and 60s. This implies that high-value customers tend to be in their economically active prime years, while high-risk customers are more concentrated among middle-aged and older individuals with accumulated credit exposure.
Figure 15 shows a clear geographical pattern. Cluster 1 is heavily concentrated in the Seoul Metropolitan Area (Seoul and Gyeonggi Province), which together account for more than 60% of its members. Cluster 2 exhibits a relatively balanced nationwide distribution, whereas Cluster 3 shows higher proportions in regions such as Busan, Incheon, and Gyeongbuk. This regional disparity suggests that high-value customers are predominantly located in the capital area, while high-risk customers are somewhat more prevalent in Incheon and Busan, the second and third largest cities in South Korea by population, respectively.
Overall, the demographic analysis suggests that Cluster 1 represents high-value male customers in their 30s–40s, many of them residing in Seoul metropolitan regions, Cluster 2 consists of middle-aged customers with moderate spending and low risk across all regions, and Cluster 3 comprises relatively older and female-dominant customers residing in the provinces and exhibiting higher credit risk. These demographic distinctions provide useful insights for developing differentiated marketing and risk-management strategies tailored to each customer segment.
4.3. Financial Characteristics of Clusters
This subsection investigates the financial behaviors and credit characteristics of each customer cluster. The analysis focuses on major financial indicators such as spending volume, payment method composition, merchant and transaction activity, billing amounts, installment patterns, and delinquency behavior. In the following figure, the spending levels across the cluster are demonstrated.
Figure 16.
Distribution of monthly spending levels by customer cluster.
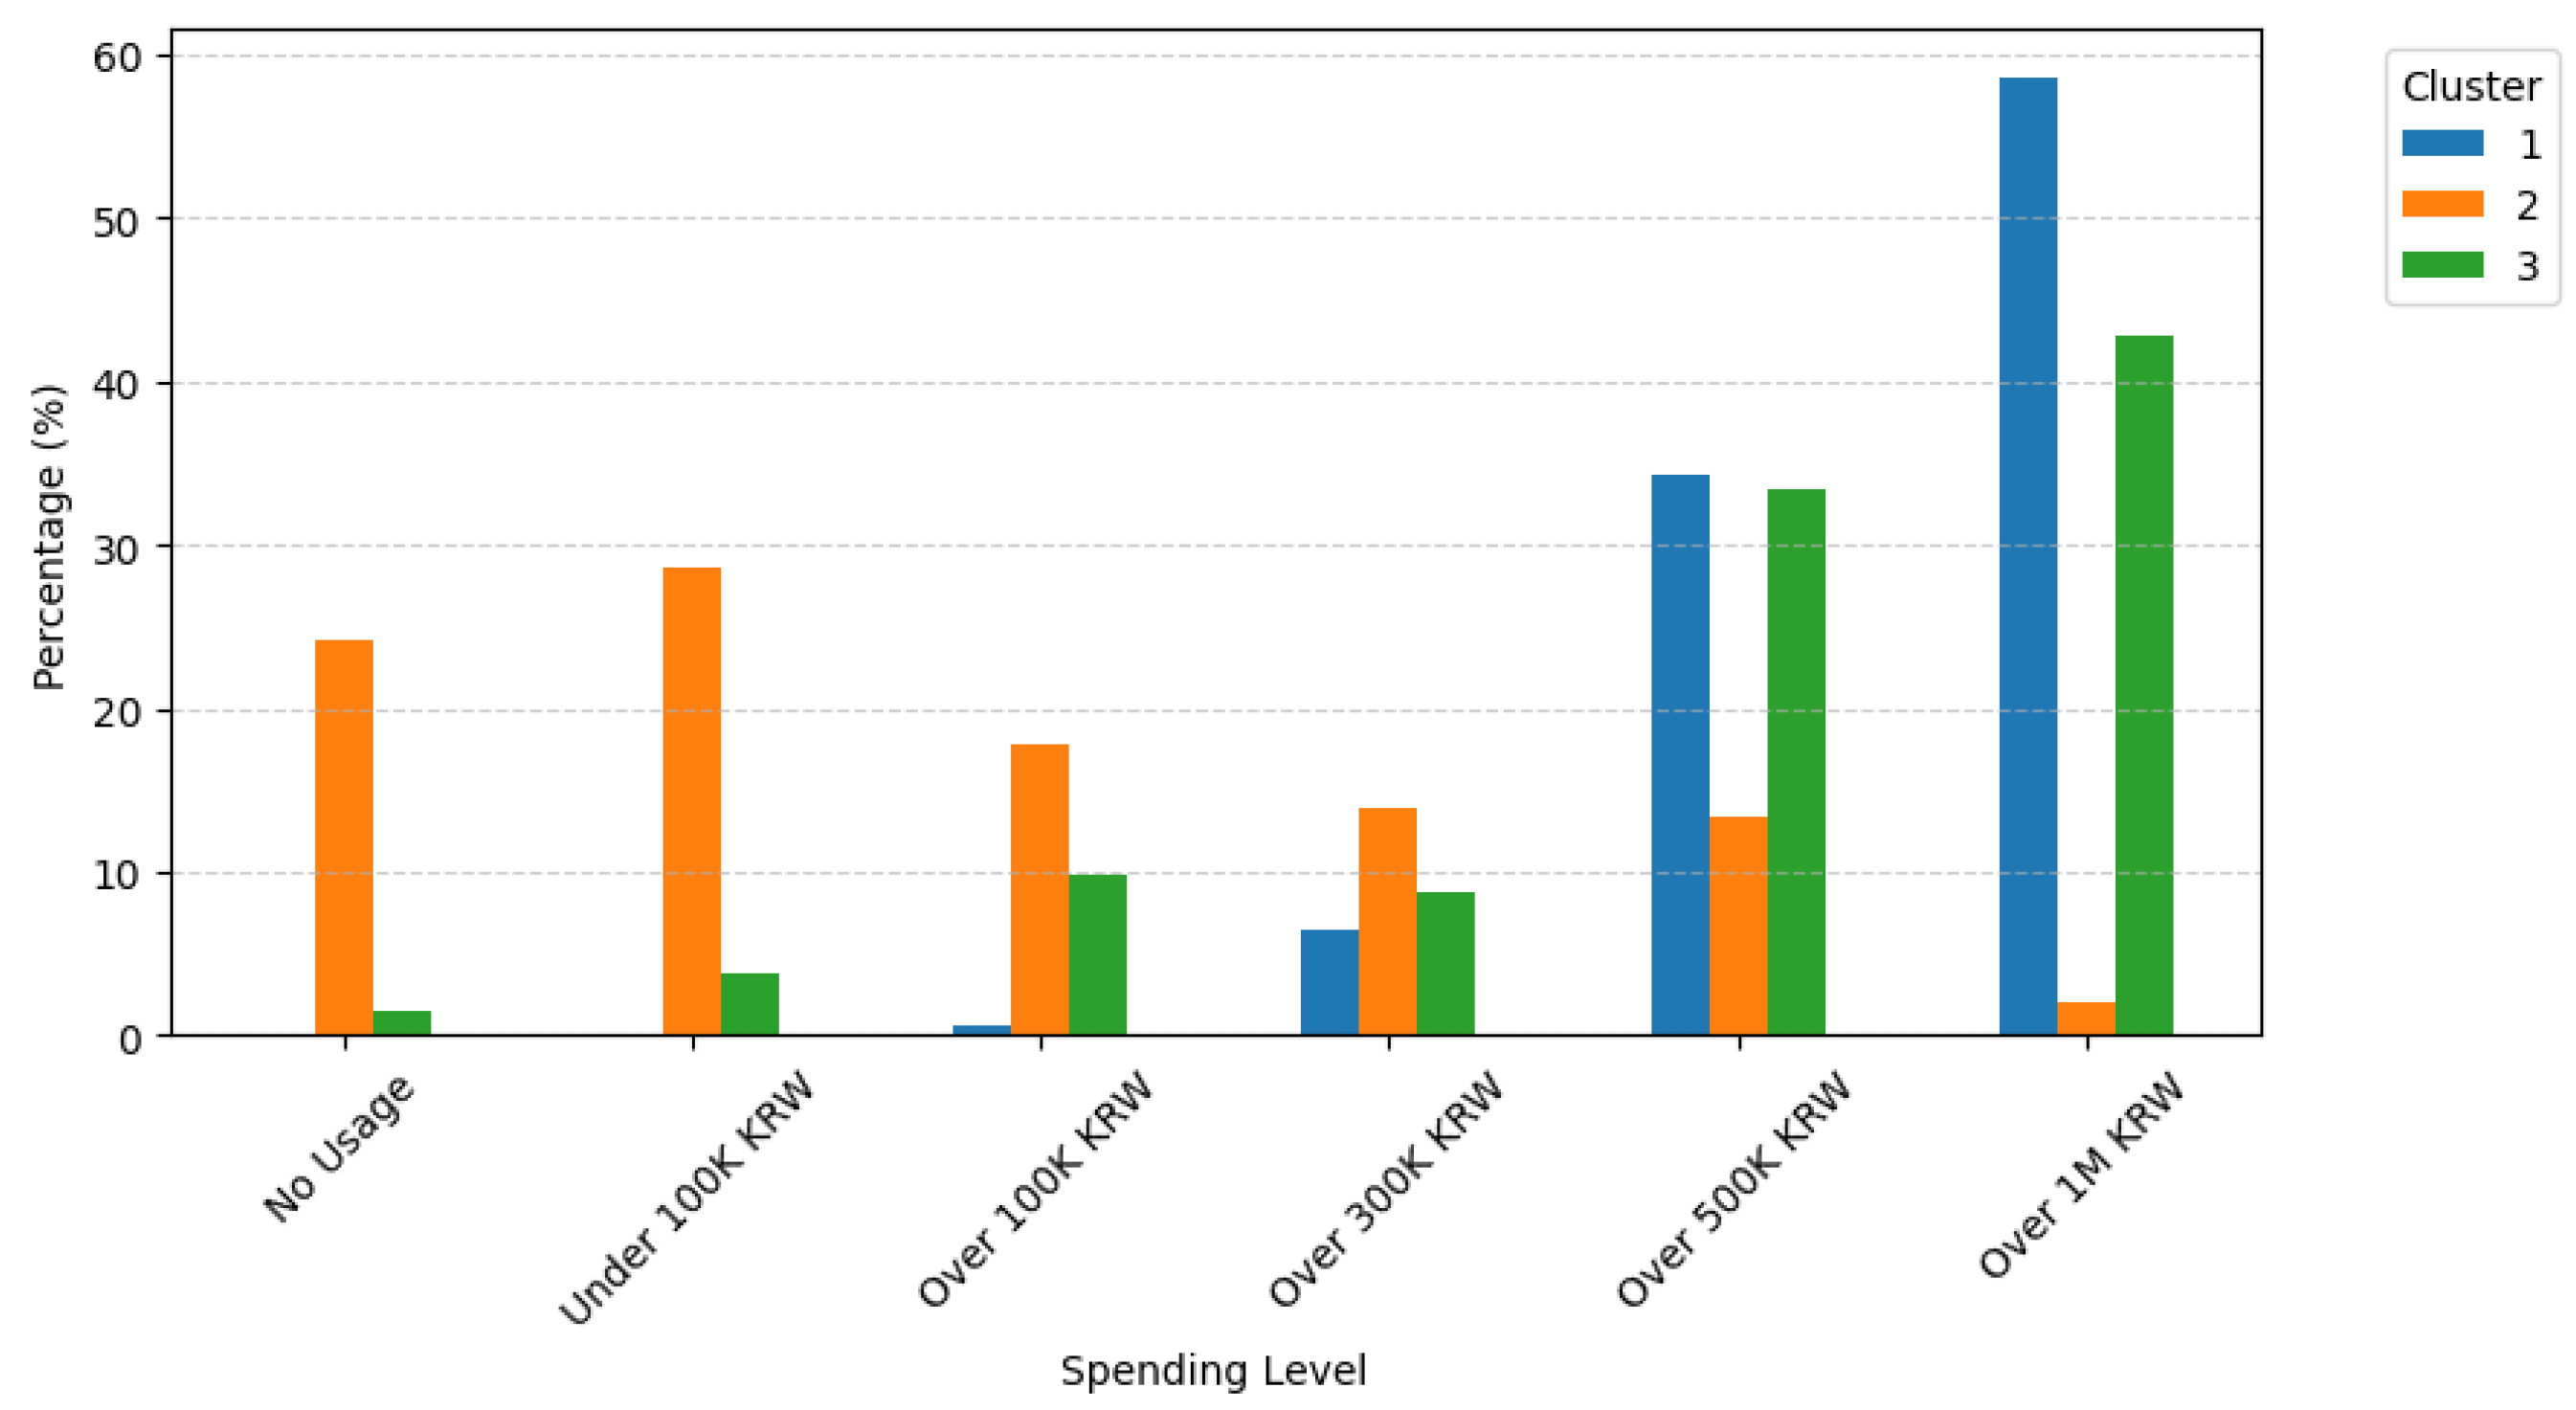
As shown in Figure 16, there are clear contrasts among the three clusters, particularly between Cluster 2 and the other two groups. Customers in Cluster 2 exhibit a higher proportion of low-spending behavior, indicating a conservative usage pattern. In contrast, customers in Clusters 1 and 3 tend to spend larger amounts, with relatively few low-spending users. Notably, Cluster 3 shows the highest overall spending level among all groups, suggesting that this segment engages most actively in credit card transactions.
Figure 17.
Average spending by payment type over the past six months across customer clusters.
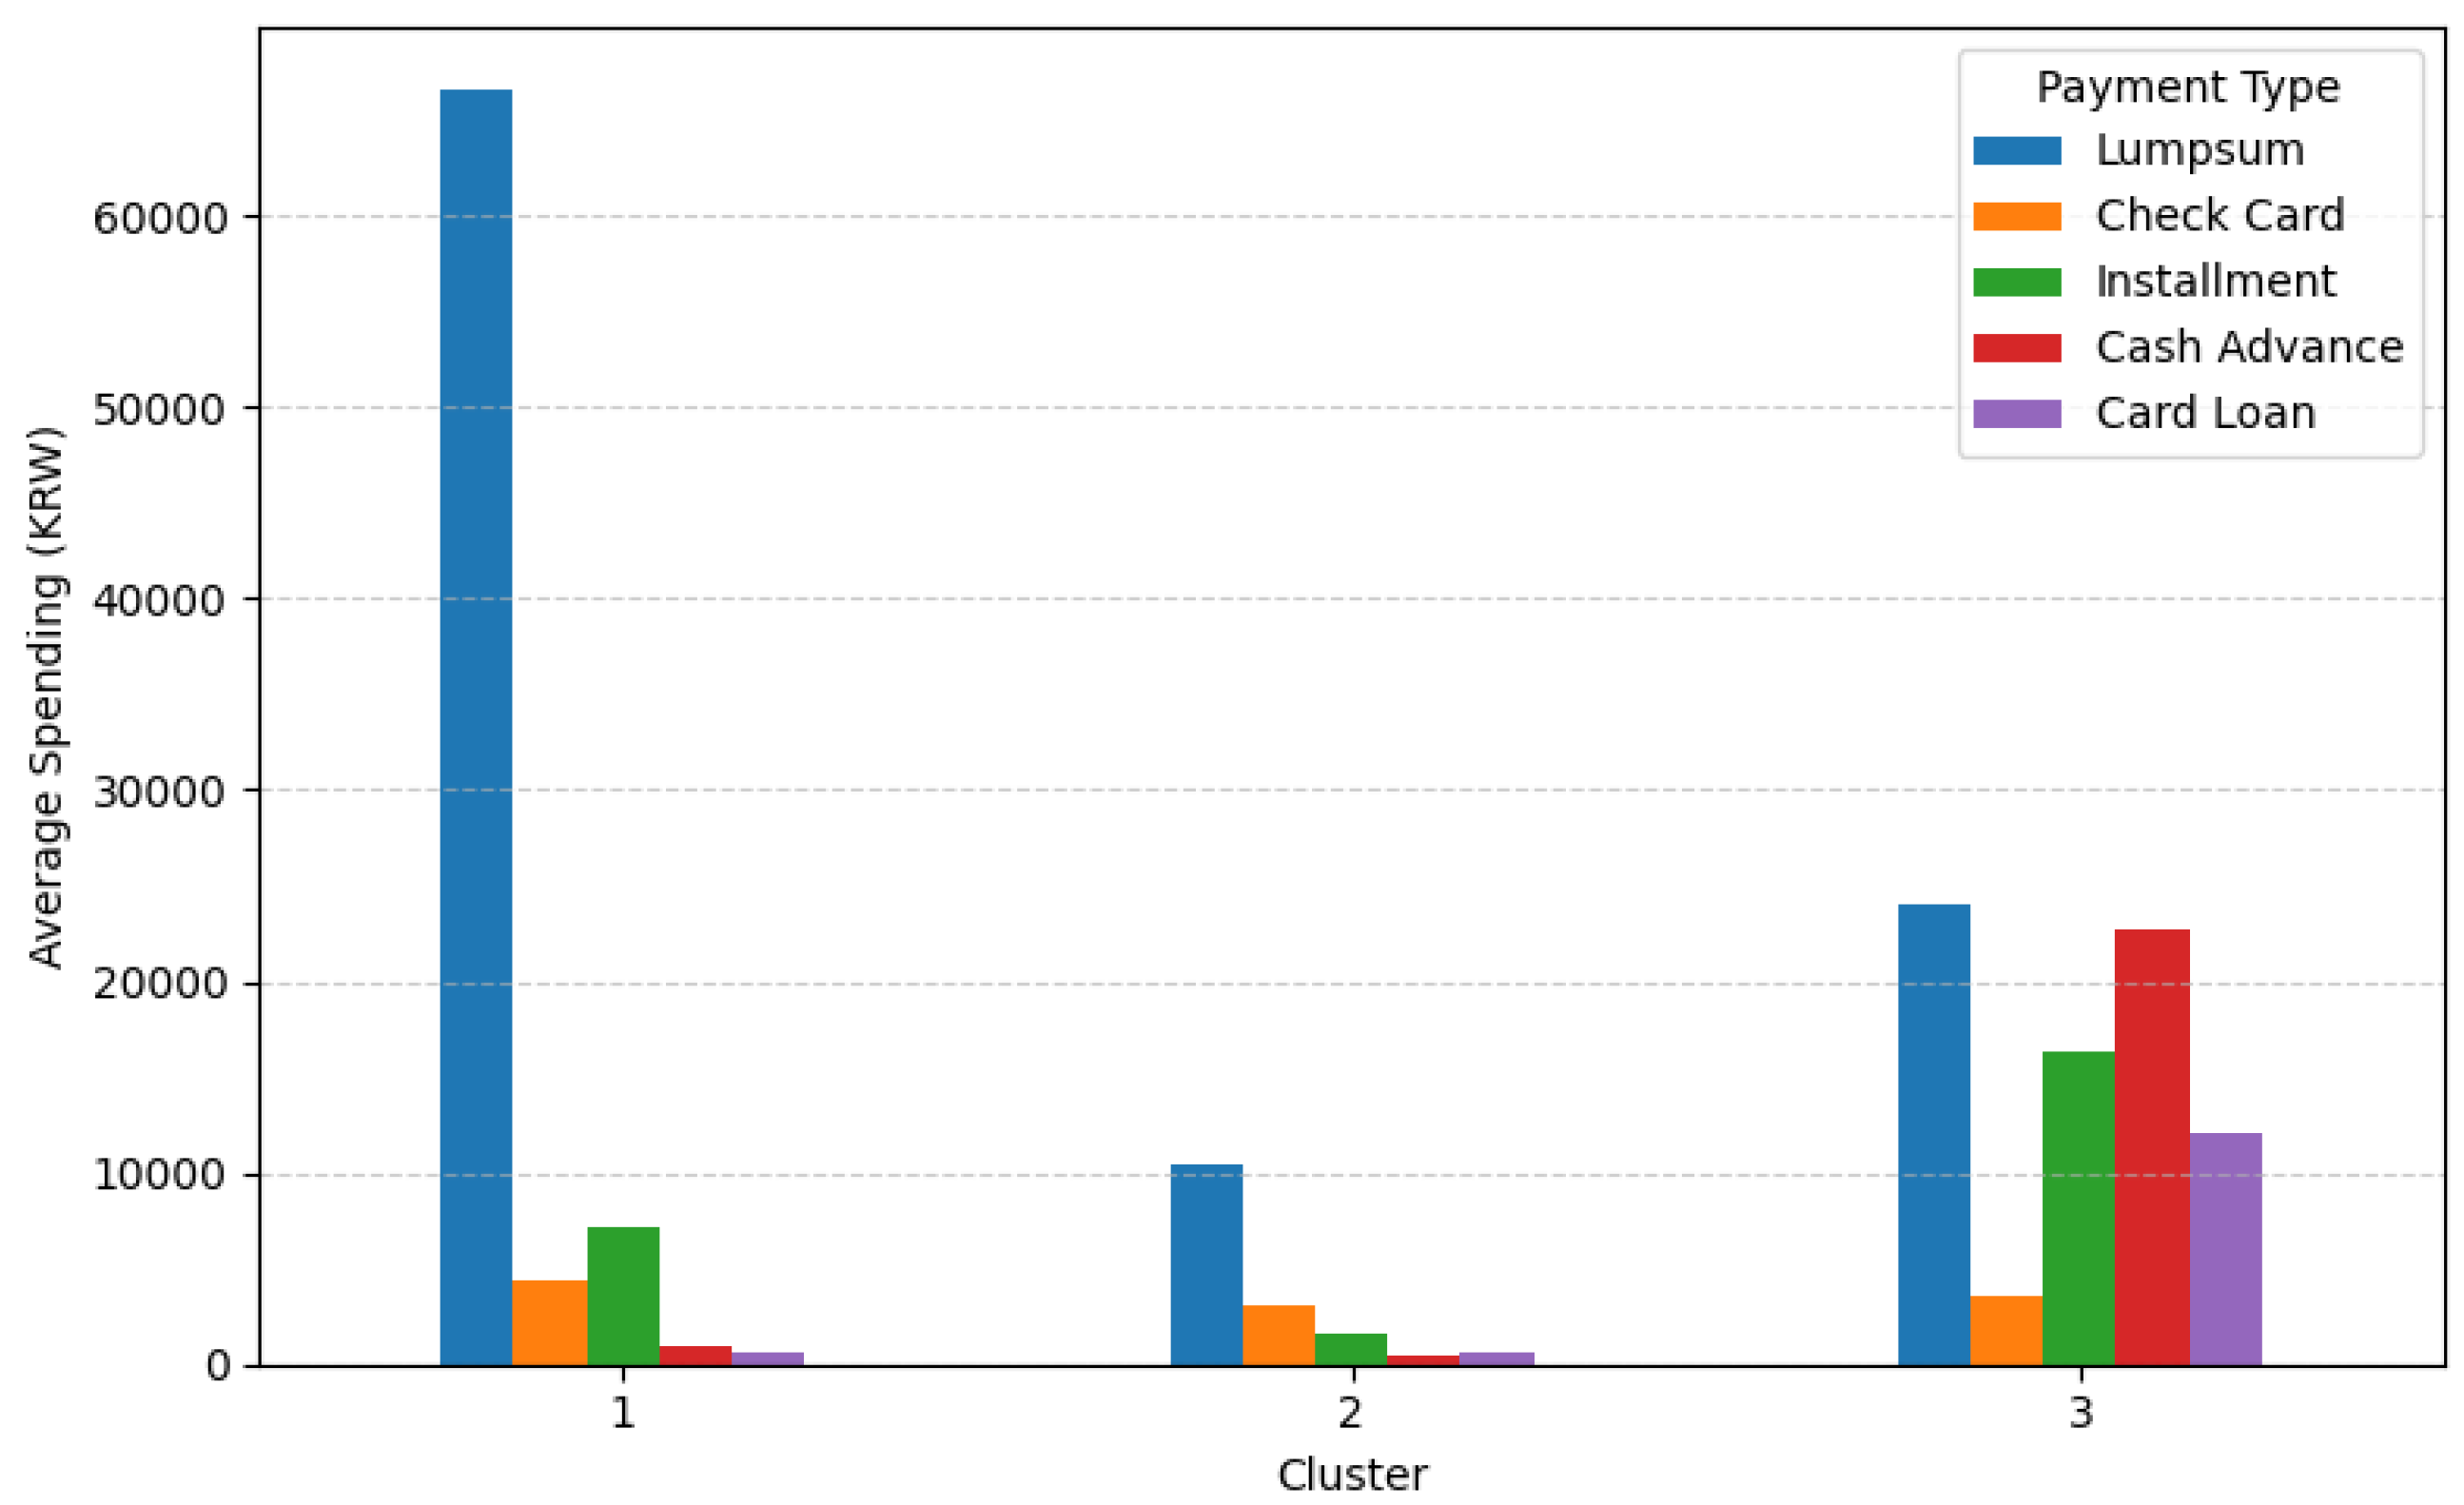
The figure clearly demonstrates notable differences in payment behavior across the three clusters. Customers in Cluster 1 primarily rely on lump-sum payments, and their spending amount is overwhelmingly higher than that of other groups, indicating strong purchasing power. Cluster 2 customers exhibit overall lower spending levels; however, their higher proportion of lump-sum payments suggests stable and conservative payment behavior. In contrast, Cluster 3 customers show a substantially higher proportion of installments, cash advances, and card loans, which distinguishes them from the other clusters and reflects high-risk financial behavior.
Figure 18 presents the proportion of customers who experienced delinquency during the most recent six-month period. Clusters 1 and 2 exhibit similar levels of delinquency frequency, although Cluster 1—whose members show higher overall spending—displays a slightly higher average count. In contrast, customers in Cluster 3 record roughly three times as many delinquency cases as those in Cluster 1, confirming their considerably higher credit risk. This result is consistent with the earlier findings that Cluster 3 customers engage more frequently in financially risky behaviors such as installment payments, cash advances, and card loans.
Overall, the financial characteristics observed across the three clusters reveal distinct behavioral patterns in spending, credit utilization, and repayment discipline. Cluster 1 represents high-value customers with strong purchasing power, high lump-sum spending, and relatively sound credit management, making them a key target for premium marketing and loyalty programs. Cluster 2 corresponds to the low-value, low-risk group, characterized by modest spending, stable repayment, and conservative credit usage—an ideal base for maintaining steady profitability with minimal risk. In contrast, Cluster 3 customers exhibit high spending intensity combined with heavy reliance on installment plans, cash advances, and card loans, along with the highest delinquency frequency, demonstrating potential financial vulnerability. From a managerial perspective, these results suggest the need for differentiated strategies: reward-based engagement for high-value customers (Cluster 1), retention programs for low-value but stable customers (Cluster 2), and proactive risk-monitoring or credit-limit management for high-risk customers (Cluster 3).
4.4. Other Characteristics of Clusters
Beyond demographic and financial factors, additional behavioral characteristics were analyzed to provide a more comprehensive understanding of each customer segment. First, the differences among clusters in terms of marketing consent are examined, as illustrated in the following figure.
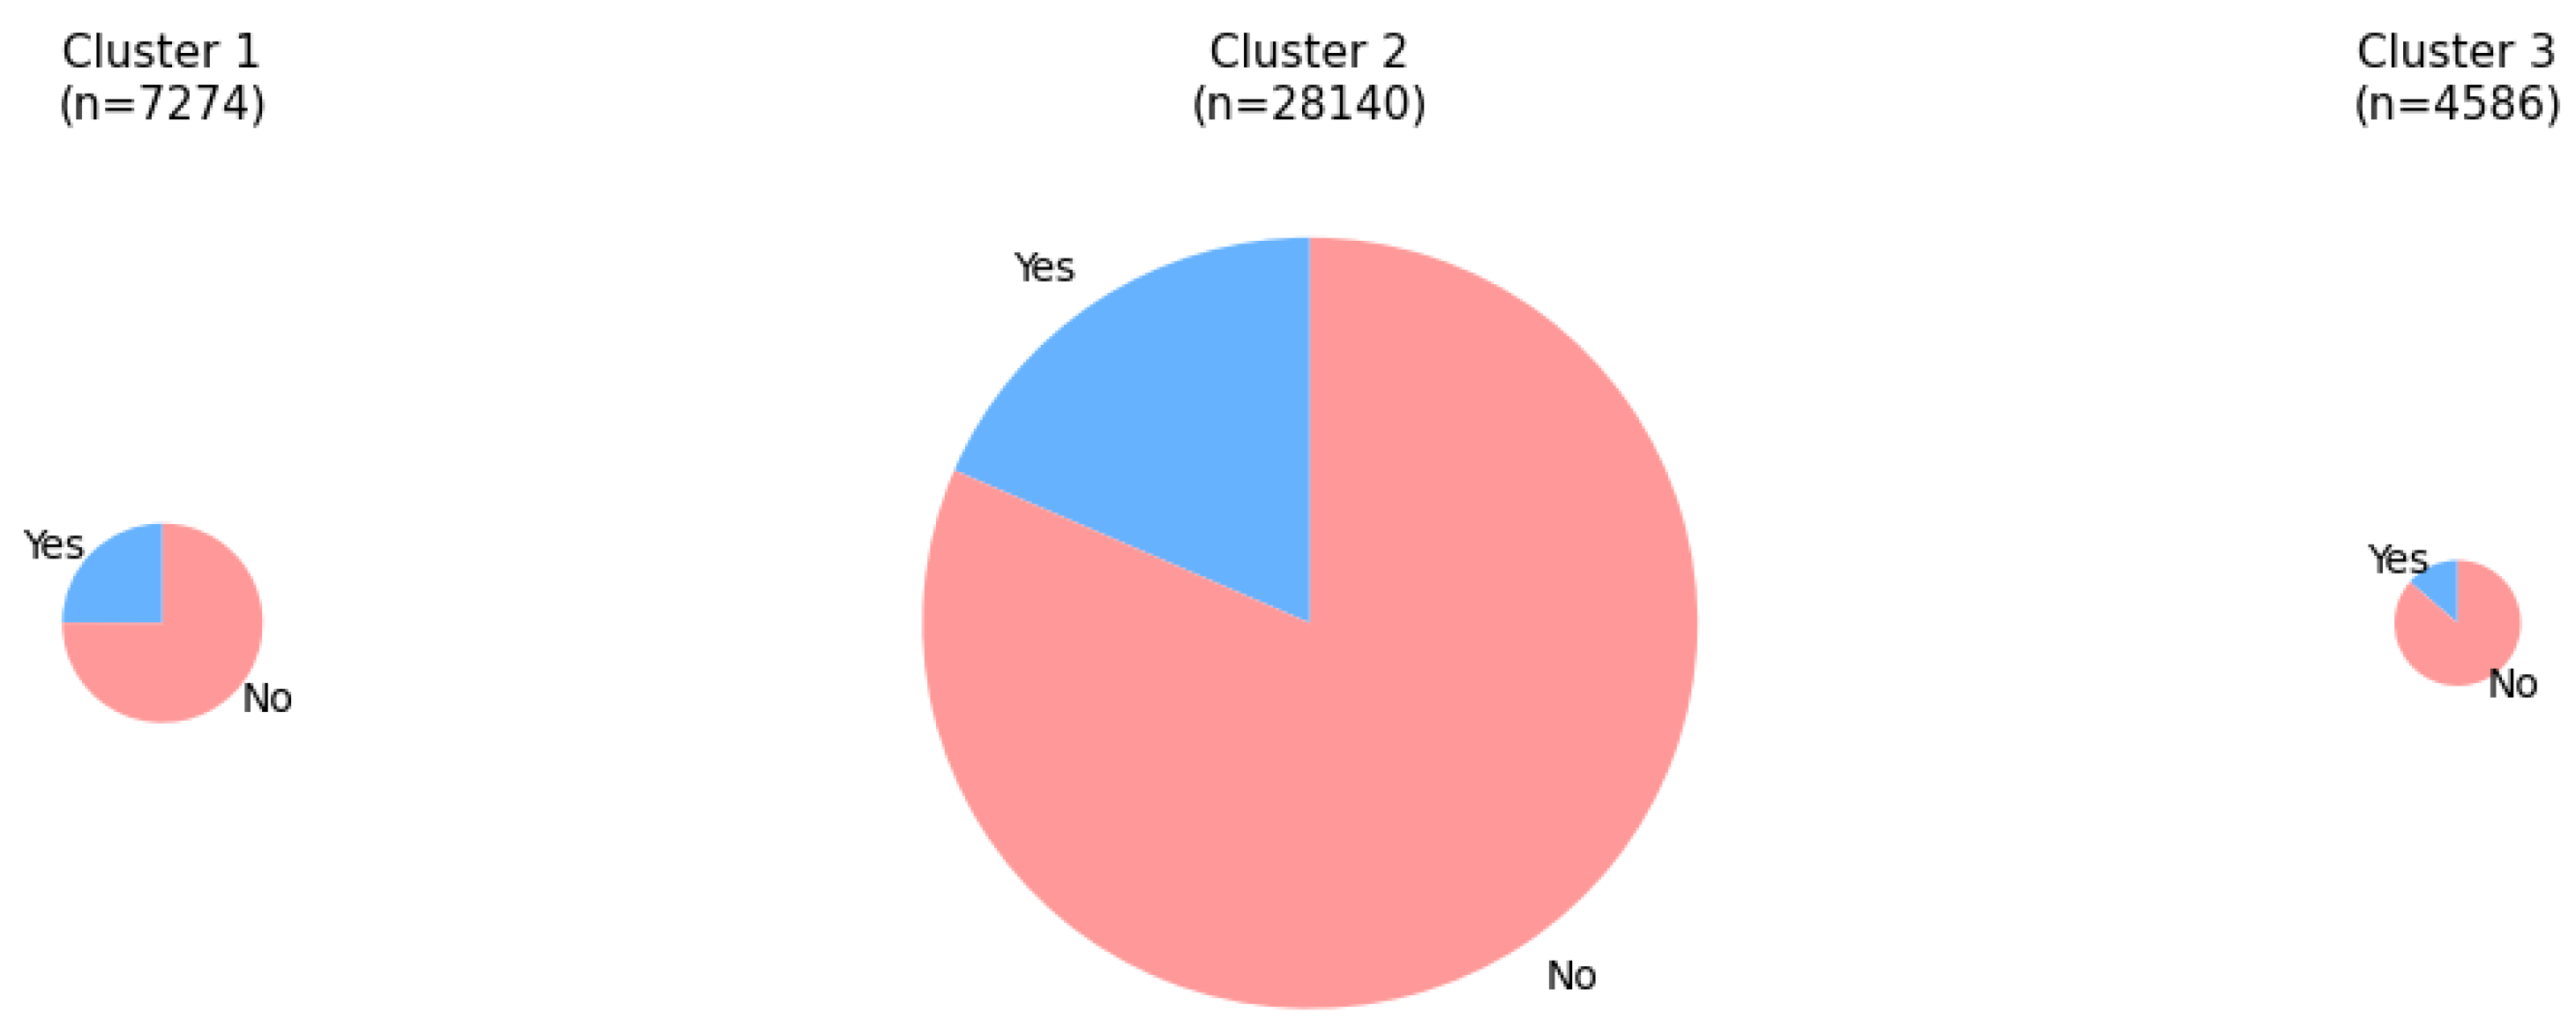
As shown in Figure 19, the proportion of customers who consented to marketing communication is highest in Cluster 1 and lowest in Cluster 3. Given that Cluster 1 customers not only exhibit higher spending levels but also show greater marketing engagement, this group represents an important target for proactive promotional strategies. Although the marketing consent rate of Cluster 2 is lower than that of Cluster 1, the absolute number of consenting customers in Cluster 2 is substantially larger because it constitutes nearly four times as many customers as Cluster 1. Therefore, it is also important to design marketing strategies that effectively reach this medium-spending segment with appropriate engagement efforts.
Figure 19.
Distribution of marketing consent status by customer cluster. The size of each pie reflects the relative cluster size.
Figure 19.
Distribution of marketing consent status by customer cluster. The size of each pie reflects the relative cluster size.
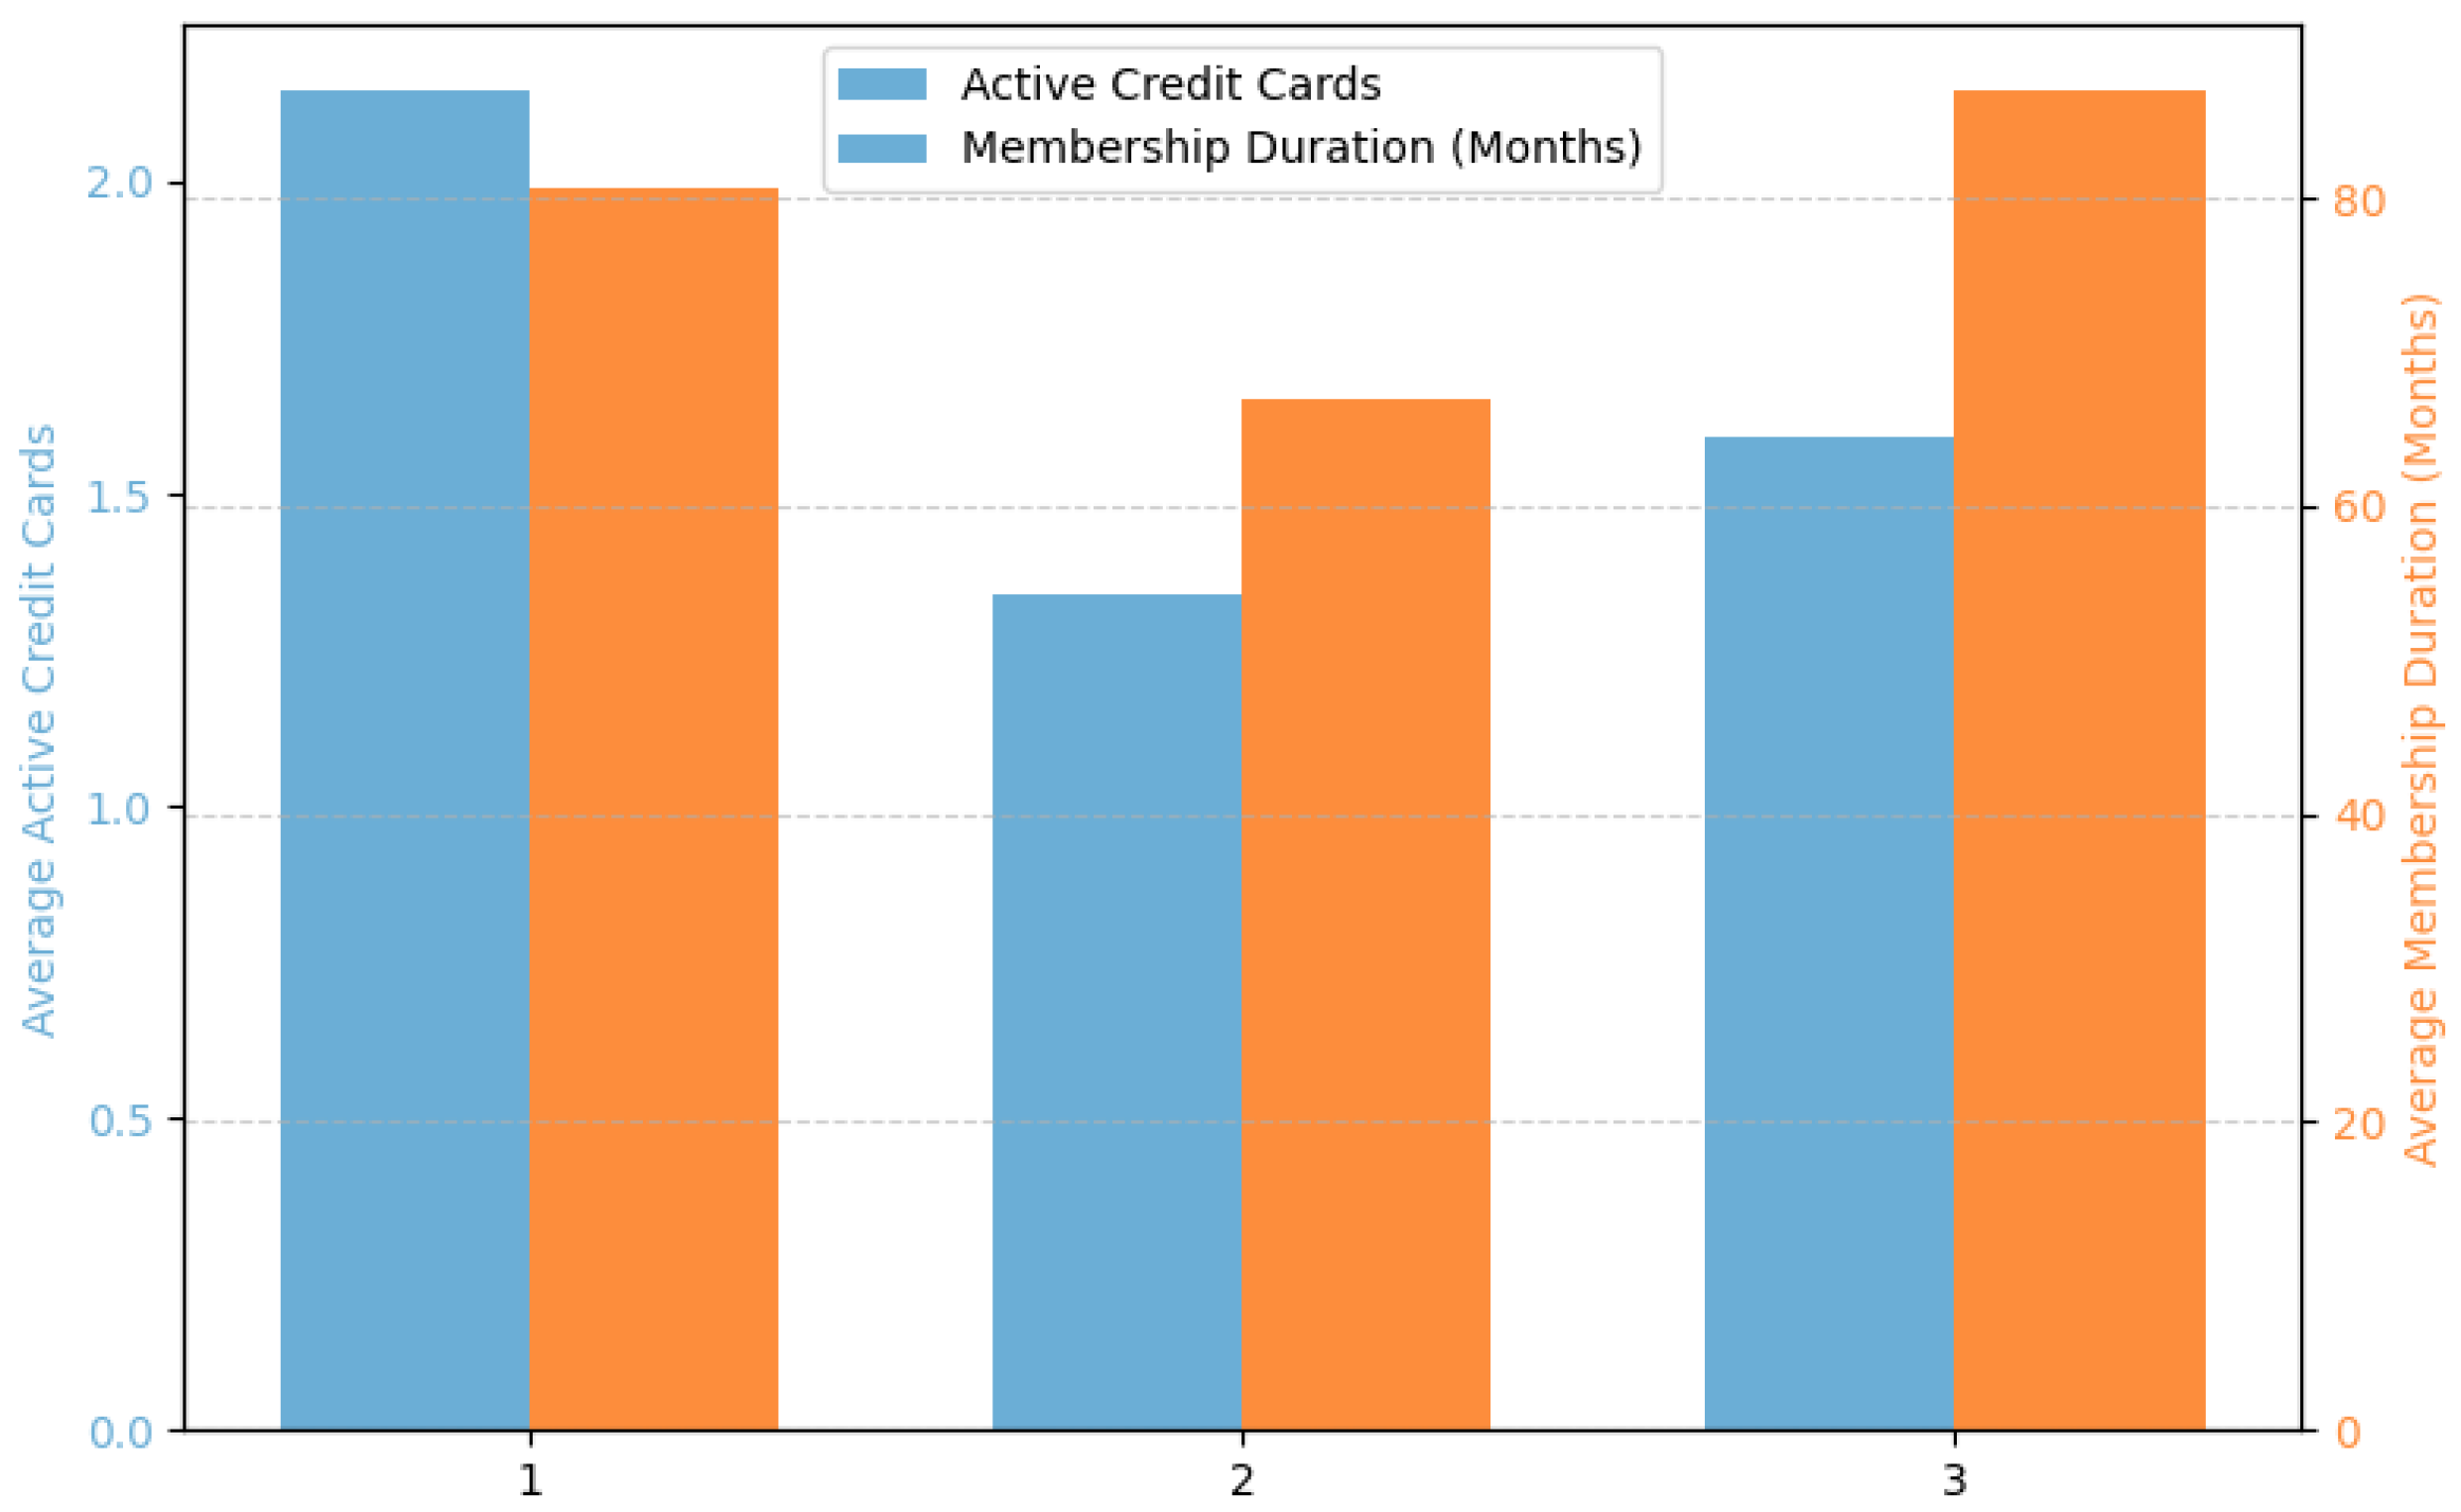
This figure illustrates how customers differ in terms of card ownership and membership longevity. Cluster 1 members tend to hold the greatest number of active credit cards, reflecting higher engagement with card services, while Cluster 3 customers exhibit the longest membership duration. In contrast, Cluster 2 customers show both fewer active cards and shorter membership periods, indicating relatively low loyalty and limited interaction with credit services. Although customers in Cluster 3 exhibit higher financial risk, their long-term relationship with the card issuer suggests that they are not entirely unstable customers. Therefore, it would be important for the company to manage their credit risk carefully while maintaining and nurturing these relationships as valuable, loyal customers over time.
Figure 20.
Average number of active credit cards and average membership duration (in months) by customer cluster.
Figure 20.
Average number of active credit cards and average membership duration (in months) by customer cluster.
4.5. Summary and Managerial Implications
The segmentation results reveal three distinct customer groups that differ systematically in spending capacity, credit-risk exposure, and relationship depth with the issuer. Cluster 1 (High-value, Low-risk) exhibits strong lump-sum spending, stable repayment behavior, and higher engagement with marketing communications. Cluster 2 (Low-value, Low-risk) forms the largest and most stable portion of the portfolio, showing modest usage and conservative credit behavior. Cluster 3 (High-risk) demonstrates active usage with greater reliance on installments, cash advances, and card loans, alongside higher delinquency frequency, yet it also maintains relatively long membership duration.
From a managerial standpoint, these findings support differentiated strategies:
- Cluster 1 — Value Expansion & Retention: Prioritize premium rewards, personalized lifestyle benefits, and high-touch loyalty programs to protect share of wallet and extend customer lifetime value.
- Cluster 2 — Cost-efficient Activation: Use targeted cross-selling, digital engagement nudges, and tiered benefits to lift usage gradually without materially increasing risk; consider small, data-driven credit-limit adjustments.
- Cluster 3 — Risk-aware Relationship Management: Implement early-warning monitoring, prudent limit management, and responsible-finance education. Pair risk controls with tailored offers that migrate usage from high-risk products to safer payment modes to preserve long-standing relationships.
Overall, the proposed segmentation framework provides a practical foundation for precision marketing and risk-based customer management in the Korean credit card industry, enhancing profitability while sustaining customer satisfaction.
5. Conclusions
This study presented a data-driven framework for segmenting Korean credit card customers using large-scale, anonymized behavioral and account-level data. After rigorous feature reduction—including missing-value pruning, numeric filtering, variance thresholding, correlation, and VIF filtering—138 informative variables were retained from an initial set of 565. Principal Component Analysis (PCA) further condensed these into three interpretable components that align with business concepts: Spending Volume (PC1), Credit & Loan Dependency (PC2), and Membership & Credit (PC3). This transformation provided a compact and meaningful representation space for subsequent clustering.
Among several clustering methods (K-means, hierarchical, and Self-Organizing Map), K-means with k = 3 achieved the most favorable internal validity—highest silhouette score and lowest Davies–Bouldin Index—while offering the clearest interpretability along the value–risk dimensions. The resulting clusters were: (i) a high-value, low-risk segment characterized by strong lump-sum spending and sound repayment discipline; (ii) a low-value, low-risk segment with conservative usage patterns that forms the portfolio’s stable core; and (iii) a high-risk segment exhibiting greater reliance on installment plans, cash advances, and card loans, alongside elevated delinquency yet notably long tenure with the issuer.
Demographic and regional analyses revealed meaningful structural differences, while behavioral indicators added further operational nuance. Collectively, these findings support differentiated strategies—premium benefits and loyalty reinforcement for high-value customers, cost-efficient activation for low-value customers, and risk-aware relationship management for high-risk customers. Methodologically, this paper integrates systematic feature reduction, interpretable representation via PCA, and multi-method clustering with both quantitative validation and visual diagnostics, all contextualized within a real Korean credit card dataset. Substantively, it provides, to the best of our knowledge, the first empirical segmentation analysis based on actual Korean credit card customer data, offering actionable insights that bridge value creation and risk control.
Nevertheless, there remains considerable room for future research. First, the clustering boundaries shown in Figure 9 are not sharply delineated, suggesting latent heterogeneity within clusters. Future studies could adopt nested or hierarchical sub-clustering to uncover finer-grained customer subgroups. Such refinement would facilitate more nuanced and customized marketing strategies reflecting the diversity within each segment. Second, developing advanced visualization techniques is essential. Given the high dimensionality of credit card datasets, conventional pairwise plots are insufficient to capture complex inter-variable relationships. Future research should therefore design high-dimensional visual analytics tools capable of representing multiple variables simultaneously and enabling interactive exploration of dependencies. These visualization frameworks would enhance interpretability and foster the development of explainable analytics in marketing and credit risk management. Finally, identifying and interpreting the key variables that drive clustering outcomes will be crucial. Feature importance analyses or explainable AI techniques (e.g., SHAP or partial dependence plots) can help reveal the underlying drivers of segment formation, improving transparency and practical understanding of customer segmentation in financial contexts.
Funding
This research received no external funding.
Data Availability Statement
The data presented in this study are openly available online. The dataset was released by a Korean credit card company for a national data analytics competition and can be found at: https://dacon.io/competitions/official/236460/overview/description.
Conflicts of Interest
The authors declare no conflicts of interest.
Abbreviations
The following abbreviations are used in this manuscript:
| PCA | Principal Component Analysis |
| CA | Cash Advance |
| TM | Telemarketing |
| DM | Direct Mail |
| SMS | Short Message Service |
| VIF | Variance Inflation Factor |
| PC | Principal Component |
| DBI | Davies–Bouldin Index |
| SOM | Self-Organizing Map |
References
- Smith, W. R. Product Differentiation and Market Segmentation as Alternative Marketing Strategies. Journal of Marketing 1956, 21 (1), 3–8. [CrossRef]
- Wind, Y. Issues and Advances in Segmentation Research. Journal of Marketing Research 1978, 15 (3), 317–337. [CrossRef]
- Smeureanu, I.; Ruxanda, G.; Badea, L. M. Customer Segmentation in Private Banking Sector Using Machine Learning Techniques. Journal of Business Economics and Management 2013, 14 (5), 923–939. [CrossRef]
- Priyadarshni, S.; Fathima, R.; Urolagin, S.; Bongale, A. M.; Dharrao, D. S. Unveiling Customer Segmentation Patterns in Credit Card Data Using K-Means Clustering: A Machine Learning Approach. In 2023 International Conference on Modeling, Simulation & Intelligent Computing (MoSICom); 2023; pp 362–366. [CrossRef]
- Olayinka, O. H. Data Driven Customer Segmentation and Personalization Strategies in Modern Business Intelligence Frameworks. World Journal of Advanced Research and Reviews 2021, 12 (3), 711–726. [CrossRef]
- Mozumder, M. A. S.; Mahmud, F.; Shak, M. S.; Sultana, N.; Rodrigues, G. N.; Rafi, M. A.; Farazi, M. Z. R.; Karim, M. R.; Khan, M. S.; Bhuiyan, M. S. M. Optimizing Customer Segmentation in the Banking Sector: A Comparative Analysis of Machine Learning Algorithms. Journal of Computer Science and Technology Studies 2024, 6 (4), 01–07. [CrossRef]
- Yan, X.; Li, Y.; Nie, F.; Li, R. Bank Customer Segmentation and Marketing Strategies Based on Improved DBSCAN Algorithm. Applied Sciences 2025, 15 (6), 3138. [CrossRef]
- Moon, H. “As I was paying off debt with a card…” Last year’s card issuance and payments ‘record high’ [Money What Money]. Herald Gyeongje [Online], July 4, 2024. https://mbiz.heraldcorp.com/article/20240704085116 (accessed Sep 30, 2025).
- Alves Gomes, M.; Meisen, T. A Review on Customer Segmentation Methods for Personalized Customer Targeting in E-Commerce Use Cases. Inf Syst E-Bus Manage 2023, 21 (3), 527–570. [CrossRef]
- Salminen, J.; Mustak, M.; Sufyan, M.; Jansen, B. J. How Can Algorithms Help in Segmenting Users and Customers? A Systematic Review and Research Agenda for Algorithmic Customer Segmentation. J Market Anal 2023, 11 (4), 677–692. [CrossRef]
- Hiziroglu, A. Soft Computing Applications in Customer Segmentation: State-of-Art Review and Critique. Expert Systems with Applications 2013, 40 (16), 6491–6507. [CrossRef]
- Amato, A.; Osterrieder, J.; Machado, M. Integration of Early Warning Systems and Customer Segmentation Methods in the Financial Industry - A Systematic Literature Review. Social Science Research Network: Rochester, NY October 30, 2023. [CrossRef]
- Butaru, F.; Chen, Q.; Clark, B.; Das, S.; Lo, A. W.; Siddique, A. Risk and Risk Management in the Credit Card Industry. Journal of Banking & Finance 2016, 72, 218–239. [CrossRef]
- Cuadros, A. J.; Domínguez, V. E. Customer Segmentation Model Based on Value Generation for Marketing Strategies Formulation. Estudios Gerenciales 2014, 30 (130), 25–30. [CrossRef]
- Bošnjak, Z.; Grljevic, O. Credit Users Segmentation for Improved Customer Relationship Management in Banking. In 2011 6th IEEE International Symposium on Applied Computational Intelligence and Informatics (SACI); 2011; pp 379–384. [CrossRef]
- Martins, M. C. M. S. G.; Cardoso, M. G. M. S. Cross-Validation of Segments of Credit Card Holders. Journal of Retailing and Consumer Services 2012, 19 (6), 629–636. [CrossRef]
- Sulsule, G.; Lade, S. CREDIT CARD-SEGMENTATION. Social Science Research Network: Rochester, NY July 27, 2024. [CrossRef]
- Abdulhafedh, A. Incorporating K-Means, Hierarchical Clustering and PCA in Customer Segmentation. Journal of City and Development 2021, 3 (1), 12–30. [CrossRef]
- Dash, D.; Mishra, A. Credit Card Holders Segmentation Using K-Mean Clustering with Autoencoder. In 2022 International Conference on Advancements in Smart, Secure and Intelligent Computing (ASSIC); 2022; pp 1–5. [CrossRef]
- Ho, H.; Tien, K.-M. (Terence); Wu, A.; Singh, S. A Sequence Analysis Approach to Segmenting Credit Card Customers. Journal of Retailing and Consumer Services 2021, 59, 102391. [CrossRef]
- Li, W.; Wu, X.; Sun, Y.; Zhang, Q. Credit Card Customer Segmentation and Target Marketing Based on Data Mining. In 2010 International Conference on Computational Intelligence and Security; 2010; pp 73–76. [CrossRef]
- Raj, S.; Roy, S.; Jana, S.; Roy, S.; Goto, T.; Sen, S. Customer Segmentation Using Credit Card Data Analysis. In 2023 IEEE/ACIS 21st International Conference on Software Engineering Research, Management and Applications (SERA); 2023; pp 383–388. [CrossRef]
- Umuhoza, E.; Ntirushwamaboko, D.; Awuah, J.; Birir, B. Using Unsupervised Machine Learning Techniques for Behavioral-Based Credit Card Users Segmentation in Africa. SAIEE Africa Research Journal 2020, 111 (3), 95–101. [CrossRef]
- Yanık, S.; Elmorsy, A. SOM Approach for Clustering Customers Using Credit Card Transactions. International Journal of Intelligent Computing and Cybernetics 2019, 12 (3), 372–388. [CrossRef]
- Rachman, F. P.; Santoso, H.; Djajadi, A. Machine Learning Mini Batch K-Means and Business Intelligence Utilization for Credit Card Customer Segmentation. International Journal of Advanced Computer Science and Applications 2021, 12 (10). [CrossRef]
- Bock, H. H. (2008). Origins and extensions of the k-means algorithm in cluster analysis. Electronic journal for history of probability and statistics, 4(2), 1-18.
- Rousseeuw, P. J. Silhouettes: A Graphical Aid to the Interpretation and Validation of Cluster Analysis. Journal of Computational and Applied Mathematics 1987, 20, 53–65. [CrossRef]
- Davies, D. L.; Bouldin, D. W. A Cluster Separation Measure. IEEE Transactions on Pattern Analysis and Machine Intelligence 1979, PAMI-1 (2), 224–227. [CrossRef]
- Ward Jr., J. H. Hierarchical Grouping to Optimize an Objective Function. Journal of the American Statistical Association 1963, 58 (301), 236–244. [CrossRef]
- Kohonen, T. Self-Organized Formation of Topologically Correct Feature Maps. Biol. Cybern. 1982, 43 (1), 59–69. [CrossRef]
Figure 1.
Distribution of gender and age groups in the Korean credit card customer dataset.
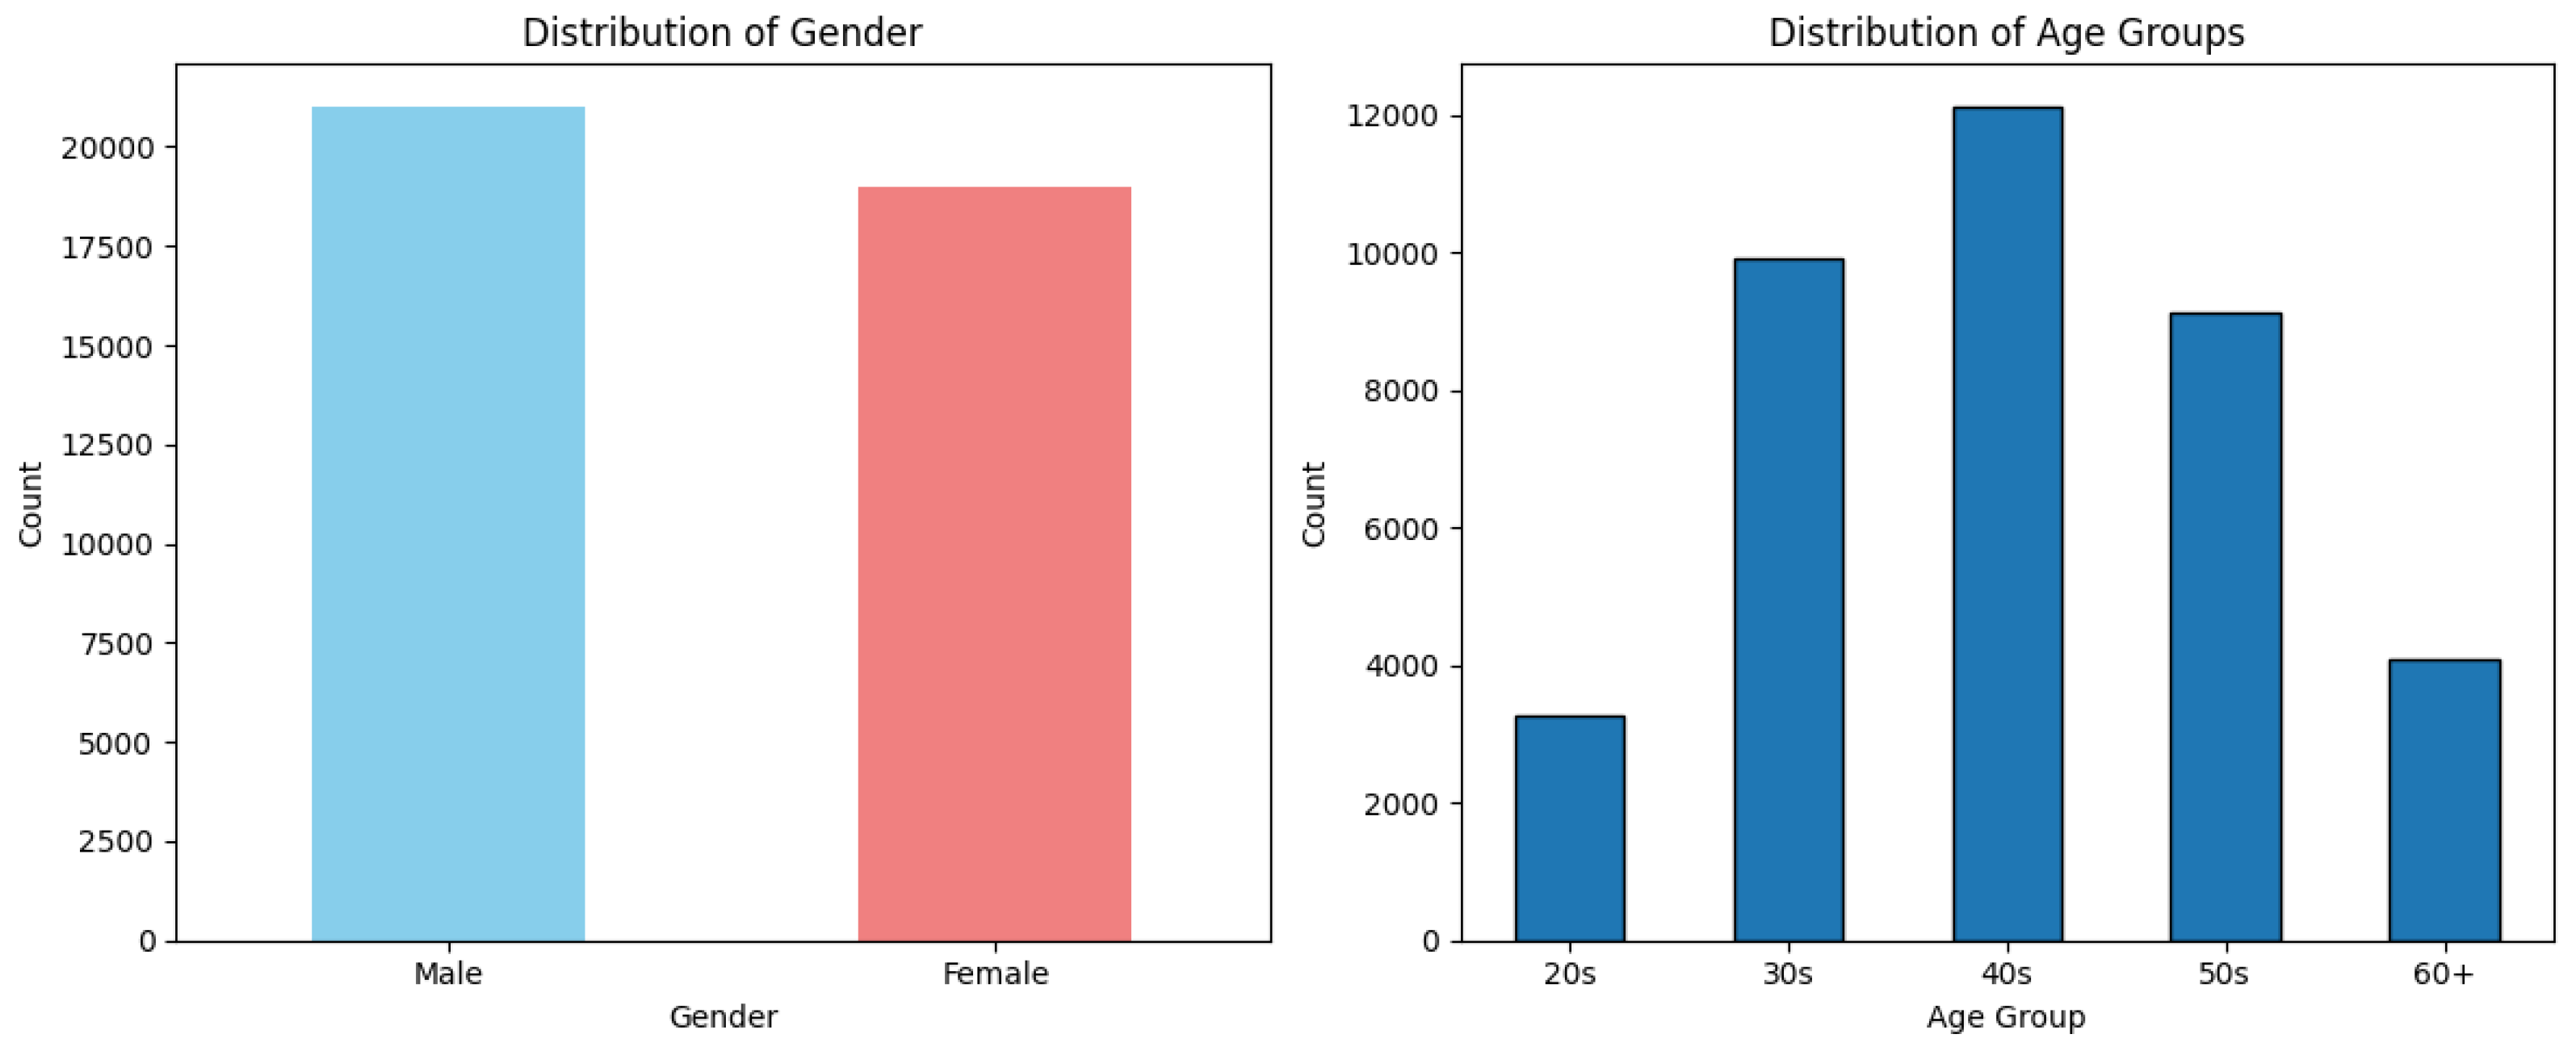
Figure 2.
Distribution of monthly lump-sum spending and delinquency status among Korean credit card customers.
Figure 2.
Distribution of monthly lump-sum spending and delinquency status among Korean credit card customers.
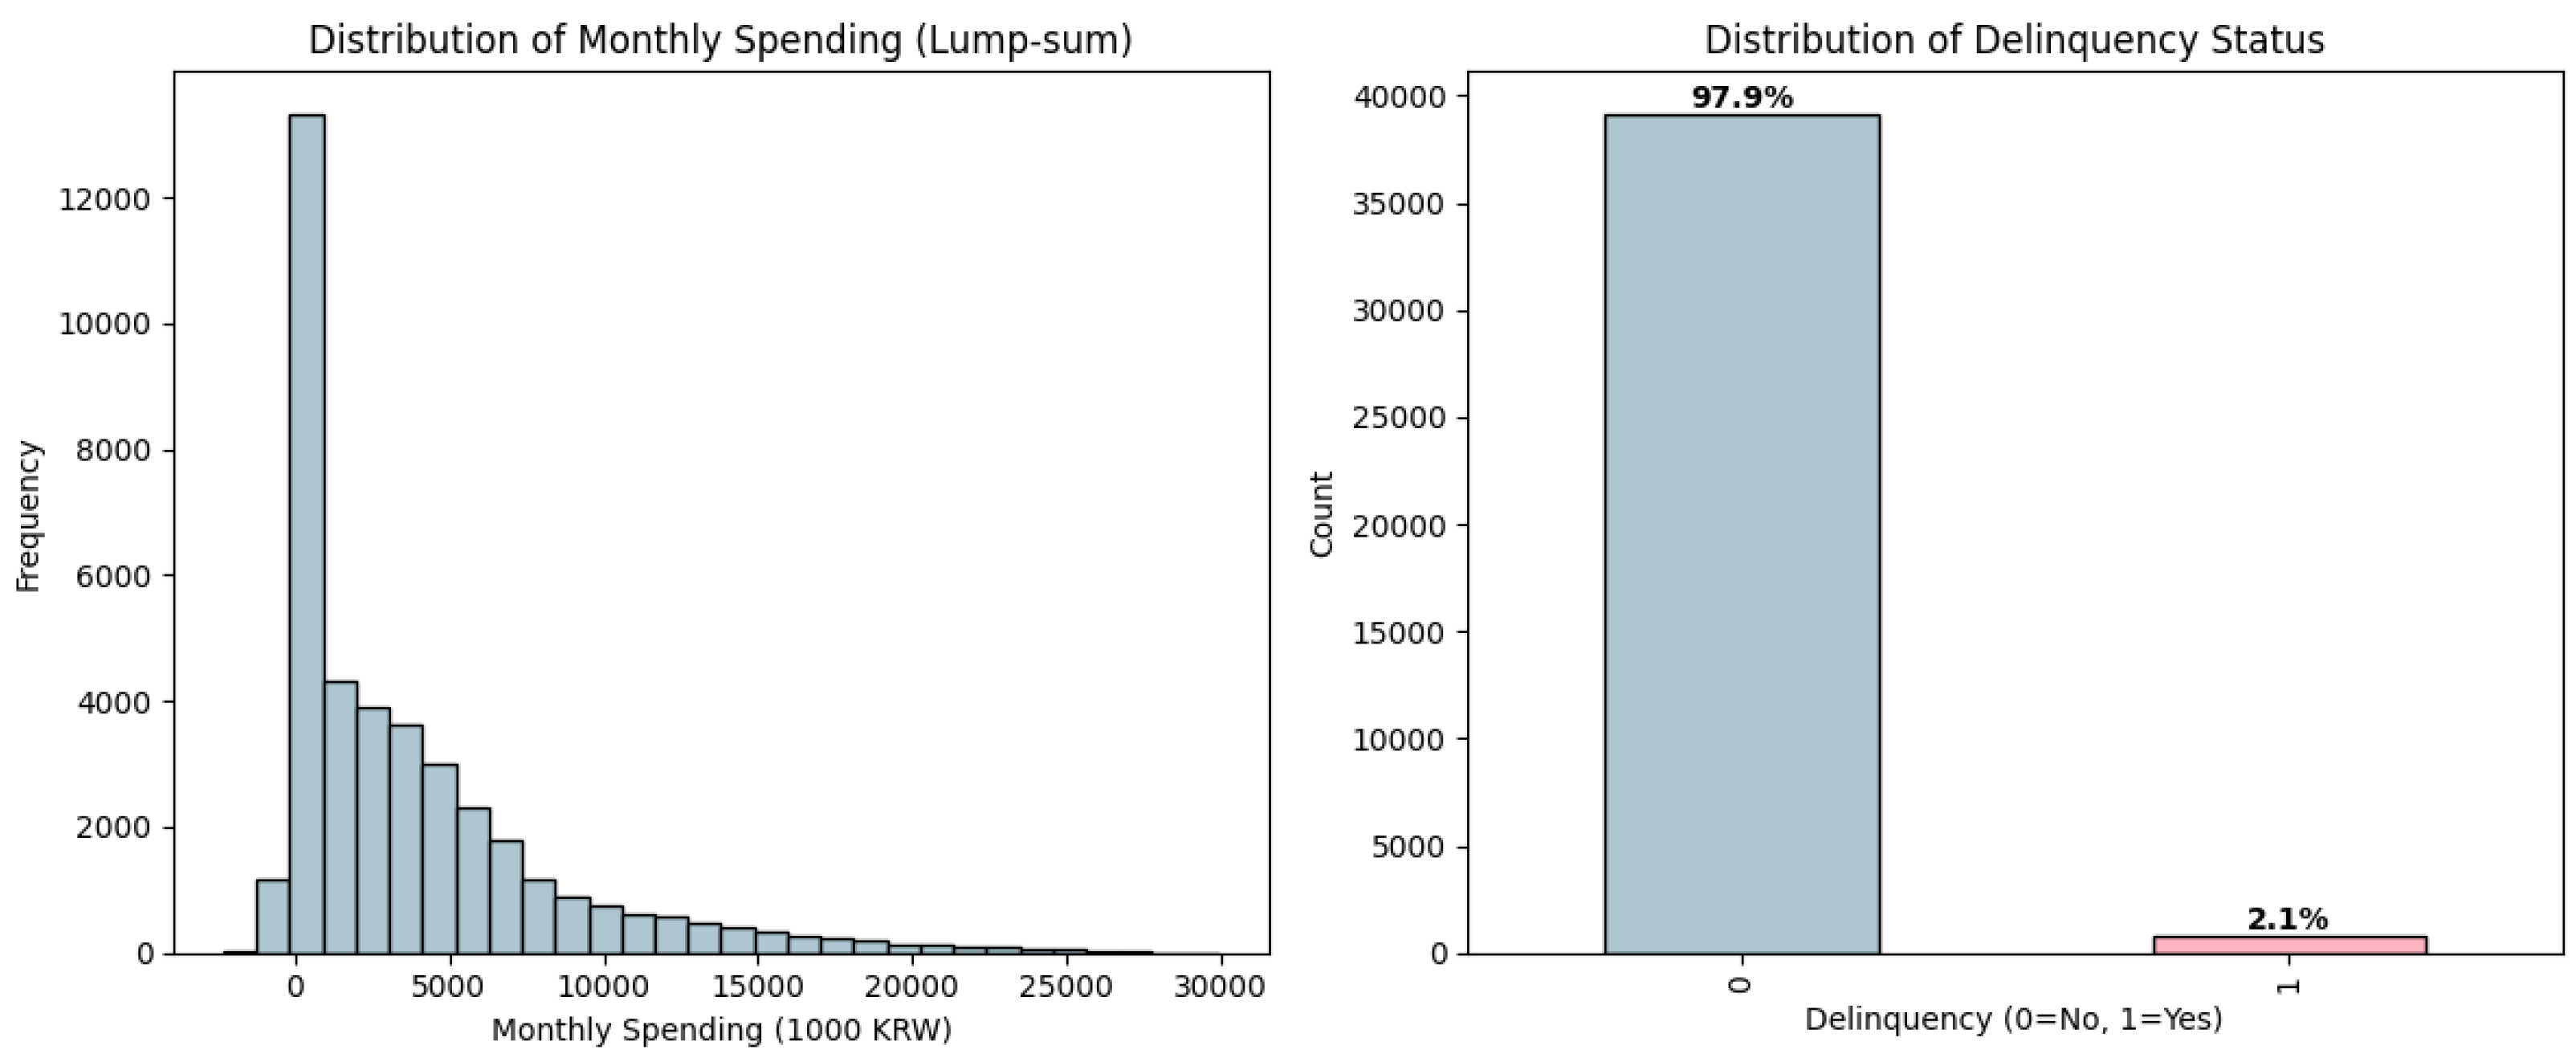
Figure 3.
Correlation heatmap of shopping-related spending across different merchant categories.
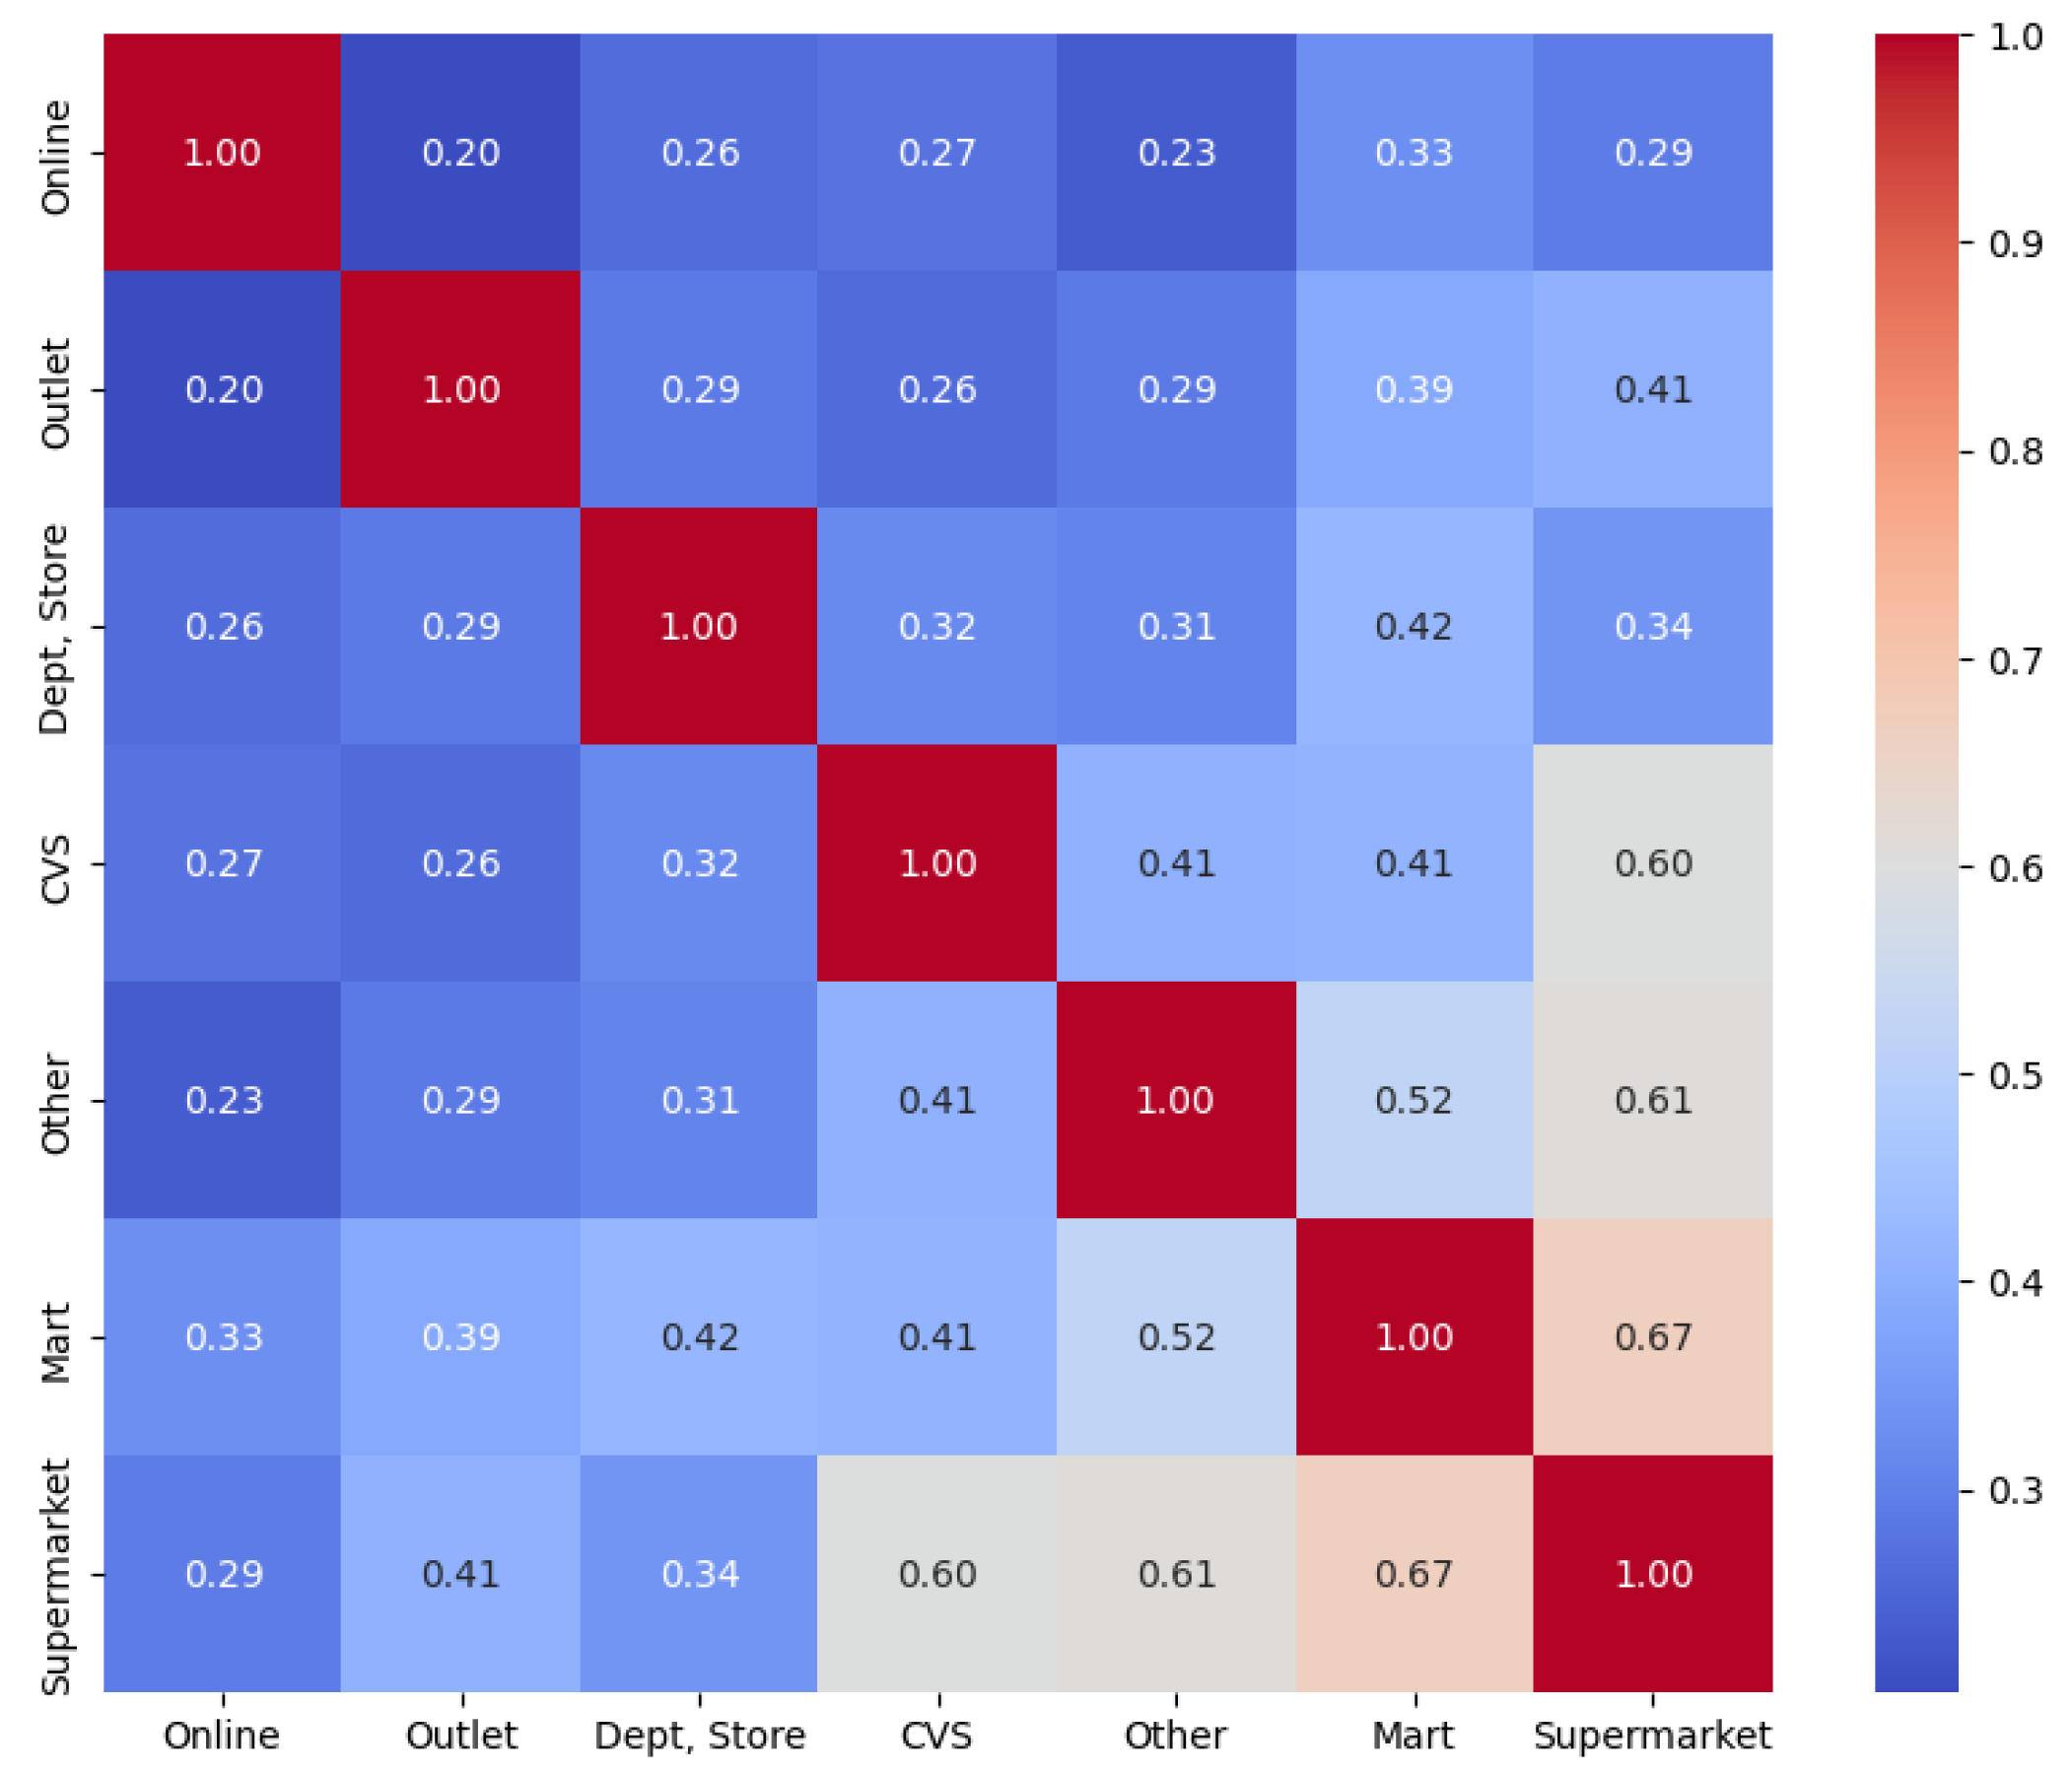
Figure 4.
Distribution of cash advance (CA) interest rates and card loan interest rates among Korean credit card customers.
Figure 4.
Distribution of cash advance (CA) interest rates and card loan interest rates among Korean credit card customers.
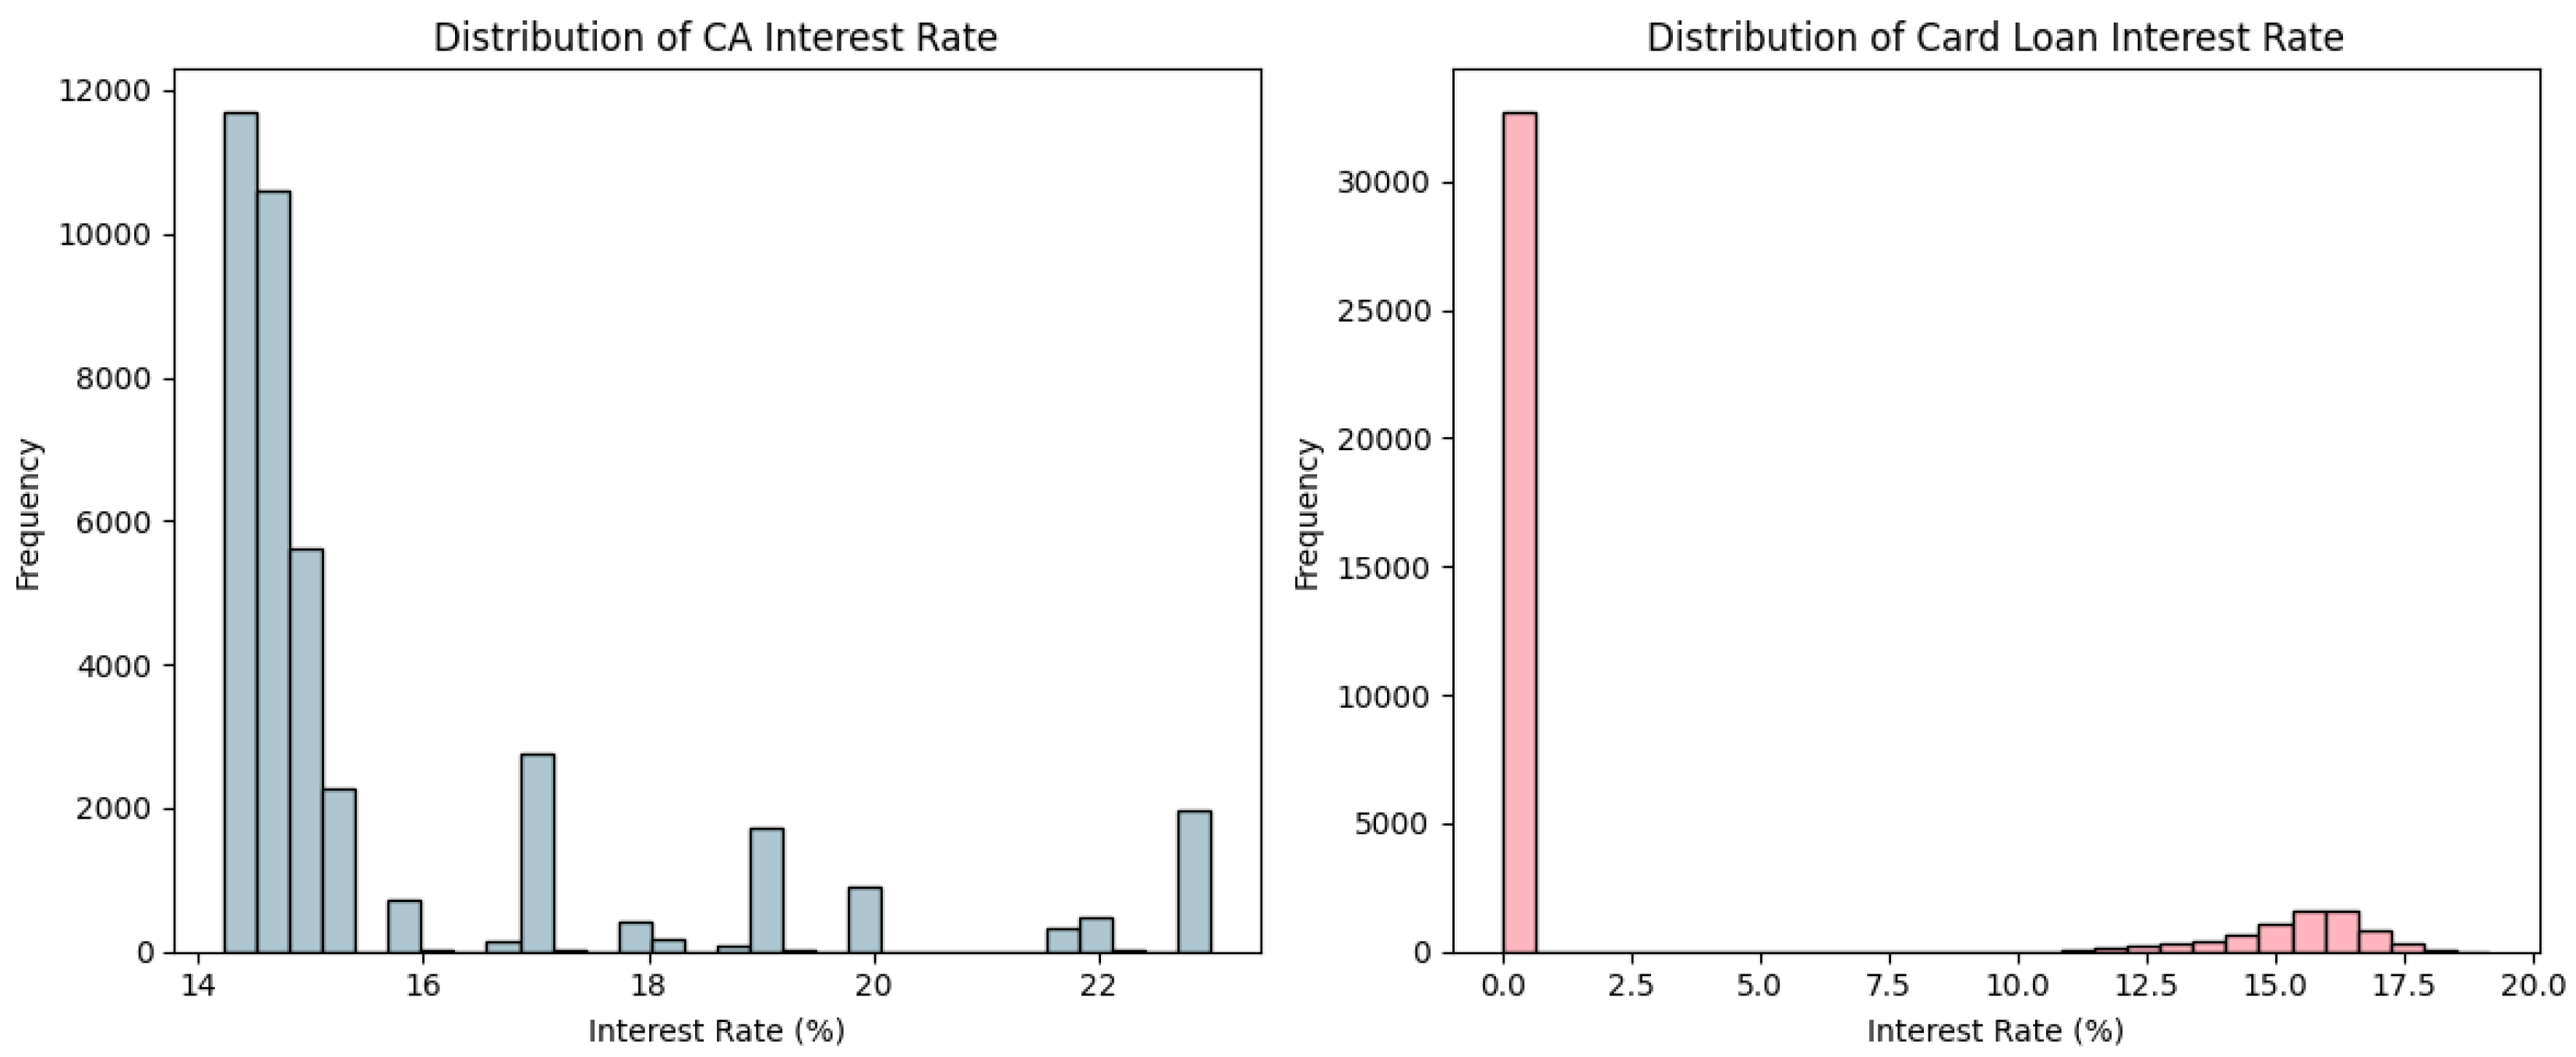
Figure 5.
Unsubscribe rates by marketing channels among Korean credit card customers.
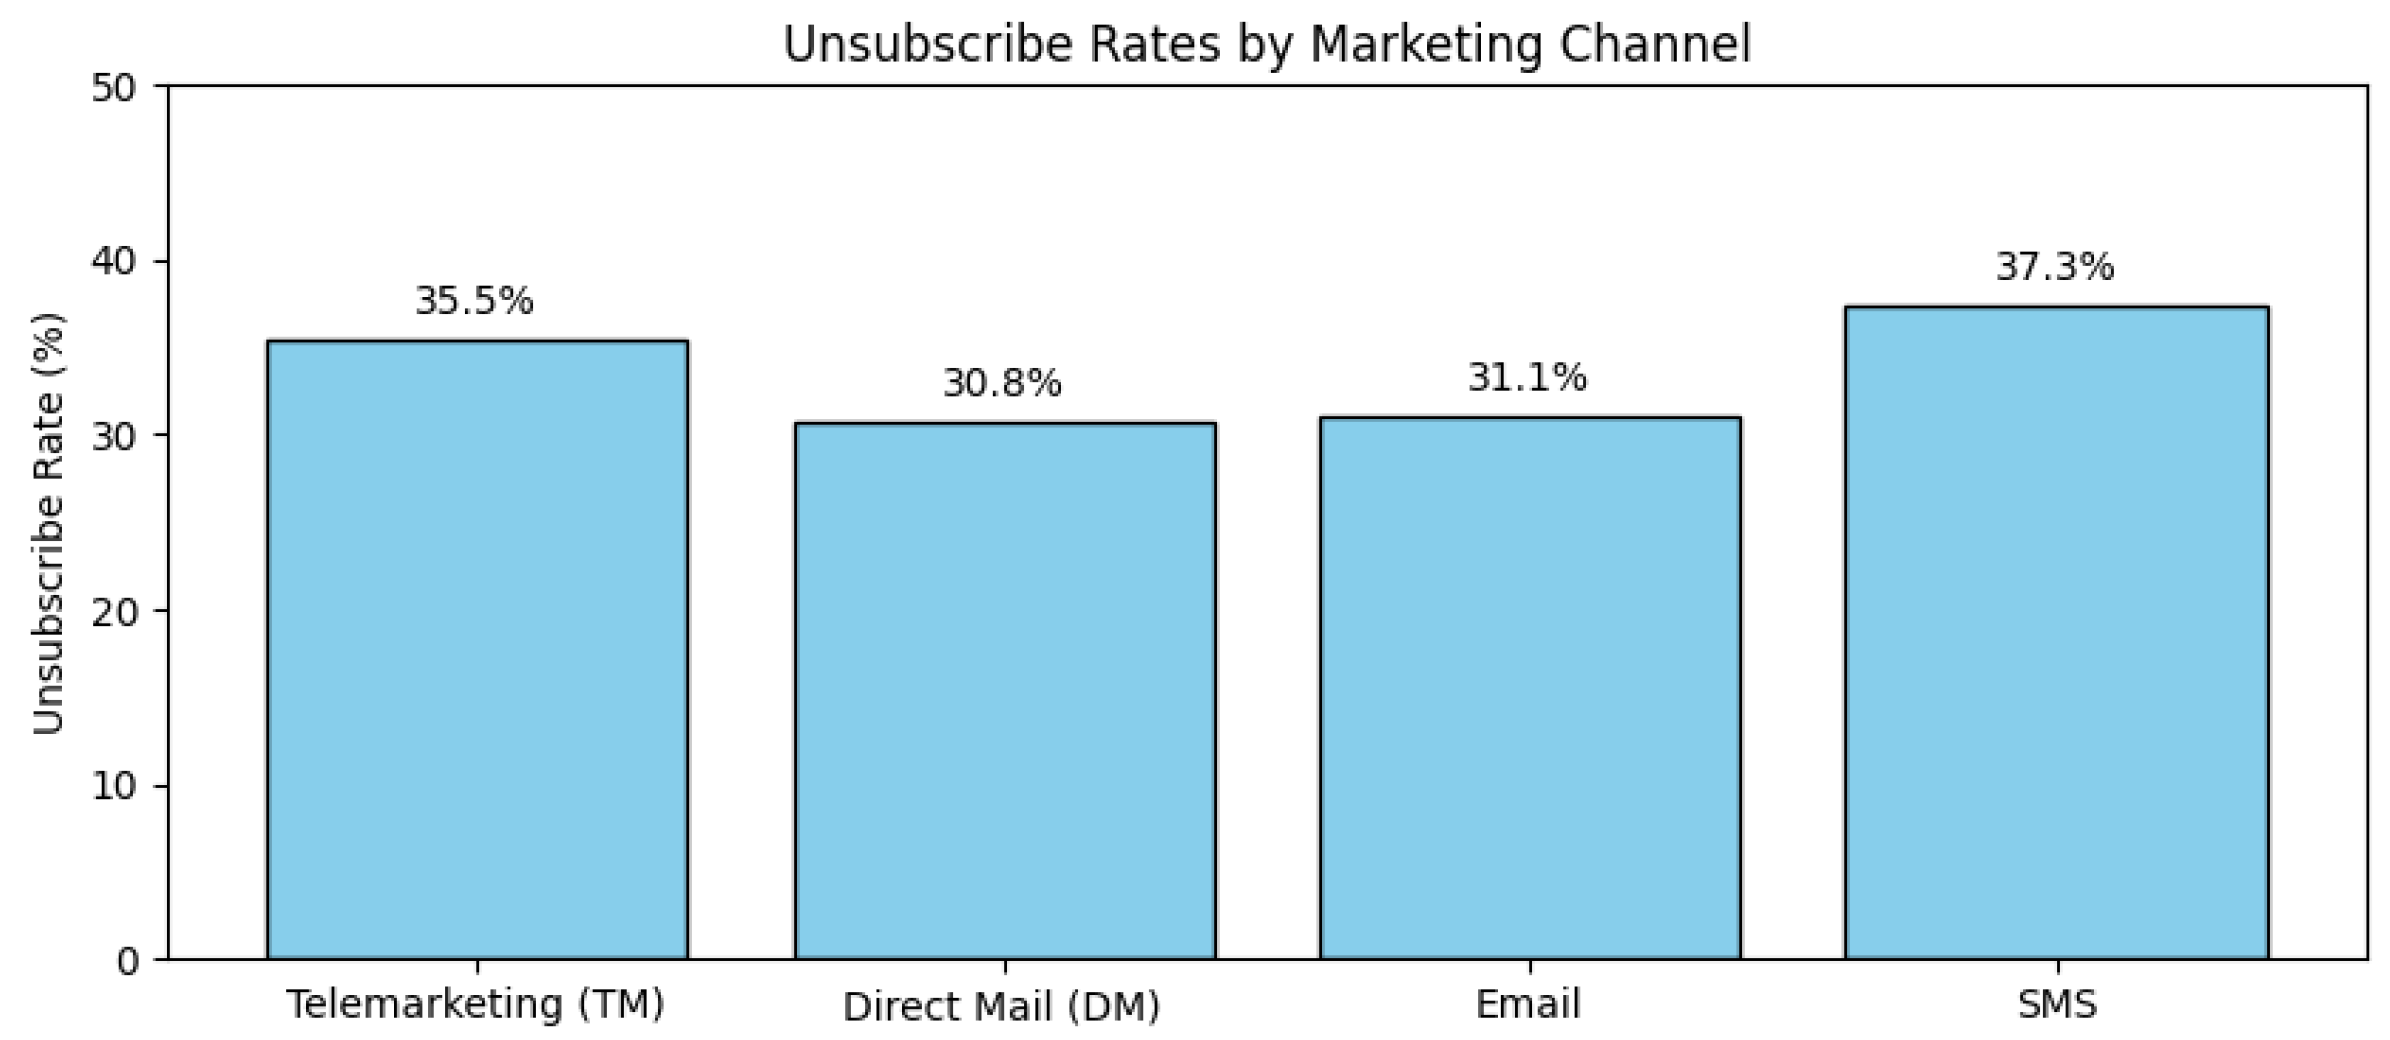
Figure 6.
Distribution of reward points and mileage accumulated over a one-year period.
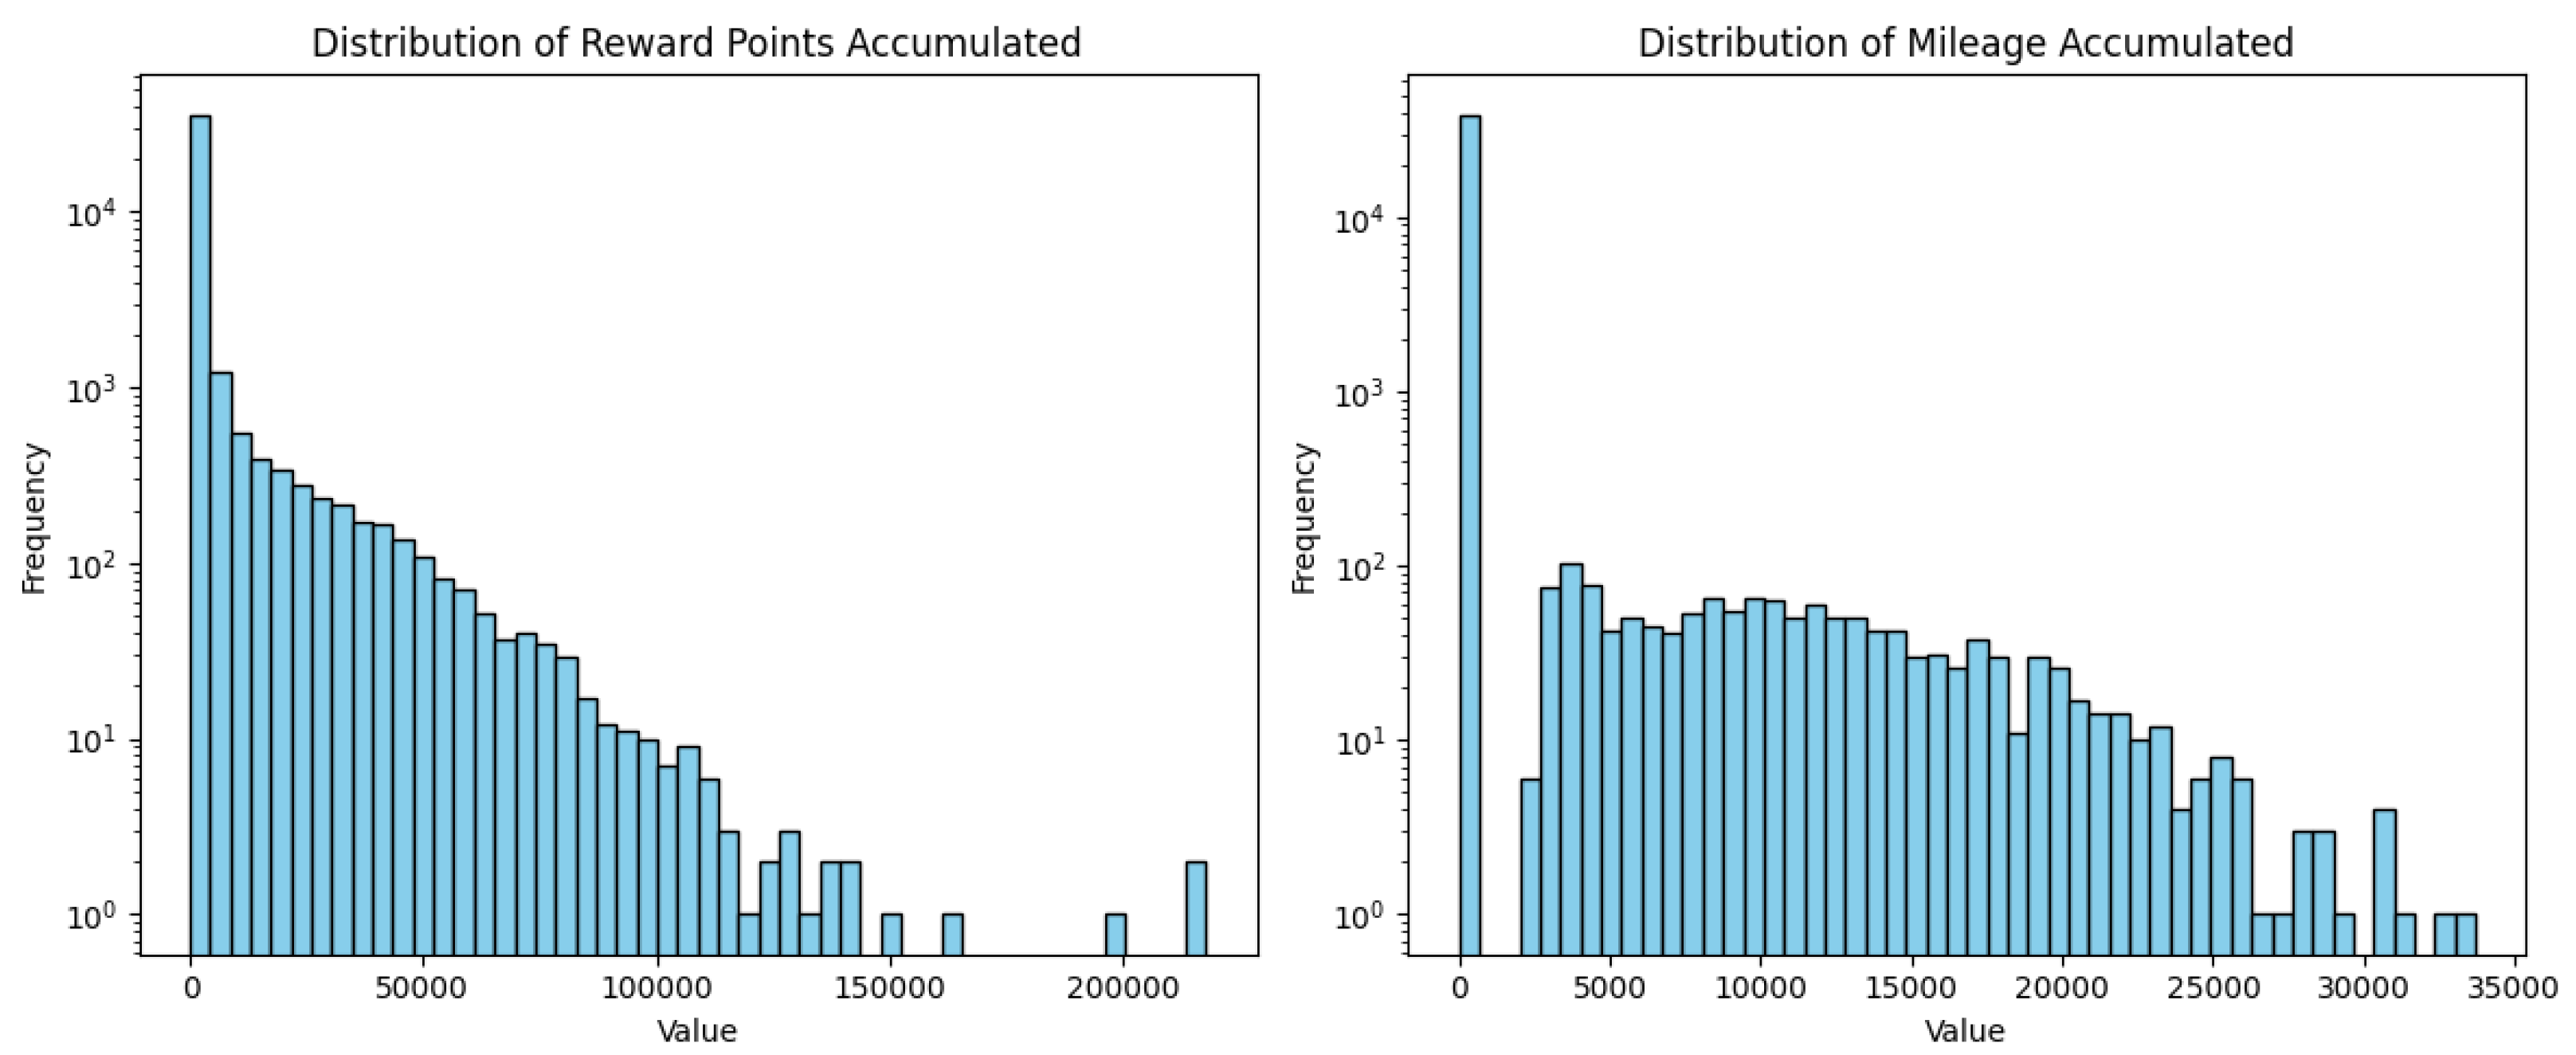
Figure 8.
Scree plot of explained variance ratios for the first 20 principal components.
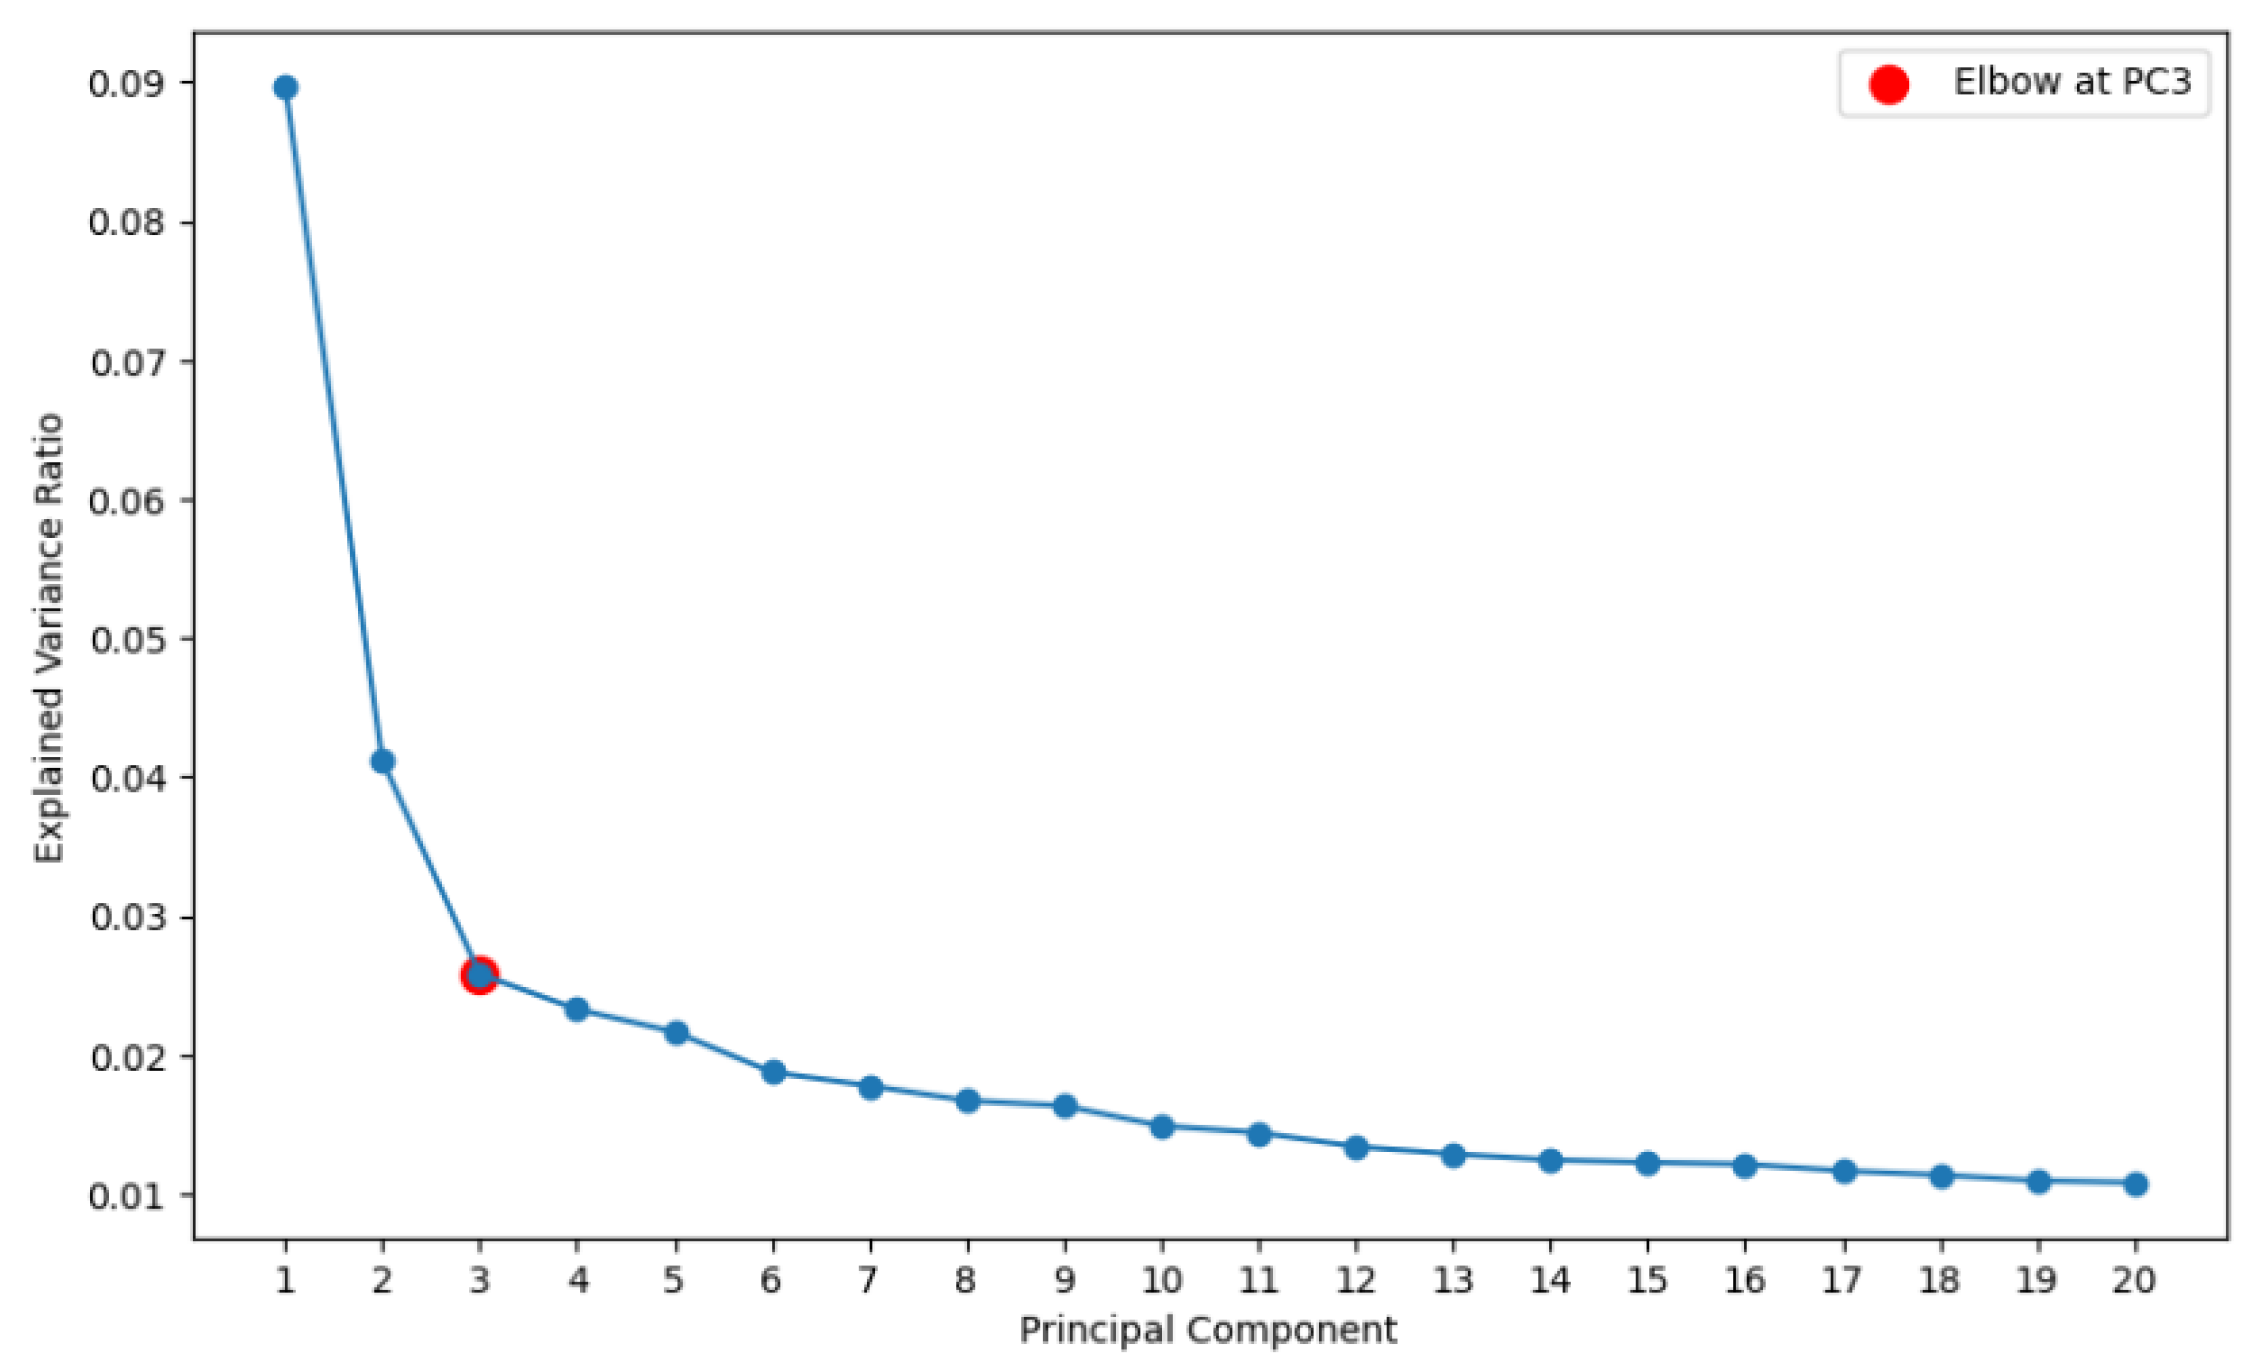
Figure 9.
Visualization of K-means clustering results for k=2,3,4 using the first two principal components (PC1 and PC2).
Figure 9.
Visualization of K-means clustering results for k=2,3,4 using the first two principal components (PC1 and PC2).
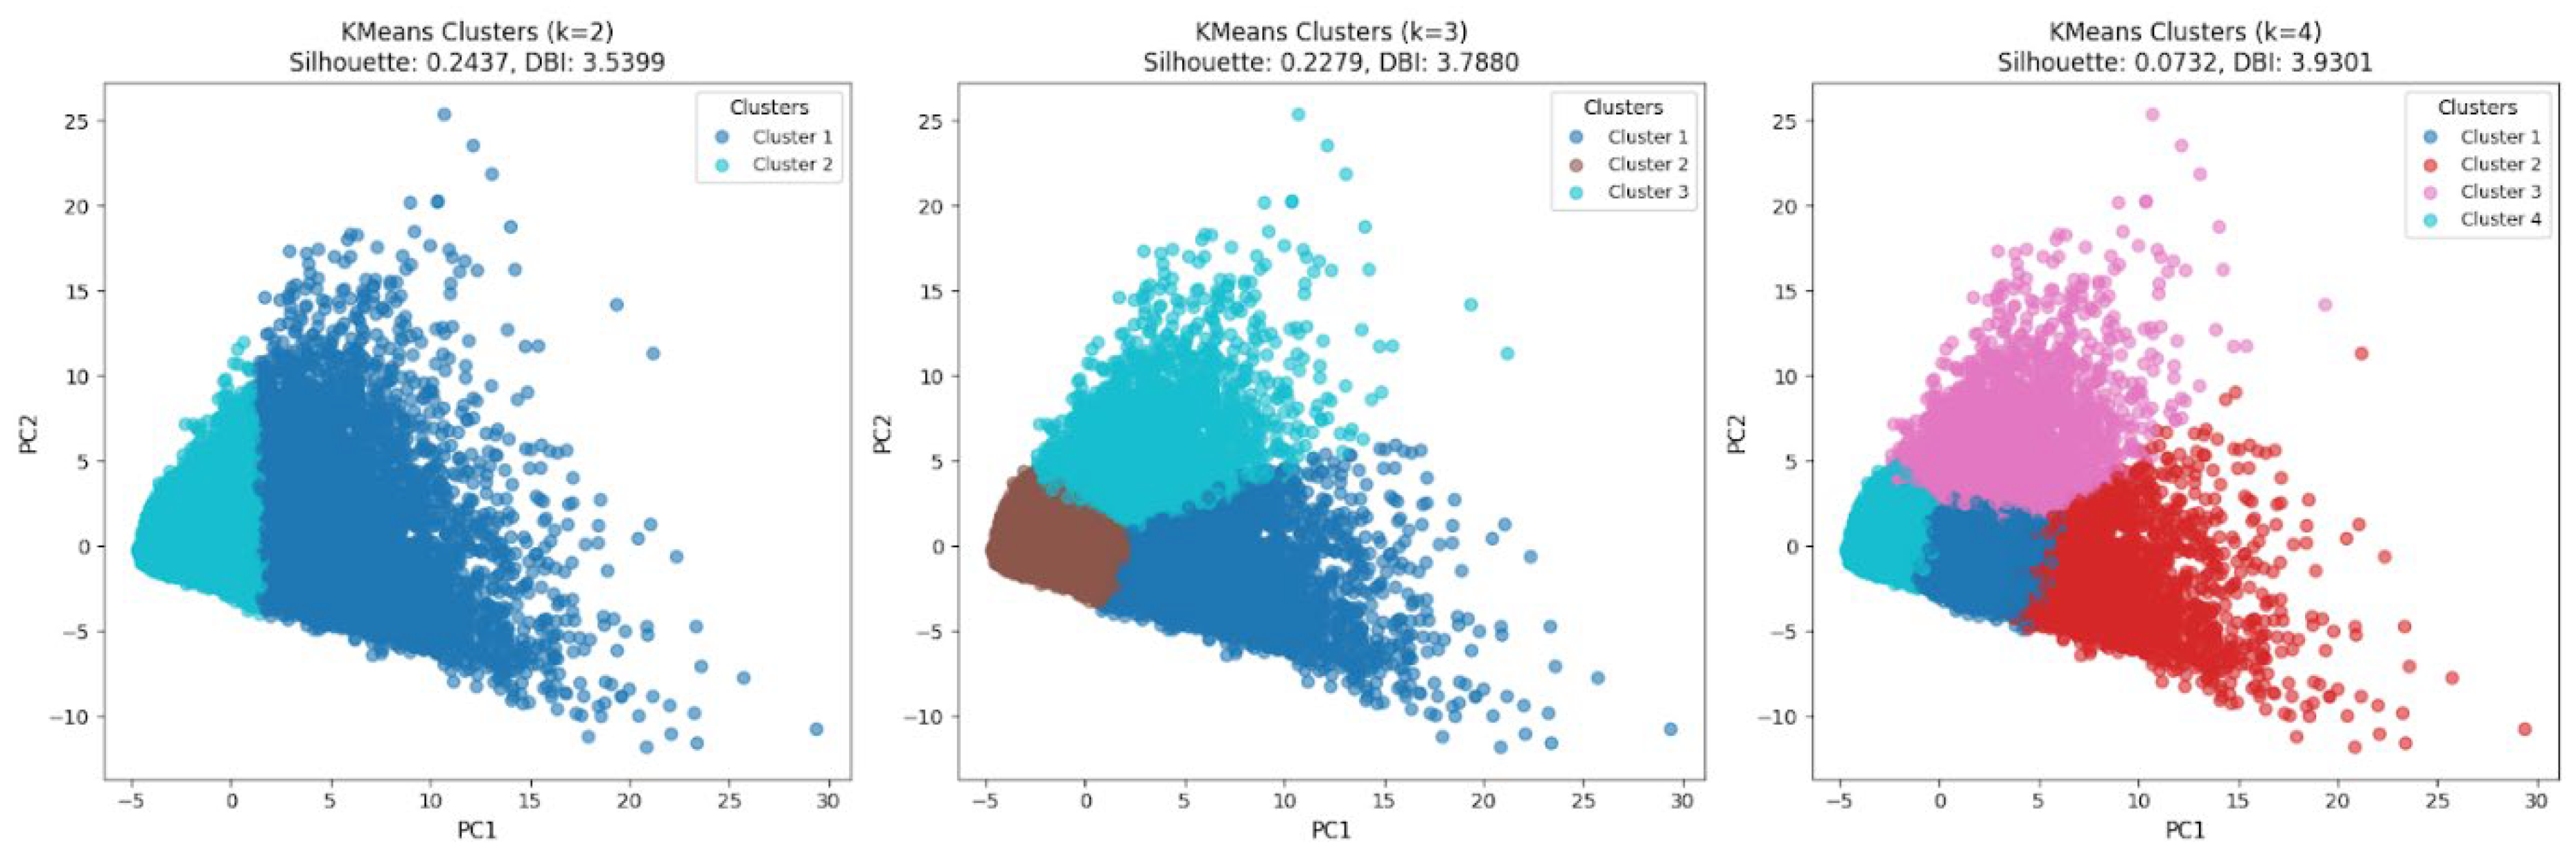
Figure 10.
Visualization of hierarchical clustering results with three clusters using the first two principal components (PC1 and PC2).
Figure 10.
Visualization of hierarchical clustering results with three clusters using the first two principal components (PC1 and PC2).
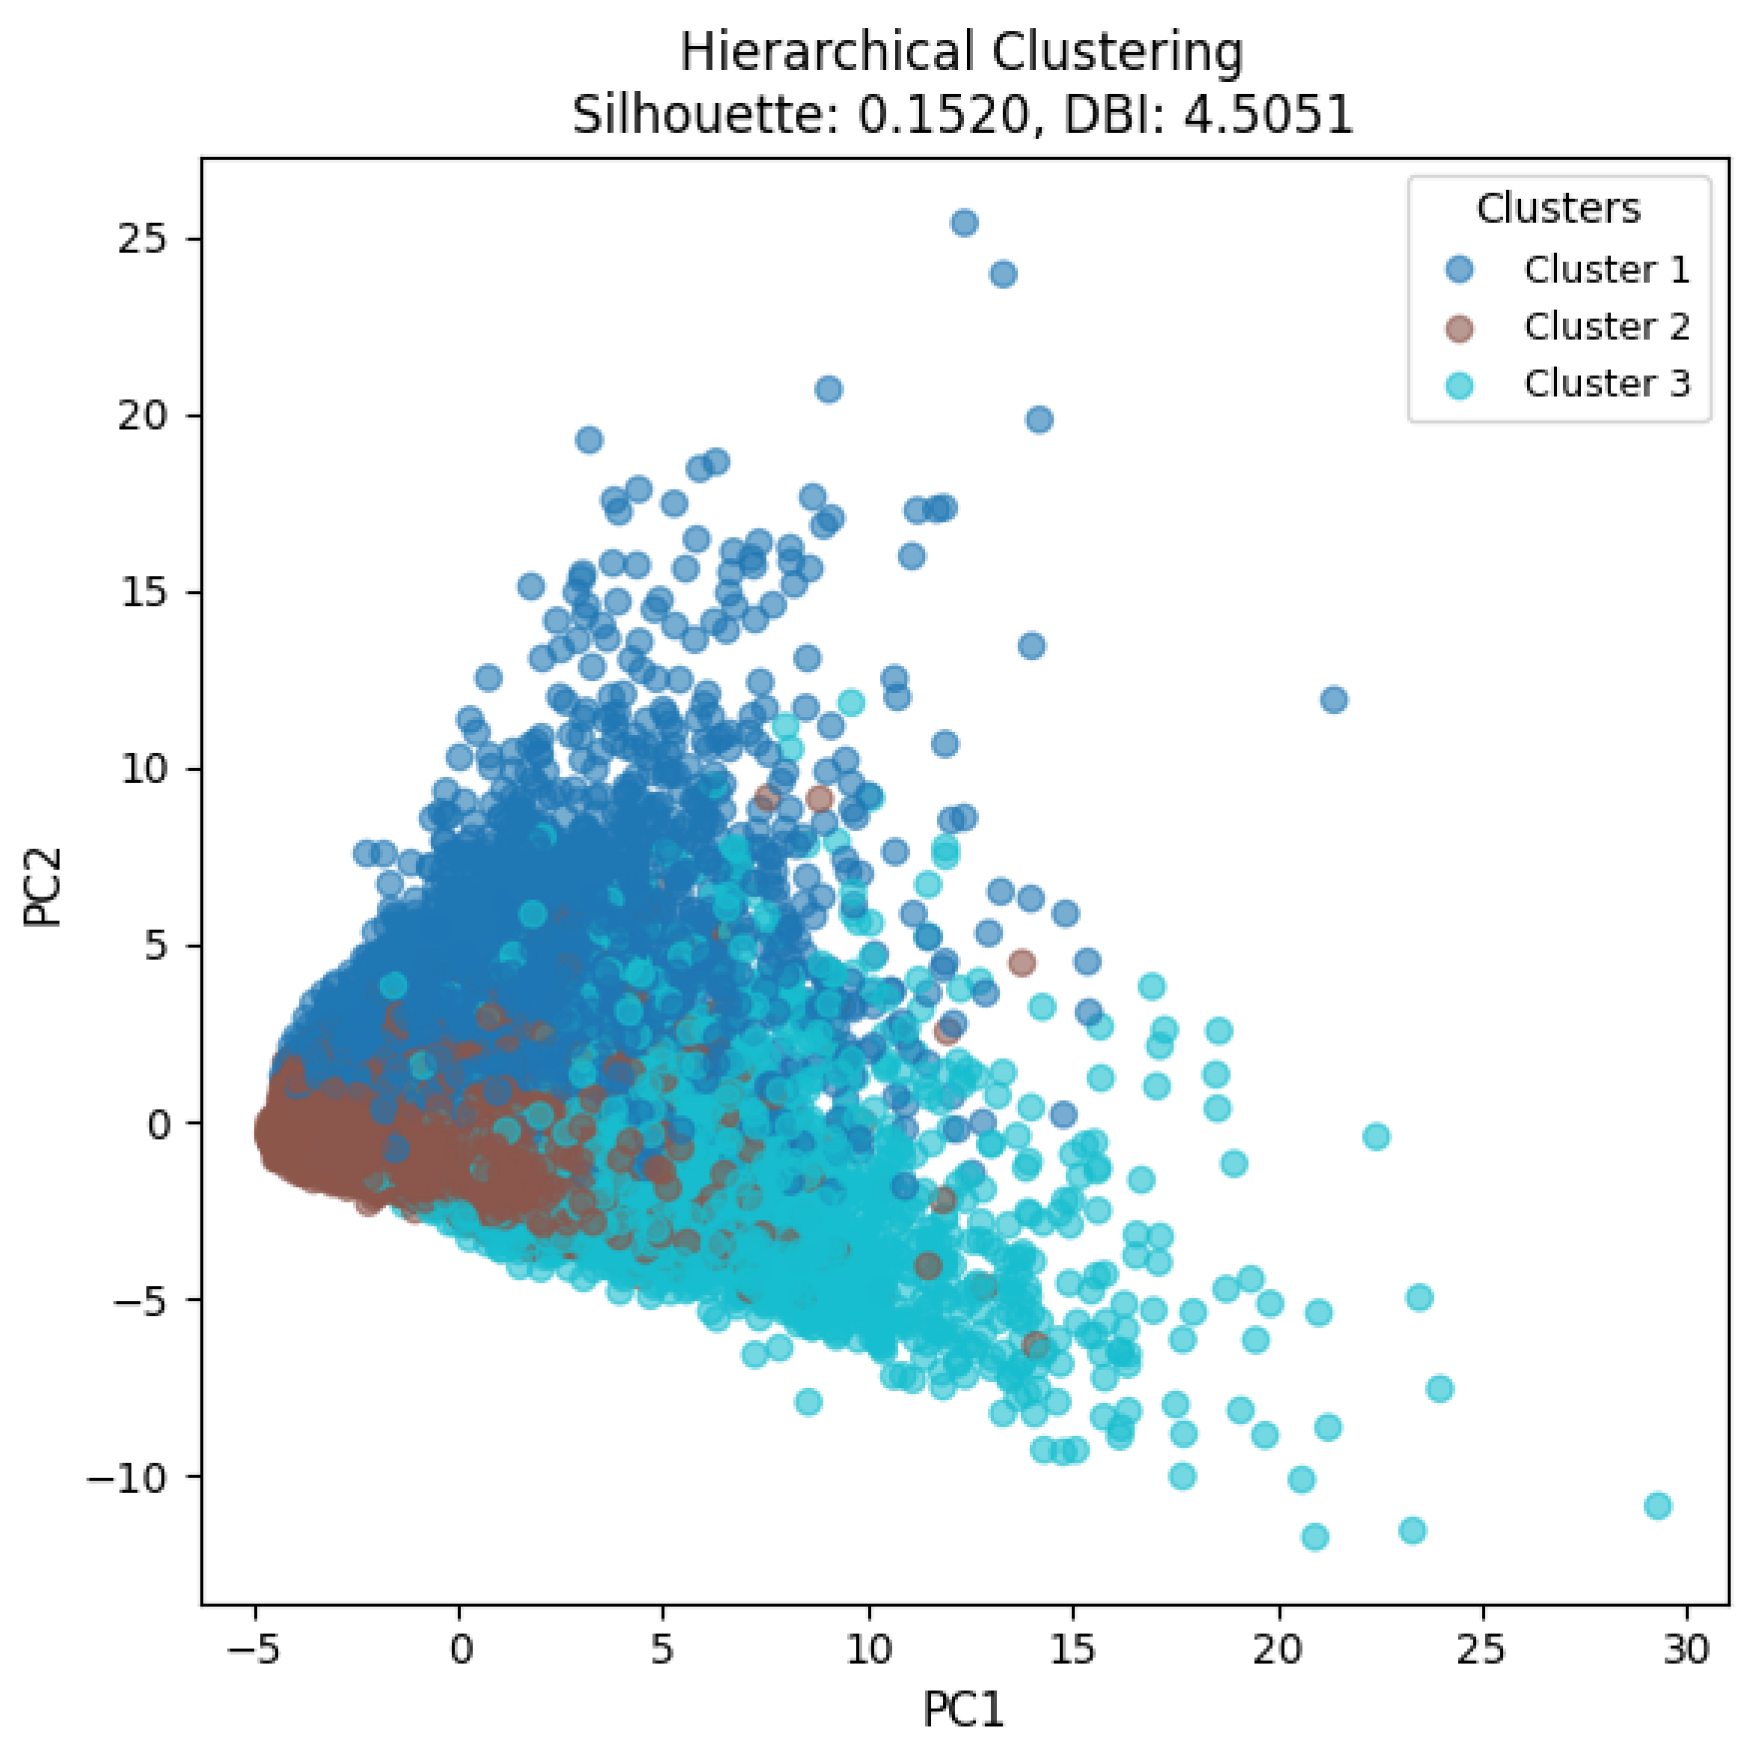
Figure 11.
Visualization of Self-Organizing Map clustering results with three clusters using the first two principal components (PC1 and PC2).
Figure 11.
Visualization of Self-Organizing Map clustering results with three clusters using the first two principal components (PC1 and PC2).
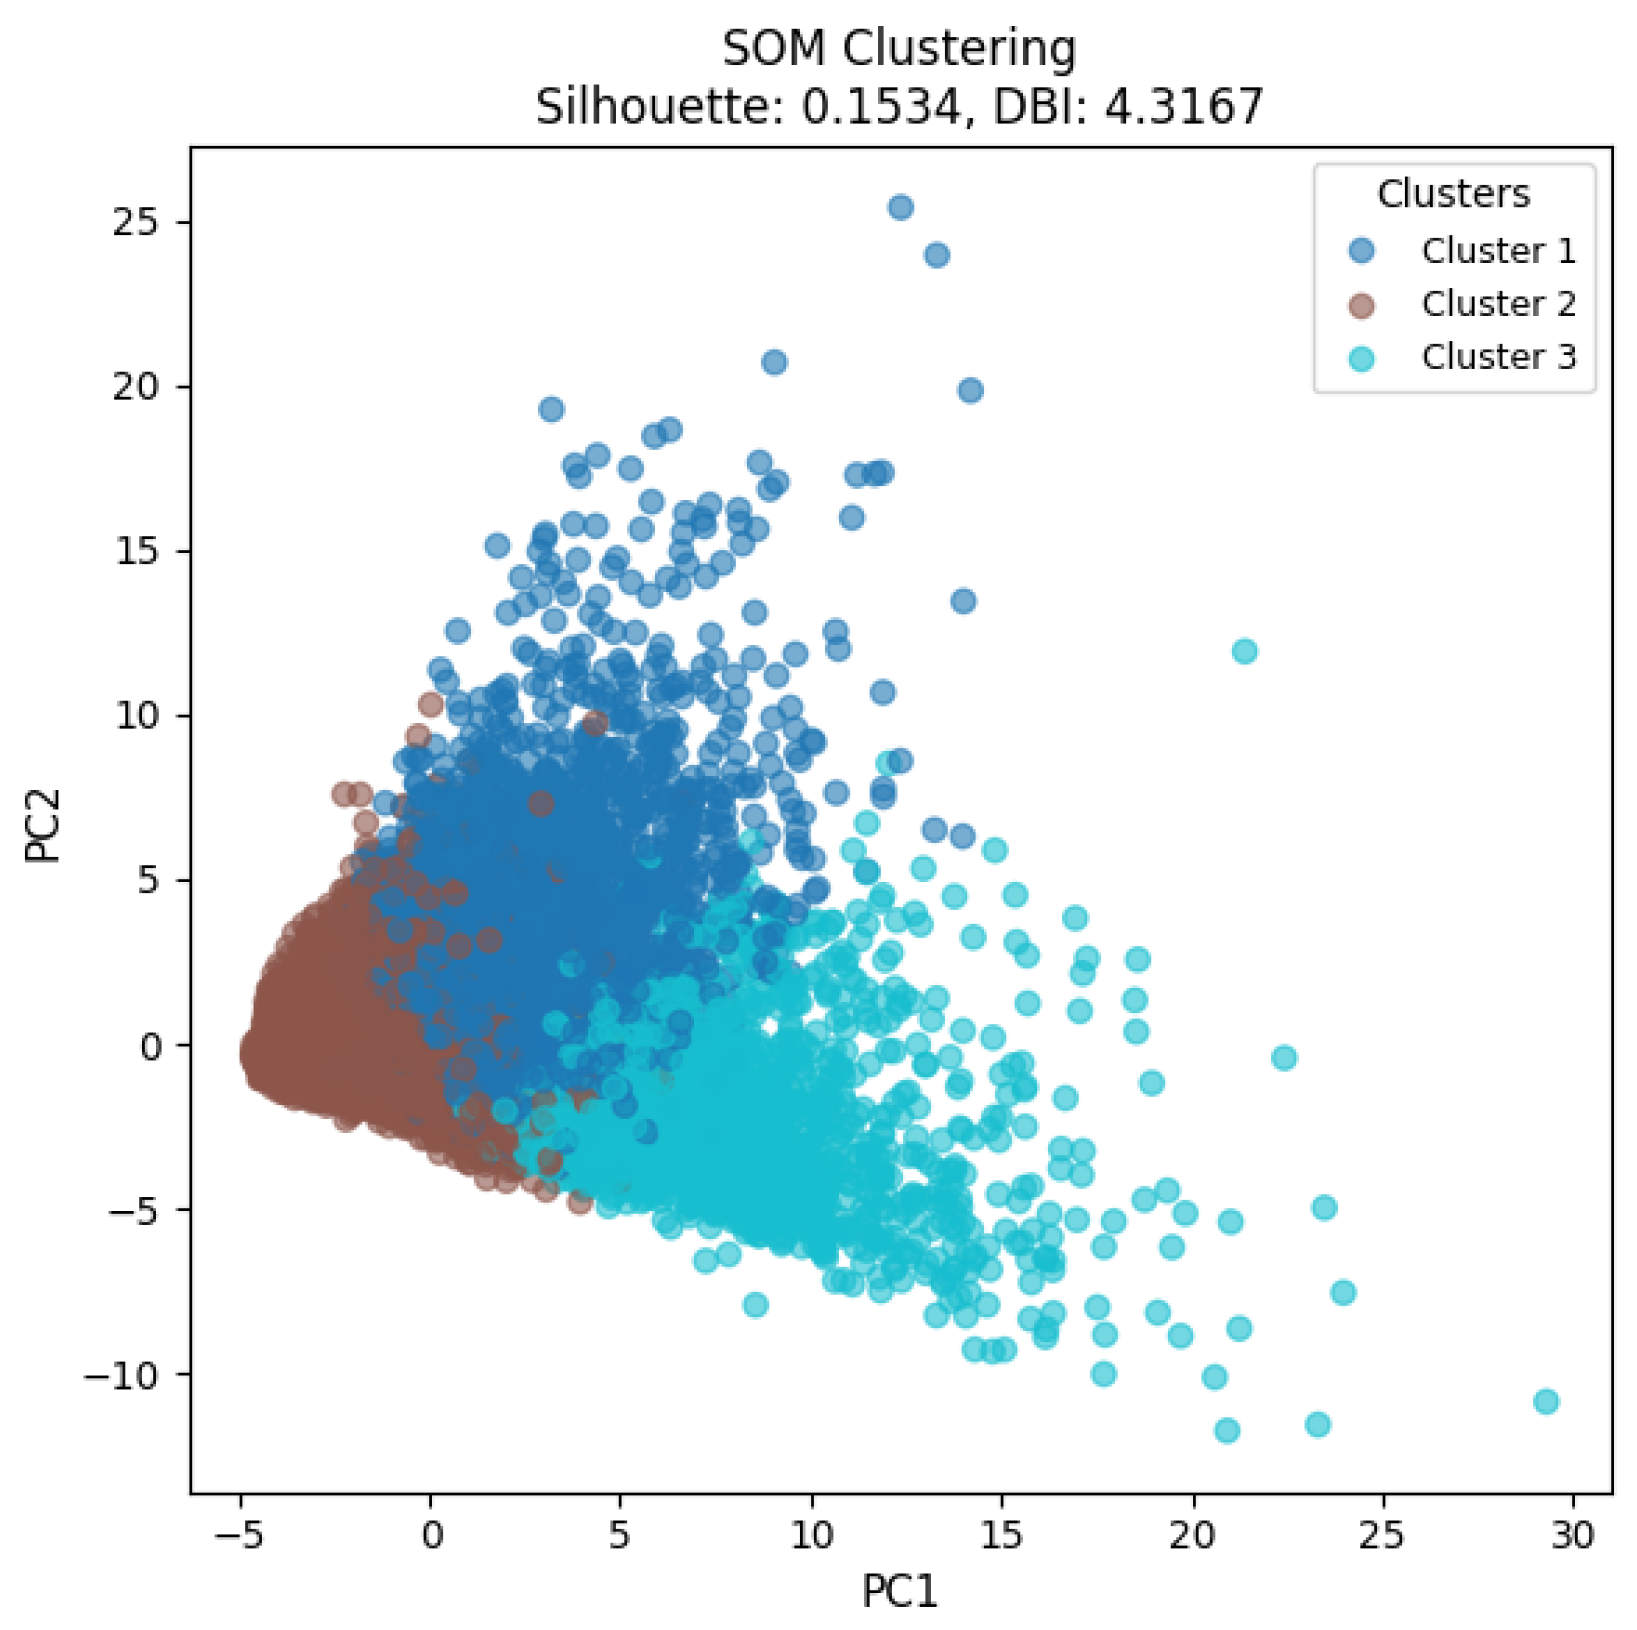
Figure 12.
K-means clustering results using the first two principal components (PC1 and PC2). Vertical and horizontal dashed lines represent the zero values of PC1 and PC2. The number of customers in each cluster is also displayed.
Figure 12.
K-means clustering results using the first two principal components (PC1 and PC2). Vertical and horizontal dashed lines represent the zero values of PC1 and PC2. The number of customers in each cluster is also displayed.
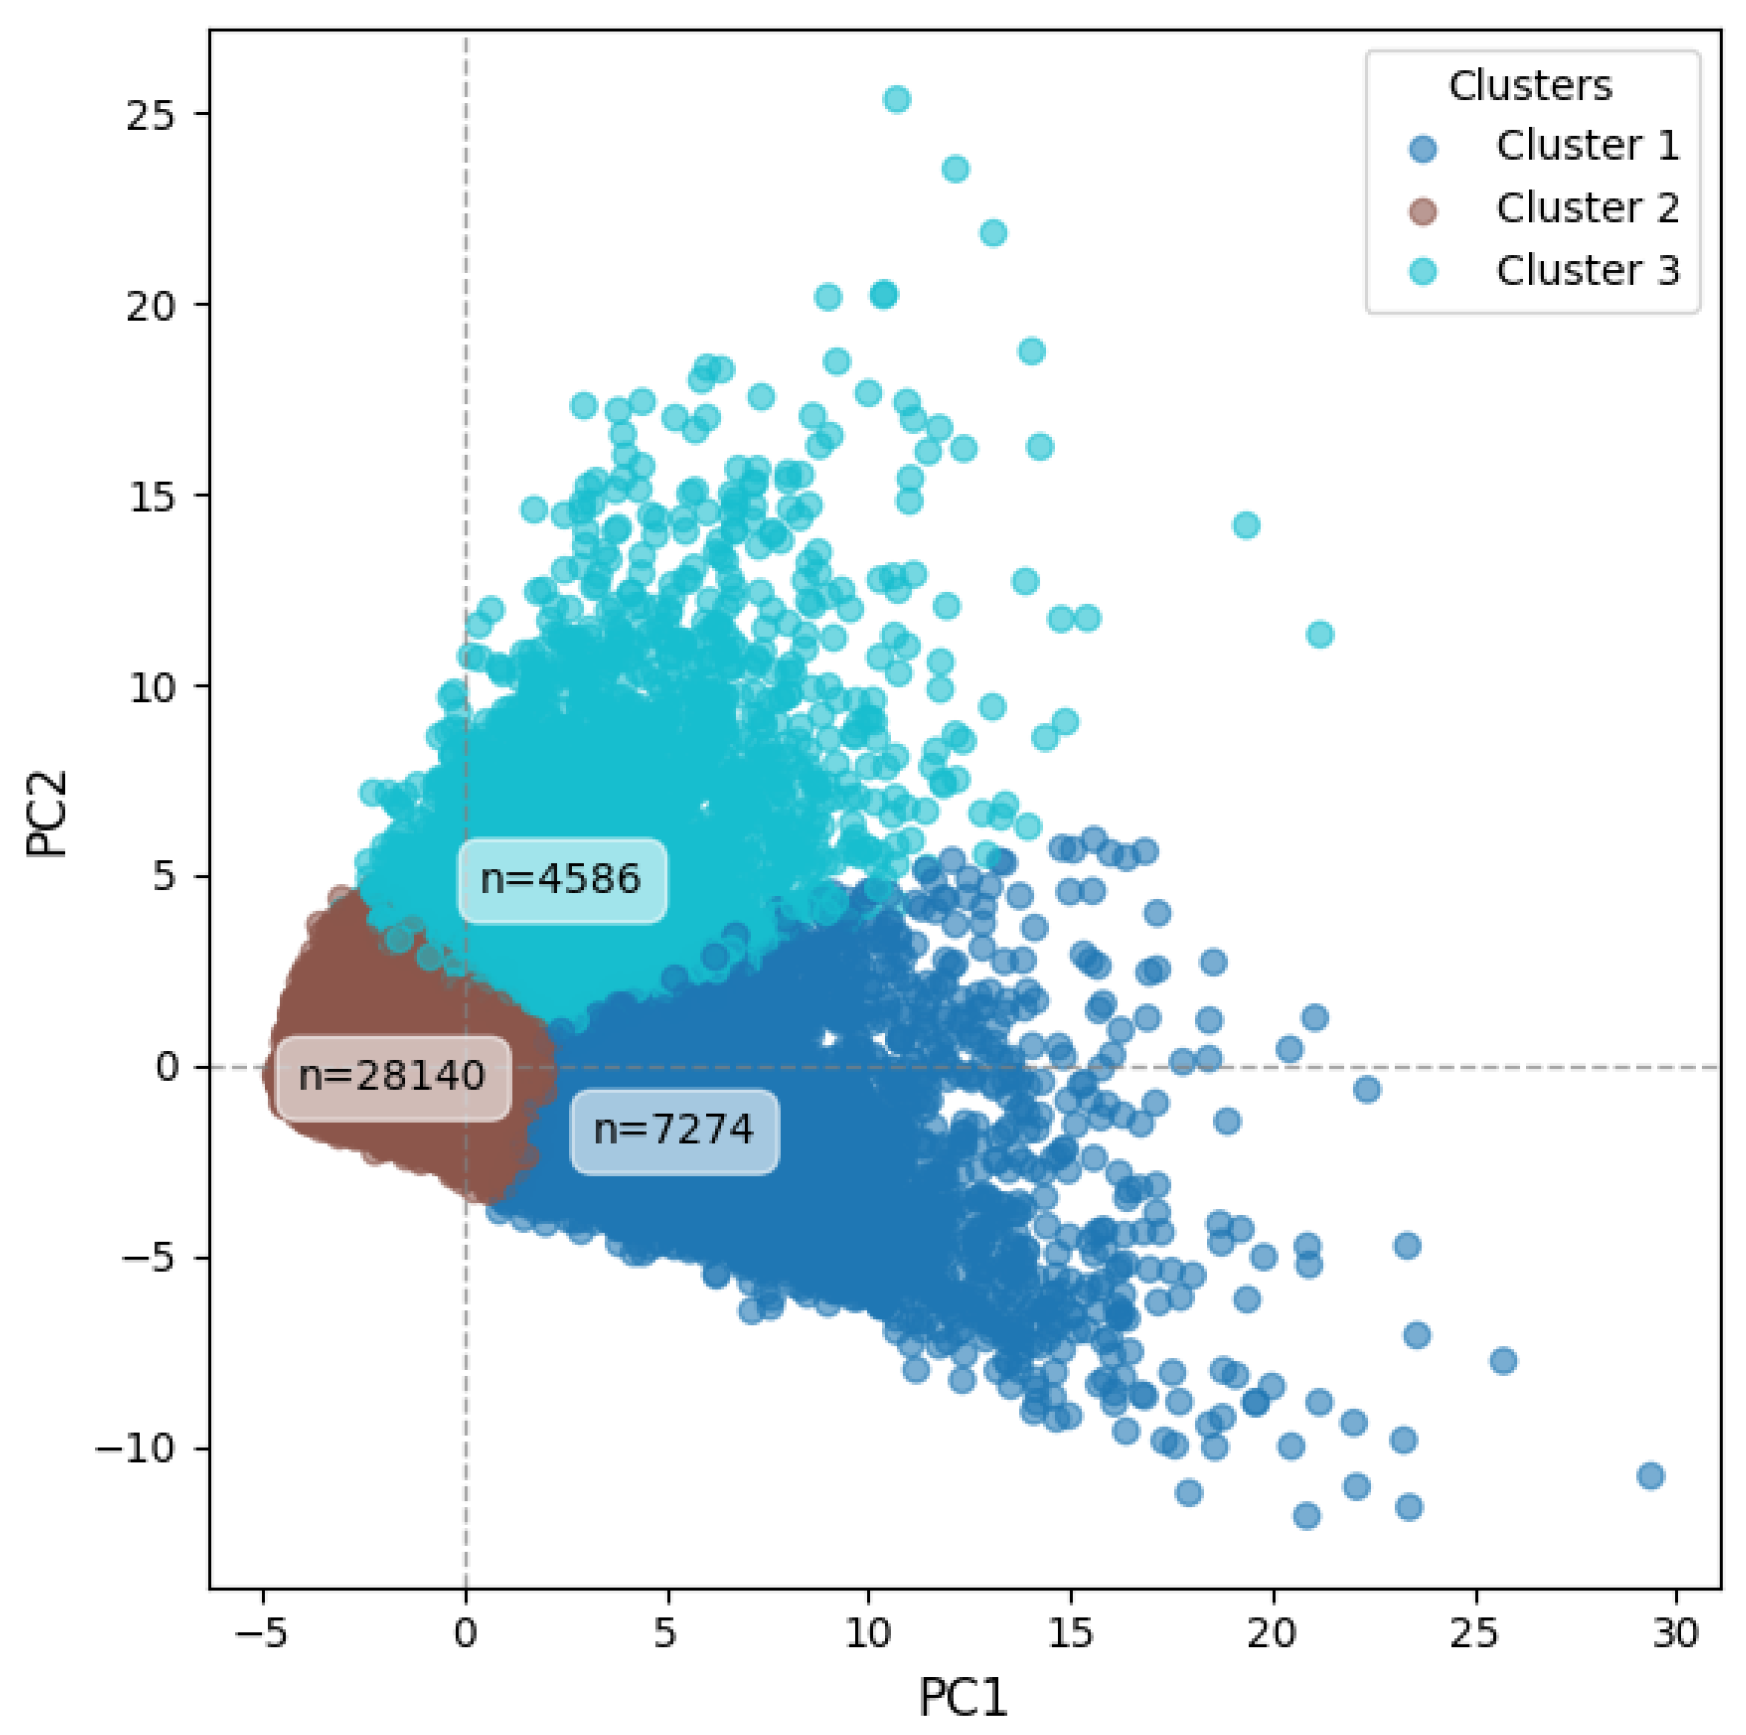
Figure 13.
Gender distribution by customer cluster.
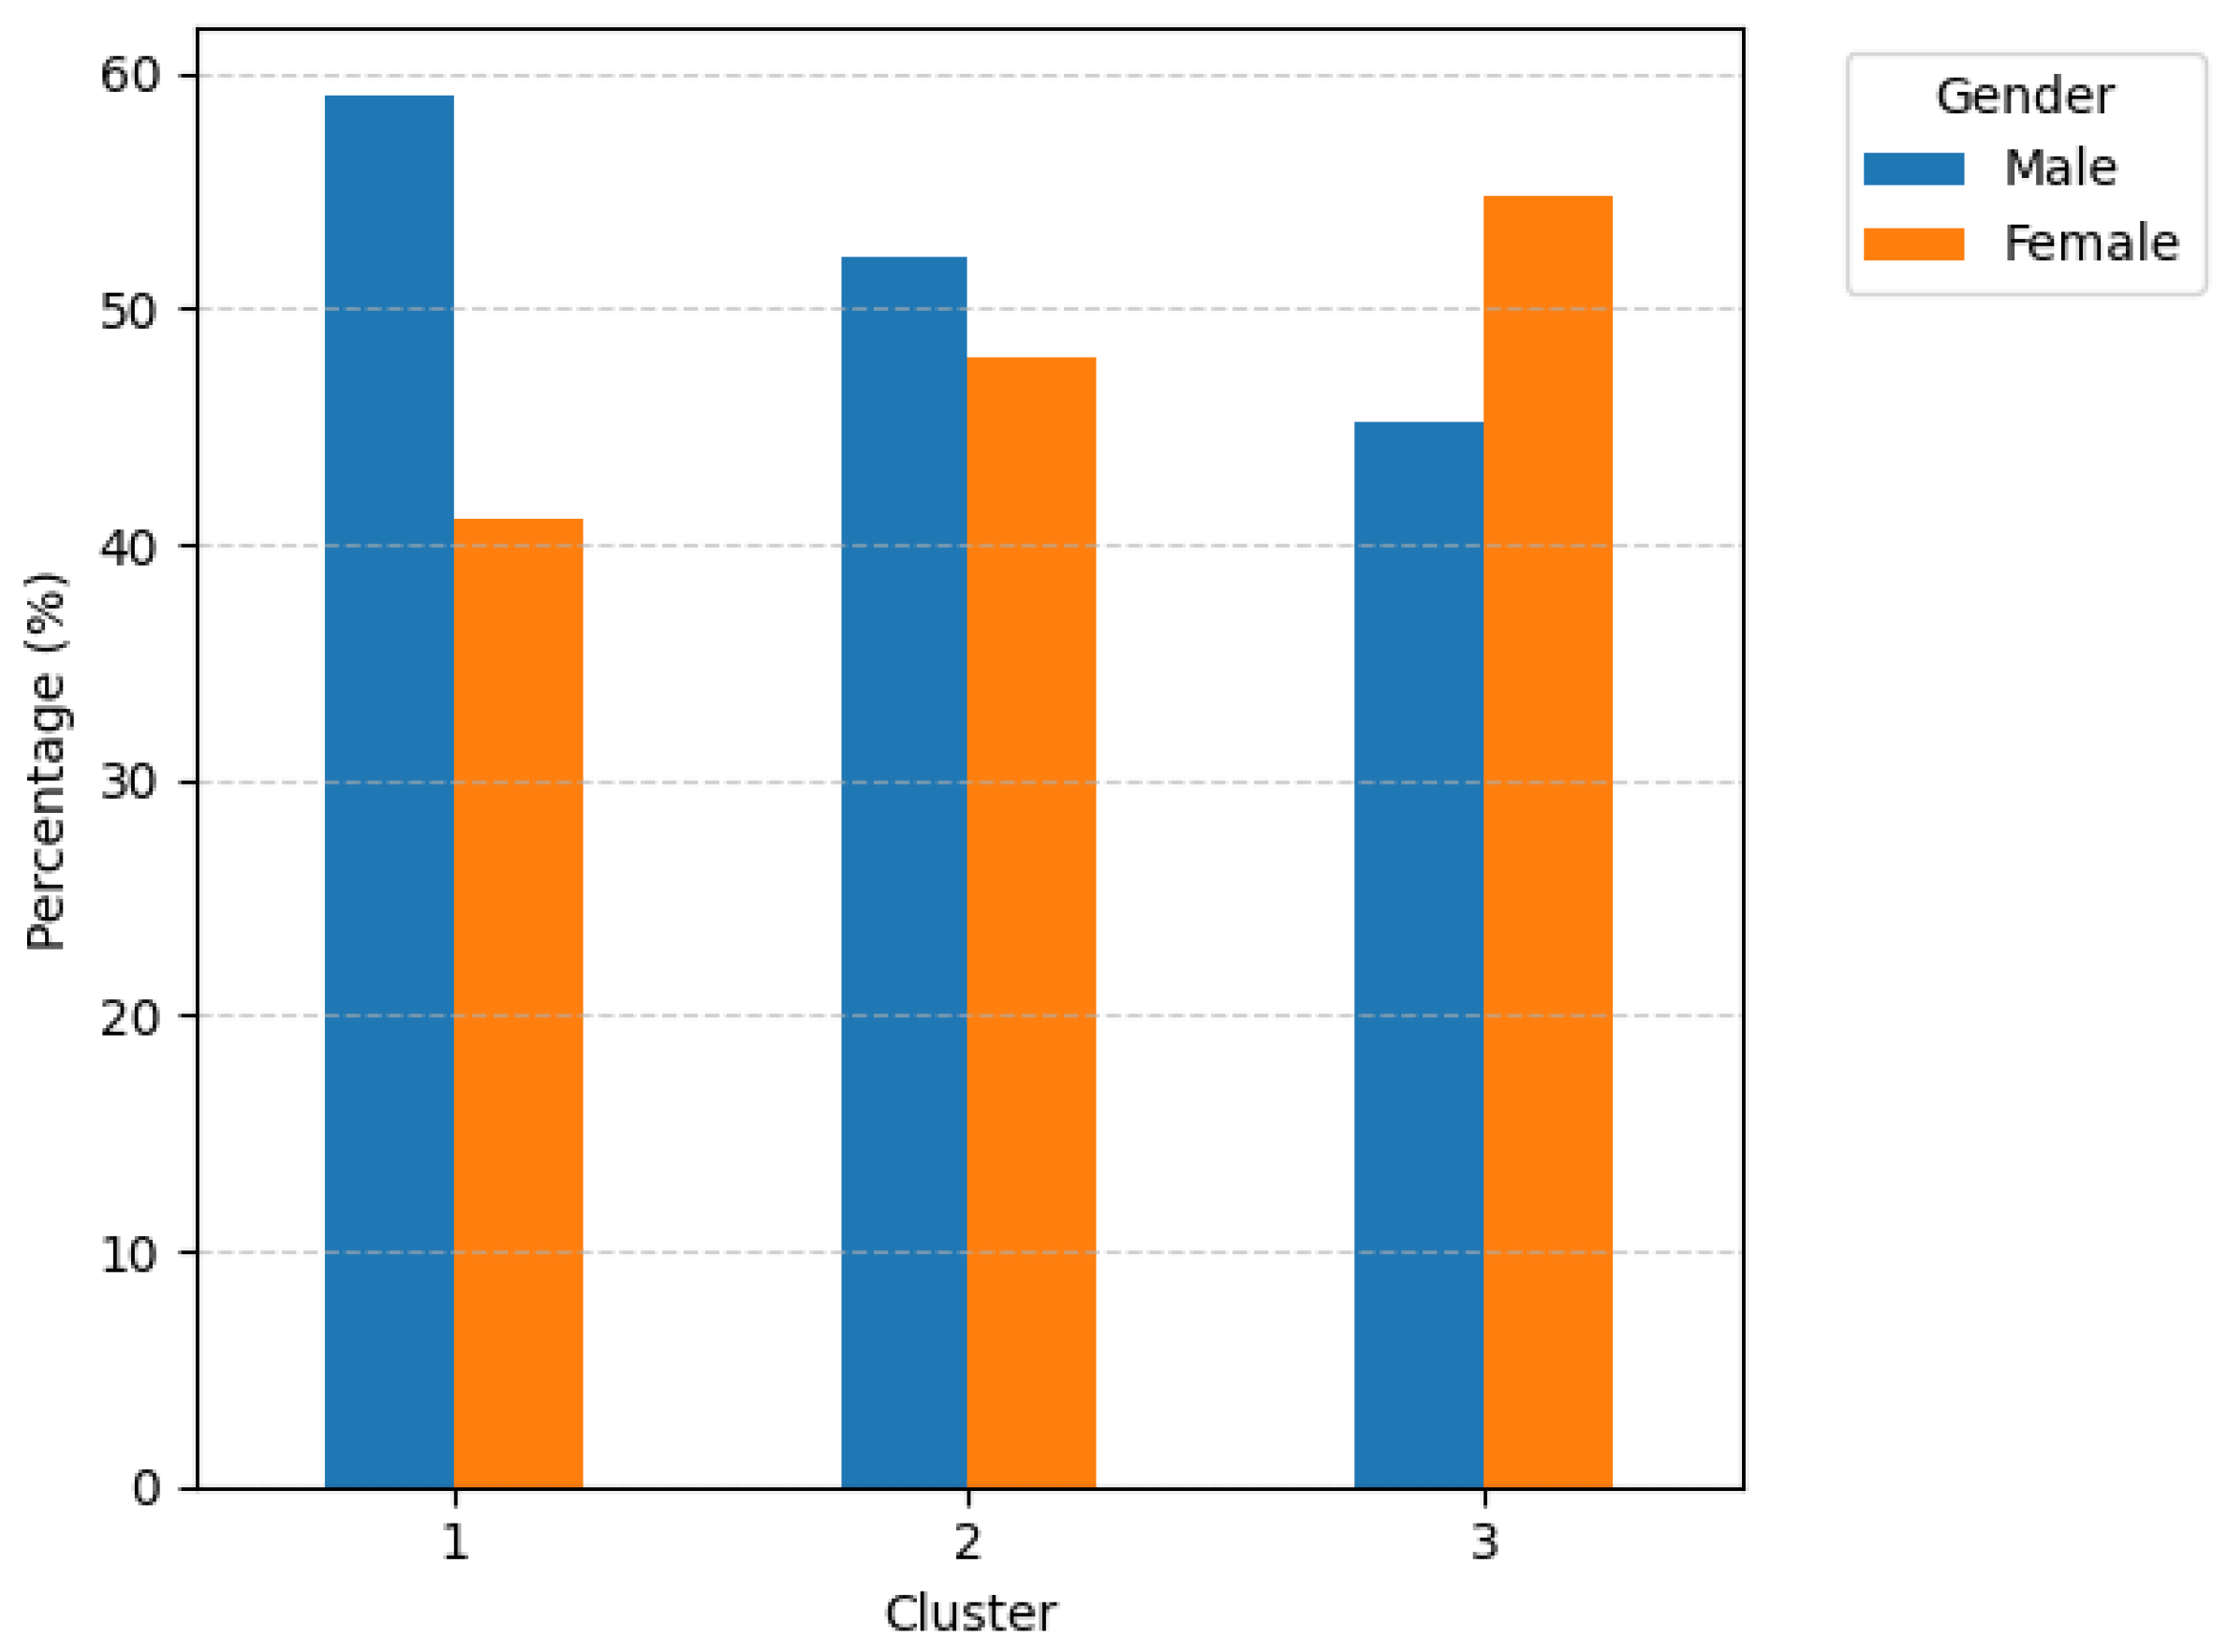
Figure 14.
Age group distribution by customer cluster.
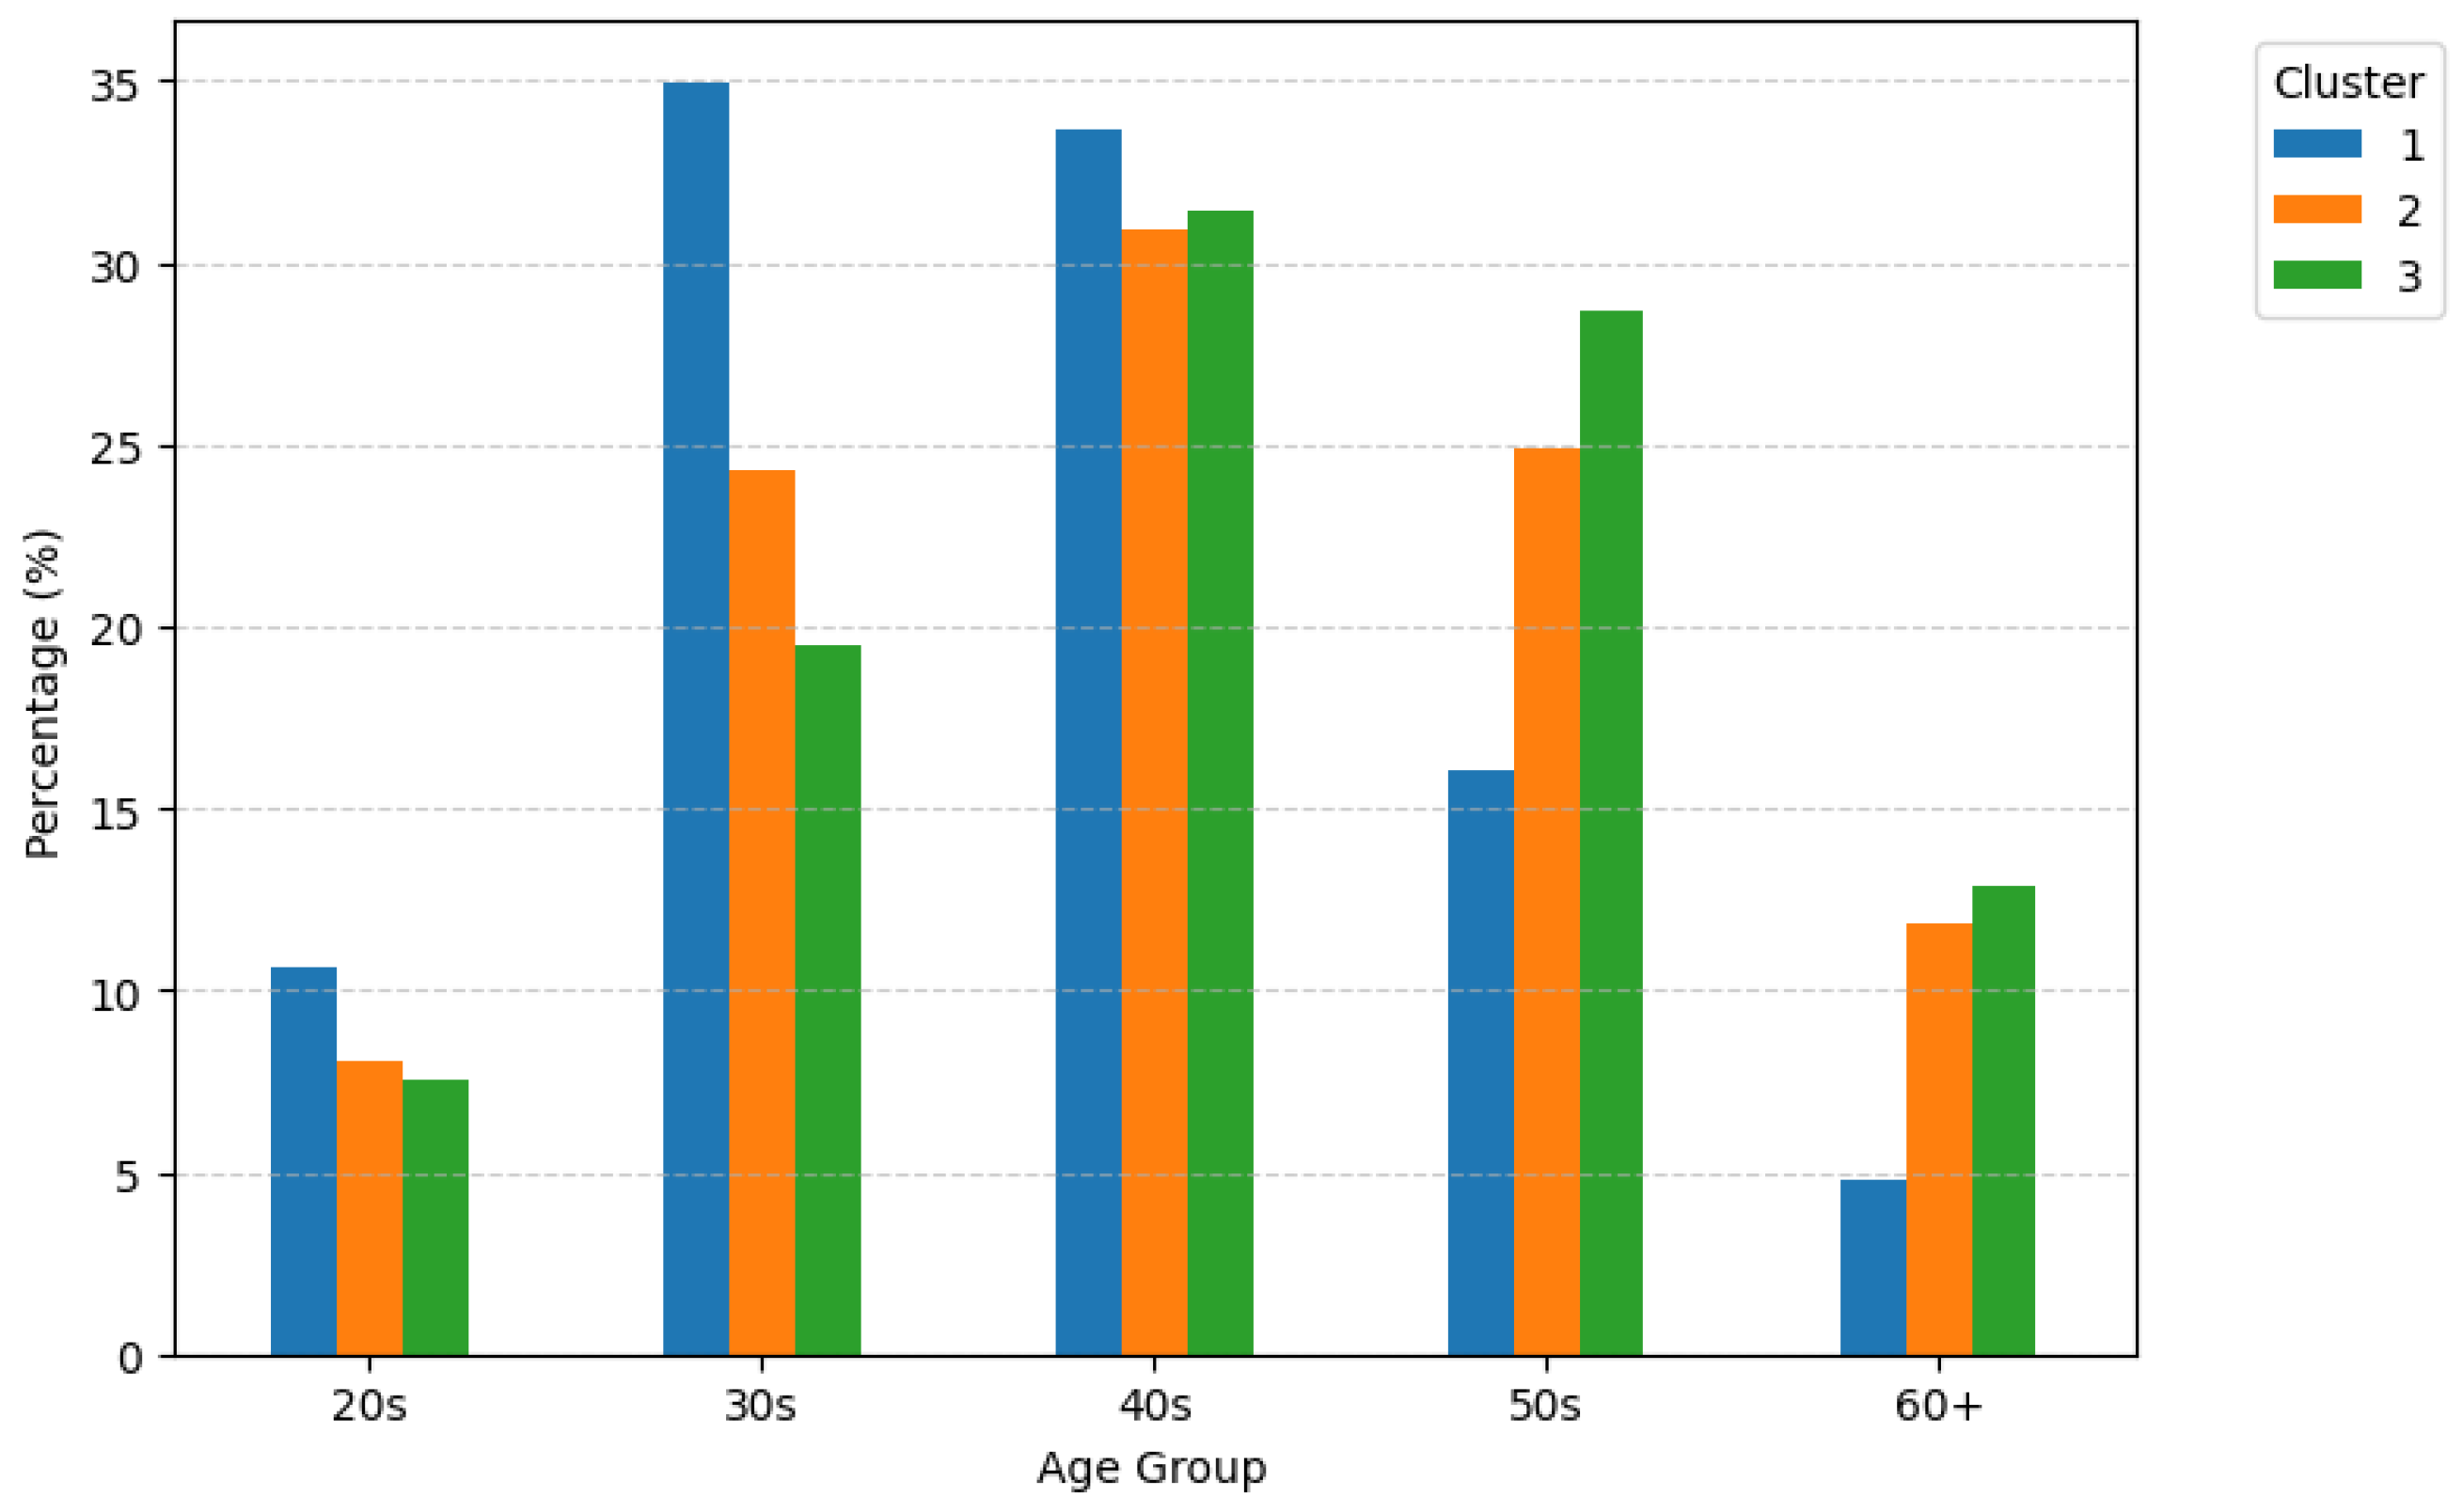
Figure 15.
Regional distribution by customer cluster.
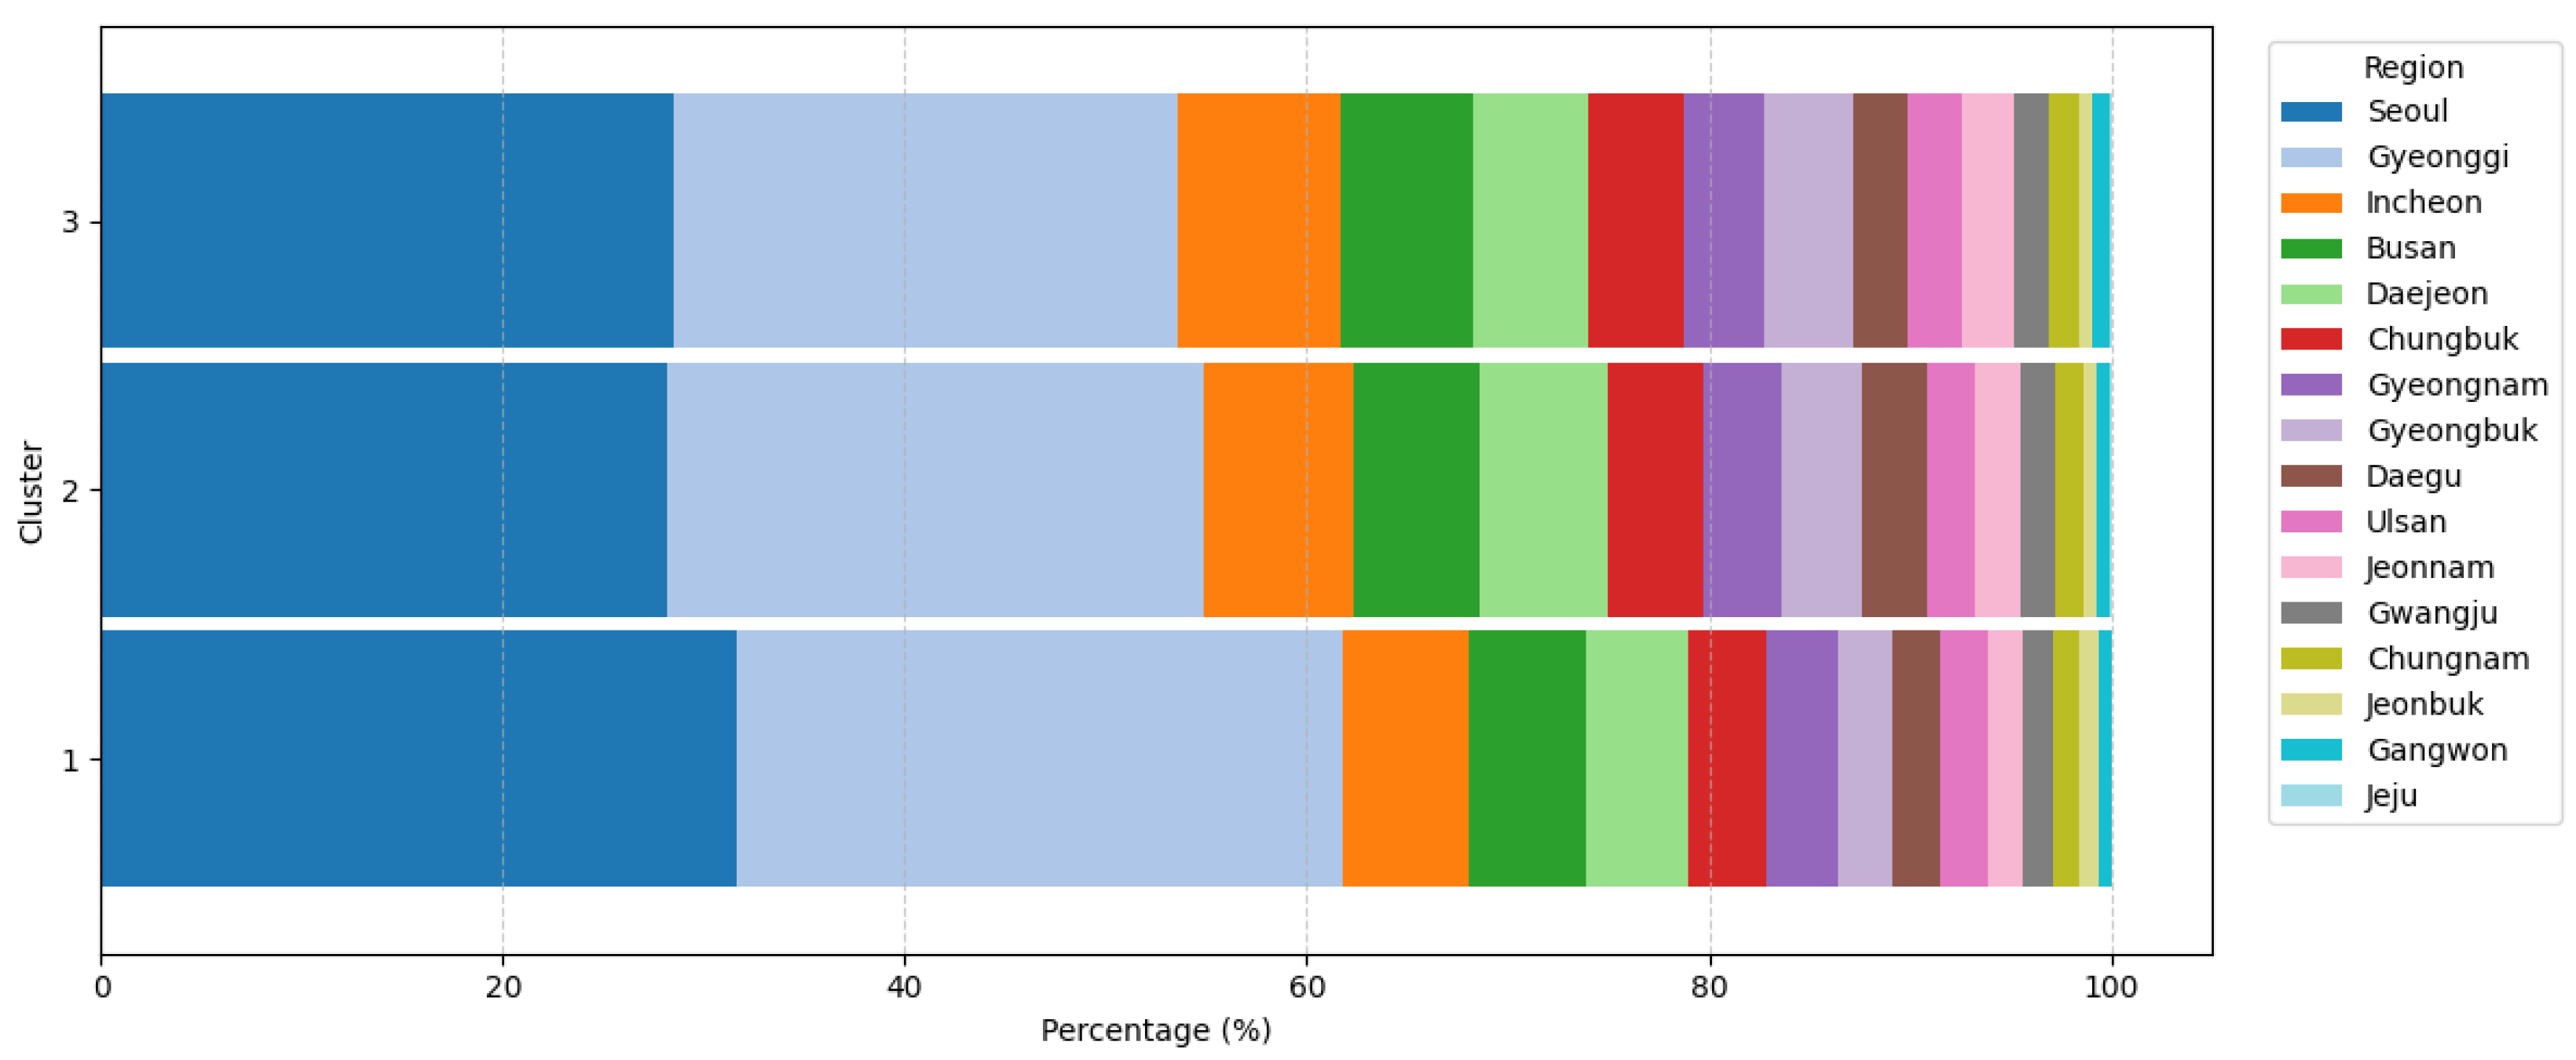
Figure 18.
Average delinquency count over the past six months by customer cluster.
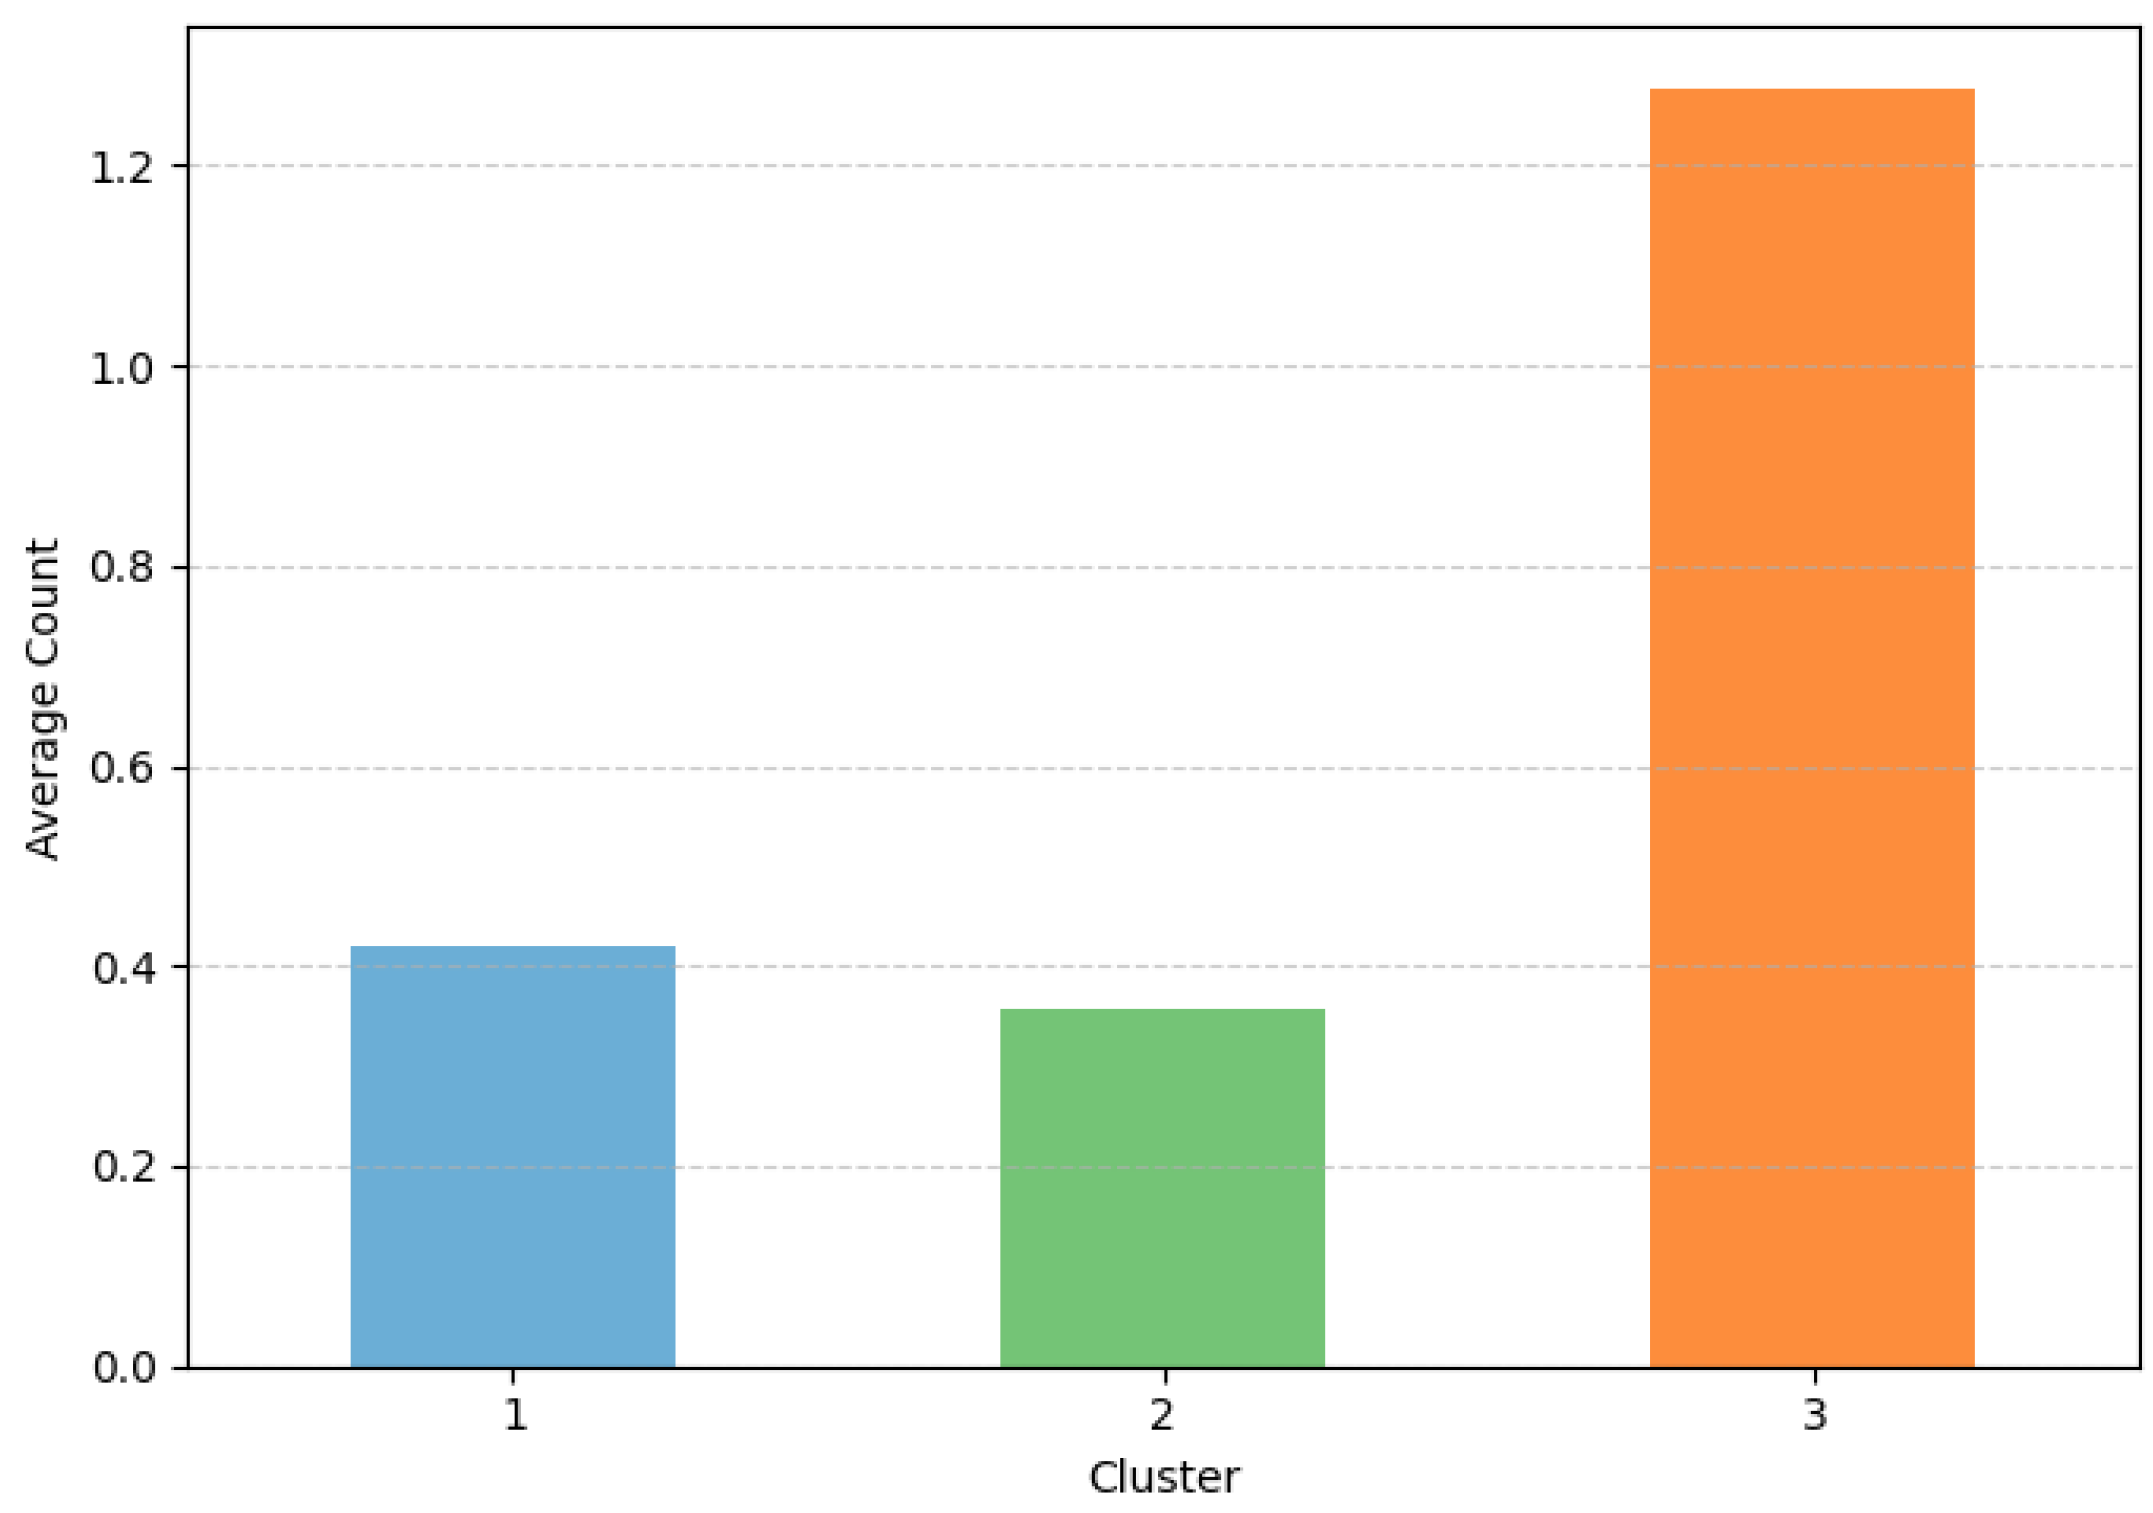

Table 1.
Summary of credit card customer segmentation studies.
| Author(s) and Year | Target Country | Clustering/Segmentation Methods |
|---|---|---|
| Martins and Cardoso (2012) [16] | Portugal | Traditional Agglomerative Segmentation Algorithm |
| Smeureanu et al. (2013) [3] | Romania | Neural Networks and Support Vector Machines |
| Butaru et al. (2016) [13] | United States | Decision Trees, Random Forests, and Regularized Logistic Regression |
| Yanık and Elmorsy (2019) [24] | Turkey | Self-Organizing Map and K-means |
| Umuhoza et al. (2020) [23] | Egypt | Unsupervised Machine Learning Techniques |
| Abdulhafedh (2021) [18] | Europe | K-means, Hierarchical Clustering, and Principal Component Analysis (PCA) |
| Ho et al. (2021) [20] | Taiwan | Sequence Analysis (Optimal Matching + Hierarchical Clustering) |
| Rachman et al. (2021) [25] | Indonesia | Mini Batch K-means |
| Dash and Mishra (2022) [19] | United States | K-means Clustering combined with Autoencoder and PCA |
Table 2.
Variable grouping of the Korean credit card customer dataset.
| Category | Variable Count | Descriptions |
|---|---|---|
| Demographics | 12 | Gender, age, region, membership tenure, household type, occupation, membership grade |
| Transactions & Spending | 335 | Transaction amounts and counts (monthly, quarterly, yearly), merchant category spending (shopping, transportation, leisure), installment usage, recency/duration of card usage |
| Credit & Risk | 110 | Credit limits, delinquency records, cash advance (CA) and card loan usage, interest rates, revolving credit, approval/denial indicators |
| Marketing | 9 | Channel preferences and responses: telemarketing (TM), direct mail (DM), SMS, email, opt-in/opt-out indicators |
| Membership & Card Attributes | 53 | Card ownership (credit, check, family, overseas), card issuance/validity/expiration, annual fees/waivers, attrition history, membership-related features |
|
Billing & Payment |
77 | Billing amounts, billing address/method, repayment schedules, prepayments, recurring payments (utilities, insurance, rental), billing history |
|
Points & Mileage |
34 | Reward points, mileage balances, discount amounts, benefit-related features |
| Metadata | 2 | Record identifiers, reference period |
| Total | 565 |
Table 3.
Top five loading variables for the first three principal components.
| Principal Component |
Variables | Loading Value |
|---|---|---|
| PC1 | Retail Spending (General Merchants) | 0.208 |
| Regular Principal Repayment before 2 Months | 0.201 | |
| Spending in Primary Transportation | 0.198 | |
| Retail Spending (Mart) | 0.193 | |
| Benefit Amount Received for 3 Months | 0.190 | |
| PC2 | Installment Duration with Interest for 12 Months | 0.236 |
| Installment Amount for 12 Months | 0.227 | |
| Installment Amount with Interest for 6 Months | 0.226 | |
| Last Usage Date of Card Loan | 0.224 | |
| Cash Advance Usage Duration for 12 Months | 0.222 | |
| PC3 | Membership Tenure (Credit) | 0.333 |
| Recurring Payment Amount for This Month | -0.229 | |
| Initial Credit Limit | 0.216 | |
| Spending in Secondary Payment Industry | -0.209 | |
| Lump-Sum Loan Limit | 0.202 |
Table 4.
K-means clustering results with candidate cluster numbers (k=2,3,4).
| k | Silhouette Score | Davies-Bouldin Index |
|---|---|---|
| 2 | 0.2437 | 3.5399 |
| 3 | 0.2279 | 3.7880 |
| 4 | 0.0732 | 3.9301 |
Table 5.
Comparison of clustering results across methods with three clusters.
| Method | Silhouette Score | Davies–Bouldin Index |
|---|---|---|
| K-means | 0.2279 | 3.7880 |
| Hierarchical | 0.1520 | 4.5051 |
| Self-Organizing Map | 0.1534 | 4.3167 |
Disclaimer/Publisher’s Note: The statements, opinions and data contained in all publications are solely those of the individual author(s) and contributor(s) and not of MDPI and/or the editor(s). MDPI and/or the editor(s) disclaim responsibility for any injury to people or property resulting from any ideas, methods, instructions or products referred to in the content. |
© 2025 by the authors. Licensee MDPI, Basel, Switzerland. This article is an open access article distributed under the terms and conditions of the Creative Commons Attribution (CC BY) license (http://creativecommons.org/licenses/by/4.0/).
Copyright: This open access article is published under a Creative Commons CC BY 4.0 license, which permit the free download, distribution, and reuse, provided that the author and preprint are cited in any reuse.


