
Submitted:
29 January 2026
Posted:
30 January 2026
You are already at the latest version
Abstract
This study compares the acid dyeing of Polyamide 6 (PA6) fabric using conventional heating and microwave-assisted techniques and examines reaction parameters (temperature, time, pH, dye concentration) on conventional and microwave system. C.I. Acid Blue 324 was used to explore the effects of critical process parameters, including pH, temperature, dyeing time, and dye concentration, on color strength (K/S). Conventional and Microwave Dyeing showed an inverse correlation between pH and K/S, with optimal color yield achieved at pH 3.0. Dye uptake was enhanced by increasing temperature, with maximum K/S obtained at 95°C for 30 minutes and the highest dye concentration (1.50 %). In contrast, the microwave-assisted dyeing methodology (160 W) drastically accelerated the process. Optimal conditions for microwave dyeing also favored an acidic media (pH 3.0) and showed a strong positive correlation between microwave exposure time and K/S. The microwave-assisted technique is confirmed as a rapid, energy-efficient, green process and effective alternative for dyeing PA6, offering significant potential for reduced processing time.
Keywords:
polyamide
; microwave dyeing
; acid dyes
; conventional dyeing
; parameter optimization
; sustainable textile process
1. Introduction
Nylon is one the of the most important synthetic fibers in textile industry which is usually dyed with acid and metal complex dye. Nylon is well known for its durability, low weight, greater tensile strength, and damage resistance properties. Nylon has the advantage over cotton fiber in achieving higher color strength with the same percentage of shade. Polyamide fibers, particularly nylon 6 and nylon 6.6, represent a cornerstone of the contemporary textile industry. Their widespread application, ranging from high-performance apparel to advanced technical textiles, stems from their exceptional physiomechanical properties, including superior tensile strength, elasticity, and remarkable abrasion resistance [1,2,3]. Due to their outstanding mechanical properties, polyamide fibers are used in the manufacture of clothing, technical textiles and reinforcement of textile composites. Polyamide fibers have a very smooth surface with a low surface area energy. The coloration of these versatile materials is predominantly achieved through the use of acid dyes, which form robust ionic interactions with the protonated amino groups inherent in the polyamide fiber structure. This interaction ensures excellent dye affinity, colorfastness, and the production of vibrant, durable shades [4,5,6,7].
The textile sector is the largest consumer of dyes, using them to color fabrics and garments. Textile dyeing is one of the most significant applications of dyes. There are different types of dyes used in textile industries including direct dyes, reactive dyes, disperse dyes, acid dyes and basic dyes. Acid dyes are used for protein fibers like wool, silk, and nylon. They are effective in dyeing these fibers under acidic conditions. Acid dyes, on the other hand, are often used for protein fibers like wool and silk due to their ability to form ionic interactions [8,9,10].
Acid dyes are a class of anionic, water-soluble dyes that are primarily applied to fibers containing cationic or protonated functional groups, such as amino (–NH2) groups. They typically contain sulfonic (–SO3−) or carboxylic (–COO−) acid groups, which provide water solubility and enable ionic interactions with fibers. Acid dyes typically contain sulfonic (–SO3−) or carboxylic (–COO−) acid groups, which provide water solubility and enable ionic interactions with fibers [11,12,13,14].
They are widely used for dyeing protein fibers (e.g., wool, silk), polyamide fibers (nylon), and to a lesser extent modified acrylics. Acid dyes represent the most commonly used class of dyes for polyamide fiber dyeing due to their excellent affinity and color fastness properties. The dyeing mechanism involves ionic interactions between the sulfonic acid groups of the dye molecules and the amino groups present in the polyamide fiber structure. The dyeing process is typically conducted under acidic conditions (pH 4-6) to protonate the amino groups in the fiber, thereby enhancing the electrostatic attraction between the dye and fiber [15,16,17]
Microwave treatment is an environmentally friendly and time-efficient conditions and the more energy- efficient phenomenon. Microwave radiation is presented as a substitute for conventional heating methods since it offers even, rapid and efficient heating by aiding all particles to heat up simultaneously. In response to the growing demand for sustainable and efficient manufacturing paradigms, microwave-assisted dyeing has emerged as a revolutionary alternative technology. Microwave radiation, in addition, assists several chemical reactions like synchronization and synthesis of organic compounds and polymers [18,19,20,21,22,23,24,25,26].
Microwave irradiation is one of powerful techniques of non-contact heating, because the dielectric substances with large dielectric loss constant vigorously fever by vibration and rotation of permanent dipoles in microwave field. The main difference between conventional heating microwave heating is the way in which heat is generated. In conventional processing, energy is transferred to material through convection, conduction and radiation of heat from the surface of the material. In contrast, microwave energy is derived directly from materials through molecular interactions with the electromagnetic waves. The uniqueness of the microwave is to process materials with selective energy, higher rate, uniform heating and energy conservation [27,28,29,30,31,32,33,34,35,36,37].
Microwave treatment improves the fabric’s uptake ability and coloring characteristics. Microwave irradiation is part of the recent most simple, lower cost and valued technologies in textile dyeing. The fundamental principle underpinning microwave heating is dielectric heating, whereby electromagnetic radiation, commonly at a frequency of 2.45 GHz, induces rapid molecular vibration and rotation of polar molecules, predominantly water, within the dyebath. This unique mechanism results in rapid, uniform, and volumetric heating throughout the entire dyeing system, a stark contrast to the slower, less uniform, and surface-to-core heat transfer characteristic of conventional heating methods. This internal generation of heat promises to dramatically curtail processing times, reduce energy consumption, and increase dye diffusion and fixation within the textile substrate [38,39,40].
Recent scholarly investigations have increasingly underscored the transformative potential of microwave technology across diverse textile applications. Studies have consistently shown that Microwave-assisted dyeing can achieve comparable or even superior color strength and fastness properties in a significantly reduced timeframe (e.g., from 30-60 minutes to 5-10 minutes) compared to conventional methods. This efficiency gain is crucial for the textile industry, which is under increasing pressure to reduce its environmental footprint, particularly in terms of water and energy consumption. [41,42,43,44,45,46,47].
Microwave-assisted dyeing is hypothesized to achieve comparable or superior color strength to conventional methods in a significantly reduced timeframe. This study is designed to conduct a detailed comparative analysis of both conventional and microwave-assisted dyeing techniques for polyamide 6 fabric utilizing a model acid dye (Telon Blue M-2R). The research will systematically investigate the effects of key process parameters specifically temperature, dye concentration, dyeing time, and pH on the dyeing mechanism, ultimate dye uptake, and final color strength. This study aims to systematically furnish a robust scientific foundation that will facilitate the development of more efficient, economically viable dyeing protocols for polyamide textiles [48,49,50,51,52,53,54,55].
2. Materials and Methods
2.1. Materials
The substrate used for all dyeing experiments was a 100% polyamide 6 (PA6) fabric. The fabric was procured from Nurel Group (Turkey). Fabric contains different type polyamide yarn. %35 384T-70/24 Denier Polymaide FDY Semidull, %10 192T-40/13 Denier Polyamide FDY Semidull, %55 - 300 DN-70/24*4 Denier Texture Polyamide Semidull [1,2,3].
Polyamide 6 (PA6) is synthesized via the ring-opening polymerization of e-caprolactam. The resulting polymer chain contains repeating amide groups (CONH), which constitute the majority of the polar sites. The polymer chains are terminated by a small number of carboxylic end groups (COOH) and amino end groups (NH). Since the number of strongly hydrophilic end groups is low relative to the less-hydrophilic amide groups, the fiber exhibits low swelling in aqueous media, which in turn makes dye penetration difficult [4,5,6,7].
The preliminary preparation of the fabrics was conducted at Nurel Tekstil. The greige fabrics were initially processed through a Binaco Happy Scour continuous washing machine using Bianco HS New detergent at 85 °C and a speed of 30 m/min. Subsequently, the fabrics were passed through a stenter at 195 °C and 30 m/min. to ensure dimensional stability. Chemical agents were employed in the dyebath to achieve a more uniform dyeing process. Specifically, a biodegradable detergent, Bianco HS New, which is compatible with the dyebath and effectively removes impurities from the fabric, was utilized in conjunction with a levelling agent [22,23,24,25,26].
Our dyed lace fabric contains four different polyamide yarns. The primary focus was to ensure uniform dyeing across all fiber types, rather than focusing solely on the dye uptake of a single fiber. Our spectrophotometric readings, from which we obtained the K/S values, were taken from three different points, and the average values were used. It was observed that the deviations were not significant [22,23,24,25,26].
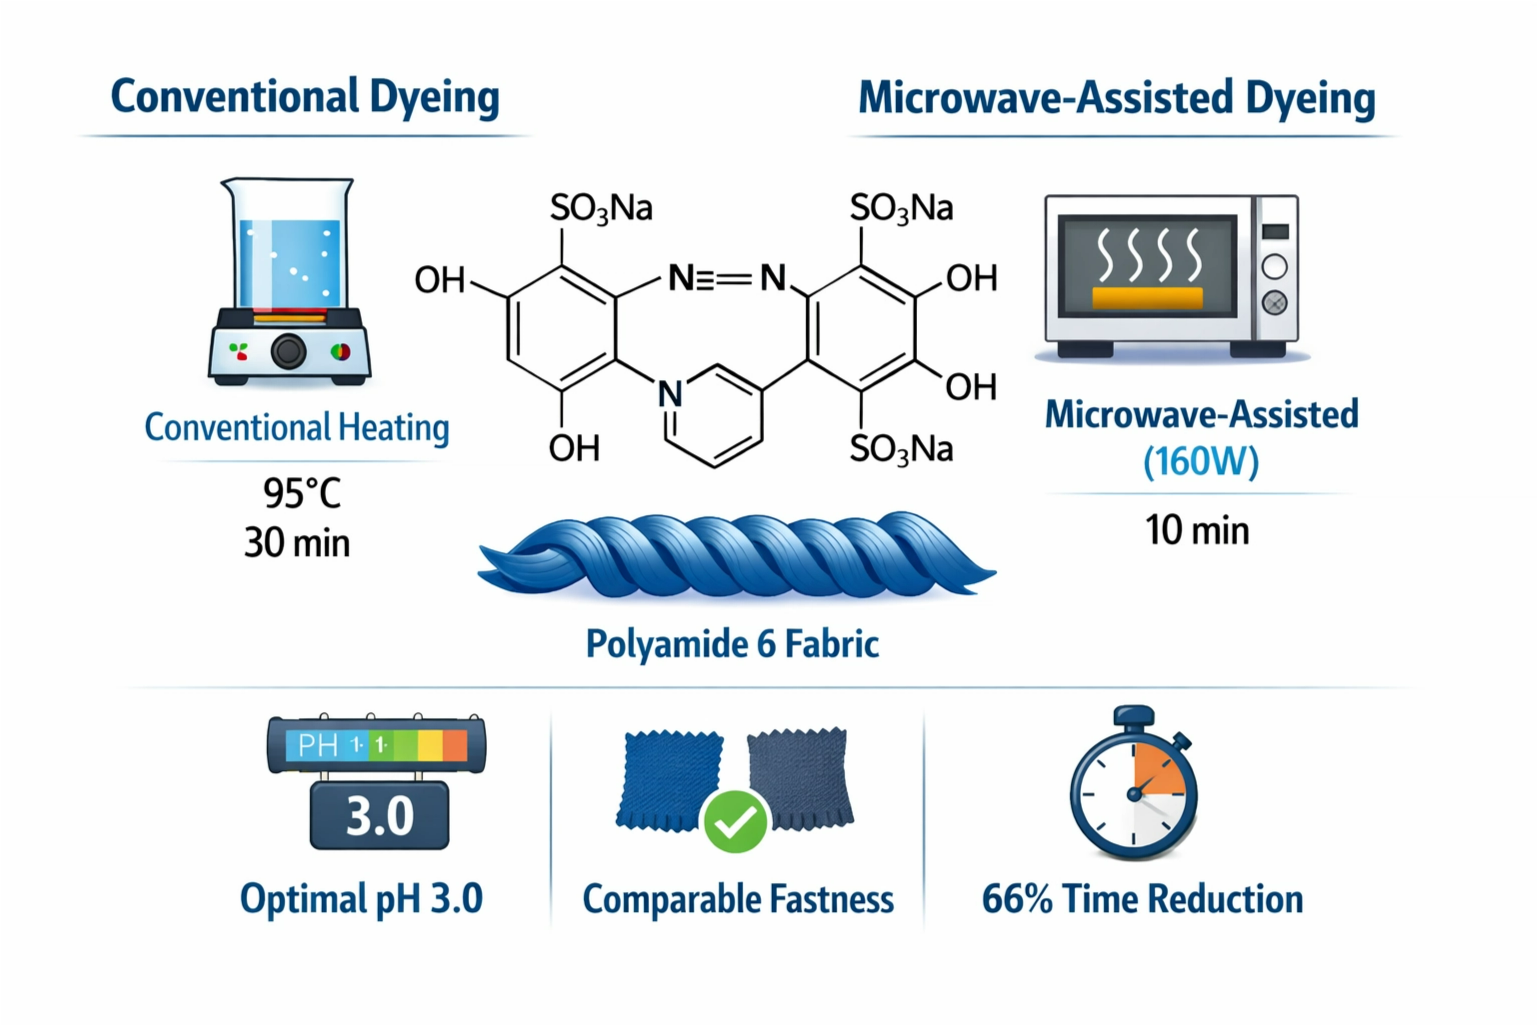
Conventional dyeing experiments were conducted in a laboratory-scale, using Rapid Eco-Dyer Laboratory Machine. The acid dye selected for this investigation was C.I. Acid Blue 324, commercially known as Telon Blue M-2R, supplied by DyStar (Germany). This dye possesses a molecular weight of 766.53 g/mol and was used as received with a purification. The chemical structure of the dye is depicted in Figure 1 [22,23,24,25,26].
2.2. Dyeing Procedures
2.2.1. Conventional Dyeing Methodology
Conventional dyeing experiments were conducted in a laboratory-scale. The dyebath was prepared with a liquor ratio of 1:50. The dyeing process was initiated at a starting temperature of 30 °C. The temperature was then uniformly raised to the target dyeing temperature (50, 60, 70, 80, or 95 °C) at a controlled rate of 1 0C/min. The dyeing was maintained at the final temperature for a duration of target reaction time (5-10-15-20-25-30 minutes) for comparative studies. Upon completion of the dyeing duration, the fabric samples were immediately removed, thoroughly rinsed with cold deionized water to remove any unfixed surface dye, and subsequently air-dried [22,23,24,25,26].
2.2.2. Microwave-Assisted Dyeing Methodology
Dyeing experiments were conducted using a modified microwave oven (Milestone Start D Microwave Digestion System). Dyeing baths were prepared in microwave-transparent 100 ml capacity tubes to ensure uniform microwave energy absorption [22,23,24,25,26].
The dyebath was prepared using the same liquor ratio (1:50) and dye concentrations as in the conventional dyeing protocol. The microwave power was systematically varied and set to 160 W. The dyeing duration was varied from 30 to 270 seconds (0,5 – 4,5 minutes), depending on the specific experimental conditions. Post-dyeing, the fabric samples were treated in the same manner as the conventionally dyed samples, involving a thorough rinsing and air-drying process [22,23,24,25,26].
2.2.3. Colorimetric Measurement
Dye uptake was determined by measuring the color strength in the fabric at predetermined time intervals using a Data Color SF 600 spectrophotometer at the maximum absorption wavelength of Telon Blue M2R (λmax = 630 nm). A calibration curve was established using known concentrations of the dye.
Color strength (K/S value) of the dyed fabric samples was measured using a reflectance spectrophotometer (Data Color 1000 spectrophotometer.) according to the Kubelka-Munk equation:
(1)
where R is the reflectance value at the maximum absorption wavelength.
The percentage dye exhaustion (Dye Exhaustion is proportional with K/S) was calculated using the following equations:
(2)
(3)
(4)
where C0 is the initial dye concentration and Cₜ is the dye concentration in the bath at time t [48,49,50,51,52,53,54,55,56,57,58,59].
The time-dependent calculation of dye concentration (Ct) in water was determined by using spectrophotometric measurements of the dye-water mixture and the proportionality of the K/S value to dye consumption. The difference between the initial concentration and the dye concentration remaining in the bath at time (t) gives the dye concentration absorbed by the fabric. Additionally, a linear regression was performed between this value and the K/S value read by the spectrophotometer to confirm the relationship of K/S value with the concentration. This conversion coefficient (A) was determined to be approximately 15. This coefficient depends on the type of dye and the initial dye concentration [48,49,50,51,52,53,54].
3. Results and Discussions
3.1. Conventional Dyeing
3.1.1. Effect of PH
Figure 2 and Table 1 show the relationship between the initial pH of the dye bath and the resulting color strength (K/S) of the dyed material. The experiment was conducted under constant conditions of time (20 minutes) and temperature (80 °C), with a dye concentration of 1% in conventional media. The results, presented in Figure 2 and Table 1 clearly demonstrate a strong inverse correlation between the initial dye bath pH and the resulting K/S value.
The data in Figure 2 and Table 1 show that the highest color strength was achieved at the lowest initial pH of 3.0, while the lowest color strength was recorded at the highest initial pH of 6.0. This represents a significant decrease of approximately 47.5% in color strength as the initial pH is increased from 3.0 to 6.0.
The plot of K/S versus pH exhibits a distinct negative exponential relationship. As the pH increases, the K/S value decreases sharply, particularly in the highly acidic range pH 3.0 to 4.0, before the rate of decrease moderates at higher pH values (above 4.5).
The data in Figure 2 and Table 1 show a progressive decrease in K/S as pH increases, with the steepest decline occurring between pH 3.0 and 4.0 (13.9% decrease per 0.5 pH unit). This indicates that the pH range 3.0–4.0 is critical for maximizing dye fixation on polyamide fibers. Polyamide fibers can be easily degraded if exposed to lower pH for a long time. At the same time, the exhaustion of dye molecules only triggers when kept at acidic pH.
3.1.2. Effect of Time andTemperature
The K/S value is a measure that indicates the color depth or dye uptake of a material The Kubelka-Munk function is widely used in color science to quantify the color yield of a dye on a substrate, where a higher K/S value indicates greater color depth or strength. [48,49,50,51,52,53,54,55,56,57,58,59].
The analysis was conducted to understand the effects of the different dyeing times and the different temperatures at a pH 6-7 (without acid donor) and a dye concentration of 1%. The dye samples at 1% concentration were heated to target temperatures (50 °C, 60 °C, 70 °C, 80 °C, and 95 °C). Figure 3 and Figure 4 show the change in K/S values and dye concentration over time (minutes) for five different temperatures. K/S values at 0, 5, 10, 15, 20, 25, and 30 minutes were measured for each temperature. Generally, K/S values show an increase over time at all temperatures. As the temperature increases, both the final level of K/S values and the rate of reaching saturation increase. Analysis of conventional dyeing curves and dyeing data in Figure 3 and Figure 4 and Table 2 and Table 3 clearly demonstrates that temperature and time play critical roles in K/S values and dyeing mechanism. At the highest temperature of 95 °C, the fastest dye uptake and the highest final K/S values were obtained.
The rate of dye exhaustion is profoundly influenced by temperature. As the temperature increases from 50 °C to 95 °C, the initial rate of dye uptake increases significantly. More importantly, the time required to reach equilibrium is drastically reduced. For instance, the 95 °C curve illustrates a near-complete exhaustion (minimal change in concentration) within the first 10–15 minutes, whereas the 50 °C curve continues to show a measurable, albeit slow, decrease in concentration even after 30 minutes (Figure 4 and Table 3).
3.1.3. Effect of Dye Concentration
The dyeing process was initiated at a starting temperature of 30 °C to examine the effects of dye concentration on the reaction. The temperature was then uniformly raised to the target dyeing temperature (50, 60, 70, 80, 90 or 95 °C) at a controlled rate of 1 °C/min. Experiments were carried out in the pH 6-7 (without acid donor) and a reaction time of 10 minutes to investigate the effects of different dye concentrations and temperature. Figure 5Figure –Figure 6 and Table 4 illustrates the relationship between color strength, dye concentration and dyeing temperature for a conventional dyeing process.
For any given dye concentration from Figure 5 and Table 4, an increase in temperature from 50 °C to 95 °C results in a substantial increase in the K/S value. These data illustrate that the dyeing process has a critical temperature zone where the mechanism of dyeing are dramatically accelerated.
The K/S value under these conditions is approximately 3.5 times greater than the value achieved at the same concentration but at 50 °C. This underscores the synergistic effect where a high dye concentration and high thermal energy (temperature) work in concert to maximize dye adsorption and fixation.
At all temperatures, higher dye concentrations result in higher K/S values, confirming that color strength is concentration-dependent. However, the relationship is non-linear, especially at elevated temperatures:
- At lower concentrations (0.1%), K/S values remain relatively low even at high temperatures, indicating limited availability of dye molecules.
- At higher concentrations (0.75% and 1,5%), K/S increases sharply up to 80–90 °C, after which the rate of increase diminishes. This behavior suggests site saturation within the fiber, where additional dye molecules contribute less effectively to color strength.
Notably, the 1,5% dye concentration exhibits the highest K/S values across all temperatures, reaching a maximum of approximately 15,91 at 95 °C, confirming superior dye loading under these conditions.
As observed, K/S values increase with rising temperature across all dye concentrations, indicating enhanced dye uptake and fixation at elevated temperatures.
The Conventional Dyeing Curve presented in Figure 6 illustrates the relationship between temperature and color strength (expressed as K/S values) for varying dye concentrations ranging from 0.1% to 1,5%.
For all dye concentrations, an overall increase in K/S is observed as the temperature increases from 50 to 95 °C. This trend can be attributed to several temperature-dependent phenomena:
Increased molecular mobility of dye molecules, which enhances diffusion from the dye bath into the fiber structure. Fiber swelling at elevated temperatures, leading to greater accessibility of internal dye-binding sites. The most pronounced increase in K/S occurs between 70 and 90 °C, particularly for dye concentrations of 0.5%, 0.75%, 1% , % 1.5, suggesting that this temperature range represents a critical transition where dye diffusion becomes significantly more efficient. Beyond 90 °C, the increase in K/S becomes marginal, indicating an approach to dye saturation or equilibrium uptake.
3.2. Microwave Dyeing
3.2.1. Effect of pH
Table 5 and Figure 7 illustrates the relationship between the initial pH of the dye bath and the resulting color strength (K/S) of the dyed material in microwave media. The experiment was conducted under constant conditions of time (4 minutes) and temperature (80 °C), with a dye concentration of 1% in microwave media. The primary objective is to identify the optimal pH range for maximizing color yield in microwave media.
The results from Figure 7 and Table 5 demonstrate a strong inverse correlation between the initial pH of the dye bath and the color strength. The highest K/S value was achieved at the most acidic condition tested pH 3.0 as in conventional media.
The K/S value decreases sharply from a maximum of approximately 25.0 at pH 3.0 to 12.5 at pH 6.5. This reduction of nearly 50% in color strength highlights the paramount importance of pH control in the dyeing of polyamide fibers, particularly when using acid or metal-complex dyes.
The high K/S values achieved (up to 25.0) are indicative of a highly efficient dyeing process, which is likely enhanced by the microwave environment.
- Accelerated Diffusion: Microwave heating provides rapid, volumetric heating, which can significantly increase the molecular mobility of the dye and the segmental motion of the polymer chains. This effectively lowers the energy barrier for the internal diffusion of the dye into the fiber matrix, accelerating the overall dyeing rate and allowing for a higher equilibrium dye uptake in a shorter time.
- Synergistic Effect: The microwave energy acts synergistically with the optimal chemical conditions (pH: 3- 6). While the acidic condition provides the necessary thermodynamic driving force (electrostatic attraction), the microwave energy provides acceleration (enhanced diffusion), resulting in the superior color strength observed.
Both conventional and microwave-assisted dyeing show a clear, inverse relationship between pH and color strength. The K/S value is maximized at the lowest tested pH (pH 3.0) and decreases sharply as the dyebath becomes less acidic. The optimal pH for maximum dye uptake remains consistently at pH 3.0 for both conventional and microwave-assisted dyeing [22,23,24,25,26,30,31,32,33,34,35,36,37].
3.2.2. Effect of Time and Temperature
The analysis was conducted to understand the effects of the different dyeing times and the different temperatures at a pH 6-7 (without acid donor) and a dye concentration of 1%.
Figure 8 and Figure 9 and Table 6 and Table 7 illustrate the effect of temperature (50– 95 °C) on the measured parameter over a 10 minute heating period. At all tested temperatures, the parameter increased continuously with time, indicating a temperature-dependent process. However, the rate of increase varied considerably with temperature.
Microwave-assisted dyeing is an advanced technique that utilizes electromagnetic radiation to rapidly heat the dye bath and the substrate, leading to faster diffusion and reduced processing times compared to conventional methods. The color strength, quantified by the Kubelka-Munk function (K/S), is a critical parameter for evaluating the efficiency of the dyeing process.
Temperature Dependence: For any given time point, the K/S value is directly proportional to the temperature. The 95 °C curve consistently yields the highest color strength, while the 50 °C curve yields the lowest.
The initial rate of dyeing (the slope of the curve at t=0) is significantly higher at elevated temperatures, particularly at 80 °C and 95 °C. The 95 °C curve exhibits a near-vertical rise in the first minute, achieving a K/S of 11.530, which is approximately 8.2 times the value achieved at 50 °C (K/S = 1.399) in the same period.
Equilibrium/Saturation: All curves exhibit a characteristic trend of rapid initial uptake followed by a gradual leveling off, suggesting that the dyeing process is approaching equilibrium exhaustion. The saturation point is reached fastest and at the highest K/S value for the 95 °C process.
Dye exhaustion, the percentage of dye transferred from the bath to the textile substrate, is a critical parameter in industrial dyeing, directly impacting color yield, process economics, and environmental sustainability. Monitoring the dye concentration in the bath over time is the standard method for determining the exhaustion rate. This analysis interprets the provided concentration data to quantify the effect of temperature on the rate and extent of dye uptake in a microwave-assisted system [48,49,50,51,52,53,54].
The data in Figure 9 and Table 7 clearly demonstrate the exponential relationship between temperature and dye exhaustion. The analysis of the dye bath concentration data confirms the superior efficiency of high-temperature microwave-assisted dyeing. The process at 95 °C achieves an exceptionally high dye exhaustion of 95.2% in just 10 minutes, which is indicative of a highly accelerated mass transfer process. This rapid and near-complete exhaustion is a direct result of the thermal energy provided by the microwave, which enhances the diffusion coefficient of the dye molecules and the swelling of the fiber structure. These findings underscore the potential of microwave technology for developing fast, high-yield, and environmentally conscious dyeing protocols [22,23,24,25,26,30,31,32,33,34,35,36,37].
The comparative analysis unequivocally demonstrates that microwave-assisted dyeing is superior to the conventional method. The microwave process significantly accelerates the rate of dye uptake, leading to substantially higher dye exhaustion in a fraction of the time required by the conventional method. This efficiency is particularly pronounced at 95 °C, where the microwave method achieves near-complete exhaustion 95.2% in just 10 minutes. The enhanced performance is attributed to the rapid, volumetric heating characteristic of microwave energy, which facilitates faster dye diffusion and fixation. These findings support the adoption of microwave technology as a more time-efficient and environmentally favorable alternative for industrial dyeing applications [22,23,24,25,26,30,31,32,33,34,35,36,37].
3.2.3. Effect of Dye Concentration and Reaction Time
The analysis was conducted to understand the effects of the different dyeing times and the different concentrations at a pH 6-7 (without acid donor) and average temperature of 80 °C.
Table 8 and the Figure 10 and Figure 11) illustrate the relationship between dye concentration (% mg/100 ml) and color strength (K/S) for samples treated under microwave irradiation at different dyeing times (0–4.5 minutes).
Overall, the results demonstrate that both dye concentration and microwave dyeing time have a significant positive effect on color strength. For all microwave exposure times, the K/S values increase with increasing dye concentration. This trend indicates that higher dye availability in the dye bath leads to greater dye uptake by the material, resulting in enhanced color strength. However, the increase is non-linear, suggesting a gradual approach toward saturation at higher concentrations [22,23,24,25,26,30,31,32,33,34,35,36,37].
At a fixed dye concentration, increasing the microwave treatment time markedly increases the K/S values. Short dyeing times (0–1.5 minutes) result in relatively low color strength, while longer times (3–4.5 minutes) produce substantially higher K/S values. This behavior can be attributed to the enhanced molecular mobility and diffusion of dye molecules under microwave heating, which promotes more efficient dye–fiber interactions [22,23,24,25,26,30,31,32,33,34,35,36,37].
The highest color strength is observed at the combined condition of high dye concentration and prolonged microwave exposure (4–4.5 minutes). This indicates a synergistic effect, where microwave energy accelerates dye penetration and fixation, particularly at higher dye concentrations [22,23,24,25,26,30,31,32,33,34,35,36,37].
The data suggest that microwave-assisted dyeing is an effective method for achieving high color strength in relatively short processing times. Optimizing microwave exposure time can reduce energy consumption while maintaining or enhancing dyeing efficiency [22,23,24,25,26,30,31,32,33,34,35,36,37].
The results in Figure 10 and Figure 11 and Table 8 clearly demonstrate that both dye concentration and microwave exposure time have a pronounced effect on dye uptake. For all dye concentrations studied (0.1–1.5%), the K/S values increase monotonically with dyeing time, indicating progressive adsorption and fixation of dye molecules onto the substrate. A rapid increase in K/S is observed at the early stages (0–2.5 min), followed by a more gradual rise at longer times.
At any given dyeing time, K/S values increase systematically with increasing dye concentration:
This trend confirms that higher initial dye concentrations provide a greater driving force for mass transfer, leading to enhanced dye uptake. The effect is particularly pronounced under microwave conditions, where volumetric heating promotes:
- Faster dye diffusion
- Improved fiber swelling
- Increased accessibility of internal binding sites
3.3. Fastness Properties
Color fastness tests were performed according to ISO standards for fabrics dyed with Telon Blue M2R at a 1% dyeing concentration using the conventional method (95 °C, 30 min) and microwave-assisted method (10 min). Washing fastness tests were performed according to ISO 105 C06 B1S method, acidic and alkaline perspiration fastness tests were performed according to ISO 105 E04 method and water fastness tests were made according to ISO 105 E01. Dry/Wet Rubbing Fastness tests were made according to ISO105X12. Fastness properties were evaluated according to ISO 105 A02 and ISO 105 A03 method with grey scale in light cabinet [22,23,24,25,26,30,31,32,33,34,35,36,37].

Table 9.
Fastness Properties (1% Conventional and Microwave Methods).
| Dyeing Method |
Washing Fastness [ISO105C06 B1S] |
Acidic Persp. [ISO 105 E04] |
Alkaline Persp. [ISO 105 E04] |
Water Fastness [ISO 105 E01] |
Dry/Wet Rubbing Fastness [ISO105X12] |
|---|---|---|---|---|---|
|
Conventional |
3/4 | 4 | 3/4 | 4 | 4/5 - 4 |
|
Microwave |
3/4 | 4 | 3/4 | 4 | 4/5 - 4 |
4. Conclusions
Comprehensive comparative study was conducted on the acid dyeing of PA-6 fabric, systematically evaluating the performance of conventional heating against the innovative microwave-assisted technique using C.I. Acid Blue 324. This investigated the mechanism of acid dyeing of polyamide 6 (PA6) fabrics, providing a detailed comparison between microwave-assisted heating and conventional dyeing methodologies. The investigation analyzed the influence of key parameters pH, temperature, dyeing time, and dye concentration on the resulting color strength (K/S).
4.1. Role of Microwave Irradiation
Compared to conventional thermal dyeing reported in the literature, the observed dye uptake occurs within remarkably short dyeing times (4.5 - 10 minute).
This significant enhancement in the dyeing process kinetics is primarily attributed to the unique mechanism of dielectric heating induced by microwave irradiation, which fundamentally differs from the surface-to-core heat transfer characteristic of conventional methods.
Microwave energy is converted into thermal energy within the dye bath and the fiber matrix through two principal mechanisms: dipole rotation and ionic conduction
Dipole Rotation: Polar molecules, most notably water, attempt to align themselves with the rapidly oscillating electric field of the microwave radiation. This constant re-orientation, occurring billions of times per second, generates internal friction and volumetric heat. This mechanism is highly efficient in heating the dye liquor and the water molecules adsorbed within the amorphous regions of the textile fiber
Ionic Conduction: The dissolved ions in the dye bath, including the dye molecules themselves and auxiliary chemicals, migrate under the influence of the alternating electric field. The resistance encountered by these moving ions leads to collisions and subsequent heat generation. This effect is particularly important as it directly targets the medium containing the dye species
Unlike conventional heating, where heat is transferred from the external source to the surface of the dye bath and then gradually into the fiber, microwave irradiation provides volumetric heating. This results in:
- Rapid Heating: The entire volume of the dye bath and the substrate is heated simultaneously, drastically reducing the time required to reach the target dyeing temperature.
- Reduced Thermal Gradients: The internal generation of heat minimizes the temperature difference between the surface and the core of the fiber, leading to a more uniform thermal environment. This uniformity is crucial for achieving level dyeing and consistent color yield across the textile material.
The combined effects of rapid volumetric heating and the direct interaction of the electromagnetic field with the polar components of the system lead to a significant improvement in the mass transfer process.
Accelerated Diffusion: The localized, internal heating of the fiber matrix, particularly the adsorbed water, is hypothesized to increase the segmental mobility of the polymer chains in the amorphous regions of the fiber. This temporary increase in free volume facilitates the faster diffusion and penetration of the dye molecules into the fiber structure.
Improved Fixation Efficiency: The accelerated diffusion kinetics, coupled with the short processing times, lead to a higher rate of dye uptake and fixation, which is often quantified by a higher color strength (K/S value) compared to conventionally dyed samples at equivalent times.
The experimental results demonstrate that microwave-assisted dyeing enables:
- Fast Color Development: Achieving the final shade in minutes rather than hours.
- High Color Strength at Short Processing Times: Maximizing the utilization of the applied dye.
- Efficient Utilization of Higher Dye Concentrations: Enabling the production of deep shades with reduced processing time.
4.2. Reaction Parameters Evaluation
The study confirmed that the conventional dyeing process adheres to established principles, with the highest dye uptake achieved at the most acidic condition (pH 3.0) and the highest temperature tested (95 °C). However, the process is inherently time consuming, requiring a duration of 30 minutes to achieve maximum color yield, which is a significant factor in industrial throughput and energy consumption.
The findings clearly demonstrate that the microwave-assisted method provides a scientific basis for developing faster, more energy-efficient, and more sustainable dyeing protocols in the textile industry.
In both dyeing methods, the optimum pH value for maximum dye uptake (K/S value) was determined to be 3.0. This confirms the critical importance of an acidic environment to maximize the ionic interaction between the protonated amino groups in the PA6 fiber and the dye molecules.
In the conventional method, dye uptake increased proportionally with time and temperature, with the highest K/S values obtained after 30 minutes of dyeing at 95 °C. This indicates that the rate-determining step of dye diffusion and fixation is dependent on thermal energy.
The microwave-assisted dyeing method provided a remarkable acceleration in the dyeing time. Thanks to the dielectric heating mechanism (160 W), the time required for dye uptake was drastically reduced compared to the conventional method [22,23,24,25,26,30,31,32,33,34,35,36,37].
The most significant finding is the drastic acceleration of the dyeing process enabled by microwave irradiation, achieving 95.2% exhaustion in 10 minutes at 95 °C, a feat unattainable by the conventional method in the same timeframe
Acknowledgments
The authors would like to thank Nurel Tekstil, Bursa, Turkey, for kindly supplying the polyamide fabrics and allowing the support.
References
- Böcek, N. Investigation of Fiber and Temperature Interaction in Dyeing of Synthetic Fibers. Master’s thesis, Sakarya University, 2001. Available online: https://tez.yok.gov.tr/UlusalTezMerkezi/.
- Irfan, M.; Gao, A. Nylon dyeing with reactive dyes by intermittent exposure to microwave irradiations to improve leveling. Pigment&Resin Technology 2025, 54/5, 674–681. [Google Scholar] [CrossRef]
- Atav, R.; Soysal, S.; Haji, A. Environmentally Friendly Coloration of Polyamide Fabrics with the Use of Natural Dyes: A Study Including Results of Industrial Scale Applications. In Fibers and Polymers; 2024; Volume 25, pp. pages 2223–2232. [Google Scholar] [CrossRef]
- Nikodijevic, M.; Vuckovic, N.; Dordevic, D. Possibilities of Dyeing of Polyamide Fabric with Substantive Dye. The Eurasia Proceedings of Science, Technology, Engineering & Mathematics (EPSTEM) 2020, Volume 11, 131–135. [Google Scholar]
- Ghazal, H. A. Microwave irradiation as a new novel dyeing of polyamide 6 fabrics by reactive dyes. Egypt. J. Chem. 2020, vol. 63(no.6), pp. 2125 2132. [Google Scholar] [CrossRef]
- Eren, S.; Özyurt, İ. Waterless Dyeing of Polyamide 6.6. Polymers 2024, 16, 1472. [Google Scholar] [CrossRef]
- Xue, Q.; Zhu, J.; Meng, W.; Zhang, K. Effect of MXene Nanosheet Dispersed Phases on the Fabrication of Polyamide Nanofiltration Membranes. ACS Appl. Eng. Mater. 2023, 679–689. [Google Scholar] [CrossRef]
- Alegbe, E. O.; Uthman, T. O. A review of history, properties, classification, applications and challenges of natural and synthetic dyes. Heliyon 2024, 10, e33646. [Google Scholar] [CrossRef]
- Özcan, Y. Textile Fiber and Dyeing Technique. 1978.
- Trotman, E.R. Dyeing and Chemical Technology of Textile Fibres. 1970.
- Teker, M; Imamoglu, M; Bocek, N. Adsorption of Some Textile Dyes on Activated Carbon Prepared From Rice Hulls - Fresenıus Environmental Bulletin - Vol.18 - pp.709 - ISSN: 1018-4619 - English - Article - 2009 - WOS:000266898500009. 2009. [Google Scholar] [CrossRef]
- Strebel, A.; Behringer, M.; Hilbig, H.; Machner, A.; Helmreich, B. Anionic azo dyes and their removal from textile wastewater through adsorption by various adsorbents: a critical review. Frontiers in Environmental Engineering 2024, 3, 1347981. [Google Scholar] [CrossRef]
- Liu, Y.; Chen, J.; Duan, D.; Zhang, Z.; Liu, C.; Cai, W.; Zhao, Z. Environmental impacts and biological technologies toward sustainable treatment of textile dyeing wastewater: A review. Sustainability 2024, 16(24), 10867. [Google Scholar] [CrossRef]
- Emanuele, L.; D’Auria, M. The use of heterocyclic azo dyes on different textile materials: A review. Organics 2024, 5(3), 277–289. [Google Scholar] [CrossRef]
- Zhang, R.; Liu, J.; Wang, J.; Wang, J.; Meng, J. A novel process of dyeing wool with acid dyes under microwave irradiation. Journal of Applied Polymer Science 2009, 113(5), 2798–2803. [Google Scholar] [CrossRef]
- Adeel, S.; Razzaq, A.; Kiran, S.; Ahmad, T.; Hassan, A.; Rehman, H. A, Comparative Study on Sustainable Dyeing of Silk and Wool with Acid Red 138 Dye. J. Nat. Fibers 2022, 19, 8181–8190. [Google Scholar] [CrossRef]
- Fattahi, F.S. Investigation on the Kinetic Feature of CI Acid Blue 106 Dyeing on Woolen Material. Nanochem. Res. 2024, 9, 280–290. [Google Scholar] [CrossRef]
- Yiğit Atabek, E. Investigation of Dyeability of Polypropylene Fiber. Doctoral thesis YÖK National Thesis Center, Sakarya University, 2009. Available online: https://tez.yok.gov.tr/UlusalTezMerkezi/.
- Dülek, Y.; Yıldıran, İ.; Sevinç, B.; Mert, E.; Yılmaz, B.; Kut, D. A Comparative Study on Microwave Assisted Dyeing Properties of Conventional and Recycled Polyester Fabrics. Eurasia Proc. Sci. Technol. Eng. Math. 2023, 23, 300–306. [Google Scholar] [CrossRef]
- Khalil, E.; Sarkar, J.; Rahman, M.M.; Shamsuzzaman, M.; Das, D. Advanced Technology in Textile Dyeing. In Advanced Technology in Textiles: Fibre to Apparel; Rahman, M.M., Mashud, M., Rahman, M.M., Eds.; Springer: Singapore, 2023; pp. 97–138. [Google Scholar] [CrossRef]
- Amesimeku, J.; Fan, L.; Jakpa, W.; Wang, C. Dyeing properties of meta-aramid fabric dyed with basic dye using ultrasonic–microwave irradiation. Journal of Cleaner Production 2021, 278, 123987. [Google Scholar] [CrossRef]
- Doyuran, A. Dyeing of Synthetic Fibers in Microwave Environment. Master’s thesis, Sakarya University, 2010. Available online: https://tez.yok.gov.tr/UlusalTezMerkezi/.
- 23. Usluoğlu A., Teker M. (2024), Investigation of Dyeing Kinetics of Cotton Fiber with C.I. Reactive Yellow 138:1 Dyestuff in Microwave Environment. Journal of the Institute of Science of Yüzüncü Yıl University Vol.29, 119. [CrossRef]
- b style="mso-bidi-font-weight:normal">24. Yiğit E.A., Teker M. (2011), Disperse Dyeability of Polypropylene Fibers via Microwave and Ultrasonic Energy - Polymer and Polymer Composites. Vol.19, 711. [CrossRef]
- Kocak, D.; Akalin, M.; Merdan, N.; Yilmaz Sahinbaskan, B. Effect of Microwave Energy on Disperse Dyeability of Polypropylene Fibres. Marmara Journal of Pure and Applied Sciences 2015, Special Issue-1, 27–31. [Google Scholar]
- Alşan, H. G. Investigation of Dyeing Kinetics of Cotton Fiber with Disperse Dyestuff in Microwave Environment. Master’s thesis YÖK National Thesis Center, Sakarya University, 2019. Available online: https://tez.yok.gov.tr/UlusalTezMerkezi/.
- Büyükakıncı, Y. B.; Karada, R.; Guzel, E.T. Organic cotton fabric dyed with dyer’s oak and barberry dye by microwave irradiation and conventional methods. Industria Textila 2021, Vol No, 72, 30–38. [Google Scholar] [CrossRef]
- Büyükakıncı, Y.; Sökmen, N.; Öner, E. Microwave assisted exhaust dyeing of polypropylene. Paper presented at the 4th Centrel European Conference, Liberec, Czech Republic, 7-9 September 2005; 2005. [Google Scholar]
- Öner, E.; Büyükakıncı, Y.; Sökmen, N. Microwave-assisted dyeing of poly(butylene terephthalate) fabrics with disperse dyes. Coloration Technology 2013, 129(2), 125–130. [Google Scholar] [CrossRef]
- Haggag K., Fixation of pad-dyeing on cotton using microwave heating. In Am Dyestuff Rep; 1990; pp. 26–30.
- Haggag, K.; El-Molla, M.M.; Mahmoued, Z.M. Dyeing of Cotton Fabric using Reactive Dyes by Microwave Irradiation Technique. Indian Journal of Fibre & Textile Research 2014, Vol.9, 406–410. [Google Scholar] [CrossRef]
- K. Haggag, M. M. El-Molla, K. A. Ahmed (2015), Dyeing of Nylon 66 Fabrics Using Disperse Dyes by Microwave Irradiation Technology. International Research Journal of Pure & Applied Chemistry 2015, 8(2), 103–111. [CrossRef]
- Haggag, K.; Hanna, H. L.; Youssef, B. M.; El-Shimy, N. S. Dyeing polyester with microwave heating using disperse dyestuffs. Journal of the Society of Dyers and Colourists 1995, 111(5), 170–173. [Google Scholar] [CrossRef]
- Gouda, M.; Haggag, K. M.; Boraie, W. E; Aljaafari, A.; Al-Faiyz, Y. Synthesis and Characterization of Inorganic Pigment Nanoparticles for Textile Coloration Using Microwave Techniques. AATCC Journal of ResearchVolume 2016, Volume 3(Issue 3), 1–8. [Google Scholar] [CrossRef]
- Elshemy, N. S.; Elshakankery, M. H.; Shahien, S. M.; Haggag; El-Sayed, K. H. Kinetic Investigations on Dyeing of Different Polyester Fabrics Using Microwave Irradiation, Egypt. J. Chem. The 8th. Int. Conf. Text. Res. Div., Nat. Res. Centre 2017, 79–88. [Google Scholar] [CrossRef]
- Rahman, M. M.; Ahmed, M.; Jalil, M. A.; Mondal, M. I. H. The effect of microwave preheating on the dyeing of wool fabric with a reactive dye. Journal of Applied Polymer Science 2008, 108(1), 314–318. [Google Scholar] [CrossRef]
- Elshemy, N.S.; Haggag, K. New Trend in Textile Coloration Using Microwave Irradiation. J. Text. Color. Polym. Sci. 2019, Vol. 16(No.1), pp 33–48. [Google Scholar] [CrossRef]
- Lill, J. R. Microwave-Assisted Proteomics. 2009.
- Hayes, B. L. Microwave Synthesis. 2002.
- Can, M. C. Microwave Heating as a Tool for Sustainable Chemistry. 2010.
- Kim, S. S.; Leem, S. G.; Ghim, H. D.; Kim, J. H.; Lyoo, W. S. Microwave heat dyeing of polyester fabric. Fibers and Polymers 2003, 4(4), 204–209. [Google Scholar] [CrossRef]
- Kale, M.J., Bhat, N.V., Effect of microwave pretreatment on the dyeing behaviour of polyester fabric. Society of Dyers and Colourists, Color. Technol. 127, 365–371, 43. [CrossRef]
- Popescu, V.; Astanei, D.G.; Burlica, R.; Popescu, A.; Munteanu, C.; Ciolacu, F.; Ursache, M.; Ciobanu, L.; Cocean, A. Sustainable and cleaner microwave-assisted dyeing process for obtaining eco-friendly and fluorescent acrylic knitted fabrics. Journal of Cleaner Production Volume 2019, Volume 232, Pages 451–461. [Google Scholar] [CrossRef]
- Keglevich, G. The Application of Microwaves in the Esterification of P-Acids. Current Microwave Chemistry 2022, 9, 62–64. [Google Scholar] [CrossRef]
- Ghaffar, A.; Adeel, S.; Habib, N.; Jalal, F.; Ul-Haq, A.; Munir, B.; Ahmad, A.; Jahangeer, M.; Jamil, Q. Effects of Microwave Radiation on Cotton Dyeing with Reactive Blue 21 Dye. Pol. J. Environ. Stud. 2019, Vol. 28(No. 3), 1687–1691. [Google Scholar] [CrossRef]
- Al-Etaibi, A.M.; El-Apasery, M.A. Microwave-Assisted Synthesis of Azo Disperse Dyes for Dyeing Polyester Fabrics: Our Contributions over the Past Decade. Polymers 2022, 14, 1703. [Google Scholar] [CrossRef]
- Lara, L.; Cabral, I.; Cunha, J. Ecological Approaches to Textile Dyeing: A Review. Sustainability 2022, 14, 8353. [Google Scholar] [CrossRef]
- Vassileva, V.; Zheleva, Z.; Valcheva, E. The Kinetic Model of Dye Fixation on Cotton Fibers. Journal of University of Chemical Technology and Metallurgy 2008, 43(3), 323–326. [Google Scholar]
- Ujhelyiova, A.; Bolhova, E.; Oravkinova, J.; Tin, R.; Marcin, A. Kinetics of dyeing process of blend polypropylene/polyester fibres with disperse dye. Dyes and Pigments 2007, 72, 212–216. [Google Scholar] [CrossRef]
- Reda, E.M.; Othman, H.A.; Ghazal, H.; Hassabo, A.G. Kinetic and isothermal study of dye absorption using pre-treated natural fabrics using polyamine compounds. Sci. Rep. 2025, 15, 3794. [Google Scholar] [CrossRef]
- Lis, M.J.; Bezerra, F.M.; Meng, X.; Qian, H.; Immich, A.P.S. Kinetics of Dyeing in Continuous Circulation with Direct Dyes:Tencel Case. World Journal of Textile Engineering and Technology 2019, 5, 97–104. [Google Scholar] [CrossRef]
- Shahmoradi Ghaheh, F.; Razbin, M.; Tehrani, M.; Zolfipour Aghdam Vayghan, L.; Sadrjahani, M. Modeling and optimization of dyeing process of polyamide 6 and woolen fabrics with plum-tree leaves using artificial intelligence. Sci. Rep. 2024, 14, 15067. [Google Scholar] [CrossRef]
- Ghaheh, F.S.; Razbin, M.; Tehrani, M.; Vayghan, L.Z.A.; Sadrjahani, M. Modeling and optimization of dyeing process of polyamide 6 and woolen fabrics with plum-tree leaves using artificial intelligence. Scientific Reports 2024, volume 14, Article number, 15067. [Google Scholar] [CrossRef]
- Roy, M.N.; Hossain, M.T.; Hasan, M.Z.; Islam, K.; Rokonuzzaman, M.; Islam, M.A.; Khandaker, S.; Bashar, M.M. Adsorption, Kinetics and Thermodynamics of Reactive Dyes on Chitosan Treated Cotton Fabric. Textile & Leather Review 2023, 6, 211–232. [Google Scholar] [CrossRef]
- Miklavc. Chem. Phys.Chem 2001, 552. [CrossRef]
- Binner, J.G.P.; Hassine, N. A.; Cross, T. E. J. Mater. Sci. 1995, 30, 5389.56. [CrossRef]
- Garbacia, S.; Desai, B.; Lavaster, O.; Kappe, C. O. J. Org. Chem. 2003, 68, 9136. [CrossRef]
- Stadler; Kappe, C. O. J. Chem. Soc., Perkin Trans. 2000, 2, 1363. [CrossRef]
- Hoz; Diaz-Ortiz, A.; Moreno, A. Chem. Soc. Rev. 2005, 34, 164. [CrossRef] [PubMed]
Figure 1.
Chemical Structure of Telon Blue M-2R (C.I. Acid Blue 324).
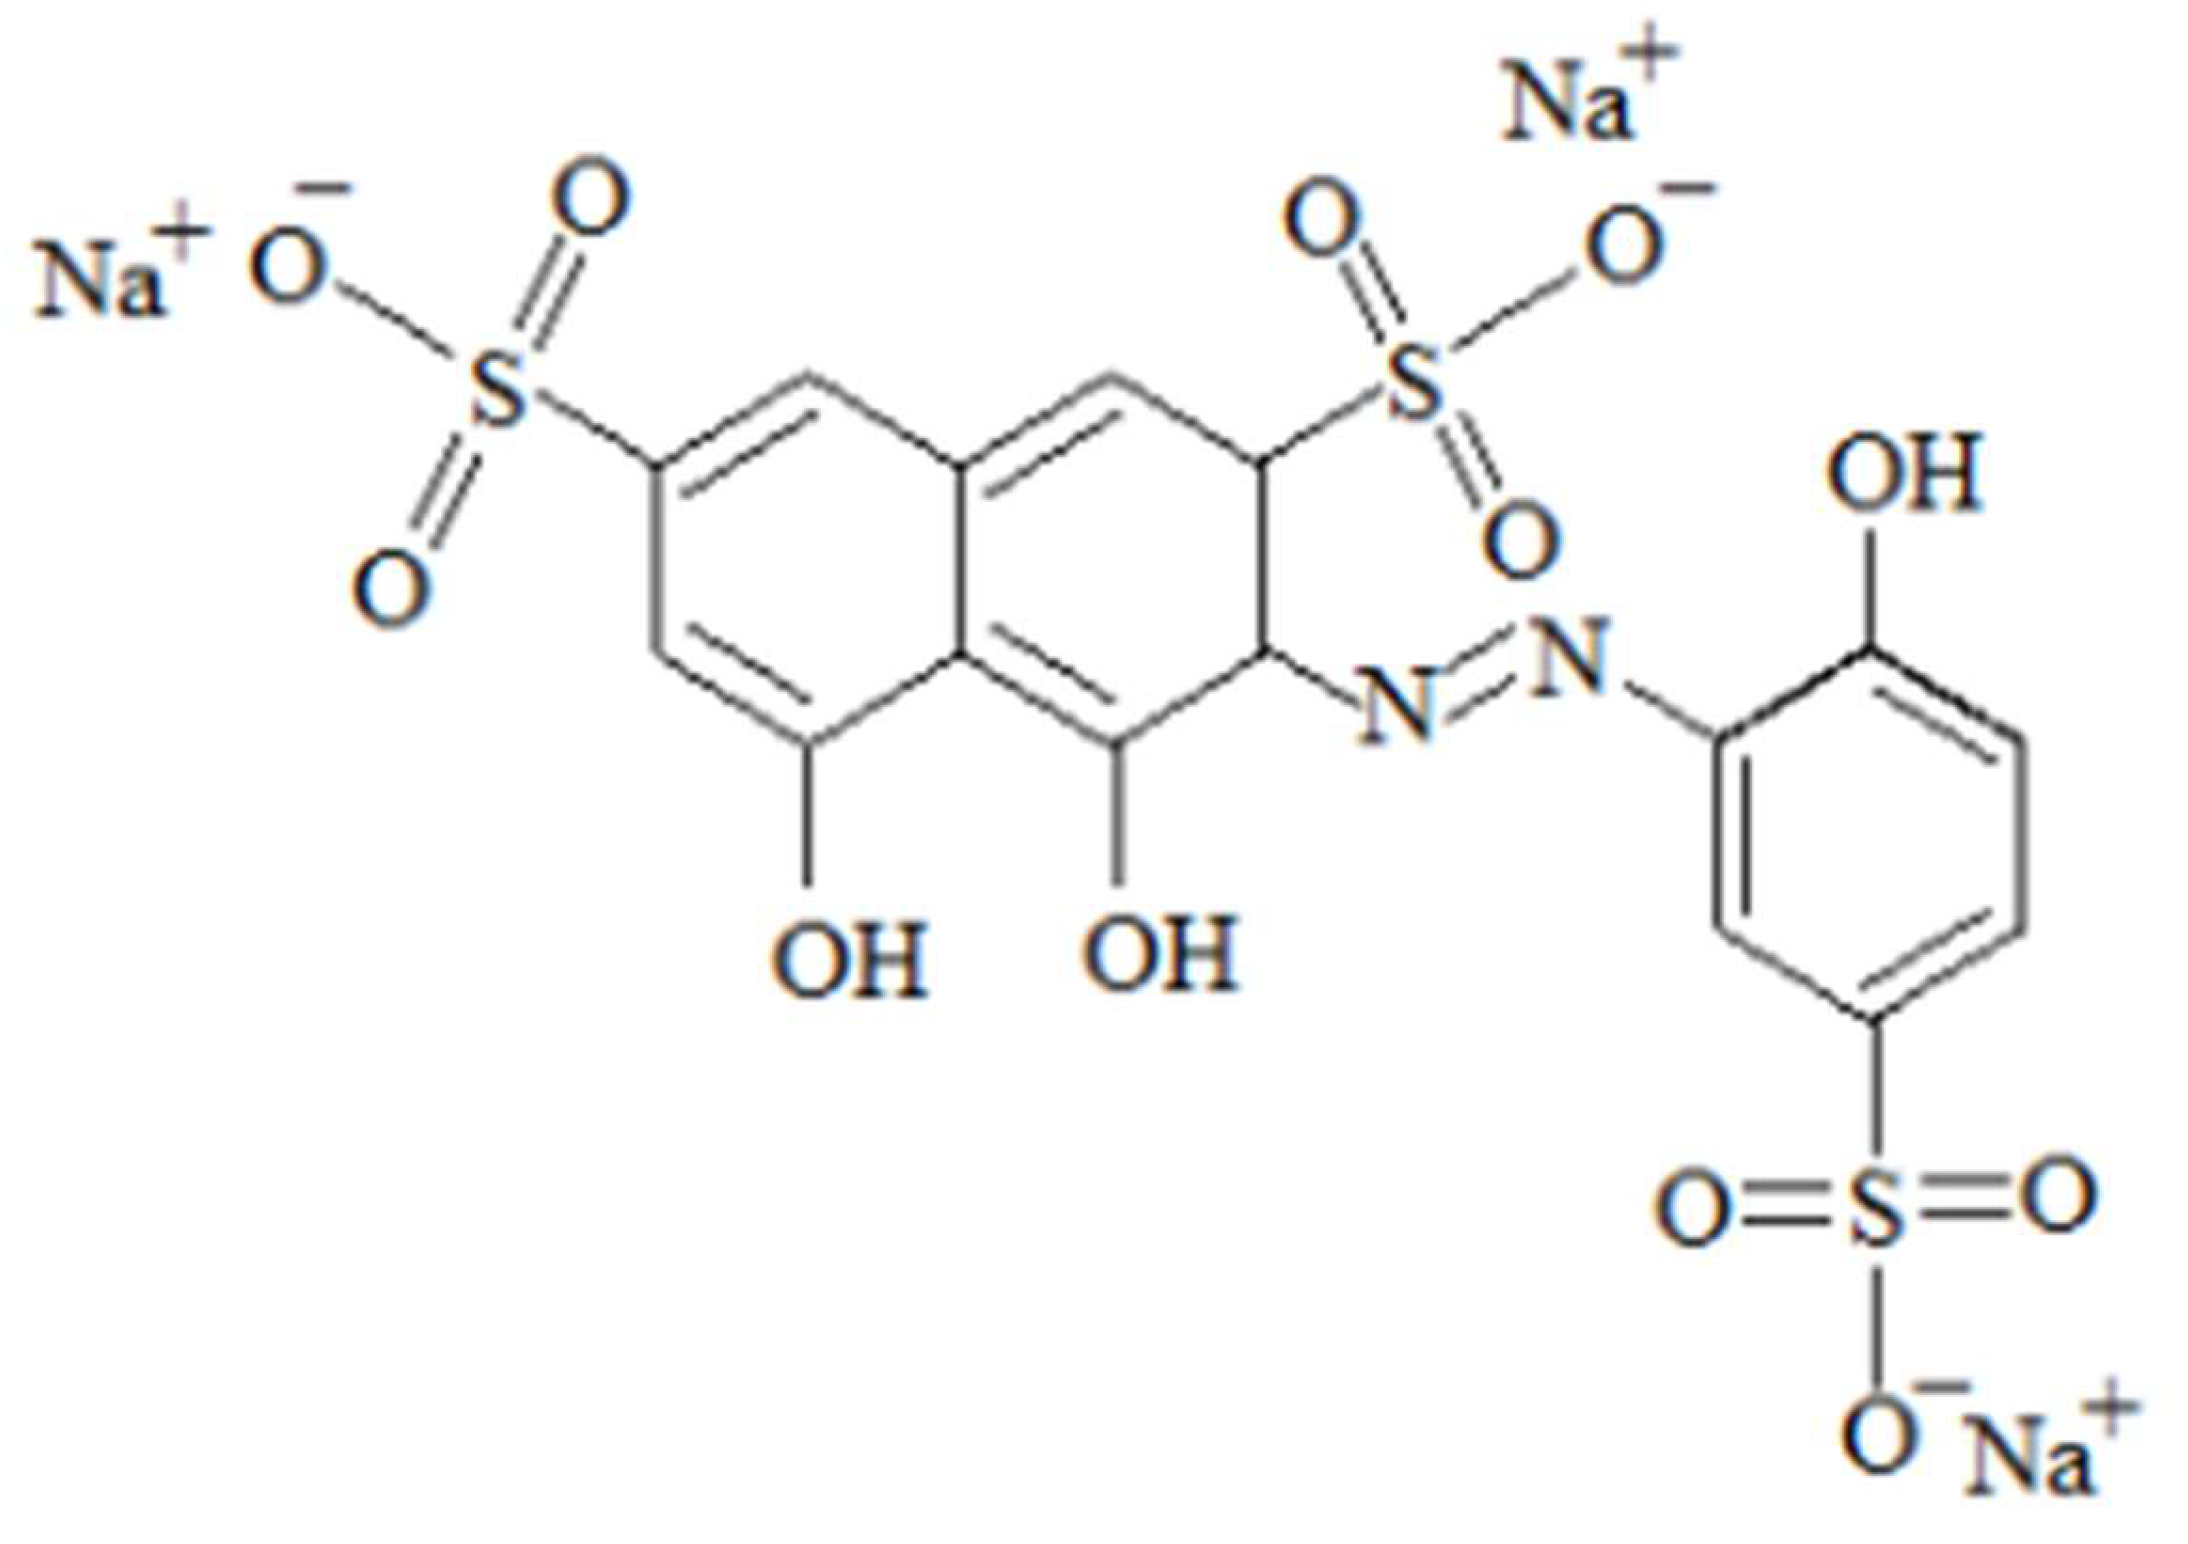
Figure 2.
pH-dependent color strength (K/S) profiles for Conventional Heating.
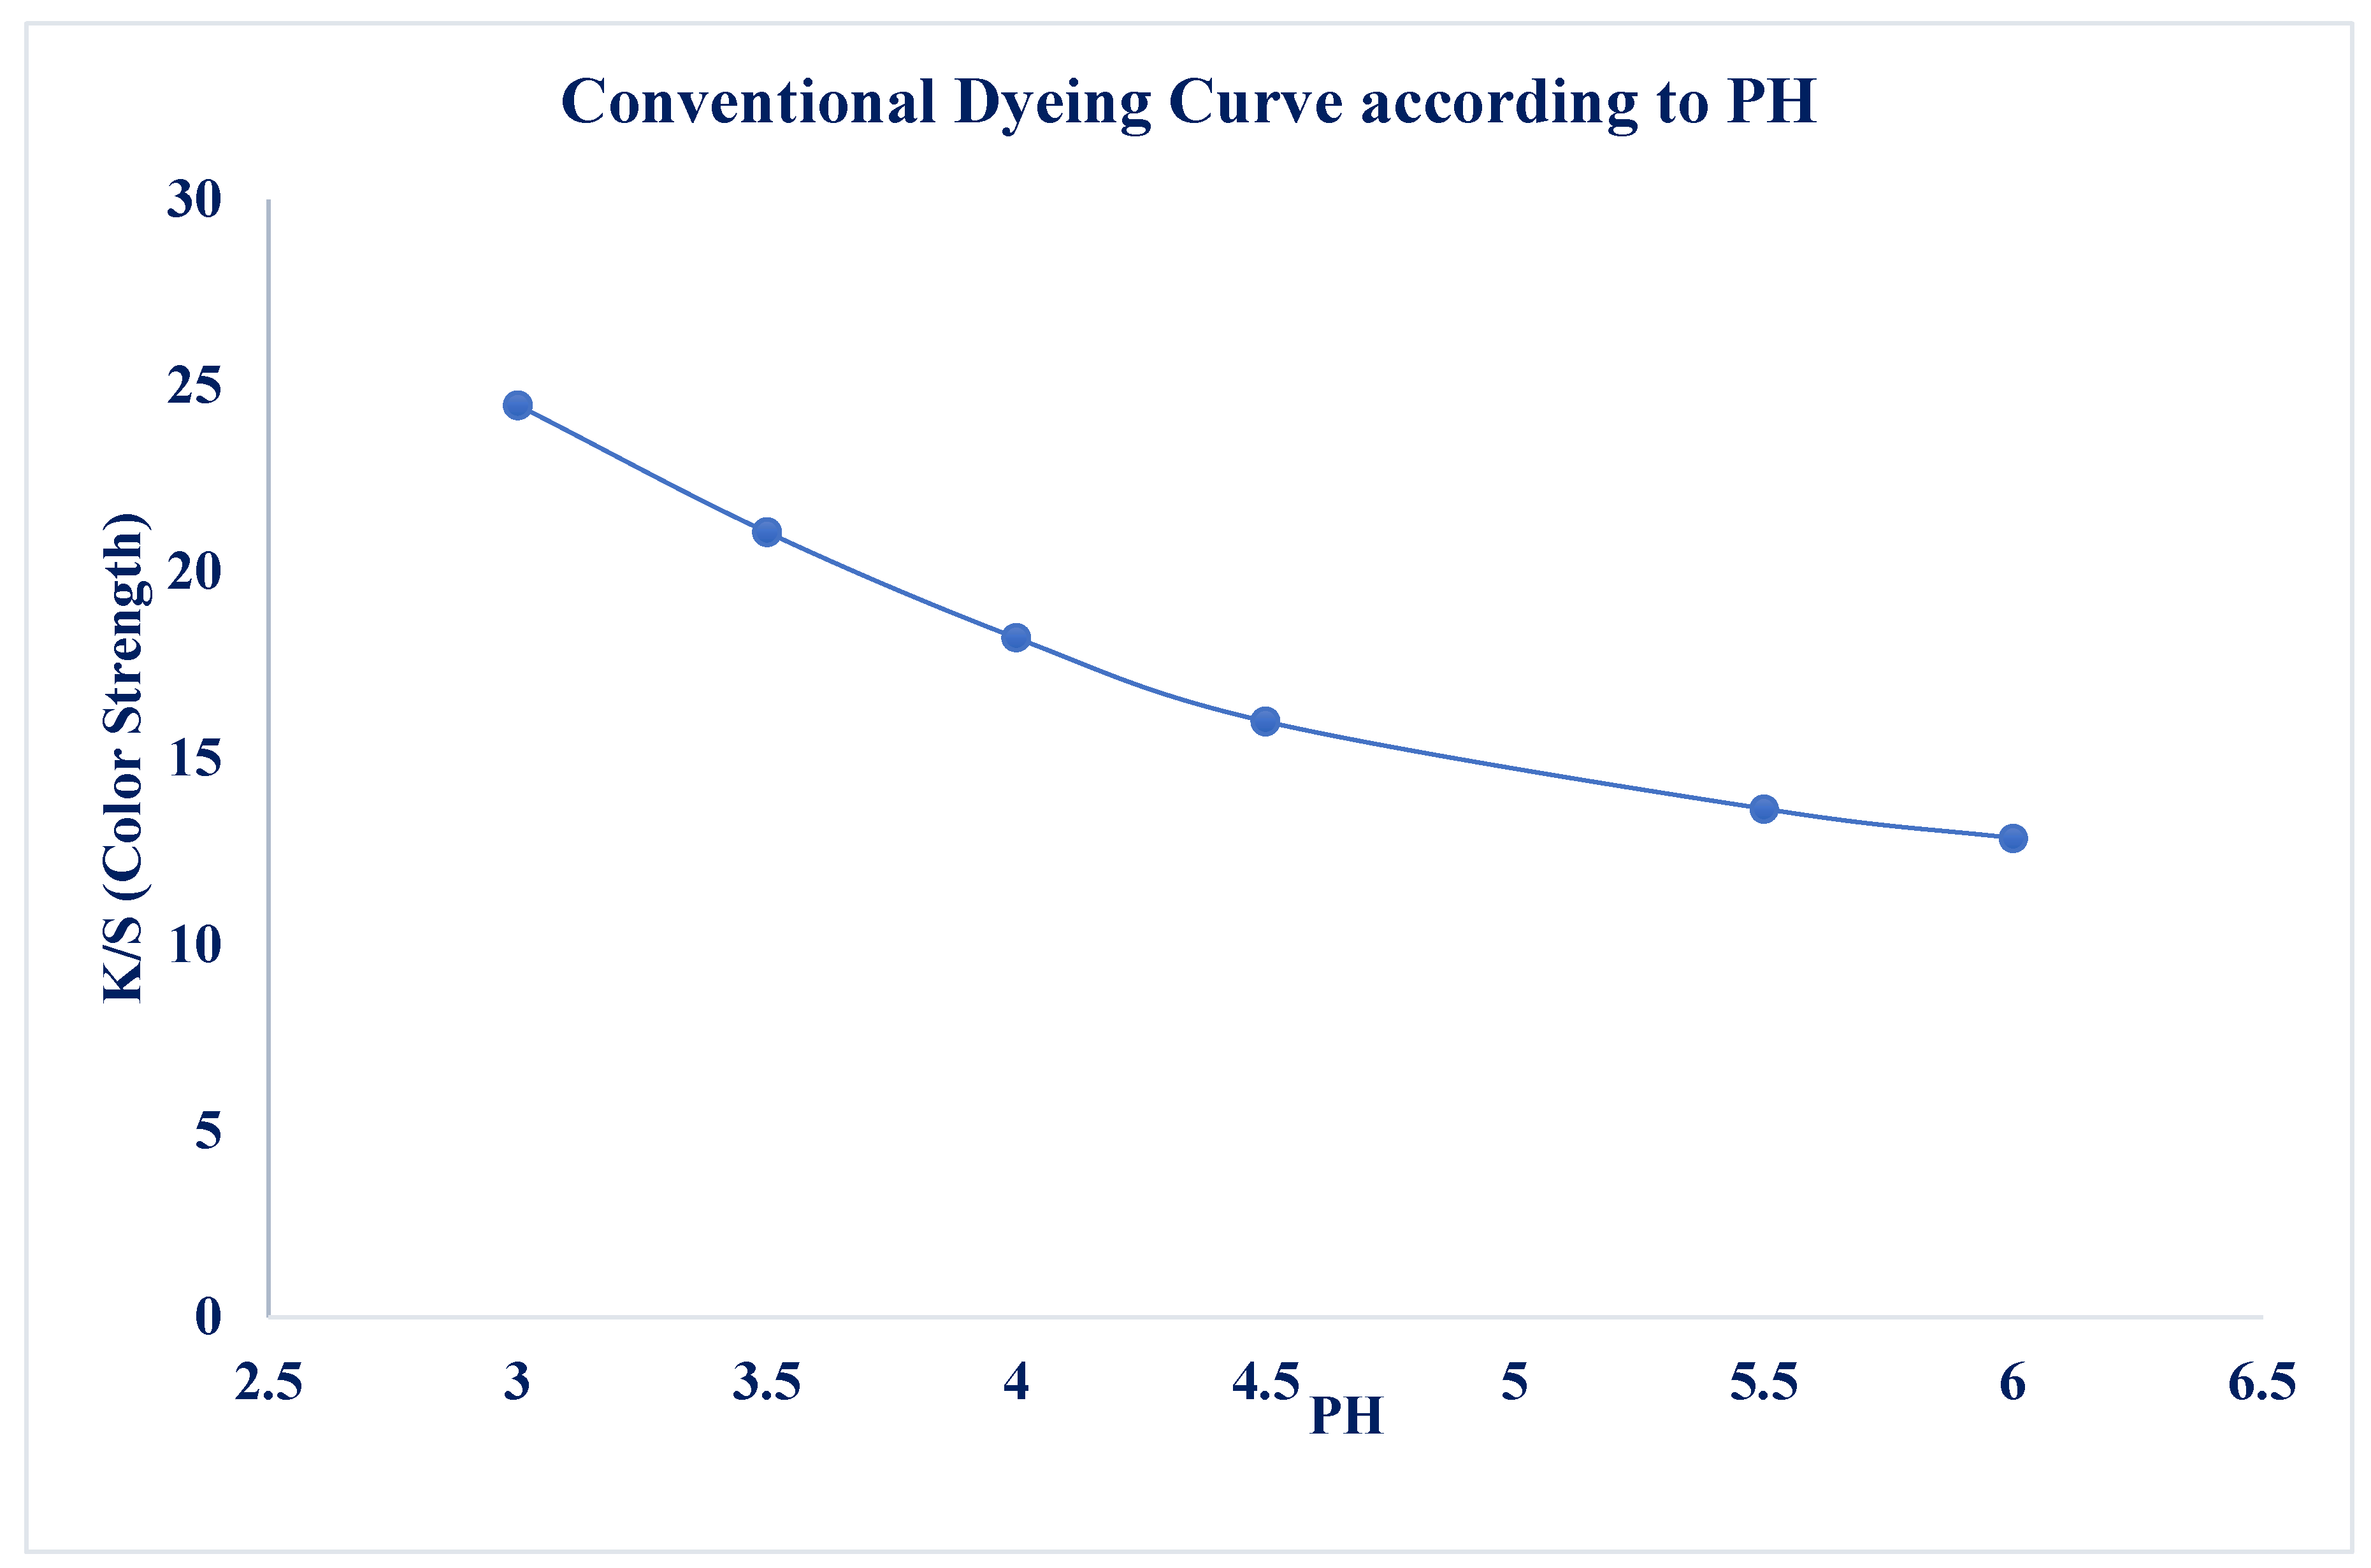
Figure 3.
Time and Temperature-dependent color strength (K/S) profiles for Conventional Heating.
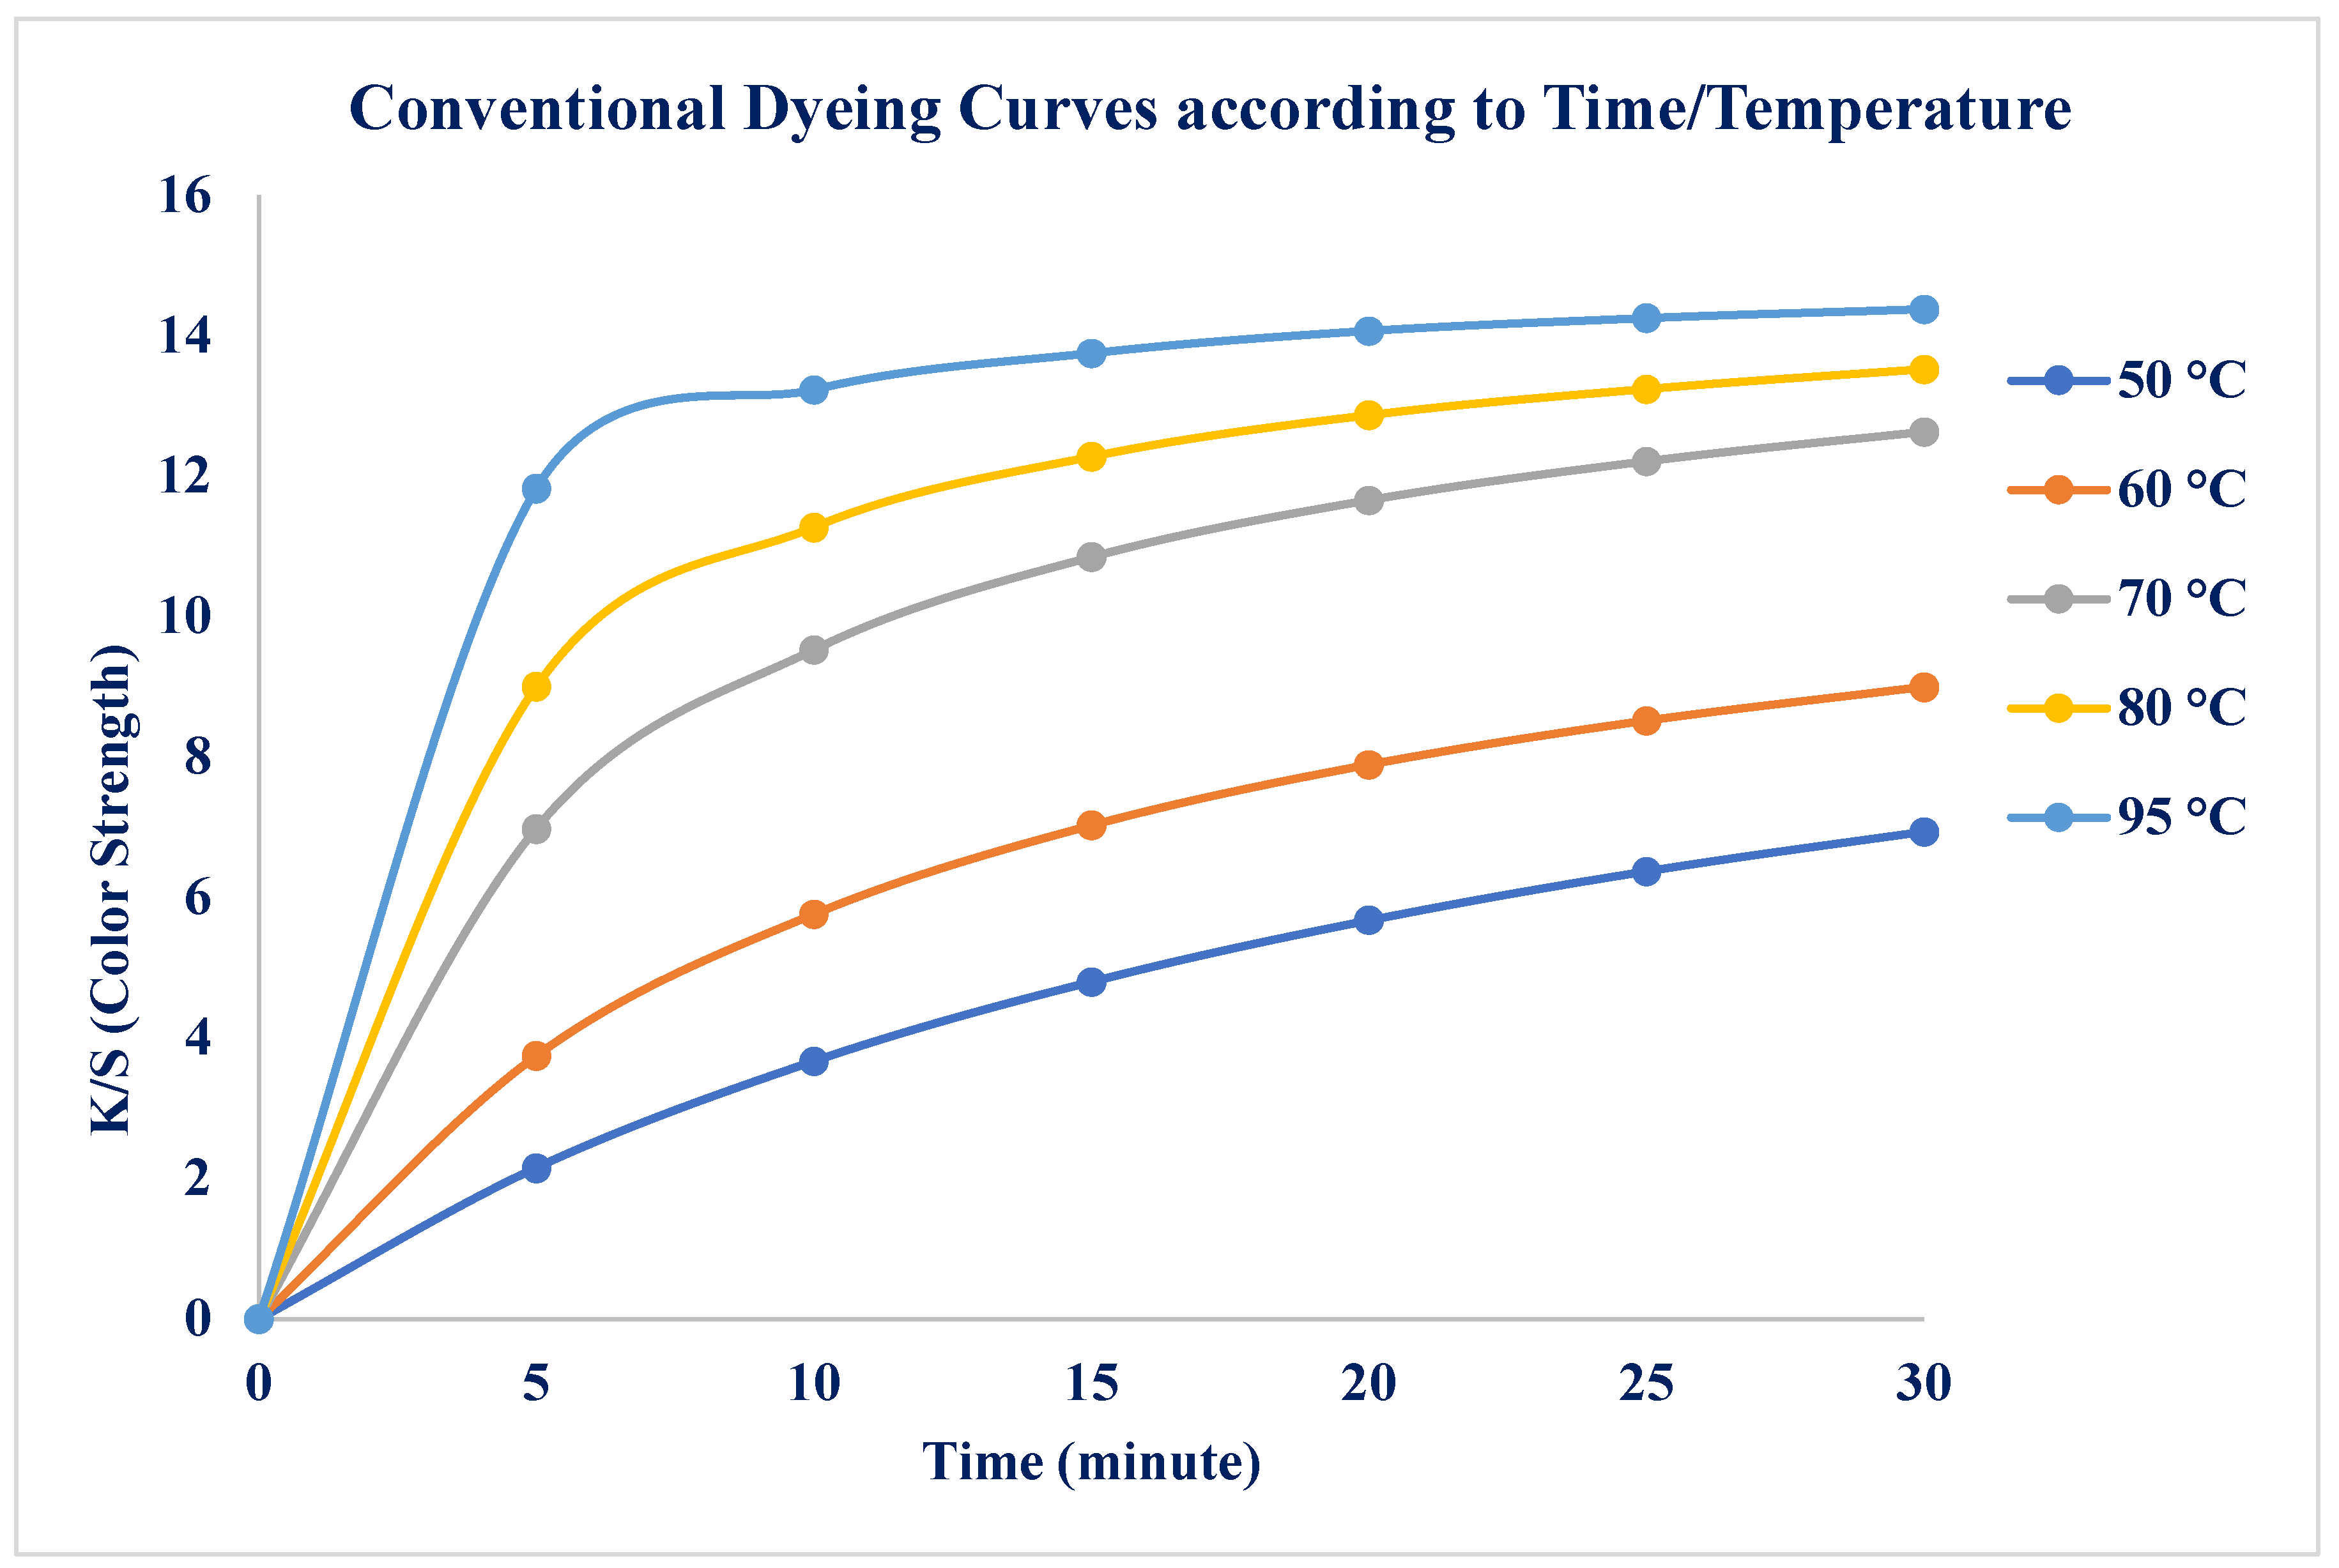
Figure 4.
Time and Temperature-dependent concentration profiles for Conventional Heating.
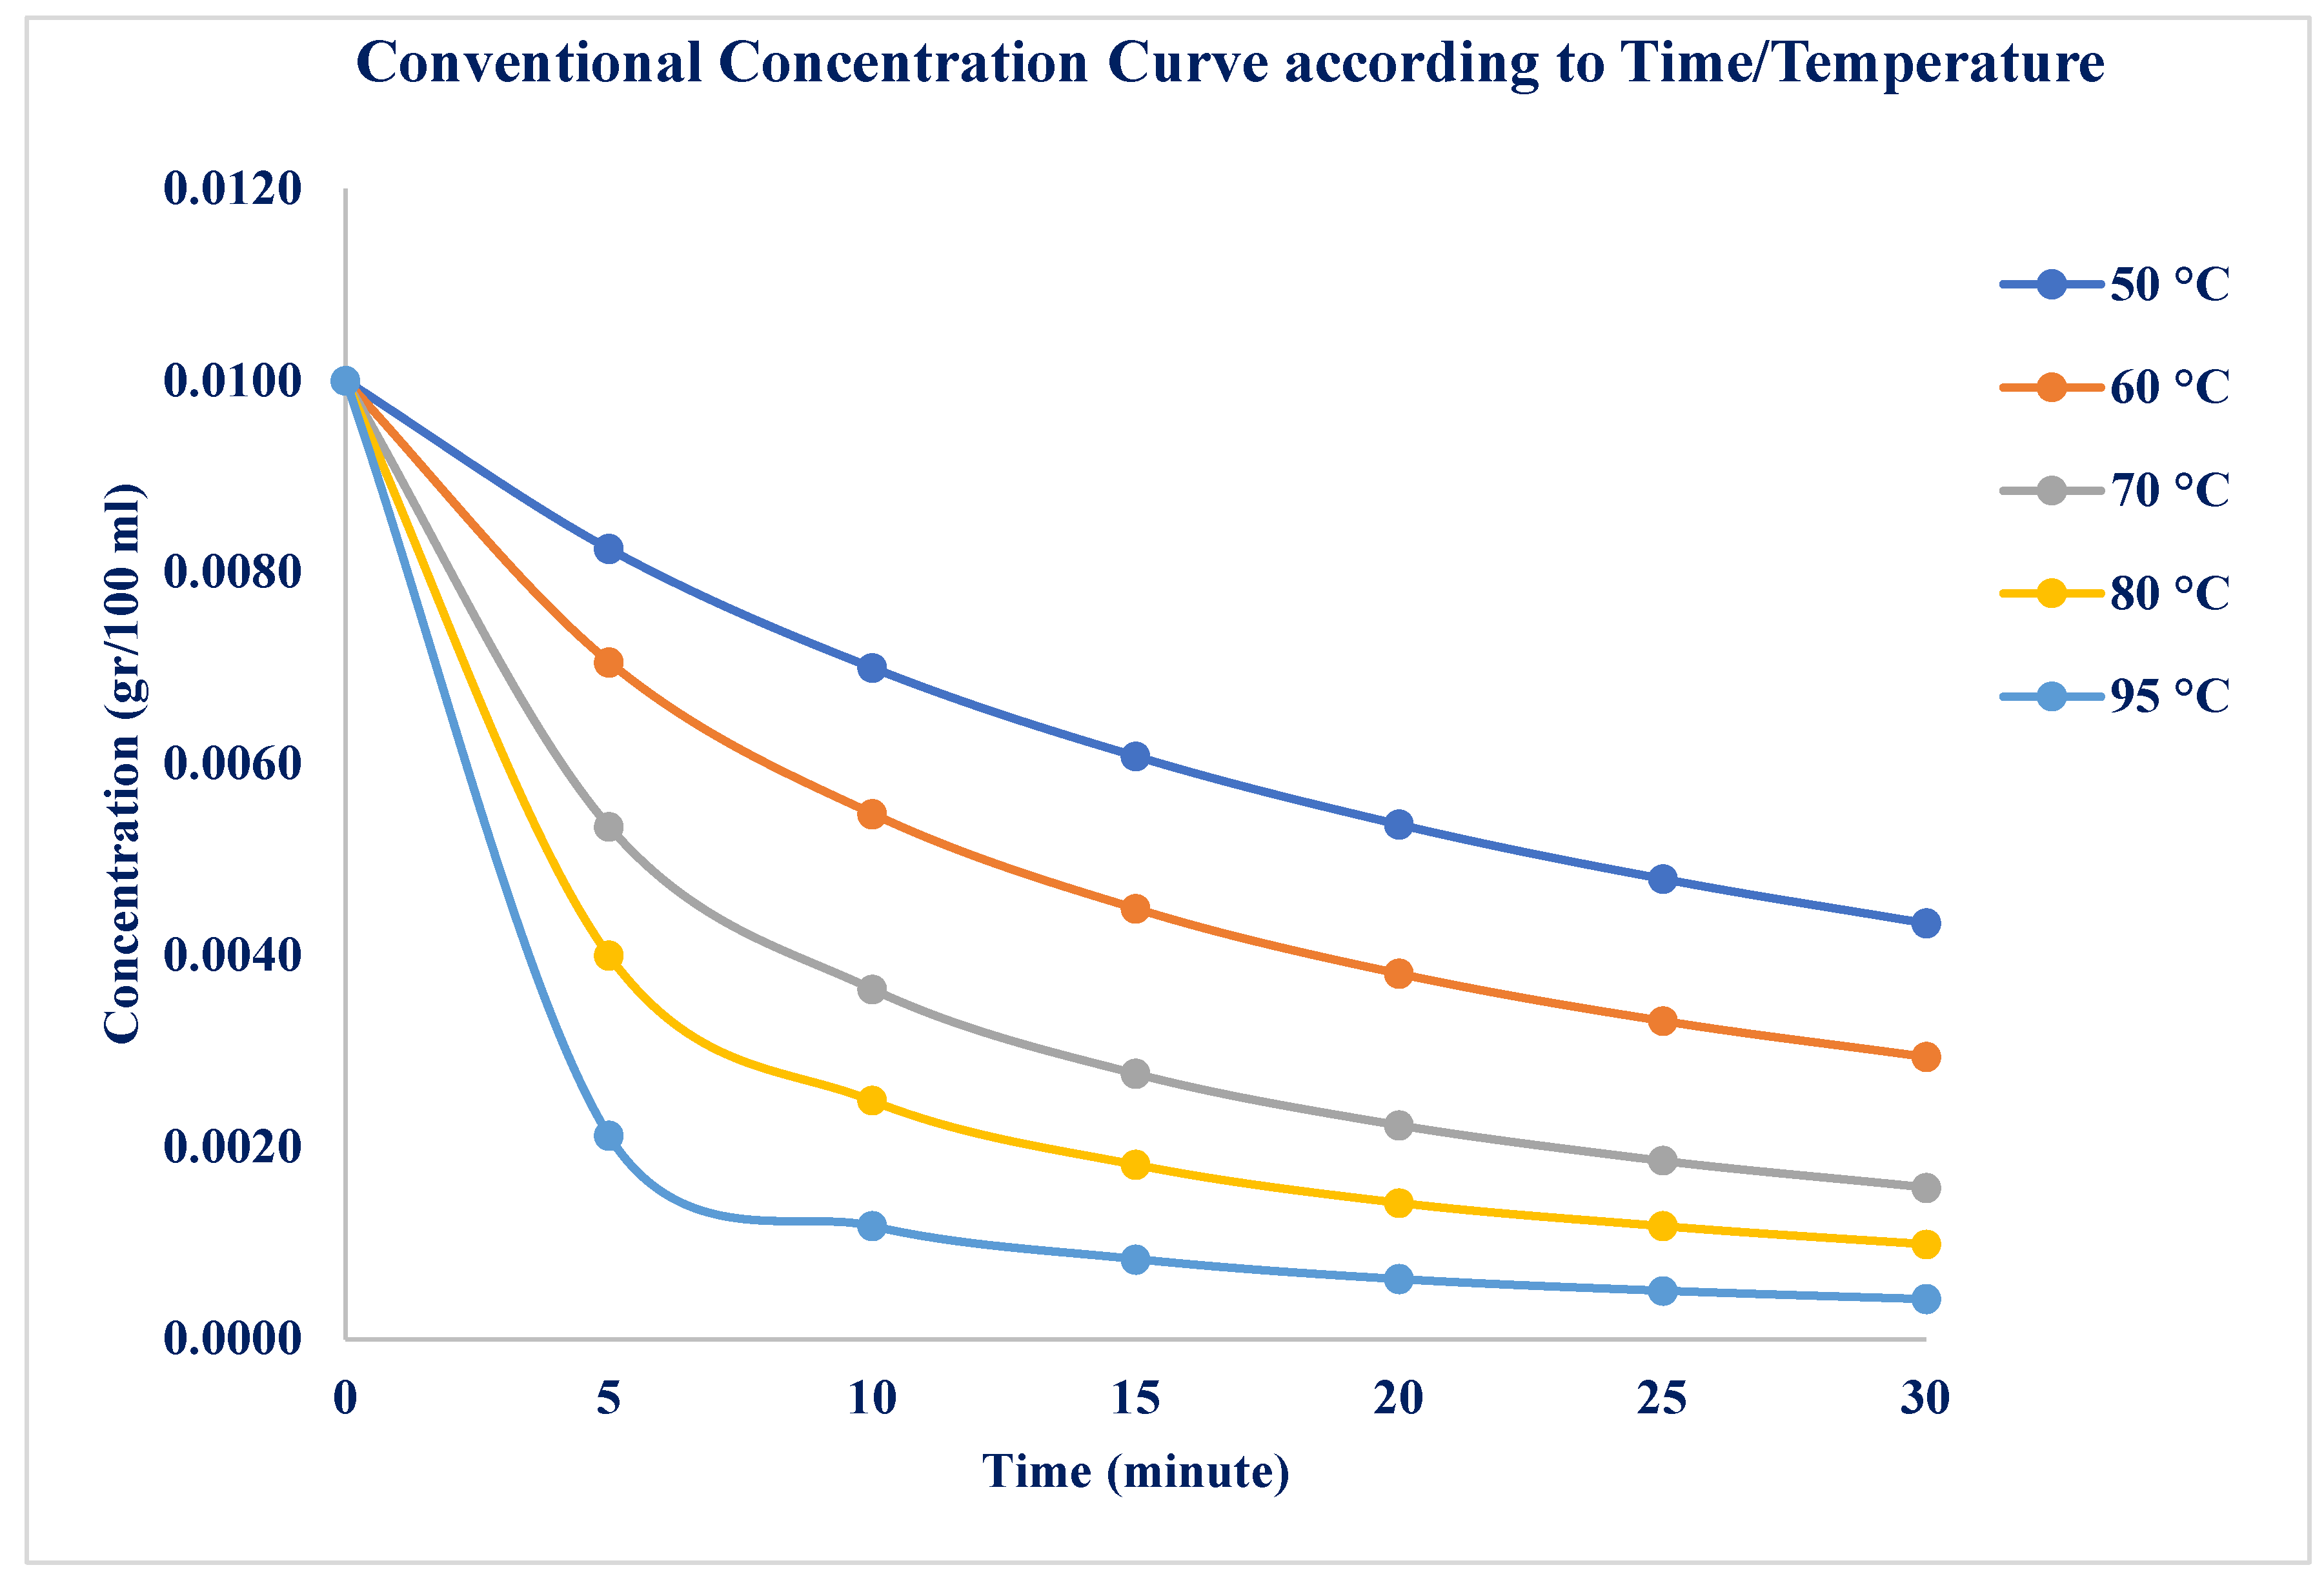
Figure 5.
Dye Concentration-dependent color strength (K/S) profiles for Conventional Heating.
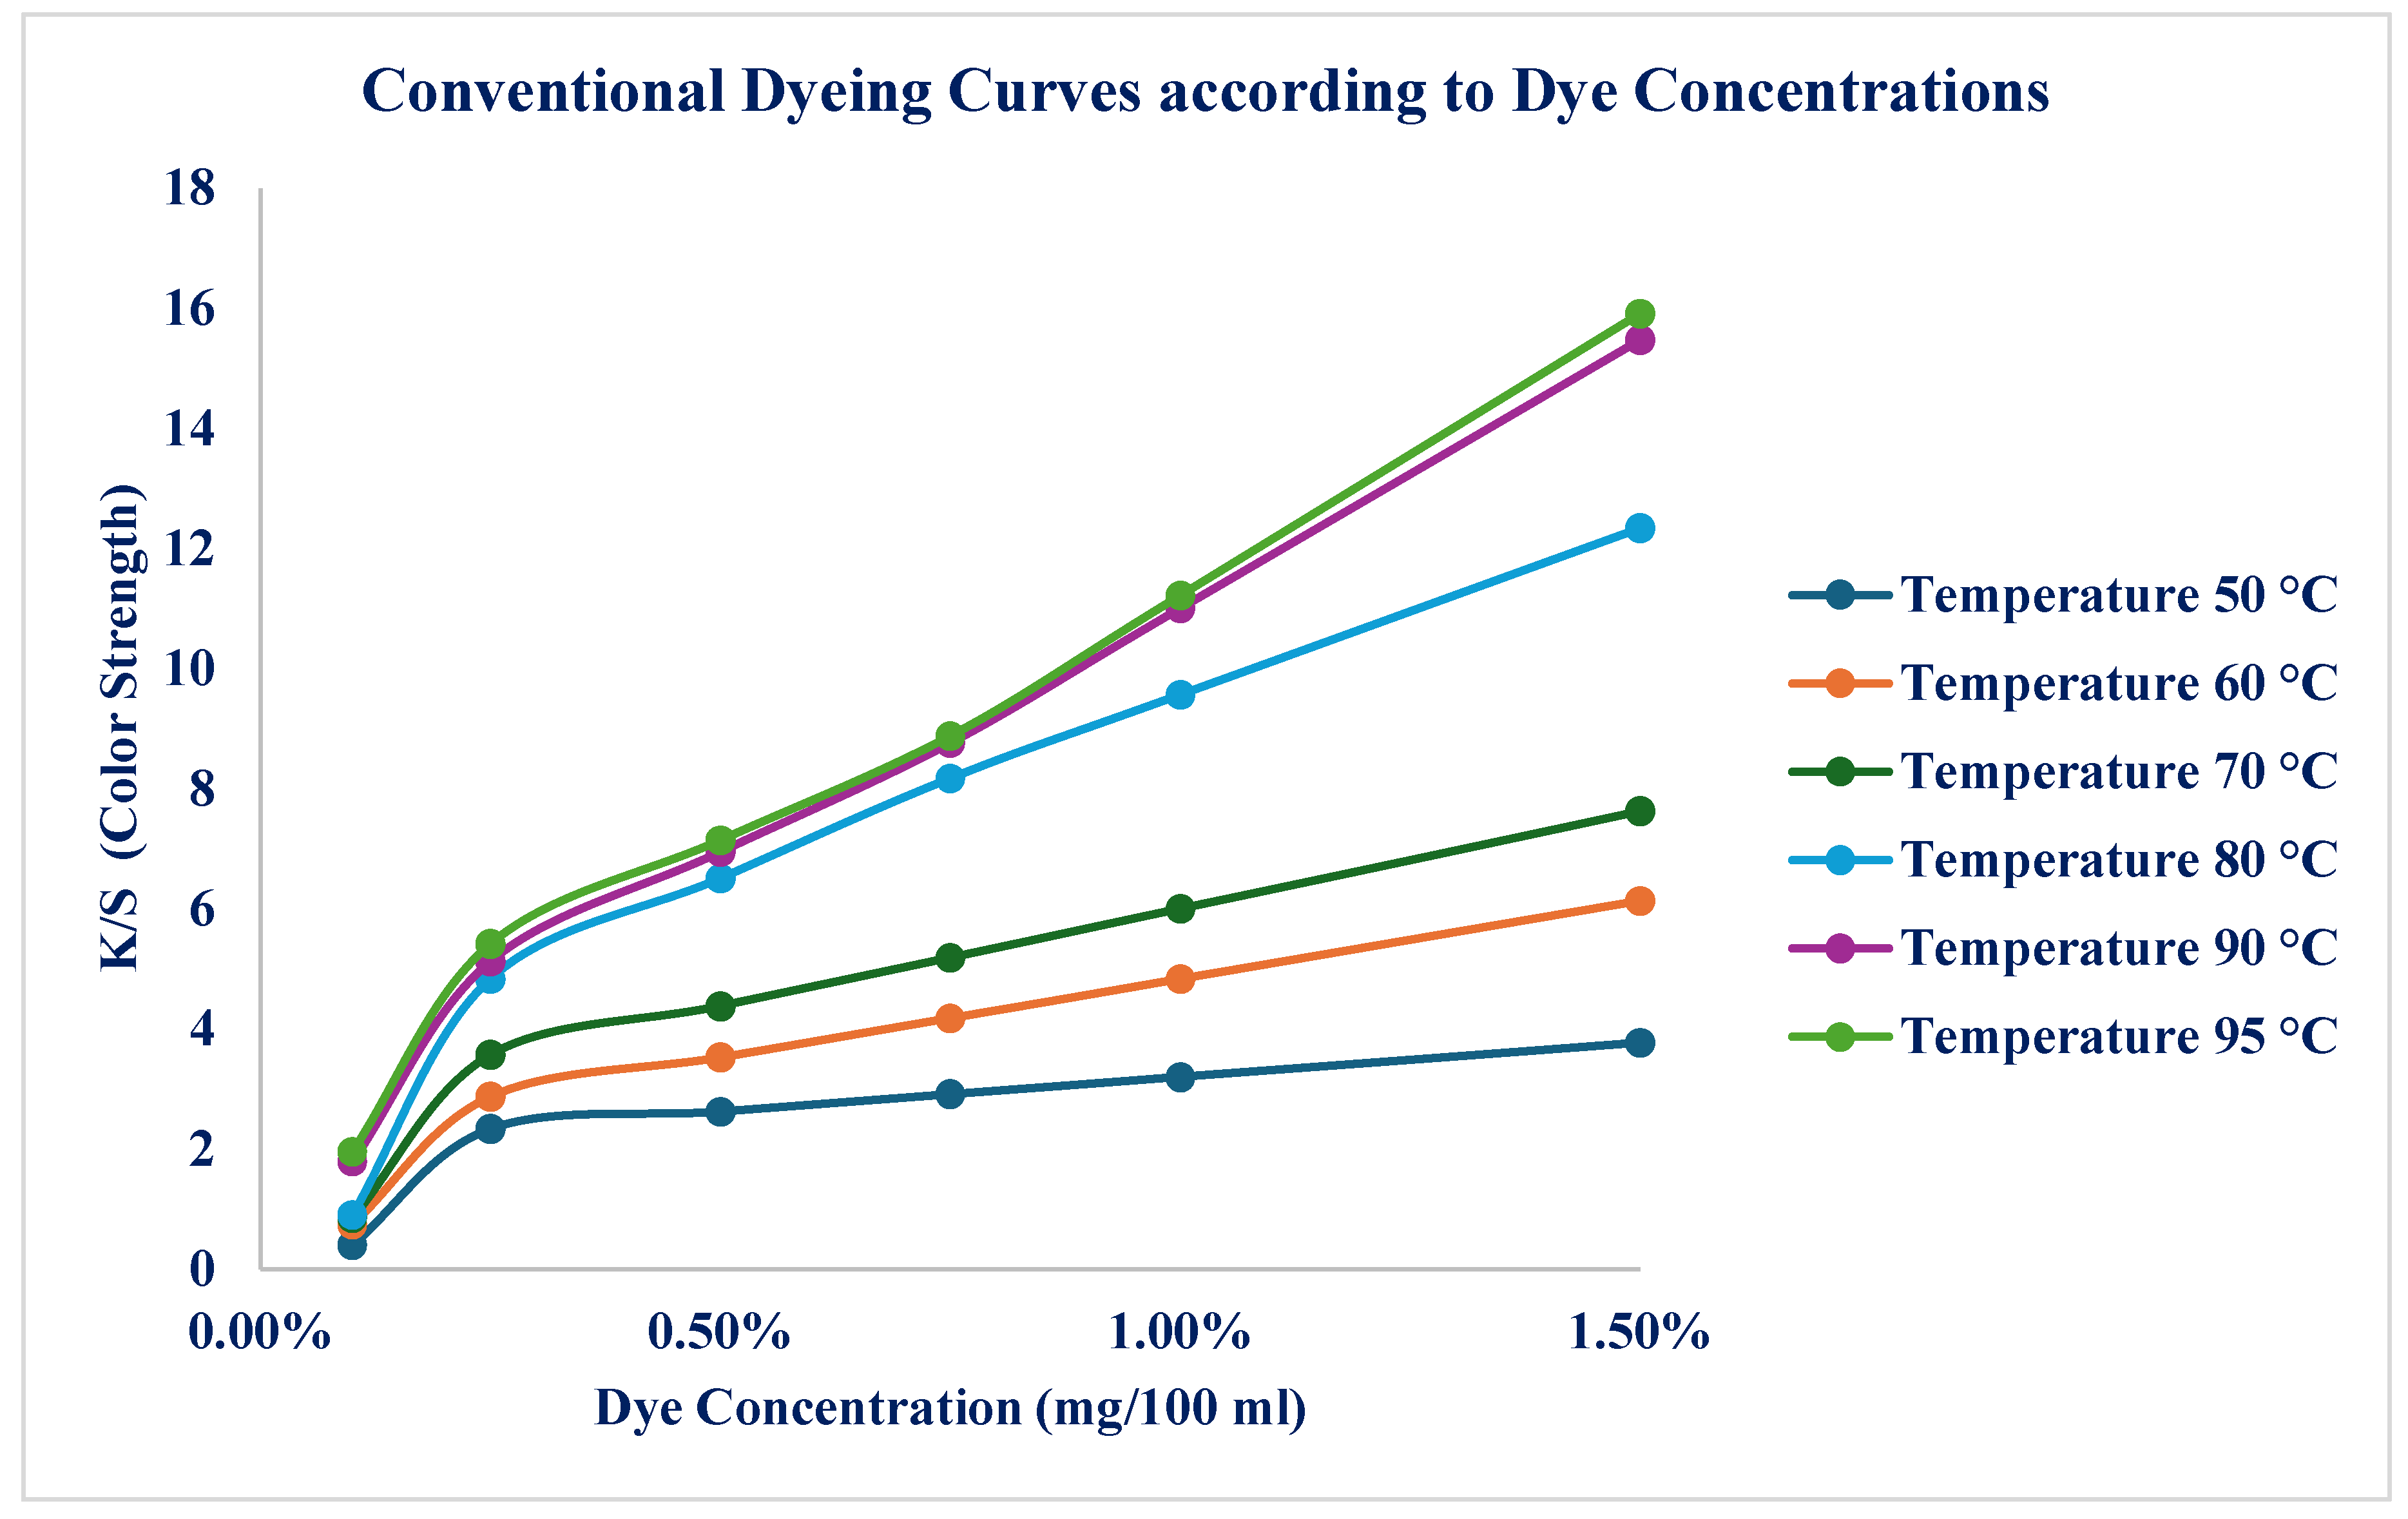
Figure 6.
Temperature-dependent Color Strength (K/S) profiles for Conventional Heating.
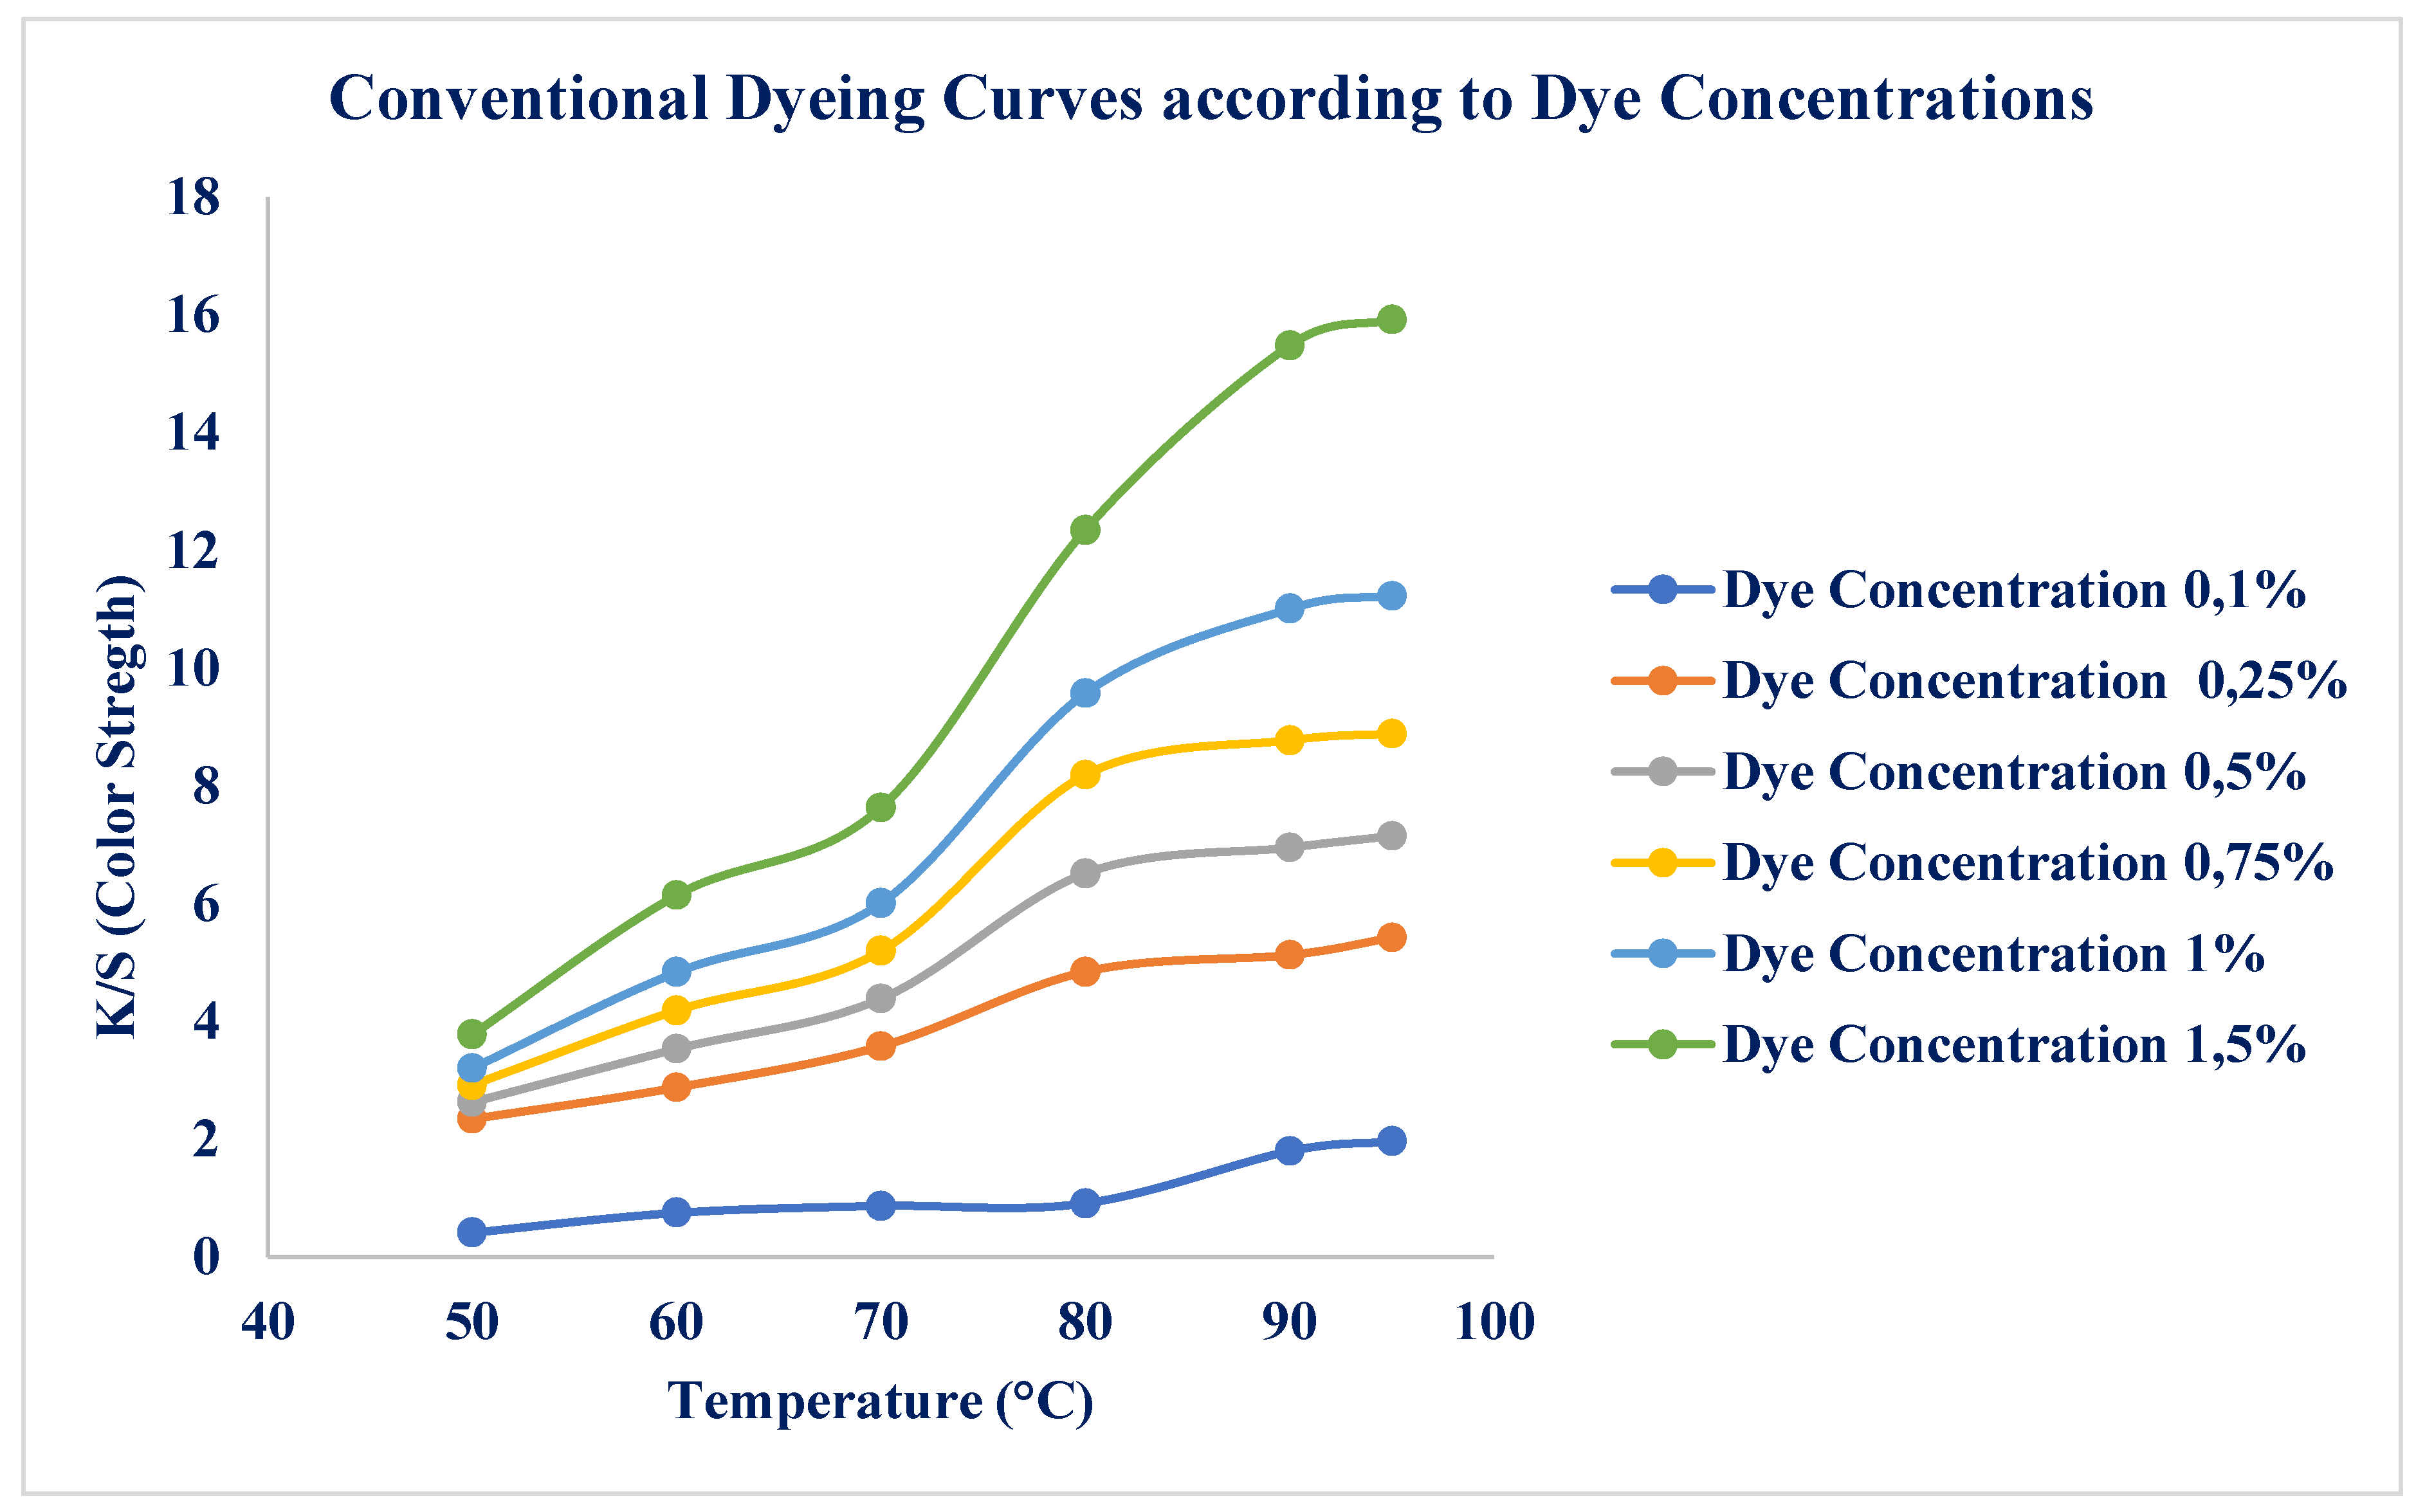
Figure 7.
pH-dependent color strength (K/S) profiles for Microwave Heating.
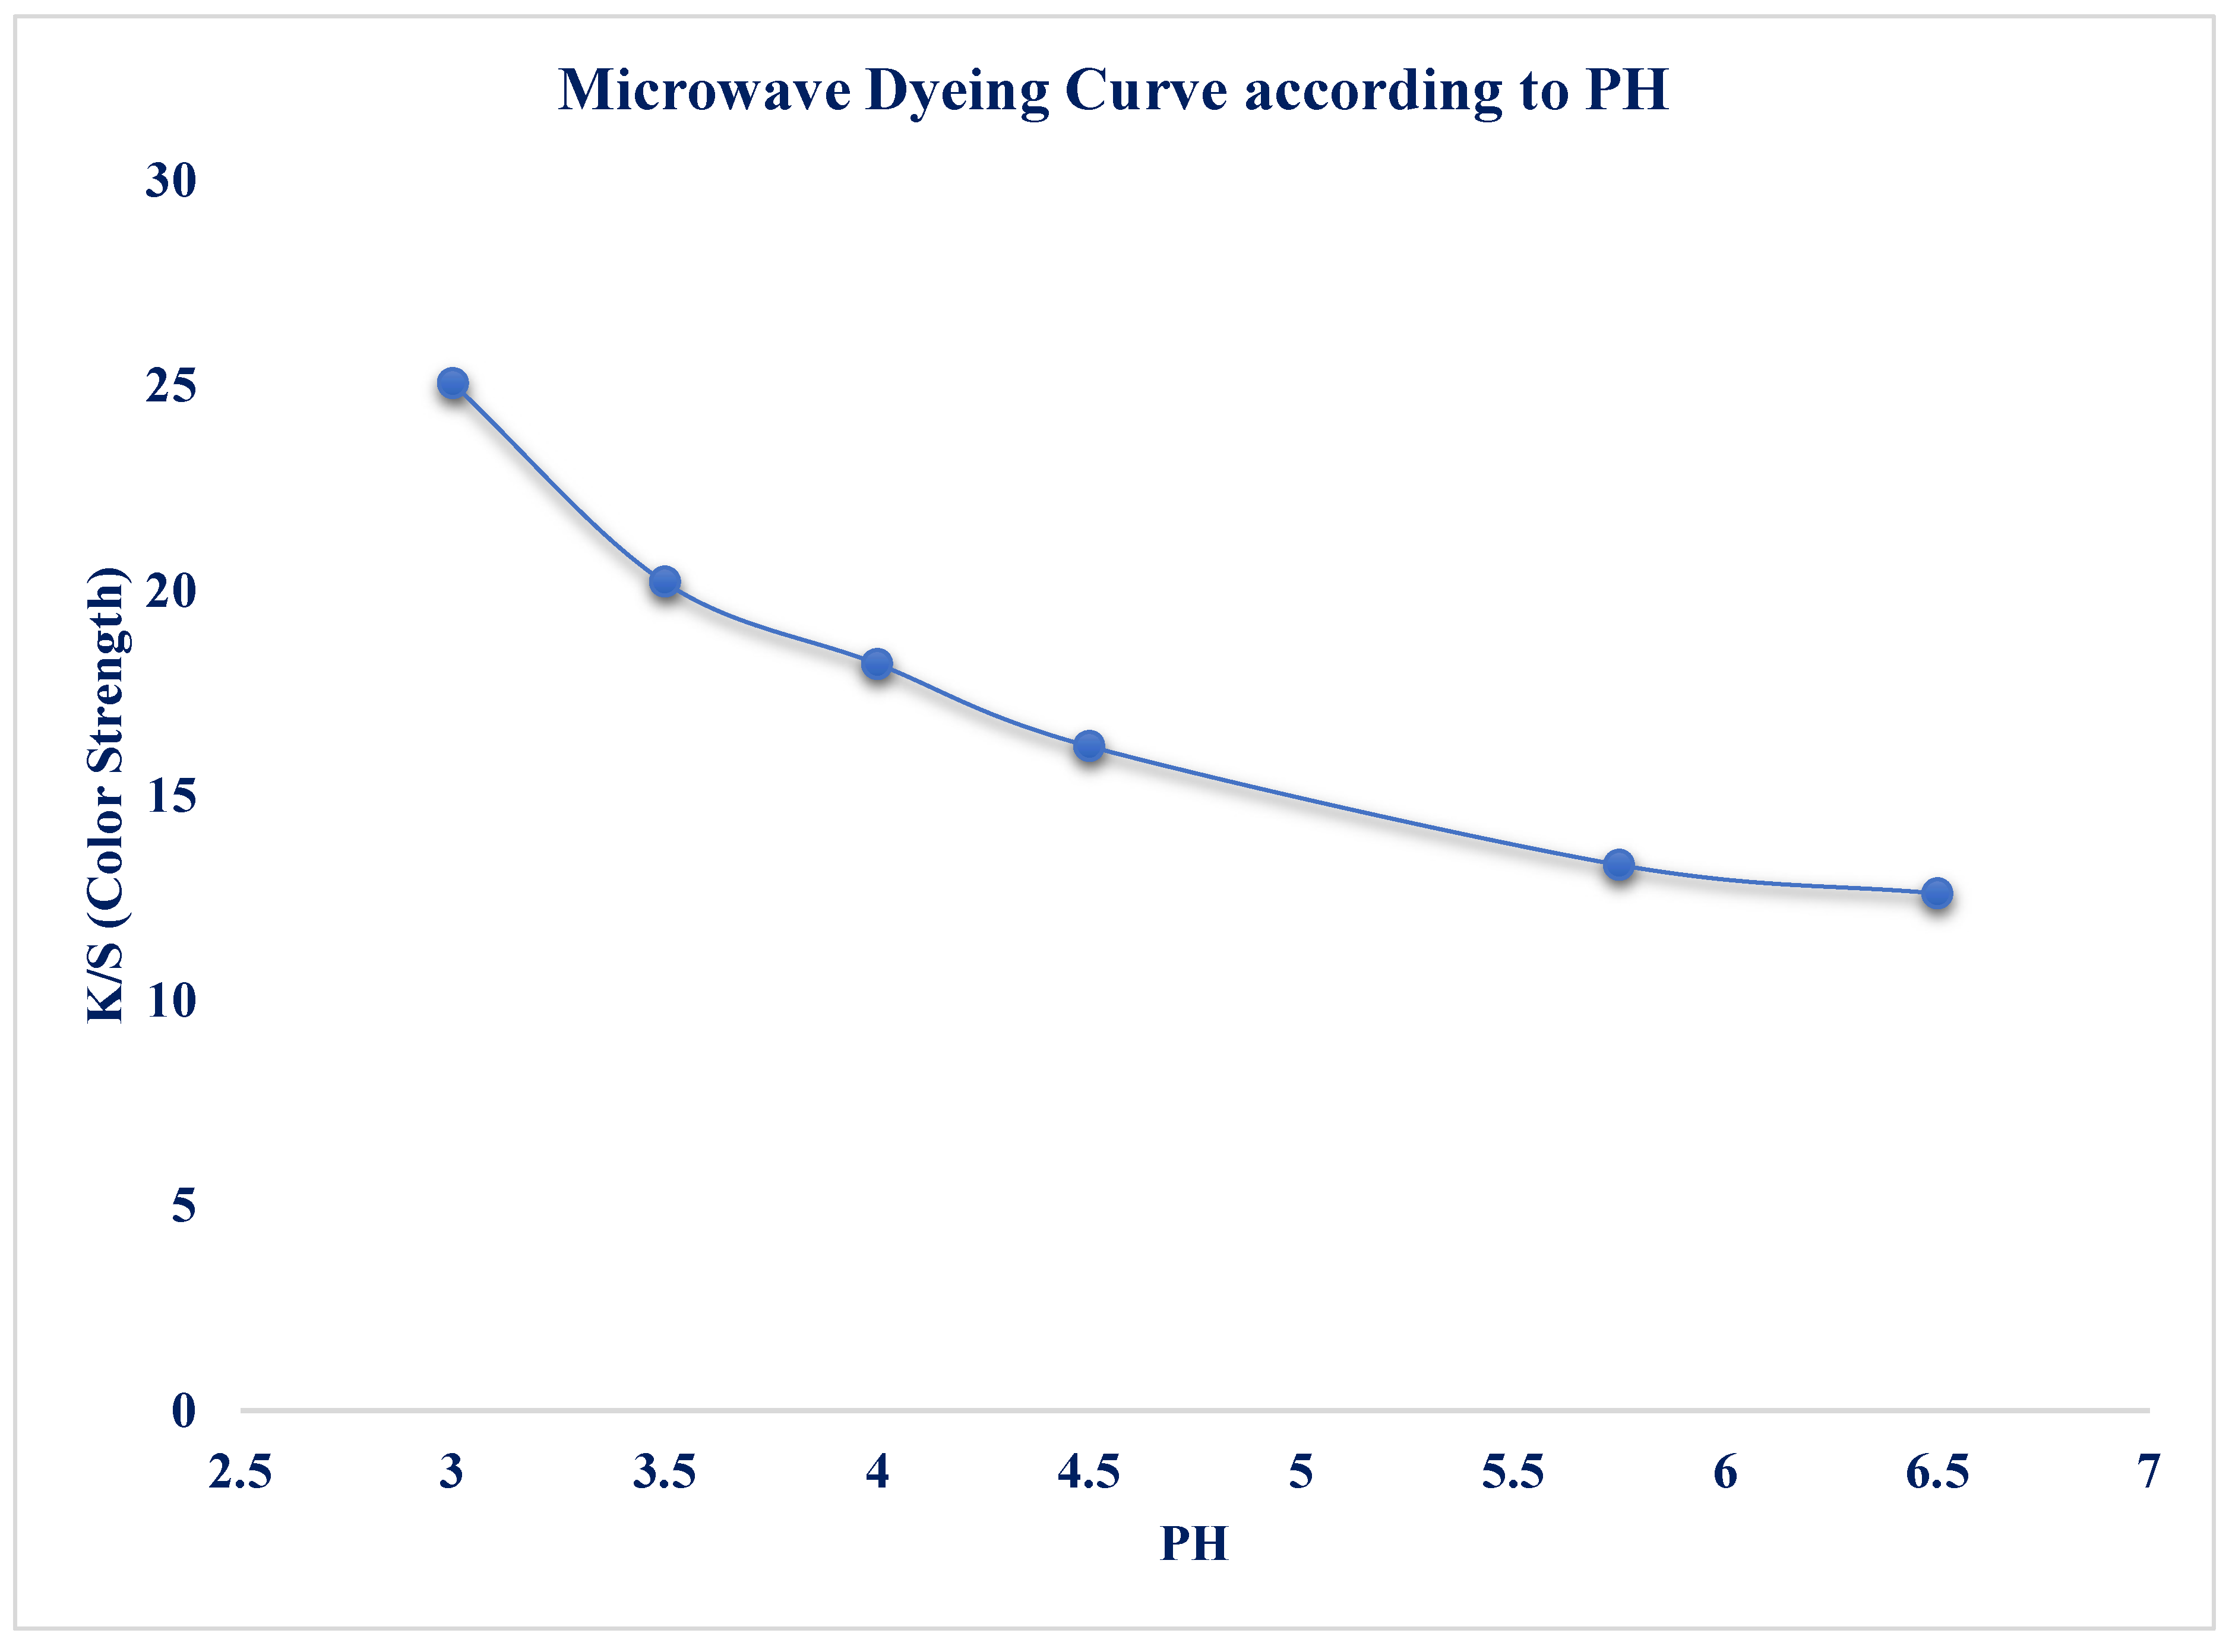
Figure 8.
Time and Temperature-dependent color strength (K/S) profiles for Microwave Heating.
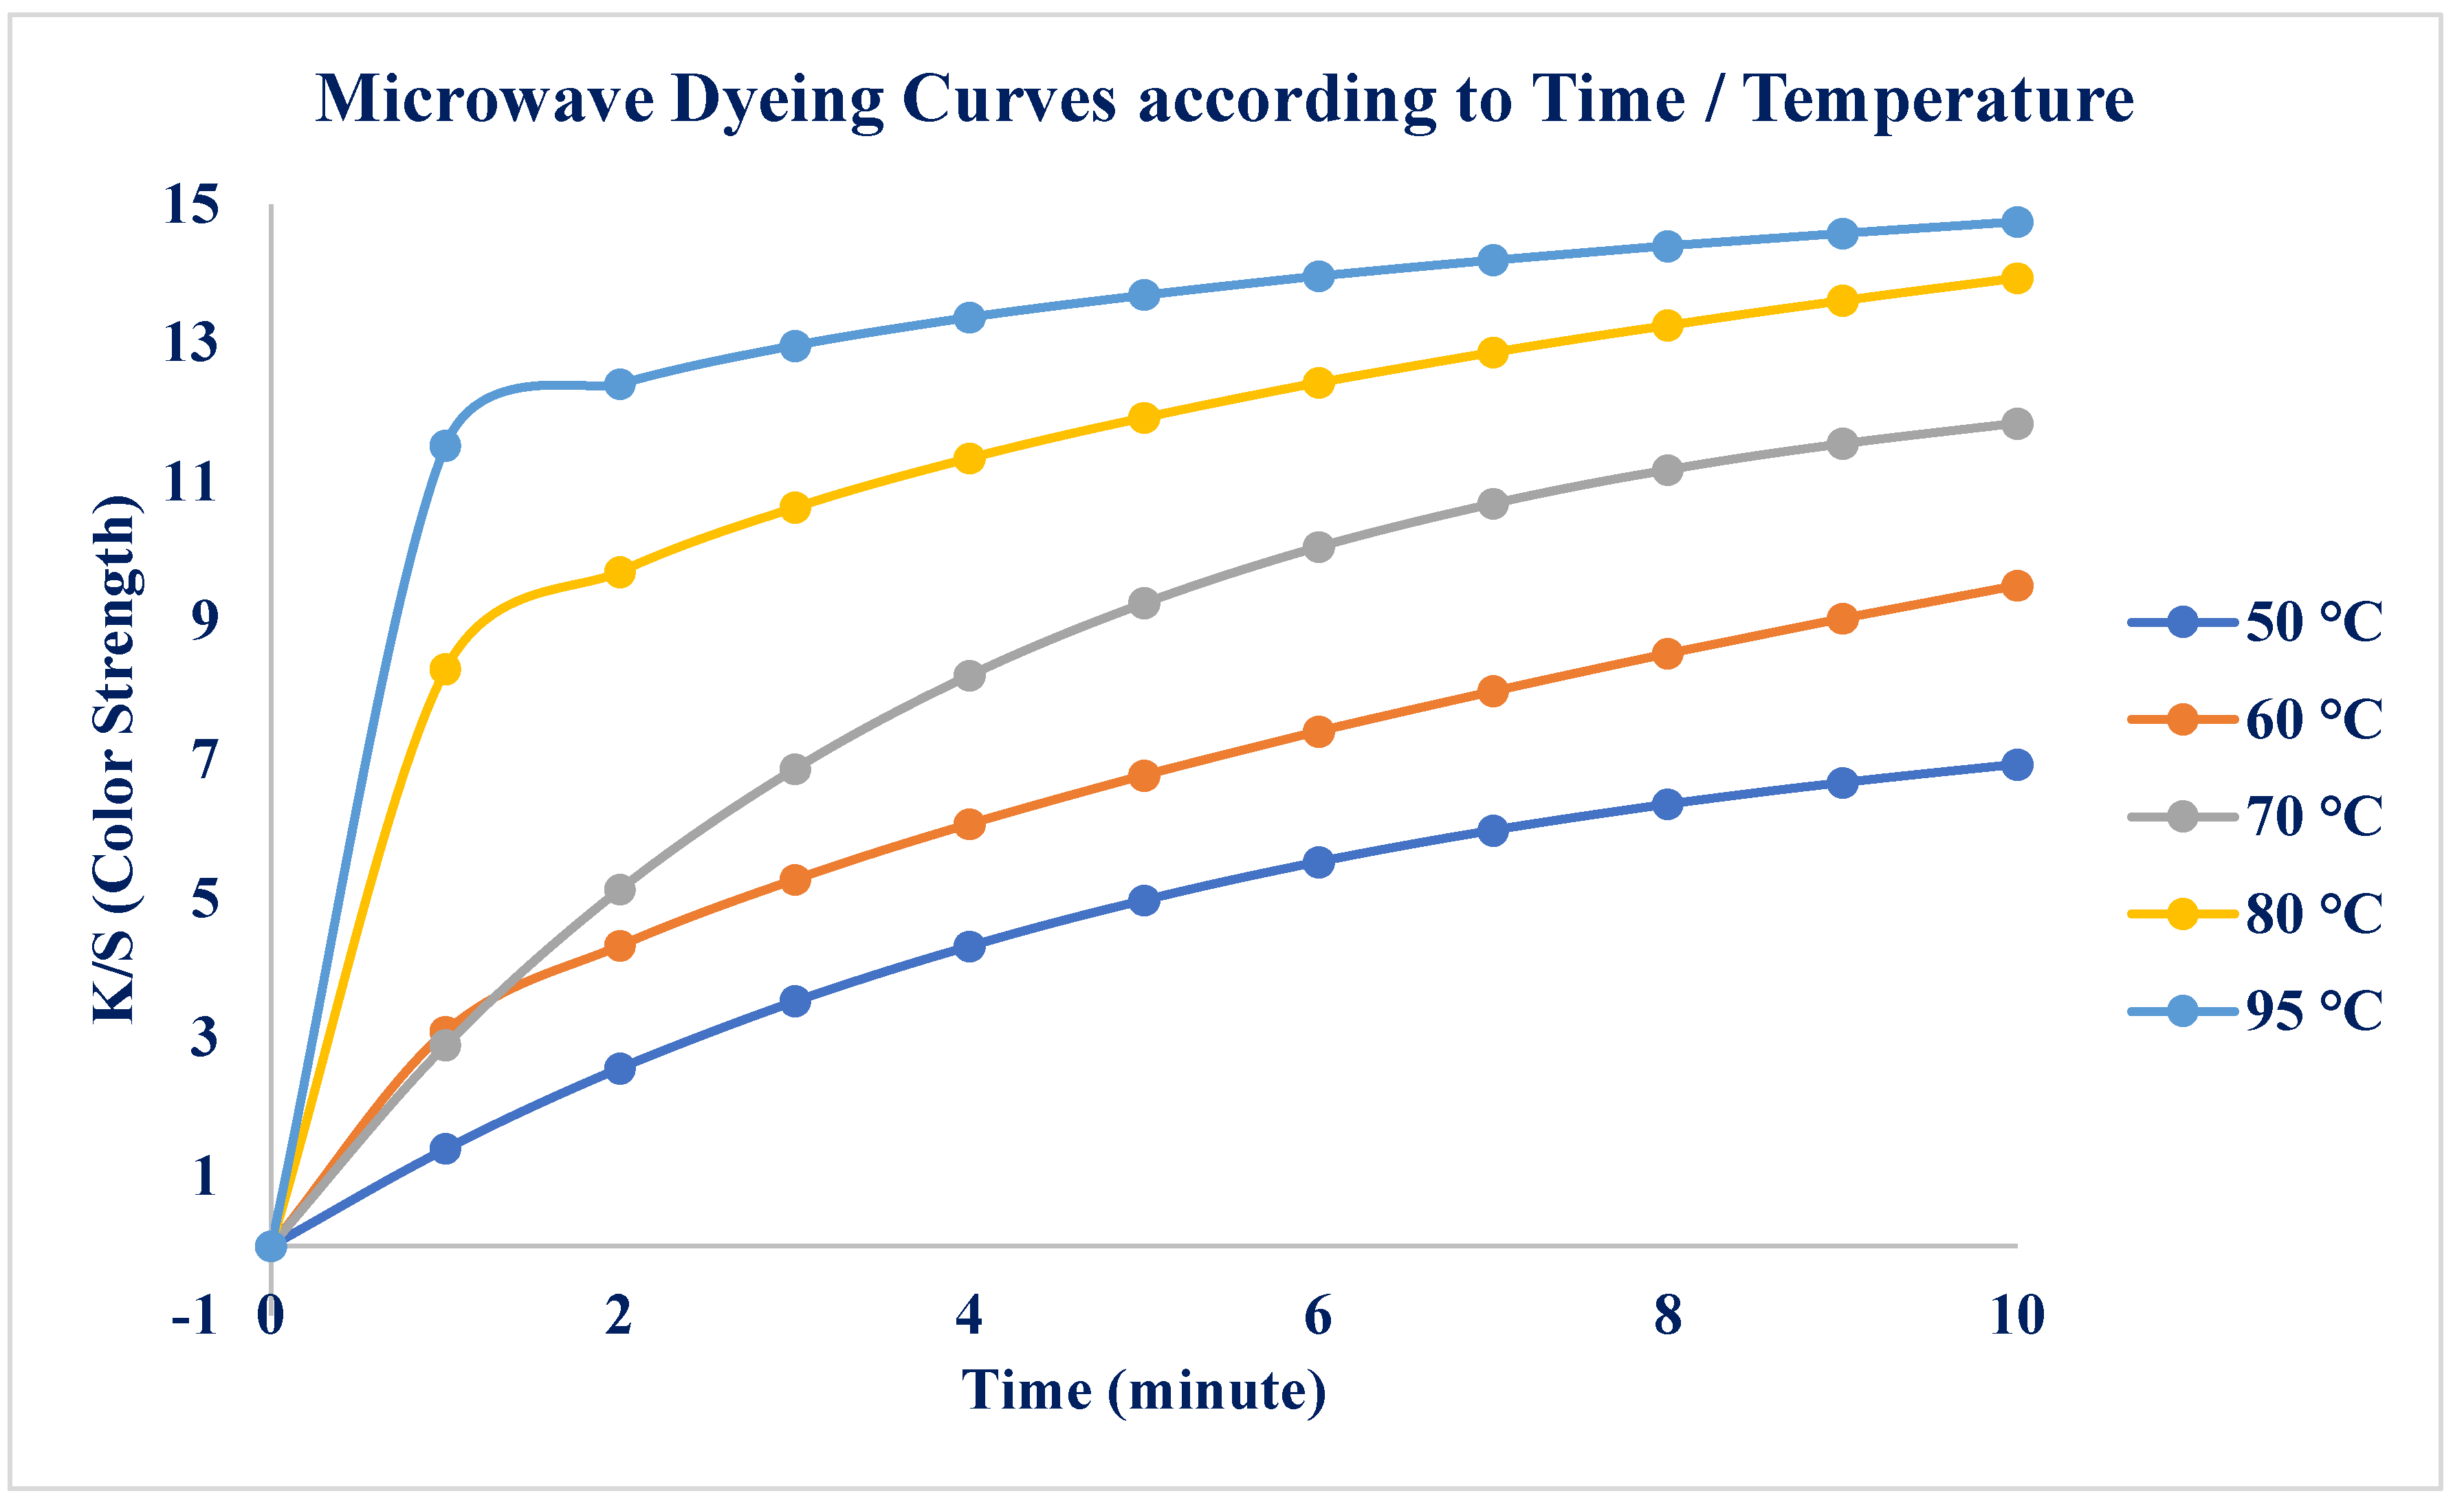
Figure 9.
Time and Temperature-dependent concentration profiles for Microwave Heating.
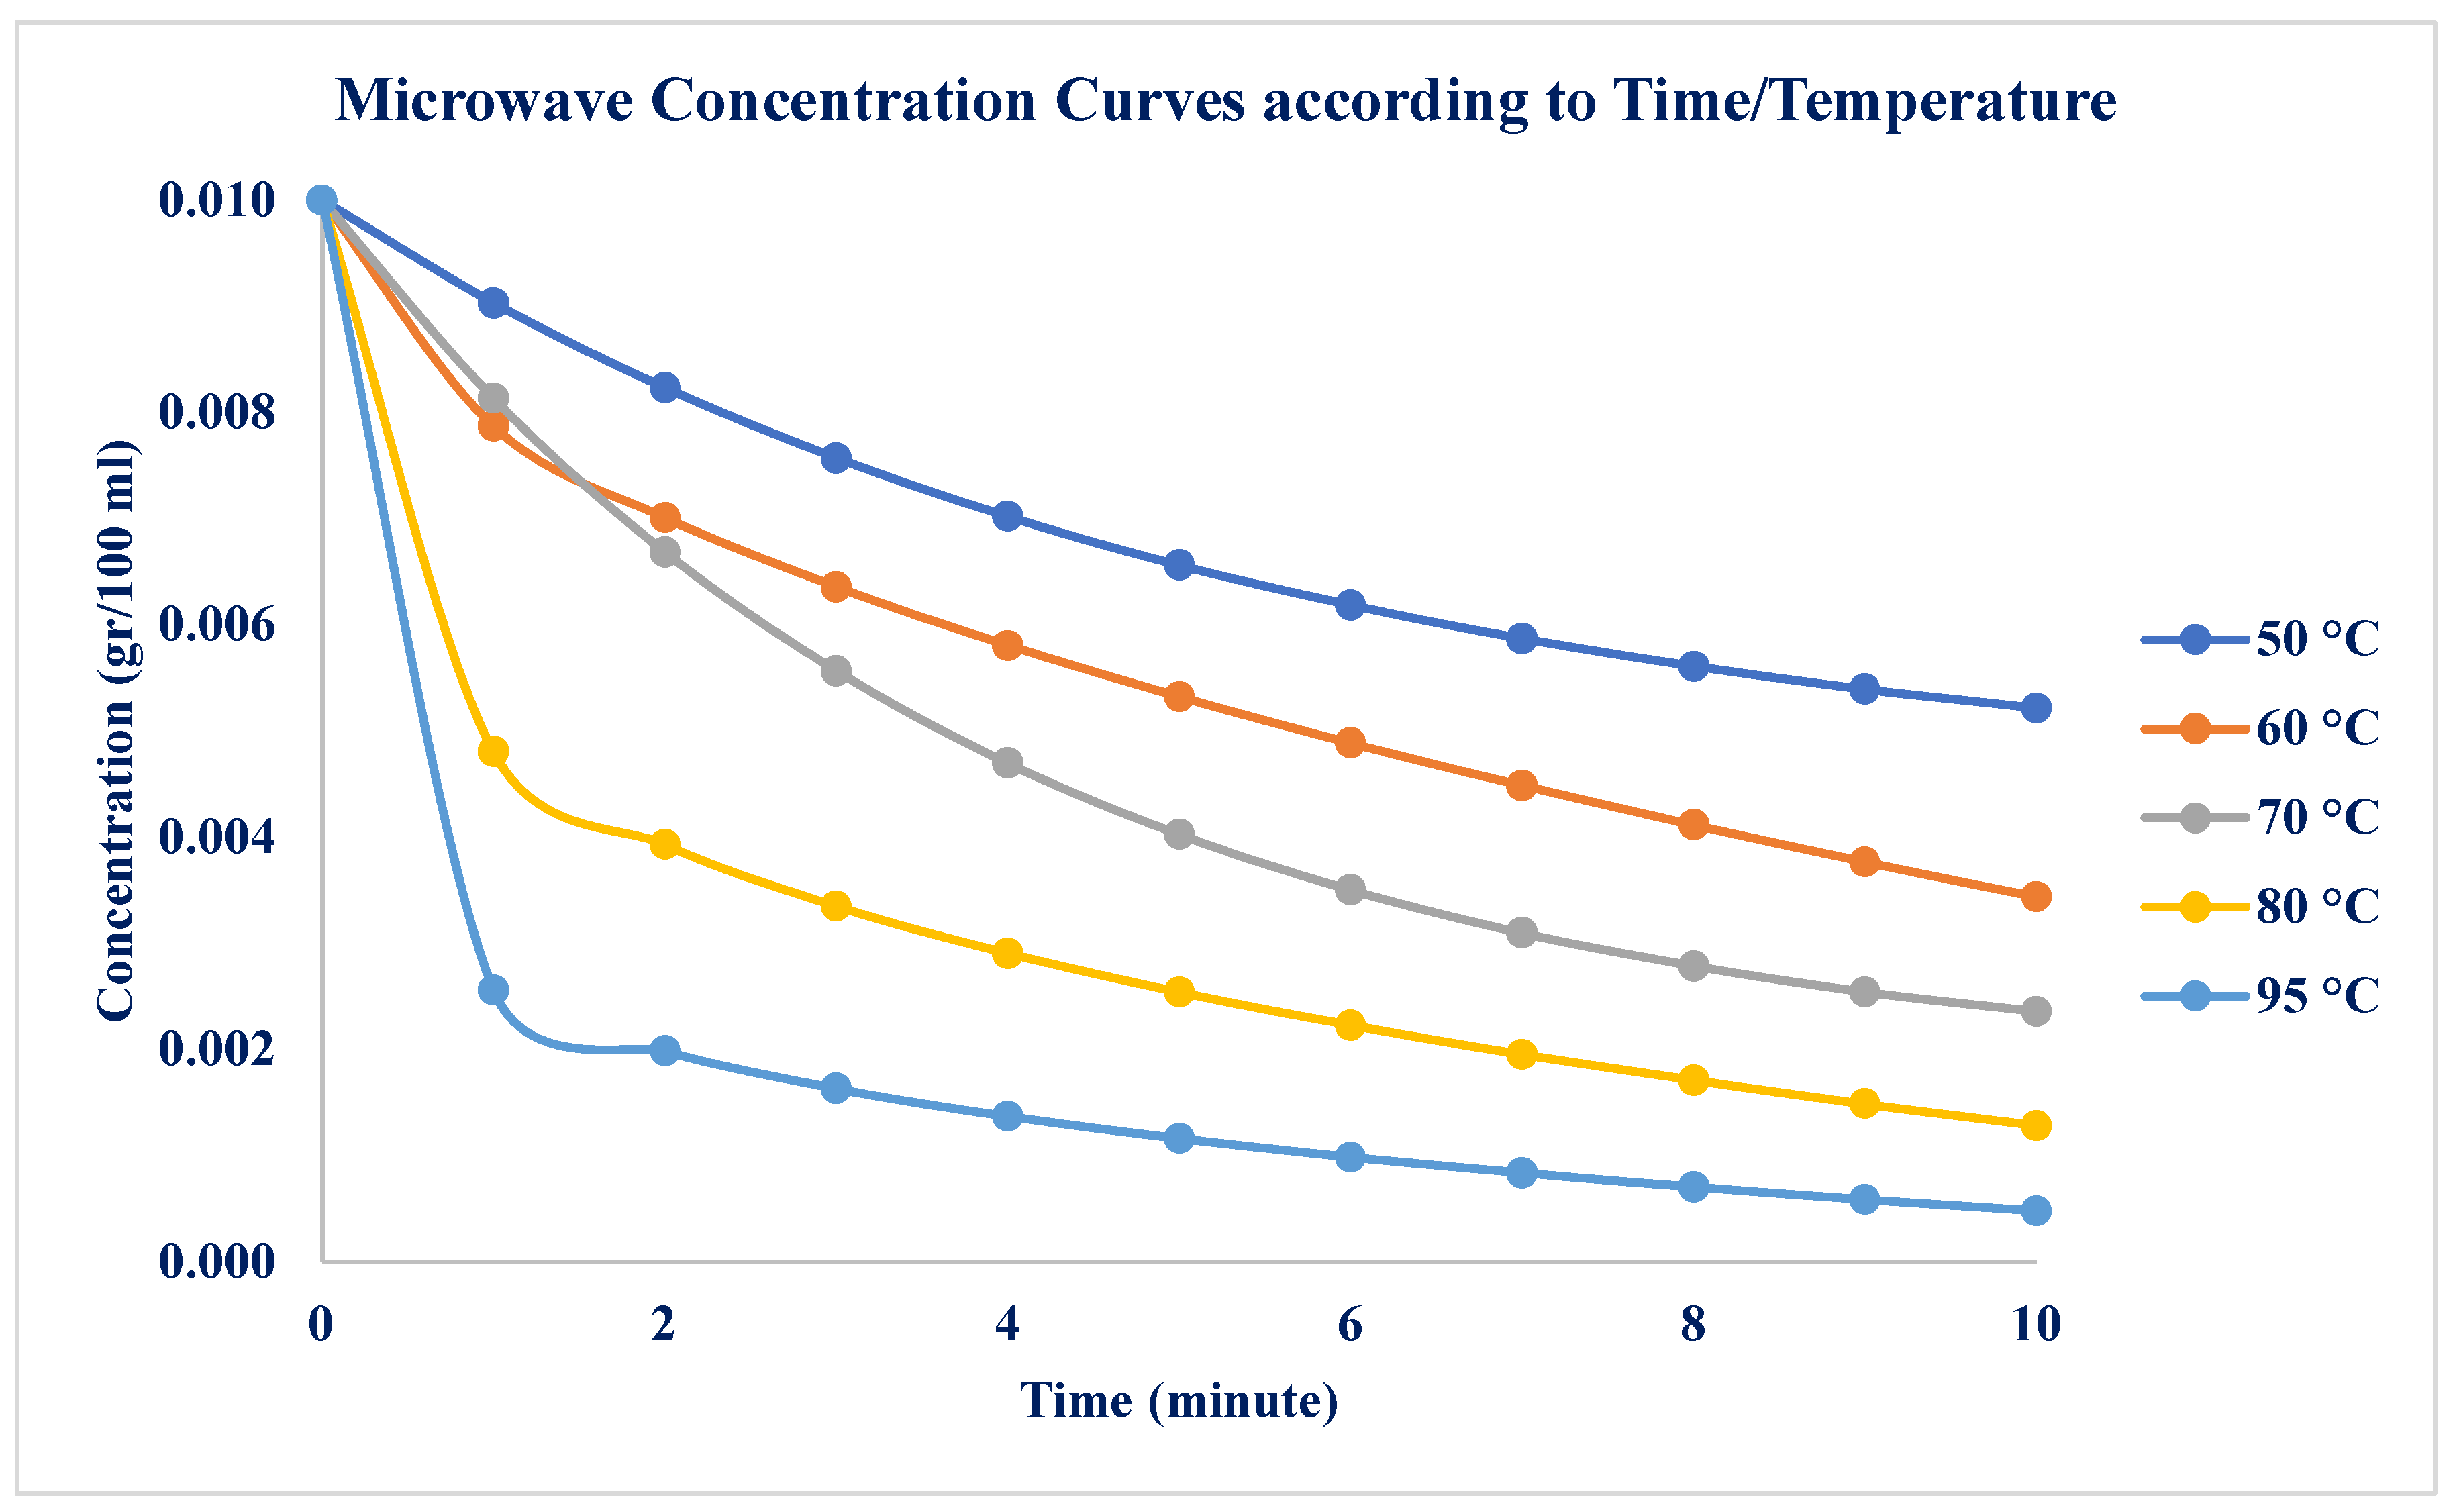
Figure 10.
Dye Concentration-dependent color strength (K/S) profiles for Microwave Heating.
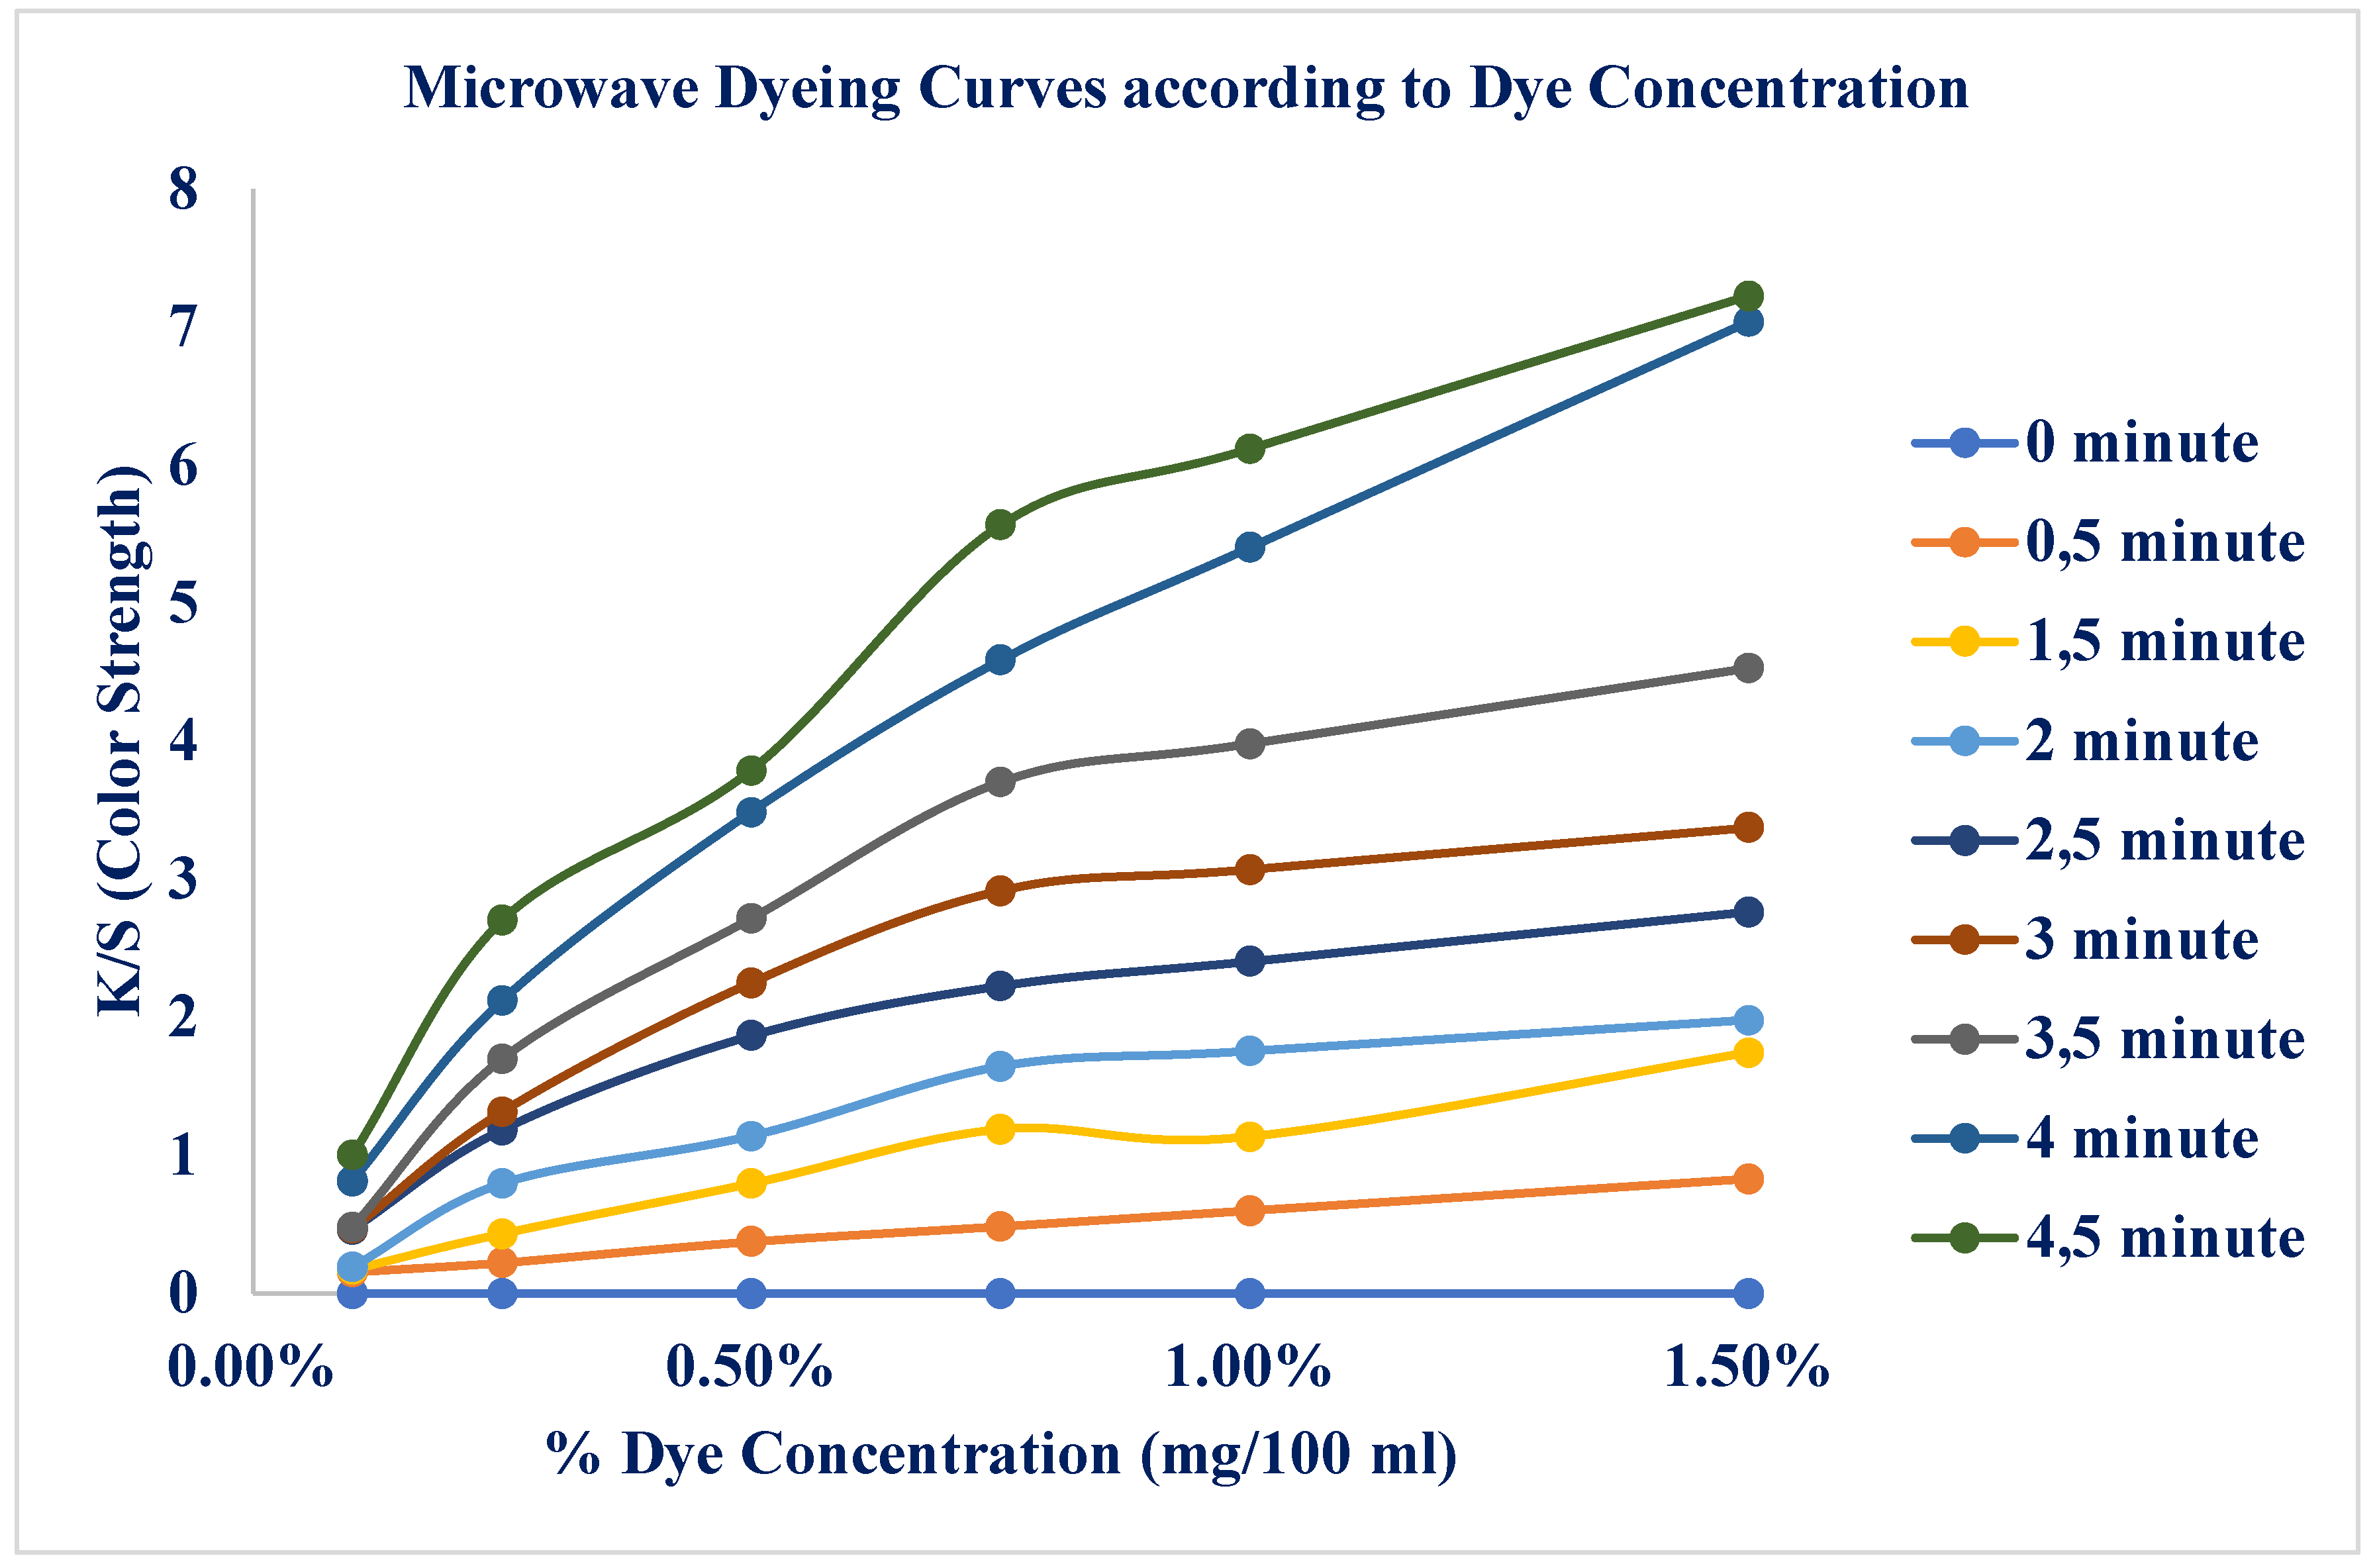
Figure 11.
Temperature-dependent Color Strength (K/S) profiles for Microwave Heating.
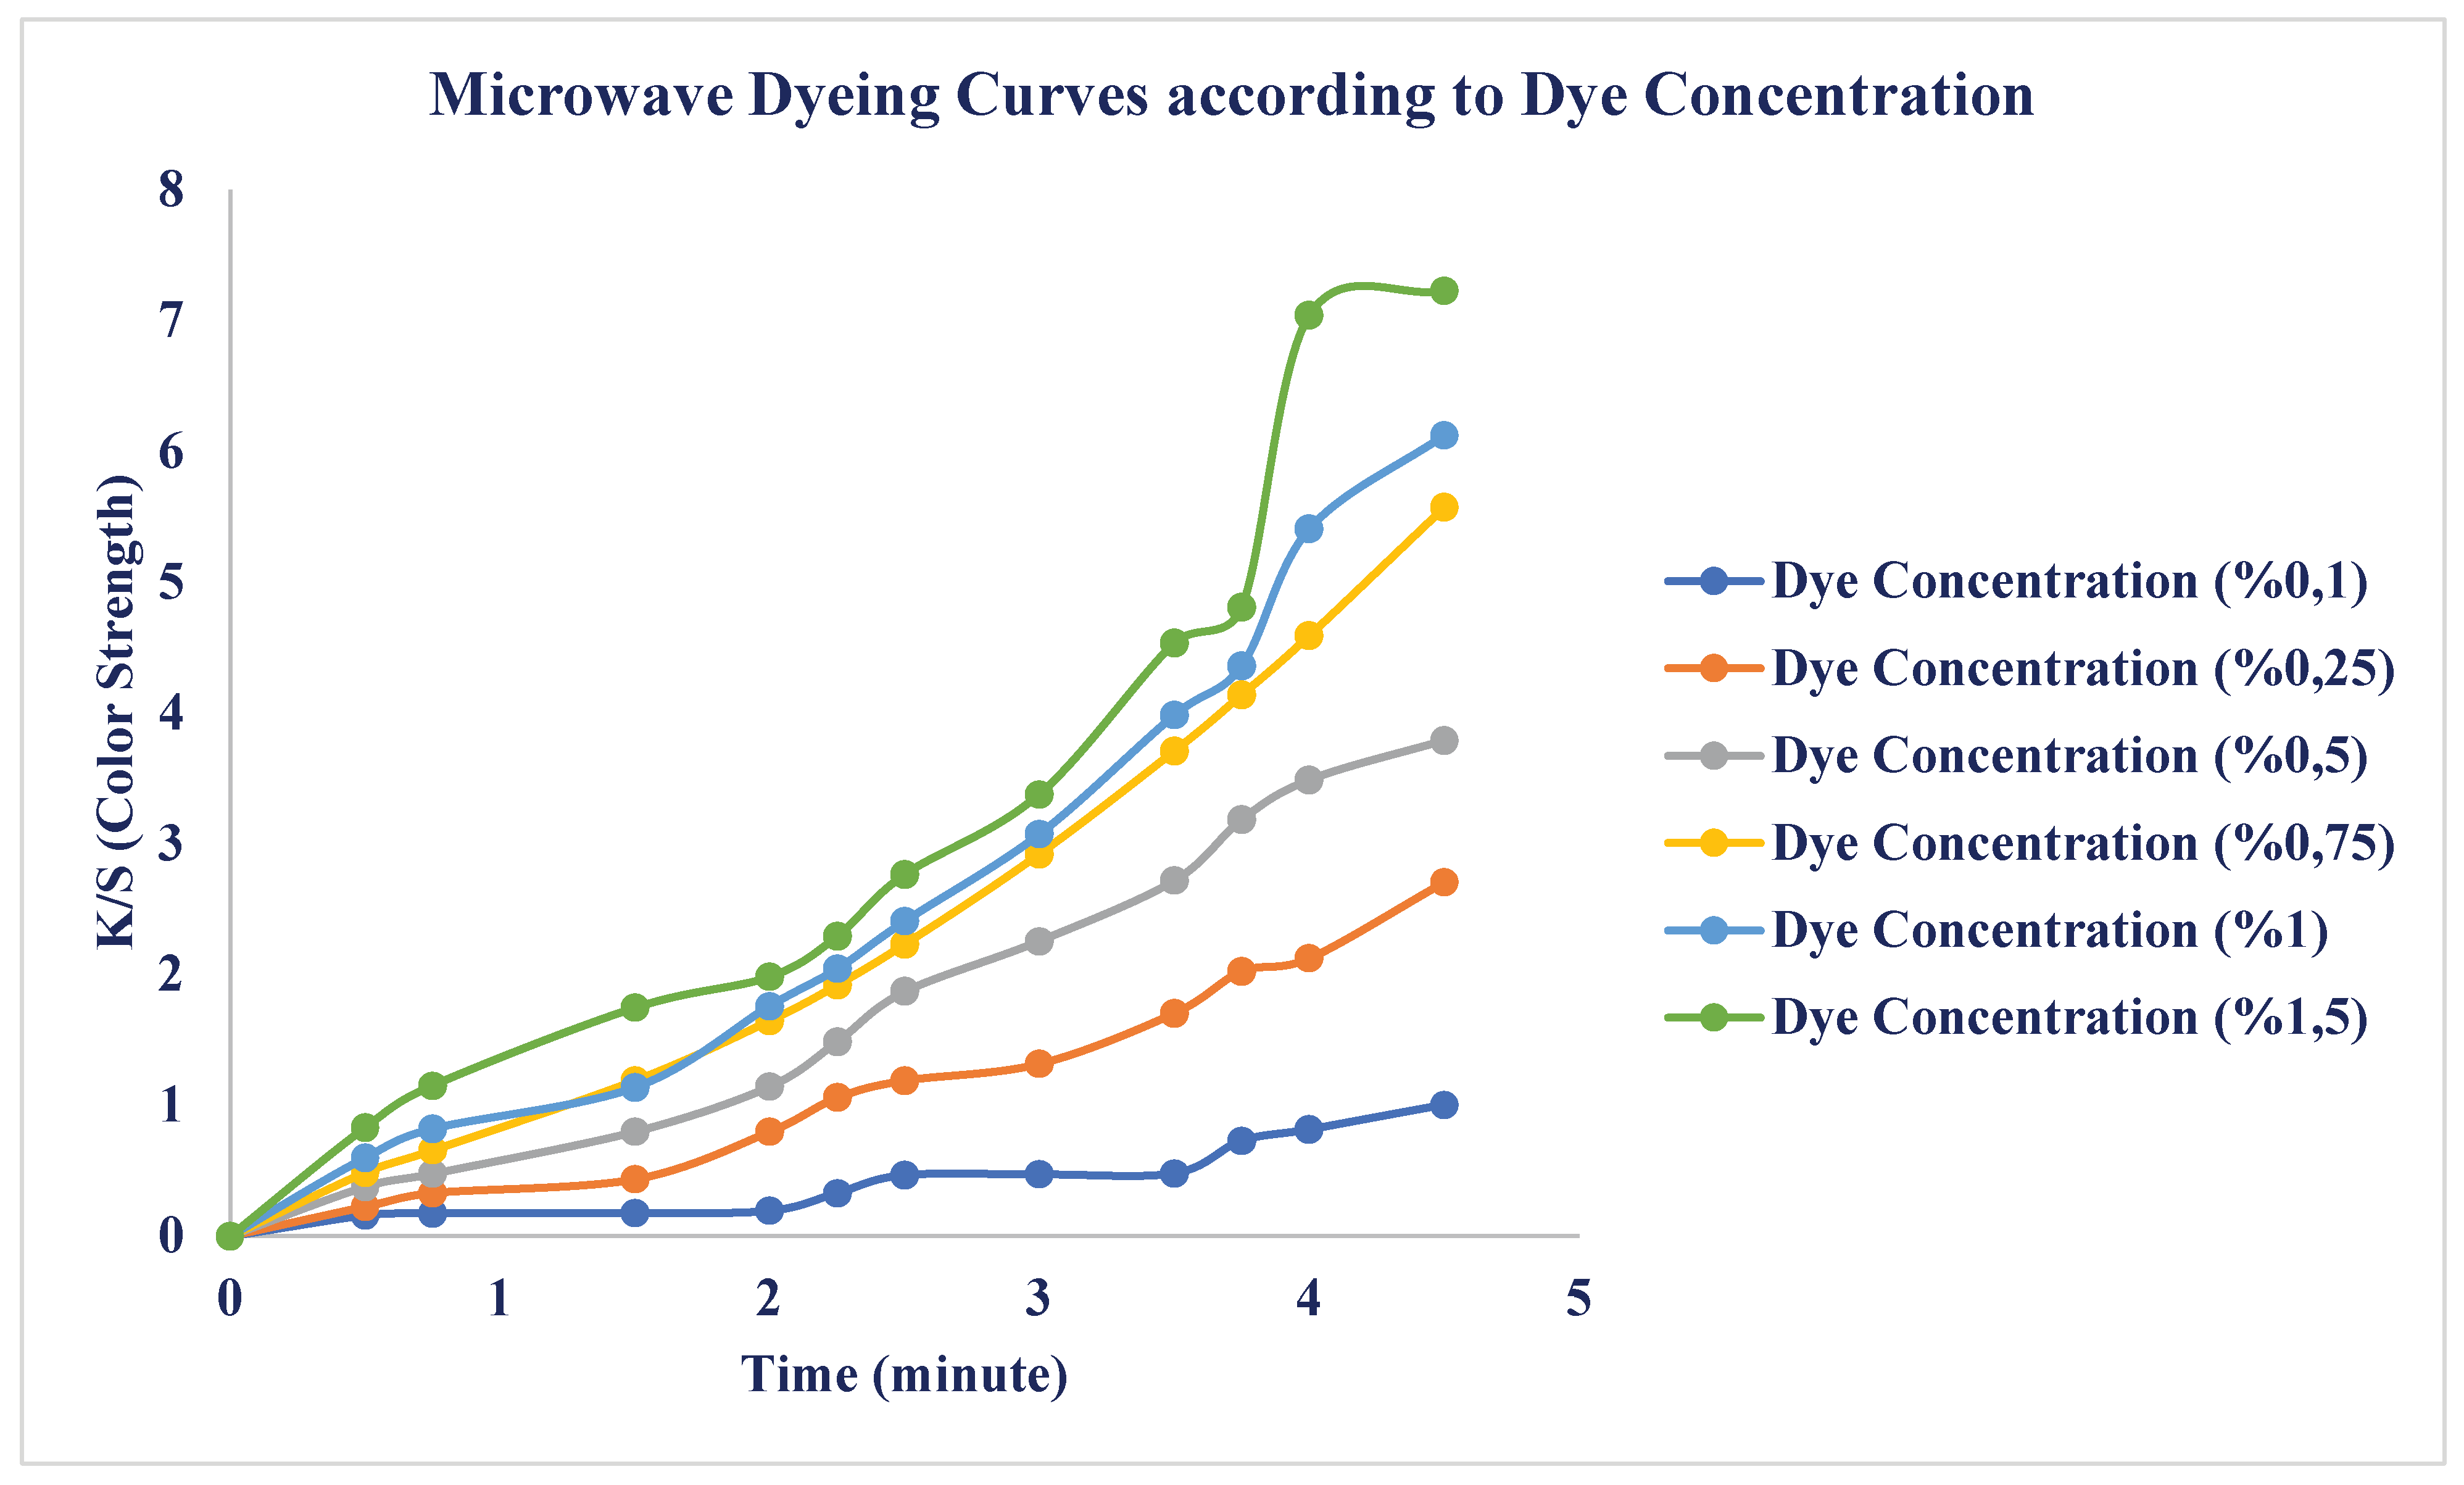
Table 1.
pH-dependent color strength (K/S) data for Conventional Heating.
| pH (in) | KS (Color Strength) |
|---|---|
| 3 | 24.4815 |
| 3.5 | 21.0672 |
| 4 | 18.2372 |
| 4.5 | 15.9914 |
| 5.5 | 13.6445 |
| 6 | 12.8571 |
Table 2.
Time and Temperature-dependent color strength (K/S) data for Conventional Heating.
| K/S (Color Strength) | 50 °C | 60 °C | 70 °C | 80 °C | 95 °C |
|---|---|---|---|---|---|
| 0 | 0 | 0 | 0 | 0 | 0 |
| 5 | 2.151 | 3.745 | 6.980 | 9.000 | 11.820 |
| 10 | 3.671 | 5.764 | 9.527 | 11.270 | 13.228 |
| 15 | 4.802 | 7.026 | 10.846 | 12.276 | 13.750 |
| 20 | 5.675 | 7.889 | 11.653 | 12.867 | 14.063 |
| 25 | 6.371 | 8.518 | 12.208 | 13.235 | 14.247 |
| 30 | 6.938 | 8.995 | 12.629 | 13.520 | 14.371 |
Table 3.
Time and Temperature-dependent concentration data for Conventional Heating.
| Concentration (g./100 ml) | 50 °C | 60 °C | 70 °C | 80 °C | 95 °C |
|---|---|---|---|---|---|
| 0 | 0.01000 | 0.01000 | 0.01000 | 0.01000 | 0.01000 |
| 5 | 0.00824 | 0.00706 | 0.00535 | 0.00400 | 0.00212 |
| 10 | 0.00700 | 0.00548 | 0.00365 | 0.00249 | 0.00118 |
| 15 | 0.00608 | 0.00449 | 0.00277 | 0.00182 | 0.00083 |
| 20 | 0.00537 | 0.00381 | 0.00223 | 0.00142 | 0.00062 |
| 25 | 0.00480 | 0.00332 | 0.00186 | 0.00118 | 0.00050 |
| 30 | 0.00434 | 0.00294 | 0.00158 | 0.00099 | 0.00042 |
Table 4.
Dye Concentration-dependent color strength (K/S) data for Conventional Heating.
| Dye Concentration | Temperature | |||||
|---|---|---|---|---|---|---|
| 50 °C | 60 °C | 70 °C | 80 °C | 90 °C | 95 °C | |
| 0.10% | 0.4150 | 0.7507 | 0.8659 | 0.9112 | 1.7994 | 1.9654 |
| 0.25% | 2.3466 | 2.8823 | 3.5761 | 4.8436 | 5.1342 | 5.4248 |
| 0.50% | 2.6333 | 3.5349 | 4.3872 | 6.5147 | 6,9551 | 7.1561 |
| 0.75% | 2.9199 | 4.1874 | 5.1982 | 8.1848 | 8,7760 | 8.8873 |
| 1.00% | 3.2066 | 4,8399 | 6.0092 | 9.5722 | 11.0113 | 11.2309 |
| 1.50% | 3.7799 | 6.1449 | 7.6311 | 12.3470 | 15.4817 | 15.9181 |
Table 5.
pH-dependent color strength (K/S) data for Microwave Heating.
| pH | KS |
|---|---|
| 3 | 25.0513 |
| 3.5 | 20.1982 |
| 4 | 18.2071 |
| 4.5 | 16.1967 |
| 5.75 | 13.3032 |
| 6.5 | 12.6054 |
Table 6.
Time and Temperature-dependent color strength (K/S) data for Microwave Heating.
| K/S (Color Strength) | 50 °C | 60 °C | 70 °C | 80 °C | 95 °C |
|---|---|---|---|---|---|
| 0 | 0 | 0 | 0 | 0 | 0 |
| 1 | 1.399 | 3.085 | 2.892 | 8.308 | 11.530 |
| 2 | 2.559 | 4.330 | 5.134 | 9.710 | 12.418 |
| 3 | 3.521 | 5.280 | 6.870 | 10.637 | 12.968 |
| 4 | 4.319 | 6.077 | 8.216 | 11.347 | 13.374 |
| 5 | 4.981 | 6.778 | 9.259 | 11.931 | 13.697 |
| 6 | 5.530 | 7.411 | 10.068 | 12.431 | 13.967 |
| 7 | 5.985 | 7.991 | 10.694 | 12.869 | 14.199 |
| 8 | 6.363 | 8.530 | 11.179 | 13.262 | 14.403 |
| 9 | 6.676 | 9.036 | 11.555 | 13.618 | 14.586 |
| 10 | 6.936 | 9.514 | 11.847 | 13.944 | 14.751 |
Table 7.
Time and Temperature-dependent concentration data for Microwave Heating.
| Concentration (g./100 ml) | 50 °C | 60 °C | 70 °C | 80 °C | 95 °C |
|---|---|---|---|---|---|
| 0 | 0.01000 | 0.01000 | 0.01000 | 0.01000 | 0.01000 |
| 1 | 0.00904 | 0.00787 | 0.00813 | 0.00481 | 0.00256 |
| 2 | 0.00824 | 0.00701 | 0.00669 | 0.00393 | 0.00199 |
| 3 | 0.00757 | 0.00636 | 0.00557 | 0.00335 | 0.00163 |
| 4 | 0.00702 | 0.00581 | 0.00470 | 0.00291 | 0.00137 |
| 5 | 0.00656 | 0.00533 | 0.00403 | 0.00254 | 0.00116 |
| 6 | 0.00619 | 0.00489 | 0.00350 | 0.00223 | 0.00099 |
| 7 | 0.00587 | 0.00449 | 0.00310 | 0.00196 | 0.00084 |
| 8 | 0.00561 | 0.00412 | 0.00279 | 0.00171 | 0.00071 |
| 9 | 0.00540 | 0.00377 | 0.00255 | 0.00149 | 0.00059 |
| 10 | 0.00522 | 0.00344 | 0.00236 | 0.00128 | 0.00048 |
Table 8.
Dye Concentration-dependent color strength (K/S) data for Microwave Heating.
| Dye Concentration (mg/100 ml) % |
0 minute | 0.5 minute | 1.5 minute | 2 minute | 2.5 minute | 3 minute | 3.5 minute | 4 minute | 4.5 minute |
|---|---|---|---|---|---|---|---|---|---|
| 0.10% | 0.0000 | 0.1578 | 0.1757 | 0.1936 | 0.4658 | 0.4733 | 0.4810 | 0.8172 | 1.0040 |
| 0.25% | 0.0000 | 0.2241 | 0.4348 | 0.7972 | 1.1874 | 1.3161 | 1.7015 | 2.1245 | 2.7051 |
| 0.50% | 0.0000 | 0.3771 | 0.7977 | 1.1424 | 1.8702 | 2.2534 | 2.7197 | 3.4885 | 3.7910 |
| 0.75% | 0.0000 | 0.4855 | 1.1910 | 1.6459 | 2.2296 | 2.9205 | 3.7077 | 4.5910 | 5.5706 |
| 1.00% | 0.0000 | 0.6010 | 1.1376 | 1.7582 | 2.4080 | 3.0728 | 3.9831 | 5.4080 | 6.1228 |
| 1.50% | 0.0000 | 0.8315 | 1.7471 | 1.9827 | 2.7649 | 3.3774 | 4.5340 | 7.0420 | 7.2272 |
Disclaimer/Publisher’s Note: The statements, opinions and data contained in all publications are solely those of the individual author(s) and contributor(s) and not of MDPI and/or the editor(s). MDPI and/or the editor(s) disclaim responsibility for any injury to people or property resulting from any ideas, methods, instructions or products referred to in the content. |
© 2026 by the authors. Licensee MDPI, Basel, Switzerland. This article is an open access article distributed under the terms and conditions of the Creative Commons Attribution (CC BY) license (http://creativecommons.org/licenses/by/4.0/).
Copyright: This open access article is published under a Creative Commons CC BY 4.0 license, which permit the free download, distribution, and reuse, provided that the author and preprint are cited in any reuse.


