
Submitted:
06 November 2025
Posted:
07 November 2025
You are already at the latest version
Abstract
This paper aims to give an analytical assessment of country’s level experience in moving towards agricultural decarbonization – from the idea of potential decarbonization measures to the assessment of their potential, the inclusion of the measure in political goals and practical implementation success. This paper is based on 10-year cycle that highlight main steps in building decarbonization awareness and an approach that can be used for monitoring, quantifying and evaluating the contribution of agriculture to climate change mitigation. This approach is based on the Marginal Abatement Cost Curve (MACC), which serves as a convenient and visual tool for evaluating the effectiveness of various agriculture greenhouse gas emission reduction measures and for climate policy planning. This study reveals the experience to date and the main directions in developing the MACC approach, which serves as a basis for analysing the potential of one specific European Union Member state, i.e., Latvia, agriculture for moving towards decarbonization. The results of the study are of practical use for the development of agricultural, environmental and climate policy or legal framework, policy analysis and impact assessment. As well findings of this study are useful for educating farmers and the public about measures to reduce GHG and ammonia emissions.
Keywords:
marginal abatement cost curve
; tool
; agriculture
; decarbonization
; strategy
1. Introduction
An analysis of statistics on world population changes and United Nations projections of population change [1] reveals that the demand for resources and emissions from the consumption thereof will be a long-term global problem. The world population is projected to peak at the end of this century at a total of 10.3 billion [1].
An additional factor behind the increase in resource consumption is the convergence of global economic growth, with less developed regions maintaining a faster rate of economic growth compared with the developed world [2]. Unfortunately, global economic growth is subject to significant externalities. The present research highlights two of the most important externalities: the continuing global industrialization process and the increasing demand for food [3]. The economic growth externalities continue to result in increased overexploitation of non-renewable resources, thereby leading to increased greenhouse gas emissions (greenhouse gases include carbon dioxide, methane, and nitrous oxide) into the natural environment, causing global temperatures to rise, contributing to a range of environmental degradation and social problems [4]. Global monitoring data on atmospheric concentrations of greenhouse gases (carbon dioxide (CO2)) show a significant increase in atmospheric CO2 concentrations from 285 parts per million (ppm) in 1850 to 425.79 ppm in 2024 [5]. The atmospheric concentration of CO2 has increased by 6.6% over the last 10 years.
Under current economic growth trends, resource extraction and consumption are projected to increase by 119% between 2015 and 2050, from 84 to 184 billion tons per year, while greenhouse gas emissions are projected to increase by 41% [6].
The growth of the global economy has a significant impact on consumer food choices. Statistical evidence and projections point to a significant increase in meat consumption in the economic growth regions. Average global demand for beef, sheep, goat, pig and poultry meat, milk and eggs is projected to increase by 14% per capita between 2020 and 2050 and by 38% overall if consumer income and population growth trends continue at current rates [7].
The current global economic growth pattern is not sustainable in the long term due to the externalities it generates. In fact, economic growth threatens sustainability. This is confirmed by the climate change statistics analysed [5] and the long-term projections of resource consumption made [6].
The increase in global temperatures caused by greenhouse gases has already caused significant damage to the living environment: extinction of some species, loss of biodiversity, drought, food insecurity, forest fires, ocean acidification, melting of the North and South Pole Glaciers (NSPG) and the rising sea level [8,9].
On 12 December 2015, 197 Parties to the United Nations Framework Convention on Climate Change (UNFCCC) unanimously agreed at the Paris Climate Change Conference (PCCC) to adopt the Paris Agreement, which sets out plans for global action to tackle climate change beyond 2020. Under the Paris Agreement, each country agreed to limit global temperature increases to less than 2 °C and to work on limiting global temperature increases to less than 1.5 °C [10]. By February 2021, 124 countries had declared their intention to become carbon neutral and achieve net zero carbon emissions by 2050 or 2060 [11].
Thus, transformation of traditional economy towards climate neutral or net zero economy has become global initiative and feature of 21st century. The terms carbon neutrality and net-zero carbon emissions are referred to in climate change mitigation policy documents. The terms are used to describe the mitigation actions that are included in the policy documents and the measures taken. A correct understanding of the terms is a basis for ensuring coherent national action to mitigate climate change. Carbon neutrality refers to the point at which CO2 emissions into the atmosphere, in per unit terms, are offset by sequestration over a given period, thus achieving a CO2 balance in the atmosphere. Carbon neutrality is the term used to describe a system in which all carbon emitters and sinks participate. The cooperation between emitters and sinks results in a balance of CO2 emissions, thus having no impact on climate change [12].
The term net-zero carbon emissions has a different meaning, as it is the responsibility of all CO2 emitters to reduce the emissions into the atmosphere. This means that every single resource consumer must develop a Net-Zero Carbon Emissions Resource Use System, which involves storing or sequestering all the emissions from economic activities into the atmosphere [12,13]. The two theoretical terms referred to in policy documents allow us to explain the EU’s overall goal of achieving climate neutrality – a net-zero carbon economy by 2050. This goal is at the heart of the European Green Deal and, thanks to the European Climate Act, is a legally binding target for all the EU Member States [14].
At the end of 2023 around 145 countries, including China, European Union, United States of America, India, had announced or are considering net zero targets. These targets are key to reduce global carbon dioxide and other greenhouse gas emission to net zero around 2050 and 2070 [15].
Topicality of net zero targets in scientific discussion emerged in first decade of 21st century when scientists began focusing more on the close relationship between total amount of anthropogenic CO2 emissions and global temperature change [16,17]. In 2014, the Intergovernmental Panel on Climate Change (IPCC) highlighted this finding, along with the implication that limiting global temperature change to any given level requires a point at which net additions of CO2 into the atmosphere reach zero [18]. It has created a challenge for many countries how to develop well-designed and implement ambitious net zero targets for national economies to meet global commitments and reach national greenhouse gas reduction targets.
Comparison of adopted net zero targets and analysis of existing experience [19] shows that when countries develop their plans to reach net zero emissions, they face several choices and need to answer to several key questions. These include what exactly “net zero” means for them, how long it will take to get there, which sectors and greenhouse gases to focus on, and whether they’ll rely on capturing carbon or international cooperation to achieve their goals. World resource institute [19] argues that to maximize the contribution of net-zero targets to drive decarbonization in line with climate science, countries should consider the following recommendations can be considered: achieving net-zero emissions will require fundamental shifts in how society operates; net-zero targets should be comprehensive and cover all greenhouse gases and all sectors; governments should establish specific time frames for achieving targets; countries with the highest emissions and greatest responsibility and capability should adopt the most ambitious target time frames; separate targets should be set for GHG emissions reductions and net-zero or net-negative emissions; countries should transparently communicate their net-zero targets.
In order to get answers to specific questions and to implement recommendations related with net zero targets close communication and cooperation between policy makers and scientists is essential. Purpose of this paper is to give an analytical assessment of country’s level experience in moving towards agricultural decarbonization – from the idea of potential decarbonization measures to the assessment of their potential, the inclusion of the measure in political goals and practical implementation success by using Marginal Abatement Cost Curve (MACC) as supportive tool.
2. Materials and Methods
The contribution of agriculture to climate change mitigation and the achievement of the climate and environmental objectives set by the European Union depends on how successfully and to what extent measures to reduce greenhouse gas (GHG) emissions are implemented in practice, as well as on how their impact is assessed and monitored. The subject of this study is the MACC - tool used for planning and implementing agricultural decarbonization strategy. This study is structured in two thematic blocks that demonstrate comprehensive methodology from theory to practical policy implications:
- • Block 1: MACC theoretical and historical analysis summarizes, describes and reveals modifications and diversity of MACC’s;
- • Block 2: MACC case study application focuses on case study that illustrates different uses and levels of integration of MACC into national climate policy-making process, serving as experience of full cycle approach towards carbon neutrality.
Table 1 summarizes two block concepts of this study and main methods, approach, focus and outcome of each thematic block.
In order to understand the scope and possible nuances of using MACC tool in the thematic Block1: MACC theoretical and historical analysis authors have analysed existing modifications and diversity of MACCs. Results of this mapping highlights historical development of MACCs, diversity of their usage, as well as strengths and weaknesses of expert judgement-based MACCs and model derived MACCs. This thematic block is built on comprehensive evaluation of MACC development over time from scientific literature.
In the thematic Block 2: MACC case study application authors have focused on 10-year period (from 2015-2025) and identified main stages in the development of the MACC approach. These development stages and relevant time period are summarized in Figure 1 and reflects this study time frame and main issues analysed in this research.
Information summarized and analysed in this thematic block highlights experience of full cycle approach towards carbon neutrality by utilizing project results from Latvian climate policy initiatives and strategic actions for advancing MACC research and policy application.
3. Results
3.1. Modifications and Diversity of Marginal Abatement Cost Curves
Cost curves for reducing energy consumption or emissions have been in use since the early 1980s [20]. Marginal Abatement Cost Curves (MACCs) were first developed in the 1970s following the two oil price shocks, initially targeting reductions in crude oil consumption and later, electricity consumption [21]. In response to the oil price crises of the 1970s, Meier (1982) introduced the first cost curves for decreasing electricity consumption (measured in $/kWh). These saving curves, also known as conservation supply curves, quickly became essential analytical tools for evaluating energy-efficiency improvements across various sectors, including transport, industrial sector, and buildings [22,23,24]. They were also widely applied to assess the abatement potential and costs of air pollutants like SO2 ($/kt) [25]. The first carbon-focused curves, which utilized methods similar to those of earlier energy-saving cost curves, emerged in the early 1990s [26,27,28]. Over time MACCs were applied to various areas, including the assessment of abatement potential and costs for air pollutants and water availability. MACCs started to be applied in the agricultural sector, involving qualitative judgement and more empirical methods [21].
Lately, researchers and policymakers focused on climate change mitigation have increasingly turned their attention to MACCs, mainly due to the influential work of McKinsey & Company. From 2007 to 2009, McKinsey released and published 14 cost curves for various countries and also developed a global cost curve, which significantly contributed to the prominence of this tool in climate policy discussions [29]. In the UK, MACCs have significantly influenced the Government’s climate change policy. This is highlighted in Government reports that incorporate MACCs, like the UK Low Carbon Transition plan. The UK Department for Energy and Climate Change (DECC) utilizes the Global Carbon Finance (GLOCAF) model, which is based on MACCs, to predict financial flows between different global regions. MACCs have also been applied in many other countries and regions, such as the Netherlands, Ireland and the European Union [30], California (USA) and China [31]. Beyond these practical uses, MACCs have been applied in theoretical policy analyses of emission reduction and impact of innovation [32,33].
Several agricultural engineering greenhouse gas emissions (GHG) MACCs have been published over the past decade. The UK Government has commissioned a series of these studies as part of broader economic analysis [34,35]. MACCs have also been developed for the agricultural sectors in Ireland [36], France [37], New Zealand [38], and China [39], as well as for the dairy sector in the Netherlands. The Danish and Belgian MACCs cover the entire economy, with Denmark currently updating its MACC for the agricultural sector. In Finland, GHG abatement costs have been calculated for various potential measures, and due to the context-specific nature of these estimates, recent MACCs include uncertainty estimates [40]. Latvia has been developing a MACC and aims to publish it in early 2018, with some preliminary results and the research approach already available [41,42,43].
These MACCs have served as catalysts for the exchange of information between science and policy. Their findings have contributed to national carbon budgets and sector-specific policies, often highlighting key gaps in implementation. The ensuing debates have driven research and policy efforts to address these gaps by reducing barriers and enhancing national GHG inventories. This improvement ensures that mitigation efforts are captured, credited, and incentivized effectively [44].
MACCs are commonly used to assess the cost-effectiveness of various emission reduction strategies. Nevertheless, their use and adoption differ greatly across regions, influenced by factors like economic development, data accessibility, technical know-how, and policy priorities. The most popular usage of MACCs is in Europe, North America, and China. In Europe specifically in the Netherlands, Germany, France, United Kingdom, Ireland etc.
The studies that have assessed empirical MACCs in agriculture considerably vary in scope (source of emissions, gasses, and mitigation options considered). Modelling approaches, assumptions, and geographic scale and resolution [45,46]. They can be classified into three main categories based on the modelling approach utilized [45]. Firstly, studies using microeconomic supply-side models incorporate a detailed representation of the technical and economic constraints that define the production possibilities at the farm level [46,47]. Secondly, MACCs obtained from studies using partial or general equilibrium models [48,49,50] consider the impact of market responses, such as changes in input and output prices on marginal abatement costs [50]. These studies typically have broader geographic coverage but lower resolution compared to those based on supply-chain models. Thirdly, studies applying an engineering approach offer detailed [34,51,52], bottom-up evaluations of the carbon price required to incentivize the adoption of available technologies, along with their associated mitigation potential. These studies handle the effects of adopting new technologies or investing in environmentally friendly equipment more effectively than economic approaches. However, they do not model the competition and interactions among various mitigation options as transparently as economic models do, which complicates the economic interpretation of the resulting abatement cost as an opportunity cost [45].
Marginal abatement cost curves (MACCs) are utilized in multiple sectors to assess the cost-effectiveness of emission reduction strategies and to guide climate policy decisions. The primary sectors where MACCs are frequently applied include the energy sector, agriculture, industrial sector, transportation, and residential and commercial buildings.
Experience from various countries demonstrates that multiple approaches can be used to analyze GHG reduction activities. The choice of methodology depends on the purpose of the assessment, the types of emissions considered, the kinds of costs calculated, and the information available.
Two different approaches are typically used to build these curves: an economy-oriented top-down model or an engineering-oriented bottom-up-model. The top-down analysis relies on a macroeconomic general equilibrium model, which provides an overall cost to the economy and is favored for studying macroeconomic and fiscal policies, models the abatement potential and cost for individual technologies or measures, making it more useful for examining options with sectoral and technological implications. To ensure rigor and consistency, the MACC appraisal must follow a commonly recognized methodology that accounts for Agriculture, Forestry, Land Use (AFOLU) specificities. The results must also be transparent and comparable to those of other sectors such as energy transportation, and manufacturing.
Marginal Abatement cost curves vary widely in shape, differing in regional scope, time zone, included sectors, and the approach used for their generation. A MACC graph shows the cost associated with the last unit (the marginal cost) of emission reduction for different levels of emission abatement, typically measured in million or billion tons of CO2. To assess the marginal abatement cost, a baseline without CO2 constraints must be defined for comparison. MACC allows for the analysis of the cost of the last abated unit of CO2 at a specified abatement level and provides insights into total abatement costs through the area under the curve. Average abatement costs can be determined by dividing the total abatement cost by the total amount of emissions abated. Based on the methodology, MACC can be categorized into expert-based and model-derived curves, as illustrated in Figure 2 [20].
Expert-based curves evaluate the cost and reduction potential of each abatement measure based on informed opinions, whereas model-derived curves are calculated using energy models. MACCs have been particularly popular with policymakers due to their straightforward presentation of the economics of climate change mitigation. Policymakers can easily identify the marginal abatement cost for any given total reduction amount and, in the case of expert-based curves, can also see the specific mitigation measures responsible for the CO2 emissions reduction [20]. Based on previous discussion, as everywhere, MACC has its pros and cons. These are summarized in Table 2.
Bottom-up energy models are partial equilibrium models focused solely on the energy sector, unlike top-down models which encompass endogenous economic responses across the entire economy. Bottom-up models can be either simulation or optimization models, achieving partial equilibrium by minimizing system costs or maximizing consumer and producer surplus. In comparison to top-down models, bottom-up models provide more detailed representation of energy technologies throughout the transition from primary to useful energy. Top-down models, on the other hand, depend on substitution elasticities, which are primarily estimated based on historical rates and assumed to remain valid in the future [20].
To leverage the strengths of both bottom-up and top-down approaches, a practical alternative is to use a bottom-up model, which provides the necessary technological detail, to create a consistent MAC curve. Index decomposition analysis can then be applied to the results of the energy system model to attribute emission reductions to specific changes in the energy system. This approach allows for the identification of the measures responsible for emission reductions while maintaining a coherent framework capable of considering system-wide interactions. This method significantly enhances the usefulness of MAC curves for policymakers, addressing several shortcomings of existing approaches while remaining easy to understand.
3.2. Historical Insights into Experience of Full Cycle Approach Towards Carbon Neutrality
In the middle of the last decade, climate problems were not very urgent for society because Latvia was considered to be a very green country with a low level of industrialisation and a low population density. Climate problems were put on the political agenda in Latvia later than in other parts of the EU because in 1990, the reference period for policy documents, Latvia was still occupied by the USSR and had an economically unsound planned economy that disintegrated immediately after the USSR collapsed. As a result, Latvia stopped producing products non-competitive outside the USSR in energy-inefficient factories and plants, and agriculture no longer needed collective farms, which had been established as a result of forced collectivisation. Naturally, alongside a decrease in energy consumption and livestock and the change in ownership that led to the restructuring of the economy and the conversion to the western model of farming, GHG emissions also decrease significantly. In Latvia, after fast privatisation, a new economy oriented towards the production, technological and investment patterns of western EU countries began to emerge. In agriculture, the descendants of farmers reclaimed their ancestral land and tried to find their place in the food market, which was also successful, with both the output of agricultural products and the intensity of production slowly increasing. Consequently, GHG emissions began to increase and, after EU accession, climate problems emerged on the agenda for policymakers. In the following decade, the need for science-based expertise on GHG emission reduction measures increased for policymakers.
3.2.1. Adoption and Improvement of MACC Methodology for Latvia
In 2015, the Latvian government launched EVIDEnT, a national scientific research project on the impacts of climate change on economic growth, and one of the project’s components was the development of the first GHG MACC for the agricultural sector in Latvia. As part of the project, the Ministry of Agriculture of the Republic of Latvia held a MACC workshop with the aim of sharing experience and using the best one for developing an agricultural MACC for Latvia. The results of the workshop and the experience of MACC designers were published in a research paper [44] describing the diverse experience in using MACCs within the EU. The EVIDENT project developed a MACC for agricultural GHG mitigation measures, which contained innovative features. From the very beginning, it was clear that MACCs would be used in policymaking. The previous experience recommended the use of the Farm Accountancy Data Network (FADN) database for evaluating MACC measures; however, the FADN database does not represent the whole agricultural sector, but only the most important part of it affecting the agricultural market. To improve this situation, a typology of Latvian farms was developed applying a cluster approach [42]. The result was a MACC for five types or clusters of farms characteristic of Latvia [43].
It should be noted, however, that the approach itself is time-consuming and adds significant complexity to the construction of a MACC, as data from various databases had to be harmonised in order to overcome potential representativeness difficulties. Nevertheless, it should be added that the inclusion of personal farm plots and organic farms in a MACC actually increased the MACC coverage by a negligible 3%, i.e., the GHG reduction potential increased by 3%. Firstly, it is clear that if policy support measures are proposed, the focus is placed on intensive farms, which are usually also economically stronger. In later discussions, organic and small farms pointed out that they were denied specific support to develop the farms. In other words, farmers felt penalised for already being less GHG intensive. Secondly, it increased the number of measures that could be defined as suitable for a certain type of cluster. This made the calculations more meaningful as well as more specific, depending on farming practices specific to Latvia [41]. Thirdly, the MACC constructed became a kind of platform which enabled more detailed discussions with farmer lobbies, policymakers and state control organizations. What became clear in a selection of measures was that the measures not only have a positive impact on GHG emission reduction but also bring other environmental or economic benefits. To verify this, an integrated impact assessment of the GHG emission reduction measures included in the MACC was performed [42]. It was found that climate actions predominantly had an impact on the strategic economic benefits of farms, as well as additional environmental benefits were brought to society. Overall, it should be noted that the use of MACCs in assessing agricultural GHG emissions was successful, which encouraged further activities. In addition to GHG emission reduction, the problem of increased C (carbon) sequestration and the interaction between land use, land-use change, and forestry (LULUCF) and agriculture was also a major challenge. These were the key tasks for constructing a next MACC.
3.2.2. Developing the Use and Diversity of the MACC Approach
The MACC for agricultural GHG emission mitigation measures developed as part of the national research programme EVIDEnT were further supplemented with two new measures, i.e., “Paludiculture (reed (for construction)) on arable land on organic soils” and “Establishment of perennial plantations (bush blueberry) on organic arable land”, which related to land use and land use change. Also previously analysed 23 measures were revised and analyzed their interaction with LULUCF sector. Overall, most of the measures had a neutral impact on each other (12 measures). Only three measures had a positive impact on both sectors, which means that both sectors contributed to GHG reductions. For two measures, the impact was not clear due to a lack of research studies. For six measures, a negative interaction was found, mainly due to the fact that an increase in green mass in the agricultural sector leads to additional emissions, while an increase in green mass in the LULUCF sector leads to an increase in CO2 sequestration. The research found that some of the measures included in the updated MACC, in addition to GHG emission reduction potential, also have CO2 sequestration and C storage potential. Therefore, the research did an assessment of the CO2 sequestration and C storage efficiency of the measures.
In Latvia, the next stage of using MACCs is associated with the European Commission’s Clean Air programme for Europe whose legal basis is Directive 2016/2284, The directive sets strict anthropogenic emission ceilings for the Member States for the main pollutants: sulphur dioxide, nitrogen oxide, non-methane volatile organic compounds, ammonia and fine particulate matter (PM2,5) for the period from 2020 to 2029 and beyond 2030. In addition, Article 6 of Directive 2016/2284 requires the Member States to develop and submit to the European Commission their national action plans to limit air pollution by 1 April 2019. An action plan must be updated at least every four years or more frequently if, according to the annual emissions report, the targets for reducing emissions from air pollutants are not met or are at risk of not being met. Given that 86% of total NH3 emissions in Latvia in 2016 were attributable to agricultural production, measures in agriculture need to be taken to reduce air pollution. A MACC was suitable for this purpose, resulting in an ammonia MACC designed for agriculture. The research adapted an already designed MACC for ammonia emission abatement measures and constructed a new MACC curve. The research analysed 17 various ammonia abatement measures focusing on the efficient use of nitrogen (N) fertilisers, efficient off-site manure management and the development of organic farming. The research identified the impacts and cost-effectiveness of the measures on reducing ammonia emissions and published the results [41]. In addition, it is important to note that the measures and approach analysed were incorporated into the policy document “Air Pollution Reduction Action Plan for 2019-2030”.
3.2.3. Using MACC in Policy Discussion and Knowledge Transfer
In addition, as preparations for the new European Union financial programming period (2021-2027) began, there was a need for a deeper and more detailed understanding of practical implementation constraints and solutions for the GHG and ammonia emission abatement measures concerned. Given the commitments of Latvia in relation to the EU GHG and ammonia emission abatement targets, it is important to identify improvements necessary in data inventory and knowledge build-up, so that the impacts of GHG and ammonia emission abatement measures are included in GHG and ammonia emission inventory reports. Basically, the MACC initiated a discussion between scientists, farmer lobby organizations, farmers, consultancy services and policymakers. During the project, nine interactive workshops were held, bringing together more than 160 participants. The purpose of the workshops was to build a common understanding (among farmers, scientists, agricultural, environmental and climate policymakers) of GHG and ammonia abatement measures in agriculture, as well as identify potential constraints and policy requirements for practical implementation. The project team presented 20 GHG and ammonia abatement measures to the workshop participants and held discussions on the positive and negative experience, technological, environmental, social and economic constraints and potential solutions for the implementation of the measures. The interactive workshops contributed to the farmers’ understanding of the nature of GHG and ammonia abatement measures and their suitability for various types of farming, as well as identified concrete actions for the active implementation thereof in practice. One important area of application of the MACC for Latvian agriculture was the opportunity to improve the national GHG inventory reports. A major challenge was to identify new measures that could be integrated into policies and make the national GHG inventory report more realistic. The IPCC sets strict guidelines (2006 IPCC Guidelines for National Greenhouse Gas Inventories; 2019 Refinement to the 2006 IPCC Guidelines for National Greenhouse Gas Inventories) for drawing up a report, which include a requirement for reliable and verifiable data. In the case of Latvia, the challenge was incomplete livestock feed statistics, which led to the use of relatively old data from the feed catalogue. These were the basic challenges to constructing an agricultural MACC for Latvia.
Unfortunately, the project was affected by the Covid-19 pandemic, which prevented sufficiently extensive and reliable data on changes in cattle feed consumption. At the same time, a new approach was designed for reducing both ammonia and GHG emissions. The project designed six new feed ration models, each comprising a feed recipe and ration for a particular lactation phase of cows. The models provide several benefits: improved animal welfare, higher productivity and reduced GHG and ammonia emissions, depending on the situation in the country [53]. The measures complemented the updated GHG MACC and ammonia MACC. However, there are some indications that in Latvia, sustainable agricultural production needs to be shifted towards a more integrated and circular pattern, taking into account the current geographical, biological, social and economic considerations [42]. The information collected was the basis for a discussion on a new Strategic Plan for the Common Agricultural Policy of Latvia for 2023-2027 (Latvia-CAP Strategic Plan). The scientifically justified GHG and ammonia abatement measures posed significant challenges for both policymakers and farmer lobby organizations. On the one hand, the measures were essential for the implementation of the EU Farm to Fork strategy and the National GHG and Air Quality Commitments; on the other hand, it was difficult to link the measures to specific support. Policymakers had to design a mechanism for implementation and control of the measures, as they had to ensure that public funding was used properly. However, this control mechanism may not become too bureaucratic and burdensome for farmers, which would undermine their involvement in the implementation of the measures. The influence of lobby organizations, which wanted to change the intensity of implementation of and eligibility criteria for the measures and increase the amount and intensity of financial support, should also be taken into account. In view of the above, a new Strategic Plan for the Common Agricultural Policy of Latvia for 2023-2027 was drawn up. This document did not satisfy anyone and was therefore considered to be a good trade-off. At the same time, a question arose to what extent the national CAP Strategic Plan is able to influence climate policy goals. Modifying the MACC approach also makes it possible to analyse current GHG abatement measures. The most important incentive for farmers to make changes on their farms is the availability of public funding to implement the measures. At the same time, the availability of such funding also provides opportunities for requesting information on the effect of GHG measures or for documenting the effect.
Therefore, the targets set by the National Energy and Climate Plan for 2021-2030 have mainly theoretical potential, and the measures and targets set by the Strategic Plan for the Common Agricultural Policy of Latvia for 2023-2027 (CAP) are practically measurable. Unlike the previous versions of the MACC, this one does not consider the marginal cost for farmers to implement the measure but the relative public cost (CAP funding) per ton of GHG (CO2eq) emissions reduced. The CAP targets, the assumptions of previous MACC projects on changes in the characteristics of emissions during the implementation of a measure, the current IPCC characteristics were used to determine the potential for GHG abatement. In total, the GHG abatement measures supported by the CAP contribute to 516 ktCO2eq reductions over five years. For comparison, a GHG emission reduction calculated for the first MACC project totals 7 653 ktCO2eq over a period of 13 years, which is five times less per year. It has to be acknowledged that the CAP MACC calculations do not include investment measures. For several measures, the CAP targets are lower than the real results achieved implementing the measures. It is therefore difficult to identify the real impacts of current CAP measures on achieving the Climate Action targets. At the same time, the MACC shows how much a reduction of 1 ton of CO2eq costs the public, allowing the public to assess the effectiveness of a policy according to the interests of a particular social group. The GHG abatement measures selected and evaluated scientifically only indicate the potential, while the real implementation is more complex and could significantly reduce the technological potential. However, it provides a basis for discussion and indicates tactical priorities in policymaking. The next priority in developing the MACC for Latvia is to integrate the value of ecosystem services into the agricultural MACC, which is still in process.
3.2.4. Using MACC in Creating New Knowledge and Improving Data Gathering
Further development of MACC methodology was proceeded with inclusion of ecosystem services value in the evaluation of measures to reduce GHG, ammonia emissions and increase CO2 sequestration. MACC methodology were prepared for the inclusion of ecosystem services value in the evaluation of measures to reduce GHG, ammonia emissions and increase CO2 sequestration. The use of ecosystem services value in MACC analysis has not been used in research so far and is considered an innovative approach. The inclusion of the social aspect in MACC analysis expands the scope of the analysis and can theoretically expand the applicability of MACC for the development of agricultural, environmental and climate policy or legal framework, policy analysis and impact assessment.
Climate change mitigation measures do not/cannot in themselves create ecosystem services, but their implementation may have a positive or negative impact on the volume and value of the ecosystem services concerned. Primarily the assessment of ecosystem services is carried out at the ecosystem level, it creates all international databases – when selecting a specific ecosystem, one can look for its association with a specific service and then determine the value of the service/service set. Repeating a similar approach in the case of MACC measures it is important:
- • To identify for each measure the type of land management/biome/ecosystem to which it relates;
- • To understand which services of the relevant ecosystem are affected by the measure if it is introduced (assuming that the impact is positive);
- • To find the value of the ecosystem service(s) to be linked to the relevant ecosystem.
With regard to the use of the value of ecosystem services in the MACC analysis, studies show that in the case of negative costs (as in the case of ecosystem services, unless it is non-services (disservices)), caution is desirable in the use of MACC [54,55,56,57,58], because:
- • The climate change mitigation potential of negative cost-negative measures may be overestimated without paying sufficient attention to measures that are less cost-effective;
- • Negative cost measures are adequately assessed as the most cost-effective or income-generating, but their mutual ranking may not be correct due to the peculiarities of the mathematical algorithm of the method.
At present, there is no well-established approach available to address this shortcoming of the MACC method, so it can be assumed that “negative cost measures” are perceived as equal in ranking. As a result, the results of the MACC analysis with embedded ecosystem services should not be directly interpreted in the form of a ranking of the measure, but should be used as an indication of the existence and significance of goodwill (the result of the calculations changes significantly), drawing the attention of decision-makers to the need to consider the inclusion of this type of value in policy decision-making processes, as well as to consider support for further research.
In Table 3 authors have summarized contributions from main stages in the development of the MACC approach.
4. Conclusions
Analytical assessment of country’s level experience in moving towards agricultural decarbonization by using MACC as supportive tool has showed that MACC has helped to prepare several strategic documents, like Rural Development Programme, National Inventory Reports of GHG and Ammonia Emissions, National Energy and Climate Plan, Air Pollution Action Plan, has been used for farmer education and as conversation platform with other non-ETS sectors, has brought necessary information for economic models of climate and agricultural development.
By tracking main points in Latvia’s experience in developing theoretical background by elaborating different versions of MACC and transferring gained theoretical knowledge into political agenda and national targets following recommendations can be drawn up:
- • By recognizing unique characteristics of different farm types (e.g. intensive, extensive, organic etc.) principle of targeted and equitable distribution of support should be implemented when developing climate related policies and framework for support measures.
- • Comprehensive assessment of GHG mitigation measures, considering their economic, environmental and social impacts, as well as understanding their multiple benefits and robust data collection and analysis can serve as background for data-driven policymaking.
- • Facilitation of knowledge sharing, like knowledge exchange between scientists, policymakers, farmers and other stakeholders, and capacity building, like training and technical assistance to farmers to implement climate friendly practices, can boost more faster transition to carbon neutrality.
Author Contributions
Conceptualization, D.P. and K.N.-L.; methodology, D.P.; validation, K.N.-L. and A.L.; formal analysis, K.F.; investigation, A.L.; resources, K.F., A.L.; writing—original draft preparation, K.F., K.N.-L., A.L. and D.P.; writing—review and editing, D.P.; visualization, D.P. and K.F.; supervision, D.P.; project administration, D.P.; funding acquisition, D.P. All authors have read and agreed to the published version of the manuscript.
Funding
The research was carried out with the financial support of the Latvian Ministry of Agriculture and the Rural Support Service project “Updating the marginal abatement cost curves (MACC) of Latvian agriculture for the decarbonization of agriculture”, research No. 25-00-S0INZ03-000034.
Data Availability Statement
No new data were created during this study.
Conflicts of Interest
The authors declare no conflicts of interest. The funders had no role in the design of the study; in the collection, analyses, or interpretation of data; in the writing of the manuscript; or in the decision to publish the results.
References
- United Nations Department of Economic and Social Affairs. World Economic Situation and Prospects 2024. 2024. 196 p. Available online: https://www.un.org/development/desa/dpad/wp-content/uploads/sites/45/WESP_2024_Web.pdf.
- Fukase, E. and Will, M. Economic growth, convergence, and world food demand and supply. World Development, 2020, Vol. 132. Available online: . [CrossRef]
- Turk, J. Meeting projected food demands by 2050: Understanding and enhancing the role of grazing ruminants. Animal Science, 2016, Vol. 94, pp. 53–62. Available online: . [CrossRef]
- Warner, K., Hamza, M., Oliver-Smith, A., Renaud, F. and Julca, A. Climate change, environmental degradation and migration. Natural Hazards, 2009, Vol. 55, pp. 689–715. Available online: . [CrossRef]
- Pro Oxygen. Latest daily CO2. 2024. Available online: https://www.co2.earth/daily-co2.
- Hatfield-Dodds, S., Schandl, H., Newth, D., Obersteiner, M. Cai, Y., Baynes, T., West, J. and Havlik, P. Assessing global resource use and greenhouse emissions to 2050, with ambitious resource efficiency and climate mitigation policies. Cleaner Production, 2017, Vol. 144, pp. 403-414. Available online: . [CrossRef]
- Komarek, A. M., Dunston, S., Enahoro, D., Charles, J., Godfray, H., Herrero, M., Mason-D’Croz, D., Rich, M. K., Scarborough, P., Springmann, M., Sulser, B.T., Wiebe, K. and Willenbockel, D. Income, consumer preferences, and the future of livestock-derived food demand. Global Environmental Change, 2021, Vol. 70. Available online: . [CrossRef]
- Maximillian, J., Brusseau, M. L., Glenn, E.P. and Matthias, A.D. Pollution and environmental perturbations in the global system. Environmental and Pollution Science, Third Edition, 2019, pp. 457–476. Available online: . [CrossRef]
- Mora, C., Rollins, R.L., Taladay, K., Kantar, M. B., Chock, M., Shimada, M. and Franklin, E. C. Bitcoin emissions alone could push global warming above 2 °C. Nature Climate Change, 2018, Vol. 8, pp. 931–933. Available online: . [CrossRef]
- United Nations. The Paris Agreement. 2015, 27 p. Available online: https://unfccc.int/files/essential_background/convention/application/pdf/english_paris_agreement.pdf.
- Chen, L., Msigwa, G., Yang, M., Osman, I.A., Fawzy, S., Rooney, W. D. and Yap, P. S. Strategies to achieve a carbon neutral society: a review. Environmental Chemistry Letters, 2022, Vol. 20, pp. 2277–2310. Available online: doi.org/10.1007/s10311-022-01435-8.
- Wei, Y. M., Chen, K., Kang, J.N., Chen, W., Wang, X. Y. and Zhang X. Policy and Management of Carbon Peaking and Carbon Neutrality: A Literature Review. Engineering, 2022, Vol. 14, pp. 52-63. [CrossRef]
- Usman, I. M. T., Ho, Y. C., Baloo, L., Lam, M. K. and Sujarwo, W. A comprehensive review on the advances of bioproducts from biomass towards meeting net zero carbon emissions (NZCE). Bioresource Technology, 2022, Vol. 366. Available online: . [CrossRef]
- European Union. Clean Planet for all A European strategic long-term vision for a prosperous, modern, competitive and climate neutral economy. COM/2018/773, 2018. Available online: https://eur-lex.europa.eu/legal-content/EN/TXT/?uri=CELEX:52018DC0773.
- Climate Action Tracker. CAT net zero target evaluation. 2023. Available online: https://climateactiontracker.org/global/cat-net-zero-target-evaluations/.
- Allen, M., Frame, D., Huntingford, C., Huntingford, C., Jones, C. D., Lowe, J. A., Meinshausen, M., and Meinshausen, N. Warming caused by cumulative carbon emissions towards the trillionth tonne. Nature, 2009, 458(7242), 1163–1166. Available online:. [CrossRef]
- Hale, T., Smith, S. M., Black, R., Cullen, K., Fay, B., Lang, J., and Mahmood, S. Assessing the rapidly-emerging landscape of net zero targets. Climate Policy, 2021, Vol. 22(1), pp. 18–29. Available online: . [CrossRef]
- IPCC. Climate Change 2014: Synthesis Report. Contribution of Working Groups I, II and III to the Fifth Assessment Report of the Intergovernmental Panel on Climate Change. [Core Writing Team, R.K. Pachauri and L.A. Meyer (eds.)]. IPCC, 2014, Geneva, Switzerland, 151 pp. Available online: https://www.ipcc.ch/site/assets/uploads/2018/05/SYR_AR5_FINAL_full_wcover.pdf.
- Levin, K., Rich, D., Ross, K., Fransen, T. and Elliott, C. Working paper: Designing and Communicating Net-Zero Targets, 2020, 30 p. Available online: https://www.wri.org/research/designing-and-communicating-net-zero-targets.
- Kesicki, F. Marginal abatement cost curves for policy making -expert-based vs. model-derived curves. Environmental Science & Policy, 2010, 14(8), pp. 1195-1204. Available online: . [CrossRef]
- Bockel, L., Sutter, P. and Jonsson, M. Using Marginal Abatement Cost Curves to Realize the Economic Appraisal of Climate Smart Agriculture Policy Options. The EX Ante Carbon-balance Tool, 2012. Available online: https://openknowledge.fao.org/server/api/core/bitstreams/33830c17-609f-4f0f-a034-b471818ecb59/content.
- Blumstein, C. and Stoft, S. E. Technical efficiency, production functions and conservation supply curves. Energy Policy, 1995, Vol. 23(9), pp. 765–768. Available online: . [CrossRef]
- Difiglio, C., Duleep, K. G. and Greene, D. L. Cost Effectiveness of Future Fuel Economy Improvements. The Energy Journal, 1990, Vol. 11(1), pp. 65–87. Available online: . [CrossRef]
- Rosenfeld, A., Atkinson, C., Koomey, J., Meier, A., Mowris, R. J. and Price, L. Conserved energy supply curves for U.S. buildings. Contemporary Economic Policy, 1993, Vol. 11(1), pp. 45–68. Available online: . [CrossRef]
- Rentz, O., Haasis, H.-D., Jattke, A., Ruβ, P., Wietschel, M. and Amann, M. Influence of energy-supply structure on emission-reduction costs. Energy, 1994, Vol. 19(6), pp. 641–651. Available online: . [CrossRef]
- Jackson, T. Least-cost greenhouse planning supply curves for global warming abatement. Energy Policy, 1991, Vol. 19(1), pp. 35–46. Available online: . [CrossRef]
- Mills, E., Wilson, D. and Johansson, T. B. Getting started: no-regrets strategies for reducing greenhouse gas emissions. Energy Policy, 1991, Vol. 19(6), pp. 526–542. Available online: . [CrossRef]
- Sitnicki, S., Budzinski, K., Juda, J., Michna, J. and Szpilewicz, A. Opportunities for carbon emissions control in Poland. Energy Policy, 1991, Vol. 19(10), pp. 995–1002. Available online: . [CrossRef]
- Kesicki, F. and Ekins, P. Marginal abatement cost curves: a call for caution. Climate Policy, 2012, Vol. 12(2), pp. 219–236. Available at: . [CrossRef]
- Blok, K., Worrell, E., Cuelenaere, R. and Turkenburg, W. The cost effectiveness of CO2 emission reduction achieved by energy conservation. Energy Policy, 1993, Vol. 21(6), pp. 656–667. Available online: . [CrossRef]
- Haoqi, Q., Libo, W. and Weiqi, T. “Lock-in” effect of emission standard and its impact on the choice of market based instruments. Energy Economics, 2017, Vol. 63, pp. 41–50. Available online: . [CrossRef]
- Bauman, Y., Lee, M. and Seeley, K. Does Technological Innovation Really Reduce Marginal Abatement Costs? Some Theory, Algebraic Evidence, and Policy Implications. Environmental and Resource Economics, 2007, Vol. 40(4), pp. 507–527. Available at: . [CrossRef]
- Downing, P. B. and White, L. J. Innovation in pollution control. Journal of Environmental Economics and Management, 1986, Vol. 13(1), pp. 18–29. Available online: . [CrossRef]
- Moran, D., Macleod, M., Wall, E., Eory, V., Mcvittie, A., Barnes, A., Rees, B., Pajot, G., Matthews, R., Smith, P. and Moxey, A. Marginal abatement cost curves for UK agriculture, forestry, land-use and land-use change sector out to 2022. IOP Conference Series: Earth and Environmental Science, 2009, Vol. 6(24), 242002. Available online: . [CrossRef]
- Moran, D., MacLeod, M., Wall, E., Eory, V., McVittie, A., Barnes, A., Rees, R. M., Topp, C. F. E., Pajot, G., Matthews, R., Smith, P. and Moxey, A. Developing carbon budgets for UK agriculture, land-use, land-use change and forestry out to 2022. Climatic Change, 2010, Vol. 105(3–4), pp. 529–553. Available online: . [CrossRef]
- O’Brien, D., Shalloo, L., Crosson, P., Donnellan, T., Farrelly, N., Finnan, J., Hanrahan, K., Lalor, S., Lanigan, G., Thorne, F. and Schulte, R. An evaluation of the effect of greenhouse gas accounting methods on a marginal abatement cost curve for Irish agricultural greenhouse gas emissions. Environmental Science & Policy, 2014, Vol. 39, pp. 107–118. Available online: . [CrossRef]
- Pellerin, S., Bamière, L., Angers, D., Béline, F., Benoit, M., Butault, J.-P., Chenu, C., Colnenne-David, C., De Cara, S., Delame, N., Doreau, M., Dupraz, P., Faverdin, P., Garcia-Launay, F., Hassouna, M., Hénault, C., Jeuffroy, M.-H., Klumpp, K., Metay, A. and Chemineau, P. Identifying cost-competitive greenhouse gas mitigation potential of French agriculture. Environmental Science & Policy, 2017, Vol. 77, pp. 130–139. Available online: . [CrossRef]
- Ikkatai, S. Emission reductions policy mix: Industrial sector greenhouse gas emission reductions. In: Climate Change and Global Sustainability, 2013, pp 164-177. Available online: . [CrossRef]
- Wang, W., Koslowski, F., Nayak, D. R., Smith, P., Saetnan, E., Ju, X., Guo, L., Han, G., de Perthuis, C., Lin, E. and Moran, D. Greenhouse gas mitigation in Chinese agriculture: Distinguishing technical and economic potentials. Global Environmental Change, 2014, Vol. 26, pp. 53–62. Available online: . [CrossRef]
- McGetrick, J. A., Bubela, T. and Hik, D. S. Automated content analysis as a tool for research and practice: a case illustration from the Prairie Creek and Nico environmental assessments in the Northwest Territories, Canada. Impact Assessment and Project Appraisal, 2016, Vol. 35(2), pp. 139–147. Available online: . [CrossRef]
- Lēnerts, A., Popluga, D., Naglis-Liepa, K., Rivža P. Fertilizer use efficiency impact on GHG emissions in the Latvian crop sector. Agronomy Research, 2016, Vol. 14(1), pp. 123-133. Available online: https://agronomy.emu.ee/wp-content/uploads/2016/05/Vol14-_nr1_Lenerts.pdf.
- Naglis-Liepa. K., Popluga D. and Rivža. P. Typology of Latvian Agricultural Farms in the Context of Mitigation of Agricultural GHG Emissions. 15th International Multidisciplinary Scientific Geoconference SGEM 2015 “Ecology, Economics, Education and Legislation” Conference Proceedings, 2015, Vol. II, pp. 513-520.
- Popluga, D., Naglis-Liepa, K., Lenerts, A., Rivza, P. Marginal abatement cost curve for assessing mitigation potential of Latvian agricultural greenhouse gas emissions: case study of crop sector. 17th International multidisciplinary scientific GeoConference SGEM 2017: conference proceedings, 2017, Vol.17: Energy and clean technologies; Issue 41: Nuclear technologies. Recycling. Air pollution and climate change, pp. 511-518.
- Eory, V., Pellerin, S., Carmona Garcia, G., Lehtonen, H., Licite, I., Mattila, H., Lund-Sørensen, T., Muldowney, J., Popluga, D., Strandmark, L. and Schulte, R. Marginal abatement cost curves for agricultural climate policy: State-of-the art, lessons learnt and future potential. Journal of Cleaner Production, 2018, Vol. 182, pp. 705–716. Available online: . [CrossRef]
- De Cara, S. and Jayet, P.-A. Marginal abatement costs of greenhouse gas emissions from European agriculture, cost effectiveness, and the EU non-ETS burden sharing agreement. Ecological Economics, 2011, Vol. 70(9), pp. 1680–1690. Available online: . [CrossRef]
- De Cara, S., Houzé, M. and Jayet, P.-A. Methane and Nitrous Oxide Emissions from Agriculture in the EU: A Spatial Assessment of Sources and Abatement Costs. Environmental and Resource Economics, 2005, Vol. 32(4), pp. 551–583. Available online: . [CrossRef]
- Hediger, W. Modeling GHG emissions and carbon sequestration in Swiss agriculture: An integrated economic approach. International Congress Series, 2006, Vol. 1293, pp. 86–95. Available online: . [CrossRef]
- Golub, A., Hertel, T., Lee, H.-L., Rose, S. and Sohngen, B. The opportunity cost of land use and the global potential for greenhouse gas mitigation in agriculture and forestry. Resource and Energy Economics, 2009, Vol. 31(4), pp. 299–319. Available online: . [CrossRef]
- Pérez Dominguez, I., Britz, W. and Holm-Müller, K. Trading schemes for greenhouse gas emissions from European agriculture : A comparative analysis based on different implementation options. Revue d’études En Agriculture et Environnement, 2009, Vol. 90(3), pp. 287–308. Available online: . [CrossRef]
- Schneider, U. A., McCarl, B. A. and Schmid, E. Agricultural sector analysis on greenhouse gas mitigation in US agriculture and forestry. Agricultural Systems, 2007, Vol. 94(2), pp. 128–140. Available online: . [CrossRef]
- Beach, R. H., DeAngelo, B. J., Rose, S., Li, C., Salas, W. and DelGrosso, S. J. Mitigation potential and costs for global agricultural greenhouse gas emissions. Agricultural Economics, 2008, Vol. 38(2), pp. 109–115. Available online: . [CrossRef]
- Höglund-Isaksson, L., Winiwarter, W., Purohit, P., Rafaj, P., Schöpp, W. and Klimont, Z. EU low carbon roadmap 2050: Potentials and costs for mitigation of non-CO2 greenhouse gas emissions. Energy Strategy Reviews, 2012, Vol. 1(2), pp. 97–108. Available online: . [CrossRef]
- Kreišmane, Dz., Aplociņa, E., Naglis-Liepa, K., Bērziņa, L., Frolova, O., Lēnerts, A. Diet optimization for dairy cows to reduce ammonia emissions. International scientific conference proceedings “Research for Rural Development 2021”, 2021, Vol.36, pp. 36-43. Available online: . [CrossRef]
- Ekins, P., Kesicki, F., and Smith, A.Z.P. Marginal Abatement Cost Curves: A call for caution. 2011. [A report from the UCL Energy Institute to, and commissioned by, Grenpeace UK]. Available online: https://www.homepages.ucl.ac.uk/~ucft347/MACCCritGPUKFin.pdf.
- Levihn, F., Nuur, C., and Laestadius, S. Marginal abatement cost curves and abatement strategies: Taking option interdependency and investments unrelated to climate change into account. Energy, 2014, 76, 336–344. Available online: . [CrossRef]
- Ponz-Tienda, J. L., Prada-Hernández, A. V., Salcedo-Bernal, A., and Balsalobre-Lorente, D. Marginal Abatement Cost Curves (MACC): Unsolved Issues, Anomalies, and Alternative Proposals. In: R. Álvarez Fernández, S. Zubelzu, & R. Martínez (Eds.), Carbon Footprint and the Industrial Life Cycle (pp. 269–288). 2017. Springer International Publishing. Available online: . [CrossRef]
- Taylor, S. The ranking of negative-cost emissions reduction measures. Energy Policy, 2012, 48, 430–438. Available online: . [CrossRef]
- Ward, D. J. The failure of marginal abatement cost curves in optimising a transition to a low carbon energy supply. Energy Policy, 2014, 73, 820–822. Available online: . [CrossRef]
Figure 1.
Main stages in the development of the MACC approach as supportive tool in building national way towards decarbanization.
Figure 1.
Main stages in the development of the MACC approach as supportive tool in building national way towards decarbanization.
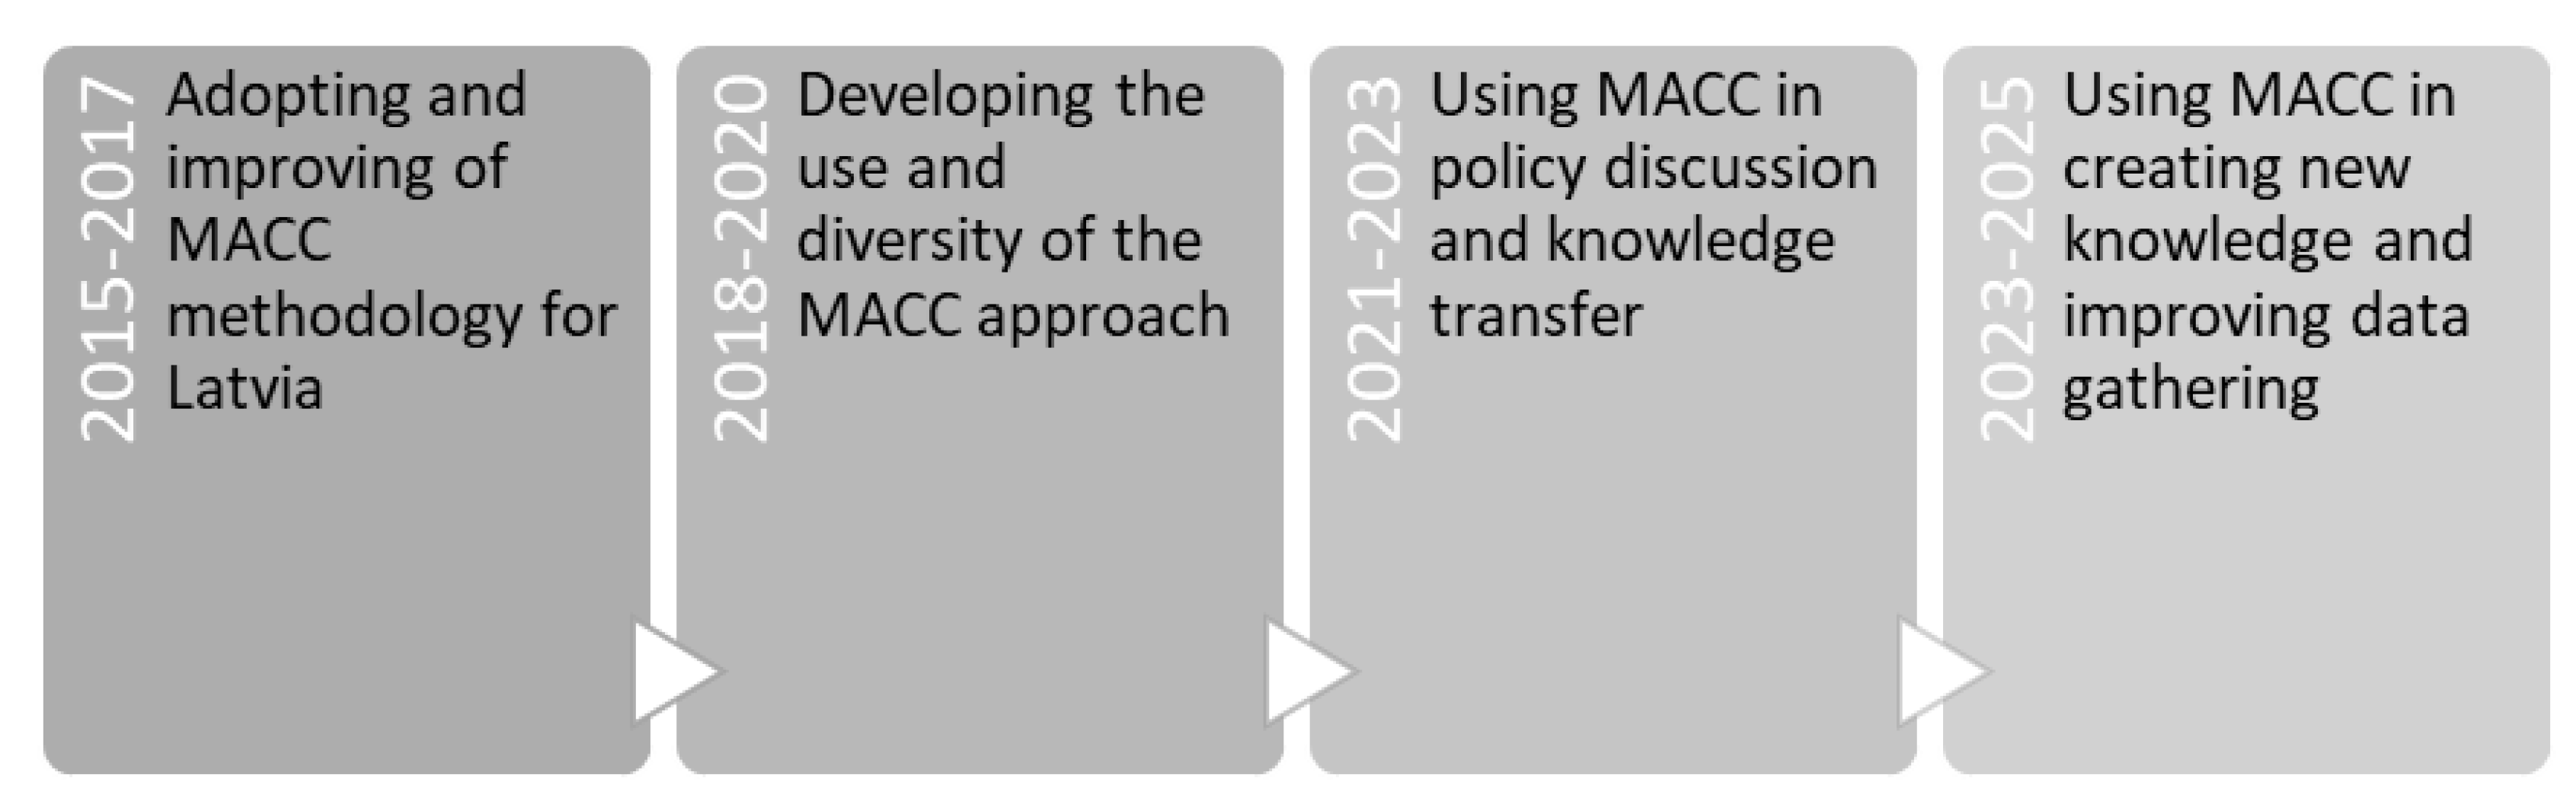
Figure 2.
Stylized examples for an expert-based (left) and model-derived MACC (right).
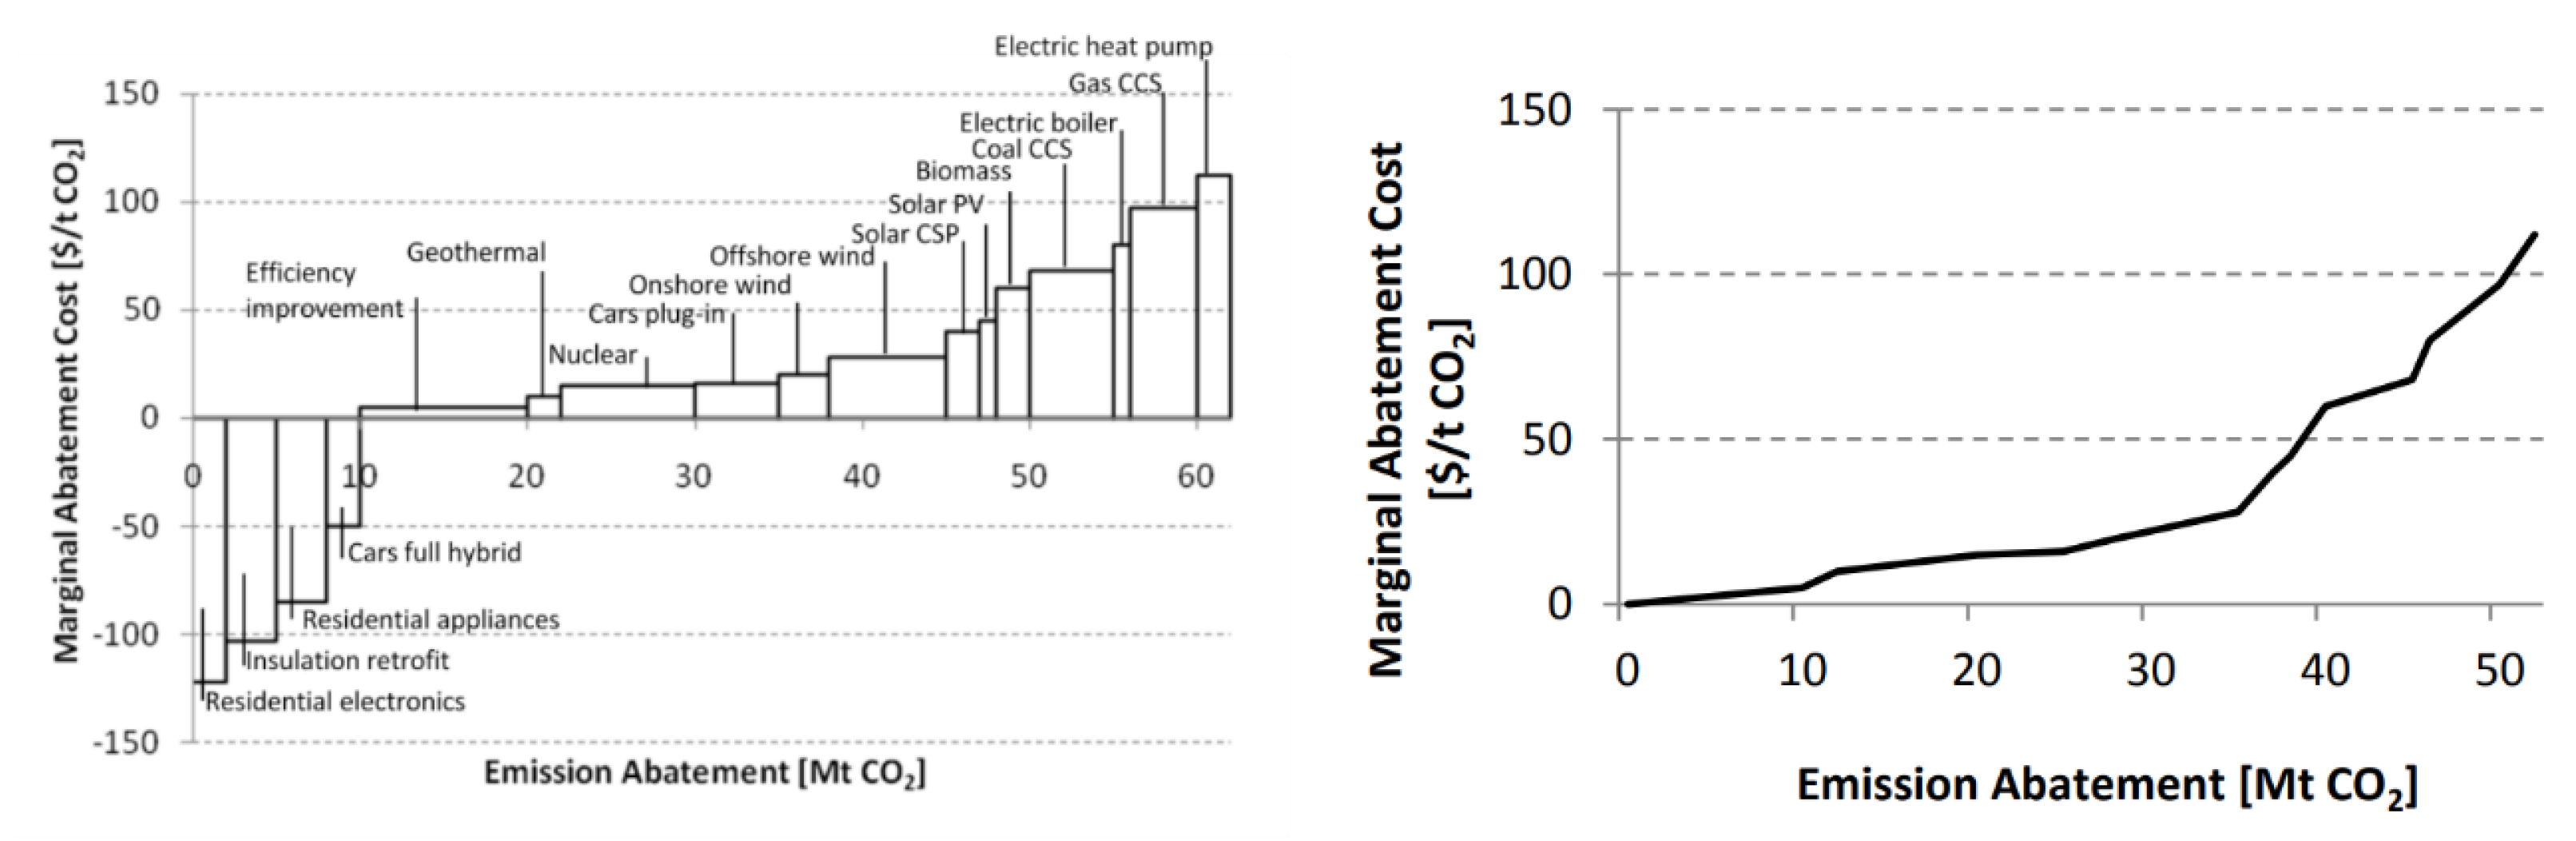

Table 1.
Main methods, approach, focus and outcome of each thematic block of study.
| Thematic blocks of study | Methods | Approach | Focus | Output |
|---|---|---|---|---|
| Block 1: MACC theoretical and historical analysis | Literature review Analysis and synthesis |
Comprehensive evaluation of MACC development over time from scientific literature | Identification of modifications, diversity, and comparative strengths/weaknesses of MACCs | Understanding of evidence-based foundation for cost-effectiveness modelling and policy assessment |
| Block 2: MACC case study application | Expert judgement and experience | Utilize project results from Latvian climate policy initiatives | Focus on how MACCs are integrated and applied within Latvia’s national climate policy frameworks for actionable insights | Transforms theoretical MACC concepts into actionable policy decisions |
Table 2.
Strengths and weaknesses of expert judgement-based MACCs and model derived MACCs.
| Analysed aspect | Expert judgement-based MACCs | Model-derived MACCs |
|---|---|---|
| Strengths | Extensive technological detail Possibility of considering technology specific market distortions Easy understanding of technology-specific abatement curves |
Bottom-up Model explicitly maps energy technologies in detail Top-down Macroeconomic feedbacks and costs considered Both Interactions between measures included Consistent baseline emission pathway Intertemporal interactions incorporated Possibility to represent uncertainty Incorporate of behavioural factors Comparably quick generation |
| Weaknesses | Lack of integration of behavioural factors Absence of interactions and dependencies between mitigation measures Potential for inconsistent baseline emissions No representation of intertemporal interactions Limited representation of uncertainty Sometimes restricted to a single economic sector, without the ability to combine abatement curves across sectors No representation of macroeconomic feedbacks Simplified technological cost structure |
Bottom-up No macroeconomic feedbacks Direct cost in the energy sector Risk of penny-switching No reflection of indirect rebound effect Top-down Model lacks technological detail Possible unrealistic physical implications Both No technological detail in representation of MAC curve Assumption of a rational agent, disregarding most market distortions |
Table 3.
Summary of contributions from main stages in the development of the MACC approach.
| Period | Stage | Action | Importance and practical use |
|---|---|---|---|
| 2015-2017 | Adopting and improving of MACC methodology for Latvia | Developed MACC for five typical farm clusters | Created a methodology suitable for Latvia created using the cluster method Prepared necessary methodology (scientific monograph) for use of MACC approach Analysed several dozen GHG mitigation measures and 17 were selected for deeper analysis and practical implementation |
| 2018-2020 | Developing the use and diversity of the MACC approach | Developed MACC with C capture measures and analysed LULUCF and agriculture interaction | Estimated the overlap effect of multiple sectors (agricultural and LULUCF) Evaluated new C capture measures Used MACC for policy making Identified new research directions |
| 2021-2023 | Using MACC in policy discussion and knowledge transfer | Developed MACC with ammonia emission reduction measures and organized set of discussion events with farmers | Transferred knowledge to NGOs and farmers Prepared information for the improvement of climate and agricultural policy Prepared information for improvement of air quality policy |
| 2023-2025 | Using MACC in creating new knowledge and improving data gathering | Developed MACC for CAP GHG reduction measures | Evaluated new GHG emissions reduction measures in agriculture Developed recommendations for the accounting of agricultural data for the evaluation of the reducing effects of GHG and ammonia emissions |
| Developed MACC including ecosystem services evaluation | Developed a methodology for incorporating the value of ecosystem services into the MACC Developed additional variations of the MACC curves for evaluating the cost effectiveness of GHG and ammonia emission reduction measures, reflecting different rates of implementation stages of the measures |
Disclaimer/Publisher’s Note: The statements, opinions and data contained in all publications are solely those of the individual author(s) and contributor(s) and not of MDPI and/or the editor(s). MDPI and/or the editor(s) disclaim responsibility for any injury to people or property resulting from any ideas, methods, instructions or products referred to in the content. |
© 2025 by the authors. Licensee MDPI, Basel, Switzerland. This article is an open access article distributed under the terms and conditions of the Creative Commons Attribution (CC BY) license (http://creativecommons.org/licenses/by/4.0/).
Copyright: This open access article is published under a Creative Commons CC BY 4.0 license, which permit the free download, distribution, and reuse, provided that the author and preprint are cited in any reuse.


