Submitted:
06 November 2025
Posted:
09 November 2025
You are already at the latest version
Abstract
Electrochemical mechanical polishing (ECMP) has emerged as a promising alternative to conventional chemical mechanical polishing (CMP), particularly for addressing challenges in planarizing ruthenium (Ru)—a critical barrier-layer material in advanced copper interconnects. This study systematically investigates the triboelectrochemical behavior and underlying mechanisms of ruthenium during ECMP, with a focus on the effects of mechanical power (induced by load and rotational speed) and applied potential. Through open-circuit potential measurements, potentiodynamic polarization, and electrochemical impedance spectroscopy (EIS), we demonstrate that mechanical energy input significantly enhances electrochemical reactions, with rotational speed exerting a more pronounced influence than applied load. Notably, the corrosion potential increases with load at constant speed, while the friction coefficient rises as rotational speed decreases. EIS analyses further reveal that higher rotational speeds promote the formation and growth of a thicker passive oxide film on ruthenium surfaces. These insights provide a theoretical foundation for optimizing ECMP processes toward high-efficiency, high-selectivity, and low-damage planarization of Ru-based interconnect structures.
Keywords:
electrochemical mechanical polishing
; ruthenium
; mechanical power
; load
; rotating speed
; applied potential
1. Introduction
As integrated circuit (IC) technology nodes continue to shrink to 10 nanometers and below, challenges such as resistance-capacitance (RC) delay, electromigration reliability, and interfacial stability in copper (Cu) interconnect structures have become increasingly prominent, emerging as critical factors constraining further improvements in device performance [1-3]. To reduce RC delay and enhance integration density, Cu interconnects must be integrated with low-dielectric-constant (low-k) materials within dual-damascene structure [4–6]. However, low-k dielectric materials typically exhibit low mechanical strength and are prone to damage, making them susceptible to surface defects caused by excessive pressure during traditional chemical mechanical polishing (CMP) processes. This poses significant challenges for planarization technology [7–10]. In advanced manufacturing nodes, the thickness of the barrier layer has been reduced to below 3.3nm. The traditional tantalum/tantalum nitride (Ta/TaN) bilayer structure struggles to meet requirements due to its high resistivity (Ta: 14 μΩ·cm; TaN: 200 μΩ·cm) and process complexity [11]. Ruthenium (Ru), a representative platinum group metal, has gained widespread recognition as one of the most promising novel barrier layer materials since its proposal by Chyan et al. [12] and Josell et al. [13] in 2003. Its advantages include low resistivity (7.1 μΩ·cm), high melting point (2250°C), excellent adhesion to copper, outstanding resistance to electromigration, and the ability to enable direct electroplating without a copper seed layer [14–16]. Research by Arunagiri et al. [17] further confirmed that a 5 nm-thick Ru film can effectively block copper diffusion into silicon at temperatures up to 450°C. Consequently, at the 14 nm node and below, Ru is progressively becoming the preferred material to replace Ta/TaN [18–20].
In copper interconnect manufacturing, chemical mechanical polishing (CMP) is a critical process for achieving both global and local planarization [21,22]. As technology nodes advance below 14 nanometers, the CMP process for copper thin films has evolved from the traditional two-step method (removing bulk copper and residual copper) to a one-step method. This approach not only requires high-efficiency copper removal but also demands precise stopping on the ruthenium barrier layer, imposing extremely stringent requirements on the removal rate selectivity between copper and ruthenium (typically needing to be greater than 100:1) [2,3,22]. To overcome the inherent drawback of traditional CMP, which is prone to causing mechanical damage when processing low-k materials, electrochemical mechanical polishing (ECMP) technology has emerged. ECMP synergistically combines electrochemical dissolution with mechanical abrasion. By precisely controlling the electrode potential to regulate the formation and removal of surface oxidation/passivation layers, it holds the potential to achieve efficient and highly selective planarization at lower pressures, demonstrating broad application prospects [23–25].
The core performance of ruthenium CMP/ECMP processes lies in the formulation design of the polishing slurry (or electrolyte). Research indicates that the oxidizer is key to affecting the ruthenium removal rate. KIO₄, as a strong oxidizer, has been extensively studied. However, its excessively strong oxidizing power may lead to the formation of a thick and dense oxide layer on the ruthenium surface, which can instead hinder removal and exacerbate galvanic corrosion of copper [26–30]. In comparison, H₂O₂ is relatively milder but often requires synergistic use with complexing agents (such as EDA, DTPA-5K) to enhance efficiency [31,32]. Recently, new methods such as the KIO₄/FeIII-NTA-based advanced oxidation system [1], and utilizing UV-activated K₂S₂O₈ [33] or Al₂O₃ particles to catalyze H₂O₂ to generate ·OH radicals [34] have been developed. These methods significantly increase the ruthenium removal rate by generating highly active oxidizing species.
Suppressing galvanic corrosion and achieving high selectivity represent another major challenge in CMP for ruthenium-based copper interconnects. The combination of BTA with ascorbic acid [29] or potassium molybdate [32] has been demonstrated to effectively reduce the Cu/Ru corrosion potential difference and form a dense passivation film. In line with green and environmentally friendly trends, eco-friendly inhibitors such as phytic acid [21,22,35], pyrazine and its derivatives (e.g., aminopyrazine) [36], and methionine derivatives (e.g., Fmoc-Met-OH) [36] have also shown excellent performance. Research reveals that these inhibitors often form protective layers on the metal surface through physicochemical mixed adsorption, and their synergistic effects (e.g., HEDP with PA [21], TAZ with PA [22], AP with sarcosine [2]) can further enhance inhibition efficiency and surface quality.
The pH environment of the polishing solution and the choice of pH regulators are also critically important. While inorganic bases (e.g., KOH) offer low cost, they may introduce metallic ion contamination. Organic bases (e.g., AMP, DEA, TEAH) not only adjust pH but also possess functions such as complexation, dispersion, and even surfactant properties, which help enhance the stability and polishing performance of the slurry [37, 38]. Research has found that using AMP as a pH regulator can achieve a remarkably high Cu/Ru selectivity ratio of 598:1 and a low surface roughness of 0.76 nm [3].
It is noteworthy that the role of abrasives in the CMP process extends beyond mere "mechanical abrasion." Research by Di et al. [34] demonstrated that Al₂O₃ particles can catalyze H₂O₂ to generate ·OH radicals via a Fenton-like reaction, significantly enhancing the chemical action on ruthenium and achieving nearly a fivefold increase in removal rate. The KIO₄/FeIII-NTA system developed by You et al. [1] even achieved a high ruthenium removal rate of 1500 Å/min under abrasive-free conditions. Meanwhile, Wu et al. [26] accomplished equivalent removal rates for Ta and Ru by controlling IO₄⁻ concentration, providing a new approach for heterogeneous surface planarization.
In the field of ECMP research, Kristin [39] systematically optimized the electrolyte formulations for copper and ruthenium polishing through electrochemical methods. Bian et al. [29] investigated the synergistic effect of BTA and AA in HEDP-based electrolytes, providing an effective strategy for controlling Cu/Ru galvanic corrosion. Electrochemical characterization techniques (such as potentiodynamic polarization and EIS) have been widely employed to elucidate the material removal and corrosion mechanisms during CMP/ECMP processes [40,41]. Studies indicate that the oxidation process of ruthenium is diffusion-controlled, and the morphology and thickness of its surface oxides (e.g., RuO₂, RuO₃) are strongly dependent on the pH value of the polishing solution and the oxidizer concentration [30,41]. Jiang et al. [42] systematically investigated the regulatory mechanism of ionic strength on the CMP performance of ruthenium in H₂O₂-based polishing slurries.
Although scholars worldwide have made significant progress in the field of ruthenium CMP/ECMP, the understanding of several key aspects remains insufficiently deep and systematic. These include the triboelectrochemical behavior of ruthenium during the ECMP process, the dynamic coupling mechanism between mechanical and electrochemical energy, the dynamic formation and removal laws of surface oxide layers under mechanical action, and the real-time synergistic mechanisms of multi-component additives under dynamic polishing conditions.
Based on this, this paper aims to systematically investigate the triboelectrochemical behavior of ruthenium during the ECMP process, with an in-depth exploration of the effects of applied force, linear velocity, and applied potential on the surface state, corrosion behavior, film formation mechanism, and material removal characteristics of ruthenium. The study seeks to elucidate the synergistic mechanism between mechanical and electrochemical interactions at the atomic/molecular scale, thereby providing a solid theoretical foundation and practical guidance for achieving efficient, high-precision, and low-damage planarization of ruthenium-based copper interconnect structures.
2. Experimental
The experiment system configuration is shown as Figure 1. The ECMP tool operates in a 2D linear motion. All electrochemical experiments were performed at room temperature with a standard three electrode setup using Ru foil (Goodfellow Co., purity= 99.9%) working electrode (WE), a copper platen counter electrode, and a platinum foil reference electrode. The basic electrolyte composition in the experiments consisted of 20 wt.% hydroxyethylidenediphosphoric acid (mass fraction), 0.5 wt.% benzotriazole and 0.3 wt.% ascorbic acid. In this study, the electrochemical measurements including potentiodynamic polarization test and electrochemical impedance spectroscopy (EIS) were carried out using a computer-controlled electrochemical analyzer, CHI604B (CH Instrument).
Linear sweep voltammetry (LSV) analysis which is irreversible potentiodynamic measurement carried out the current change following potential increase step by step. For all potentiodynamic experiments potential region were employed from -0.5 to 2.0 V vs.Pt at a scan rate of 5 mV s-1. All EIS studies were performed using a 5 mV amplitude sinusoidal AC voltage signal. In order to avoid the low-frequency signal drift, we chose the frequency range of 20Hz-20kHz through appropriate selection of low-frequency to generate a quasi-steady-state result. The ZSimp Win version 3.1 was used to fit the EIS data by complex nonlinear least square (CNLS) analysis. For each EIS test, the electrode was held for 10 min to form the passive film. Tripathi et al. [43] claimed that the impedance behavior did not vary significantly no matter whether the electrode rotate or not, hence in this work EIS tests were performed in static condition.
For all wafer polishing experiments, the pad was perforated with holes of 1 mm diameter at regular intervals, with an overall pad porosity of approximately 6.20%. Fresh electrolyte was used for each experiment. Before each experiment, the wafer sample was polished by using 3000 grit sand paper and 1 μm diamond grit suspension to obtain a mirror finish.
3. Results and Discussions
3.1. Influence Mechanism of Force and Linear Velocity on the Triboelectrochemical Performance of Ruthenium ECMP
Figure 2 shows the Tafel curves of the Ru samples measured during polishing under different conditions. Two different loads were applied on the sample at four different rotating speeds, 10, 30, 60, and 120 rpm, respectively, under loads of 2 N and 10 N. These curves are composed of sweeping potential on the Y axis and absolute current on the X axis in a logarithmic scale.
The relationship of the corrosion potential, corrosion current, loads and rotating speeds are shown in Figure 3. In Figure 2 and Figure 3, the curves obtained by applying either 2 or 10 N down force have lower corrosion potentials than that without abrasion. The reduction of Tafel curves indicates the effect of polishing. In this tribo-process, where abrasion is generated through friction, no matter what loads and speeds are applied, those Tafel curves follow the same trend. This means that the ruthenium sample being polished is prone to be attacked by the anodic reactions due to less protective oxide layer. Hence, the sample surface appears to be more active (with low corrosion potential and high corrosion current in Figure 2 and Figure 3). This indicates that during ECMP, electrochemical reactions can be enhanced by the increase in mechanical energy (load or rotating speed). Figure 3 shows that the speed is more pronounced than the load.
From Figure 3, it is also interesting to note that the corrosion potential increases with an increased load at the same speed. It can be explained by following. According to Pourbaix, Ru appears to be a very noble metal; according to his thermodynamic data, Ru is unoxidizable in acid solution below ca. 0.74V (SHE) or 0.10V (SMSE). Of all the Pt group elements, Ru has higher tendency for oxidation [44]. On exposure to atmosphere, Ru forms thin layer of oxide ~0.18 nm which is termed as native oxide or air exposed oxide [45]. Presence of native oxide on Ru can have effects on Ru ECMP. Lee et al. [46] have shown that the native oxide covered on Ru surface is transformed to unstable Ru2O3 film just after the immersion in CAN-containing acidic slurry and the OCP value of bare Ru is greater than that of Ru2O3. Since the electrochemistry of metals is important in ECMP process, it is necessary to discuss its basic principles. The open circuit potential (OCP) is the potential at which the metal is at an equilibrium state with the absence of any electrical perturbation, i.e. a natural state. The corrosion potential is the potential at which there is no current flow on the metal. Ideally, the corrosion potential is equal to the OCP. The higher the mechanical energy, the more the oxide layer was removed and the more bare Ru was exposed.
The friction coefficient is denoted by the ratio of the friction force generated at the interfaces and the normal force. In Figure 4, the friction coefficient was measured during polishing when applying 10 N at different rotating speeds without applied potential. In this figure, the y-axis is the friction coefficient and the x-axis is the polishing time in seconds. The total polishing time was 20 min. It is seen that the friction coefficient increase with the decrease of the rotating speeds. From experiments, we also find that the friction coefficient obtained under 2 N are higher than that of 10 N under 60 rpm.
Surface changes after polishing under different rotating speeds without applied potential were monitored electrochemically using OCP measurements. Figure 5 shows OCP measurements in different treating conditions. The increase in OCP after LSV measurement can be attributed to a substantial growth of a surface oxide and the increase in the ratio of cathodic to anodic area. While there is a decrease in OCP with the increase of rotating speed, it is believed that there has been a breakdown of a passive film on the surface either formed by an oxide or another complex that has adhered to the surface. It is also believed that because there was a decrease in OCP that there has been an overall decrease in the ratio of cathodic to anodic area on the WE surface [47].
Impedance measurements can be used to reveal the properties of a metal surface. Figure 6 shows Nyquist plots of impedance results at different rotating speeds under loads of 10 N. All impedance spectra is fitted to the equivalent circuit shown in Figure 7, which exhibits two capacitive loops, one for the solid–electrolyte interface (Rct, CPE1) and one for the passive film (Rf, CPE2), while Rs corresponds to the solution phase resistance. However, if the resistance of the passive film (Rf) is included in the data fit, the values obtained are quite high and poorly fit, hence, this element has been omitted from all data fits. Physically this corresponds to the presence of a thick passive film whose thickness is poorly determined. Metal surfaces are known to be quite heterogeneous due to surface topography as well as consequent variations in reaction rates. This can be incorporated into impedance models phenomenologically by replacing the capacitances in the equivalent circuit of Figure 6 with constant phase elements (CPE), whose impedance is [43]:
where T is a frequency independent constant, ω is the angular frequency, and n is an exponent within the range of 0.5< n <1. When n approaches unity, the CPE behaves like an ideal capacitor, whereas when n is 1/2, the CPE behaves like a Warburg impedance.
From the research of Tripathi [43], we learned that there are only two major parameters, CPE1 and Rct, concerning about charactering the mechanical of passive film. The formation and growth of oxide are reflected by the increase in Rct, while the value of CPE1 decrement with the increment of the thickness of passive film. The best-fit values for CPE1 and Rct from the impedance spectra in Figure 7 are shown in Table 1.
The value of T1 decreases with the increment of the rotating speeds, while the value of Rct increase with the rotating speeds. This indicates that the thickness of passive film increases and the formation and growth of ruthenium oxide, respectively.
3.2. Effect of Applied Potential on the Surface Characteristics of Ruthenium ECMP
Figure 8 shows the SEM micrographs of the ruthenium sample surface before and after the application of a 1.2V potential. Figure 8 (a) displays the surface morphology of the ruthenium sample after being immersed in the electrolyte for 300s without applied potential, where the small pores observed on the surface are attributed to the manufacturing process of the ruthenium sheet. From Figure 8 (b), it can be observed that when a 1.2V potential was applied for 300s, severe pitting corrosion occurred on the ruthenium sample surface due to electrochemical reactions.
Table 2 presents the EDS results of the ruthenium sample surface after 300 s of immersion in the electrolyte under different applied potentials. It can be observed from the table that with the application of the potential, the increase in nitrogen content indicates the formation of a BTA-containing complex on the ruthenium surface.
Figure 9 shows the XPS spectra of the Ru(3d) region for metallic ruthenium after 180 seconds of polishing in the electrolyte under conditions of a 0.5 N load, 0.06 m/s linear velocity, and applied potentials of 0.64 V and 1.2 V, respectively.
The XPS spectra from Figures 9(a) and 9(b) were fitted, each yielding two peaks. Specifically, the peak located at a binding energy of 280.1 eV corresponds to Ru(0); the peak at 281.8 eV corresponds to Ru(III); and the peak at 282.2 eV corresponds to Ru(IV). No Ru(VIII) was detected on the surface at applied potentials below 1.2 V, indicating that no toxic RuO₄ gas was generated during the ECMP process.
In ECMP process, the electrolyte turned straw yellow at around 1.3V, which is the color of ruthenium tetra-oxide (RuO4 or H2RuO4), no matter what loads and speeds are applied [48]. Ruthenium tetra-oxide is similar to that of osmium, in terms of physical characteristics and is considered highly toxic. However, this particular Ru oxide is also highly soluble in water and therefore, upon the formation of this oxide in an aqueous electrolyte, Ru will be carried from the surface.
The formation of RuO4 has been known to also coincide with oxygen evolution, and is very unstable in acidic conditions [48]. Equation 2 shows how ruthenium dissolves into solution from the covalent state [48]:
Ru+4H2O→RuO4+8H++8e-
Once the experiment was complete and the electrolyte and electrode were set aside, there was an additional color change of the electrolyte, from straw yellow to a dull yellow and then finally to a black/grayish color. This is the subsequent reduction of the soluble oxide into the insoluble hydrated ruthenic oxide RuO2·nH2O that occurs as shown in Equation 3 [49]:
RuO4+xH2O→RuO2·xH2O+O2
Hydrated ruthenic oxide decreases corrosion current and it is also very active catalysts for reactions such as oxygen evolution [49]. After experiment, on the WE surface there was some form of black surface film, evidence that ruthenium (IV) oxide (RuO2) had been formed.
Figure 10 presents the Nyquist plots of the ruthenium surface after ECMP polishing under different applied potentials. Table 3 lists the fitted values of the impedance parameters CPE1 and Rct obtained from the EIS data using CNLS analysis. As the applied potential increases, the value of CPE1 decreases, while the value of Rct increases. This indicates that both the thickness of the passive layer and the growth of surface oxides on ruthenium increase with the applied potential.
3.3. Comprehensive Evaluation of Influencing Factors in Ruthenium ECMP
During polishing, the material on the sample surface was removed mechanically by the friction force existing between the sample surface and polishing pad. The mechanical abrasion through friction contributes to the material removal. In order to understand the material removal process, it is necessary to calculate the mechanical abrasion that can be represented by the mechanical power introduced by the friction force.
Table 4 lists the test conditions, the average impedance and the calculated mechanical power induced by the friction force. The mechanical power can be calculated by Equation (4):
where P is the mechanical power in watt, V is linear speed of the polished sample, F is the average friction force, w is the rotating speed, and R is the distance (10 mm) between the sample and the spinning center of the platen.
In Table 4, the variables are loads, rotating speeds, and applied potentials. In the first group, the mechanical power increases with the increased load. The power was the highest in all polishing tests when 10 N was applied. In Group 2, the lowest mechanical power appears at 10 rpm. The mechanical power inclines when a higher rotating speed is used. Different potentials are applied in the third group of experiments. In Group 3, the mechanical power increases with the elevated potential.
The friction coefficient is denoted by the ratio of the friction force generated at the interfaces and the normal force. Figure 11 (a) shows the friction coefficient when the ruthenium sample is polished with 60 rpm rotating speed, 0.64V (vs.Pt) potential as the different loads are employed. It can be seen that the coefficient of friction decreases gradually with increasing the applied load . Under the lowest load, the contact pressure is not high enough to break the passivating film and the ruthenium sample slides against the oxide film leading to a high friction coefficient. Figure 11 (b) shows the friction coefficients under different rotating speeds when the load and applied potential are fixed at 10N and 0.64V (vs.Pt), respectively. It is seen that the friction coefficient increase with the decrease of the rotating speeds. From experiments, we also find that there are the stick-slip phenomena when the speed are 10 rpm and 30 rpm, respectively. This can be explained that when the velocity decreases, the scratch depth of ruthenium sample on the soft pad increases so that more work is needed to dig deeper into the material. On the other hand when the velocity increases, the scratch depth decreases so the friction force decreases. In Figure 11 (c), different potentials are applied on the Ru sample during ECMP while the load and rotating speed are fixed at 10N and 60rpm. It can be seen that the friction coefficient increase with the applied potential. The rise in friction coefficient may be caused by surface roughening and the surface roughness can be increased during the dissolution and passivation processes.
The Nyquist plots in Figures 12 (a), (b), and (c) correspond to the three sets of experiments summarized in Table 4. Figure 12 (a) shows the impedance curves when the copper is polished with 60 rpm rotating speed, 0.64V (vs.Pt) potential when the different loads are employed. It can be seen that the average impedance decreases gradually with the increasing of the applied load. Comparing the data listed in Table 1, it is found that the higher the mechanical power, the lower the average impedance. The mechanical abrasion with a high power removes more oxide layer resulting in a low impedance.
Figure 12 (b) shows the impedance results under different rotating speeds when the load and applied potential are fixed at 10N and 0.64V (vs.Pt), respectively. The average impedance decreases gradually with the increasing of the rotating speed. The data in Table 4 shows that at 10rpm the average impedance is the highest, indicating the thickest oxide layer and the mechanical power is the lowest.
In Figure 12 (c), different potentials are applied on the Ru sample during ECMP while the load and rotating speed are fixed at 10N and 60rpm. The average impedance increases with the elevated potential, showing the thickness growth of the oxide layer. It is noticeable that the amplitude of the impedance in Figure 12 (c) shows a larger difference compared to that of Figure 12 (a) or Figure 12 (b). This indicates that the electrochemical reaction is more pronounced than the mechanical abrasion, causing the material removal rate increase with the applied potential. The growth rate of the oxide film is not only a function of its thickness, but also the applied potential. The higher the potential, the higher the growth rate due to extra energy.
We have plotted the mechanical power and average impedance against the samples tested, as shown in Figure 13. It is interesting to see the reverse relationship between power and impedance. The average impedance reflects the thickness of the oxide layer while the mechanical power is to remove it. Here, we only consider the scenarios in which the load and rotating speed are variables because they are readily adjusted in practice. The composition of the slurry and applied potential remained unchanged. In order to highlight the relationship, the impedance is plotted against the input power, as shown in Figure 14. The impedance reflects the thickness of the oxide layer and it is found to be a function of the mechanical power through load or rotating speed. This plot divides the synergetic process into two regions, oxidation and removal. The oxidation and mechanical removal compete with each other. The upper region is dominated by the oxidation and lower the mechanical removal.
In order to examine how the mechanical abrasion induced by the load and rotating speed affected the oxide layer in ECMP process, Figure 13 was plotted to show their relationships. The potential was 0.64V (vs.Pt). The average impedance decreased with the increase of the calculated mechanical power.
As a constant potential, the growth rate of the oxide layer declines with the increase of its thickness, being shown by the exponentially decreasing current density. Further electrochemical reactions are suppressed by the passive layer. On the contrary, once the oxide film is thinned, its growth rate increases. In the ECMP process, when the oxide is removed by the mechanical abrasion to a certain thickness, the electrochemical reactions are dominant to grow the oxide layer at a higher rate, resulting the increase of the impedance. The electrochemical reactions forming a thick oxide layer are weakened by the increase of the thickness, Then, the mechanical abrasion is more pronounced than the electrochemical reactions to removal the oxide, causing the declination of the impedance. This is the mechanism of the material removal in ECMP.
Figure 13 shows the relationship between frictional power and impedance magnitude at an applied potential of 0.64V. As can be seen from the figure, the calculated frictional power under various conditions exhibits an opposite trend to the impedance. Figure 14 further illustrates the correlation between impedance and frictional power (i.e., the impedance decreases with increasing frictional power). This plot can be divided into two distinct regions, representing the oxidation and removal processes, respectively. The upper region is dominated by oxidation, while the lower region is dominated by mechanical removal.
In the ECMP process, applying an anodic potential promotes electrochemical reactions, facilitating the formation of a thicker oxide layer. These two mechanisms—oxidation and removal—compete with each other. Mechanical abrasion induced by pressure, linear velocity, and the polishing pad removes the oxides formed on the metal surface, reducing the thickness of the oxide layer. Material removal in metal ECMP is achieved through the cyclic formation and removal of the oxide layer.
4. Conclusions
This study systematically investigated the triboelectrochemical behavior and underlying mechanisms of ruthenium during the ECMP process, yielding the following key conclusions:
(1) Potentiodynamic polarization analysis demonstrated that increased mechanical energy input, induced by either applied load or rotational speed, enhances electrochemical reactions during Ru ECMP. Notably, rotational speed exerts a more pronounced influence than the applied load. Furthermore, at a constant rotational speed, the corrosion potential shifts positively with increasing load.
(2) The coefficient of friction was observed to increase with decreasing rotational speed. Conversely, Open Circuit Potential (OCP) measurements indicated a decrease in OCP with increasing rotational speed, suggesting the disruption of surface passive films. Electrochemical Impedance Spectroscopy (EIS) confirmed that higher rotational speeds promote the formation and growth of a thicker passive oxide layer on the ruthenium surface.
(3) Single-frequency EIS analysis identified the applied potential as the primary factor influencing oxide layer formation during Ru ECMP, with frictional work acting as a secondary influencing factor.
(4) Surface characterization revealed that the formation of BTA-containing complexes on the ruthenium surface increases with the applied potential in the electrolyte, as evidenced by EDS analysis. XPS analysis confirmed the absence of toxic RuO₄ gas generation at applied potentials below 1.3 V.
(5) The interplay between mechanical abrasion and electrochemical reactions governs the material removal mechanism in ECMP. An inverse relationship was established between the calculated mechanical power (from load and speed) and the measured average impedance (indicative of oxide layer thickness). This synergy delineates the process into two competing regimes: an upper region dominated by electrochemical oxidation (thickening the oxide layer) and a lower region dominated by mechanical removal (thinning the oxide layer). The cyclic formation and removal of this oxide layer facilitates efficient material removal.
These findings provide a fundamental theoretical basis and practical guidance for optimizing ECMP processes towards achieving high-efficiency, high-selectivity, and low-damage planarization of ruthenium-based copper interconnect structures.
Acknowledgments
The author gratefully acknowledges Ms. Yuan-Yuan Cheng, the legal representative of Hebei Jinhan Electronic Technology Co., Ltd., China, for the financial support and for providing the experimental materials used in this research.
References
- You, Y.; Zhou, J.; Qi, Y.; Luo, C. Research on the Mechanism of Ru Abrasive-free CMP Based on KIO4/FeIII-NTA System. ECS J. Solid State Sci. Technol. 2025, 14, 054007. [Google Scholar] [CrossRef]
- Zhan, N.; He, C.; He, C.; Niu, X.; Zhang, N.-N.; Zhang, N.; Zou, Y.; Liu, J.; Dong, C.; Dong, C.; Li, X.; Li, X.; Zhou, J. Effects of pyrazine and its derivatives as inhibitors on copper film chemical-mechanical polishing properties for ruthenium-based copper interconnect. Colloids Surf. A Physicochem. Eng. Asp. 2024, 688, 133609. [Google Scholar] [CrossRef]
- Dong, C.; Niu, X.; Liu, J.; Zhan, N.; Zou, Y.; He, C.; Li, X.; Luo, F.; Shi, Y.; Cheng, J. Effect of Novel pH Regulators on Copper film Chemical Mechanical Polishing for Ruthenium-Based Copper Interconnect under Weak Alkalinity Conditions. ECS J. Solid State Sci. Technol. 2024, 13, 054001. [Google Scholar] [CrossRef]
- Elshocht, S.V.; Delabie, A.; Dewilde, S.; Meersschaut, J.; Swerts, J.; Tielens, H.; Verdonck, P.; Witters, T.; Vancoille, E. ALD barrier deposition on porous low-k dielectric materials for interconnects. ECS Trans. 2011, 41, 25–32. [Google Scholar] [CrossRef]
- Zhou, W.; Bailey, S.; Sooryakumar, R.; King, S.; Xu, G.; Mays, E.; Ege, C.; Bielefeld, J. Elastic properties of porous low-k dielectric nano-films. J. Appl. Phys. 2011, 110, 043520. [Google Scholar] [CrossRef]
- Xi, K.; He, H.; Xu, D.; Ge, R.J.; Meng, Z.; Jia, X.D.; Yu, X.H. Ultra low dielectric constant polysilsequioxane films using T8(Me4NO)8 as porogen. Thin Solid Films 2010, 518, 4768–4772. [Google Scholar] [CrossRef]
- Chen, F.; Shinosky, M. Soft breakdown characteristics of ultra low-k time-dependent dielectric breakdown for advanced complementary metal-oxide semiconductor technologies. J. Appl. Phys. 2010, 108, 054107. [Google Scholar] [CrossRef]
- Zhao, L.; Tokei, Z.; Croes, K.; Wilson, C.J.; Baklanov, M.; Beyer, G.P.; Claeys, C. Direct observation of the 1/E dependence of time dependent dielectric breakdown in the presence of copper. Appl. Phys. Lett. 2011, 98, 023107. [Google Scholar] [CrossRef]
- Lin, W.C.; Lin, J.; Tsai, T.C.; Hsu, C.M.; Liu, C.C.; Lin, J.F.; Hwang, C.C.; Wu, J.Y. Effects of Cu surface roughness on TDDB for direct polishing ultra-low k dielectric Cu interconnects at 40 nm technology node and beyond. Microelectron. Eng. 2012, 92, 115–118. [Google Scholar] [CrossRef]
- He, M.; Novak, S.; Vanamurthy, L.; Bakhru, H.; Plawsky, J.; Lu, T.M. Cu penetration into low-k dielectric during deposition and bias-temperature stress. Appl. Phys. Lett. 2010, 97, 252901. [Google Scholar] [CrossRef]
- Shin, J.; Kim, H.W.; Hwang, G.S.; Ekerdt, J.G. Chemical routes to ultra thin films for copper barriers and liners. Surf. Coat. Technol. 2007, 201, 9256–9259. [Google Scholar] [CrossRef]
- Chyan, O.; Arunagiri, T.N.; Zhang, Y.; Wallace, R.M.; Kim, M.J.; Hurd, T.Q. Electrodeposition of Copper Thin Film on Ruthenium A Potential Diffusion Barrier for Cu Interconnects. J. Electrochem. Soc. 2003, 150, C347–C350. [Google Scholar] [CrossRef]
- Josell, D.; Wheeler, D.; Witt, C.; Moffat, T.P. Seedless superfill: copper electrodeposition in trenches with ruthenium barriers. Electrochem. Solid-State Lett. 2003, 6, C143–C145. [Google Scholar] [CrossRef]
- Chan, R. Diffusion studies of copper on ruthenium thin film. Electrochem. Solid-State Lett. 2004, 7, G154–G157. [Google Scholar] [CrossRef]
- Mahadevaiyer, K.; Nalaskowski, J.W.; Cook, L.M. Chemical Mechanical Planarization: Slurry Chemistry, Materials, and Mechanisms. Chem. Rev. 2010, 110, 178–204. [Google Scholar]
- Seo, S.C.; Yang, C.C.; Hu, C.K.; Kreber, A.; Fan, S.; Horak, D.; Canaperi, D.; Rao, S.P.; Haran, B.; Doris, B. Thermal Stability of Copper Contact Metallization Using Ru-Containing Liner. Electrochem. Solid-State Lett. 2011, 14, H187–H190. [Google Scholar] [CrossRef]
- Arunagiri, T.N.; Zhang, Y.; Chyan, O.; Bouanani, M.E.; Kim, M.J.; Chen, K.H.; Wu, T.N.; Chen, L.C. 5 nm ruthenium thin film as a directly plateable copper diffusion barrier. Appl. Phys. Lett. 2005, 86, 083104. [Google Scholar] [CrossRef]
- Burke, L.; Naser, N.; Sharna, R. The oxide electrochemistry of ruthenium and its relevance to trench liner applications in damascene copper plating. J. Appl. Electrochem. 2008, 38, 377–384. [Google Scholar] [CrossRef]
- Kim, I.K.; Kang, Y.J.; Kwon, T.Y.; Cho, B.G.; Park, J.G.; Park, J.Y.; Park, H.S. Effect of sodium periodate in alumina-based slurry on Ru CMP for metal-insulator-metal capacitor. Electrochem. Solid-State Lett. 2008, 11, H150–H153. [Google Scholar] [CrossRef]
- Lee, W.J.; Park, H.S.; Lee, S.I.; Sohn, H.C. Effects of ceric ammonium nitrate (CAN) additive in HNO3 solution on the electrochemical behaviour of ruthenium for CMP processes. J. Appl. Electrochem. 2004, 34, 119–125. [Google Scholar] [CrossRef]
- Wu, Z.; Dong, C.; Niu, X.; Zhou, J.; He, C.; Li, X.; Hu, B.; Li, J. A novel slurry for Cu films CMP in Ru-based Cu interconnects: Integration of experimental and theoretical calculations. Mater. Sci. Semicond. Process. 2026, 201, 110071. [Google Scholar] [CrossRef]
- Luo, F.; Niu, X.; Yan, H.; Zhang, Y.; Qu, M.; Zhu, Y.; Hou, Z. Synergistic effect of 1,2,4-triazole and phytic acid as inhibitors on copper film CMP for ruthenium-based copper interconnected and the surface action mechanism analysis. Mater. Sci. Semicond. Process. 2023, 156, 107276. [Google Scholar] [CrossRef]
- Gao, F.; Liang, H. Transformable oxidation of tantalum in electrochemical mechanical polishing (ECMP). J. Electron. Mater. 2011, 40, 134–140. [Google Scholar] [CrossRef]
- Lee, S.J.; Chen, Y.H.; Liu, C.P.; Fan, T.J. Electrochemical mechanical polishing of flexible stainless steel substrate for thin-film solar cells. Int. J. Electrochem. Sci. 2013, 8, 6878–6888. [Google Scholar] [CrossRef]
- Cojocaru, P.; Muscolino, F.; Magagnin, L. Effect of organic additives on copper dissolution for e-CMP. Microelectron. Eng. 2010, 87, 2187–2189. [Google Scholar] [CrossRef]
- Wu, Y.; Lei, R.; Jiang, L.; Qian, L. Achieving equivalent removal of Ta and Ru via controlling oxidation for chemical mechanical polishing of advanced barrier layer. Mater. Sci. Semicond. Process. 2024, 180, 108564. [Google Scholar] [CrossRef]
- Xu, Y.; Ma, T.; Liu, Y.; Tan, B.; Zhang, S.; Wang, Y.; Song, G. Effect of ethylenediamine on CMP performance of ruthenium in H2O2-based slurries. RSC Adv. 2021, 12, 228–240. [Google Scholar] [CrossRef]
- Wang, C.; Zhou, J.; Luo, C.; Wang, C.; Zhang, X. Synergist effect of potassium periodate and potassium persulfate on improving removal rate of Ruthenium during chemical mechanical polishing. Mater. Sci. Eng. B 2020, 262, 114764. [Google Scholar] [CrossRef]
- Bian, Y.-F.; Zhai, W.-J.; Cheng, Y.-Y. Electrolyte composition and galvanic corrosion for ruthenium/copper electrochemical mechanical polishing. Rare Met. 2020, 39, 1–7. [Google Scholar] [CrossRef]
- Cheng, J.; Wang, T.; Wang, J.; Liu, Y.; Lu, X. Effects of KIO4 concentration and pH values of the solution relevant for chemical mechanical polishing of ruthenium. Microelectron. Eng. 2016, 151, 30–37. [Google Scholar] [CrossRef]
- Ma, H.; Zhou, J.; Wang, C.; Zhang, Y.; Li, Z.; Zhang, X.; Liu, G. Role of Diethylene Triaminepentaacetic Acid Pentapotassium Salt on Ruthenium CMP in H2O2-Based Slurries. ECS J. Solid State Sci. Technol. 2022, 11, 124002. [Google Scholar] [CrossRef]
- Cheng, J.; Wang, T.; Mei, H.; Zhou, W.; Lu, X. Synergetic effect of potassium molybdate and benzotriazole on the CMP of ruthenium and copper in KIO4-based slurry. Appl. Surf. Sci. 2014, 320, 531–537. [Google Scholar] [CrossRef]
- Wang, C.; Wang, C.; Li, H.; Zhou, J.; Zhang, X.; Tian, Y.; Xu, C. Effect of UV Radiation on Oxidation for Ru CMP. ECS J. Solid State Sci. Technol. 2021, 10, 034007. [Google Scholar] [CrossRef]
- Di, H.; Zhou, P.; Lu, Y.; Yang, K.; Guo, D. Role of alumina particles in chemical-mechanical synergies in ruthenium polishing. J. Mater. Process. Technol. 2024, 330, 118477. [Google Scholar] [CrossRef]
- Shao, S.; Wu, B.; Wang, P.; He, P.; Qu, X.-P. Investigation on inhibition of ruthenium corrosion by glycine in alkaline sodium hypochlorite based solution. Appl. Surf. Sci. 2020, 506, 144976. [Google Scholar] [CrossRef]
- Zhan, N.; Niu, X.; Liu, J.; Zuo, Y.; Yan, H.; Luo, F.; Qu, M.; Xian, W.; Zhou, J. Surface Interaction Effect and Mechanism of Methionine Derivatives as Novel Inhibitors for Alkaline Copper CMP: Insights from Molecular Simulation and Experimental Analysis. ECS J. Solid State Sci. Technol. 2023, 12, 094001. [Google Scholar] [CrossRef]
- Zhou, J.; Wang, J.; Niu, X.; Zhang, K.; Wang, Z.; Cui, Y.; Wang, R. Chemical Interactions and Mechanisms of Different pH Regulators on Copper and Cobalt Removal Rate of Copper Film CMP for GLSI. ECS J. Solid State Sci. Technol. 2019, 8, P99–P105. [Google Scholar] [CrossRef]
- Wang, Q.; Zhou, J.; Wang, C.; Niu, X.; Tian, Q.; Xiao, Y.; Wang, R. Controlling the Removal Rate Selectivity of Ruthenium to Copper during CMP by Using Guanidine Carbonate and 1,2,4-Triazole. ECS J. Solid State Sci. Technol. 2018, 7, P567–P574. [Google Scholar] [CrossRef]
- Kristin, G.S. An Electrochemical Investigation of the Removal and Planarization of Copper and Ruthenium. Ph.D. Thesis, Columbia University, New York, NY, USA, 2010. [Google Scholar]
- Yadav, K.; Manivannan, R.; Victoria, S.N. Electrochemical characterization of ruthenium dissolution and chemical mechanical polishing in hydrogen peroxide based slurries. Mater. Today Proc. 2019, 18, 1220–1228. [Google Scholar] [CrossRef]
- Cheng, J.; Wang, T.; Jiang, L.; Lu, X. Surface characteristics of ruthenium in periodate-based slurry during chemical mechanical polishing. Appl. Surf. Sci. 2015, 351, 401–409. [Google Scholar] [CrossRef]
- Jiang, L.; He, Y.; Li, Y.; Luo, J. Effect of ionic strength on ruthenium CMP in H2O2-based slurries. Appl. Surf. Sci. 2014, 317, 332–337. [Google Scholar] [CrossRef]
- Tamboli, D.; Osso, J.O.; McEvoy, T.; Vega, L.F.; Rao, M.; Banerjee, G. Investigating the compatibility of ruthenium liners with copper interconnects. ECS Trans. 2010, 33, 181–187. [Google Scholar] [CrossRef]
- Yeung, H.; Chan, H.; Zou, S.Z.; Weaver, M.J. Mechanistic differences between electrochemical and gas-phase thermal oxidation of platinum-group transition metals as discerned by surface-enhanced raman spectroscopy. J. Phys. Chem. B 1999, 103, 11141–11151. [Google Scholar]
- Liu, J.; Lei, J.; Magtoto, N.; Garza, M.; Kelber, J.A. The effects of an iodine surface layer on Ru reactivity in air and during Cu electrodeposition. J. Electrochem. Soc. 2005, 152, G115–G121. [Google Scholar] [CrossRef]
- Lee, W.J.; Park, H.S. Development of novel process for Ru CMP using ceric ammonium nitrate (CAN)-containing nitric acid. Appl. Surf. Sci. 2004, 228, 410–417. [Google Scholar] [CrossRef]
- Ahadi, M.M.; Attar, M.M. OCP measurement: A method to determine CPVC. Sci. Iran. 2007, 14, 369–372. [Google Scholar]
- Kim, I.K.; Cho, B.G.; Park, J.G.; Park, J.Y.; Park, H.S. Effect of pH in Ru Slurry with Sodium Periodate on Ru CMP. J. Electrochem. Soc. 2009, 156, H188–H192. [Google Scholar] [CrossRef]
- Burke, L.D.; Whelan, D.P. The behaviour of ruthenium anodes in base. J. Electroanal. Chem. 1979, 103, 179–187. [Google Scholar] [CrossRef]
Figure 1.
ECMP configuration with a three-electrode system.
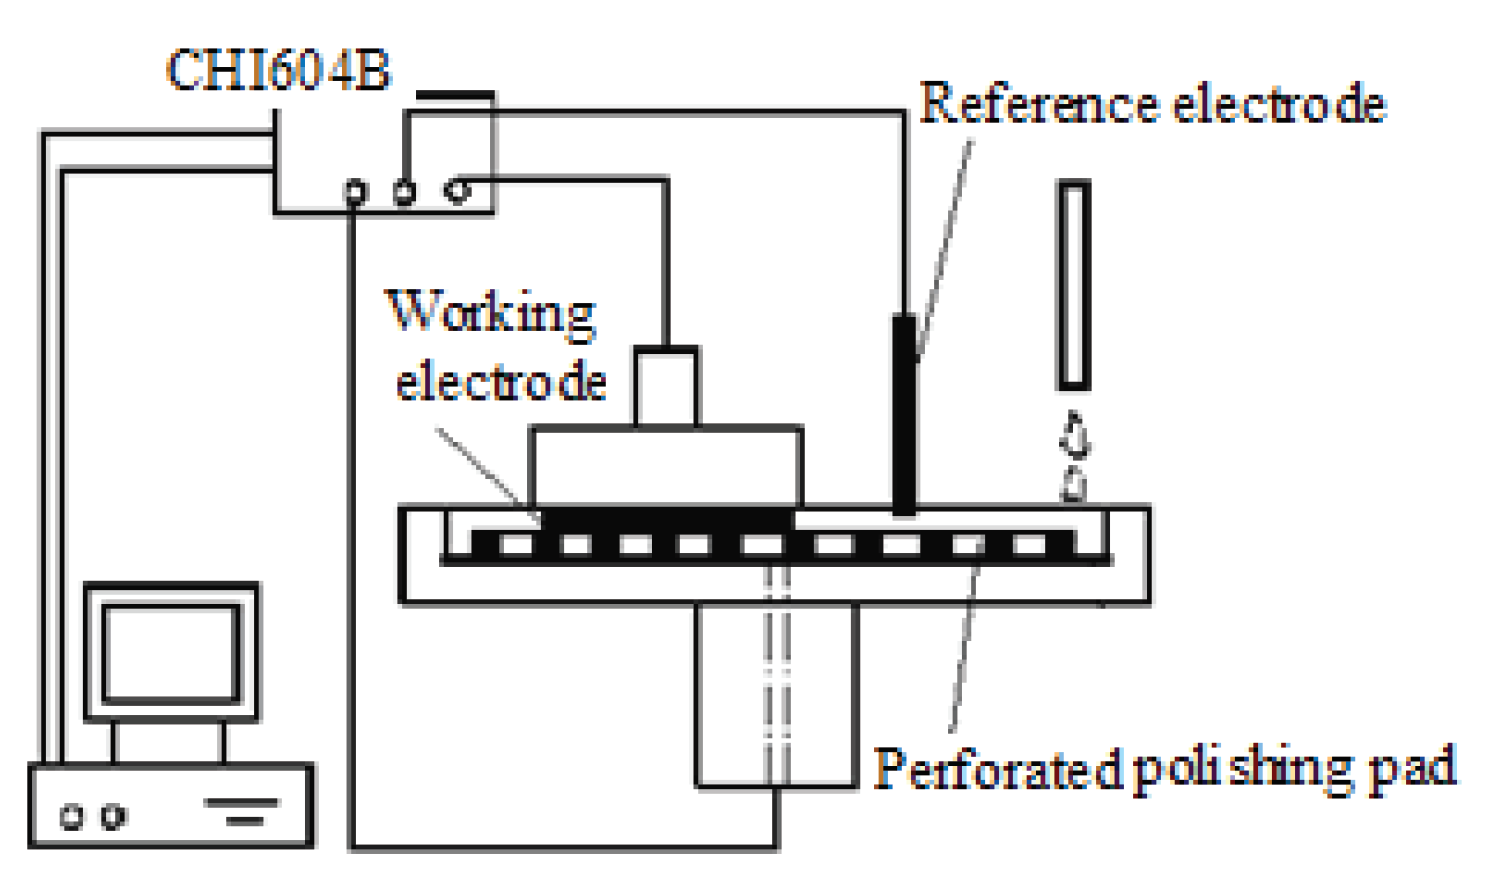
Figure 2.
Tafel curves obtained under different conditions.
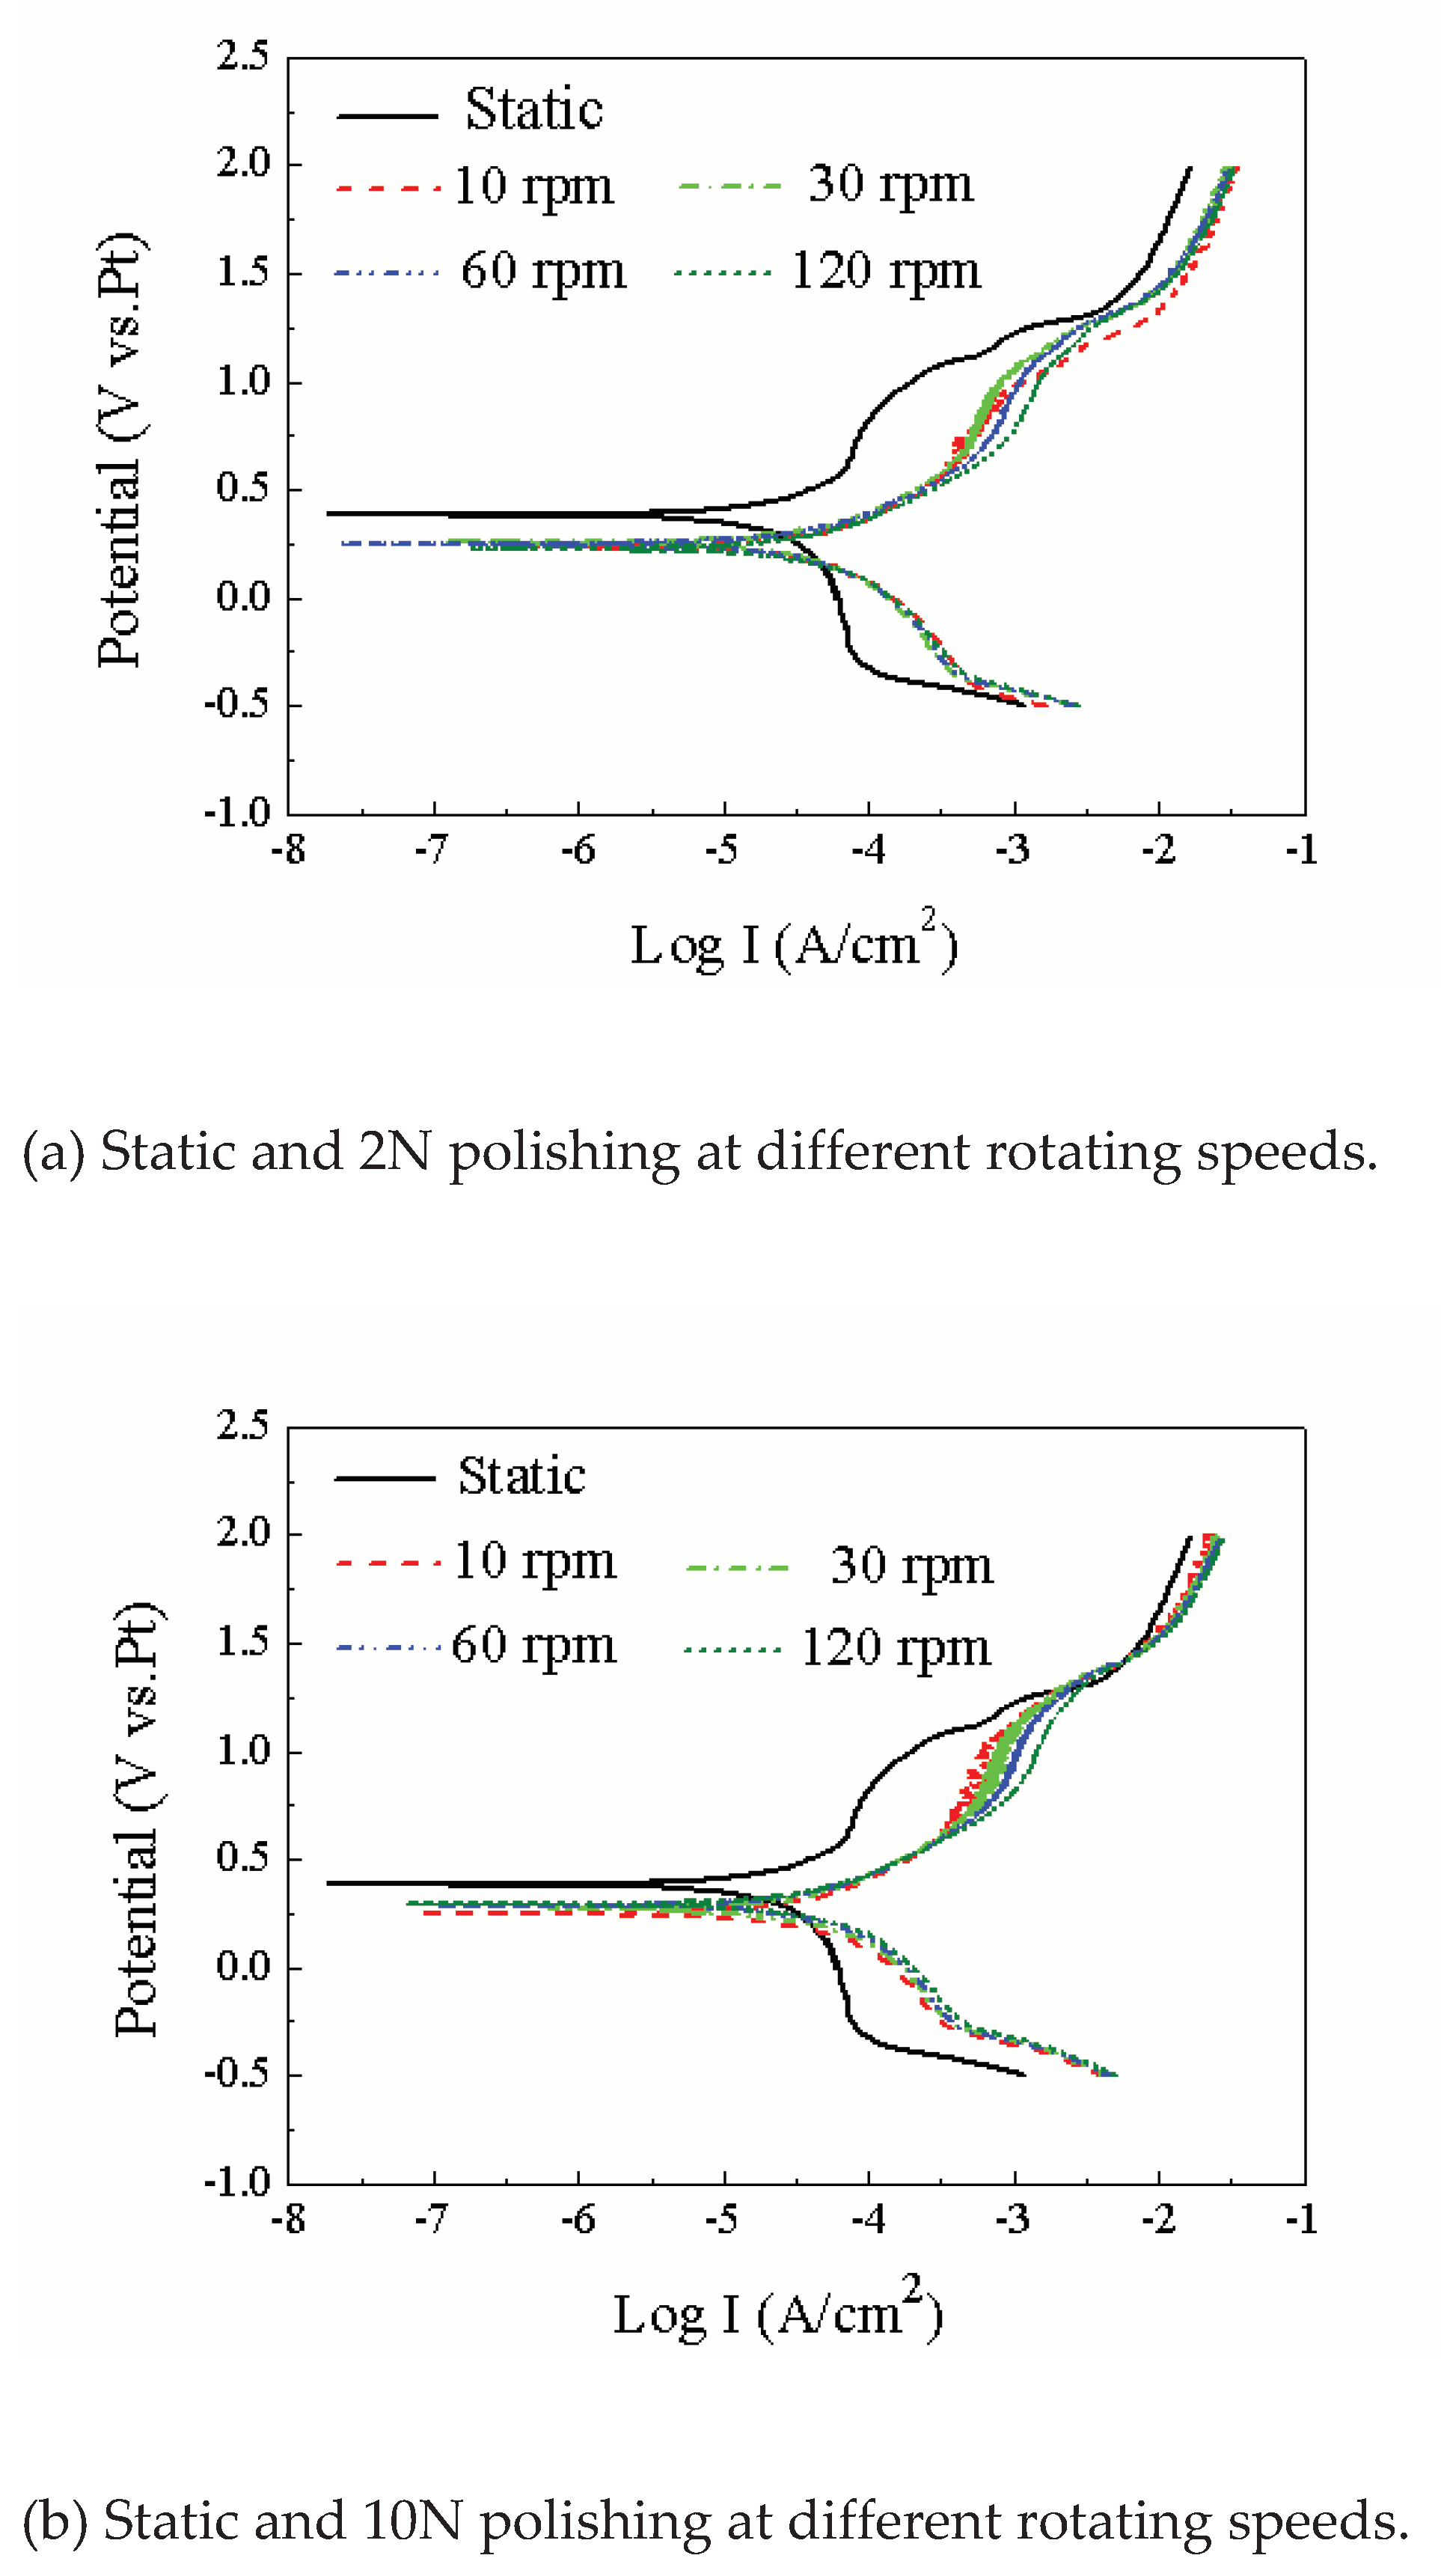
Figure 3.
Corrosion current and potential during potentiodynamic tests.
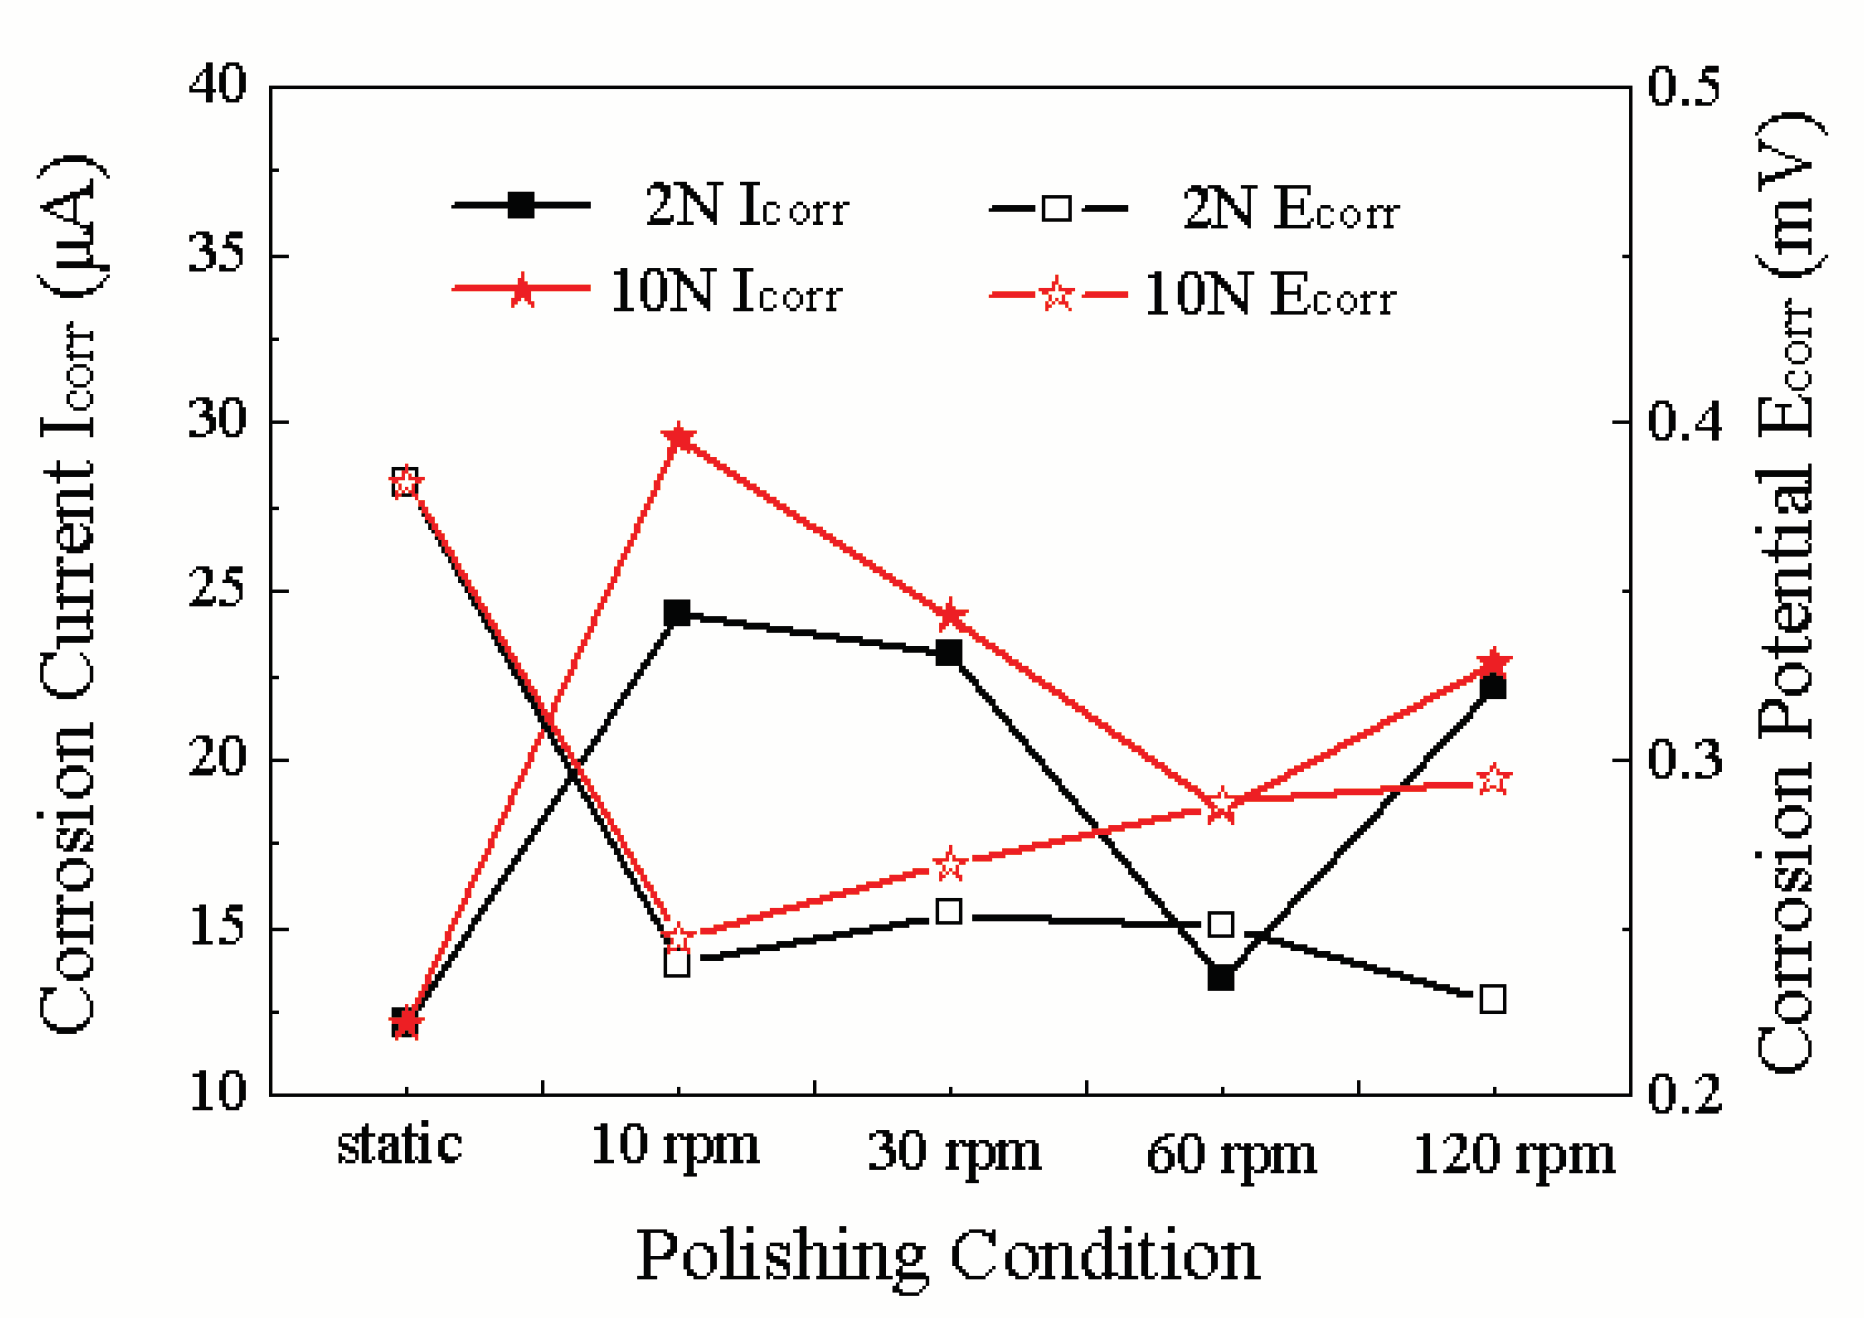
Figure 4.
Friction coefficients for different rotating speeds.
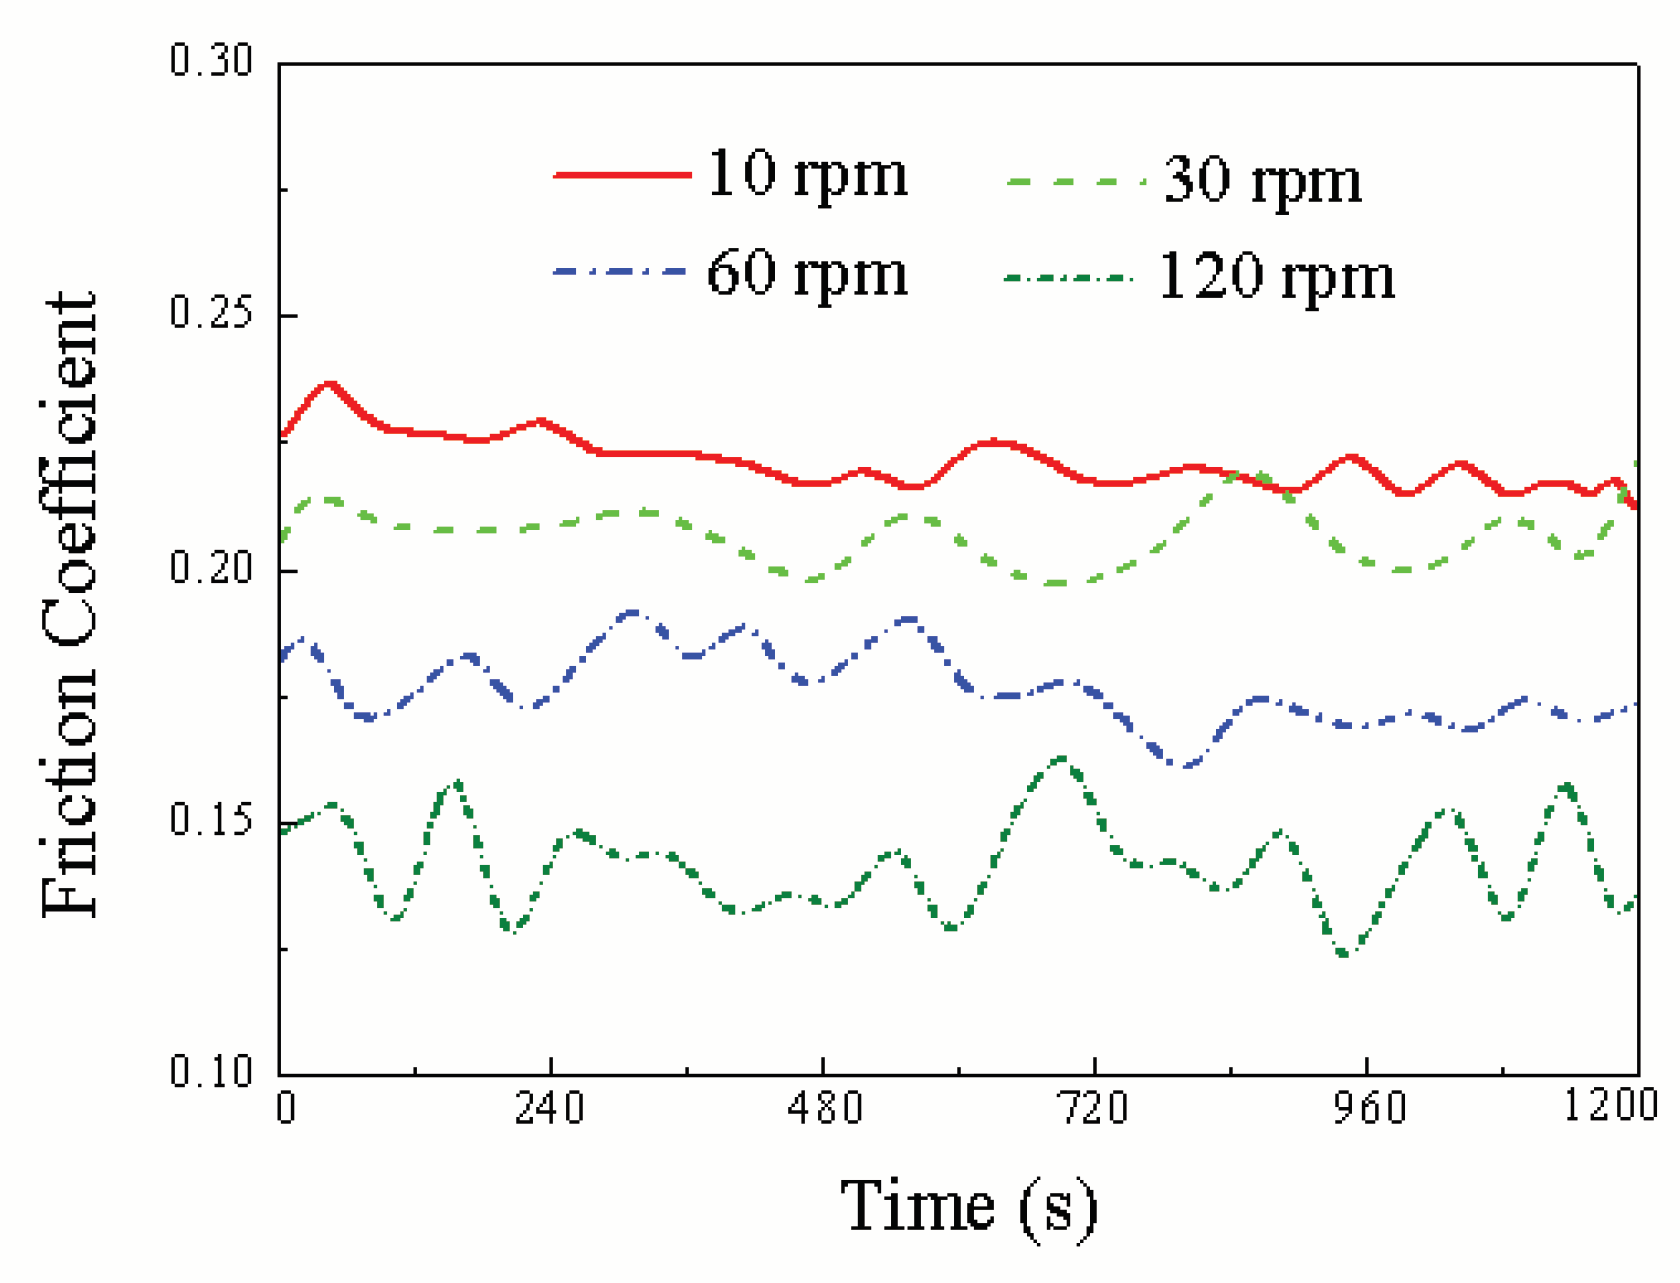
Figure 5.
OCP measured in different treating condition.
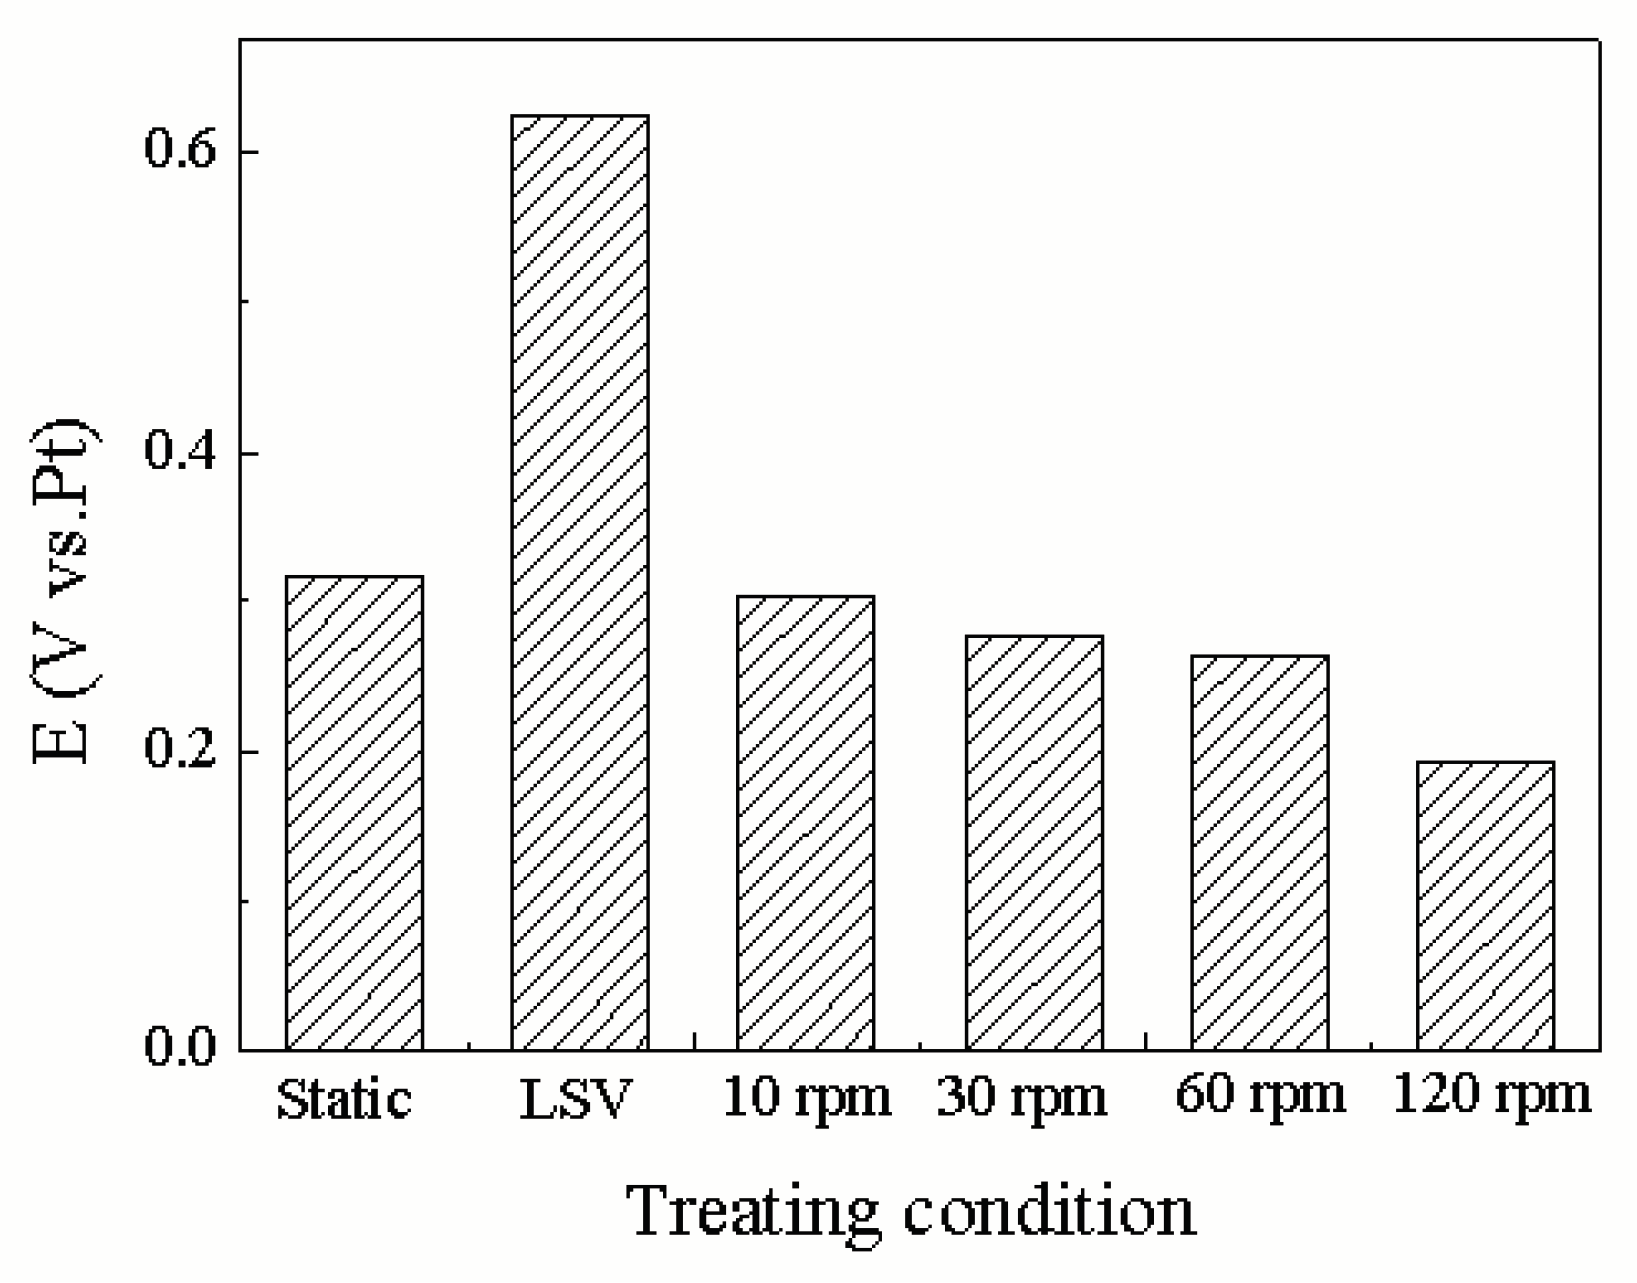
Figure 6.
Nyquist impedance plot for different rotating speeds.
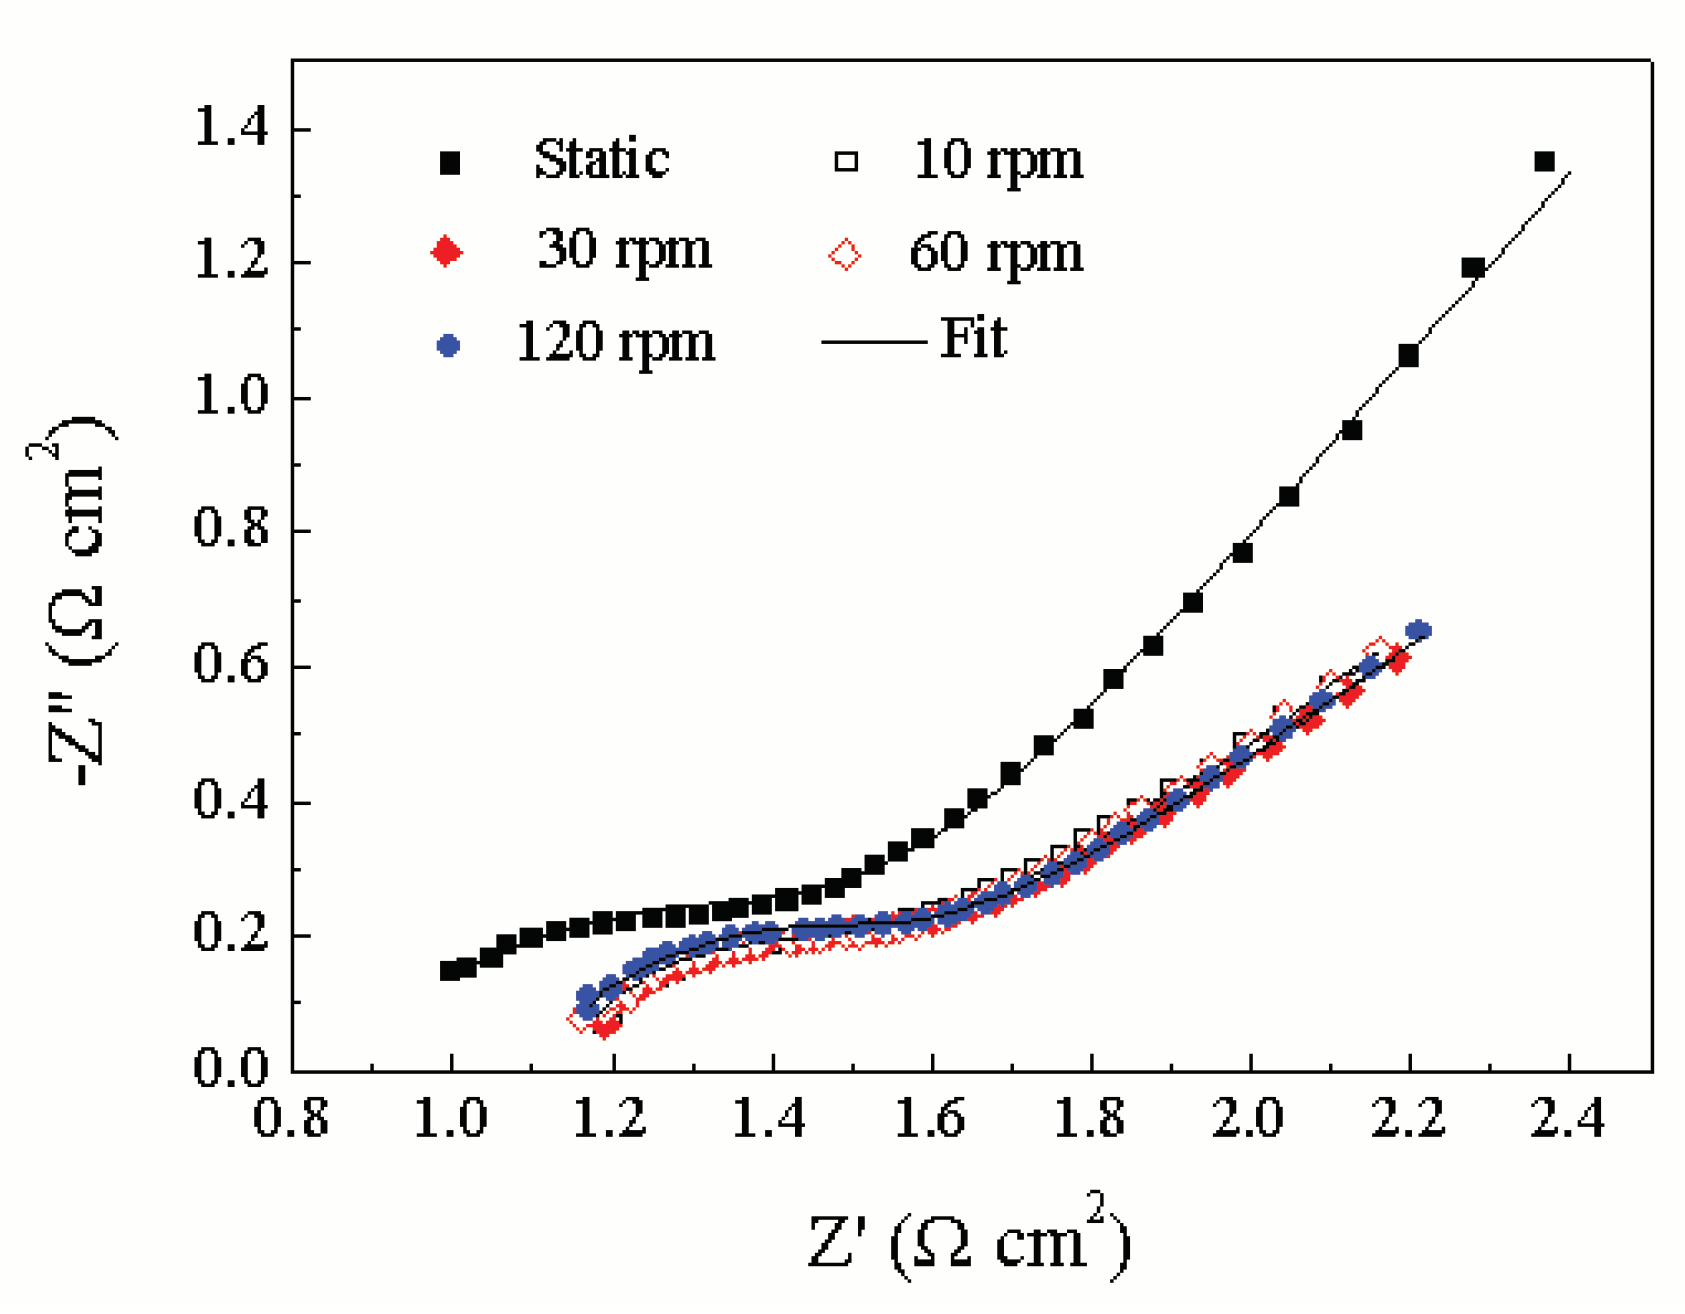
Figure 7.
Equivalent circuit model used to fit the impedance results in Figure 6.
Figure 7.
Equivalent circuit model used to fit the impedance results in Figure 6.
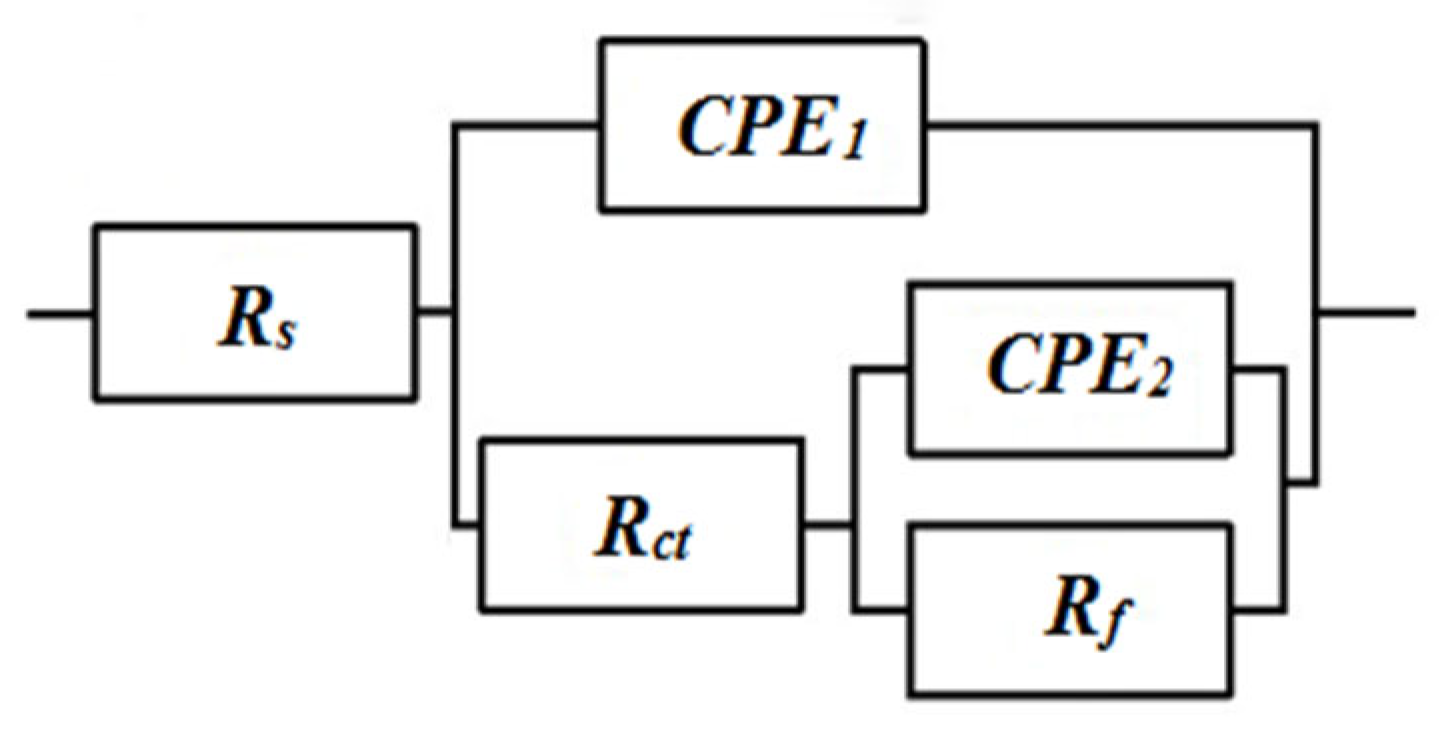
Figure 8.
Comparison of SEM surface photographs before and after a voltage-activated process: (a) no bias ;(b)1.2V.
Figure 8.
Comparison of SEM surface photographs before and after a voltage-activated process: (a) no bias ;(b)1.2V.
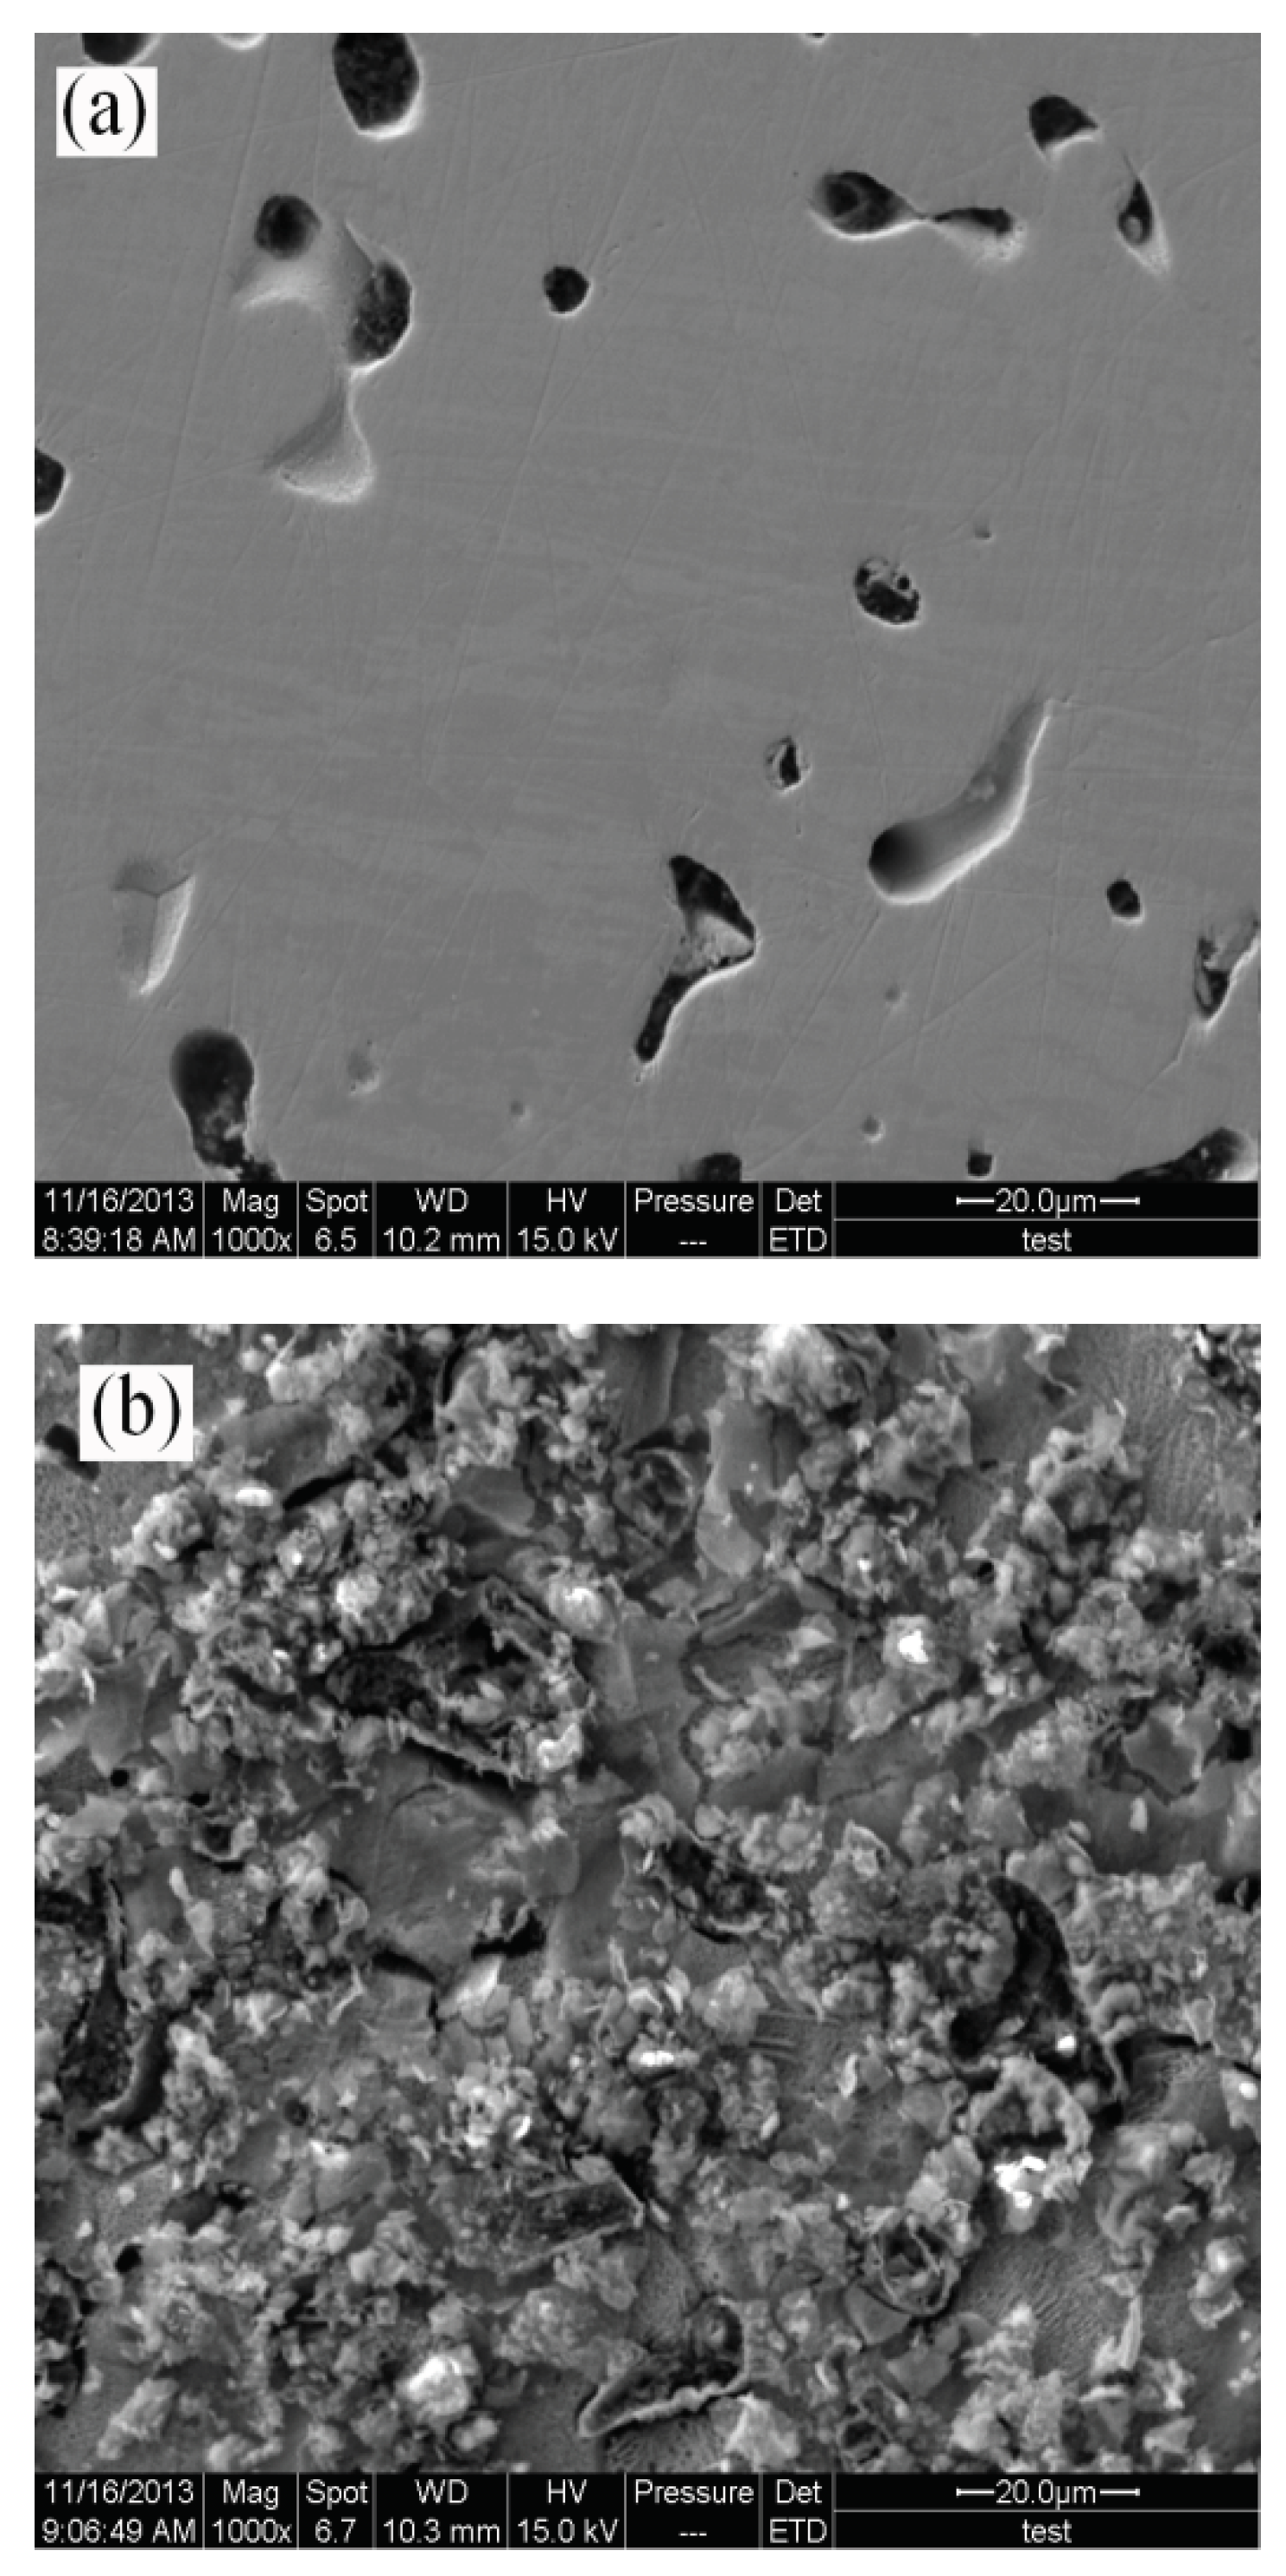
Figure 9.
XPS spectra from Ru surface of the Ru(3d) line in electrolyte containing: (a) 0.64 V; (b) 1.2 V.
Figure 9.
XPS spectra from Ru surface of the Ru(3d) line in electrolyte containing: (a) 0.64 V; (b) 1.2 V.
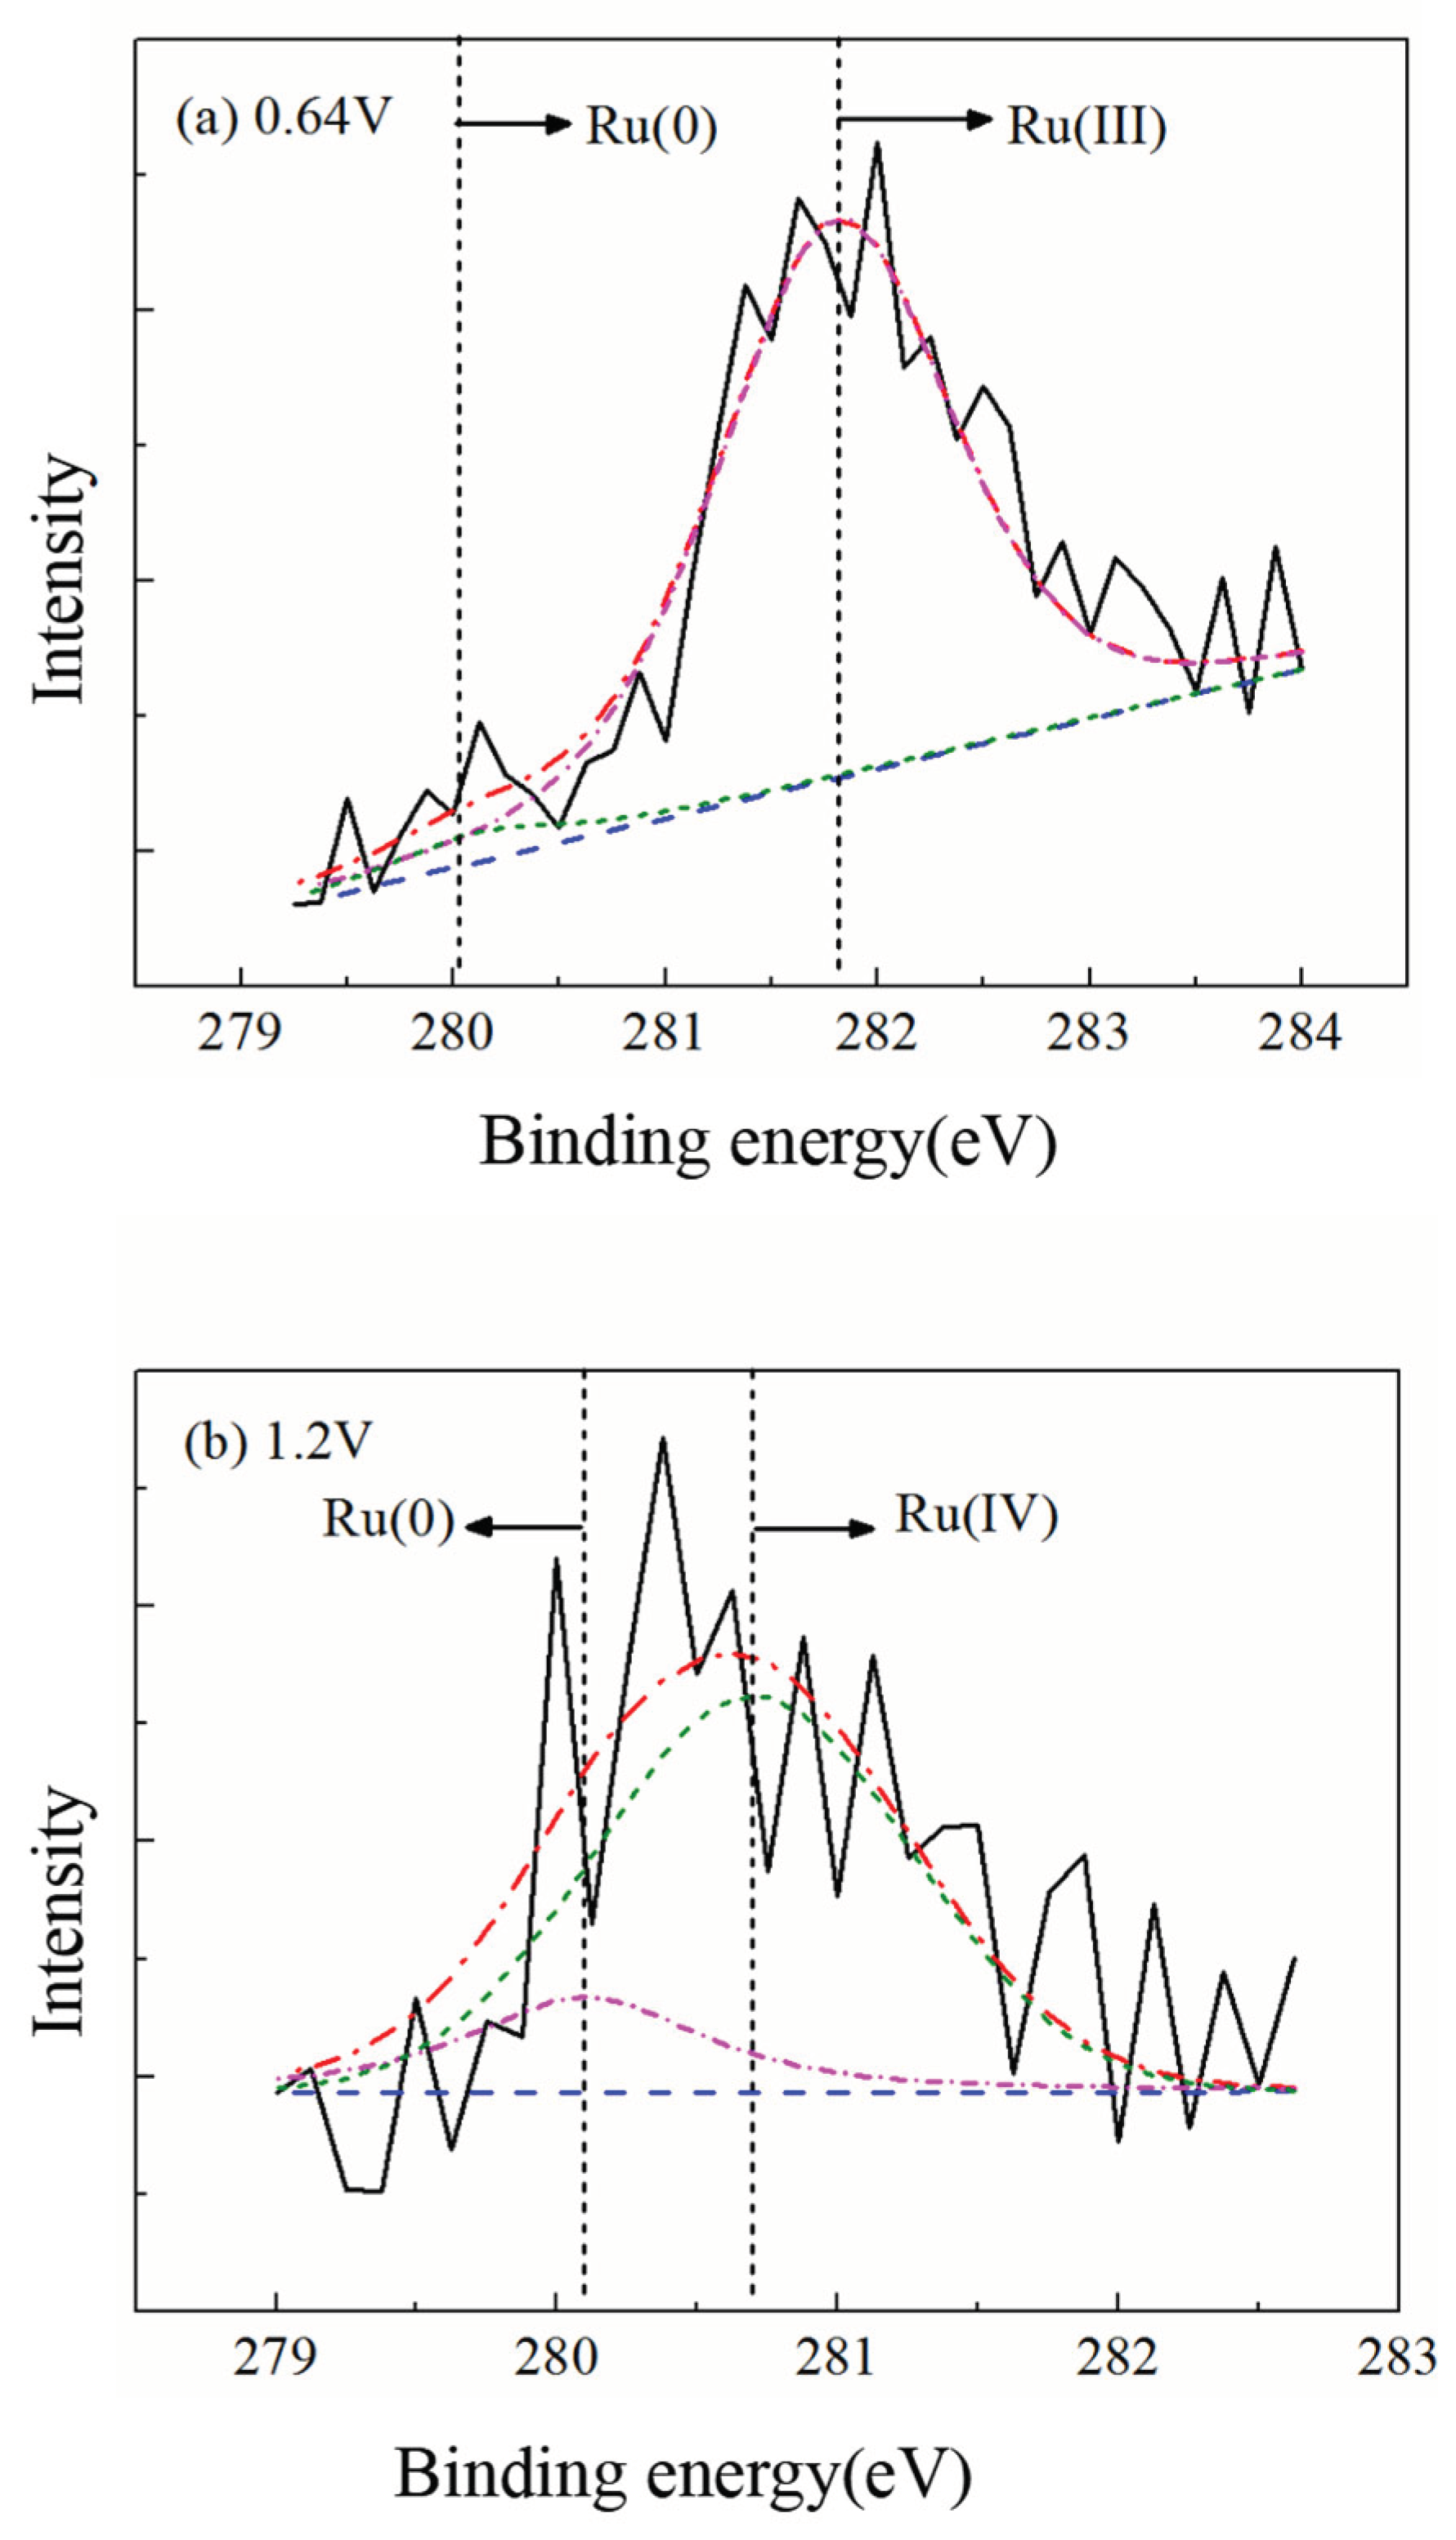
Figure 10.
Nyquist impedance plot for different anodic potentials.
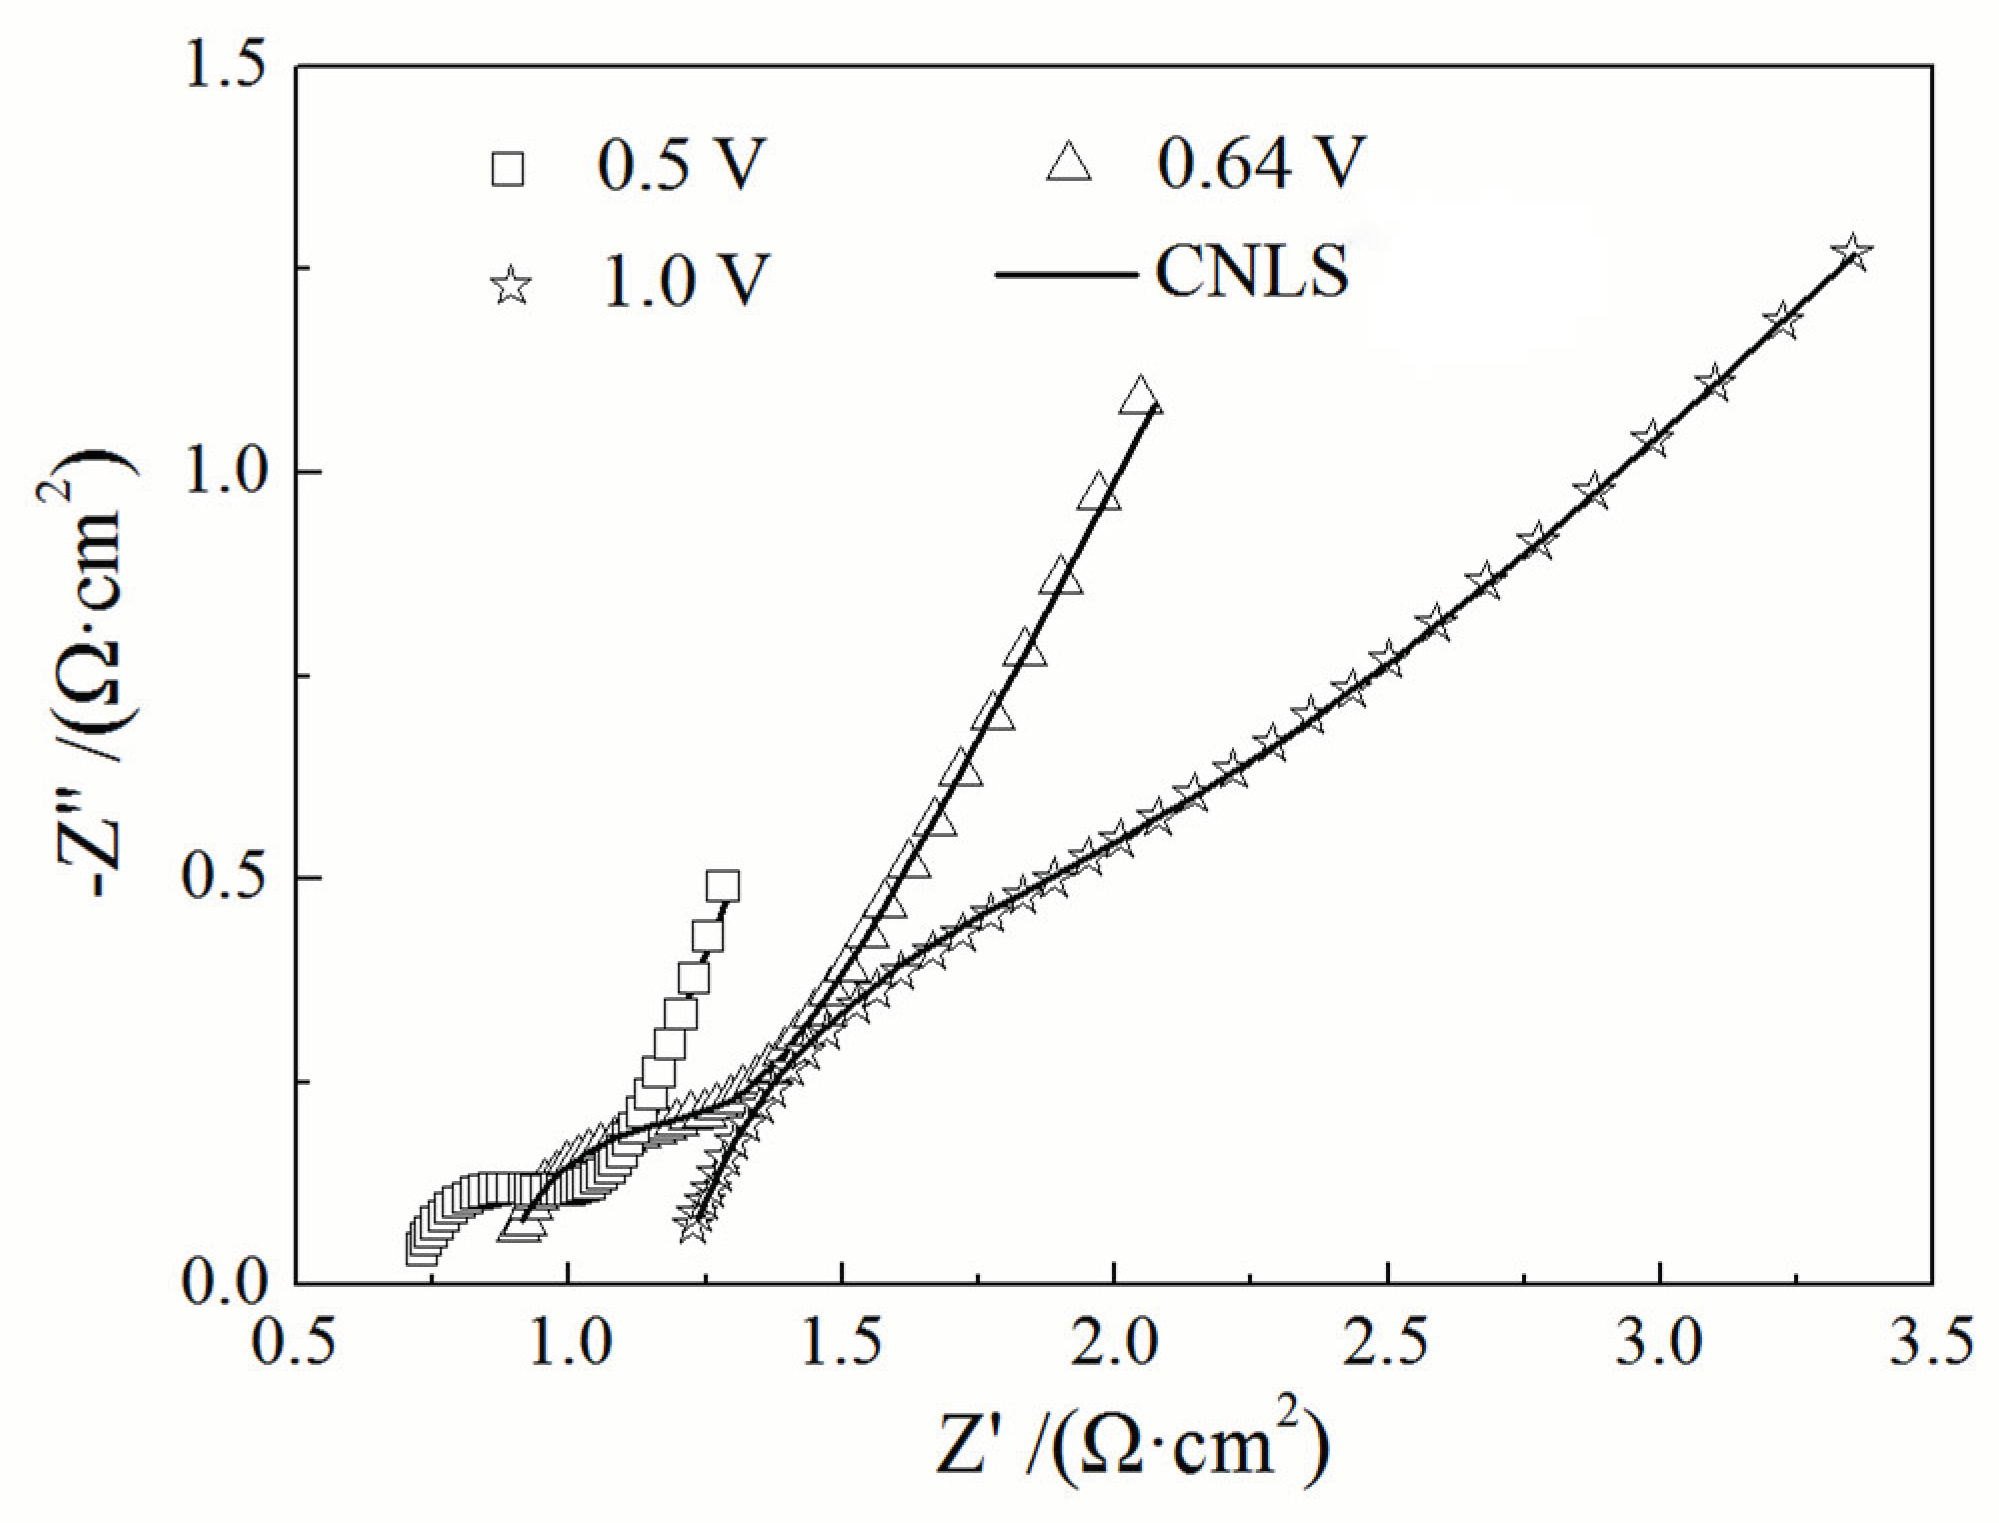
Figure 11.
Friction coefficients for different cases: (a)different applied loads at 60rpm and 0.64V (vs.Pt);(b)different rotating speed at 10N and 0.64V (vs.Pt); (c)different potentials at 10N and 60 rpm.
Figure 11.
Friction coefficients for different cases: (a)different applied loads at 60rpm and 0.64V (vs.Pt);(b)different rotating speed at 10N and 0.64V (vs.Pt); (c)different potentials at 10N and 60 rpm.
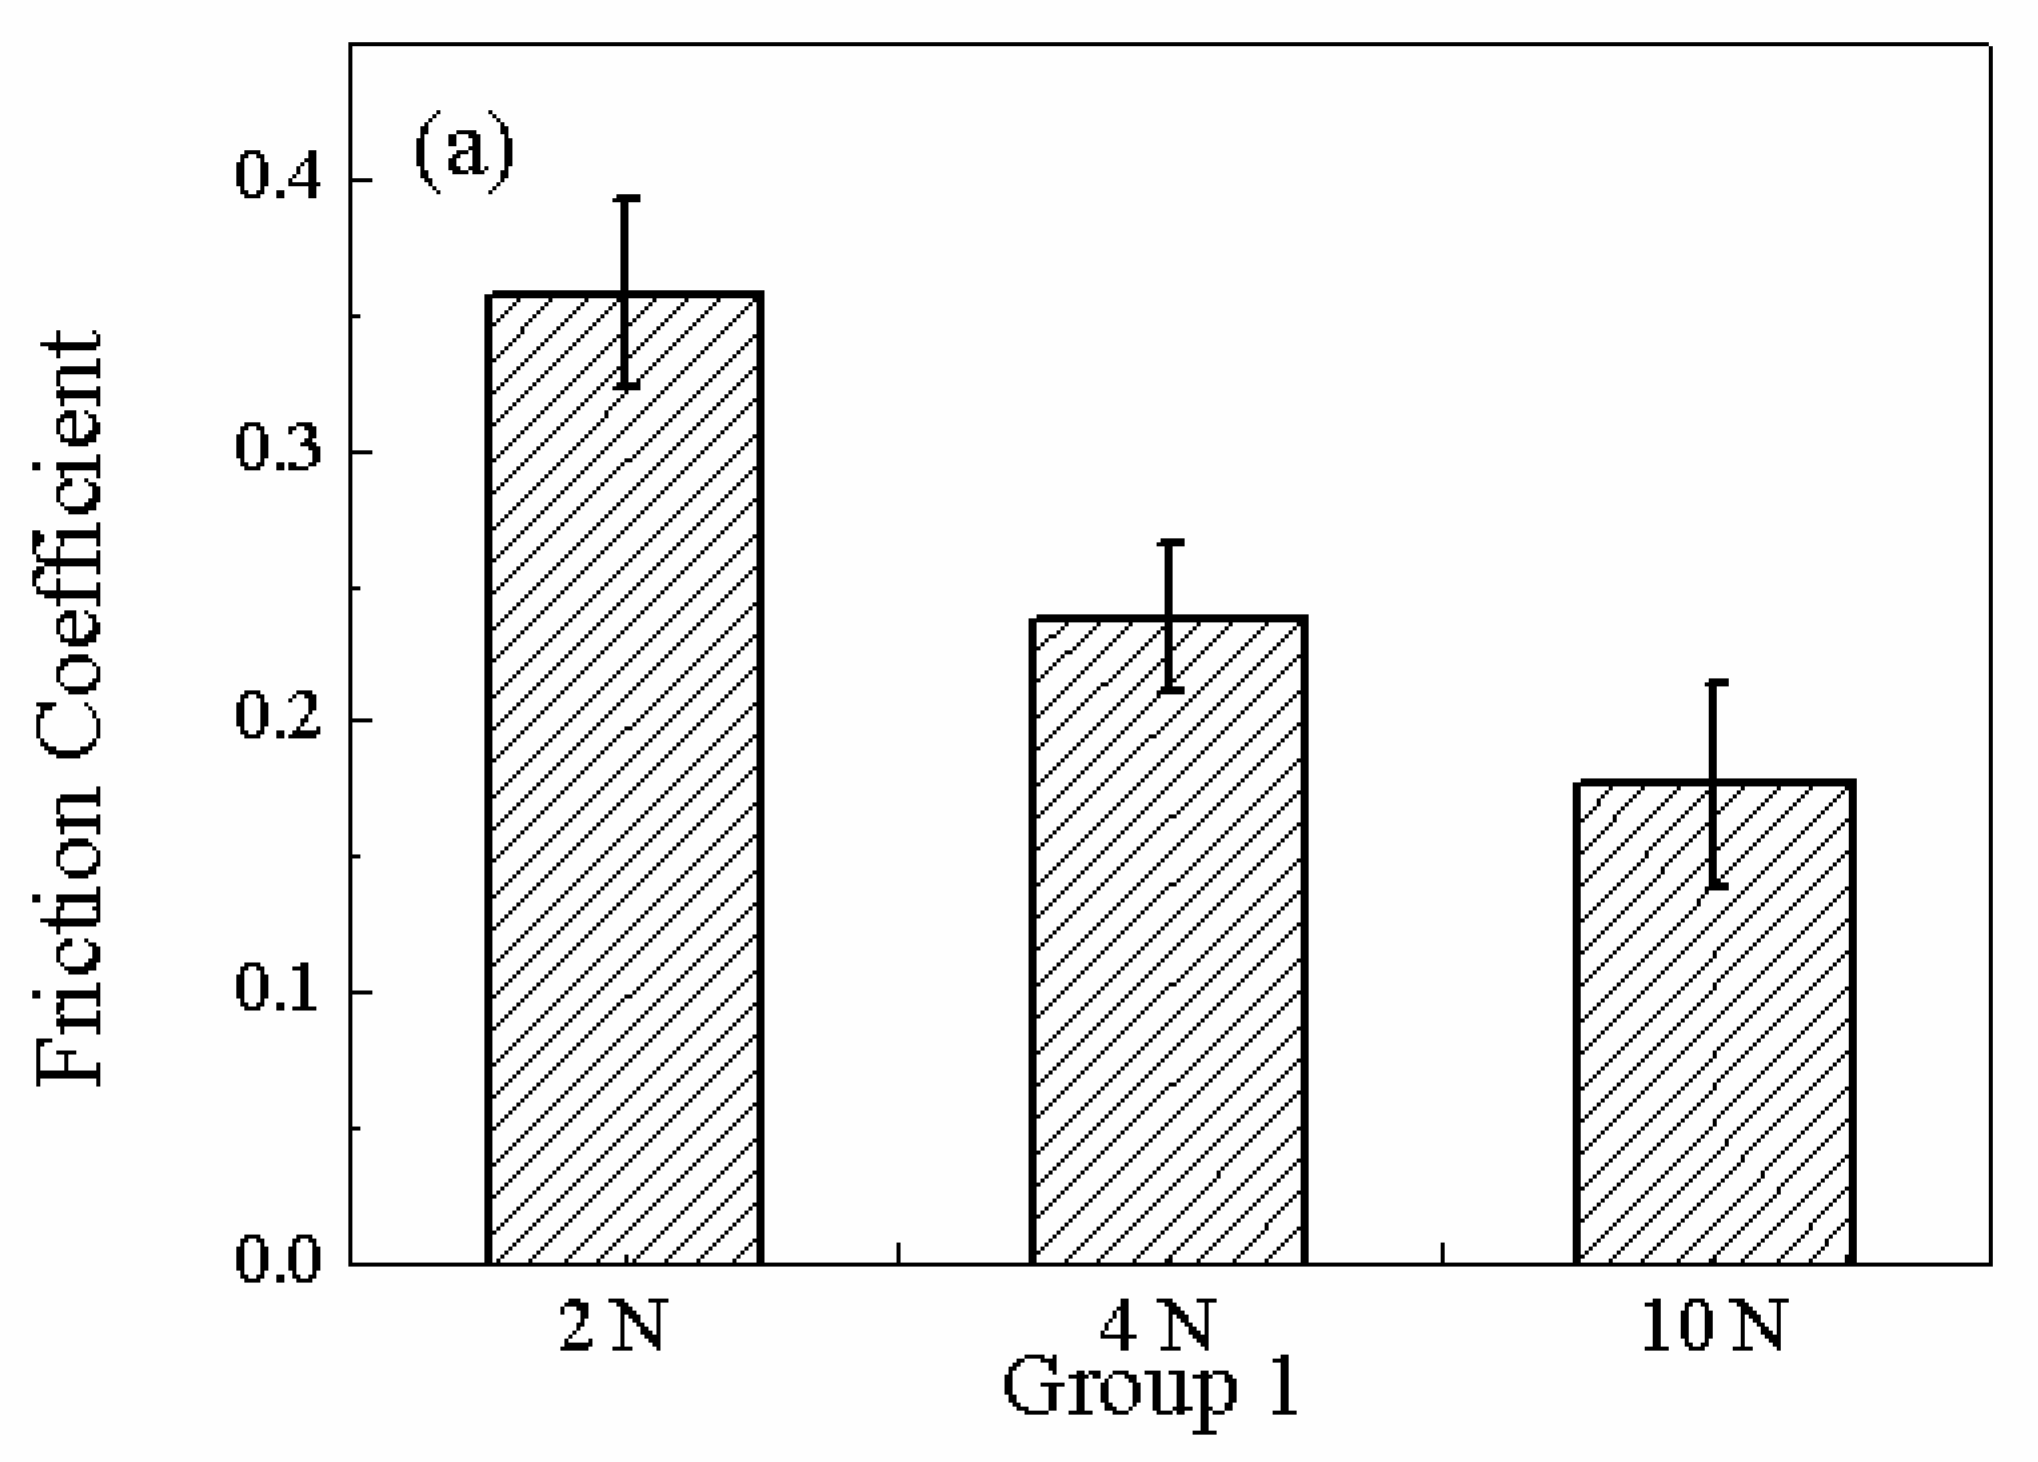
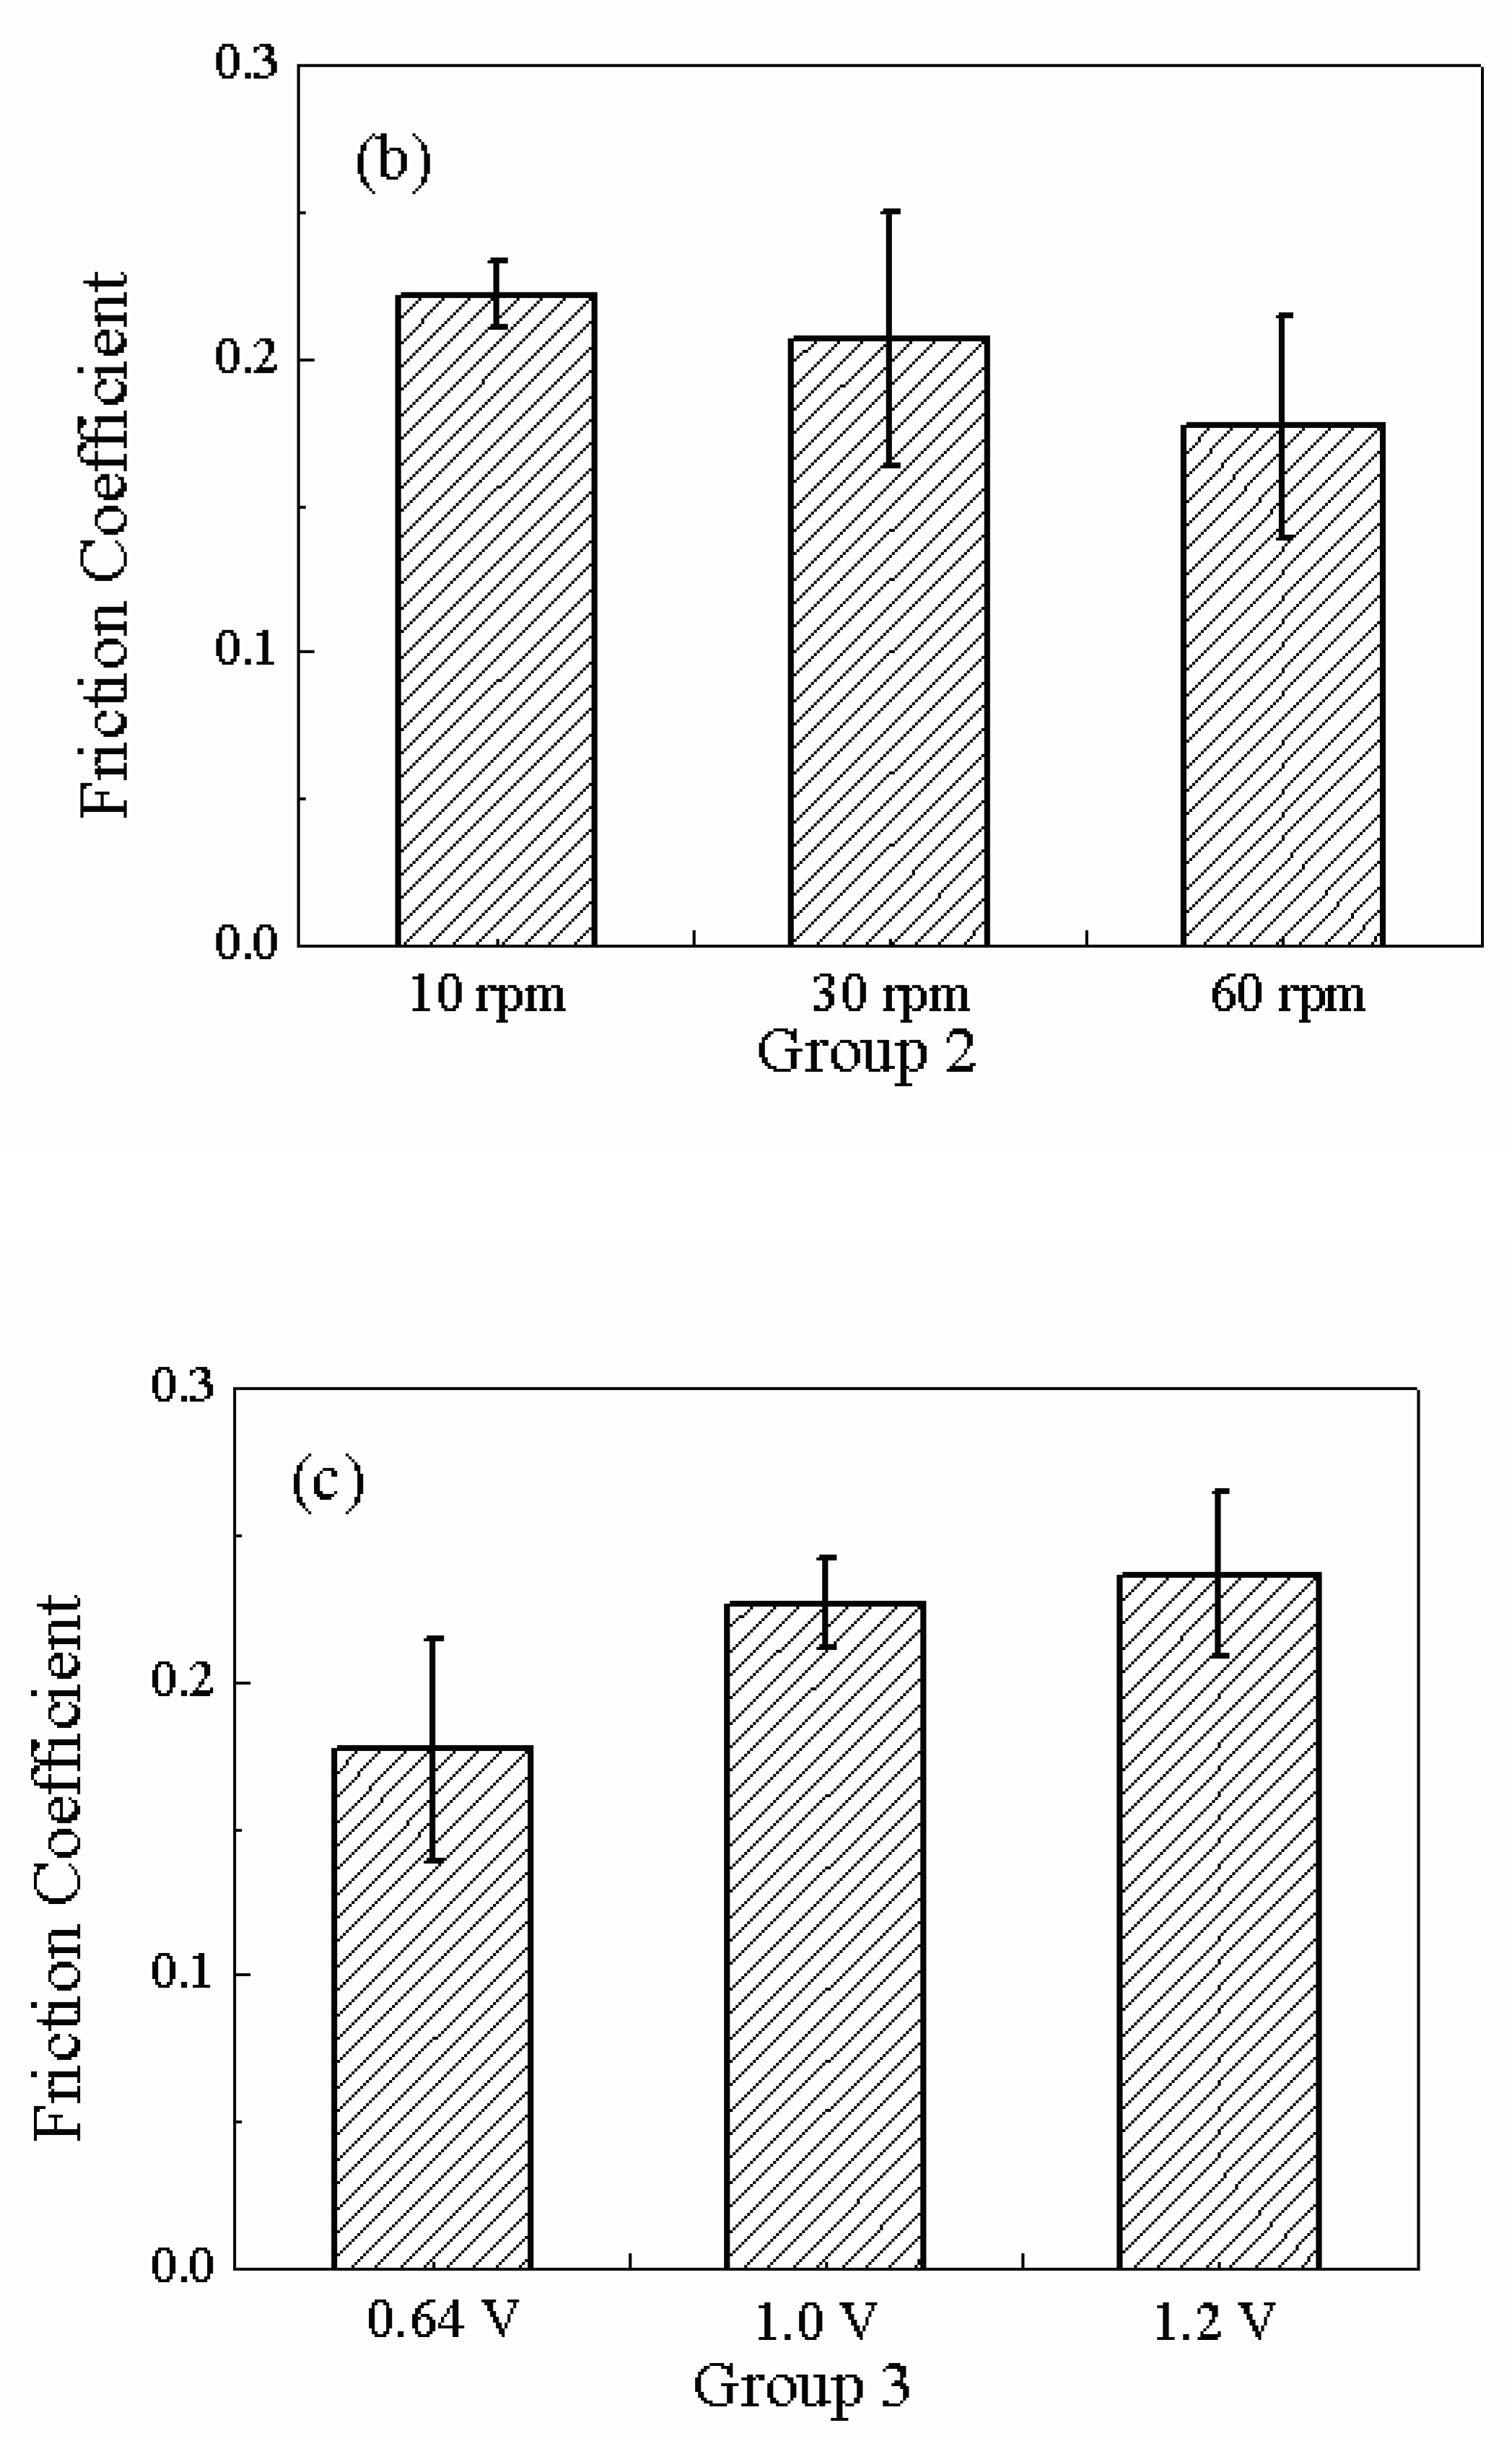
Figure 12.
Impedance curves for different cases: (a)different applied loads at 60rpm and 0.64V (vs.Pt);(b)different rotating speed at 10N and 0.64V (vs.Pt); (c)different potentials at 10N and 60 rpm.
Figure 12.
Impedance curves for different cases: (a)different applied loads at 60rpm and 0.64V (vs.Pt);(b)different rotating speed at 10N and 0.64V (vs.Pt); (c)different potentials at 10N and 60 rpm.
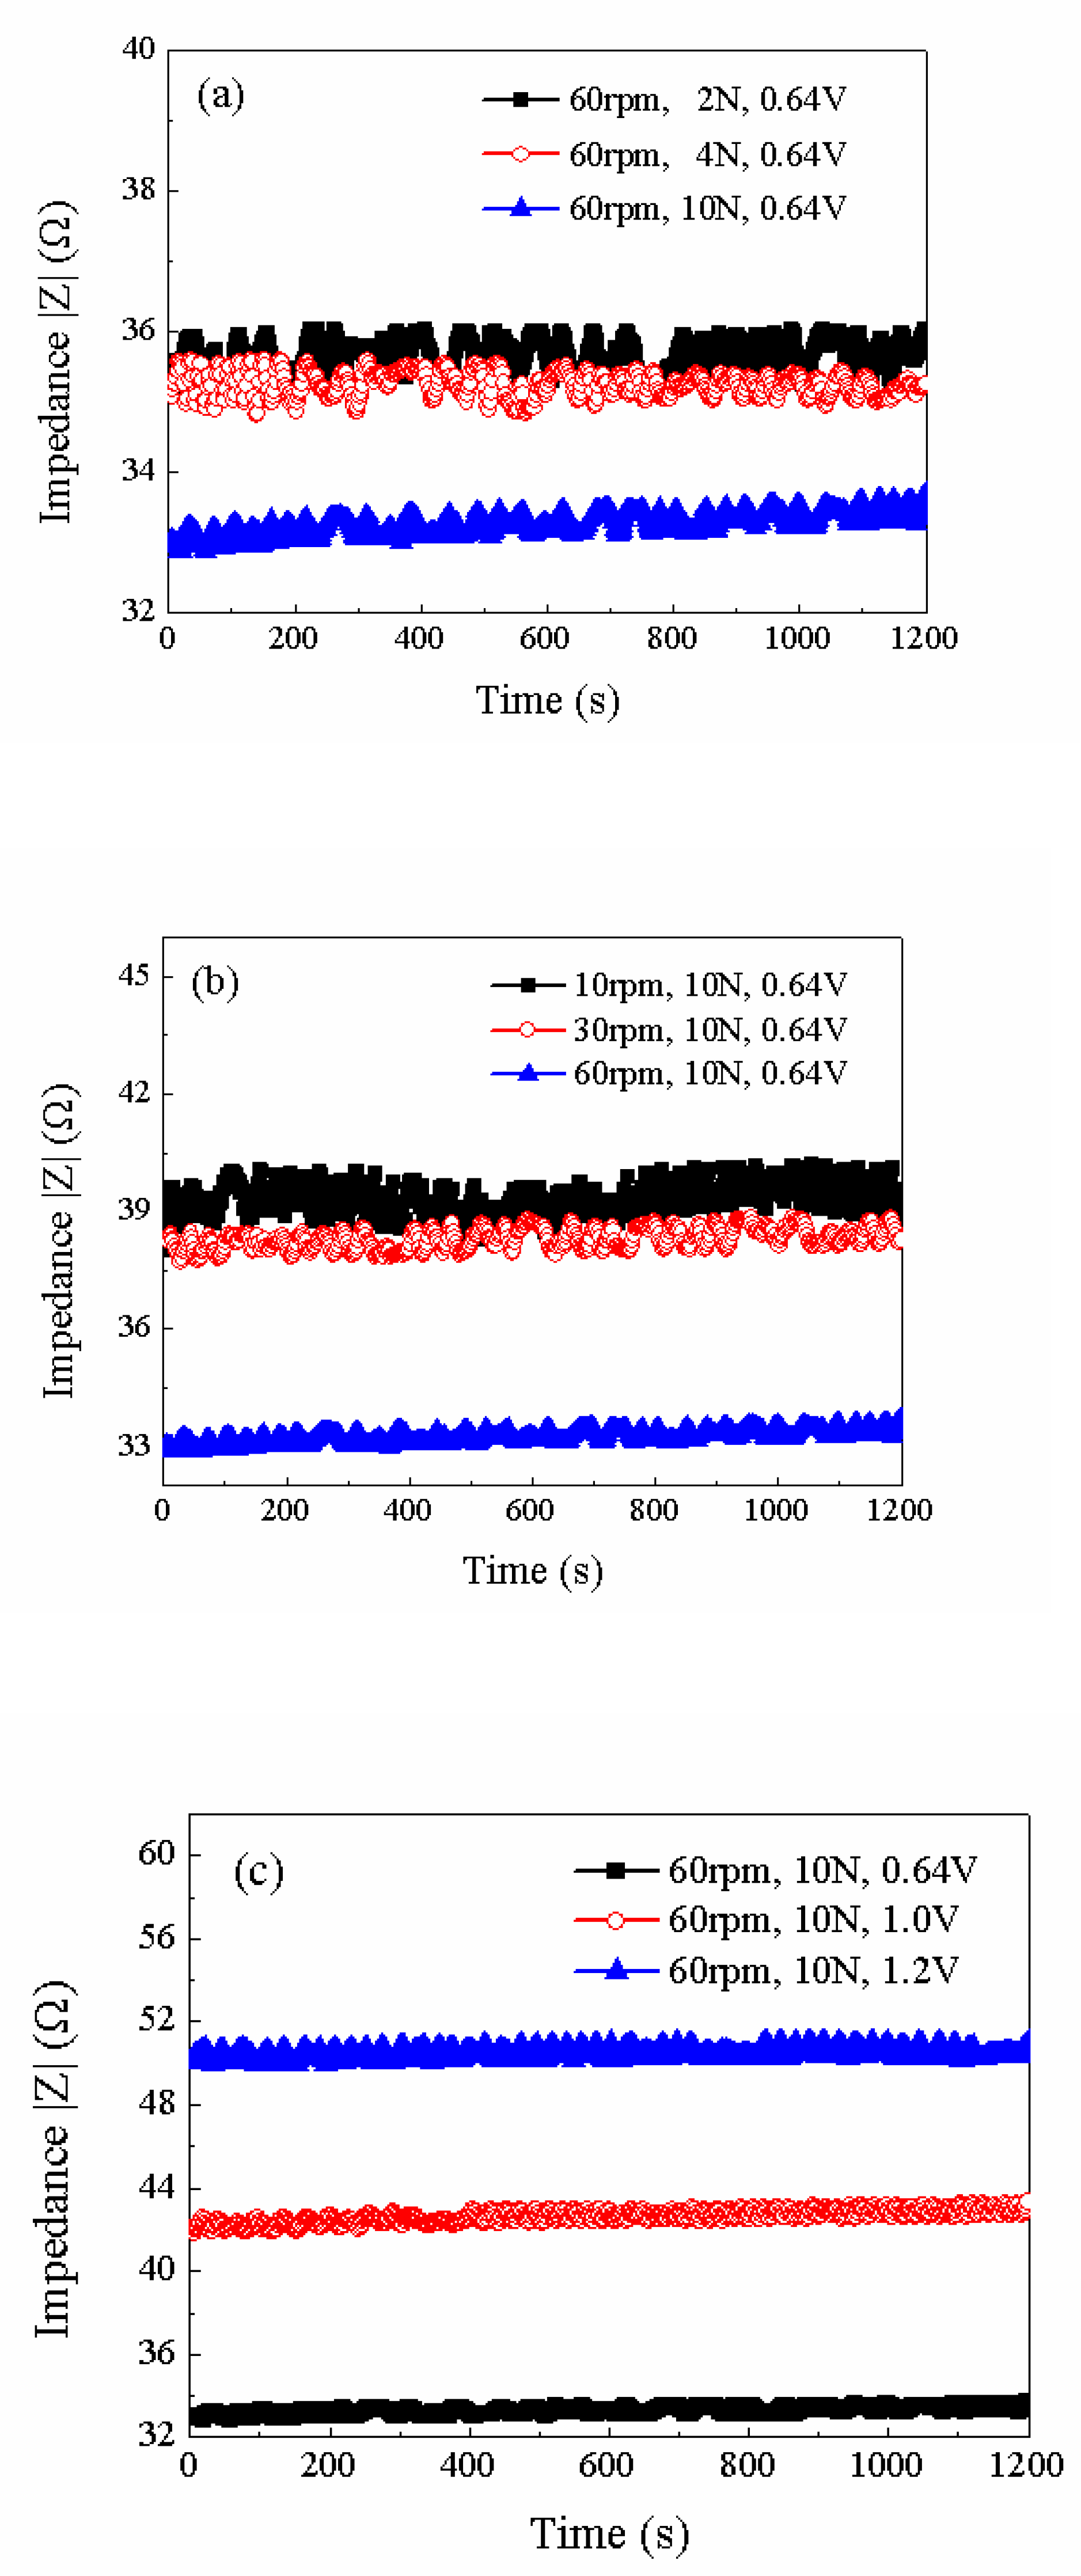
Figure 13.
The relationship between the mechanical power and average impedance. The load and rotating speed are the only variables. The potential is 0.64 V (vs.Pt).
Figure 13.
The relationship between the mechanical power and average impedance. The load and rotating speed are the only variables. The potential is 0.64 V (vs.Pt).
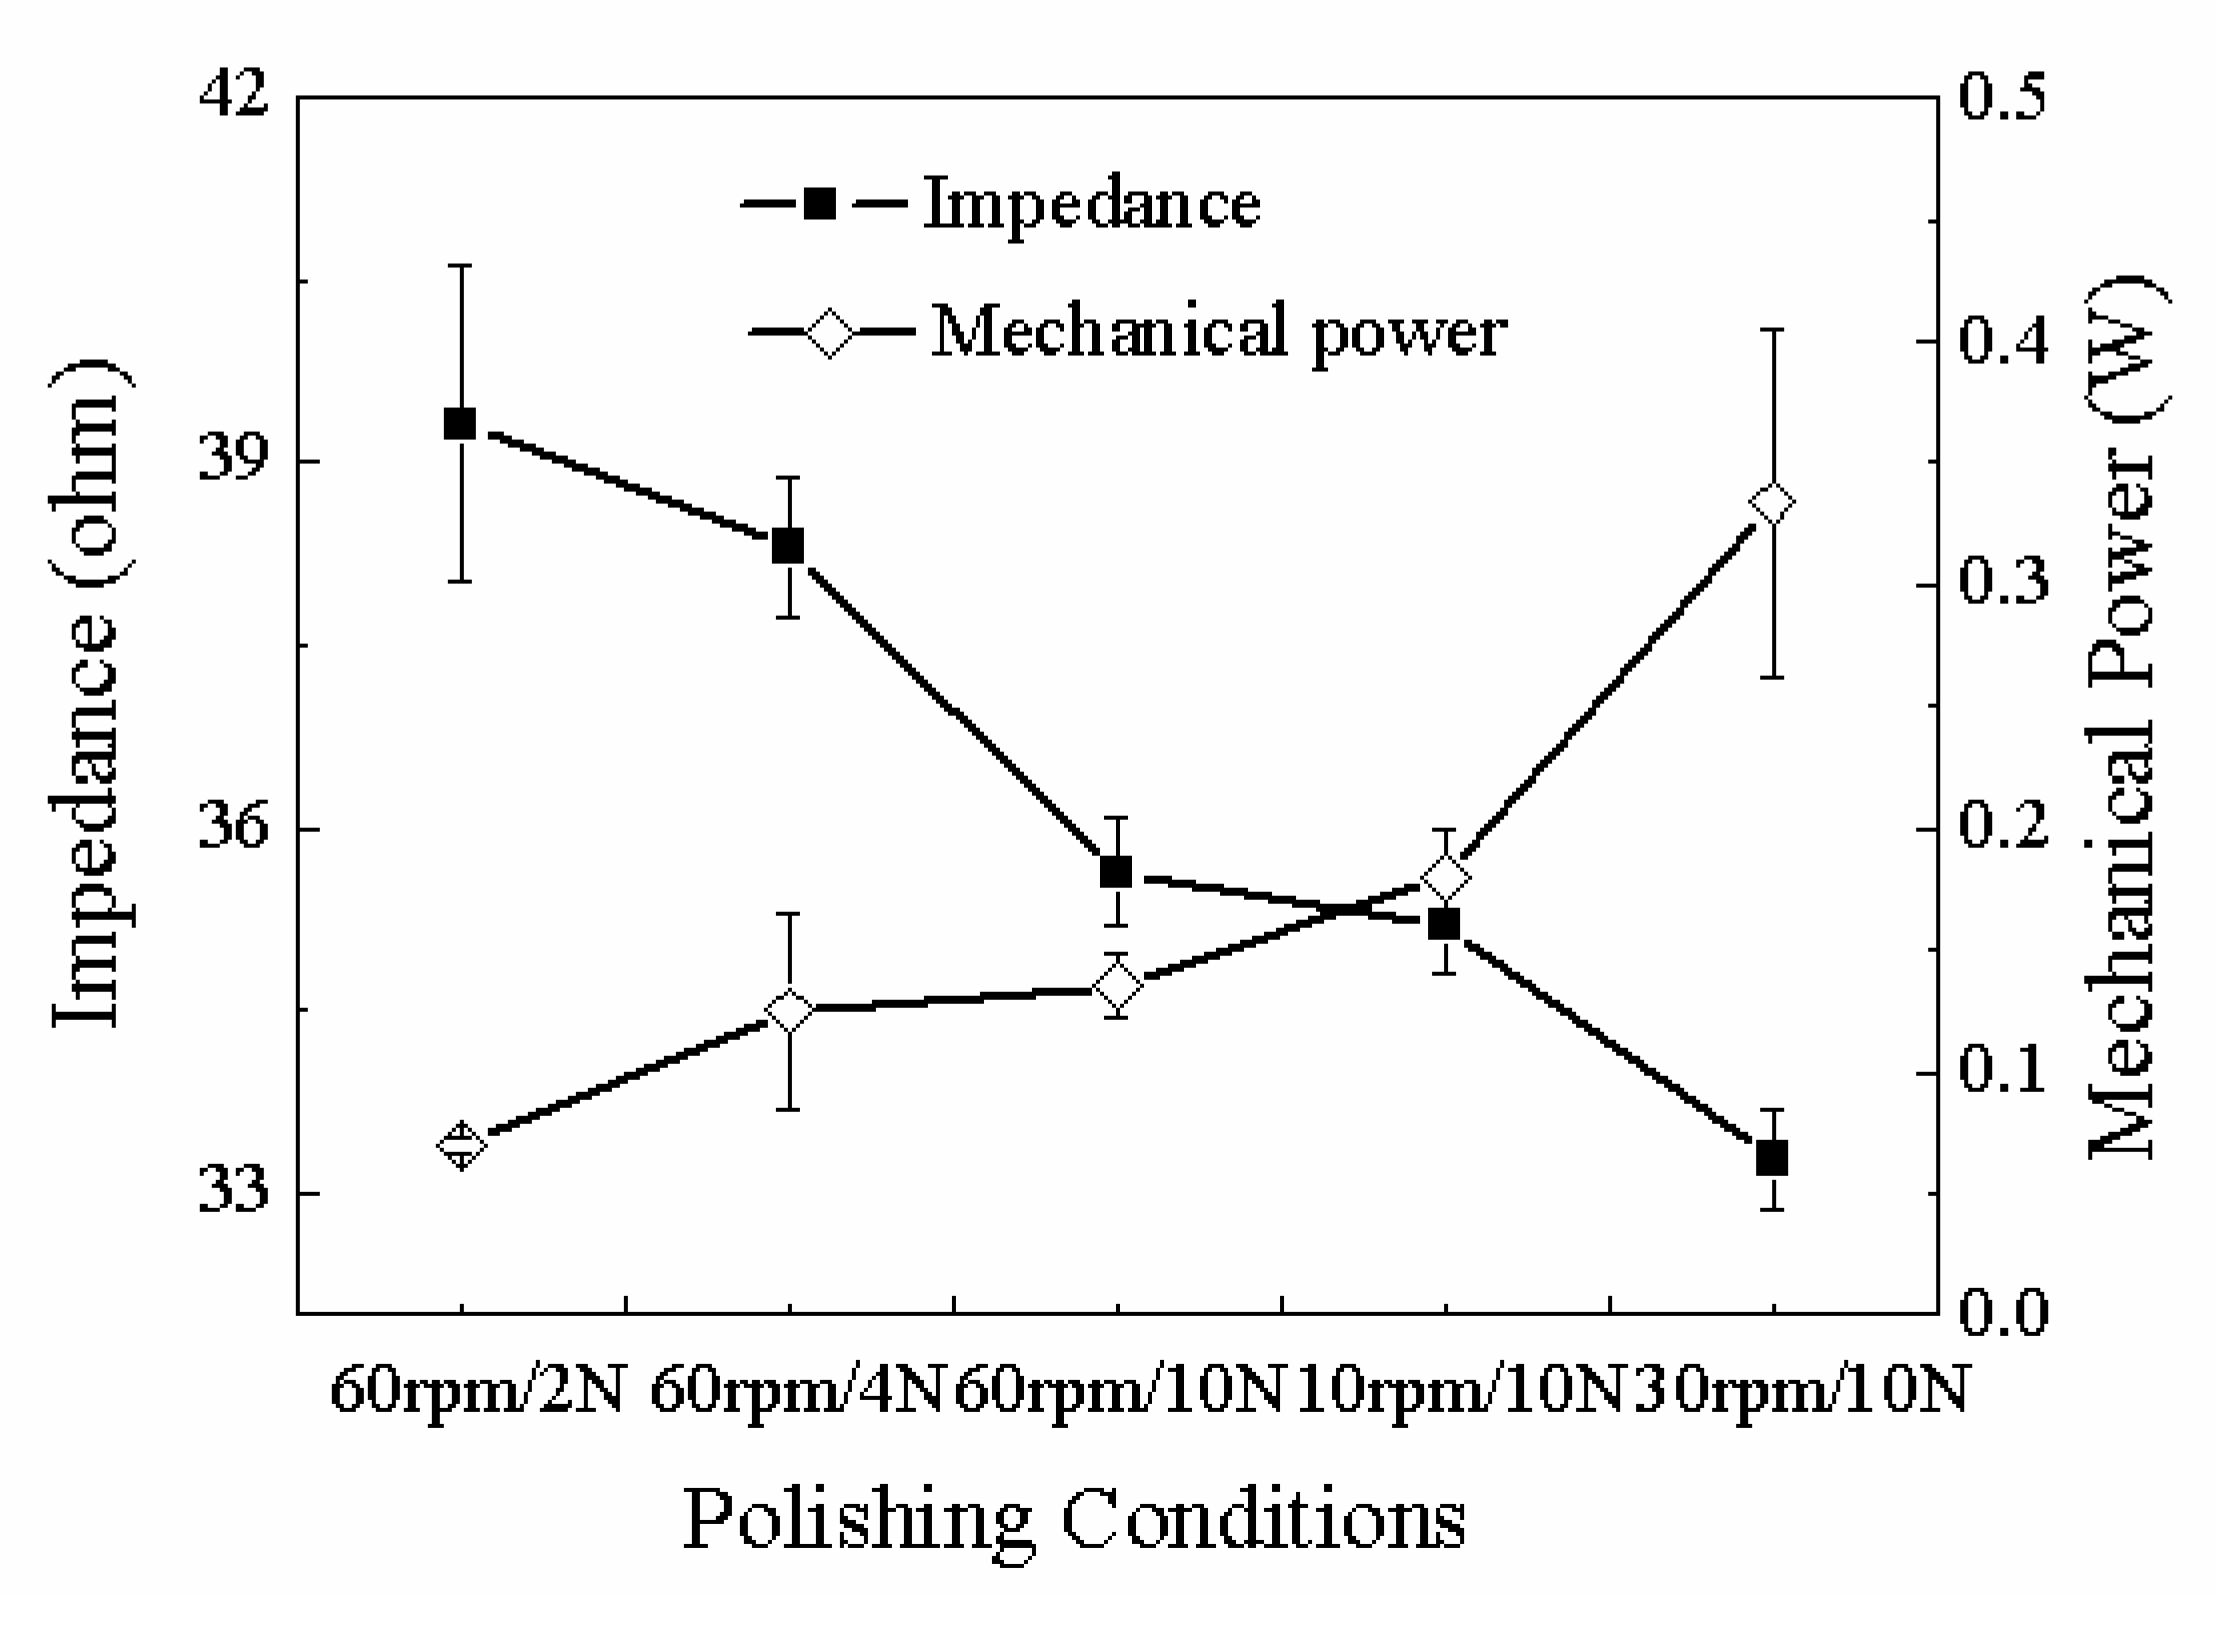
Figure 14.
Impedance as a function of mechanical power. The curve divides the removal mechanisms into two regions. The upper is dominated by oxidation and lower by mechanical abrasion.
Figure 14.
Impedance as a function of mechanical power. The curve divides the removal mechanisms into two regions. The upper is dominated by oxidation and lower by mechanical abrasion.
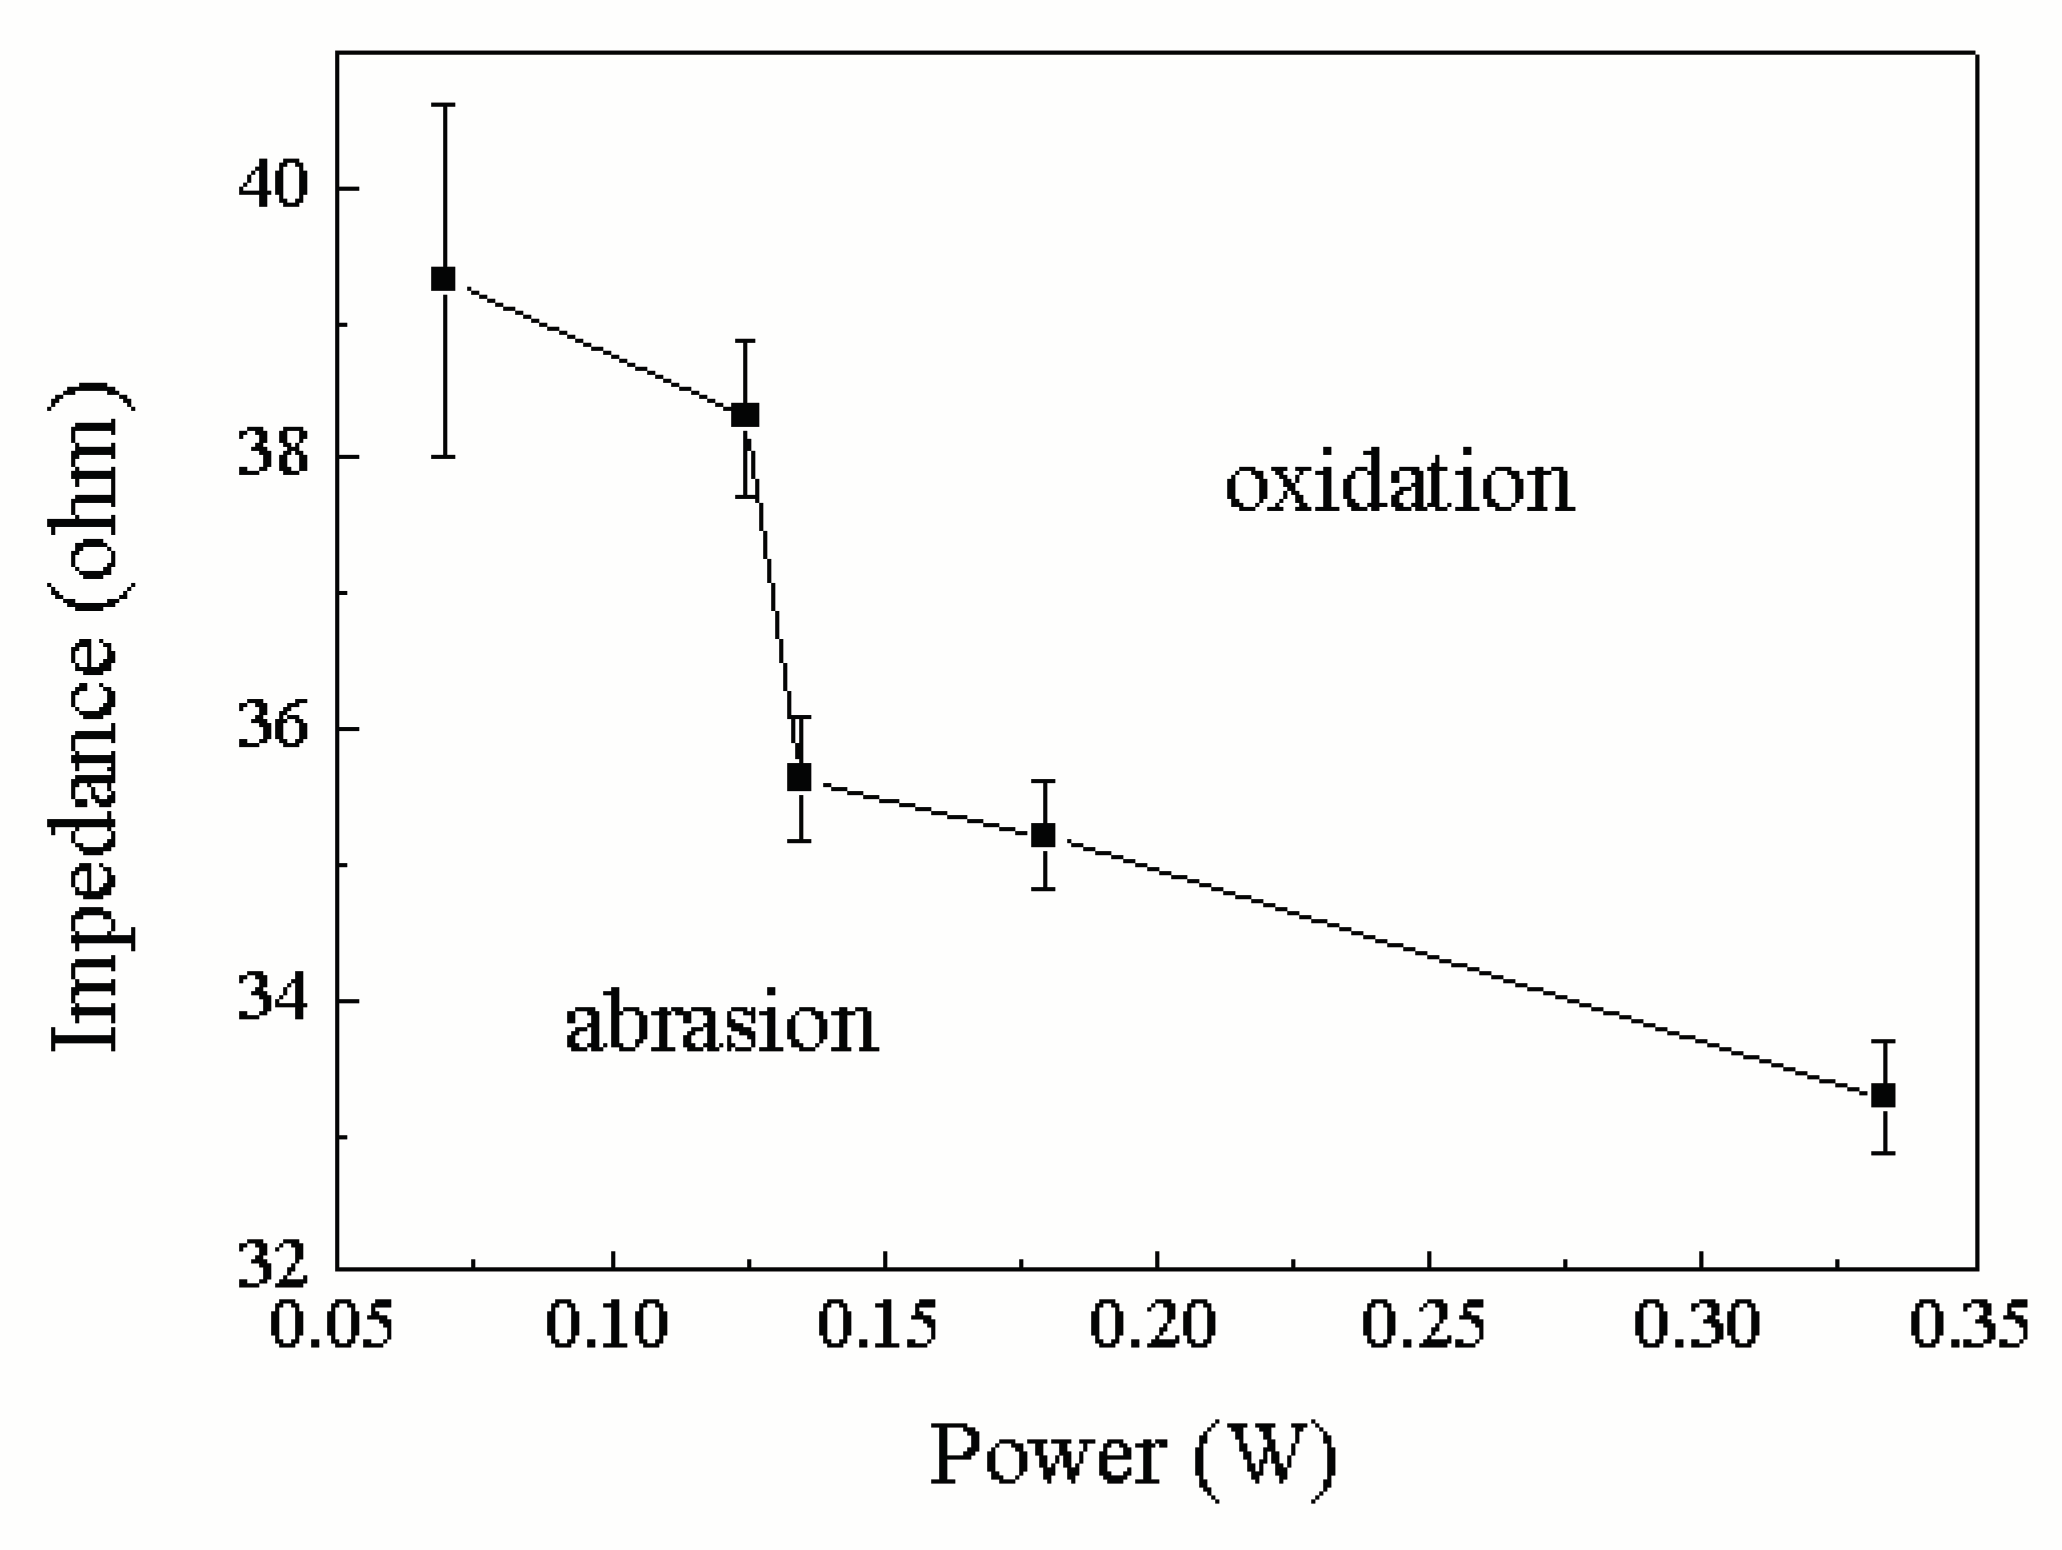

Table 1.
Best-fit values for CPE1 and Rct from the impedance spectra in Figure 7.
Table 1.
Best-fit values for CPE1 and Rct from the impedance spectra in Figure 7.
| CPE1 /(F·cm-2) | Rct /(Ω·cm2) | |
|---|---|---|
| Static | 0.0007916 (62.27) | 0.3541 (9.867) |
| 10 rpm | 0.0007312 (26.95) | 0.3604 (9.277) |
| 30 rpm | 0.0005719 (48.93) | 0.3777 (15.88) |
| 60 rpm | 0.0005682 (33.22) | 0.3814 (10.18) |
| 120 rpm | 0.0005098 (33.67) | 0.4272 (9.905) |
Note: The data in parentheses is the fitting error.
Table 2.
Results of EDAX (mass fraction, %).
| Potential/V | C | N | O | Ru |
|---|---|---|---|---|
| No bias | – | – | 0.64 | 99.36 |
| 0.64 | 11.44 | 1.59 | 1.98 | 84.99 |
| 1.0 | 11.84 | 2.67 | 2.79 | 82.70 |
| 2.0 | 5.48 | 10.27 | 20.61 | 63.64 |
Table 3.
Best-fit values for CPE1 and Rct from the impedance spectra in Figure 10
Table 3.
Best-fit values for CPE1 and Rct from the impedance spectra in Figure 10
| Potential / (V vs. Pt) | CPE1 /(F·cm-2) | Rct /(Ω·cm2) |
|---|---|---|
| 0.5 | 0.002563 | 0.3746 |
| 0.64 | 0.001355 | 0.4915 |
| 1.0 | 0.0007592 | 0.6590 |
Table 4.
Results of mechanical power and average impedance
| Group | Fixed parameters | Variables | Average impedance(Ω) | Power(W) |
|---|---|---|---|---|
| 1 | 60rpm/0.64V | 2N | 35.6366±0.4466 | 0.1350±0.0132 |
| 4N | 35.2091±0.4 | 0.1794±0.0202 | ||
| 10N | 33.2810±0.4190 | 0.3333±0.0711 | ||
| 2 | 10N/0.64V | 10rpm | 39.3130±1.293 | 0.0697±0.0035 |
| 30rpm | 38.3030±0.5830 | 0.1249±0.0405 | ||
| 60rpm | 33.2810±0.4190 | 0.3333±0.0711 | ||
| 3 | 60rpm/10N | 0.64V | 33.2810±0.4190 | 0.3333±0.0711 |
| 1.0V | 42.6213±0.7113 | 0.4275±0.0283 | ||
| 1.2V | 50.5326±0.5626 | 0.4464±0.0539 |
Disclaimer/Publisher’s Note: The statements, opinions and data contained in all publications are solely those of the individual author(s) and contributor(s) and not of MDPI and/or the editor(s). MDPI and/or the editor(s) disclaim responsibility for any injury to people or property resulting from any ideas, methods, instructions or products referred to in the content. |
© 2025 by the authors. Licensee MDPI, Basel, Switzerland. This article is an open access article distributed under the terms and conditions of the Creative Commons Attribution (CC BY) license (http://creativecommons.org/licenses/by/4.0/).
Copyright: This open access article is published under a Creative Commons CC BY 4.0 license, which permit the free download, distribution, and reuse, provided that the author and preprint are cited in any reuse.


