
Submitted:
04 November 2025
Posted:
06 November 2025
You are already at the latest version
Abstract
Leronlimab, a humanized monoclonal antibody directed to the CCR5 receptor, demonstrated anti-tumor activity in humanized NSG mouse models of both heterotopic and orthotopic SW480 human colon carcinoma. The anti-tumor effect was lost in non-humanized mice, suggesting a critical role for engrafted human leukocytes. Development of xGVHD was delayed in both tumor-bearing and non-tumor-bearing mice that had been treated with leronlimab. Leronlimab induced human CD4+CD25+ cells in the peripheral blood of tumor-bearing (1.5-fold increase, p=0.016) and non-tumor-bearing animals (2.2-fold, p=0.0038). Leronlimab reduced CD4+CD25- cells (1.84-fold reduction, p=0.033). In the orthotopic colon cancer model, lung metastatic burden was decreased ~87% in leronlimab-treated mice compared to IgG-treated animals (p=0.012). Blockade of CCR5 signaling reduced peri-tumoral vessel formation feeding the tumor, 62% (p=0.013). As CD4+CD25+ T cells, play a crucial role in immune checkpoint inhibitor (ICI) responses we assessed CCR5/immune checkpoint gene expression in human colon cancer. CCR5 and its ligands were overexpressed in human colon cancer, correlating with increased immune checkpoint gene expression in both microsatellite stable (MSS) and instable (MSI) patients.
Keywords:
leronlimab
; humanized NSG mice
; CCR5 receptor
; angiogenesis
; GVHD
; immune checkpoint inhibitor
1. Introduction
The CCR5 receptor, a G protein-coupled integral membrane receptor, functions as a chemokine receptor on the surface of T cells, macrophages, eosinophils, dendritic cells and some carcinoma cells, including breast and prostate [1,2]. Ligands for CCR5 include CCL3, CCL4, CCL3L1, and CCL5 [3,4,5,6]. CCR5 serves as a co-receptor for the cellular entry point for HIV. Leronlimab, a humanized monoclonal anti-CCR5 antibody, was developed as an entry inhibitor for HIV. In a phase 2b/3 study HIV-1 RNA levels were reduced to <50 copies per mL plasma, suggesting utility of leronlimab as a component of salvage therapy [7]. Leronlimab was generally well tolerated with no drug-related SAEs reported [7]. Leronlimab functions as a competitive inhibitor of CCR5 by binding to the second external loop of CCR5 [8]. Binding of leronlimab to CCR5 does not induce agonistic activity (activation of tyrosine kinase or synthesis of cAMP). Leronlimab, in combination with standard anti-retroviral therapies, has successfully completed a Phase 3 pivotal trial in HIV-infected treatment-experienced patients.
CCR5 is overexpressed in cancers [9], increasing in abundance upon cellular oncogenic transformation [10]. The use of small molecule CCR5 inhibitors validated the importance of CCR5 in the progression and metastasis of breast [1] and prostate cancer [2] , reducing bone and brain metastasis in immune competent mice. CCR5 facilitates the onset and progression of breast cancer [11] and leronlimab prevented the breast cancer metastasis and reduced the size of established metastasis [12]. Expression of CCR5 is elevated in colon cancer, correlating with poor outcomes and advanced TNM stage [13,14]. Microsatellite instability (MSI) in colon cancers occurs due to defects in mismatch repair (MMR). MSI is less common (15%) and associated with a better prognosis and potential response to certain immunotherapies. High CCR5 and CCL5 expression is associated with increased tumor mutational burden, deficiency in mismatch repair, and elevated PD-L1 levels, suggesting a link to immunotherapy resistance [13].
Our previous studies indicated that treatment with leronlimab abrogated xenogenic graft-versus-host-disease (xGVHD) in NSG mice [15]. Leronlimab blunted the development of xGVHD, but did not block engraftment of normal human leukocytes in the murine bone marrow. Other evidence suggested that a small molecule inhibitor of CCR5 (maraviroc) was clinically effective at blocking immunosuppressive cellular activity, mediated by CCL5 expressed on cytotoxic T lymphocytes (CTL), and that CCR5 blockade was associated with re-polarization of tumor associated macrophages from M2 phenotype (immunosuppressive) back to M1 (pro-inflammatory) in the colon carcinoma microenvironment [16]. Blockade of CCR5 by maraviroc rescued mice from inflammatory bowel disease (colitis) in both acute and chronic models [17]. The CCL5-CCR5 axis clearly plays a role in orchestrating several key aspects of the immune response [18]. The goal of these studies was to determine if leronlimab treatment might induce a graft-versus-tumor effect against primary or metastatic colon carcinoma lesions.
2. Materials and Methods
2.1. Animal Studies
Animal experiments were conducted in accordance with the ethical standards and according to national and international guidelines and were approved by the Cleveland Clinic Institutional Animal Care and Use Committee. Male NOD.Cg-Prkdcscid Il2rgtm1Wjl/SzJ, commonly known as the NOD scid IL-2 receptor gamma knockout (NSG, Jackson Laboratory, Stock No. 005557), were 6-8 weeks old when used. Mice were housed in a specific pathogen free barrier facility in cages with microisolator lids, autoclaved bedding, HEPA-filtered air, and maintained under 12:12 light:dark cycles, controlled temperature and humidity. Animals had free access to autoclaved standard food and filtered water. Conditioning regimen: mice received 225 cGy total body irradiation via an X-ray source (Precision X-Rad 320, North Branford, CT).
2.2. Humanized Mouse Model and Tumor Inoculation
Twenty-four hours after X-ray irradiation, mice were engrafted with human BM cells. De-identified human donor cells were obtained by back-flushing filter packs utilized by the Cleveland Clinic Bone Marrow Transplant program. Fresh (non-frozen) leukocytes were purified by Ficoll-Hypaque gradient centrifugation, washed in phosphate buffered saline (PBS), and assessed for viability (ViCell, Beckman Coulter, Brea, CA). Human BM mononuclear leukocytes were injected into the lateral tail vein (106 cells/mouse). Heterotopic inoculation: On day 35, when there was clear evidence of human leukocyte engraftment, mice were inoculated in the flanks with 2.5x10⁵ SW480 human colon carcinoma cells (ATCC, Manassas, VA) that had been stably transfected with luciferase-pcDNA3 [32] using Lipofectamine. The luciferase-pcDNA3 plasmid was a gift from William Kaelin (Addgene plasmid # 18964; http://n2t.net/addgene:18964; RRID: Addgene_18964). Mice were monitored for clinical symptoms of GvHD (body posture, activity, fur and skin condition, weight loss) two times/week. Peripheral blood was monitored weekly for engraftment utilizing saphenous vein venipuncture (50 µL) collected in K-EDTA tubes. At day 81 over half the mice exhibited > 10% weight loss, clinical symptoms of GvHD, and were considered to have reached experimental endpoint. Orthotopic inoculation: Under ketamine-xylazine anaesthesia, following skin preparation with Betadine scrub and 70% ethanol wipe (x3), the cecum was exposed through a 10 mm incision. 105 SW480-luc cells in a volume of 10 uL were inoculated into the sub-serosa of the cecum using a 31-gauge needle. Cecum was returned to the peritoneal cavity, muscle and skin were closed in two layers of suture, and mice were allowed to recover. Euthanasia: Mice were subject to euthanasia by controlled gradient CO2 inhalation (Quietek, NextAdvance, Averill Park, NY) followed by cervical dislocation, and tumors and organs were harvested. Bioluminescent imaging: To evaluate metastases mice were analyzed using the IVIS Spectrum In Vivo Imaging System (PerkinElmer, Waltham MA). Luciferin doses were 3 mg i.p. for in vivo imaging, and 150 ug/mL for in vitro imaging of excised lungs and liver.
2.3. Leronlimab Treatment
Mice were randomized into control and treatment groups of 8 animals each by body weight. Leronlimab was administered intraperitoneally (i.p.) at 2.0 mg/mouse twice weekly. The 2.0 mg dose was calculated [33,34] to approximate the dose used in an ongoing CytoDyn sponsored phase 2 human clinical trial for acute GvHD. A single administration of this dose in HIV positive patients has been shown to reduce the HIV load by more than ten-fold. Control mice received normal human IgG (Sigma Aldrich, St. Louis, MO) at the same dose level.
2.4. Flow Cytometry
Peripheral blood (PB) samples were analyzed by flow cytometry. Erythrocytes were lysed with ammonium chloride, cells were washed twice with PBS and stained for 15 min at 4 deg C in PBS/0.5 mM EDTA/0.5% BSA with the following antibodies: anti-human-CD3-FITC (clone UCHT1, IM1281U), anti-human-CD45-PC7 (clone J.33, IM3548U), anti-mouse-CD45.1-FITC (clone A20), eBioscience (Thermo Fisher) and anti-human-CD56-PE (clone 5.1H11), BioLegend. For human CD45, mouse CD45, and human CD3, results were expressed as percentage of total events. For human CD56, results were expressed as percentage of total events. For analysis of immunosuppressive cells, True-Nuclear Human Treg Flow Kit (FoxP3 AlexaFluor 488/CD4 PE-Cy5/CD25 PE) was used according to manufacturer directions (BioLegend, San Diego, CA). Samples were analyzed on a Cytomics FC500 Flow Analyzer (Beckman/Coulter).
2.5. Immunohistochemistry
Immunohistochemistry staining was performed using the Discovery ULTRA automated stainer from Roche Diagnostics (Indianapolis, IN). Antigen retrieval was performed using a tris/borate/EDTA buffer (Discovery CC1, 06414575001; Roche), pH 8.0 to 8.5. Time, temperature, and dilutions are listed below. The antibodies were visualized using the OmniMap anti-Rabbit HRP (05269679001; Roche), and OmniMap anti-Mouse HRP (05269652001; Roche) in conjunction with the ChromoMap DAB detection kit (05266645001; Roche). Lastly, the slides were counterstained with hematoxylin and bluing.
2.6. Cell Sorting
SW480 cells were grown as a monolayer in DMEM with 10% FBS, Antibiotic-Antimycotic (Sigma), in a 37 deg C incubator, at 5% CO2 and converted into a single cell suspension using Cell Dissociation Solution Non-enzymatic 1X (Sigma). Cells were stained with CCR5-APC, Anti-human/mouse/rabbitCCR5, APC conjugate, IgG1, CAT#FAB1802A (R&D Systems, Minneapolis, MN) at a 1:20 dilution in 1xPBS with 2% FBS. Cells were sorted by FACS into CCR5-High and CCR5-Low populations. Cell sorting was performed on a Sony SH800Z using a 130uM nozzle. Sorting of CCR5 dim and bright positive cells was based on sequential gating of FSC vs. SSC to exclude debris; 76.70% of cells were included in the gate.
2.7. Tumor Angiogenesis
Blood vessels growing at the periphery of dermally inoculated day 10 SW480 colon carcinoma tumors in humanized NSG mice were photographed using a dissecting microscope at 12.5x magnification. Every visible vessel touching the circumference of the tumor nodule was scored as a single vessel. Two measurements were taken to assess the tumor area (the largest diameter coplanar with the skin, and a second diameter perpendicular to the first). The product of these two measurements was used as an index of tumor area. Grayscale mages were captured using an operating microscope with 12.5 objective lens (World Precision Instruments, PSMT5, Sarasota, FL). Each experimental group contained eight mice. Grayscale images were converted to binary images (black and white) using Photoshop (Adobe). Binary images were subjected to digital analysis using VESGEN software [35], where the region of interest representing the tumor mass defined the perimeter of the tumor. The output was a series of color Vessel Generation maps (colored vessels on black background) in which the vessels of largest diameter were defined as G1 (red), with each subsequent smaller generation represented as G2–G9. From these maps, the software calculated the total vessel area, vessel length density, vessel number, and vessel diameter.
2.8. CCR5 Gene Expression Correlation Analysis on TCGA COAD Samples
Gene expression correlation analysis was conducted using the UCSC Xena platform [23] on TCGA Colon and Rectal Cancer (COADREAD) samples (dataset TCGA, [36]). For the 434 samples with available RNAseq data, the expression of CCR5 ligands were assessed for correlation with CCR5 expression using the built in Spearman’s and Pearson’s correlation functions. The expression of immune checkpoint genes was similarly assessed. The platform allowed for grouped visualizations of the expression correlations (Figure 7A,B), but analysis of MSS and MSI samples separately was not possible, because the platform did not store such annotations for the samples. Therefore, the cBioPortal for Cancer Genomics platform [24] was used for analysis of gene expression correlations for MSS (Figure 7C-G) and MSI samples (Figure S2A-E), separately. Correlations between the expression of CCR5 and the expressions of CCR5 ligands as well as of immune checkpoints was analysed using the built-in expression correlation tool of the platform applying default parameters (Spearman’s correlation with Benjamini-Hochberg FDR correction). Pairwise correlations with the significantly correlated immune checkpoint genes were depicted using a log scale (Figure 7E-G for MSS and Figure S2C-E for MSI samples).
2.9. Statistical Analysis
Statistical analysis was performed using GraphPad Prism (GraphPad Software, La Jolla, CA). All measures of variance were depicted as standard error of the mean (SEM). Survival was analyzed by the Kaplan-Meier method and Mantel-Cox log-rank test. For other data, two-sided unpaired Student’s t-test was used.
3. Results
3.1. CCR5 Expression Accelerates Tumor Growth
We first sought to characterize the anti-tumor and immunomodulatory effects of leronlimab in a humanized human colon xenograft murine model and identify cellular mediators. To demonstrate that CCR5 was a functionally relevant marker of colon cancer progression in this xenograft model, SW480 human colon carcinoma cells were FACS sorted according to intensity of CCR5 expression (Figure 1). Pools containing the top and bottom 20% expressors were used to inoculate (non-irradiated) NSG mice (Figure 1B). Tumors that initiated from cells expressing CCR5 most strongly (Hi) generated tumors that grew faster than cells that had the lowest CCR5 expression (Lo), n=4, p=0.019 (Figure 1C). Hence, in the absence of drug treatment, tumor cells that expressed high numbers of CCR5 displayed a growth advantage in vivo.
3.2. Leronlimab Slows Development of xGVHD
The behavior of SW480 tumors in the context of humanized NSG mice was then examined. NSG mice were conditioned with 225 cGy total body irradiation, followed 24 hours later by inoculation of normal human BM mononuclear cells. Within 3 weeks, mice receiving IgG began to exhibit signs of xeno-graft-versus-host-disease (xGVHD), characterized by weight loss, body posture, activity, fur and skin condition (Figure 2). In non-tumor-bearing mice, leronlimab and IgG treatment was stopped at week 5, to determine the duration and persistence of anti-GVHD activity conferred by antibody. Systemic symptoms worsened in both IgG and leronlimab groups following cessation of treatment. Signs of xGVHD were delayed until week 7 in both leronlimab-treated groups. Weight loss accelerated in both tumor-bearing groups compared to non-tumor-bearing animals. Compared to IgG, leronlimab delayed the onset of xGVHD in both tumor-bearing and non-tumor-bearing mice, p=0.001.
3.3. Leronlimab Enhances Anti-Tumor Activity in Humanized Mice
The effect of humanization on anti-tumor activity was then assessed. In humanized NSG mice leronlimab effectively delayed tumor progression compared to IgG treatment, and the effect persisted out to day 80 (Figure 3, blue line, p=0.004). In non-humanized NSG mice, the effect of leronlimab treatment upon tumor growth was no different from IgG treatment (green line, p=0.782), indicating the importance of human effector cells in mediating the anti-SW480 activity. Humanization combined with IgG treatment conferred an initial anti-tumor effect that was eventually lost by day 60.
3.4. Alterations in Peripheral Blood Leukocyte Distribution in Humanized Mice
Peripheral blood from humanized mice was analyzed for changes in immune cell composition. In non-tumor-bearing mice leronlimab induced a 28.9% increase in circulating human NK cells (p=0.017) (Figure 4A, control mice). In tumor-bearing mice leronlimab treatment resulted in decreased circulating human B cells (40.1%, p=0.037) and NK cells (49.8%, p= 0.006), and increased T cells (Figure 4B, tumor bearing mice) (9.0%, p=0.002). This cellular redistribution following leronlimab administration was not secondary to enhanced tumor invasion by human leukocytes. In peripheral blood of both tumor-bearing and non-tumor-bearing animals, leronlimab induced immunosuppressive human CD4+CD25+ cells (1.5-fold increase, p=0.016; 2.2-fold increase, p=0.0038, respectively) (Figure 4C). Leronlimab also caused a 1.8-fold reduction (p=0.03) of GVHD-promoting circulating human CD4+CD25- cells. There were no FoxP3+ cells detected (data not shown).
3.5. Tumor-Infiltrating Leukocytes Were Absent from SW480 Tumor Xenografts
Immunohistochemistry of SW480 tumors was negative for staining of B cells and T cells as well as monocytes/macrophages (CD11b) being absent (Supplemental Figure 1). Human tonsil tissue was utilized as positive control, which demonstrated robust staining with CD3, CD4, CD8 and CD11b (Supplemental Figure 1, lower 4 panels).
3.6. Leronlimab Reduces SW480 Lung and Liver Metastases Following Orthotopic Inoculation
In order to determine the impact of leronlimab on colon cancer metastatic burden, orthotopic implantation experiments were conducted using the SW480 colon cancer cell line. Ten days after orthotopic inoculation of luciferase-labeled colon carcinoma cells into the sub-serosa of the cecum, mice were subject to bioluminescence imaging to verify equivalent starting tumor volumes. There was no significant difference between the early luminescence signal (photons/sec, p/s) emitted by tumors implanted in IgG-treated and leronlimab-treated mice (p=0.074) (Figure 5A,B). Mice were treated with leronlimab with a dose based on the bioequivalent dose shown to be safe in patients with HIV (700 mg) and the dose previously used to treat breast cancer in mice [12]. On day 45 the study was terminated due to palpable tumors in the abdomen measuring >15 mm diameter and deteriorating general condition of mice in both treatment groups. The livers and lungs were excised and placed in medium containing luciferin substrate. The liver metastatic burden was decreased 59% in leronlimab-treated mice (p=0.067) (Figure 5C,D). The lung metastatic burden was decreased 87% in leronlimab-treated mice compared to IgG-treated animals (p=0.012) (Figure 5E,F).
3.7. Tumor-Associated Angiogenesis is Inhibited by Leronlimab
Because of the lack of tumor-infiltrating leukocytes demonstrated by immunohistochemistry, we sought other host-mediated factors that might modulate the anti-tumor activity. Tumor neoangiogenesis is required for tumor growth and metastasis [19]. The inhibitory effect of leronlimab on tumor growth, and especially upon metastasis, suggested that another potential mechanism through which leronlimab may exert its antineoplastic effect(s) may be via inhibition of angiogenesis. Quantitative analyses of blood vessels directly feeding into day 10 SW480 colon carcinoma tumors inoculated in the dermis of the flanks revealed a significant decrease in the number of vessels in tumors from leronlimab-treated humanized mice compared with IgG-treated hosts (Figure 6), consistent with leronlimab causing an inhibitory effect on neoangiogenesis in the tumor bed. The utilization of VESGEN software allowed detailed comparisons between treatment groups and revealed marked reduction in multiple key properties of the vascular network feeding the tumor, including 62% reduction in total vessel area (pixels) (p=0.013), 53% reduction in vessel length density (p=0.0011), 61% reduction in number of large vessels (p=0.0082) and 80% reduction in number of small vessels (p=0.017). Thus, primary tumors from animals with the same initial tumor burden exhibited decreased angiogenesis following treatment with leronlimab.
3.8. CCR5 Expression in MSS Colorectal Cancer Correlates with Immune Checkpoint Inhibitor (ICI) Gene Expression
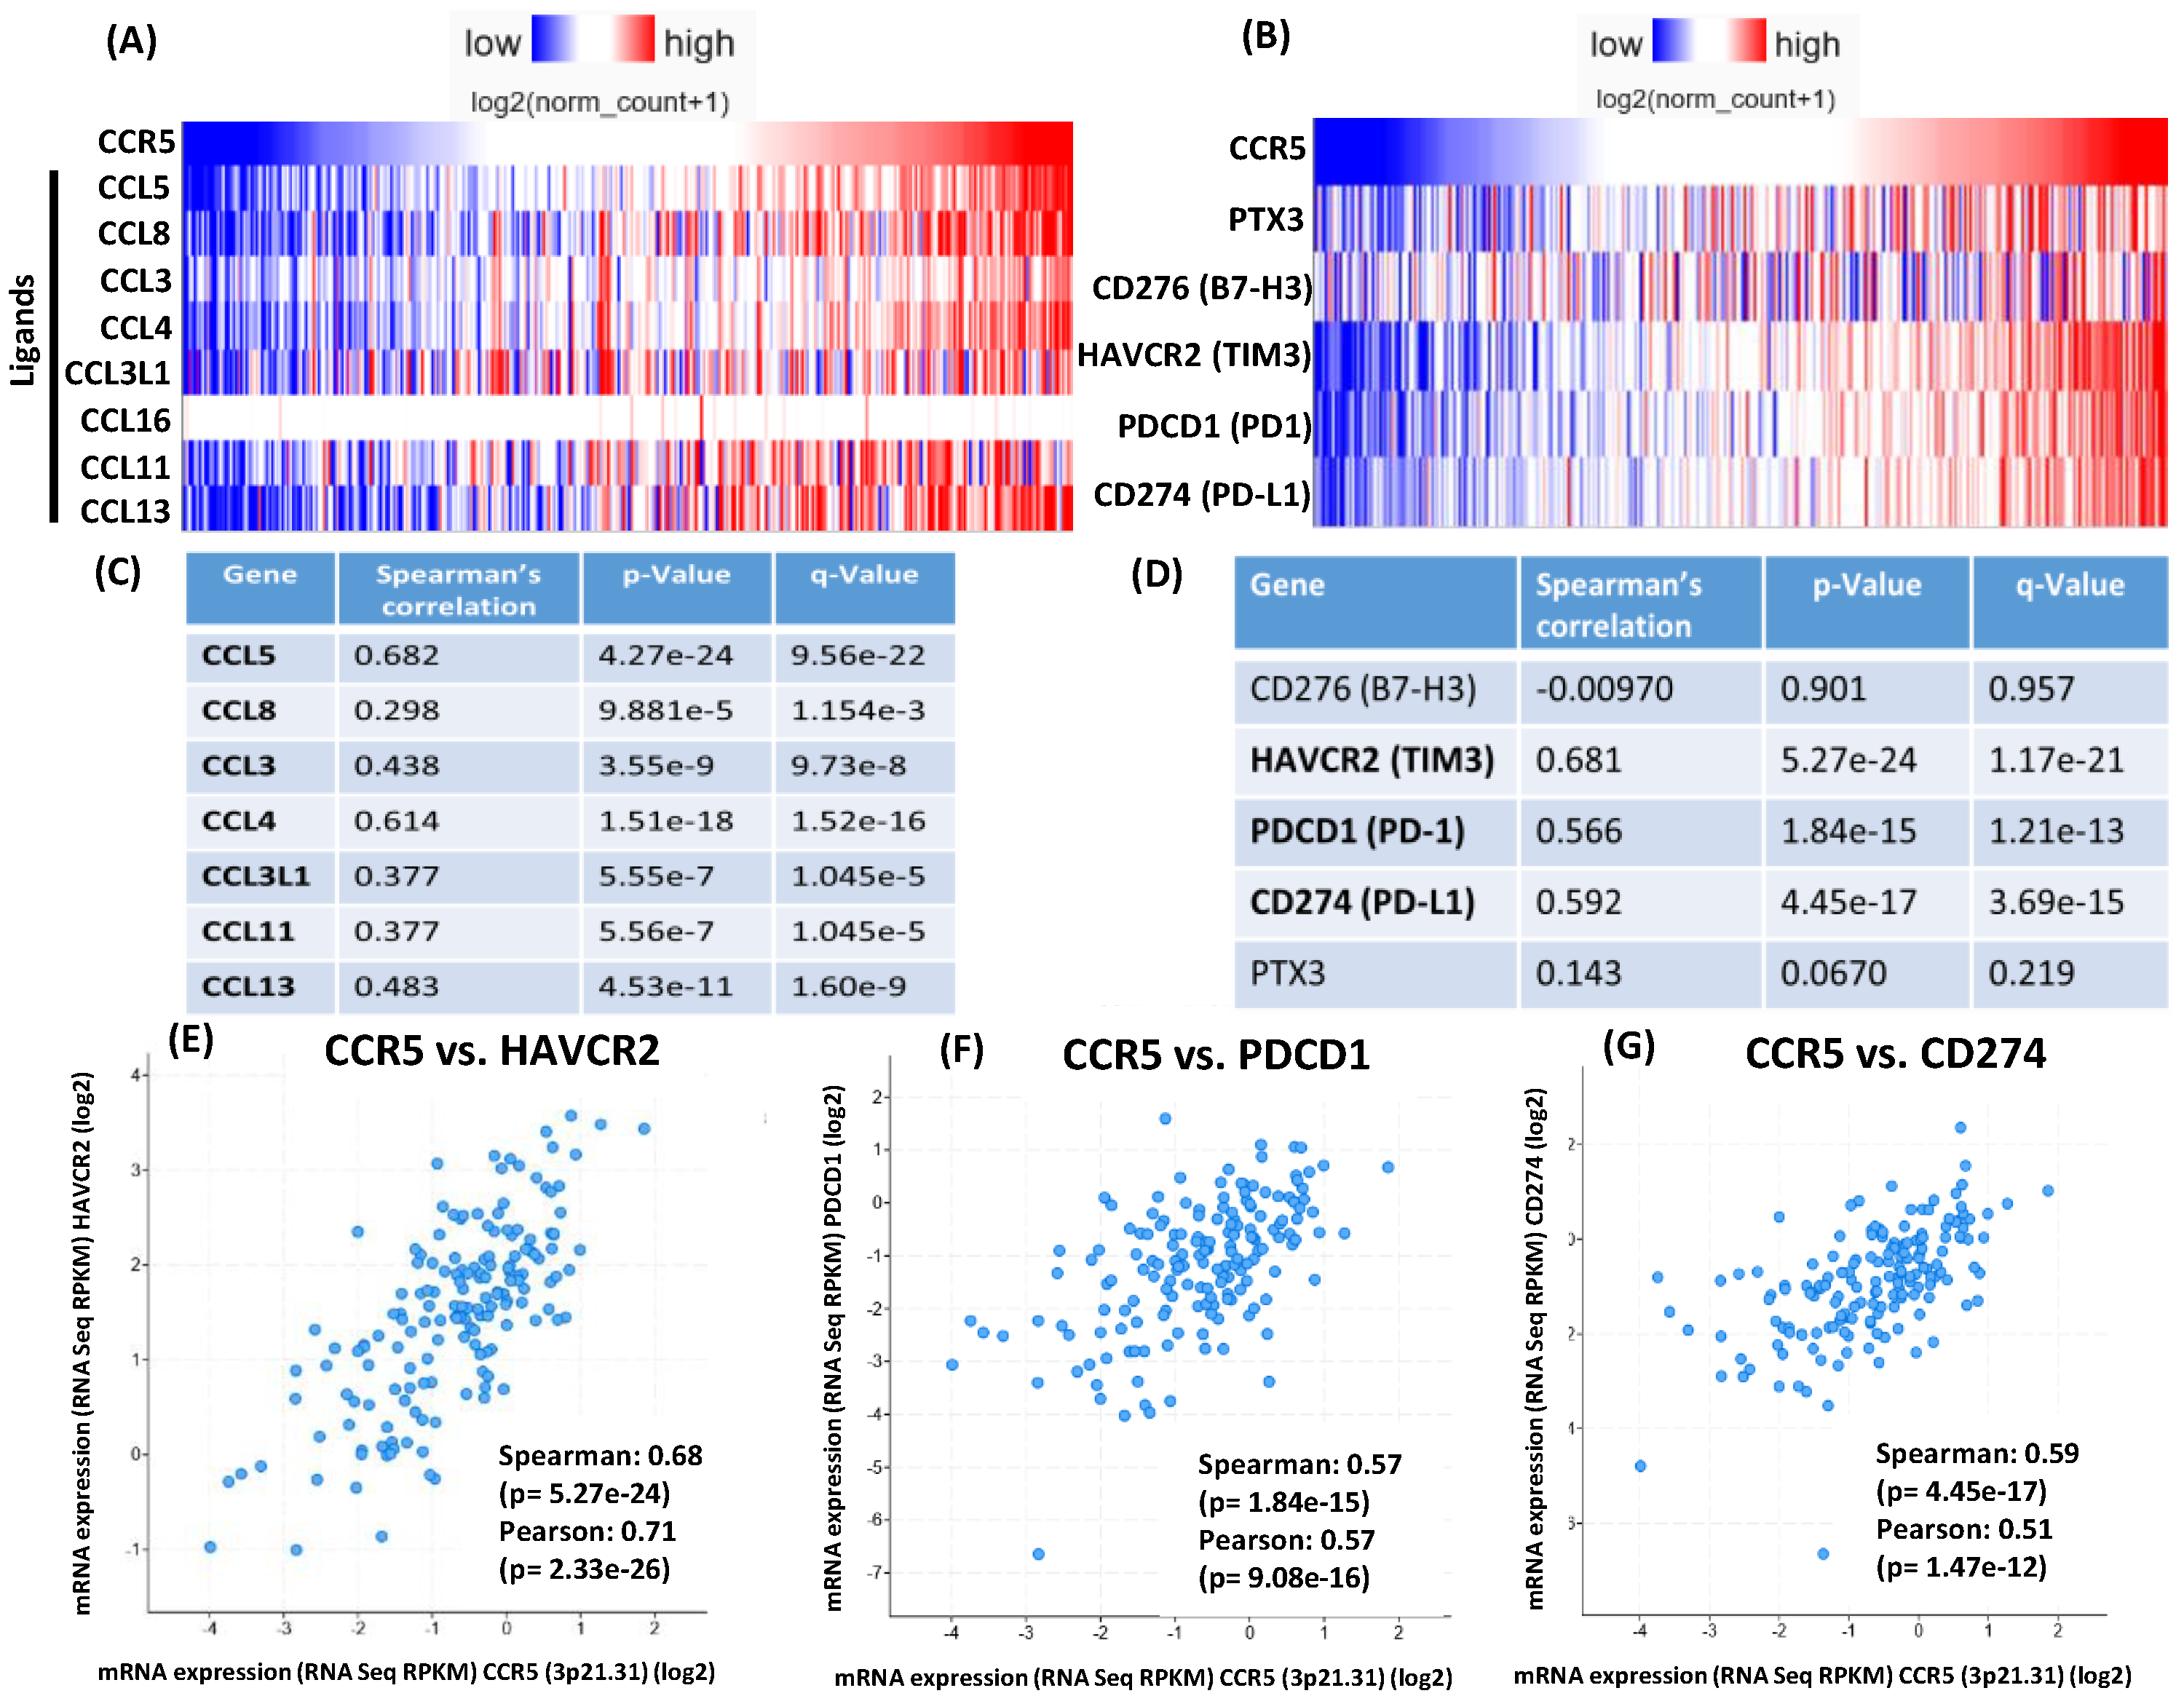
In prior studies increased baseline percentages of CD4+CD25+ Tregs were associated with good prognosis in patients receiving the immune checkpoint inhibitor ipilimumab [20]. An increase in Treg percentage in advanced melanoma patients treated with neoadjuvant ipilimumab correlated with prolonged progression free survival [21]. Higher levels of circulating CD4+ T cells (CD62Llo ) prior to PD-1 checkpoint blockade was significantly correlated with better response [22]. Therefore, we investigated if CCR5 gene expression was correlated with the expression of CCR5 ligands and immune checkpoint inhibitor genes in TCGA colorectal cancer samples. The totality of samples with available RNAseq data (434 samples) was analyzed using the UCSC Xena platform [23] (dataset: TCGA Colon and Rectal Cancer (COADREAD)). Most CCR5 ligands showed significant expression correlation with CCR5 (Figure 7A). Importantly, expression of immune checkpoint inhibitor genes also showed highly significant correlation with CCR5 expression: HAVCR2 (Spearman’s rho = 0.8233; p = 3.201e-108), PDCD1/PD-1 (rho = 0.7609; p = 4.247e-83), CD274/PD-L1 (rho = 0.7507; p = 1.001e-79), PTX3 (rho = 0.4975; p = 1.666e-28) and CD276 (rho = 0.1624; p = 0.0006816)(Figure 7B). The analyzed gene expression correlations were also assessed for MSS and MSI samples separately using the cBioPortal for Cancer Genomics platform [24]. We found that expression of most CCR5 ligands and expression of immune checkpoint inhibitor genes HAVCR2, PD-1 and PD-L1 are highly significantly correlated with CCR5 expression in both MSS (Figure 6C-G) and MSI samples (Supplemental Figure 3).
4. Discussion
In the current studies, tumor cells overexpressing CCR5 did not exhibit accelerated growth in vitro assessed by sulforhodamine B staining (measures total cell mass) or MTT assay (3-[4,5-di-methylthiazol-2yl]-2,5-diphenyl-tetrazolium bromide; measures metabolic activity). To more accurately model the physiology and progression of human colon carcinoma, an orthotopic model was employed, utilizing sub-serosal inoculation of luc-SW480 tumor cells in the cecum. In the absence of leronlimab treatment, SW480 colon carcinoma cells with high CCR5 expression displayed a tumor growth advantage in vivo (Figure 1). Leronlimab treated mice displayed a 59% (p=0.067) and 89% (p=0.012) decrease in number of metastatic cells in liver and lung, respectively. The reduction in lung metastases was highly significant, whereas the reduction in liver metastases approached statistical significance. Hence the degree of tumor inhibition was more pronounced in the metastatic lesions compared to growth inhibition of the primary subcutaneous. tumors. Our studies are consistent with evidence that CCR5 governs cancer metastasis as either small molecular inhibitors of CCR5 [1], or leronlimab [12] reduced breast carcinoma cell metastasis (reviewed in [11]). Together, our findings suggest that cytokines or direct cellular contact with host tissues may be required for CCR5-mediated enhancement of tumor growth.
Graft-versus-host (GVH) and graft-versus-tumor (GVT) activities diverge following leronlimab treatment, in a therapeutically advantageous direction. As in our previous studies [15], leronlimab inhibited the development of GVHD symptoms in mice that had been humanized with normal donor bone marrow cells (Figure 2A, blue & red curves). As expected, cohorts of tumor-bearing humanized mice (Figure 2A, green & yellow curves) had a more rapid weight loss compared to non-tumor bearing mice. In both cases, leronlimab treatment prolonged survival (Figure 2B). After cessation of treatment on day 35, weight loss accelerated, requiring animal euthanasia. Thus the anti-GVHD effect was lost as leronlimab was cleared from the circulation.
Human leukocyte engraftment was required for maximal inhibition of primary tumor growth. In non-humanized NSG mice, leronlimab did not suppress primary tumor growth rate (Figure 3). In successfully engrafted mice (>25% human CD45 in peripheral blood) tumor growth was slowed by leronlimab treatment compared to mice receiving IgG, suggesting that the GVT effect mediated by humanization was clearly enhanced by blockade of CCR5 signal transduction following leronlimab in vivo.
The role of NK cells in regulation and mediation GVHD is not well understood; many clinical trials involving transfer of NK cells into human allogeneic human stem cell transplant (HCT) patients have not been associated with GVHD [25]. Our humanized tumor-bearing mice displayed increased numbers of circulating human T cells and decreased percentages of human B and human NK cells following leronlimab (Figure 4). Our initial impression was that increased cytotoxic T cells (CTL) in the peripheral blood was inconsistent with the observed decrease in GVHD. Analysis of the Treg subset was more instructive. In humanized tumor-bearing mice there was a clear induction of CD4+CD25+ (suppress GVHD) and decrease in percentage of CD4+CD25- (induce GVHD) cells (Figure 5). Harvested tumors were examined by immunohistochemistry to assess infiltration of effector cells. Surprisingly, the tissue architecture was very homogenous, comprised solely of parenchymal tumor cells, with no evidence of human cells by immunohistochemistry.
We considered host microenvironmental factors that affect early stages of tumor progression and metastasis. Angiogenesis is critical for tumors to progress beyond 2 mm in diameter [19]. The intradermal angiogenic assay is one method used to quantitate vessel number, diameter, branching and networking. VESGEN, software developed by NASA, was used to analyze early SW480 tumors (Figure 6). Previous studies with vessel generational analysis of VESGEN have consistently demonstrated the importance of the actively remodeling small vessels in progression of vascular-dependent pathologies such as malignant melanoma growth [26], diabetic retinopathy [27], and cytokine stimulation or inhibition of angiogenesis [28]. Blockade of CCR5 signaling clearly interfered with host processes required for neo-vessel proliferation surrounding nascent growing tumors.
Our studies showed that CD4+ cells, which are considered tumor immunosuppressive [24] were increased by leronlimab in the peripheral blood. CD4+ T cells are now recognized to play key roles in both the priming and effector phases of the antitumor immune response [22,29]. In addition to providing T cell help through co-stimulation and cytokine production, CD4+ T cells can also possess cytotoxicity either directly on MHC class II expressing tumor cells or to other cells within the tumor microenvironment (TME). The presence of specific populations of CD4+ T cells, and their intrinsic plasticity, within the TME can represent an important determinant of clinical response to immune checkpoint inhibitors. Furthermore, we found CCR5 expression correlated with the abundance of immune checkpoint gene expression in both MSS and populations of patients with MSI colon cancer. In prior studies increased baseline percentages of CD4+CD25+ Tregs were associated with good prognosis in patients receiving the immune check point inhibitors ipilimumab [20]. An increase in Treg percentage in advanced melanoma patients treated with neoadjuvant ipilimumab correlated with prolonged progression free survival [21]. Higher levels of circulating CD4+ T cells (CD62Llo ) prior to PD-1 checkpoint blockade was significantly correlated with better response [22]. The induction of CD4+ cells by leronlimab is therefore consistent with a potential augmentation of responses to immune checkpoint therapy. Recent studies showed that patients with metastatic triple negative breast cancer who had received a mean of two prior types of therapy when treated with leronlimab and an ICI showed a favorable response with an 18% 4 years survival [30].
The maintenance of high levels of CD4+ T cells correlated significantly with patient survival, whereas a loss of this population of CD4+ T cells after immune checkpoint blockade was correlated with resistance to ICB therapy. CD4+ Tregs constitutively express high levels of surface receptors that are only upregulated by conventional T cells in response to activation, including PD-1 and CTLA-4, as well as a host of TNF receptor superfamily members such as OX-40 (CD134) and GITR new approaches to improve CD4 responses before PD-L1/PD-1 blockade therapy [31] could be the solution to increase response rates and patient survival.
Supplementary Materials
The following supporting information can be downloaded at the website of this paper posted on Preprints.org, Figure S1: s2, Figure S2; s3 Figure S3.
Author Contributions
Conceptualization, D.J.L, D.R.B. and R.G.P; methodology, D.J.L., Y.A.P., R.P. and A.G.; software, P.P.W and R.P.; validation, J.A.D., P.P.W. and R.P; formal analysis, D.J.L., A.G. and R.P; investigation, D.J.L., R.G.P. and D.R.B.; resources, D.J.L. and D.R.B.; data curation, Y.A.P. and R.P.; writing—original draft preparation, D.J.L.; writing—review and editing, D.J.L., R.P., R.G.P. and D.R.B.; visualization, Y.A.P. and D.J.L.; supervision, D.J.L. and R.G.P.; project administration, K.G.; funding acquisition, D.J.L., R.P., R.G.P. and D.R.B. All authors have read and agreed to the published version of the manuscript.”.
Funding
D.J.L. was supported in part by the Case Comprehensive Cancer Center (CCCC) Preclinical and Translational Shared Resource, and the CCCC Imaging Shared Resource, and the NCI Cancer Center Support Grant P30 CA043703-23 (PI=Gary Schwartz). R.G.P. was supported in part by R43HL164131, the DOD Breast Cancer Research Program Breakthrough Awards (W81XWH-22-BRCP) and the project was implemented with the support from the National Research, Development and Innovation Fund of the Ministry of Culture and Innovation under the RGH_24 (RGH 151464) Grant Agreement with the National Research, Development and Innovation Office (R.G.P.). The project was implemented with the support from the National Research, Development and Innovation Fund of the Ministry of Culture and Innovation, financed under the FK-142285 funding scheme granted to R.P. R.P is also a holder of the János Bolyai Research Fellowship of the Hungarian Academy of Sciences (BO/00174/22).
Institutional Review Board Statement
The animal study protocol was approved by the Institutional Animal Care and Use Committee of Cleveland Clinic Foundation (IACUC protocol 3142, date of approval 06-28-2023).
Informed Consent Statement
All samples in the NCI Cancer Genome Atlas Program (TCGA) that were analyzed in this study have been collected and utilized following strict policies and guidelines for the protection of human subjects, informed consent and IRB review of protocols.
Data Availability Statement
All authors agree to publicly release all data underlying this manuscript. All authors agree to follow the FAIR principles (Findability, Accessibility, Interoperability, Reproducibility) subsequent to publication. The data generated and analyzed during the current study are available from the corresponding author on reasonable request. The gene expression datasets analyzed during the current study are publicly available in the UCSC Xena Browser repository and analysis tool, https://xenabrowser.net [23]; dataset analyzed: “TCGA Colon and Rectal Cancer (COADREAD)”. The gene expression datasets categorized as MSS and MSI analyzed during the current study are publicly available in the cBioPortal for Cancer Genomics repository and analysis tool, https://www.cbioportal.org/ [24]; dataset analyzed: “Colorectal Adenocarcinoma (TCGA, Nature 2012)”.
Acknowledgments
Not applicable.
Conflicts of Interest
The funders had no role in the design of the study; in the collection, analyses, or interpretation of data; in the writing of the manuscript; or in the decision to publish the results.
Abbreviations
The following abbreviations are used in this manuscript:
| NSG | Nod-scid-IL2 receptor gamma KO mice |
| xGVHD | Xeno-Graft vs host disease |
| MSS | Microsatellite stable |
| MSI | Microsatellite instable |
References
- Velasco-Velazquez, M.; Jiao, X.; De La Fuente, M.; Pestell, T.G.; Ertel, A.; Lisanti, M.P.; Pestell, R.G. CCR5 antagonist blocks metastasis of basal breast cancer cells. Cancer Res 2012, 72, 3839–3850. [Google Scholar] [CrossRef]
- Sicoli, D.; Jiao, X.; Ju, X.; Velasco-Velazquez, M.; Ertel, A.; Addya, S.; Li, Z.; Ando, S.; Fatatis, A.; Paudyal, B.; et al. CCR5 receptor antagonists block metastasis to bone of v-Src oncogene-transformed metastatic prostate cancer cell lines. Cancer Res 2014, 74, 7103–7114. [Google Scholar] [CrossRef]
- Struyf, S.; Menten, P.; Lenaerts, J.P.; Put, W.; D’Haese, A.; De Clercq, E.; Schols, D.; Proost, P.; Van Damme, J. Diverging binding capacities of natural LD78beta isoforms of macrophage inflammatory protein-1alpha to the CC chemokine receptors 1, 3 and 5 affect their anti-HIV-1 activity and chemotactic potencies for neutrophils and eosinophils. European journal of immunology 2001, 31, 2170–2178. [Google Scholar] [CrossRef]
- Miyakawa, T.; Obaru, K.; Maeda, K.; Harada, S.; Mitsuya, H. Identification of amino acid residues critical for LD78beta, a variant of human macrophage inflammatory protein-1alpha, binding to CCR5 and inhibition of R5 human immunodeficiency virus type 1 replication. J Biol Chem 2002, 277, 4649–4655. [Google Scholar] [CrossRef] [PubMed]
- Slimani, H.; Charnaux, N.; Mbemba, E.; Saffar, L.; Vassy, R.; Vita, C.; Gattegno, L. Interaction of RANTES with syndecan-1 and syndecan-4 expressed by human primary macrophages. Biochimica et biophysica acta 2003, 1617, 80–88. [Google Scholar] [CrossRef] [PubMed]
- Proudfoot, A.E.; Fritchley, S.; Borlat, F.; Shaw, J.P.; Vilbois, F.; Zwahlen, C.; Trkola, A.; Marchant, D.; Clapham, P.R.; Wells, T.N. The BBXB motif of RANTES is the principal site for heparin binding and controls receptor selectivity. J Biol Chem 2001, 276, 10620–10626. [Google Scholar] [CrossRef]
- Gathe, J.C.; Dejesus, E.; Ramgopal, M.N.; Rolle, C.P.; Yang, O.O.; Sanchez, W.E.; Lalezari, J.P.; Krishen, A.; Sacha, J.B.; Hansen, S.G.; et al. Leronlimab Treatment for Multidrug-Resistant HIV-1 (OPTIMIZE): A Randomized, Double-Blind, Placebo-Controlled Trial. J Acquir Immune Defic Syndr 2025, 99, 185–194. [Google Scholar] [CrossRef] [PubMed]
- Olson, W.C.; Rabut, G.E.; Nagashima, K.A.; Tran, D.N.; Anselma, D.J.; Monard, S.P.; Segal, J.P.; Thompson, D.A.; Kajumo, F.; Guo, Y.; et al. Differential inhibition of human immunodeficiency virus type 1 fusion, gp120 binding, and CC-chemokine activity by monoclonal antibodies to CCR5. Journal of virology 1999, 73, 4145–4155. [Google Scholar] [CrossRef]
- Upadhyaya, C.; Jiao, X.; Ashton, A.; Patel, K.; Kossenkov, A.V.; Pestell, R.G. The G protein coupled receptor CCR5 in cancer. Adv Cancer Res 2020, 145, 29–47. [Google Scholar] [CrossRef]
- Jiao, X.; Velasco-Velazquez, M.A.; Wang, M.; Li, Z.; Rui, H.; Peck, A.R.; Korkola, J.E.; Chen, X.; Xu, S.; DuHadaway, J.B.; et al. CCR5 Governs DNA Damage Repair and Breast Cancer Stem Cell Expansion. Cancer Res 2018, 78, 1657–1671. [Google Scholar] [CrossRef]
- Hamid, R.; Alaziz, M.; Mahal, A.S.; Ashton, A.W.; Halama, N.; Jaeger, D.; Jiao, X.; Pestell, R.G. The Role and Therapeutic Targeting of CCR5 in Breast Cancer. Cells 2023, 12. [Google Scholar] [CrossRef]
- Jiao, X.; Wang, M.; Zhang, Z.; Li, Z.; Ni, D.; Ashton, A.W.; Tang, H.Y.; Speicher, D.W.; Pestell, R.G. Leronlimab, a humanized monoclonal antibody to CCR5, blocks breast cancer cellular metastasis and enhances cell death induced by DNA damaging chemotherapy. Breast Cancer Res 2021, 23, 11. [Google Scholar] [CrossRef] [PubMed]
- Battaglin, F.; Baca, Y.; Millstein, J.; Yang, Y.; Xiu, J.; Arai, H.; Wang, J.; Ou, F.S.; Innocenti, F.; Mumenthaler, S.M.; et al. CCR5 and CCL5 gene expression in colorectal cancer: comprehensive profiling and clinical value. J Immunother Cancer 2024, 12. [Google Scholar] [CrossRef]
- Nishikawa, G.; Kawada, K.; Nakagawa, J.; Toda, K.; Ogawa, R.; Inamoto, S.; Mizuno, R.; Itatani, Y.; Sakai, Y. Bone marrow-derived mesenchymal stem cells promote colorectal cancer progression via CCR5. Cell Death Dis 2019, 10, 264. [Google Scholar] [CrossRef]
- Burger, D.R.; Parker, Y.; Guinta, K.; Lindner, D. PRO 140 Monoclonal Antibody to CCR5 Prevents Acute Xenogeneic Graft-versus-Host Disease in NOD-scid IL-2Ry(null) Mice. Biol Blood Marrow Transplant 2018, 24, 260–266. [Google Scholar] [CrossRef] [PubMed]
- Halama, N.; Zoernig, I.; Berthel, A.; Kahlert, C.; Klupp, F.; Suarez-Carmona, M.; Suetterlin, T.; Brand, K.; Krauss, J.; Lasitschka, F.; et al. Tumoral Immune Cell Exploitation in Colorectal Cancer Metastases Can Be Targeted Effectively by Anti-CCR5 Therapy in Cancer Patients. Cancer cell 2016, 29, 587–601. [Google Scholar] [CrossRef]
- Mencarelli, A.; Cipriani, S.; Francisci, D.; Santucci, L.; Baldelli, F.; Distrutti, E.; Fiorucci, S. Highly specific blockade of CCR5 inhibits leukocyte trafficking and reduces mucosal inflammation in murine colitis. Scientific reports 2016, 6, 30802. [Google Scholar] [CrossRef]
- Bronte, V.; Bria, E. Interfering with CCL5/CCR5 at the Tumor-Stroma Interface. Cancer cell 2016, 29, 437–439. [Google Scholar] [CrossRef] [PubMed]
- Bielenberg, D.R.; Zetter, B.R. The Contribution of Angiogenesis to the Process of Metastasis. Cancer journal 2015, 21, 267–273. [Google Scholar] [CrossRef]
- Martens, A.; Wistuba-Hamprecht, K.; Geukes Foppen, M.; Yuan, J.; Postow, M.A.; Wong, P.; Romano, E.; Khammari, A.; Dreno, B.; Capone, M.; et al. Baseline Peripheral Blood Biomarkers Associated with Clinical Outcome of Advanced Melanoma Patients Treated with Ipilimumab. Clin Cancer Res 2016, 22, 2908–2918. [Google Scholar] [CrossRef]
- Tarhini, A.A.; Edington, H.; Butterfield, L.H.; Lin, Y.; Shuai, Y.; Tawbi, H.; Sander, C.; Yin, Y.; Holtzman, M.; Johnson, J.; et al. Immune monitoring of the circulation and the tumor microenvironment in patients with regionally advanced melanoma receiving neoadjuvant ipilimumab. PLoS One 2014, 9, e87705. [Google Scholar] [CrossRef]
- Kagamu, H.; Kitano, S.; Yamaguchi, O.; Yoshimura, K.; Horimoto, K.; Kitazawa, M.; Fukui, K.; Shiono, A.; Mouri, A.; Nishihara, F.; et al. CD4(+) T-cell Immunity in the Peripheral Blood Correlates with Response to Anti-PD-1 Therapy. Cancer Immunol Res 2020, 8, 334–344. [Google Scholar] [CrossRef]
- Goldman, M.J.; Craft, B.; Hastie, M.; Repecka, K.; McDade, F.; Kamath, A.; Banerjee, A.; Luo, Y.; Rogers, D.; Brooks, A.N.; et al. Visualizing and interpreting cancer genomics data via the Xena platform. Nature biotechnology 2020, 38, 675–678. [Google Scholar] [CrossRef]
- Cerami, E.; Gao, J.; Dogrusoz, U.; Gross, B.E.; Sumer, S.O.; Aksoy, B.A.; Jacobsen, A.; Byrne, C.J.; Heuer, M.L.; Larsson, E.; et al. The cBio cancer genomics portal: an open platform for exploring multidimensional cancer genomics data. Cancer Discov 2012, 2, 401–404. [Google Scholar] [CrossRef]
- Simonetta, F.; Alvarez, M.; Negrin, R.S. Natural Killer Cells in Graft-versus-Host-Disease after Allogeneic Hematopoietic Cell Transplantation. Frontiers in immunology 2017, 8, 465. [Google Scholar] [CrossRef]
- Zamanian-Daryoush, M.; Lindner, D.J.; Tallant, T.C.; Wang, Z.B.; Klipfell, E.; Parker, Y.; Hatala, D.; Parsons-Wingerter, P.; Rayman, P.; et al. The cardioprotective protein apoA1 promotes potent anti-tumorigenic effects. Journal of Biological Chemistry 2013, 288, 21237–21252. [Google Scholar] [CrossRef]
- Parsons-Wingerter, P.; Radhakrishnan, K.; Vickerman, M.B.; Kaiser, P.K. Oscillation of angiogenesis with vascular dropout in diabetic retinopathy by VESsel GENeration analysis (VESGEN). Invest Ophthalmol Vis Sci 2010, 51, 498–507. [Google Scholar] [CrossRef]
- Vickerman, M.B.; Keith, P.A.; McKay, T.L.; Gedeon, D.J.; Watanabe, M.; Montano, M.; Karunamuni, G.; Kaiser, P.K.; Sears, J.E.; Ebrahem, Q.; et al. VESGEN 2D: automated, user-interactive software for quantification and mapping of angiogenic and lymphangiogenic trees and networks. Anatomical record 2009, 292, 320–332. [Google Scholar] [CrossRef]
- Montauti, E.; Oh, D.Y.; Fong, L. CD4(+) T cells in antitumor immunity. Trends Cancer 2024, 10, 969–985. [Google Scholar] [CrossRef]
- Pestell, R.G. , Cristofanilli M, Adams D, Dolezal M, Rui H, ArmanC, Joseph M, Cunningham B, Lalezari J, Rugo HS. Observed survival following treatment with Leronlimab in patients with metastatic triple-negative breast cancer (mTNBC). ESMO Open 2025, 10, 10940. [Google Scholar] [CrossRef]
- Zuazo, M.; Arasanz, H.; Bocanegra, A.; Fernandez, G.; Chocarro, L.; Vera, R.; Kochan, G.; Escors, D. Systemic CD4 Immunity as a Key Contributor to PD-L1/PD-1 Blockade Immunotherapy Efficacy. Front Immunol 2020, 11, 586907. [Google Scholar] [CrossRef]
- Safran, M.; Kim, W.Y.; O’Connell, F.; Flippin, L.; Gunzler, V.; Horner, J.W.; Depinho, R.A.; Kaelin, W.G., Jr. Mouse model for noninvasive imaging of HIF prolyl hydroxylase activity: assessment of an oral agent that stimulates erythropoietin production. Proc Natl Acad Sci U S A 2006, 103, 105–110. [Google Scholar] [CrossRef] [PubMed]
- Freireich, E.J.; Gehan, E.A.; Rall, D.P.; Schmidt, L.H.; Skipper, H.E. Quantitative comparison of toxicity of anticancer agents in mouse, rat, hamster, dog, monkey, and man. Cancer Chemother Rep 1966, 50, 219–244. [Google Scholar]
- Nair, A.B.; Jacob, S. A simple practice guide for dose conversion between animals and human. Journal of basic and clinical pharmacy 2016, 7, 27–31. [Google Scholar] [CrossRef]
- US_National_Aeronautics_and_Space_Administration. Vessel Generation Analysis (VESGEN) 2D Software https://software.nasa.gov/search/software/vesgen. 2019.
- Cancer Genome Atlas, N. Comprehensive molecular characterization of human colon and rectal cancer. Nature 2012, 487, 330–337. [Google Scholar] [CrossRef]
Figure 1.
Growth of CCR5-expressing FACS sorted SW480 colon carcinoma. A. Following gating (FSC vs. SSC) to exclude debris, 6.70% of cells were included in gate 1. B. Histogram of APC positive cells from gate 1, Interval gate between 101 – 102 APC delineated the dim CCR5 positive cells, while the interval gate of 2.53 – 1.14 APC delineated the bright CCR5 positive cells. C. Sorted cells were inoculated into left flanks (dim, LO) and right flanks (bright, HI) of four non-irradiated NSG mice (2.5x10⁵ cells per site). Hence each mouse bore 2 tumors and served as its own control, n=4. Tumor growth rate is depicted; no antibody treatment was given.
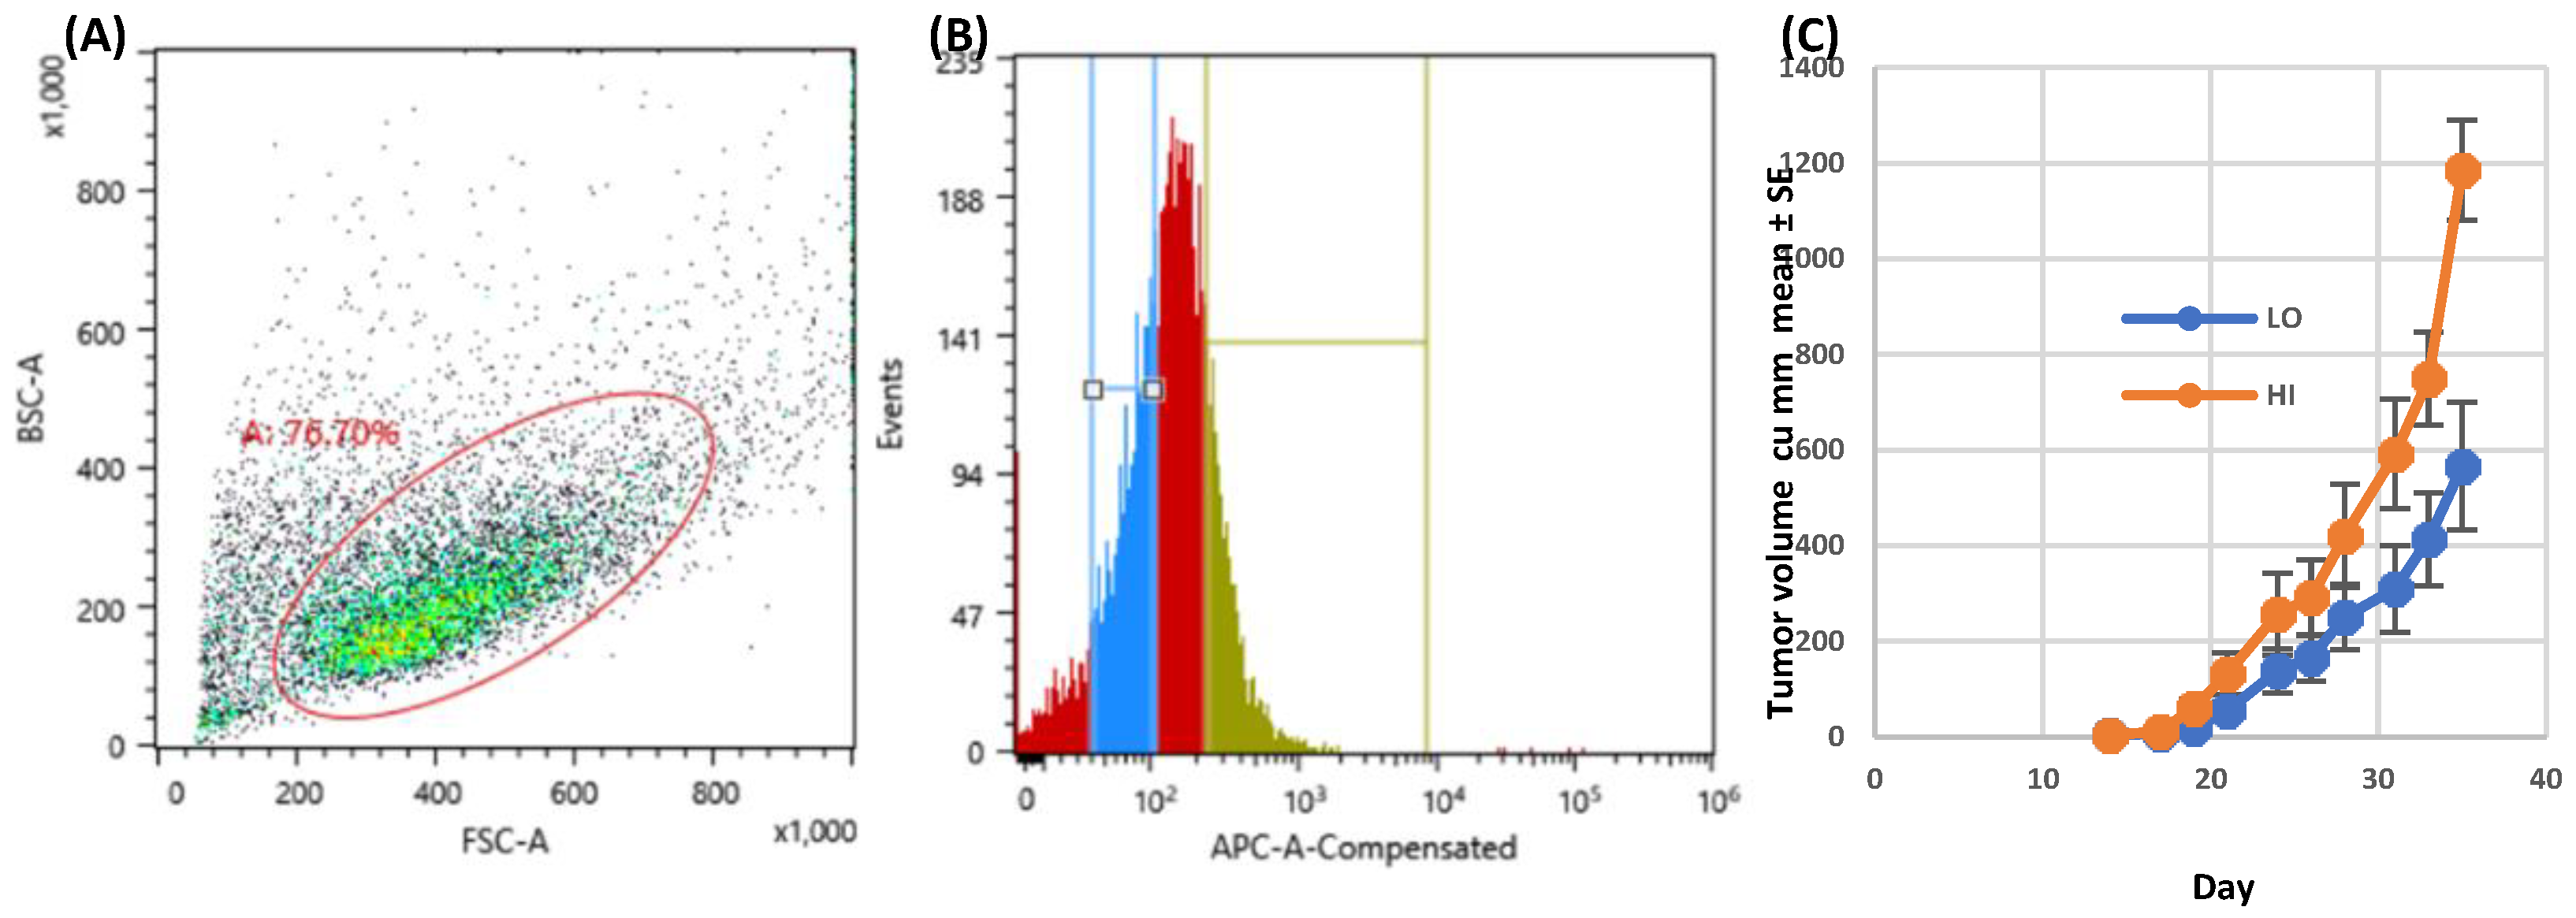
Figure 2.
Leronlimab delays xGVHD onset in humanized SW480 tumor-bearing mice. Sub-lethally irradiated NSG mice were inoculated on day 0 with normal human BM (107 Ficoll-Hypaque purified mononuclear cells). Treatment groups: IgG-5wk: IgG 2 mg i.p. 2x/wk for 35 days then stopped (non-tumor bearing), Ler-5wk: Leronlimab 2 mg i.p. 2x/wk for 35 days then stopped (non-tumor bearing, IgG-tum: IgG 2 mg i.p. 2x/wk continuously, inoculated with SW480 (2.5x10⁵ cells s.c.) on day 35, Ler-tum: Leronlimab 2 mg i.p. 2x/wk continuously, inoculated with SW480 on day 35, n=8 mice/group.
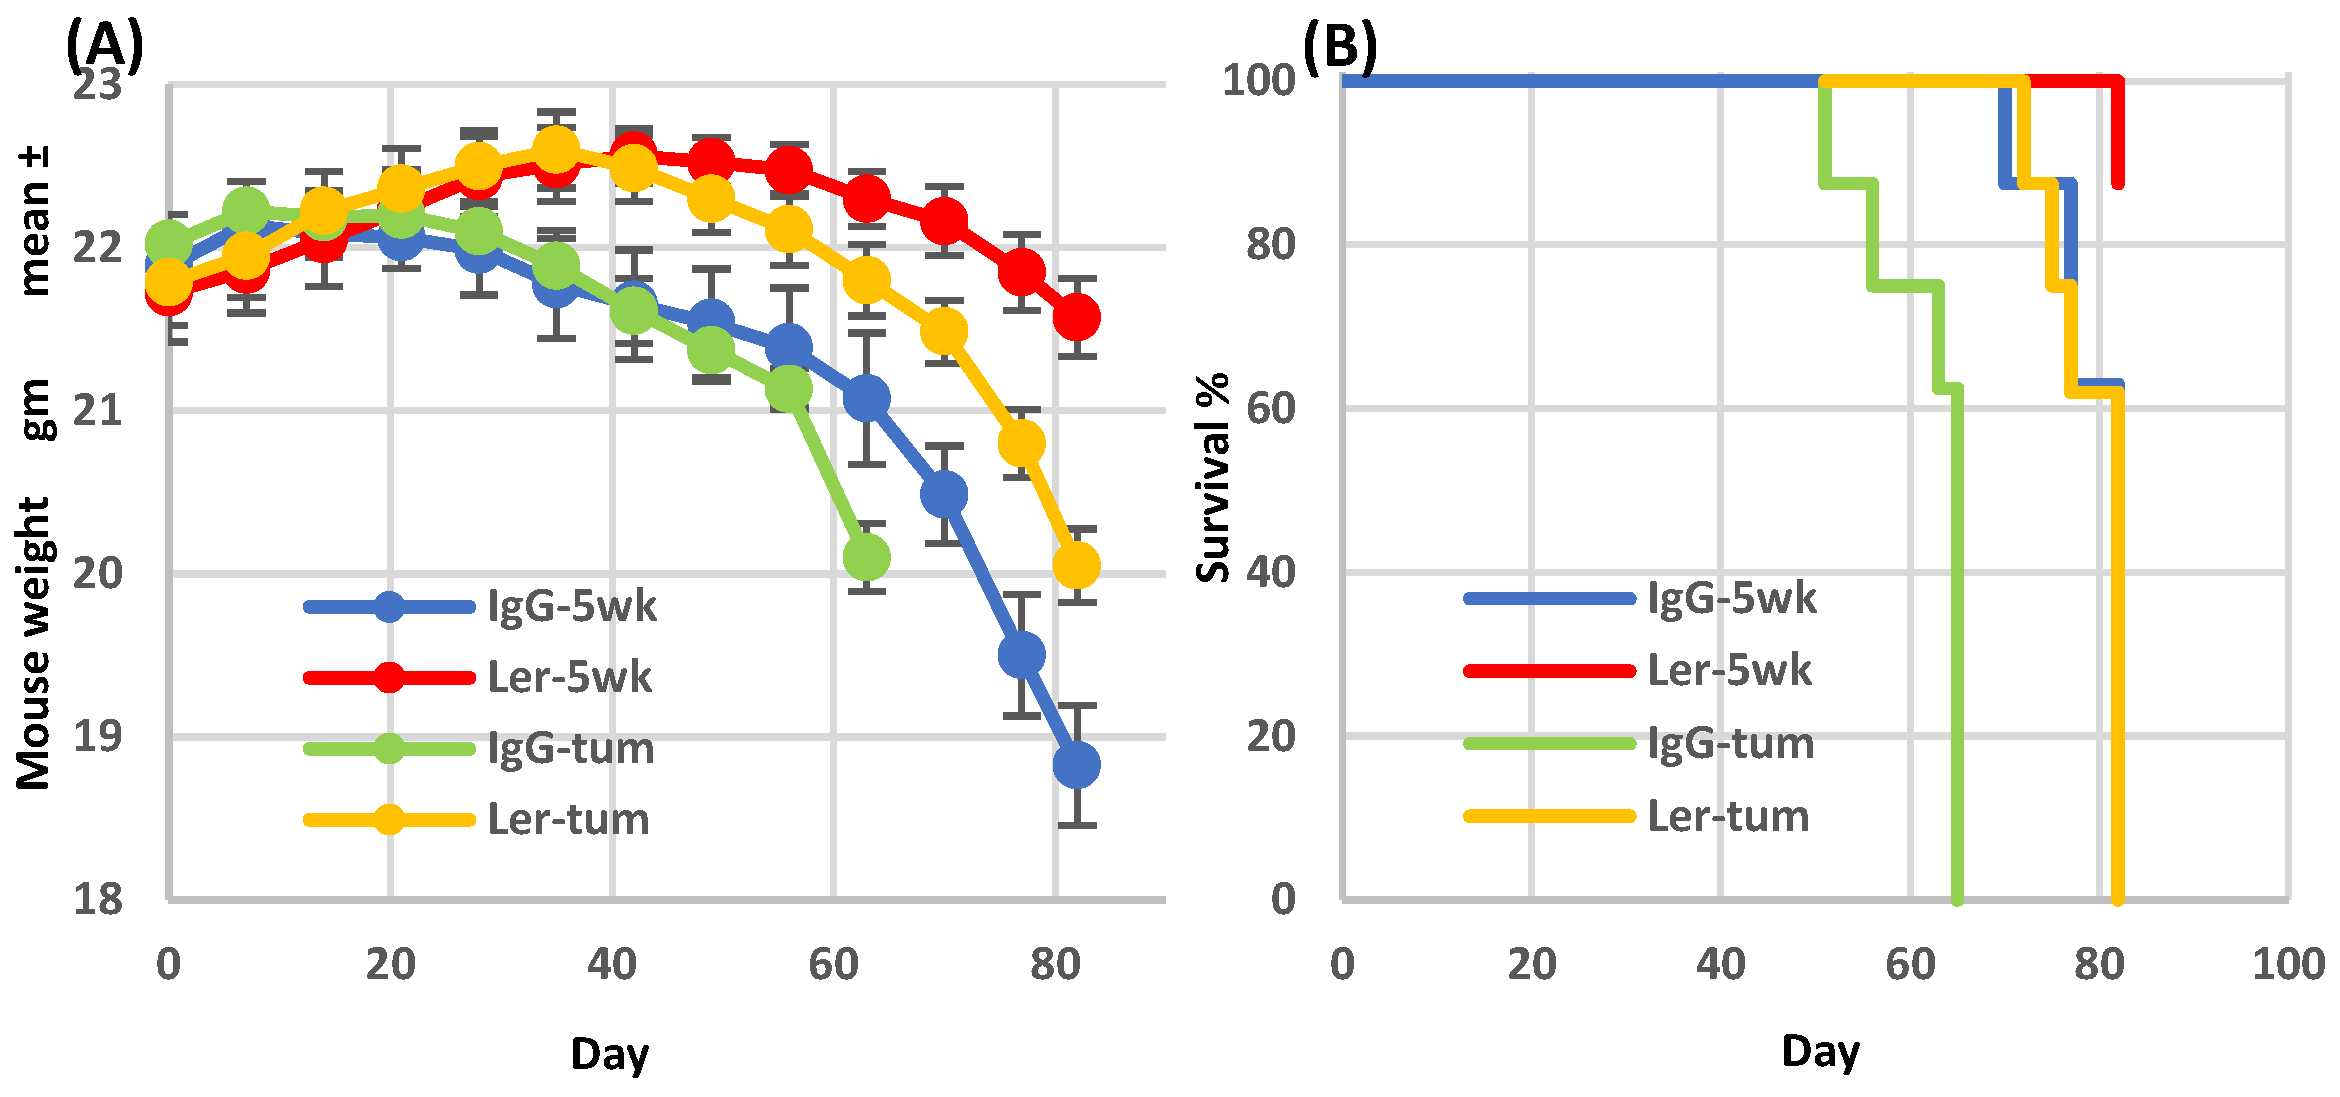
Figure 3.
Effect of mouse humanization on leronlimab anti-tumor activity. NSG mice were either humanized (normal human BM, 107 mononuclear cells) or sham-injected, and then inoculated with SW480 (2.5x10⁵ cells s.c.) on day 35. Humanized mice received either IgG (h-IgG) leronlimab (h-Ler). Non-humanized mice received IgG (IgG) or leronlimab (Ler). All groups received 2 mg antibody i.p. twice weekly, starting day 7, n=8 mice/group.
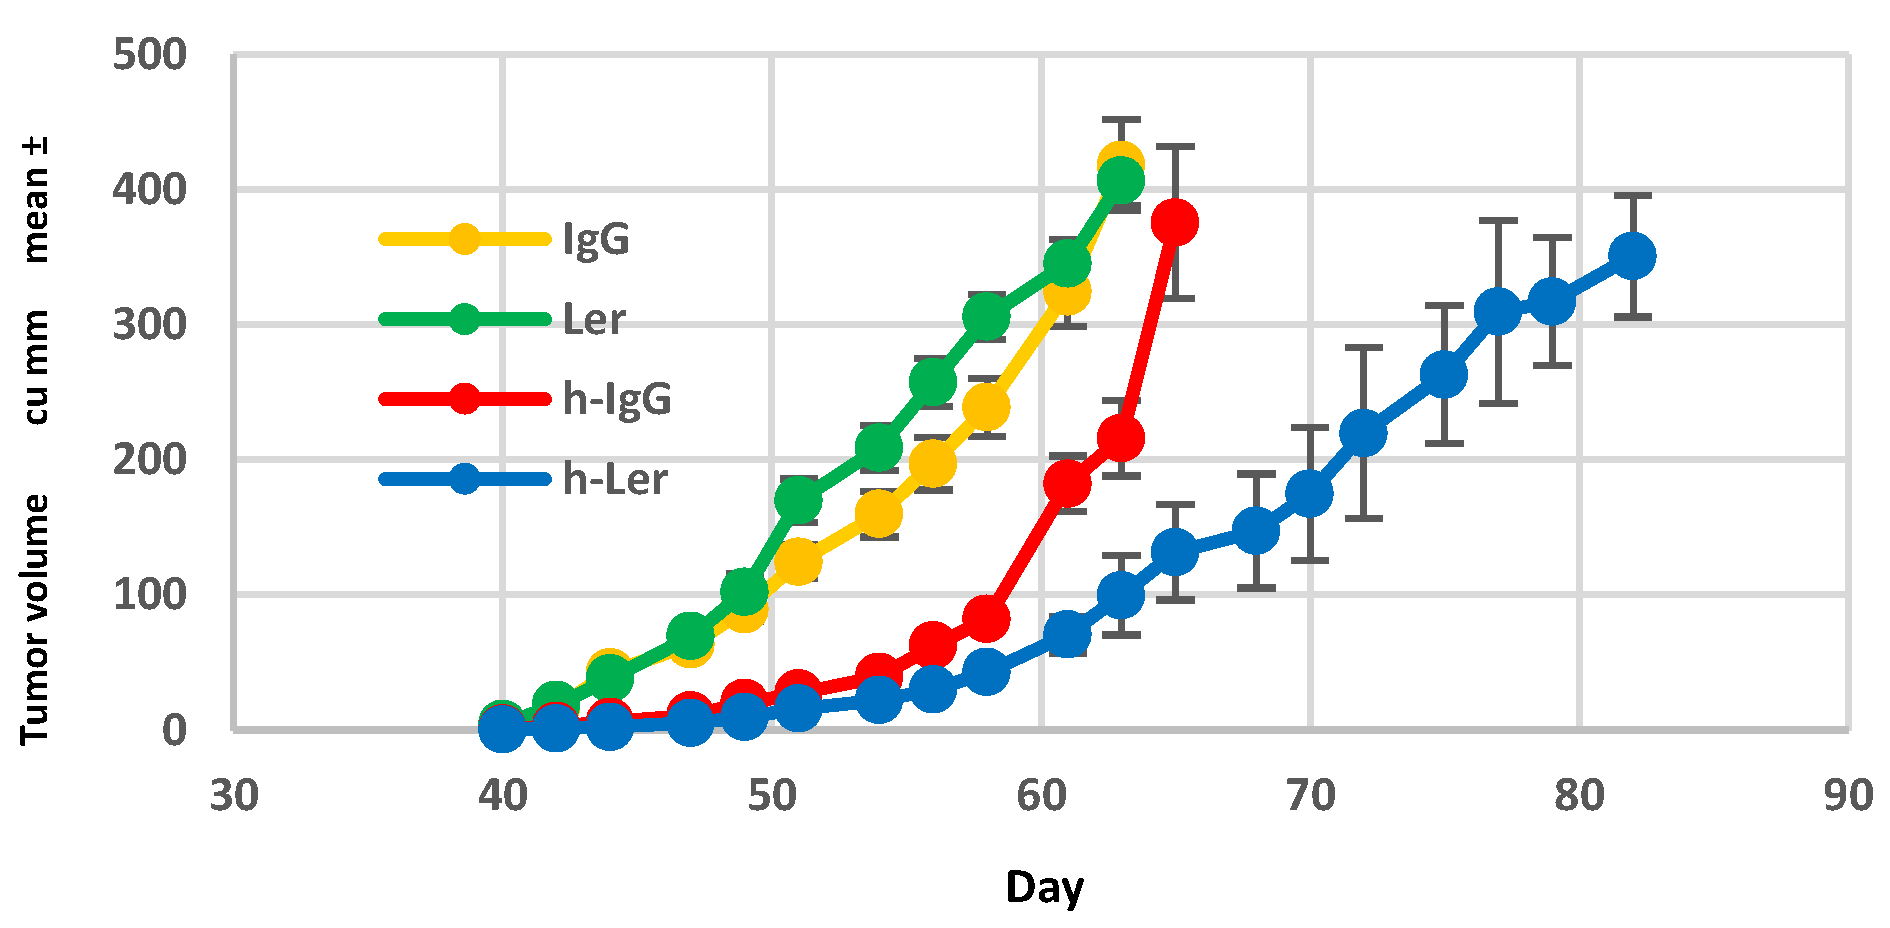
Figure 4.
Effect of leronlimab on peripheral blood human B, T, NK cells, and T regulatory (Treg) cells. Sub-lethally irradiated NSG mice were inoculated with normal human BM mononuclear cells. Treatment groups: IgG-5wk: IgG 2 mg i.p. 2x/wk for 35d then stopped (non-tumor bearing), Ler-5wk: Leronlimab 2 mg i.p. 2x/wk for 35d then stopped (non-tumor bearing), IgG-tum: IgG 2 mg i.p. 2x/wk continuously, inoculated with SW480 (2.5x10⁵ cells s.c.) on d35, Ler-tum: Leronlimab 2 mg i.p. 2x/wk continuously, inoculated with SW480 on d35, n=8 mice/group. Peripheral blood was analyzed on day 62 (gated on hCD45+). CD4+CD25+ cells suppress GVHD, whereas CD4+CD25- cells promote GVHD. Significant p values are indicated.
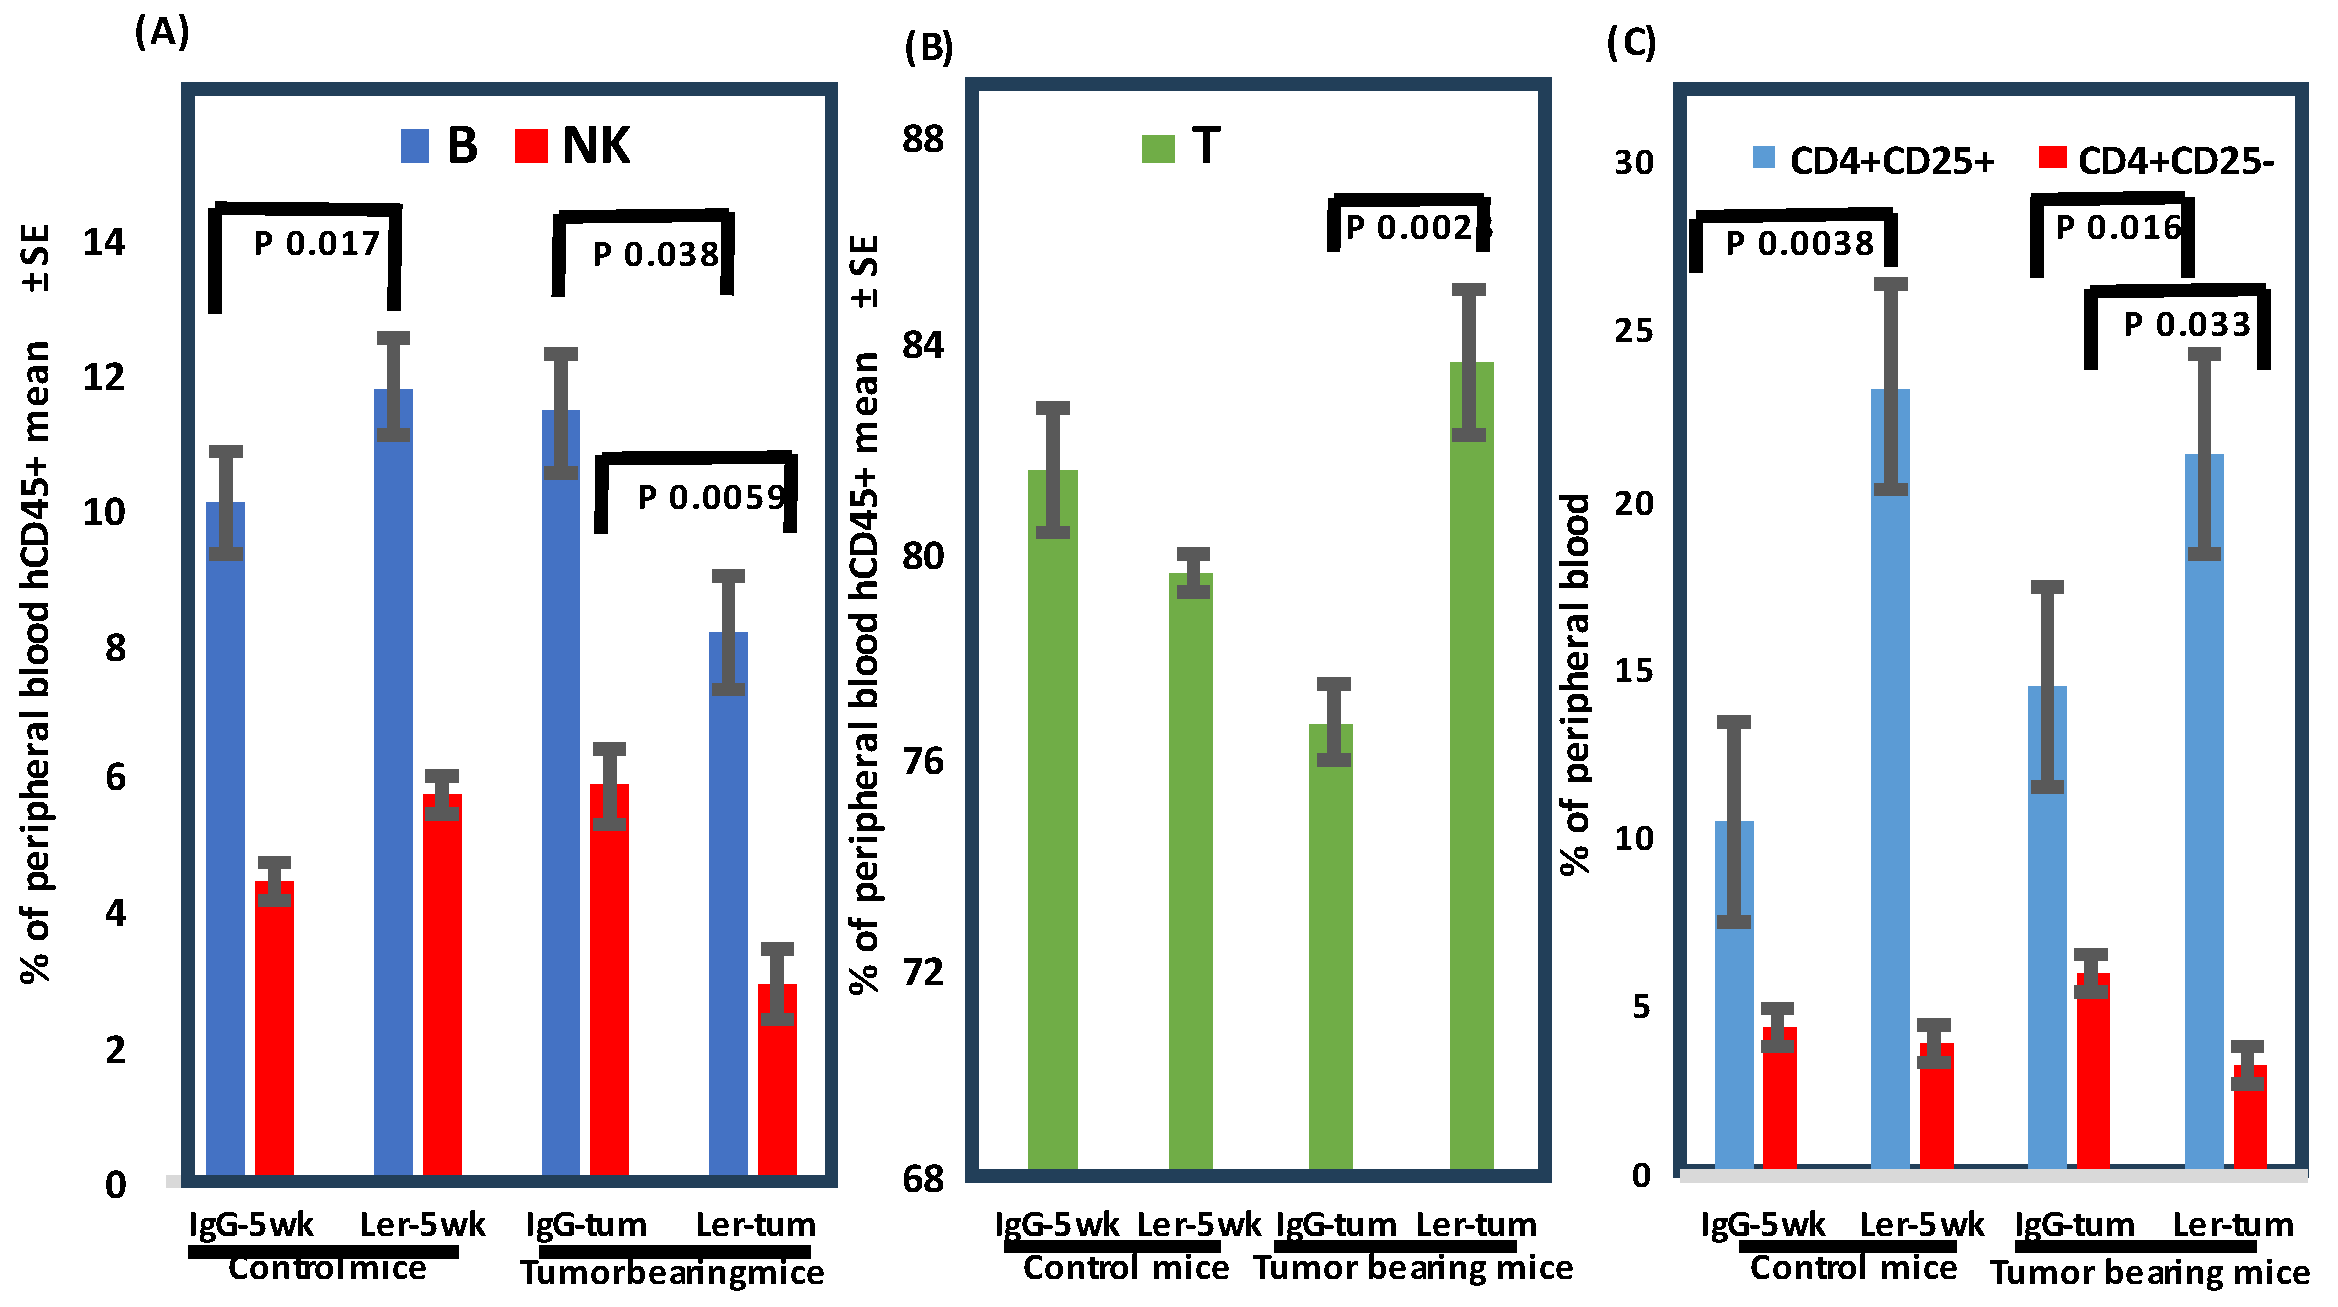
Figure 5.
Leronlimab reduces luc-SW480 colon carcinoma metastasis in vivo. (A). Primary tumor initial luminescence was established at 10 days as shown. SW480 cells were inoculated orthotopically in the cecum of humanized NSG mice. On day 10, IVIS imaging was performed to demonstrate comparable levels of engraftment in both treatment groups (upper panels). (B). Liver luminescence was determined after leronlimab treatment. Mice received continuous antibody treatment. Following harvest on day 45, excised livers (C,D) and lungs (E,F) were incubated with luciferin substrate ex vivo. Leronlimab treatment resulted in decreased luminescence signal in livers (D, shown as mean + SEM for N=8 ) and lungs (lower panels).
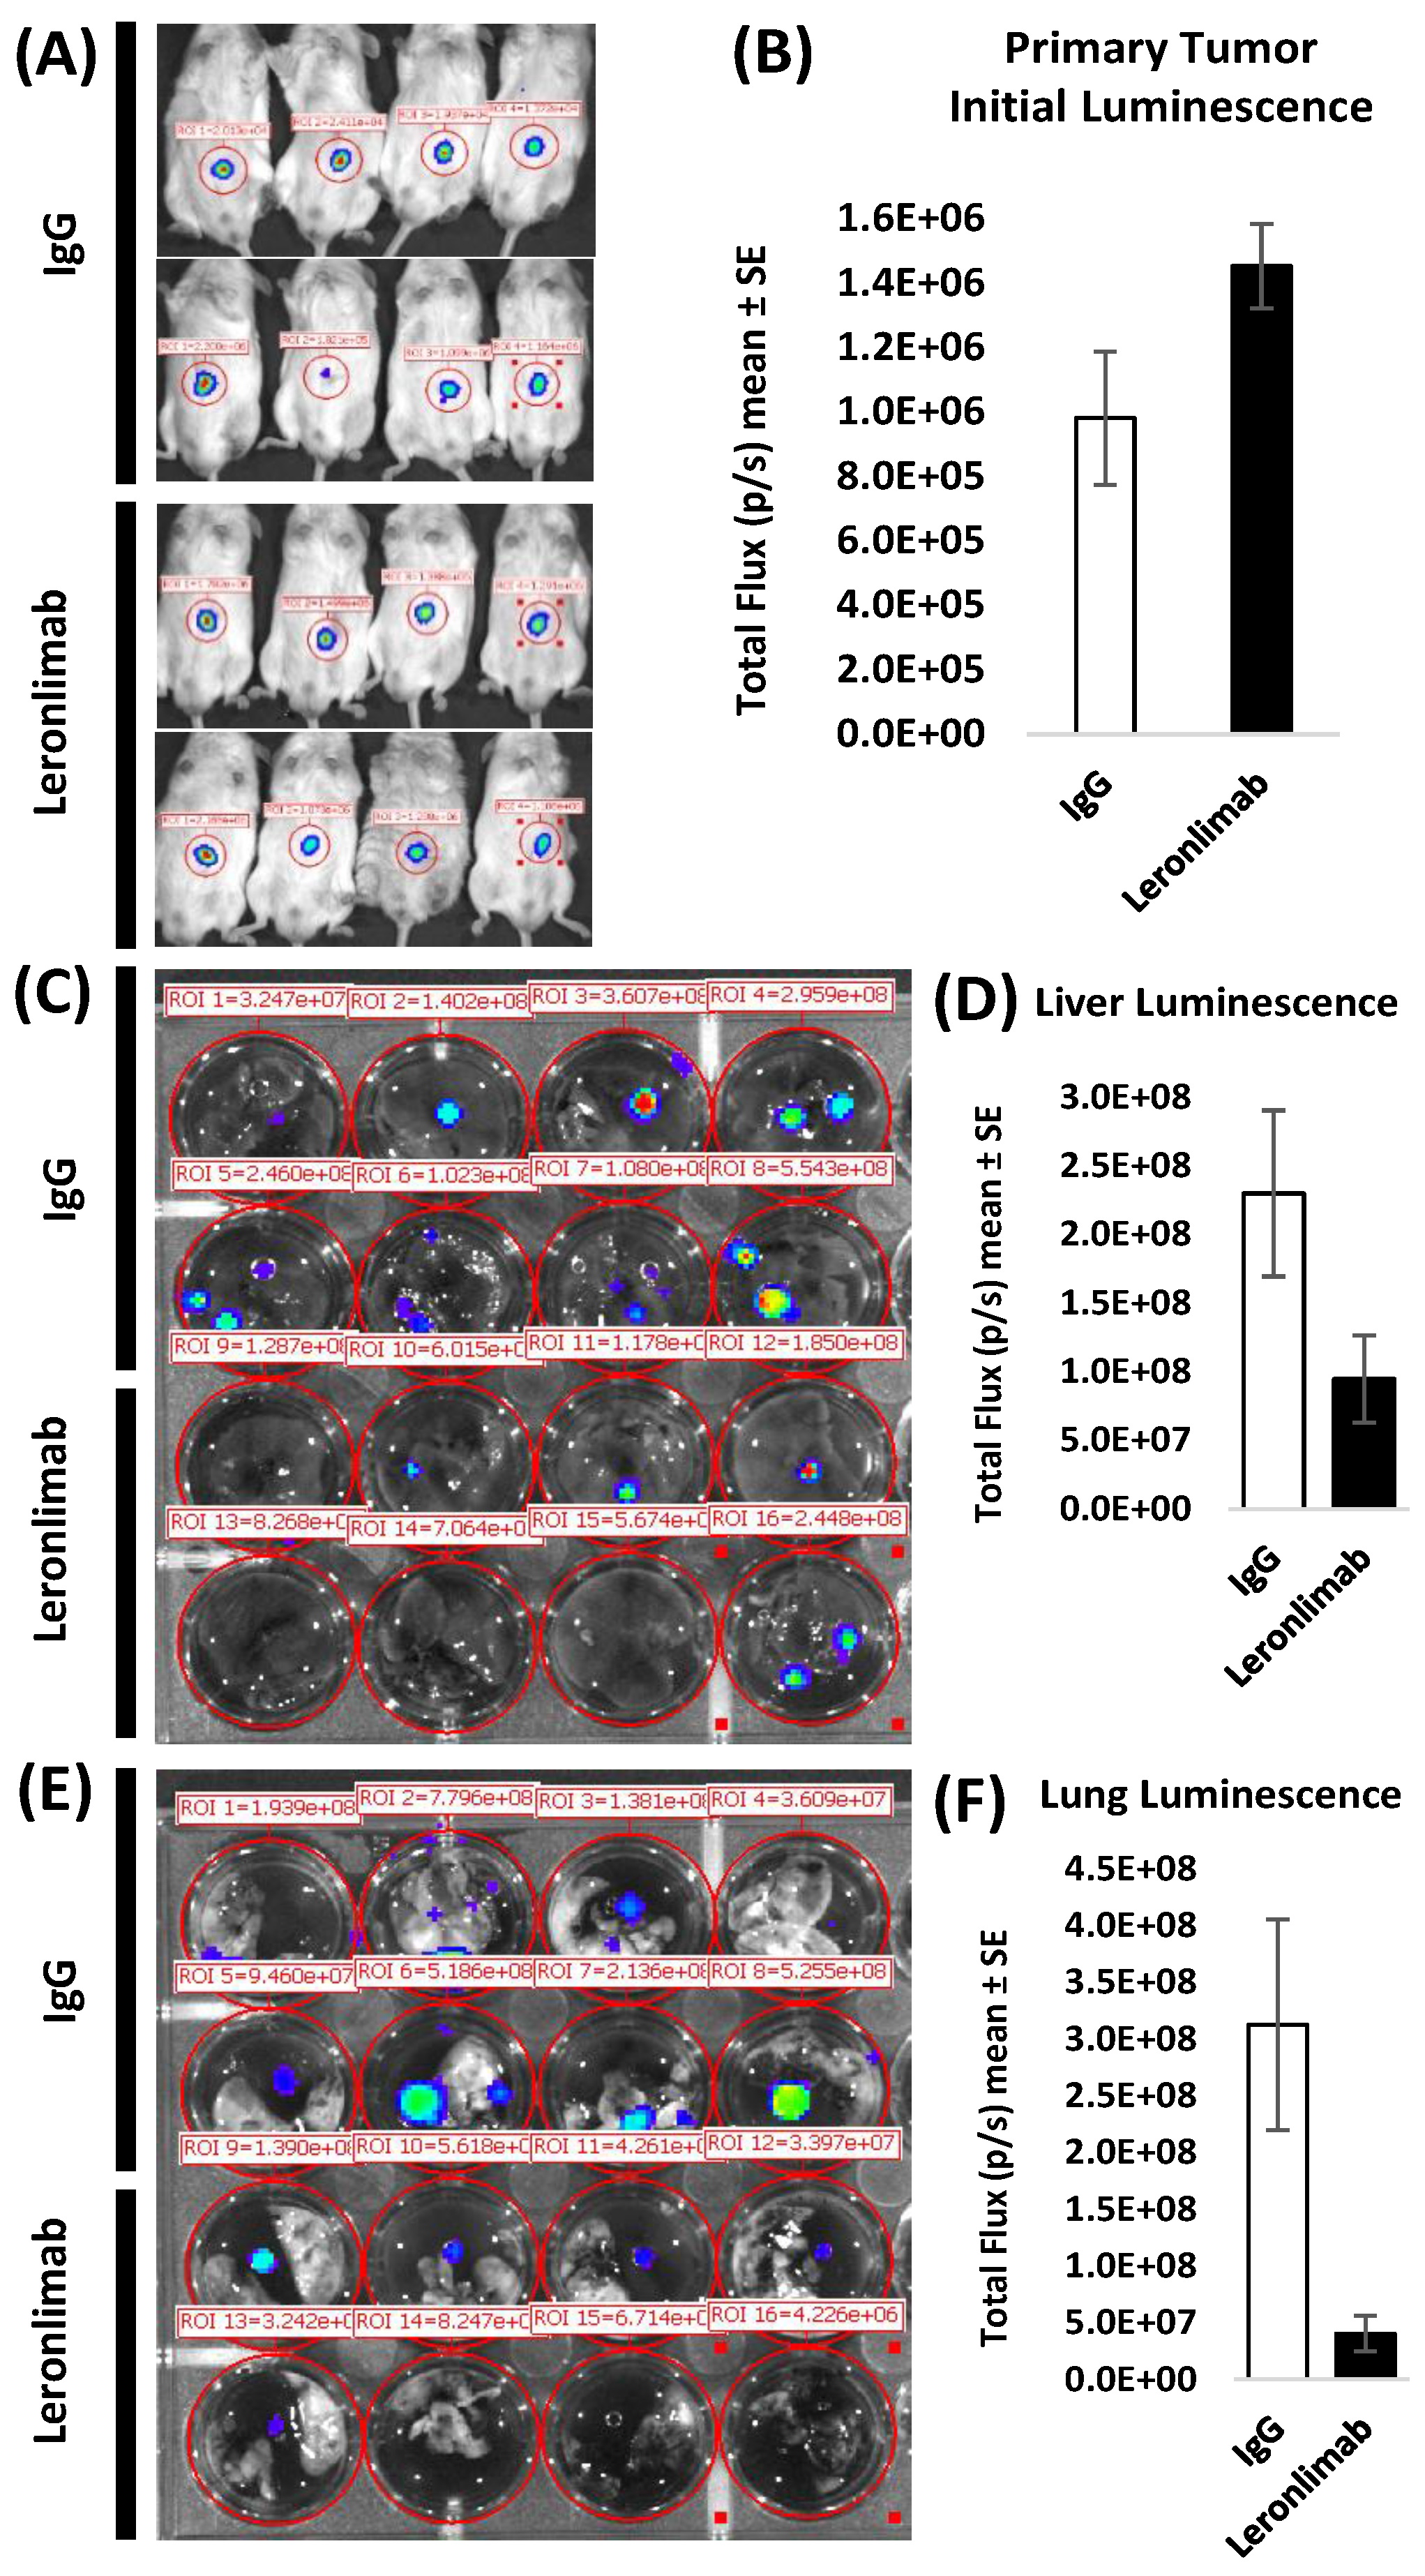
Figure 6.
Leronlimab inhibits angiogenesis induced by SW480 tumors grown in the dermis of humanized NSG mice. Tumor cells (2 x 10⁶) were inoculated in suspension in a volume of 0.1 mL PBS into the dermis of NSG mice. Antibody treatment was performed as above (2 mg i.p. 2x/wk). Ten days later mice were euthanized, and the inoculation site was photographed under 12.5x magnification. VESGEN software was used to analyze vessel number, diameter, branching, vessel generation number, and network characteristics. Total vessel area, vessel length density, large and small generations were all reduced in leronlimab treated mice. There was no difference in mean tumor area (p=0.91).
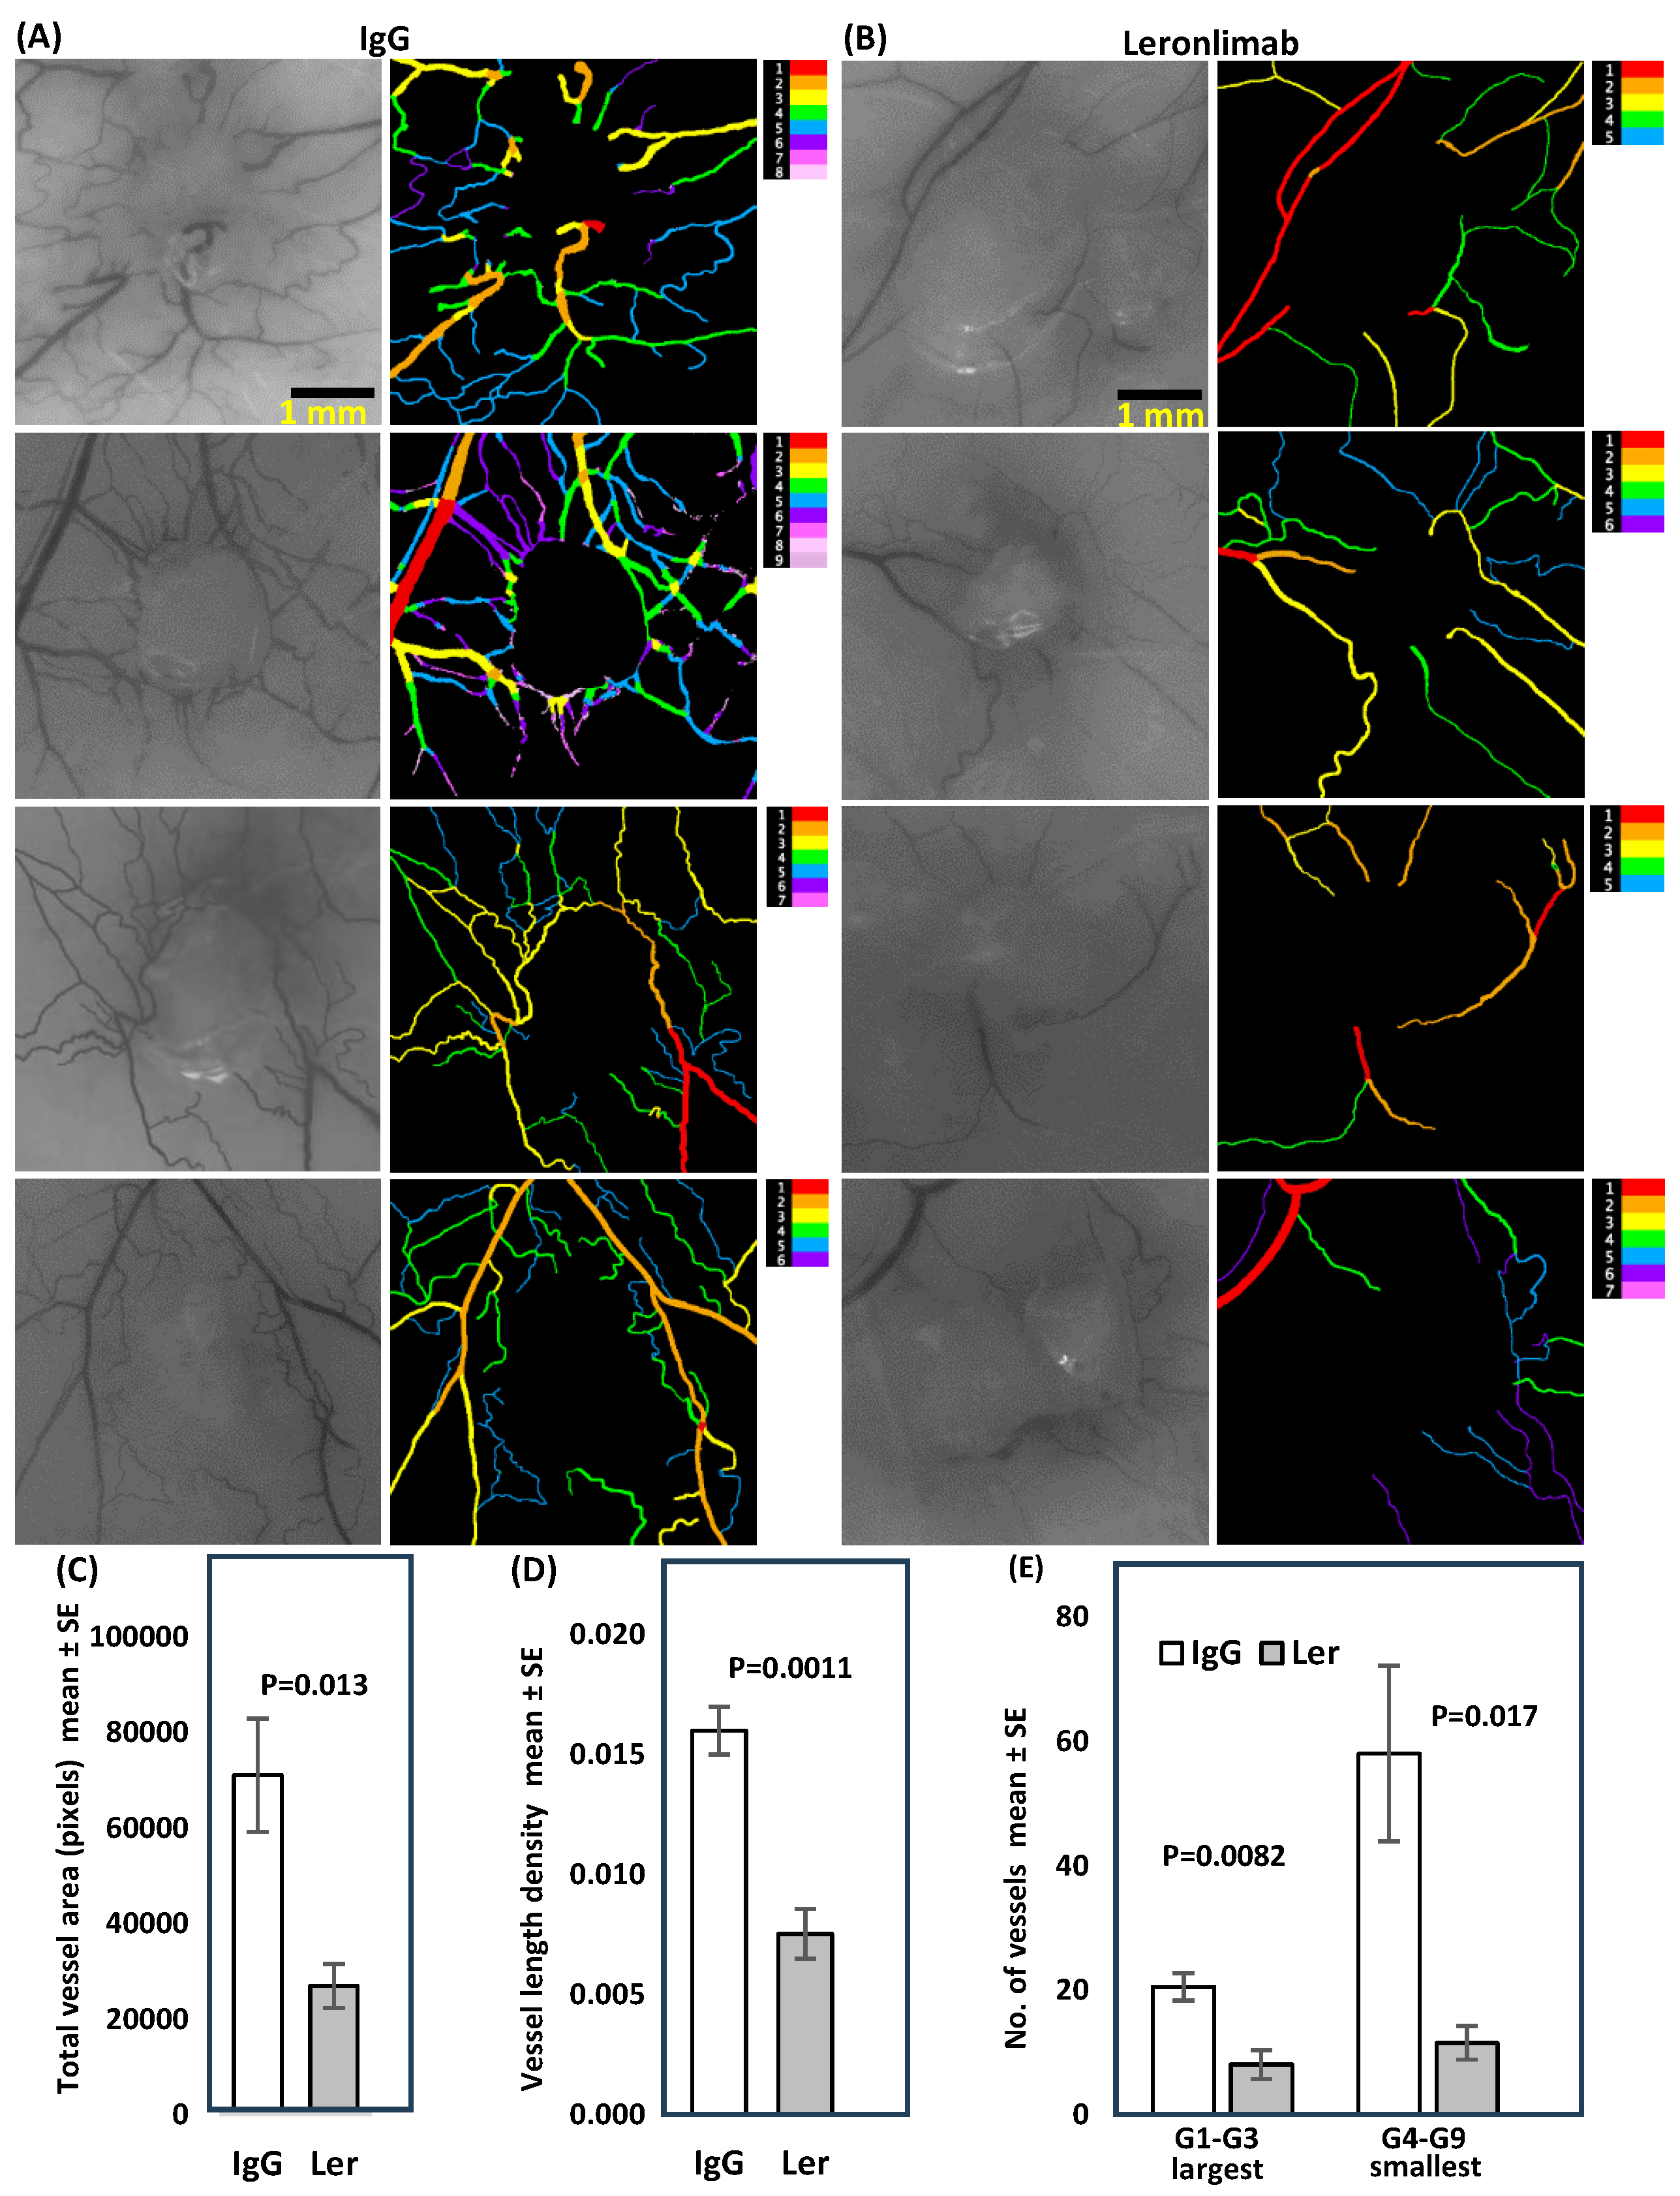
Figure 7.
Gene expression correlation analysis of TCGA Colorectal Adenocarcinoma (COAD) samples. (A) The UCSC Xena platform was used for analysis and visualization of the gene expression correlations. For the 434 Colon and Rectal Cancer (COADREAD) samples with available RNAseq data, correlations between the expressions of CCR5 ligands and CCR5 and B) correlations between the expressions of immune checkpoint genes and CCR5 were assessed (see Spearman’s correlation rho values and associated p-values in Results). (C) Analysis of Colorectal Adenocarcinoma (COAD) MSS samples (dataset TCGA, Nature 2012) using cBioPortal for Cancer Genomics platform. Of the 193 COAD samples assigned as microsatellite stable (MSS), 166 samples had available RNAseq data. Gene expression correlations were assesed using these 166 samples. The gene names of the CCR5 ligands and D) immune checkpoint genes whose expressions are significantly correlated with CCR5 expression (Spearman’s correlation with Benjamini-Hochberg FDR correction; q-value<0.05) are depicted in bold.E) Pairwise expression correlations are depicted between CCR5 and the immune checkpoint genes HAVCR2, (F) PD-1 and (G) PD-L1, respectively in MSS samples.
Disclaimer/Publisher’s Note: The statements, opinions and data contained in all publications are solely those of the individual author(s) and contributor(s) and not of MDPI and/or the editor(s). MDPI and/or the editor(s) disclaim responsibility for any injury to people or property resulting from any ideas, methods, instructions or products referred to in the content. |
© 2025 by the authors. Licensee MDPI, Basel, Switzerland. This article is an open access article distributed under the terms and conditions of the Creative Commons Attribution (CC BY) license (http://creativecommons.org/licenses/by/4.0/).
Copyright: This open access article is published under a Creative Commons CC BY 4.0 license, which permit the free download, distribution, and reuse, provided that the author and preprint are cited in any reuse.


