Submitted:
05 November 2025
Posted:
06 November 2025
You are already at the latest version
Abstract
Background/Objectives: Cannabidiol (CBD) is a non-psychoactive compound found in the Cannabis sativa plant. Due to its broad therapeutic potential, CBD is often incorporated into various pharmaceutical formulations. This study aimed to evaluate homogenous (oil-based) and heterogeneous (emulsion-based) liquid preparations of CBD using different fatty oils and to provide a comprehensive comparative framework for the development of stable liquid dosage forms of cannabidiol (CBD), with direct applications in pharmaceutical formulations. Methods: The oils and emulsions were qualitatively analysed to assess their stability and suitability as CBD carriers. Ultra-Violet (UV) spectrophotometry and High-Performance Liquid Chromatography (HPLC) were employed for quantifying CBD in the formulations and also characterising them in terms of product quality. Results: The results indicated that sunflower oil is the most stable and analytically compatible matrix, with CBD recovery exceeding 97% and minimal degradation over time. Conversely, linseed and pumpkin seed oils exhibited significant analytical interference and oxidative instability. Oil-in-water emulsions prepared with a 4% Tween 80/Span 80 mixture demonstrated optimal physical stability and droplet size distribution. Conclusions: Overall, both formulations can be regarded as suitable pharmaceutical carriers for CBD delivery.
Keywords:
cannabidiol
; homogenous preparation
; emulsions
; stability test
; analytical assay
1. Introduction
Cannabidiol (CBD) is a phytocannabinoid extracted from the Cannabis sativa plant, characterised by its lack of psychoactive effects and extensively researched for its therapeutic potential. It is included in various pharmaceutical formulations available on the market, such as oily solutions. One example, approved in both the European and United States (US) markets, is Epidiolex/Epidyolex, which contains 10% CBD suspended in an oily solvent and is marketed as a treatment for patients with Lennox-Gastaut and Dravet syndrome who are unresponsive to other active ingredients [1,2,3].
In the European Union (EU), no topical medicinal products containing cannabidiol (CBD) are currently authorised; however, the compound is not listed among the prohibited ingredients in the EU Cosmetic Ingredients Database (CosIng), which has enabled its incorporation into a growing number of cosmetic preparations and specific Class I medical devices. As a result, CBD is a multifaceted active ingredient that can be administered internally and externally. Typically, oily solutions can be administered internally in drops, while emulsions can be used both internally and externally. Furthermore, the emulsions can be incorporated into semi-solid formulations by merging them with a hydrogel, resulting in an emulgel [1,3].
Given that this active ingredient falls within the second category of the Biopharmaceutical Classification System (BCS II), its physicochemical properties are critical. CBD can be described as a crystalline, colourless to pale yellow powder with a molecular weight of 314.5 g/mol and the chemical formula C21H30O2. The molecular structure is shown in Figure 1. CBD exhibits high lipophilicity, with a log P value of approximately 6.3, which affects its aqueous solubility (estimated to be less than 1 µg/mL) and oral bioavailability. Consequently, due to its low hydrophilicity, the most appropriate pharmaceutical formulation for CBD is an oily solution, which has already been trademarked and is commercially available. CBD contains two phenolic hydroxyl groups, indicating weak acidic properties (pKa=9.13). It is practically insoluble in water but dissolves in organic solvents such as ethanol and specific liquid lipids. Its chemical stability depends on the formulation type, storage conditions—including light exposure, temperature, and oxygen exposure—and pH levels; an alkaline pH increases the risk of degradation [3].
Due to its increased lipophilicity, two of the most common pharmaceutical formulations in which the proposed active ingredient will be incorporated are oily solutions and emulsions, both of which are discussed below.
CBD oils are influenced by environmental factors such as light, oxygen, and temperature, with elevated temperatures accelerating the degradation of the active compound and consequently reducing shelf life. Numerous studies have been conducted to evaluate the stability of CBD oils at different concentrations (5% and 10%) across various types of oils, with Cannabis oil among the most frequently used [4]. Prior research has indicated that, despite labels asserting the absence of cannabinoids in Cannabis oils, certain instances have detected a cumulative concentration exceeding the labelled amount. Consequently, an alternative oil that does not contain or derive from the Cannabis plant is required to mitigate the risk of cannabinoid accumulation and the associated potential for adverse effects. Given that the active ingredient possesses a low melting point, it is presumed to be less stable than compounds with higher melting points. Maintaining a lower temperature and storing the oil under controlled conditions may enhance the stability of these lipid-based solutions [5,6,7,8,9]. Furthermore, oil-based systems enhance dermal and mucosal permeation of this highly lipophilic molecule, thereby improving therapeutic efficacy. Although advanced technologies such as nanoemulsions or micellar systems can, in principle, enable aqueous-based CBD gels, these require complex surfactant mixtures and processing steps, making simple oil-based solutions the most robust and pharmaceutically feasible approach [10,11].
CBD emulsions serve as delivery systems designed to enhance the low hydrophilicity and poor oral bioavailability of CBD. These pharmaceutical formulations are produced by dissolving active ingredients in a lipid phase and then dispersing them as fine droplets within an aqueous phase. The addition of lipid components into the hydrophilic phase is facilitated by emulsifiers with different hydrophilic-lipophilic balance (HLB) values. Oil-in-water (O/W) emulsions are generally preferred for oral use because they improve patient palatability (i.e., higher patient acceptability); additionally, droplet size can enhance biopharmaceutical and pharmacokinetic properties. Incorporating CBD into this heterogeneous mix provides greater stability during storage under atmospheric conditions; furthermore, exposure to light and oxygen has a less significant impact on the active ingredient compared to an oily solution [10,11,12]. Microemulsions provide several advantages, making them suitable for CBD delivery, such as:
- thermodynamic stability,
- small particle size that increases the surface area for absorption, enhancing the dissolution rate and bioavailability of CBD,
- allows the simultaneous incorporation of lipophilic ingredients (such as CBD) and hydrophilic excipients (or other active ingredients that outline an increased hydrophilicity),
- improve formulation flexibility,
- increase the therapeutic efficacy,
Bonn-Miller and his collaborators outlined that oily formulations are generally less likely to be mislabeled compared to vaporisation liquids, which are the most frequently mislabeled. The same study showed that more than 40% of the products tend to be underlabeled and more than 30% are overlabeled [8].
In a previously published study, it was observed that the cannabis oil contains a small amount of CBD (<0.5%), even though the label states that the CBD oil contains no CBD or tetrahydrocannabinol (THC) [4]. As a result, another oil should be used to develop CBD oil that will not lead to an over-labelled product. Since CBD is a lipophilic ingredient, the initial formulation chosen is an oily solution. Practically, the previously obtained results served as the basis for this study.
de Aquino et al. developed two distinct nanoemulsions, one containing CBD and the other containing tetrahydrocannabinol (THC), to reduce brain damage and treat convulsions in mice treated with pentylenetetrazole. By using a small amount of oily phase (about 10%), they obtained very stable emulsions, characterised by low particle size (<250 nm) and a low Polydispersity Index (<0.1), which highlights the increased homogeneity of the pharmaceutical formulation [10].
Demisli et al. developed nanoemulsions with CBD at concentrations ranging from 0.1% to 0.5%. Since the concentration range was narrow, the amount of active ingredient did not significantly affect the particle size (in both cases, particles smaller than 130 nm were observed on the day of preparation). During the stability study, it was observed that over time, the particle size tends to increase while the system remained stable with the PdI < 0.25 for all the determinations conducted [12].
In both cases, the CBD concentration was below 1%, depending on the administration route and the target population (mice). By contrast, this study used a higher CBD concentration, exceeding 4%, which has a therapeutic effect in humans, in the liquid formulations. Additionally, it is a fact that using a larger amount of active ingredient tends to increase the droplet size.
This study aims to identify the type of oil that does not cause the accumulation of the active ingredient in pharmaceutical formulations, as observed with Cannabis oil. The active ingredient can be accurately analysed using various techniques. Additionally, the research involves incorporating the optimised oils into a microemulsion, with the preparation methods (conventional or automated) and the amount of emulsifier varied to evaluate their effects on the emulsion's properties.
2. Materials and Methods
2.1. Chemicals and Reagents
The following chemicals and reagents were used throughout this investigation: cannabidiol (CBD) with a purity of 99.5%, supplied by Trigal Pharma (Vienna, Austria); refined sunflower oil from Argus S.A. (Constanța, Romania); cold-pressed pumpkin seed oil and linseed oil obtained from S.C. Dachim S.R.L. (Turda, Romania); and sesame oil provided by Auchan (Romania). The emulsifiers included Tween 80 (polyoxyethylene sorbitan monooleate), supplied by Sigma-Aldrich (Milano, Italy), and Span 80 (sorbitan monooleate) from Carl Roth GmbH (Karlsruhe, Germany). Vitamin E (α-tocopherol) was sourced from Fagron (Trikala, Greece). Simultaneously, Cosgard (a mixture of benzyl alcohol and dehydroacetic acid) was acquired from MAYAM (Elemental, Oradea, Romania, originating from the USA). HPLC-grade acetonitrile and methanol were obtained from Honeywell (Raunheim, Germany). Ethanol, ethyl ether, chloroform, glacial acetic acid, and potassium iodide were procured from Merck KGaA (Darmstadt, Germany). All aqueous solutions were prepared using ultrapure water supplied by Q Test S.R.L. (Iași, Romania). All chemicals and solvents used in this study were of an analytical grade.
2.2. Physicochemical Evaluation of Fatty Oil Vehicles
Density, acid value, saponification value, peroxide value, and ester value were determined according to the methods described in the European Pharmacopoeia 11th Edition (Ph. Eur. 11).
2.2.1. Organoleptic Properties
The oils were evaluated for colour, odour, and appearance.
2.3. Preparation of Homogenous Oil-Based CBD Formulations
Four oil-based formulations were prepared by dispersing CBD into different fatty oils at a final concentration of 10% (w/w). The oils used included refined sunflower oil, cold-pressed pumpkin seed oil, linseed oil, and sesame oil. CBD was added to these oils by manual stirring, then homogenised for 30 minutes with a magnetic stirrer. The resulting oils were labelled U1-U4, corresponding to: U1 - sunflower oil, U2 - pumpkin seed oil, U3 - linseed oil, and U4 - sesame oil.
2.3.1. Stability Study
The amount of CBD was determined using a previously validated chromatographic method (HPLC), with the analytical performance assessment detailed in subsection 2.5.2 [4,5]. The active pharmaceutical ingredient (API) was analysed at 1 month (T1), 2 months (T2), and 3 months (T3). Additionally, the presence or absence of fungal filaments was assessed during the organoleptic study at the specified time points.
2.3.2. Oil Selection – Mathematical Scoring
To select the best oil, the properties of various oils, including CBD oils, were evaluated, resulting in a maximum score of 10 for each oil. The parameters considered are listed below, with their mathematical scoring detailed in Table 1.
2.4. Emulsions with or Without API Loaded
Eight emulsions without CBD were prepared using sunflower oil with varying amounts of surfactants (Tween 80 and Span 80) at different concentrations: 3%, 4%, 5%, and 10% (w/w). Two preparation methods were employed: a conventional method using a mortar (Em) and an automatic method utilising a magnetic stirrer operated at 500 rpm for 30 minutes (Ea). The emulsions were designated as follows: E3%m-E10%m for the conventional method and E3%a-E10%a for the automatic mixing method (see Table 2). Considering the specific Hydrophilic-Lipophilic Balance (HLB) values of the selected surfactants and the optimal HLB value (10), the percentages of each emulsifier were determined and tested. ECBD and Eblank were prepared after the stability test was conducted, based on the best results for the amount of emulsifiers used. To prevent oxidation of the active ingredient, vitamin E was added to the aforementioned formulation, while Cosgard was used to preserve the emulsion. The latter two ingredients were only included in the final formulations prepared after the stability test.
2.4.1. Preparation Steps
For the emulsions without API, the lipophilic emulsifier (Span 80) was dispersed in sunflower oil, while the hydrophilic one (Tween 80) was dispersed in ultrapure water. Equal amounts of oily and hydrophilic phases were mixed in a mortar to produce the emulsions labelled E3%m-E10%m, prepared using a conventional method. In the second method, the hydrophilic and lipophilic components were added to a Berzelius glass and mixed for 30 minutes at 500 rpm (Table 3). For the latter two formulations mentioned in Table 2, vitamin E and Cosgard were dispersed in the lipophilic mixture.
The hydrophilic-lipophilic balance (HLB) of Tween 80 and Span 80 is 15 and 4.2, respectively. The optimal HLB for sunflower oil is 10, and the required emulsifier ratio was calculated using the Pearson square method.
2.4.2. Establishing the Emulsion Type
Method 1. Dilution method. Two samples of 1 mL each were diluted with water (the first) and oil (the second), and the behaviour of the emulsion was observed. If the emulsion can be diluted with water without showing any phase discontinuity, it can be considered O/W. Conversely, if the emulsion can be diluted with oil, a W/O emulsion is obtained, in accordance with Bancroft's stipulations.
Method 2: Colouring Technique. In two separate test tubes, 1 mL of emulsion was combined with 1-2 drops of a hydrophilic dye (1 % w/w Methylene Blue) in the first tube and with a lipophilic dye (Sudan III) in the second. If a uniform colouration appears upon the addition of Methylene Blue, the emulsion is identified as oil-in-water (O/W). Conversely, if a homogeneous mixture is observed with Sudan III, the emulsion is classified as water-in-oil (W/O).
The two methods can be used simultaneously to compare and validate the results.
2.4.3. Stability Index Evaluation
To determine the influence of the preparation method and the amount of emulsifiers used, 5 mL of each emulsion was poured into a 5 mL glass cylinder, and the water volume was measured after 1, 2, and 24 hours following preparation. Using Eq. 1, the stability index was calculated.
(Eq. 1)
Where:
S% - stability index
V1 – theoretical water volume
V2 – practical water volume
2.4.4. Particle Size Evaluation
To evaluate this parameter, 30 particles were examined for size using an electron microscope (Optika Microscopes, Ponteranica, Italy). The emulsion was agitated, and a single drop was analysed for size; 30 oil drops were evaluated. The mean size was calculated and expressed as the average ± standard deviation (SD). Additionally, the following parameters were considered during the assessment: the minimum particle diameter (dmin), the largest particle diameter (dmax), the frequency of drops within an interval (f), the mean diameter of the interval (dm), and the percentage of drops within the interval (n%). Ranges for ten particles were considered for both the CBD-emulsion and the emulsion without active ingredients. A frequency curve was plotted.
2.5. Analytical Determinations of CBD Preparations
Two analytical techniques were employed to determine the CBD content in the proposed liquid formulations: a UV-spectrophotometric method and an HPLC method. For each technique, standard performance was assessed, and both were utilised after achieving satisfactory linearity and selectivity parameters.
2.5.1. Spectrophotometric Quantification of CBD in Oily Solutions
A stock solution of 1 mg/mL CBD in acetonitrile was prepared. From the stock solution, a calibration curve was prepared in the range of 0.5-25 µg/mL. CBD oils were diluted 1:100 (v/v) with acetonitrile. The active ingredient was assessed at 208 nm in a 1 cm-diameter glass cuvette.
A calibration curve (R² > 0.99) was generated at 208 nm. The CBD emulsions were diluted to achieve a concentration within the proposed range. Absorbances were measured and compared to the standard curve.
2.5.2. UHPLC Analysis of CBD Oils and Emulsions
High-performance liquid chromatography (HPLC) was used to assess the uniformity and stability of CBD levels in various vegetable oils. The analyses occurred at the Advanced Medical-Pharmaceutical Research Centre, within the Chromatography and Mass Spectrometry Laboratory (CROMS) of George Emil Palade University of Medicine, Pharmacy, Science and Technology of Targu Mures. A UHPLC Flexar (PerkinElmer) system and a Gemini NX C18 column (3 µm, 100 x 3 mm) were used to quantify CBD in the prepared oils, following a method previously developed and validated by the research group [16].
A 1 mg/mL stock solution of CBD was prepared, and seven standard dilutions were then ready to assess the method's linearity Linearity was evaluated at three time points after preparation: 1 month (T1), 2 months (T2), and 3 months (T3).
Each oil sample was diluted twice: 1:100 and 1:20. For the 1:100 dilution, 100 µL of the sample was mixed with acetonitrile in a 10 mL volumetric flask. From this, 500 µL was further diluted to 10 mL (1:20). Blanks (non-CBD oils) were prepared in the same manner.
Samples and standards were filtered and transferred into HPLC vials. The mobile phase consisted of a 30:70 (v/v) mixture of water and acetonitrile, and the detection wavelength was set at 208 nm. The injection period lasted 3.5 minutes under a pressure exceeding 200 bar.
2.6. Statistical Evaluation
Statistical analysis of the CBD assay in the emulsion was performed using the HPLC method in GraphPad Prism 10 (GraphPad Software, Boston, CA, USA). The ROUT test was used to identify and exclude outliers at the Q=1% level, followed by the Shapiro-Wilk normality test. Since only two datasets were compared, the Student's t-test was applied. Results are presented as mean ± SD. To assess the quality index, a one-way analysis of variance (ANOVA) was conducted, followed by the post hoc Tukey test. Statistically significant differences between samples are indicated by different letters. The significance level was set at 0.05 (p).
3. Results and Discussions
This chapter presents the results and discussion for both CBD oils, as well as the procedures followed to select the most stable CBD oil for incorporation into a CBD emulsion, along with its pharmaceutical and technological characterisation.
The choice of refined sunflower oil, cold-pressed pumpkin seed oil, linseed oil, and sesame oil as lipid carriers was based on their wide availability, proven safety profile, and everyday use in pharmaceutical and nutraceutical products. These edible vegetable oils offer suitable lipophilic environments for dissolving cannabidiol (CBD) and vary in their fatty acid profiles and natural antioxidant contents (tocopherols in sunflower oil, sesamol in sesame oil), factors known to affect oxidative stability and compatibility with analytical methods. Additionally, using non-cannabis-derived oils reduces the risk of uncontrolled cannabinoid levels and regulatory issues, while allowing for a systematic comparison of physicochemical performance for developing stable CBD liquid dosage forms.
3.1. Physicochemical Evaluation of Fatty Oil Vehicles
In addition to density, the quality indexes (acid value, saponification value, peroxide value, and ester value) were evaluated to determine which oil will be used to develop the CBD oils and emulsions.
3.1.1. Density Evaluation
For each fatty oil, the density was measured and is shown in Table 4. Minor differences were observed between the oils, all of which were very close to the Ph. Eur. 11 requirements, as shown in Table 4 [17]. All the oils recorded density values lower than the Ph. Eur. 11 standards, possibly due to the method used. Additionally, the deviation from the standards is less than 5%; therefore, all the oils will receive a perfect score of 2 for this parameter.
3.1.2. The Quality Index Assessment
The results obtained in the physicochemical evaluations of the fatty oils are underscored in Figure 2.
Table 5 highlights the results, considering the evaluated indices and the Ph. Eur. 11 stipulations.
Sunflower oil had the lowest acid value (0.27 mg KOH/g) and the highest peroxide value (38.78 meq O₂/kg). Linseed oil showed the highest saponification value (227.82 mg KOH/g). Ester values were highest in linseed oil (227.13 mg KOH/g) and lowest in sunflower oil (75.78 mg KOH/g).
Four different fatty oils were used to prepare oil-based solutions containing 10% cannabidiol (CBD). These formulations underwent physicochemical quality assessments through a series of standard analyses. The acid value indicates the concentration of free fatty acids and serves as an indicator of the oil’s quality. For sunflower oil, the results show that the acid value complies with the Ph. Eur. 11 standards (0.5 mg KOH/g) [17]. For pumpkin seed oil, the literature reports a maximum acceptable acid value of 1.32 mg KOH/g. The experimental value obtained in this study exceeds this limit, suggesting that the oil may have undergone degradation or was produced by heat extraction followed by refining, despite product labelling claiming cold-press extraction. For linseed oil, the acid value determined was 0.69 mg KOH/g. The Ph. Eur. 11 specifies a maximum acid value of 4.5 mg KOH/g for Lini oleum virginale [17]. The results obtained in the present study are within the acceptable range, indicating a favourable quality profile and an optimal level of free fatty acids. Regarding sesame oil, the Ph. Eur. 11 limits the maximum acid value at 0.5 mg KOH/g [17]. The value obtained is slightly above this limit, suggesting a mildly elevated free fatty acid concentration, possibly due to minor oxidative degradation.
The saponification value functions as an indicator of the average molecular weight of fatty acids and bears an indirect correlation with both foaming properties and emulsion behaviour. The sunflower oil sample exhibited a saponification value of 76.05 mg KOH/g, markedly below the expected range of 186–194 mg KOH/g. This observation suggests a diminished foaming capacity and may imply the presence of longer-chain fatty acids or a reduced ester content. Pumpkin seed oil demonstrated an experimental value of 98.39 mg KOH/g compared to a theoretical value of 181.76 mg KOH/g. This discrepancy indicates incomplete saponification or insufficient extraction duration. Linseed oil exhibited a saponification value marginally above the upper limit of the theoretical range (188–195 mg KOH/g), potentially indicating a higher concentration of short-chain fatty acids and an enhanced foaming potential. Furthermore, sesame oil showed a value lower than anticipated, relative to the literature range of 188–193 mg KOH/g, suggesting either limited saponification capacity or the need for an extended reaction period.
Peroxide value is an essential indicator of lipid oxidation and the presence of haracteriz lipids. According to Ph. Eur. 11, the maximum allowed peroxide value for sunflower oil is 10 meq O₂/kg [17]. The experimental result exceeded this limit, indicating non-compliance and possible oxidative degradation. For pumpkin seed oil, the literature reports a maximum theoretical value of 2.02 meq O₂/kg. The high peroxide value obtained suggests poor oxidative stability. In contrast, linseed oil showed a peroxide value within the acceptable range (≤ 15 meq O₂/kg) according to Ph. Eur. 11, confirming its adequate oxidative stability under the tested conditions [17]. Sesame oil exhibited a slightly higher peroxide value compared to the theoretical maximum of 2.34 meq O₂/kg. However, the increase was not significant, indicating acceptable oxidative stability and a suitable fatty acid composition.
These parameters are essential not only for establishing the pharmaceutical quality of the lipid vehicles but also for predicting their behaviour in terms of stability and interaction with the active compound (CBD), as noted in similar studies on lipid excipients in drug delivery systems [17,18,19,20].
Based on the overall physicochemical assessment, refined sunflower oil was identified as the most suitable lipid vehicle for CBD due to its low acid value within pharmacopoeial limits, an acceptable ester and saponification profile, and superior analytical compatibility, despite presenting a higher peroxide value that can be mitigated by controlled storage conditions.
3.2. Organoleptic Properties of the Unloaded Oils and CBD Oils
The sunflower oil displayed the following characteristics: clear yellow colour, transparent liquid (fluid at room temperature), with an almost imperceptible (neutral) odour. The addition of CBD did not change the properties mentioned earlier [21].
The pumpkin oil was a dark green colour, a clear liquid with a pleasant nutty odour, and was usually liquid at room temperature. By mixing the CBD with the pumpkin oil, the organoleptic properties remained unchanged [22,23].
Linseed oil is a golden-yellow oil with a mild nutty aroma when fresh. It is smooth, light, and fluid, but can become bitter and develop a strong odour if it oxidises [24]. The dissolution of CBD in linseed oil did not affect the organoleptic properties evaluated in this study.
Sesame oil is a clear, golden oil with a characteristic nutty aroma, more intense when roasted. It is smooth and fluid, adding a distinctive flavour to culinary applications [25,26]. By incorporating CBD into this oil, no modifications to the organoleptic properties were observed.
All fatty oils selected corresponded to the organoleptic requirements; as a result, they received a perfect score for each parameter evaluated — colour, odour, and aspect — totalling 6.
Based on the results for the unloaded CBD oils, the recommended oils for further use are linseed oil and sesame oil, both of which achieved a cumulative score of 6. In contrast, the other two oils received a score of 4. Given the need for a rapid analytical methodology to evaluate the active ingredient, a cumulative score will be calculated based on results from both unloaded oils and CBD oils.
3.3. Stability Study – CBD Assay
3.3.1. Spectrophotometric Determinations of CBD in Oil Formulations
The theoretical concentration of each oil was calculated and expressed in µg/ml. The percentage deviation between the measured and theoretical concentrations was determined, and a corresponding mathematical score was assigned. In the U2 formulation, pumpkin oil contains an ingredient that interferes with the active compound, leading to higher-than-expected absorbance (peaks overlap, resulting in a hyperchromic effect). In contrast, for sesame and linseed oils, a hypochromic effect can be observed. Since the oils used in the U2-U4 formulations are chemically complex, comprising triglycerides, pigments (such as chlorophylls and carotenoids), phenolic antioxidants, and oxidation products, there is an increased risk of overlapping absorbance bands in the UV region. Another analytical method is being requested for the evaluation of the active pharmaceutical ingredient content [23,27].
If the spectrophotometric method can be used to assess the proposed active ingredient, an additional point will be awarded to that specific oil. From this perspective, only U1 received an extra point, while the other three oils did not earn any points based on the spectrophotometric results; consequently, the active ingredient was further analysed by HPLC.
The results of the spectrophotometric assay for the active ingredient in the proposed CBD oils, along with the percentage deviation from the theoretical concentration, are detailed in Table 6.
3.3.2. HPLC Quantification of CBD in Oil Formulations
Method validation confirmed satisfactory linearity (R² > 0.99), precision, and accuracy. Since the spectrophotometric method was not suitable for three out of the four oils, an alternative analytical quantification method was employed, haracter HPLC (a validated method previously used to determine CBD in various matrices, including orodispersible tablets and films, suspensions, hard capsules, oils, and powders). The analytical performance of this method was confirmed beforehand [4,5,28,29].
Calibration curves for different time frames —T1 (after 1 month), T2 (after 2 months), and T3 (after 3 months) —exhibited consistent retention times (~2.45–2.48 min), high peak heights, and areas proportional to concentration. R² values were above 0.99 at all time points, confirming method linearity.
For a more accurate evaluation, the percentage deviations from the theoretical concentrations were highlighted in green if the results were close to the expected values and in red if they fell outside the acceptable range. As shown in Table 7, a noticeable accumulation also occurred with U2 oil, despite HPLC generally offering better selectivity. However, this was not always the case, as one component at the chosen wavelength (210 nm) interacted with CBD. Although the results for the U3 formulation are closer to the theoretical values, significant deviations remain; additionally, after 3 months, the concentration has nearly halved.
Sunflower oil (U1) demonstrated the best stability over 3 months at 22±2°C in the dark. HPLC was confirmed as optimal for CBD quantification in this matrix. Pumpkin oil (U2) experienced significant degradation, with CBD levels decreasing by nearly 90% after three months. Linseed oil (U3) requires post-dilution sonication and centrifugation or replacement with non-polar solvents (e.g., acetone, ethyl acetate) for accurate quantification of CBD. Sesame oil (U4) remained more stable over time compared to sunflower oil, and HPLC was suitable for its CBD analysis.
As a result, U1 received a score of 2, since both the spectrophotometric and HPLC methods can be used to assay the active ingredient. U4 received a score of 1, as only the HPLC method is suitable. U2 and U3 were assigned a score of 0, as none of the developed analytical methods were ideal for API quantification. Therefore, it is necessary to develop a new analytical method to enhance the assessment of API content. Additionally, alternative approaches, such as using an extraction method or selecting a different specific wavelength, may be considered, as the oils used to develop U2 and U3 interfered with the analyte.
3.3.3. Mathematical Scoring Evaluation
As shown in Figure 3, the final scores indicate that sunflower oil and U1 have a total score equal to that of sesame oil and U4. This is then followed by linseed oil and pumpkin oil. To identify the most suitable CBD oil, the results for the different CBD oils are compared. In this scenario, U1 (with a score of 10—the perfect score) achieved better results than U4 (with a score of 8). Therefore, U1 will be chosen as the lipophilic component for developing the CBD emulsions.
CBD content was further assessed using high-performance liquid chromatography (HPLC) at 208 nm. Over a three-month storage period, a gradual decline in CBD concentration was observed across all formulations. Sunflower oil exhibited the highest stability, with minimal loss. Sesame oil showed a 15% reduction, while linseed oil experienced a 22% decrease in CBD content. Notably, pumpkin seed oil showed a significant reduction, retaining only 22.8% of its initial CBD concentration after 3 months, indicating accelerated degradation or incompatibility with the cannabinoid. These findings highlight the importance of choosing oils haracterized by low pro-oxidant components and advantageous fatty acid profiles, as these factors directly impact the stability of lipophilic compounds such as CBD.
3.4. Characterisation of Cannabidiol (CBD) in Oil-in-Water Emulsions
Since U1 demonstrated the highest mathematical score concerning both the blank oil and the matrix containing the active ingredient, it was subsequently selected for the development of CBD emulsions. These pharmaceutical formulations were evaluated based on their stability index, particle size and distribution, as well as active ingredient content and stability. The results will be detailed in the subsequent subchapters. All the developed emulsions exhibit a white, milk-like colour and texture, with no signs of separation observed after the preparation process was completed. To expand the applicability of CBD in oral formulations, heterogeneous systems (emulsions) were also developed using sunflower oil as the lipid phase.
3.4.1. Emulsion Stability
The stability index of the emulsions after 1, 2, and 24 hours is documented in Table 8. The stability index was assessed at 1, 2, and 24 hours after preparation. In the initial three cases, the automated method demonstrated superior stability at 1 hour and 2 hours post-preparation. A concentration exceeding 5% does not improve the stability of the emulsion; moreover, due to the low S% results observed with E10%a after 1 hour, the production of mortar emulsions containing 10% emulsifiers was discontinued. This decision was based on the previous three results, wherein the automated method yielded better stability indices. As observed, the stability index tends to decrease over time. Considering all three time points, E4%a was identified as the most stable, particularly during the early phase of evaluation. Additionally, the stability of E3%a and E4%a was compared based on S% after 24 hours. Because E4%a showed higher stability, a 4% emulsifier concentration was further selected for inclusion of the active ingredient.
The most stable formulation was achieved with a 4% emulsifier mixture, which was used to prepare a 4.76% CBD-loaded oil-in-water (O/W) emulsion via magnetic stirring. To create a more stable formulation with both microbiological and antioxidant properties, vitamin E (an antioxidant) and Cosgard (a preservative) were added to the most stable emulsion.
3.4.2. Emulsion Type Evaluation
Two complementary methods were used to establish the type of emulsion W/O or O/W.
Although the emulsion was diluted with water, no changes were observed in its consistency; the formulation retained its original characteristics (Figure 4. (a)). However, when oil was used as the diluent, a clear separation was observed (Figure 4 (b)). The use of two colouring agents, methylene blue, a hydrophilic agent, and Sudan III, a lipophilic agent, showed that the hydrophilic agent dispersed readily within the emulsion. In contrast, Sudan III remained on the surface, forming particles that did not disperse in the emulsion (Figure 4. (c)).
Both Method 1 and Method 2 produced consistent results, indicating that the resulting emulsion was of the oil-in-water (O/W) type. This provides a significant advantage from an administration perspective, as O/W emulsions are generally better tolerated by patients when taken orally.
3.4.3. Particle Size and Distribution
The oily droplets from the proposed emulsions (ECBD and Eblank) are visible in Figure 5 (a and b). Since a heterogeneous pharmaceutical formulation has been developed, the particle size of the oil droplets can indicate the emulsion’s stability. For better comparison, an unloaded emulsion containing all ingredients except the active ingredient, and a loaded emulsion containing the active ingredient at a concentration of 4.76%, were prepared. Microemulsions were obtained in both cases, as the emulsion without the active ingredient showed an average particle size of 10.26 µm (Figure 5. ©). In comparison, the CBD-emulsion (ECBD) had a halved average particle size of 5.83 µm (Figure 5. (d)). In practice, incorporating CBD into the heterogeneous matrix improved stability and reduced particle size.
3.5. API Content in the Emulsions
Since both the spectrophotometric and HPLC methods were suitable for the U1, the CBD assay from the emulsion began with the spectrophotometric method. The results obtained through the spectrophotometric method are underscored in the following subchapter.
3.5.1. Spectrophotometric Determination of CBD from Emulsions
The average extracted CBD concentration was 14.18 µg/mL, compared to a theoretical value of 23.8 µg/mL, indicating approximately 59% recovery. The results emphasise the need for improved extraction techniques to address CBD retention in the lipophilic phase. The spectrophotometric method was suitable for quantifying active ingredients in the U1 formulation, which utilised sunflower oil due to its lower interference risk and simpler matrix. However, although U1 was incorporated into the heterogeneous formulation, the increased complexity of the matrix rendered the spectrophotometric assay unsuitable. The addition of emulsifiers Tween 80 and Span 80, vitamin E as an antioxidant, and Cosgard as a preservative heightened interference with the active ingredient assay. To address these limitations, the High-Performance Liquid Chromatography (HPLC) method was selected due to its superior selectivity and reliability.
3.5.2. HPLC Quantification of CBD in Emulsions
Since the spectrophotometric methods did not closely match the theoretical values, the HPLC method was used. Because an emulsion is a more complex matrix than an oil-based formulation, different extraction techniques were employed. Two samples were tested and labelled P1 and P2. For the P1 sample, after collecting the emulsion, a 1:100 dilution in acetonitrile was prepared, followed by 60 minutes of magnetic stirring. The sample was diluted 1:20 and analysed by HPLC. For P2, the same dilutions were carried out, but no magnetic stirring was performed after the initial dilution. As shown in Table 9, the results are close to the theoretical concentration. Furthermore, the study showed that extra magnetic stirring during dilution before analysis did not significantly influence the extraction yield, whether for magnetically prepared or mortar-prepared emulsions. This suggests that the emulsified system enabled sufficient release of CBD into the solvent phase, rendering these steps unnecessary for accurate analysis.
To support the statement that the extraction method does not influence the amount of CBD assessed, a statistical test (t-test) was applied, revealing no statistically significant difference (Figure 6).
CBD quantification in the emulsion was performed using both UV spectrophotometry (at 210 nm) and HPLC (at 208 nm). The HPLC method showed greater precision and accuracy in determining CBD content compared to UV analysis, which was more susceptible to matrix interference, particularly in the presence of surfactants and emulsified lipids. These findings are consistent with previous literature recommending chromatographic methods over spectrophotometric methods for complex or turbid pharmaceutical systems [32,33].
The present study is constrained by the relatively brief stability monitoring duration of three months and the limited selection of lipid carriers, which comprised only commonly utilised edible plant-derived oils. Such limitations may not entirely capture the long-term physicochemical behaviour and oxidative stability of cannabidiol (CBD) formulations under diverse storage conditions. Future investigations will seek to extend stability assessments to 6–12 months, adhering to both long-term and accelerated ICH Q1A(R2) guidelines, and to broaden the spectrum of lipid excipients by integrating alternative natural oils with varied unsaturation and antioxidant characteristics, such as almond and jojoba oils, as well as fully or partially synthetic triglyceride-based carriers (medium-chain triglycerides). These strategies are anticipated to yield a greater understanding of the relationships among fatty acid composition, oxidative vulnerability, and CBD retention, thereby facilitating the development of robust, pharmaceutically suitable delivery systems.
4. Conclusions
Several CBD oils (10% w/w) were formulated using various natural oils to assess stability indices over time, in accordance with pharmacopoeial standards. Two analytical methods were established to measure CBD in the proposed pharmaceutical matrices, each complying with ICH guidelines. When selectivity was not achieved with the spectrophotometric method, a previously validated HPLC method was verified and successfully employed. During stability testing, a decline in CBD content was observed, with sunflower oil demonstrating the best stability and pumpkin oil the lowest. After three months, fungal growth was found in the oils; therefore, the addition of a lipophilic preservative solution is recommended to improve their stability.
In addition, the lipid excipients selected in this study are Generally Recognised As Safe (GRAS) and compliant with Ph. Eur. standards, supporting their suitability for pharmaceutical and dermato-cosmetic use. Future work will extend stability testing to 6-12 months under ICH Q1A(R2) long-term and accelerated conditions to establish reliable shelf-life data, and will explore additional natural (e.g., almond, jojoba) and synthetic triglyceride-based vehicles. Furthermore, advanced delivery strategies, such as nanoemulsions or self-nanoemulsifying drug delivery systems (SNEDDS), will be investigated to enhance CBD protection, improve bioavailability and dermal penetration, and ensure patient safety and regulatory compliance in the rapidly expanding CBD product market.
Both oil-based and emulsion-based formulations are considered viable pharmaceutical systems for incorporating cannabidiol (CBD). However, the selection of the oil matrix is of utmost importance in affecting both drug release and long-term stability. Sunflower oil has demonstrated optimal performance, balancing favourable physicochemical properties, high CBD release, and sustained stability over time. Emulsions offer an additional advantage for enhancing dispersion, ensuring dose uniformity, and improving patient compliance, particularly in dermato-cosmetic or oral applications. Chromatographic techniques, such as high-performance liquid chromatography (HPLC), remain the benchmark for quantifying cannabinoids within complex matrices. Simultaneously, UV spectrophotometry may be utilised in simpler systems where interference is minimal.
The effects of surfactant concentration and preparation method on the properties of the CBD emulsion were studied. Since emulsions are heterogeneous mixtures, their stability is generally lower than that of oily solutions. The emulsion was of the O/W type with a small particle size, showing promising results that could be further improved to develop nanoemulsions with greater stability. Due to the complex composition of the emulsion, chromatographic methods were most suitable for measuring CBD. Minor differences were observed between the two preparation methods, indicating that the emulsion can be produced by either method and yielding similar particle sizes and stability.
In the future, additional ingredients such as antioxidants and various surfactants will be added to CBD oils and emulsions to enhance their stability.
Author Contributions
Conceptualization, R.A.V., L.F. and R.Ș.; methodology R.A.V., L.F., M.B. and R.Ș.; .; software, M.B.; validation, R.A.V., L.F. and R.Ș; formal analysis, R.A.V., F.L., D.P., C.P., P.A., A.P., E.M.R., C.T.C., A.C. and R.Ș.; investigation, R.A.V., F.L., D.P., C.P., P.A., E.M.R., A.P., C.T.C., A.C. and R.Ș; resources, R.A.V., F.L., D.P., C.P., P.A., E.M.R., A.P., C.T.C., A.C.; data curation, R.A.V., F.L., D.P., R.Ș.; writing—original draft preparation, D.P., C.P., P.A., E.M.R., A.P., C.T.C., M.B., and A.C; writing—review and editing, R.A.V., L.F. and R.Ș; funding acquisition, R.Ș.. All authors have read and agreed to the published version of the manuscript.
Funding
This work was supported by the George Emil Palade University of Medicine, Pharmacy, Science and Technology of Targu Mures, Research Grant number 163 /7/ 10.01.2023.
Data Availability Statement
The results will be available via e-mail to the corresponding author and on the ResearchGate platform.
Conflicts of Interest
The authors declare no conflicts of interest.
Abbreviations
The following abbreviations are used in this manuscript:
| CBD | Cannabidiol |
| US | United States |
| HLB | Hydrophil-Lipophil Balance |
| O/W | Oil in water |
| O2 | Oxygen |
| U/HPLC | Ultra/High Pressure Liquid Chromatography |
| W/W | Weight/weight |
| API | Active pharmaceutical ingredient |
| SD | Standard deviation |
| V/V | Volume/volume |
| Ph. Eur. | European Pharmacopoeia |
References
- Blebea, N.; Costache, T.; Negres, S. The Qualitative and Quantitative Analysis of CBD in Hemp Oils by UHPLC with PDA and Applications. Ser. D. Anim. Sci. 2019, 62, 138–142. [Google Scholar]
- European Medicines Agency. Epidyolex: Summary of Product Characteristics. Available online: https://www.ema.europa.eu/en/documents/product-information/epidyolex-epar-product-information_en.pdf (accessed on 9 April 2025).
- Vlad, R.-A.; Hancu, G.; Ciurba, A.; Antonoaea, P.; Rédai, E.-M.; Todoran, N.; Silasi, O.; Muntean, D.-L. Cannabidiol—Therapeutic and Legal Aspects. Pharmazie 2020, 75, 463–469. [Google Scholar] [CrossRef]
- Vlad, R.-A.; Farczadi, L.; Toma, C.-M.; Imre, S.; Antonoaea, P.; Redai, E.M.; Muntean, D.-L.; Ciurba, A. Cannabidiol content evaluation in commercial dietary supplements and stability in oil vehicle. Stud. Univ. Babes-Bolyai Chem. 2021, 66, 299. [Google Scholar] [CrossRef]
- Vlad, R.-A.; Farczadi, L.; Imre, S.; Ciurba, A.D.; Todoran, N.; Redai, E.; Antonoaea, P.; Muntean, D.L. New UHPLC Method for Cannabidiol Determination in Hard Capsules. Acta Medica Marisiensis 2019, 65, 45–48. [Google Scholar] [CrossRef]
- Dawidowicz, A.L.; Olszowy-Tomczyk, M.; Typek, R. CBG, CBD, Δ9-THC, CBN, CBGA, CBDA and Δ9-THCA as Antioxidant Agents and Their Intervention Abilities in Antioxidant Action. Fitoterapia 2021, 152, 104915. [Google Scholar] [CrossRef]
- Astray, G.; Mejuto, J.C.; Xiao, J.; Simal-Gandara, J. Benefits, Toxicity and Current Market of Cannabidiol in Edibles. Critical Reviews in Food Science and Nutrition 2023, 63, 5800–5812. [Google Scholar] [CrossRef]
- Bonn-Miller, M.O.; Loflin, M.J.E.; Thomas, B.F.; Marcu, J.P.; Hyke, T.; Vandrey, R. Labeling Accuracy of Cannabidiol Extracts Sold Online. JAMA 2017, 318, 1708. [Google Scholar] [CrossRef] [PubMed]
- Fraguas-Sánchez, A.I.; Fernández-Carballido, A.; Martin-Sabroso, C.; Torres-Suárez, A.I. Stability Characteristics of Cannabidiol for the Design of Pharmacological, Biochemical and Pharmaceutical Studies. Journal of Chromatography B 2020, 1150, 122188. [Google Scholar] [CrossRef] [PubMed]
- De Aquino, P.E.A.; Júnior, F.J.G.; De Souza Nascimento, T.; Rosal Lustosa, Í.; De Andrade, G.M.; Ricardo, N.M.P.S.; De Brito, D.H.A.; De Almeida, G.É.P.; Silveira, K.B.; Zampieri, D.; et al. Nanoemulsions of Cannabidiol, Δ9-Tetrahydrocannabinol, and Their Combination Similarly Exerted Anticonvulsant and Antioxidant Effects in Mice Treated with Pentyelenetetrazole. Pharmaceuticals 2025, 18, 782. [Google Scholar] [CrossRef]
- Hermush, V.; Mizrahi, N.; Brodezky, T.; Ezra, R. Enhancing Cannabinoid Bioavailability: A Crossover Study Comparing a Novel Self-Nanoemulsifying Drug Delivery System and a Commercial Oil-Based Formulation. J Cannabis Res 2025, 7, 35. [Google Scholar] [CrossRef]
- Demisli, S.; Galani, E.; Goulielmaki, M.; Kyrilis, F.L.; Ilić, T.; Hamdi, F.; Crevar, M.; Kastritis, P.L.; Pletsa, V.; Nallet, F.; et al. Encapsulation of Cannabidiol in Oil-in-Water Nanoemulsions and Nanoemulsion-Filled Hydrogels: A Structure and Biological Assessment Study. Journal of Colloid and Interface Science 2023, 634, 300–313. [Google Scholar] [CrossRef]
- Gharbavi, M.; Manjili, H.K.; Amani, J.; Sharafi, A.; Danafar, H. In Vivo and in Vitro Biocompatibility Study of Novel Microemulsion Hybridized with Bovine Serum Albumin as Nanocarrier for Drug Delivery. Heliyon 2019, 5, e01858. [Google Scholar] [CrossRef] [PubMed]
- Rao, Y.; Deepthi, K.; Chowdary, K.P. Microemulsions: A Novel Drug Carrier System. Int. J. Drug Dev. Technol. 2009, 1, 39–44. [Google Scholar] [CrossRef]
- Burgos-Díaz, C.; Garrido-Miranda, K.A.; Palacio, D.A.; Chacón-Fuentes, M.; Opazo-Navarrete, M.; Bustamante, M. Food-Grade Oil-in-Water (O/W) Pickering Emulsions Stabilized by Agri-Food Byproduct Particles. Colloids and Interfaces 2023, 7, 27. [Google Scholar] [CrossRef]
- Opazo Navarrete, M.; Morales, E.; Burgos Díaz, C. (Eds.) Recent Advances in Emulsions and Applications; MDPI Books: Basel, Switzerland, 2023; ISBN 978-3-0365-8951-0. [Google Scholar] [CrossRef]
- European Pharmacopoeia - 11th Edition; 11. 8.; Council of Europe: Strasbourg, 2025. [Google Scholar]
- Monton, C. Effect of Vegetable Oil Types on the Stability of Cannabinoids in Cannabis Sublingual Drops. J Curr Sci Technol 2021, 11, 1523–1531. [Google Scholar] [CrossRef]
- Ștefănescu, R.; Vlad, R.-A.; Imre, S.; Tero-Vescan, A.; Ősz, B.-E.; Sita, D.-D.; Farczádi, L. Development and Validation of an LC-MS/MS Method for the Quantification of Six Cannabinoids in Commercial Products. Studia UBBi Chemia 2025, 70, 173–190. [Google Scholar] [CrossRef]
- McClements, D.J. Edible Lipid Nanoparticles: Digestion, Absorption, and Potential Toxicity. Progress in Lipid Research 2013, 52, 409–423. [Google Scholar] [CrossRef]
- Mehany, T.; González-Sáiz, J.M.; Pizarro, C. The Quality Prediction of Olive and Sunflower Oils Using NIR Spectroscopy and Chemometrics: A Sustainable Approach. Foods 2025, 14, 2152. [Google Scholar] [CrossRef]
- Hu, T.; Zhou, L.; Kong, F.; Wang, S.; Hong, K.; Lei, F.; He, D. Effects of Extraction Strategies on Yield, Physicochemical and Antioxidant Properties of Pumpkin Seed Oil. Foods 2023, 12, 3351. [Google Scholar] [CrossRef]
- Cirule, D.; Andersone, I.; Kuka, E.; Andersons, B. Recent Research on Linseed Oil Use in Wood Protection—A Review. Sci 2024, 6, 54. [Google Scholar] [CrossRef]
- Wang, R.; Wu, L.-X.; Guo, B.-X.; Zhao, P.-H.; Yin, W.-T.; Liu, H.-M.; Mei, H.-X.; Duan, Y.-H. Characterization of Aroma-Active Compounds in Sesame Hulls at Different Roasting Temperatures by SAFE and GC-O-MS. Food Chemistry: X 2024, 21, 101203. [Google Scholar] [CrossRef]
- Bożek, M.; Trybała, J.; Lebiedowska, A.; Stolecka-Warzecha, A.; Babczyńska, P.; Wilczyński, S. Assessment of the Sunscreen Properties of Sesame Oil Using the Hemispherical Directional Reflectance Method. Appl. Sci. 2024, 14, 6545. [Google Scholar] [CrossRef]
- Kabutey, A.; Mizera, Č.; Dajbych, O.; Hrabě, P.; Herák, D.; Demirel, C. Modelling and Optimization of Processing Factors of Pumpkin Seeds Oil Extraction under Uniaxial Loading. Processes 2021, 9, 540. [Google Scholar] [CrossRef]
- Mueed, A.; Shibli, S.; Korma, S.A.; Madjirebaye, P.; Esatbeyoglu, T.; Deng, Z. Flaxseed Bioactive Compounds: Chemical Composition, Functional Properties, Food Applications and Health Benefits-Related Gut Microbes. Foods 2022, 11, 3307. [Google Scholar] [CrossRef]
- Vlad, R.-A.; Pintea, A.; Antonoaea, P.; Rédai, E.-M.; Bîrsan, M.; Hancu, G.; Farczádi, L.; Imre, S.; Muntean, D.-L.; Sovány, T.; et al. Exploring the Interconnected Properties of Cannabidiol Suspensions and Orodispersible Films. Sci. Rep. 2025, 15, 21564. [Google Scholar] [CrossRef]
- Vlad, R.-A.; Antonoaea, P.; Todoran, N.; Rédai, E.-M.; Bîrsan, M.; Muntean, D.-L.; Imre, S.; Hancu, G.; Farczádi, L.; Ciurba, A. Development and Evaluation of Cannabidiol Orodispersible Tablets Using a 23-Factorial Design. Pharmaceutics 2022, 14, 1467. [Google Scholar] [CrossRef]
- Seccamani, P.; Franco, C.; Protti, S.; Porta, A.; Profumo, A.; Caprioglio, D.; Salamone, S.; Mannucci, B.; Merli, D. Photochemistry of Cannabidiol (CBD) Revised. A Combined Preparative and Spectrometric Investigation. J. Nat. Prod. 2021, 84, 2858–2865. [Google Scholar] [CrossRef]
- Patel, B.; Wene, D.; Fan, Z. (Tina) Qualitative and Quantitative Measurement of Cannabinoids in Cannabis Using Modified HPLC/DAD Method. J Pharm Biomed Anal. 2017, 146, 15–23. [Google Scholar] [CrossRef] [PubMed]
- Kosović, E.; Sýkora, D.; Kuchař, M. Stability Study of Cannabidiol in the Form of Solid Powder and Sunflower Oil Solution. Pharmaceutics 2021, 13, 412. [Google Scholar] [CrossRef] [PubMed]
- Baratta, F.; Simiele, M.; Pignata, I.; Ravetto Enri, L.; D’Avolio, A.; Torta, R.; De Luca, A.; Collino, M.; Brusa, P. Cannabis-Based Oral Formulations for Medical Purposes: Preparation, Quality and Stability. Pharmaceuticals 2021, 14, 171. [Google Scholar] [CrossRef]
Figure 1.
CBD-chemical structure.
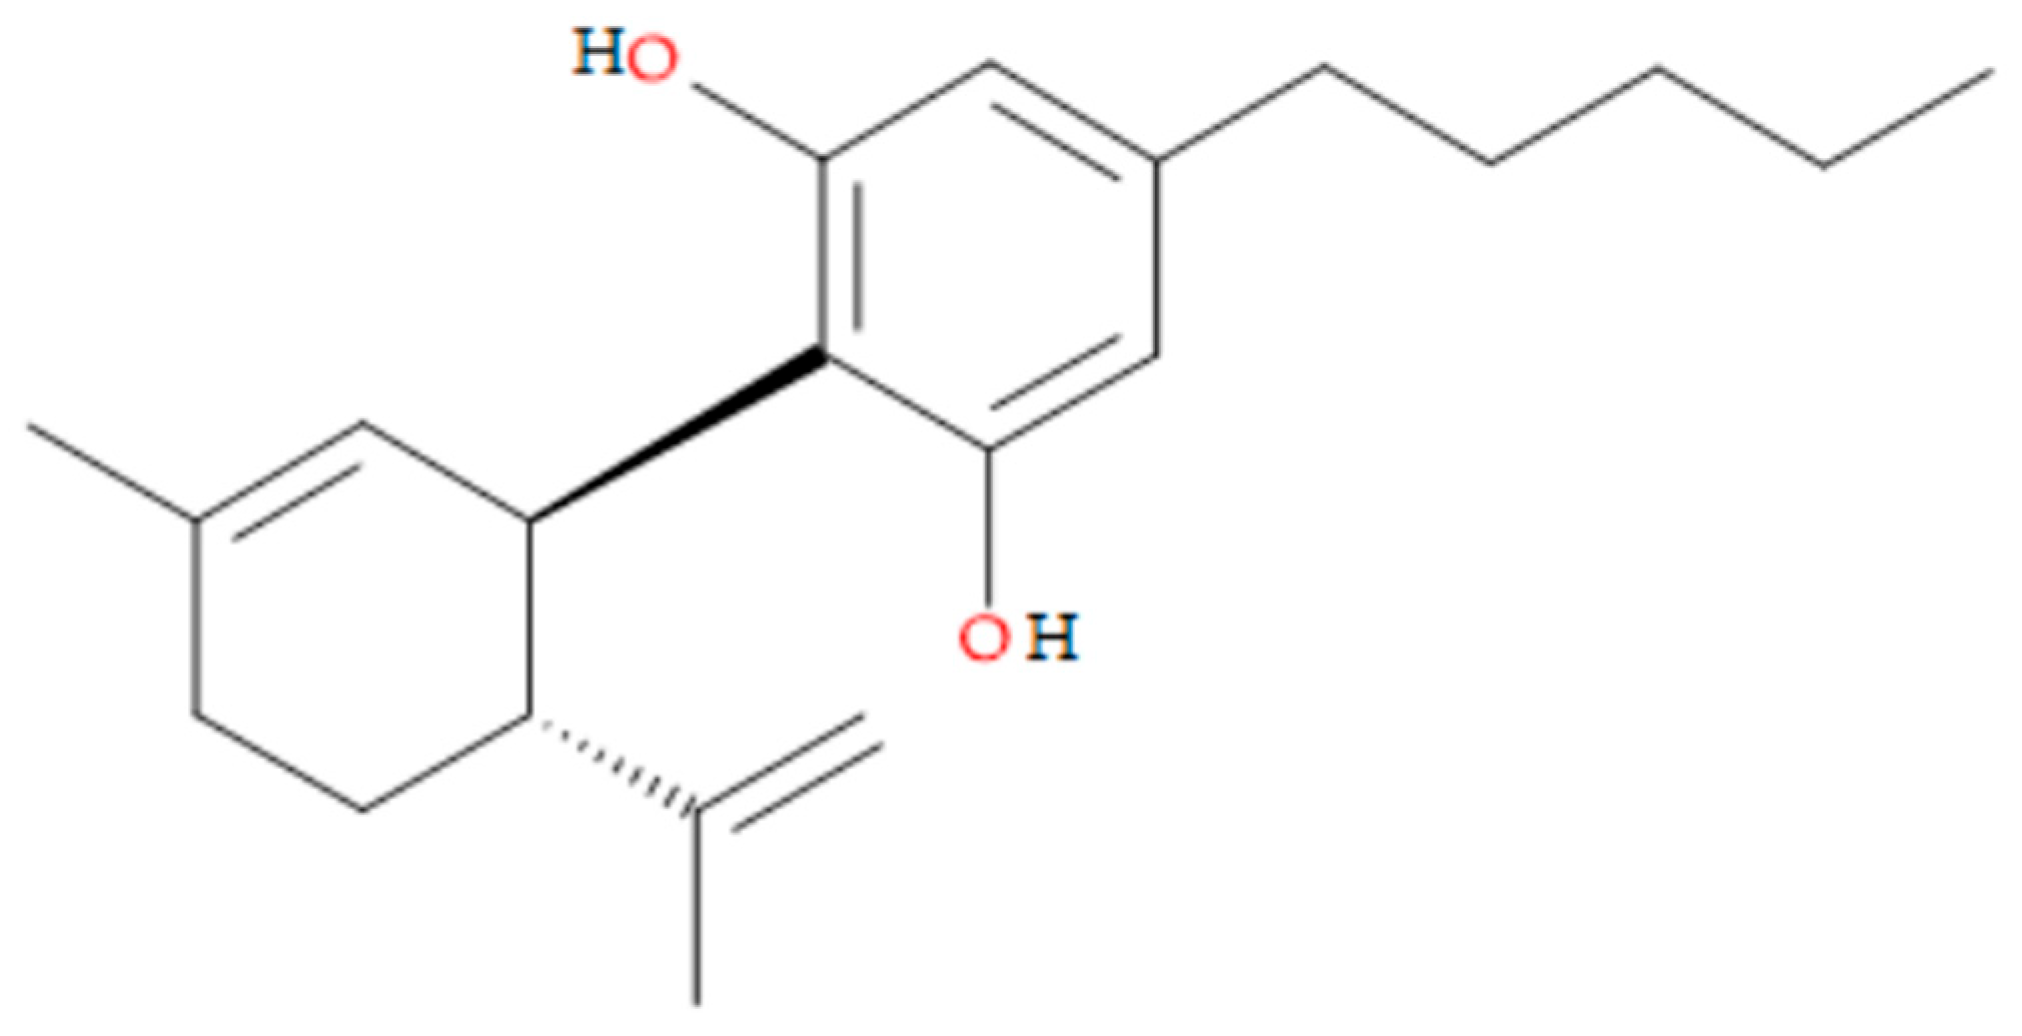
Figure 2.
Acid value, saponification value, peroxide value, and ester value were determined for the four fatty oils. Different letters above columns indicate a statistically significant difference at p < 0.05.
Figure 2.
Acid value, saponification value, peroxide value, and ester value were determined for the four fatty oils. Different letters above columns indicate a statistically significant difference at p < 0.05.
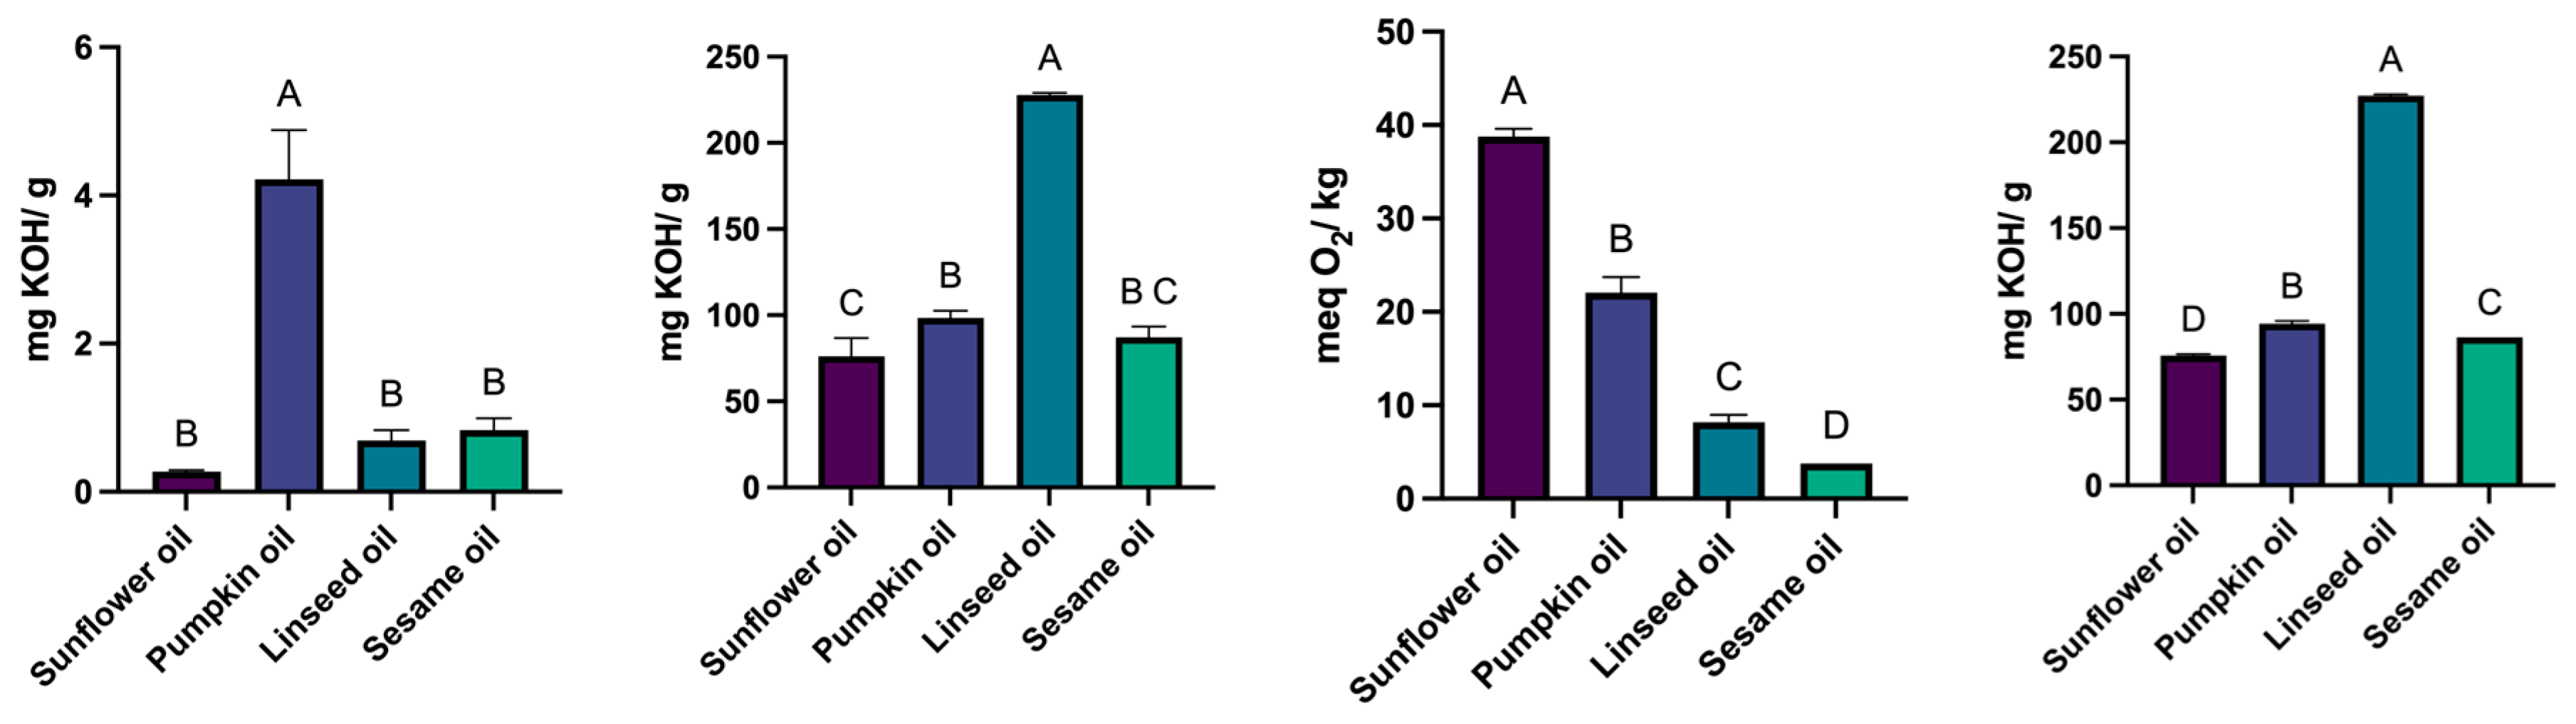
Figure 3.
The scores obtained by the blank oils and the CBD oils, and the total score obtained by cumulating the unloaded oil score with the CBD-oil score.
Figure 3.
The scores obtained by the blank oils and the CBD oils, and the total score obtained by cumulating the unloaded oil score with the CBD-oil score.
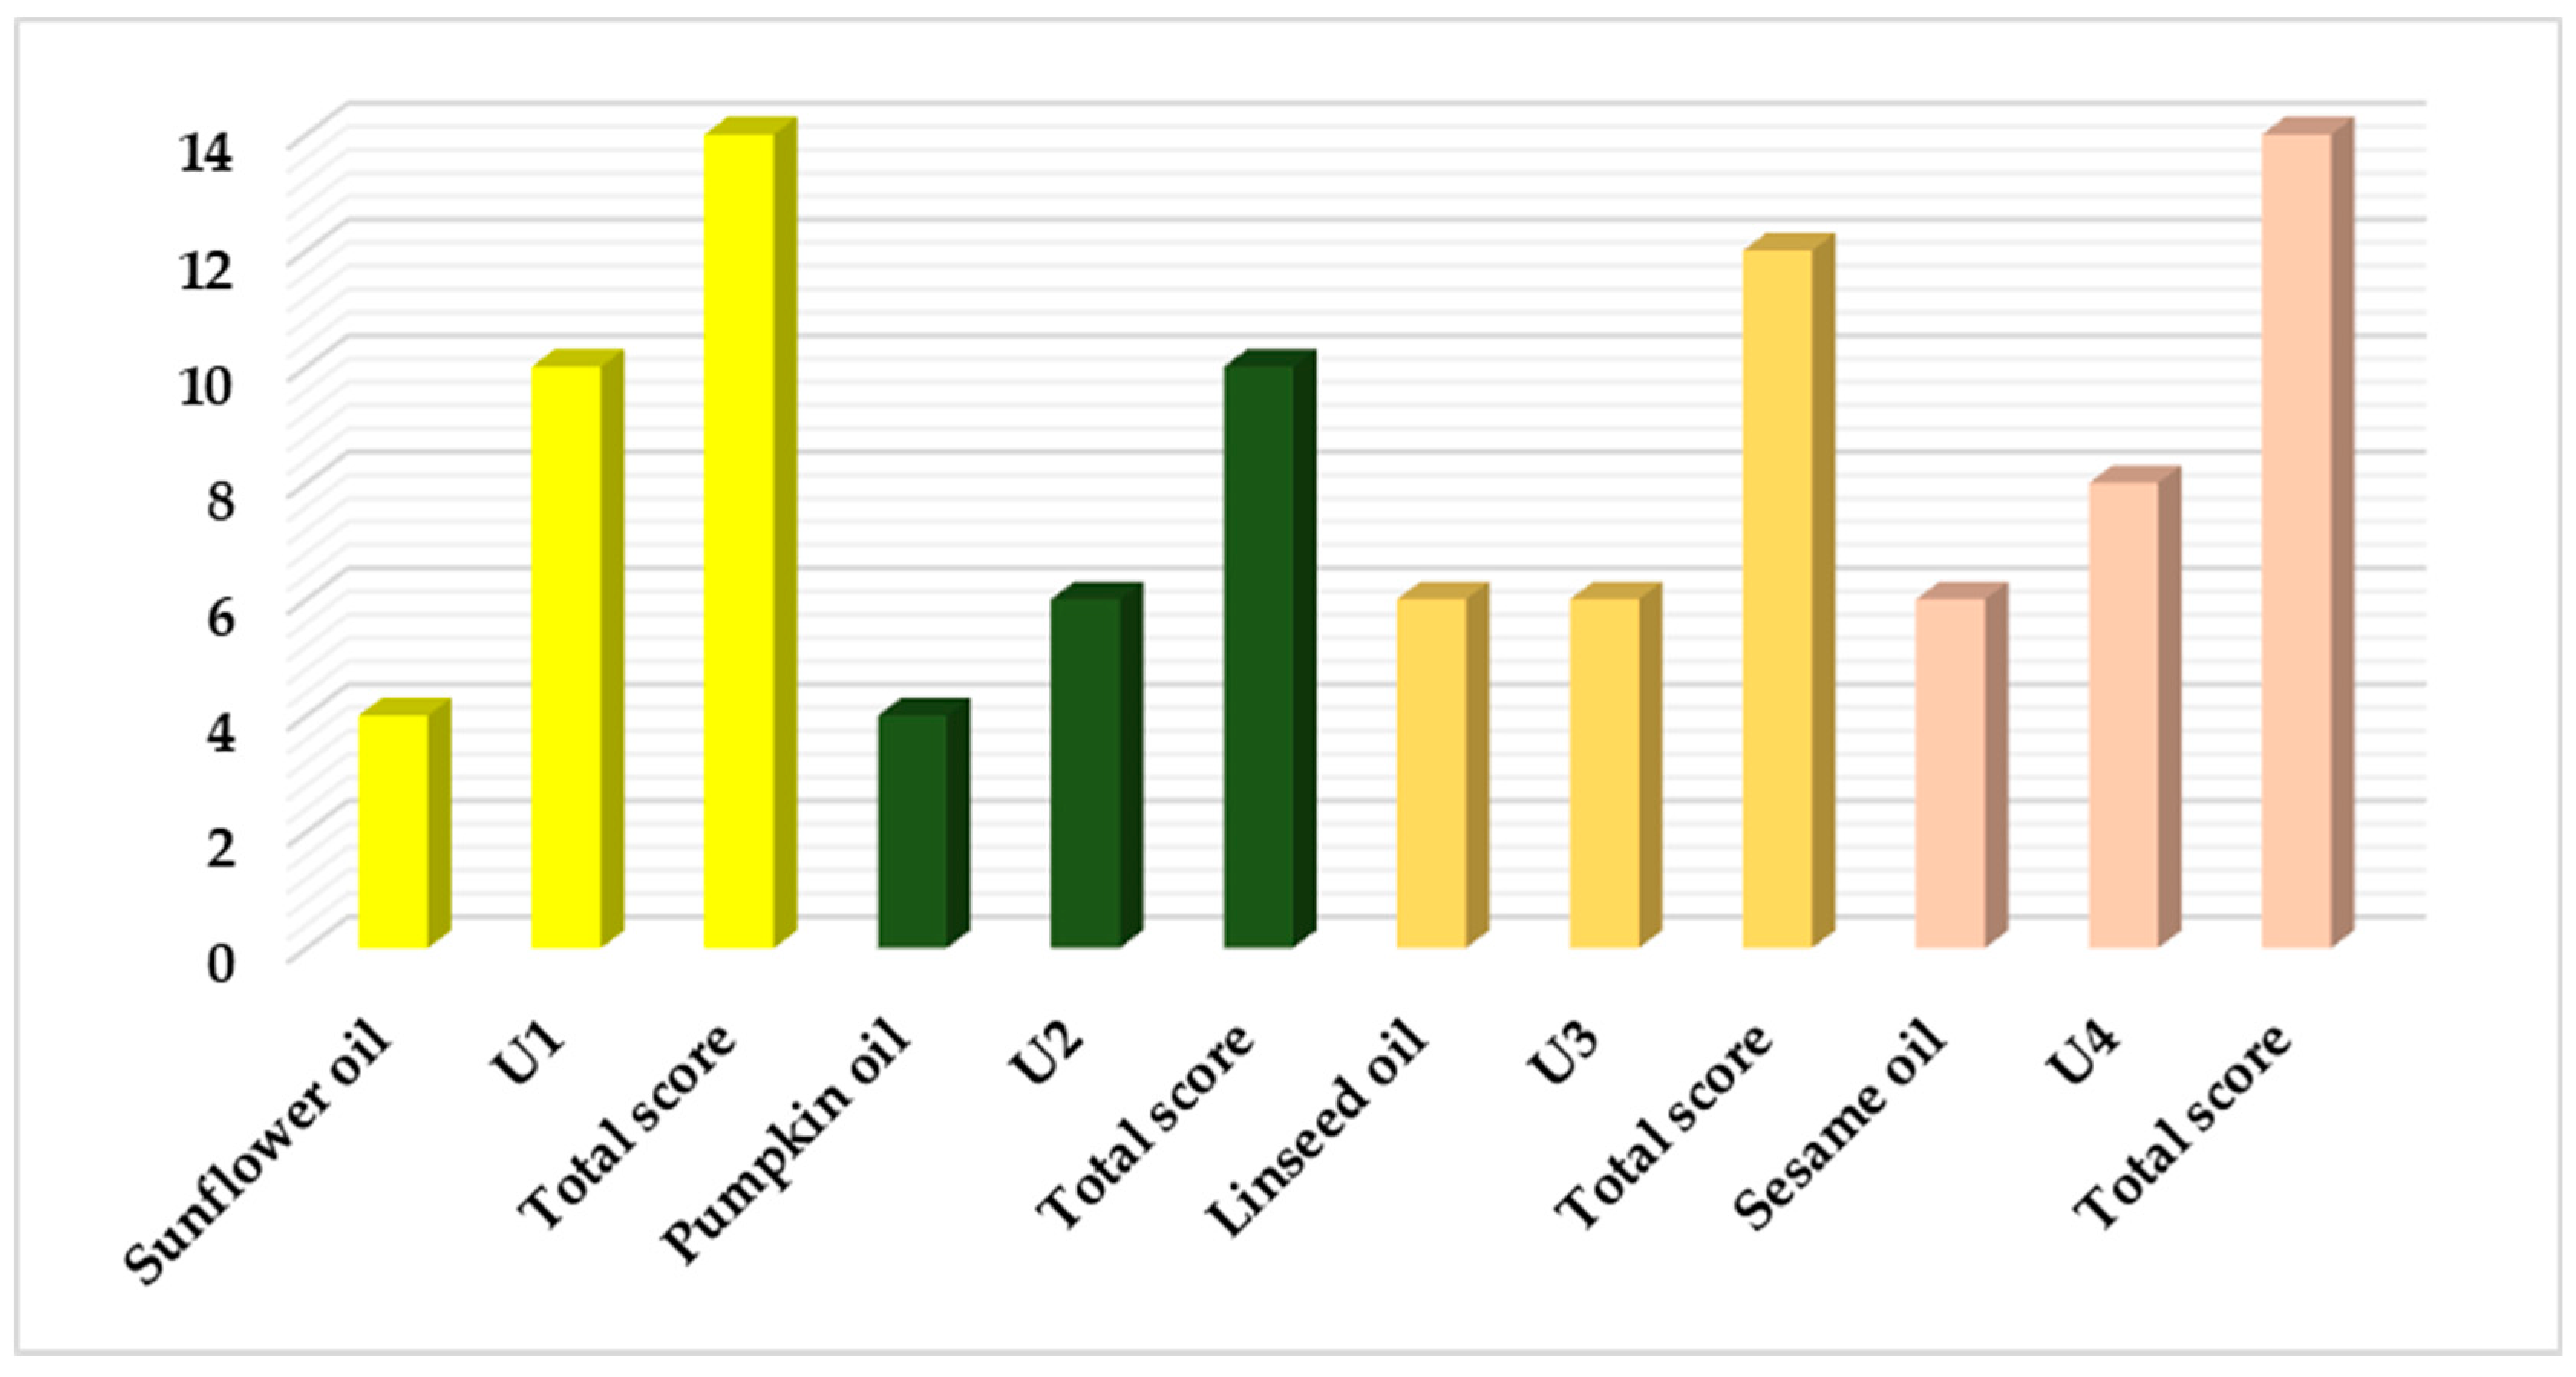
Figure 4.
The emulsion type evaluation results through Method 1 (a, b) and Method 2 ©.
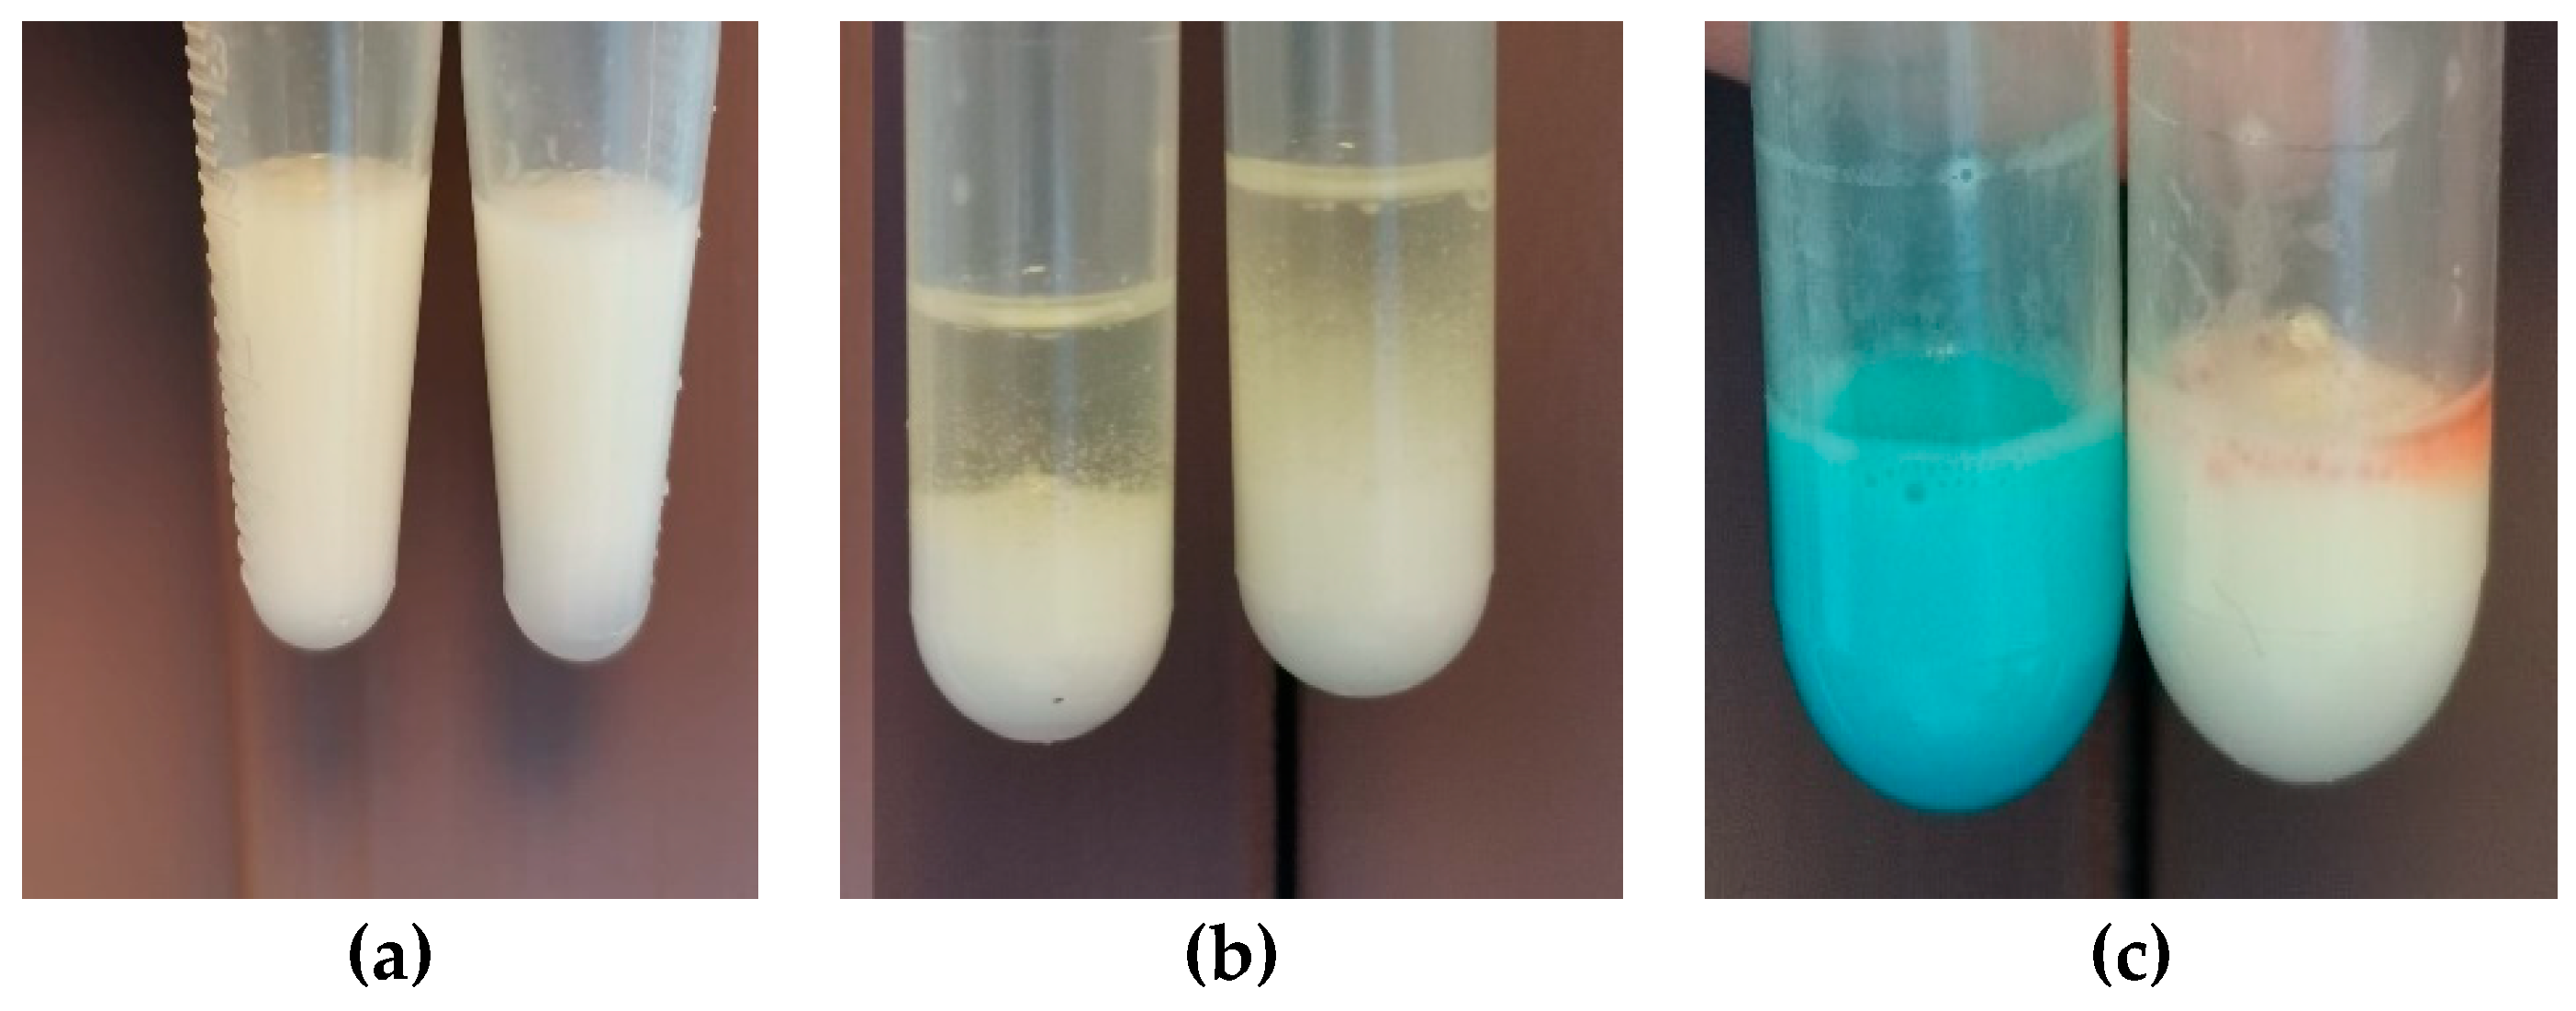
Figure 5.
The microscopic evaluation of the oily droplets and the particle size distribution for the ECBD (a),(c) and Eblank (b), (d).
Figure 5.
The microscopic evaluation of the oily droplets and the particle size distribution for the ECBD (a),(c) and Eblank (b), (d).
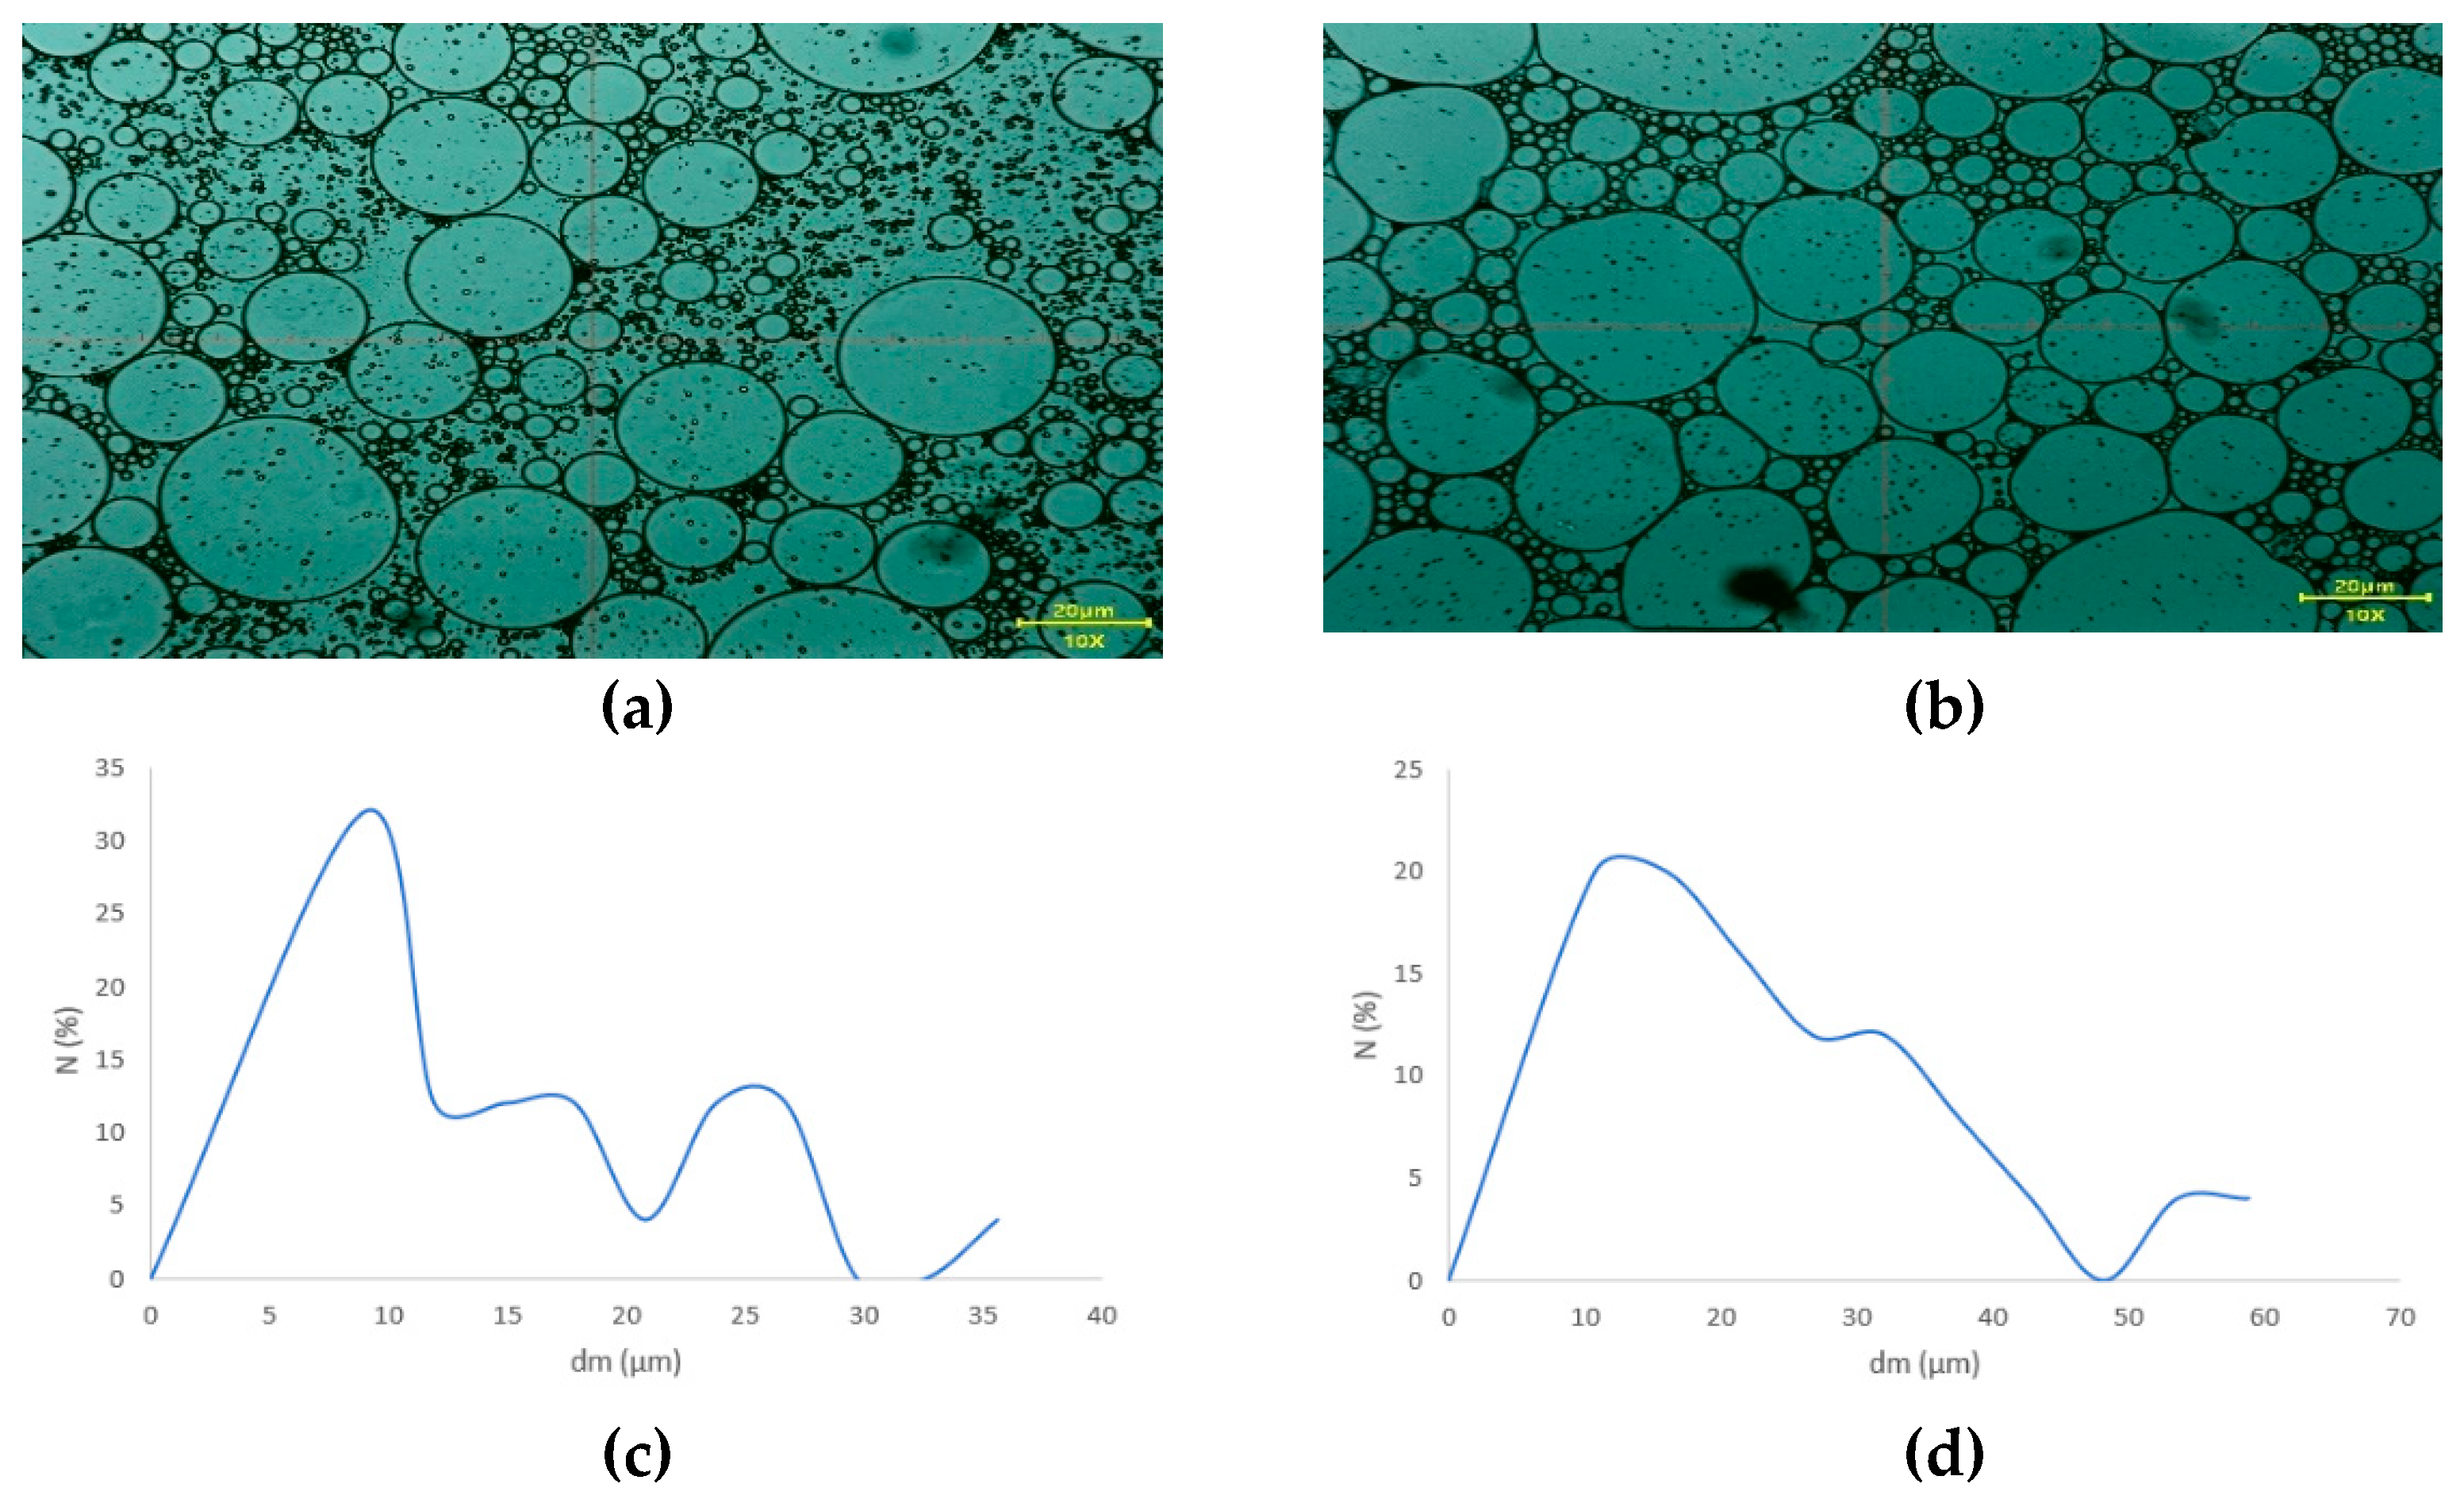
Figure 6.
T-test statistical evaluation of the extraction method.
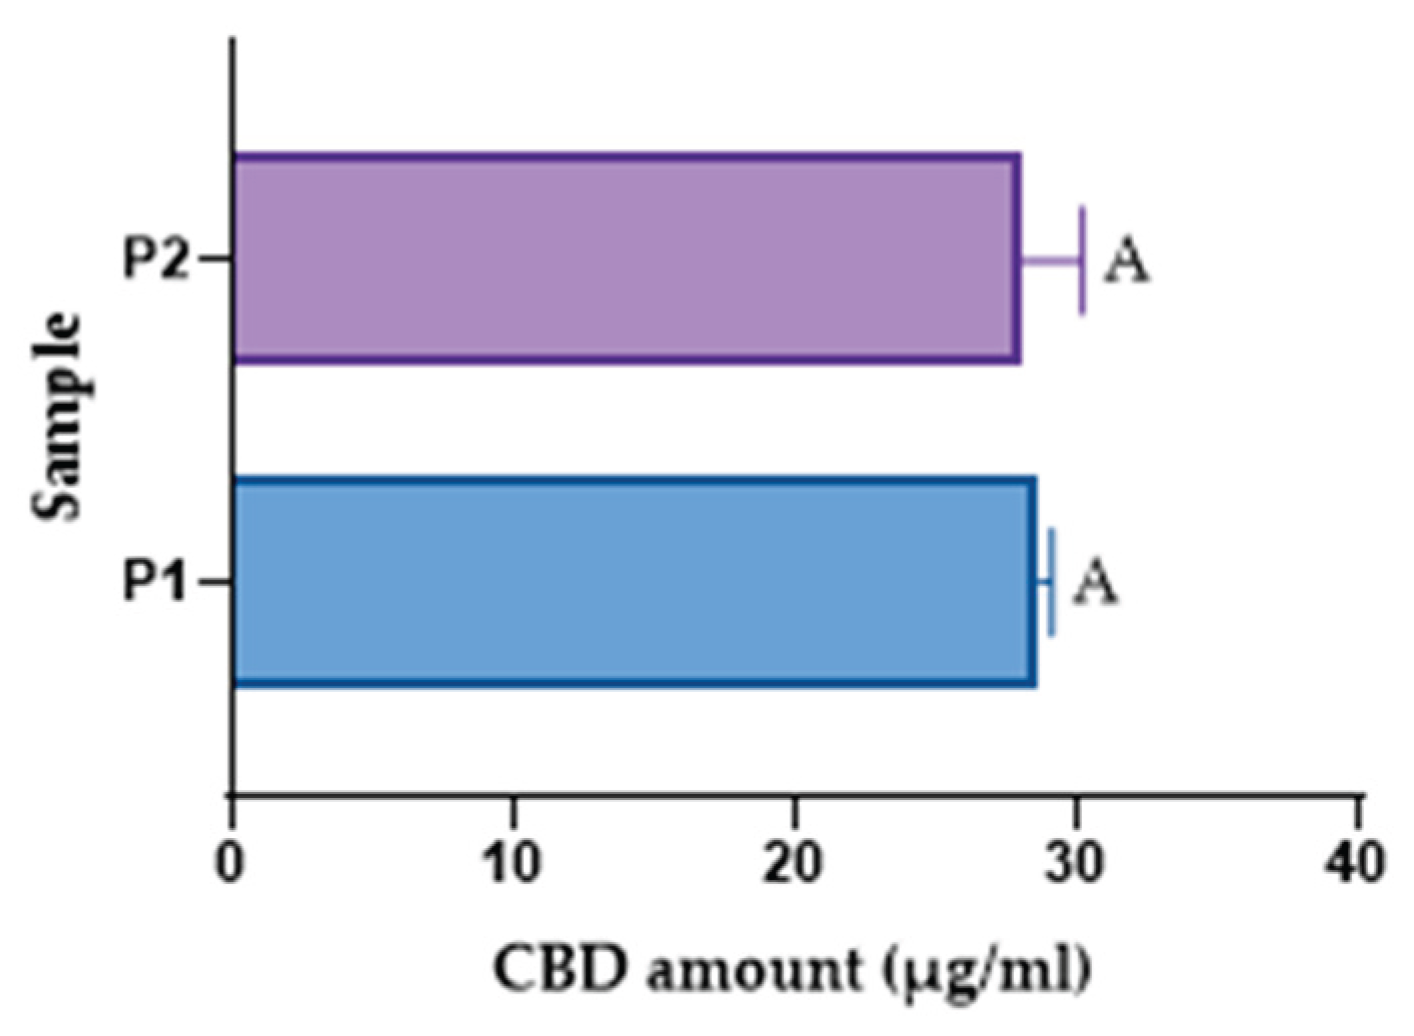

Table 1.
The score repartition for the blank oils and CBD oils.
| Parameters | Range 1 | Score | Range 2 | Score | Range 3 | Score |
| Oils | ||||||
| Density | ±5% | 2 | ±5.01%-10% | 1 | >10% | 0 |
| Acid index | ±10% | 2 | ±10.01-15% | 1 | >15% | 0 |
| Saponification index | ±10% | 2 | ±10.01-15% | 1 | >15% | 0 |
| Peroxide index | ±10% | 2 | ±10.01-15% | 1 | >15% | 0 |
| Ester index | ±10% | 2 | ±10.01-15% | 1 | >15% | 0 |
| Maximum score | 10 | |||||
| CBD-oils | ||||||
| Assay method | Spectrophotometric | 2 | HPLC | 1 | None | 0 |
| Color | Corresponds | 2 | Not corresponding | 0 | ||
| Smell | Corresponds | 2 | Not corresponding | 0 | ||
| Aspect | Corresponds | 2 | Not corresponding | 0 | ||
| Stability study | 3 months | 2 | 2 months | 1 | 1 month | 0.5 |
| Maximum score | 10 | |||||
Table 2.
The amount of ingredients used to develop the CBD-emulsions.
|
Emulsion codes / Ingredients |
CBD | Ultrapure water | Sunflower oil | Tween 80 | Span 80 | Vitamin E | Cosgard |
| mass (g) | |||||||
| E3%a E3%m |
/ | 9.76 | 9.64 | 0.23 | 0.36 | ||
| E4%a E4%m |
/ | 9.69 | 9.52 | 0.31 | 0.48 | ||
| E5%a E5%m |
/ | 9.60 | 9.40 | 0.40 | 0.60 | ||
| E10%a E10%m |
/ | 9.20 | 9.20 | 0.80 | 1.20 | ||
| ECBD | 4.76 | 9.58 | 9.41 | 0.31 | 0.48 | 0.02 | 0.2 |
| Eblank | / | 11.96 | 11.79 | 0.31 | 0.48 | 0.02 | 0.2 |
Table 3.
Preparation method and the amount of emulsifier used to obtain the heterogeneous formulation.
Table 3.
Preparation method and the amount of emulsifier used to obtain the heterogeneous formulation.
| Code | Method used | Emulsifier concentration |
| E3%m | mortar trituration | 3% |
| E3%a | magnetic stirring | 3% |
| E4%m | mortar trituration | 4% |
| E4%a | magnetic stirring | 4% |
| E5%m | mortar trituration | 5% |
| E5%a | magnetic stirring | 5% |
| E10%a | magnetic stirring | 10% |
Table 4.
Fatty oils density.
| Oil type | Density (g/mL) |
Ph. Eur. 11 stipulations Density (g/mL) |
% deviation | Mathematical scoring |
| Sunflower oil | 0.891 | 0.920 | 2.94 | 2 |
| Pumpkin oil | 0.894 | 0.919 | 2.72 | 2 |
| Linseed oil | 0.889 | 0.928 | 3.99 | 2 |
| Sesame oil | 0.886 | 0.918 | 3.49 | 2 |
Table 5.
The acid, saponification, ester, and peroxide values obtained for the selected oils and their mathematical scores.
Table 5.
The acid, saponification, ester, and peroxide values obtained for the selected oils and their mathematical scores.
| Indexes | Sunflower oil | Pumpkin oil | Linseed oil | Sesame oil | ||||
| Obtained | Ph. Eur. Stip. | Obtained | Ph. Eur. Stip. | Obtained | Ph. Eur. Stip. | Obtained | Ph. Eur. Stip. | |
| Acid value | 0.27±0.02 | ≤0.6 mg KOH/g | 4.22±0.66 | 2-4 mg KOH/g | 0.69±0.14 | ≤4 mg KOH/g | 0.83±0.16 | ≤1.5 mg KOH/g |
| Score | 2 | 2 | 2 | 2 | ||||
| Saponification value | 76.05±10.73 | 188-194 mg KOH/g | 98.39±4.21 | 185-195 mg KOH/g | 227.82±1.18 | 189-197 mg KOH/g | 87.21±6.19 | 188-193 mg KOH/g |
| Score | 0 | 0 | 0 | 0 | ||||
| Ester value | 75.78 | 187-193 mg KOH/g | 94.17 | 181-191 mg KOH/g | 227.13 | 185-193 mg KOH/g | 86.38 | 187-192 mg KOH/g |
| Score | 0 | 0 | 0 | 0 | ||||
| Peroxide value | 38,78±0,84 | ≤ 10 meq O2/kg | 22,06±1,67 | ≤ 15 meq O2/kg | 8,17±0,82 | ≤ 15 meq O2/kg | 3,77±0,009 | ≤ 10 meq O2/kg |
| Score | 0 | 0 | 2 | 2 | ||||
| Total score | 2 | 2 | 4 | 4 | ||||
Table 6.
The spectrophotometric CBD assay and the % deviation from the theoretical concentration.
| Oil type | Determined concentration (µg/mL) | Theoretical concentration (µg/mL) | % deviation |
| U1 | 86.47 | 89.10 | -2.95 |
| U2 | 123.94 | 88.92 | +39.4 |
| U3 | 70.51 | 89.38 | -21.1 |
| U4 | 53.44 | 88.56 | -39.7 |
Table 7.
The stability of the oils at 1 (T1), 2 (T2), and 3 (T3) months, and their method and stability score.
Table 7.
The stability of the oils at 1 (T1), 2 (T2), and 3 (T3) months, and their method and stability score.
| Oil type | T1 (µg/ mL) | T1 % deviation | T2 (µg/ mL) | T2 % deviation | T3 (µg/ mL) | T3 % deviation | Theoretical (µg/mL) | Method Score | Stability Score |
| U1 | 48.44 | +8.73% | 47.30 | +6.18% | 45.48 | +2.09% | 44.55 | 2 | 2 |
| U2 | 88.45 | +99.0% | 53.44 | +20.2% | 10.16 | −77.1% | 44.46 | 0 | 0 |
| U3 | 66.39 | +48.6% | 60.94 | +36.4% | 34.97 | −21.7% | 44.69 | 0 | 0 |
| U4 | 40.59 | −8.3% | 46.95 | +6.0% | 37.56 | −15.2% | 44.28 | 1 | 1 |
Table 8.
The stability index for the selected formulations.
| Emulsion type | S% after 1h | S% after 2h | S% after 24h |
| E3%m | 79,50 | 34,43 | 15,98 |
| E3%a | 95,90 | 93,85 | 18,03 |
| E4%m | 71,07 | 42,14 | 17,35 |
| E4%a | 95,86 | 93,80 | 23,55 |
| E5%m | 62,5 | 52,08 | 41,66 |
| E5%a | 58,33 | 45,83 | 33,33 |
| E10%a | 60,86 | 47,82 | 19,56 |
Table 9.
Concentration of CBD in emulsions determined by HPLC.
| Sample | Mean concentration (µg/ mL) | Theoretical concentration (µg/ mL) |
| P1 (magnetic, shaken) | 28.68 ± 1.72 | 23.8 |
| P2 (magnetic, static) | 28.00 ± 1.80 |
Disclaimer/Publisher’s Note: The statements, opinions and data contained in all publications are solely those of the individual author(s) and contributor(s) and not of MDPI and/or the editor(s). MDPI and/or the editor(s) disclaim responsibility for any injury to people or property resulting from any ideas, methods, instructions or products referred to in the content. |
© 2025 by the authors. Licensee MDPI, Basel, Switzerland. This article is an open access article distributed under the terms and conditions of the Creative Commons Attribution (CC BY) license (https://creativecommons.org/licenses/by/4.0/).
Copyright: This open access article is published under a Creative Commons CC BY 4.0 license, which permit the free download, distribution, and reuse, provided that the author and preprint are cited in any reuse.


