Preprint
Article

This version is not peer-reviewed.

Epiphytic Habit and Spatial Distribution Patterns of Phalaenopsis deliciosa and Phalaenopsis hainanensis

A peer-reviewed article of this preprint also exists.

Submitted:

05 November 2025

Posted:

05 November 2025

You are already at the latest version

Abstract

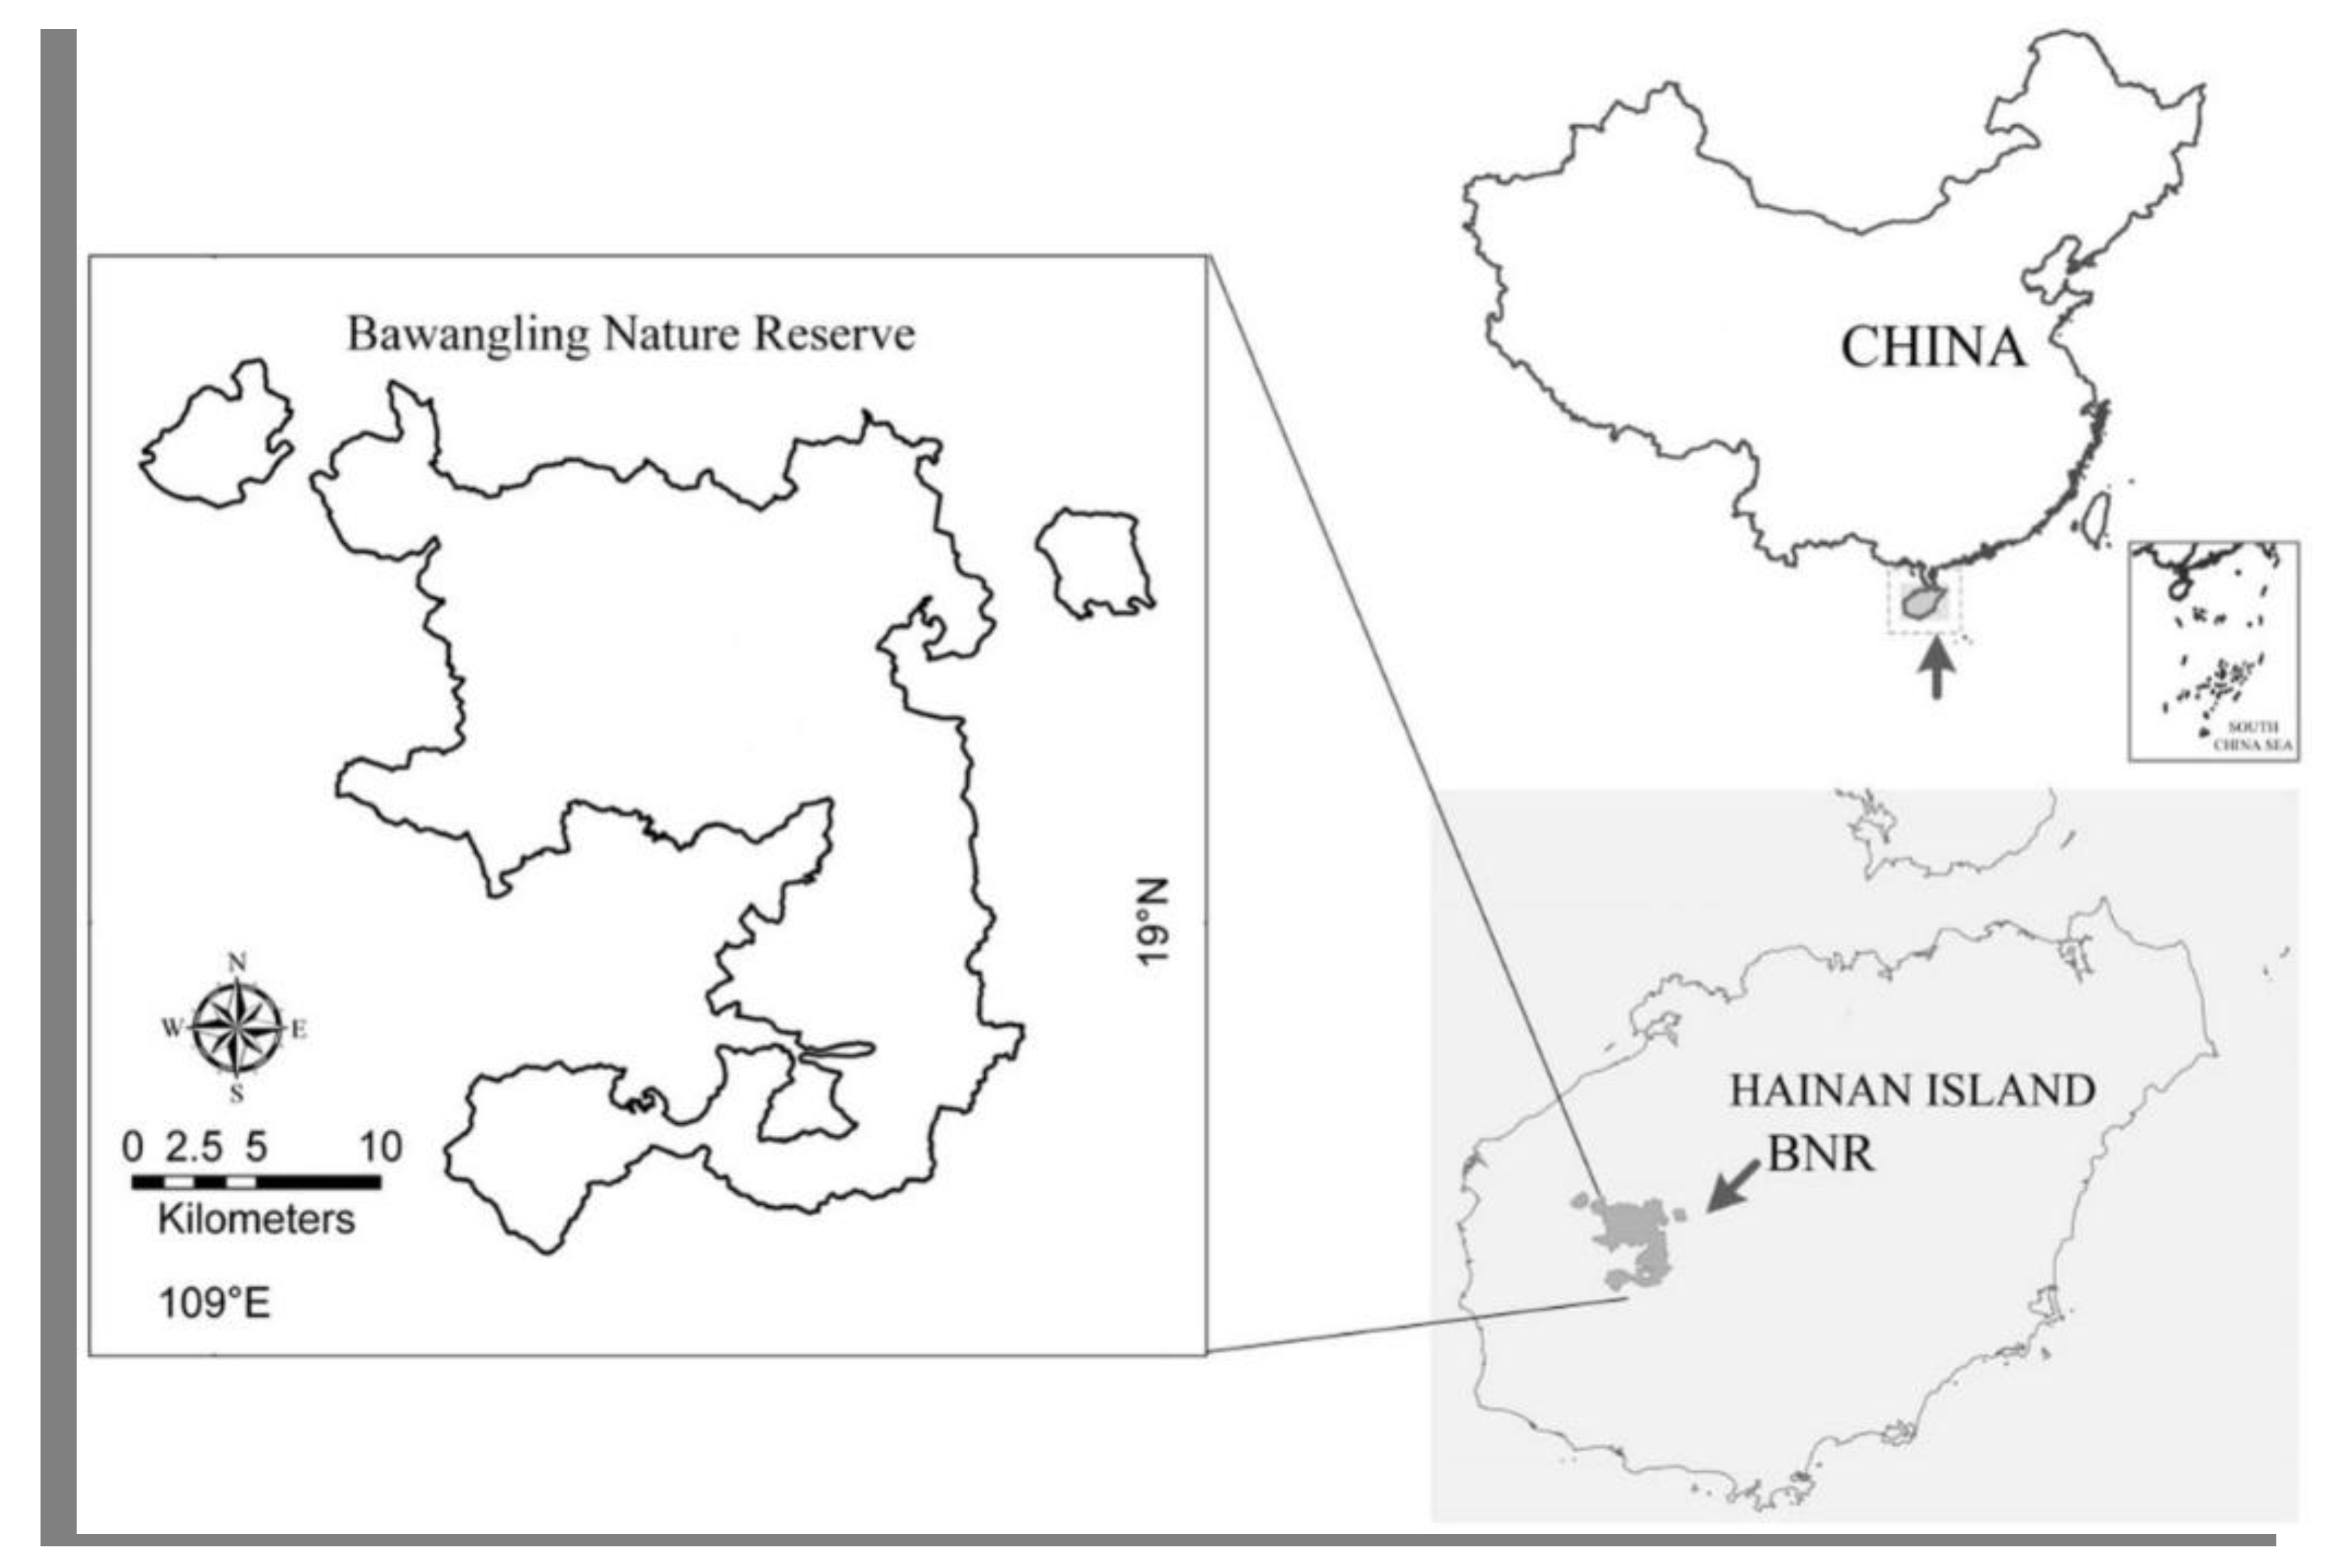
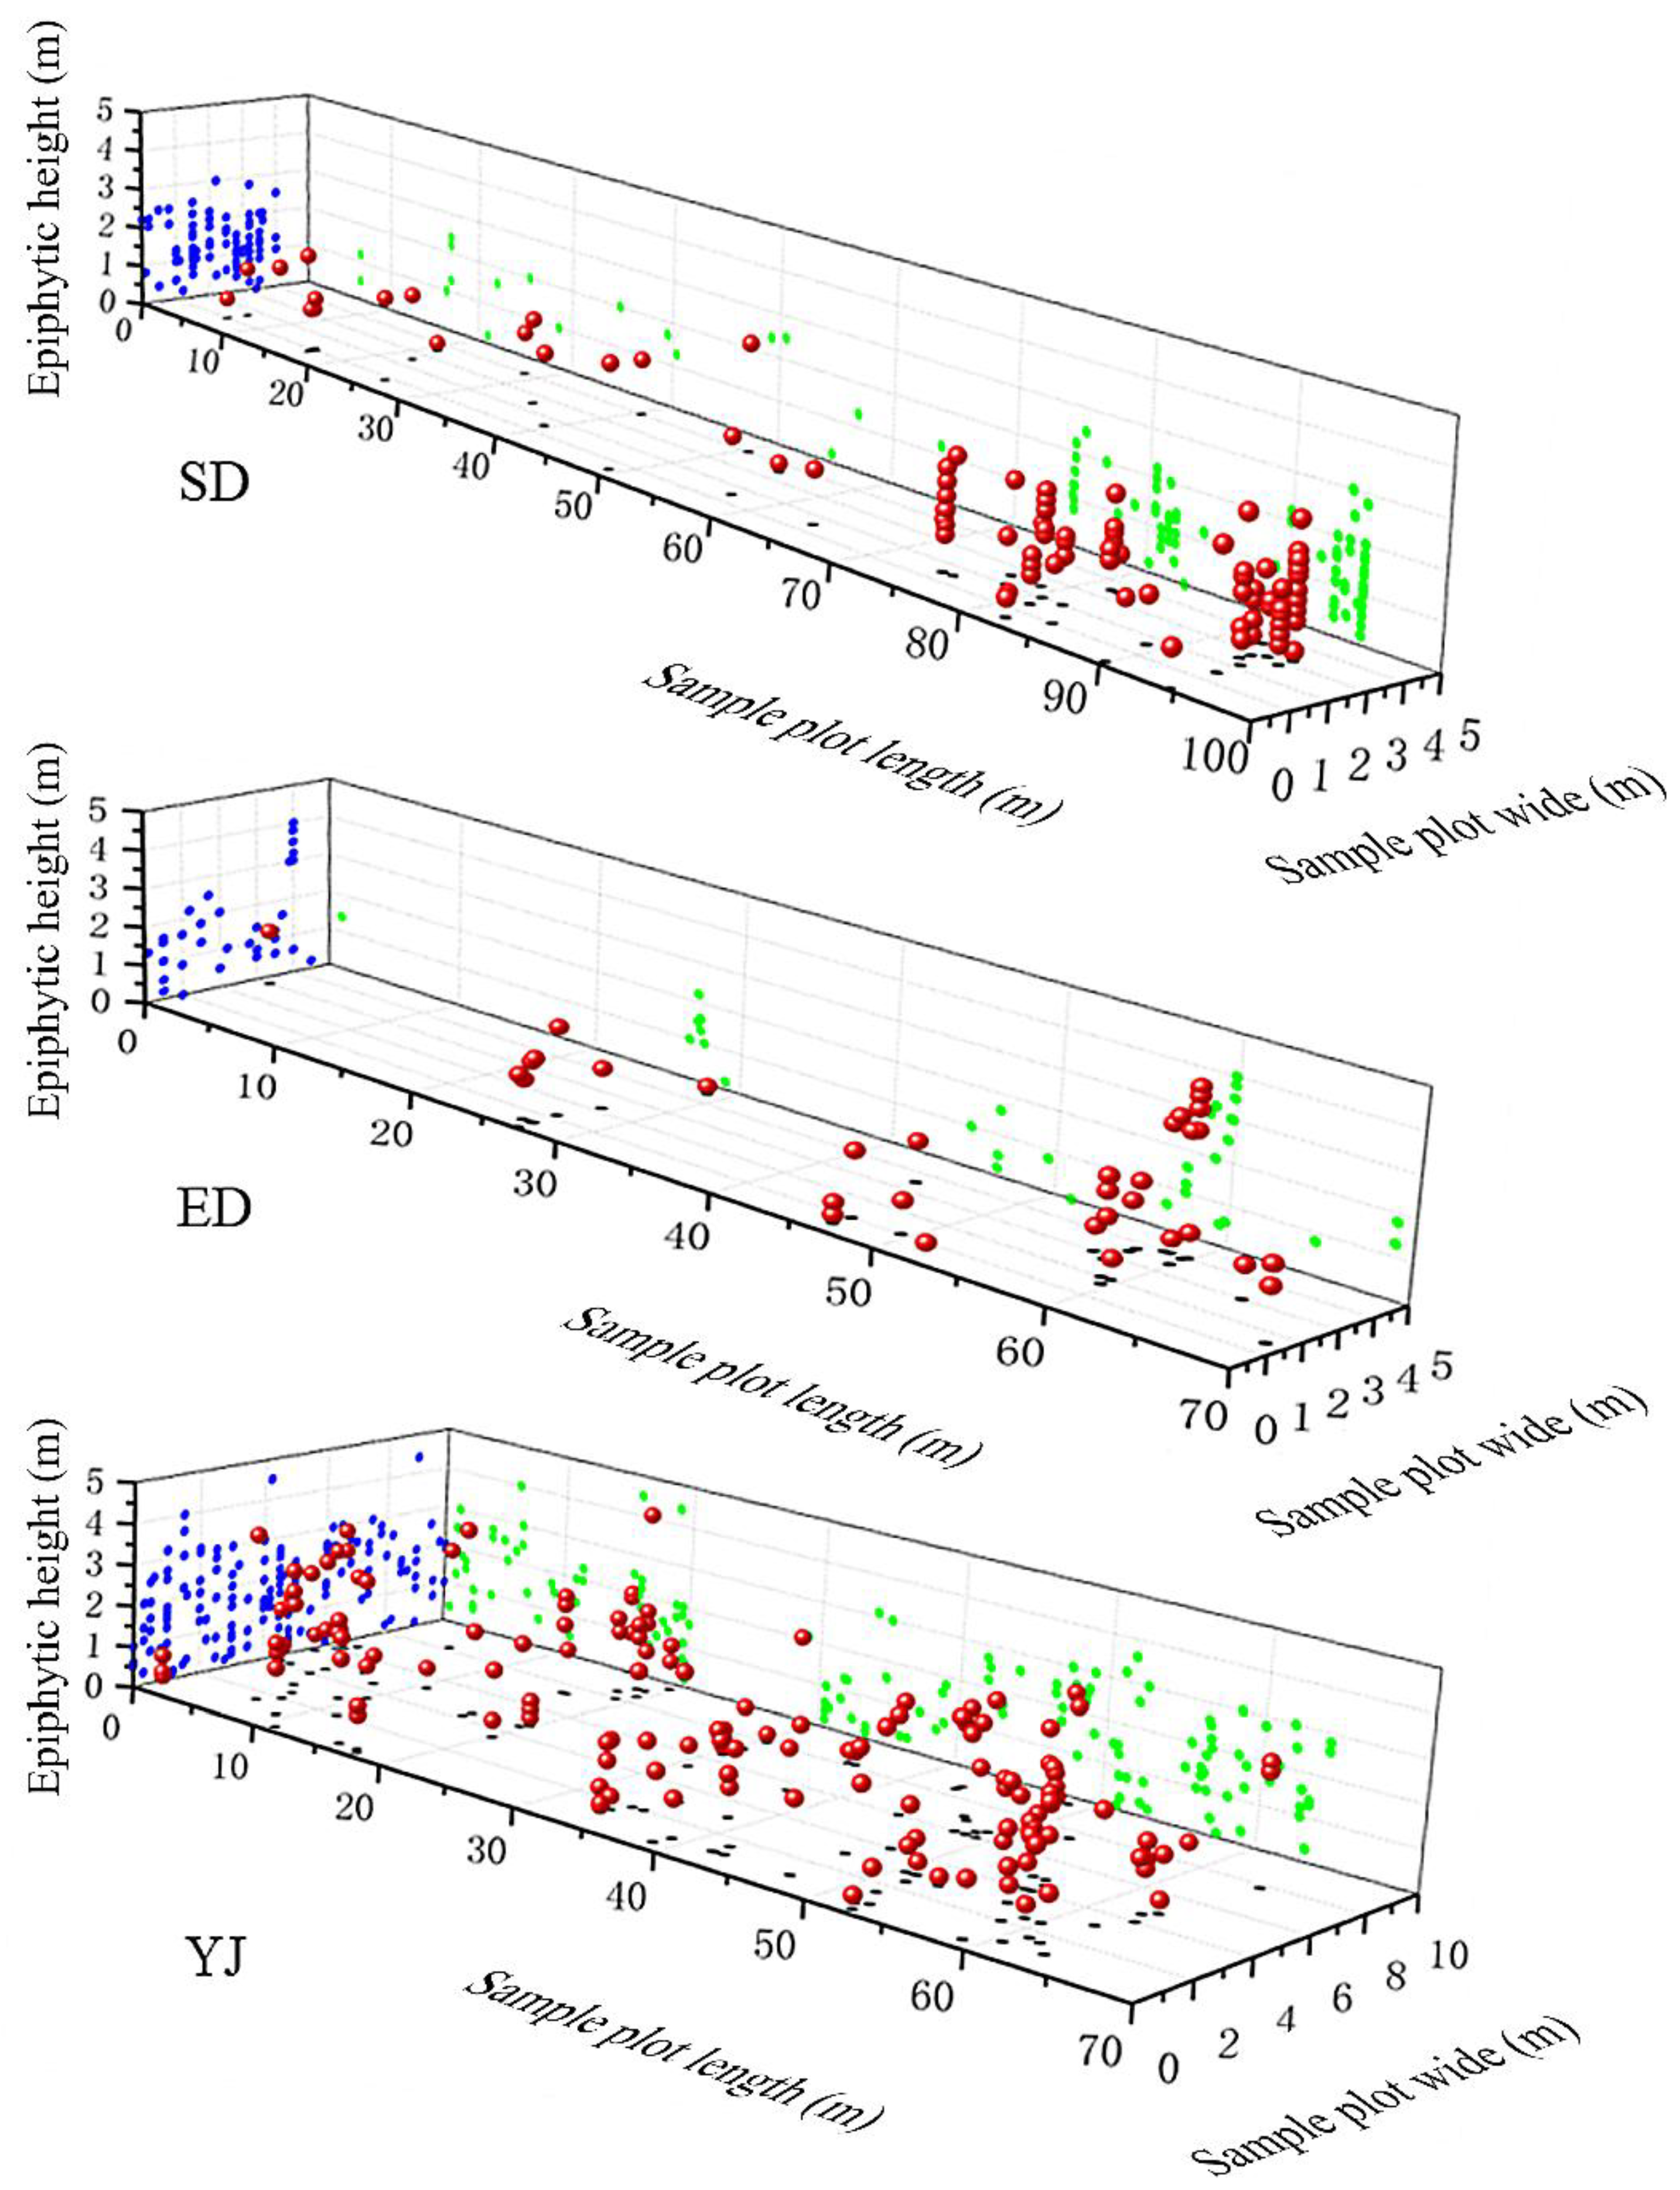
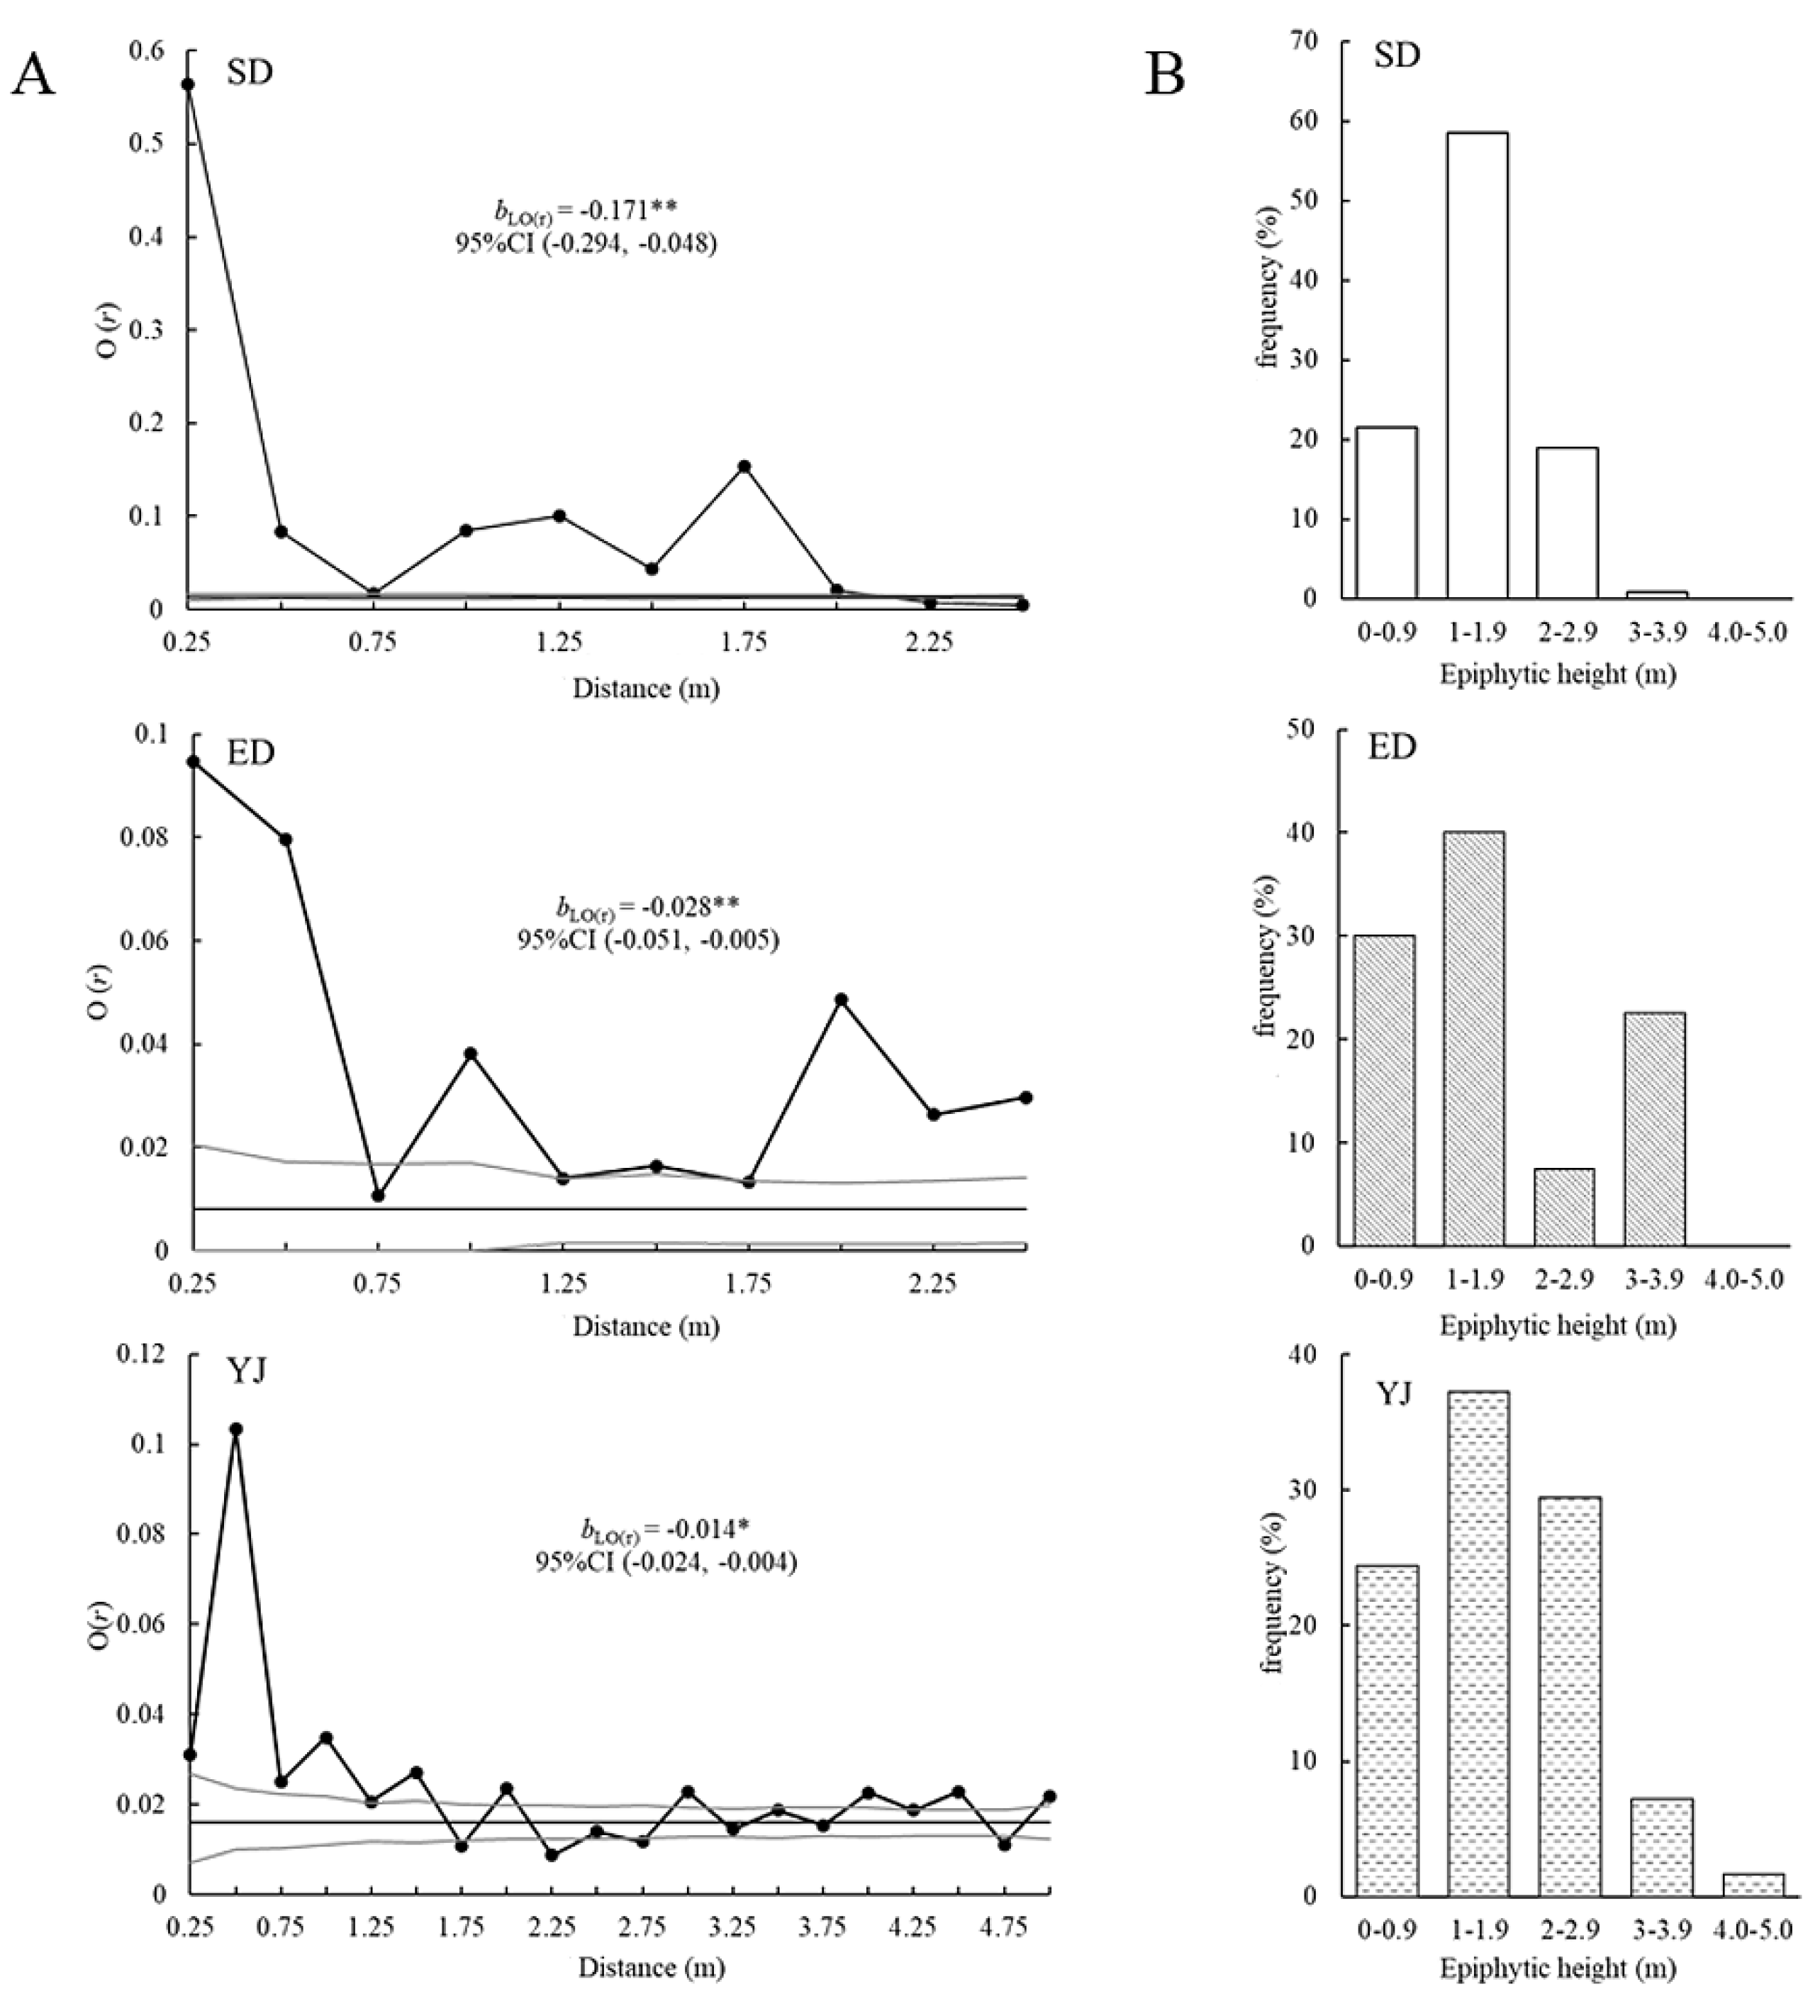
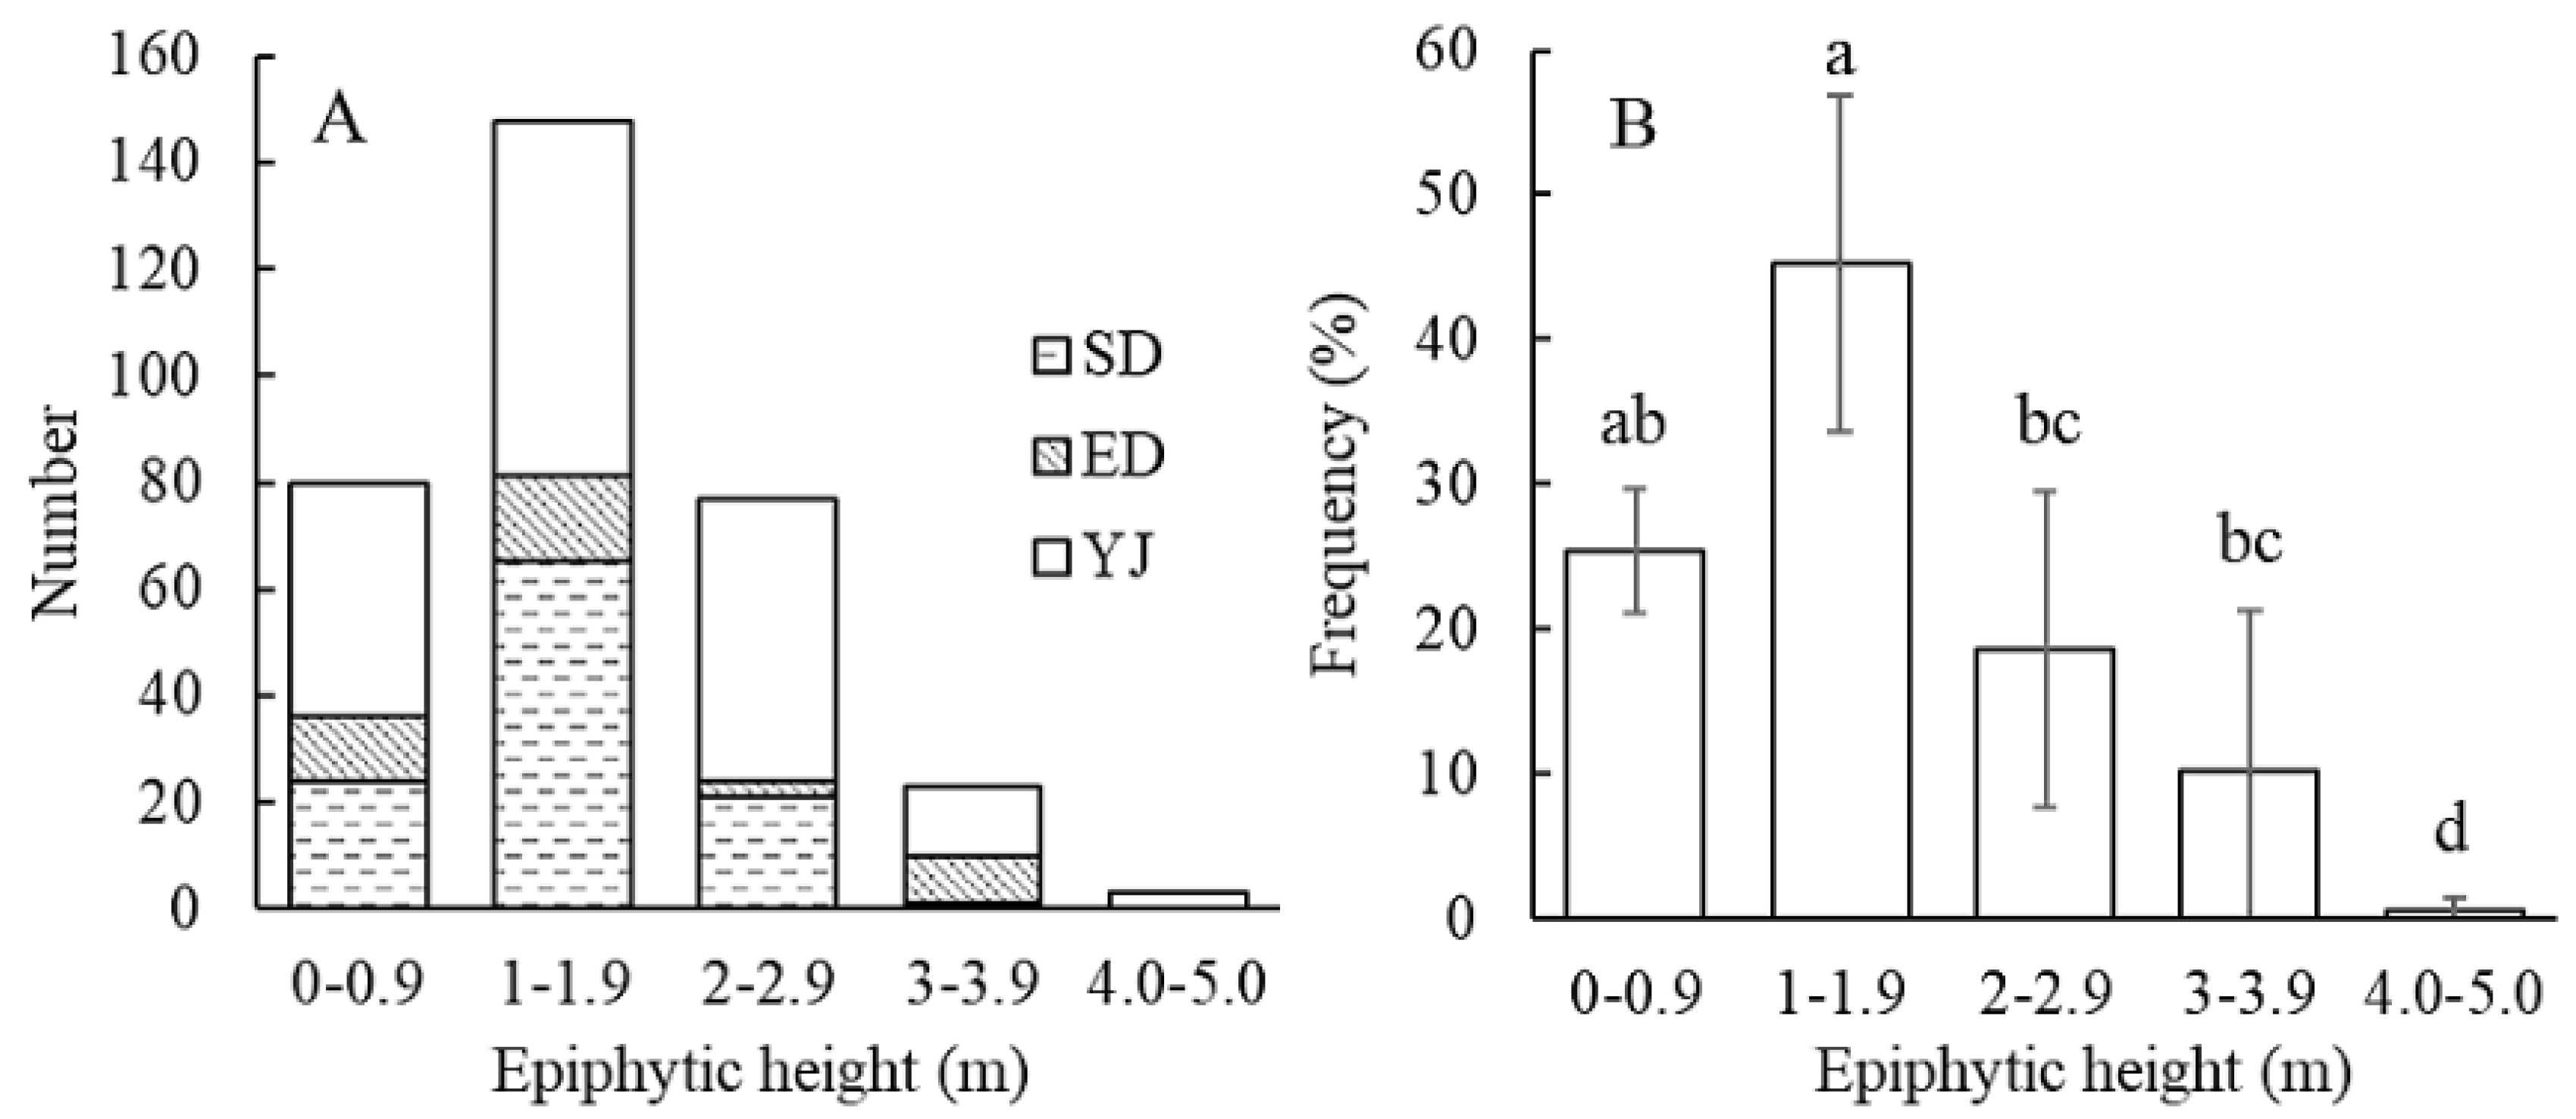
Epiphytic orchids are the largest group of epiphytes and are important components of forest species diversity. Epiphytic orchids show host preferences. Their growth may be influenced by many factors, that could also affect their spatial distribution. In this study, the habitat community structure and epiphytic habits of epiphytic orchids, Phalaenopsis deliciosa (P. deliciosa) and Phalaenopsis hainanensis (P. hainanensis), distributed on Hainan Island were investigated. The results show that the vascular plants in the communities of P. deliciosa and P. hainanensis are mainly distributed in tropical Asia and pantropical areas. A total of 41 species of epiphytic hosts for P. deliciosa were found, and a total of 17 species of epiphytic hosts for P. hainanensis were found. Both P. deliciosa and P. hainanensis showed a high epiphytic preference for S. ilicifolius. The horizontal distribution of P. deliciosa and P. hainanensis showed small-scale aggregations. In the vertical distribution of the P. hainanensis, the individual plants are distributed below 5 m, and are mainly in the height region of 1–1.9 m; individual plants of P. hainanensis are distributed below 4 m and there is no significant difference in the number of distributions between the distribution intervals. Heights of 0–0.9 m and 2–2.9 m were the most abundant. In summary, the height distribution of the two Phalaenopsis species are both low, which might be because the main epiphyte-preferred tree species are shrubs and small trees, and their growth heights are low. The protection of the habitat plant community, especially the preferred epiphytic tree species or companion plants, should be strengthened to conserve the Phalaenopsis species.

Keywords: 
;  ;  ;  

1. Introduction

Epiphytes are significant and characteristic components of tropical rain forests. They play an important role in maintaining forest species diversity and ecosystem functions, such as carbon sequestration, water, and nutrient cycling [1]. About 7.5% of vascular plants are epiphytes [2,3] and most of them are found in 876 genera of 84 families [4]. Orchidaceae plants are widely distributed in various terrestrial ecosystems except for polar and extremely arid regions and are one of the most evolved and advanced groups in plants. The morphological and physiological characteristics of most orchids are particularly suitable for existing as epiphytes and using other plants as hosts, making them the most species-rich group of epiphytes. About 70% of orchids are epiphytes, accounting for about 60% of all epiphytes [5], and almost all of them are distributed in humid tropical regions with rich diversity [6]. On average, there are more epiphytic species of Orchidaceae than terrestrial species at the genus level [7]. The epiphytic Orchidaceae have higher rates of speciation and diversification than terrestrial orchids [8]. The epiphytic habit is a significant evolutionary characteristic of orchids, affecting the survival, formation, proliferation, and differentiation of orchid species. However, due to the ecological specialization of orchids, they also have very high requirements on the epiphytic environment, and most of them grow slowly [9,10]; The epiphytic orchid population is endangered due to environmental damage and human activities.
Although the vascular structures of epiphytes and their host plants are independent, some epiphyte orchids show preferences in their host selection [4]. This preference is influenced by many factors, including the microenvironment [11], the physicochemical properties of the host bark [12], and the distribution of symbiotic fungi [13]. The spatial distribution of orchids is related to mycorrhizal fungi. Their enrichment leads to the spatially aggregated distribution on a small scale in adult plants [14]. Many studies have shown that the formation process of the spatial distribution pattern of plant populations in nature is complex. It is also affected by a variety of abiotic and biotic factors such as environmental factors, human disturbance, animal transmission capacity, and interspecific competition. Studying the spatial distribution pattern of plant populations allows understanding the biological characteristics of plant populations, the interaction between these populations, and the relationship between populations and the environment [15]. The regeneration strategy of plant populations based on changes in the spatial distribution pattern could be obtained. Investigating the spatial distribution of the orchids is of great significance for exploring the formation and maintenance mechanisms of the plant community and its biodiversity.
Due to their extremely high ornamental value, wild populations of Phalaenopsis from the tropical rainforests in Southeast Asia to Hainan Island on the northern edge of the tropics have suffered a devastating reduction in numbers and destruction since the mid-18th century [16]. There are three kinds of Phalaenopsis distributed in Hainan Island, namely Phalaenopsis pulcherrima (P. pulcherrima), and Phalaenopsis deliciosa (P. deliciosa) Phalaenopsis hainanensis (P. hainanensis). Among them, P. pulcherrima is a petrophyte, and P. deliciosa and P. hainanensis are epiphytes.
In this study, the composition of the habitat plant communities of P. deliciosa and P. hainanensis were studied by setting up transects or quadrants in the Bawangling area of Hainan. The community floristic characteristics, epiphytic characteristics, and spatial distributions of P. deliciosa and P. hainanensis were investigated. The results of this study provide insight into the epiphytic habit, the structure of the orchid community in the habitats, population distribution, and ecological functions of P. deliciosa and P. hainanensis, and may be utilized to develop strategies for the conservation of orchids. Therefore, the objectives of this study were to (1) analyze the community structure and floristic composition of the habitats of Phalaenopsis deliciosa and P. hainanensis; (2) evaluate their epiphytic host preferences; and (3) characterize their horizontal and vertical spatial distribution patterns to provide insights into their adaptive strategies and conservation.

2. Materials and Methods

2.1. Materials

The Bawangling Branch of Hainan Tropical Rainforest National Park is located in the southwest of Hainan Island (18°53′–19°20′ N, 108°58′–109°53′ E) (Figure 1). In this study, three natural populations of P. deliciosa and two natural populations of P. hainanensis were investigated. Transects and quadrants were established according to the terrain and species distribution. The total areas of the transects and quadrats were 1550 m2 and 900 m2, respectively (Table 1, Figure 2). P. deliciosa, epiphytes growing on tree trunks or valley rocks in montane forests at an altitude of 100 –1100 m, are widely distributed as far west as southern India and Sri Lanka, as far north as the tropical Himalayas and Yunnan, China, as far south as Indonesia, and as far east as the Philippines, which are in the tropical and subtropical regions of Asia [17]. P. deliciosa are distributed in Ledong, Changjiang, Sanya, and other places on Hainan Island, China. P. hainanensis, epiphytes growing on tree trunks or subterranean-forest rocks in mountain forests at an altitude of 600–1 300 m, are commonly found in limestone areas, and distributed in Ledong, Baisha, Changjiang, and other places on Hainan Island, China [17].

2.2. Data Processing and Analysis

2.2.1. Plant Community Structure

Plant community structure refers to the state of configuration of individual species in a community in space. The following are definitions of terms.
Frequency = the number of quadrats in which a particular plant species is found / the total number of quadrats surveyed. Coverage = (vertical projected area of the aerial part of the plants of a certain species/ quadrats area) ×100%.
Abundance = the number of plants of a certain species in a plot.
Relative frequency (RF) = (frequency of a certain species/sum of frequencies of all species) × 100%.
Relative coverage (RD) = (coverage of a certain species/total coverage of all species of the plot) ×100%.
Relative abundance (RA) = (the number of plants of a certain species in the plot / the total number of plants of this species in all surveyed plot) × 100%.
The importance values were calculated according to the following equation [15,19]: IM = (RF+RD+RA)/3, where IM stands for importance value; RF is the relative frequency; RD is the relative coverage; RA is the relative abundance. The larger the IM value is, the higher the dominance of the species in the community. The relative tree coverage is calculated by using the projected area of the tree canopy over the total area; the relative coverage of the shrub layer is calculated by using the projected area of the shrub layer over the total area [20]. The herbaceous layers of the two species had fewer plant species, and no statistical calculations were performed.
The areal type distribution of the seed plant families was identified according to the method published by Zhengyi Wu (2011)[21].

2.2.2. The Eepiphytic Selectivity Index

According to the equation reported in the literature by Xiqiang Song (2005)[22], the epiphytic selectivity index Esi was calculated to evaluate the selection preference and dependence of epiphytic plants on the host tree.
The epiphytic index (Esi) is determined by using 1/3 of the sum of the relative abundance (RA), the relative prominence (RP), and the relative frequency (RF).
The abundance refers to the number of individuals of the host tree species that support the epiphyte in the community; the frequency is the ratio of the number of individuals of the host tree species that host epiphytes to the total number of individuals of the host tree species in the community; prominence refers to the total number of individuals of epiphytes on the host tree species. Relative abundance RHA, relative frequency RHF, and relative dominance RHP are calculated as follows:
Relative abundance of the host trees (RHA) = the number of individuals with epiphytes on the host tree ÷ the total number of host trees with epiphytes in a specific community × 100%
Relative frequency of the host trees (RHF) = frequency of epiphytes on this host tree ÷ sum of frequencies of all host trees with epiphytes in the community × 100%
Relative prominence of the host tree (RHP) = the total number of individuals of epiphytes on this host tree ÷ the total number of individuals of epiphytes on all hosts in the community × 100%
Excel 2016 was used for data processing and analysis.

2.2.3. Horizontal Spatial Distribution Pattern

The spatial distribution pattern and data analysis were performed using the PROGRAMITA software [23]. The non-cumulative univariate O-ring O(r) statistic [23] used to analyze the spatial distribution pattern of individuals in the population. The coordinates of the host tree species were used as the distribution focal points. The initial scanning radius to the focal point was set to 0.25 m, and the radius was gradually increased with a step size of 0.25 m. respectively; the maximum values of r for the 9 quadrants containing P. hainanensis were all set to 5 m. To avoid errors caused by the small number of samples, only the quadrant with 10 or more individuals (P1, P4, P5, and P6) were statistically analyzed. A Monte Carlo simulation was performed 999 times, using those individuals in the population that conformed to the Complete Spatial Randomness (CSR) as the null hypothesis. The lowest and highest values of the 25th simulation were used to determine the 95% confidence interval (CI). When O(r) is higher than the maximum value of the confidence interval, the distribution is an aggregated distribution; if O(r) is within the confidence interval, the distribution is a random distribution; if O(r) is lower than the minimum of the confidence interval, the distribution is a uniform distribution. The statistical results also give the first-order intensity ( λ) of the spatial point distribution pattern [23] slope bLO(r) and the 95% confidence interval (95% CI) were obtained by linear regression of the O(r) and ln(r) of each population using the SPSS 22.0 software; the regression slopes of different populations were also compared. The ORIGIN software was used to generate the 3D spatial distribution graphs.

2.2.4. Vertical Spatial Distribution Pattern

The unit epiphytic surveying height of each host plant was set to 1 m, and the distribution frequency of individuals of the epiphytes in each height unit was analyzed. Each transect or quadratic unit was analyzed for significant differences of the distribution frequency in the different height units and the vertical distribution characteristics of P. deliciosa and P. hainanensis were obtained. Significant difference analysis was performed using SPSS 22.0 software.

3. Results

3.1. Community Structure Composition

3.1.1. Habitat Community Composition of P. deliciosa

In the 3 surveyed transects of P. deliciosa (1550 m2 in total), there are 159 species of vascular plants in 53 families, 134 genera, including 2 families, 2 genera, and 2 species of ferns (Appendix 1). There are 22 monotypic families in the sample plots, accounting for 41.51% of the total number of families, and 116 monotypic genera, accounting for 72.96% of the total number of genera. The results indicate a scattered distribution of the families and genera of the P. deliciosa community. The dominant families in the community are Euphorbiaceae with 20 species (accounting for 12.58% of the total species), Rubiaceae with 15 species (accounting for 9.43% of the total species), Lauraceae with 10 species (accounting for 6.29% of the total species), and Annonaceae with 9 species (5.66% of the total).
A total of 72 plant species were counted in the tree layer of the YJ population, among which Streblus taxoides, Erismanthus sinensis, S. ilicifolius, and Hydnocarpus hainanensis had high importance values (>5%), and were the dominant species in the plant community of this population (Table 2). A total of 65 plant species was counted in the tree layer of the ED population, among which Mallotus peltatus and E. sinensis were the dominant species in the plant community of this population. A total of 42 plant species were counted in the tree layer of the SD population, where S. ilicifolius, Terminalia hainanensis, Dasymaschalon trichophorum, and Cleistanthus concinnus had an importance value of >5% and were the dominant species in the plant community of this population. Overall, S. ilicifolius, Streblus taxoides, and Terminalia hainanensis were the dominant species in the tree layer of the community where P. deliciosa resided (Table 2).
A total of 48 plant species were counted in the shrub layer of the YJ population, among which Schizostachyum pseudolima, S. ilicifolius, S. taxoides, and D. trichophorum were the dominant species in the plant community of this population (Table 3); a total of 32 plant species were counted in the shrub layer of the ED population, among which S. pseudolima and Licuala fordiana were the dominant species in the plant community of this population (Table 3); a total of 11 plant species were counted in the shrub layer of the SD population. S. ilicifolius, S. taxoides, T. hainanensis, D. trichophorum, C. concinnus, and Actephila merrilliana showed high important values (>5%) and were the dominant species of the plant community of this population (Table 3). Overall, Schizostachyum pseudolima, D. trichophorum, S. taxoides, S. ilicifolius, and Actephila merrilliana were the dominant species in the shrub layer of the community where P. deliciosa resided (Table 3).

3.1.2. The Composition of the Plant Community in P. hainanensis Plots

There are 61 species of vascular plants in 34 families, 53 genera within a total of nine 10 m × 10 m (total 1000 m2) plots in the two surveyed P. hainanensis sample fields (Appendix 2). Among them, there are 25 monotypic genus families in the sample plots, accounting for 73.53% of the total family, and 46 monotypic genera, accounting for 86.79% of the total genera. The results show that the distribution of the families and genera of the P. hainanensis community is dispersed. The dominant families in the community were Euphorbiaceae with 5 species (8.20% of the total), Orchidaceae with 8 species (13.11% of the total), and Oleaceae with 3 species (4.92% of the total).
A total of 26 plant species were counted in the tree layer of the EXL population, among which Quercus bawanglingensis, S. ilicifolius, Mallotus yunnanensis, Sterculia lanceolata, Aglaia odorata var. microphyllina, and Osmanthus matsumuranus were the dominant species in the plant community of this population (Table 4); a total of 31 plant species were counted in the tree layer of the YZC population. The species with important values higher than 5% include S. ilicifolius, Clausena excavate, and Dehaasia hainanensis. Overall, S. ilicifolius, Mallotus yunnanensis, Dehaasia hainanensis, Clausena excavata, Quercus bawanglingensis, and Sterculia lanceolata were the dominant species in the tree layer of the P. hainanensis community (Table 4). A total of 8 plant species were counted in the shrub layer of the EXL population. M. yunnanensis and Croton cascarilloides with a high importance value (>5%) were the dominant species in the plant community of this population (Table 2-5). A total of only 2 plants were counted in the shrub layer of the YZC population, Schefflera arboricola and Paramichelia baillonii. Overall, M. yunnanensis, Croton cascarilloides, Schefflera arboricol, and Paramichelia baillonii were the dominant species in the shrub layer of the P. hainanensis community (Table 5).

3.2. Community Floristic Characteristics

The: vascular plants of the 134 genera in the community of P. deliciosa are mainly distributed in tropical Asia, with 41 genera, accounting for 30.60% of the total genera, followed by pantropical distributions with 29 genera, accounting for 21.64%. Tropical Asia to tropical Oceania with 21 genera, Old World tropical distribution with 18 genera, and tropical Asia to tropical Africa with 13 genera account for 15.67%, 13.43%, and 9.70%, respectively, while other flora types are less distributed (Table 6). The 53 genera of vascular plants in the community of P. hainanensis were dominated by pantropical distributions, with 14 genera accounting for 26.42%, followed by 10 genera in tropical Asia, accounting for 20.53%. The distribution of tropical Asia to tropical Oceania with 8 genera, north temperate zone with 5 genera, and Old World tropical distribution with 4 genera accounted for 15.09%, 9.43%, and 7.55%, respectively, while other flora types were less distributed (Table 6).

3.3. Epiphytic Habits

In this study, we found that the epiphytic hosts of wild P. deliciosa belonged to 24 families, 40 genera, and 41 species, among which the number of epiphytes of S. taxoides and S. ilicifolius of Moraceae family was the largest, accounting for 50.37% of the total epiphytes, followed by the number of epiphytes of M. peltatus and E. sinensis of the Euphorbiaceae family, and Sphenodesme pentandra of the Verbenaceae family (Table 7). The epiphytic index Esi of the host plant species studied was in the range of 0.43–21.89, among which only 4 species’ indexes were greater than 5.00, namely S. ilicifolius, S. taxoides, M. peltatus, and A. E. sinensis (Table 7). The epiphytic index Esi of S. ilicifolius is the largest, with values up to 21.89, followed by S. taxoides, which is 17.97; the number of epiphytic P. deliciosa was also the largest of these two host species, with 82 and 55 individual epiphytes, respectively, accounting for 30.15% and 20.22% of the total (Table 7). This indicated that P. deliciosa showed a high epiphytic preference for these two plant species.
The epiphytic hosts of P. hainanensis belong to 11 families, 15 genera and 17 species, among which S. ilicifolius of the Moraceae family and M. yunnanensis of the Euphorbiaceae family are epiphytes, with the highest number of epiphytes among these two host species, accounting for 41.30% and 19.57% of the total epiphytes, respectively. The number of other tree species hosting the epiphytic P. hainanensis was lower (Table 7). The variation range of the epiphytic index Esi of the host species studied was 2.58-26, of which the indexes of only 5 species were greater than 5.00, namely, S. ilicifolius, M. yunnanensis, S. lanceolata, Vietnam Ulmus tonkinensis, and C. excavata (Table 2, Table 3, Table 4, Table 5, Table 6, Table 7, Table 8 and Table 9). The epiphytic index Esi of S. ilicifolius was the highest, reaching 26.00, followed by M. yunnanensis, which was 17.98. The number of epiphytic P. hainanensis of S. ilicifolius and M. yunnanensis was also the largest, with 19 and 9 different epiphytes, respectively, accounting for 41.30% and 19.57% of the total epiphytes, respectively (Table 7). The results show that P. hainanensis has a very high epiphytic preference for these two plants.

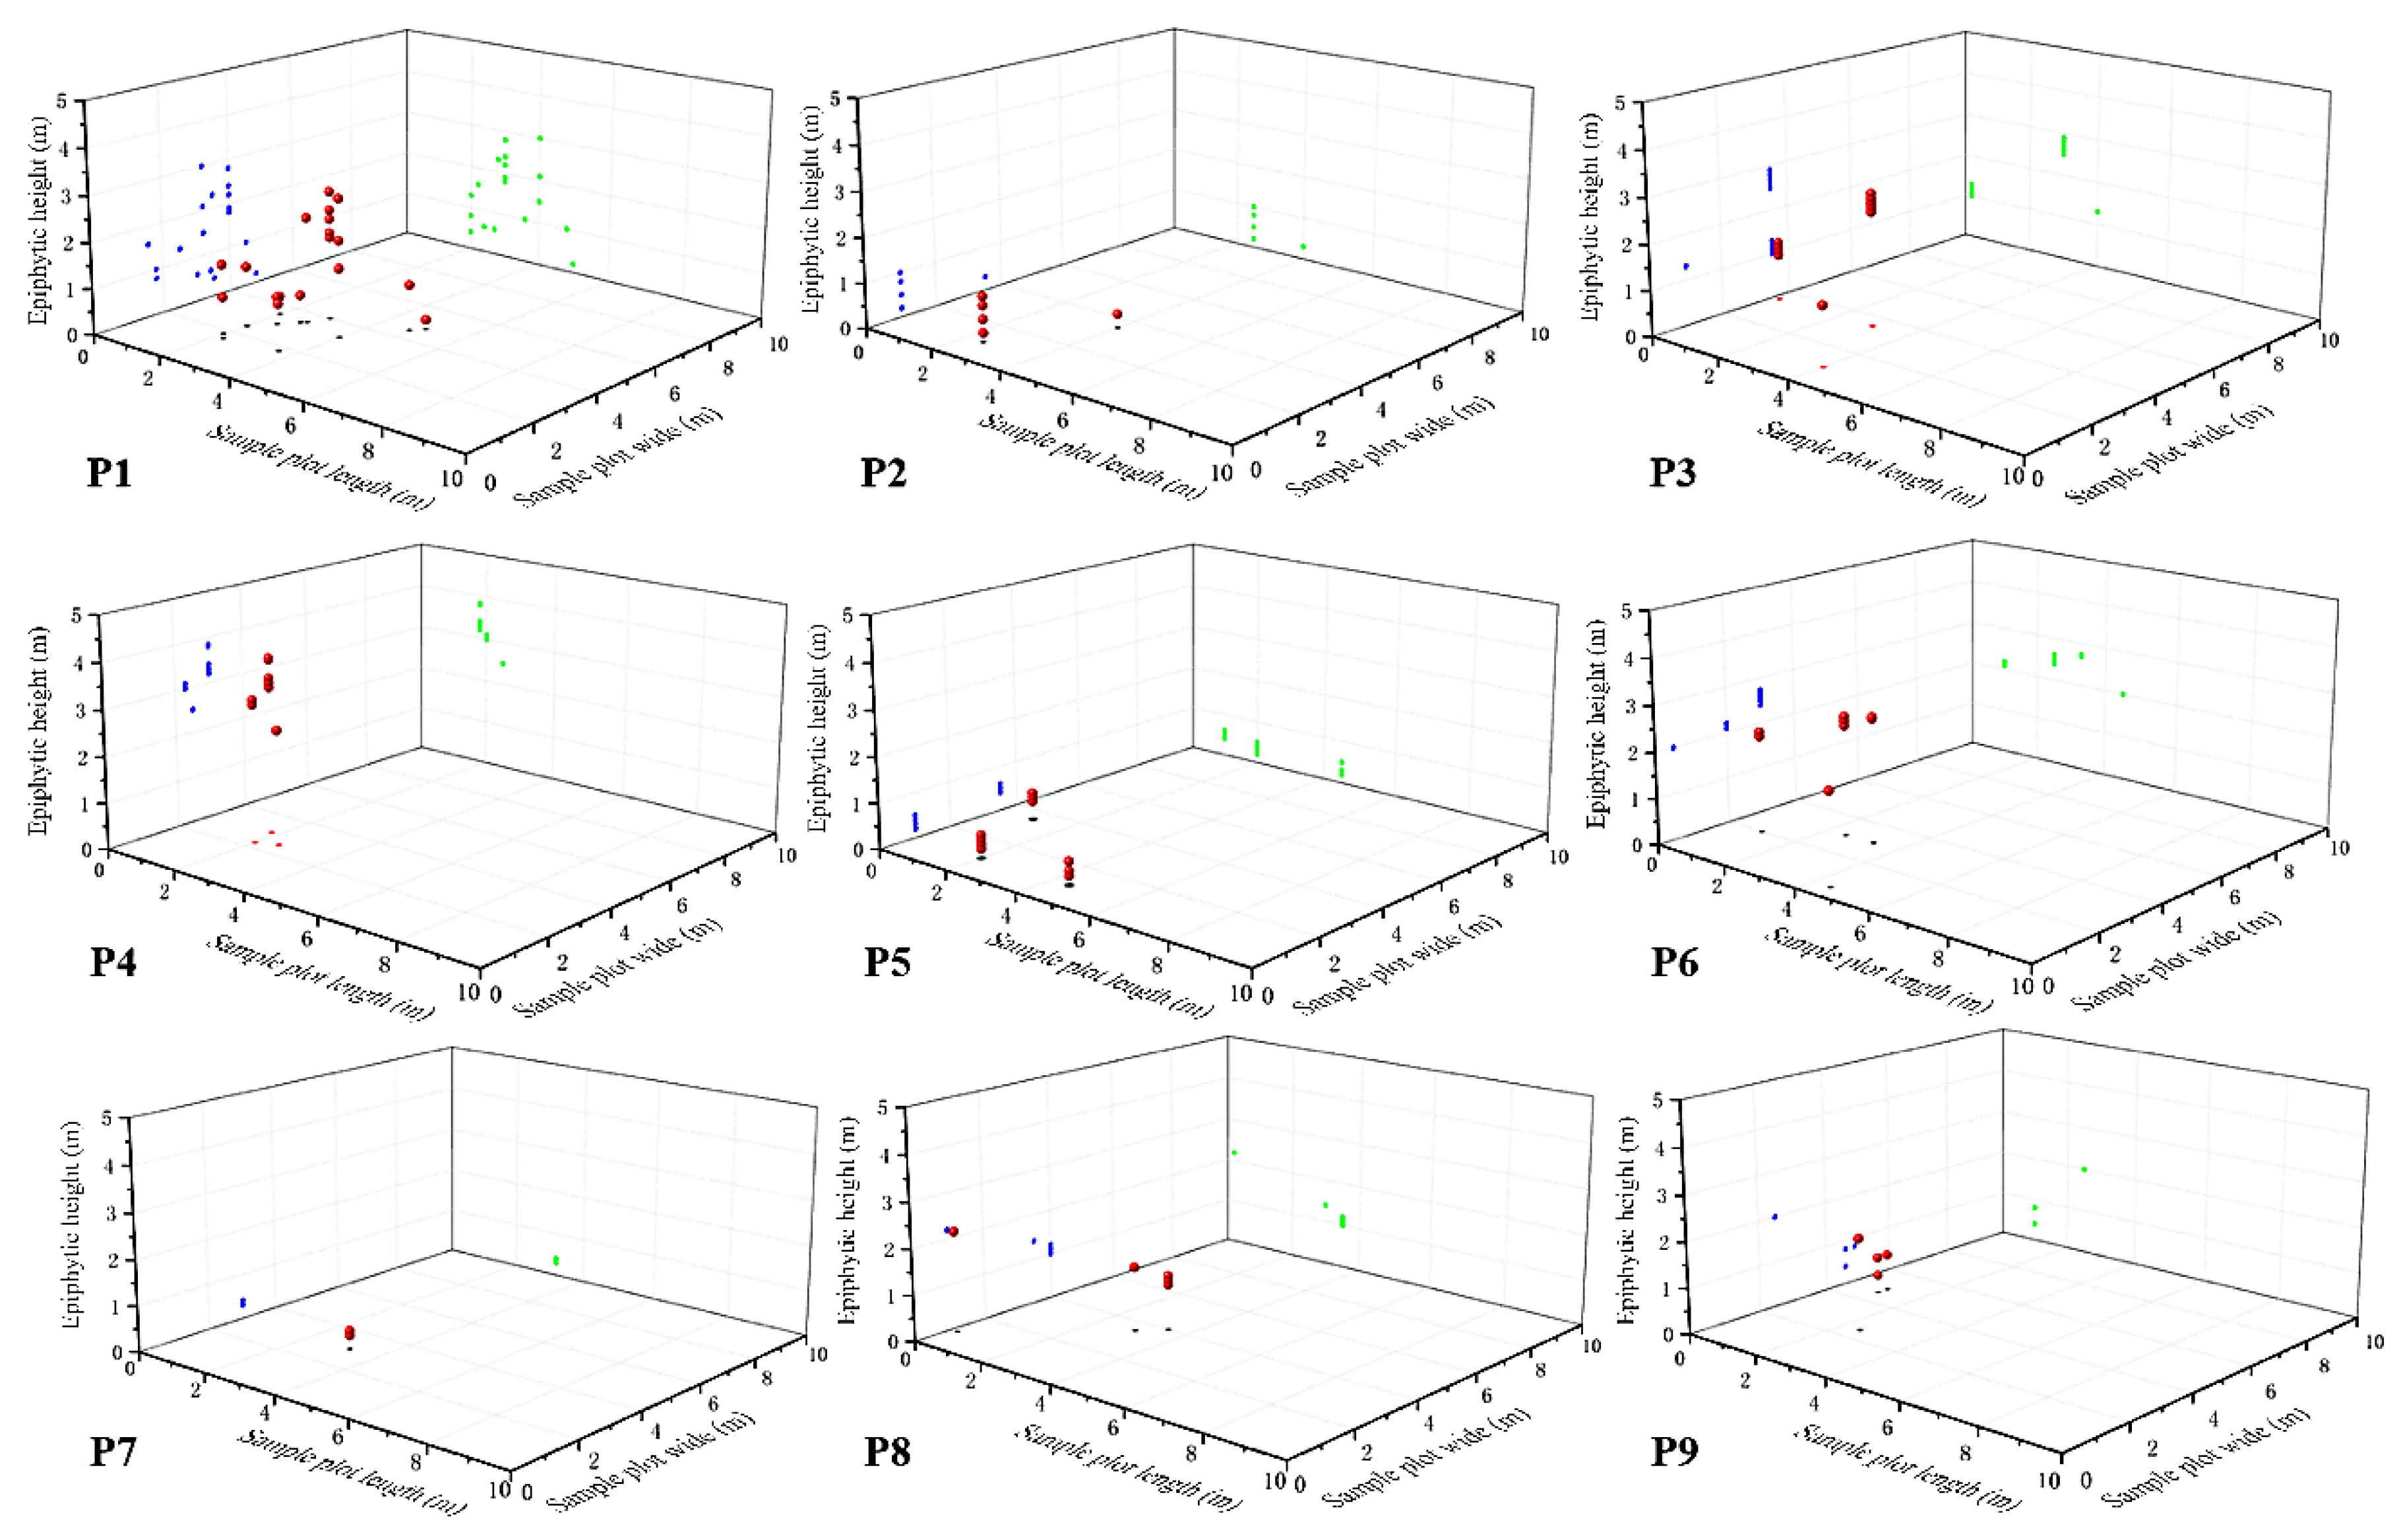
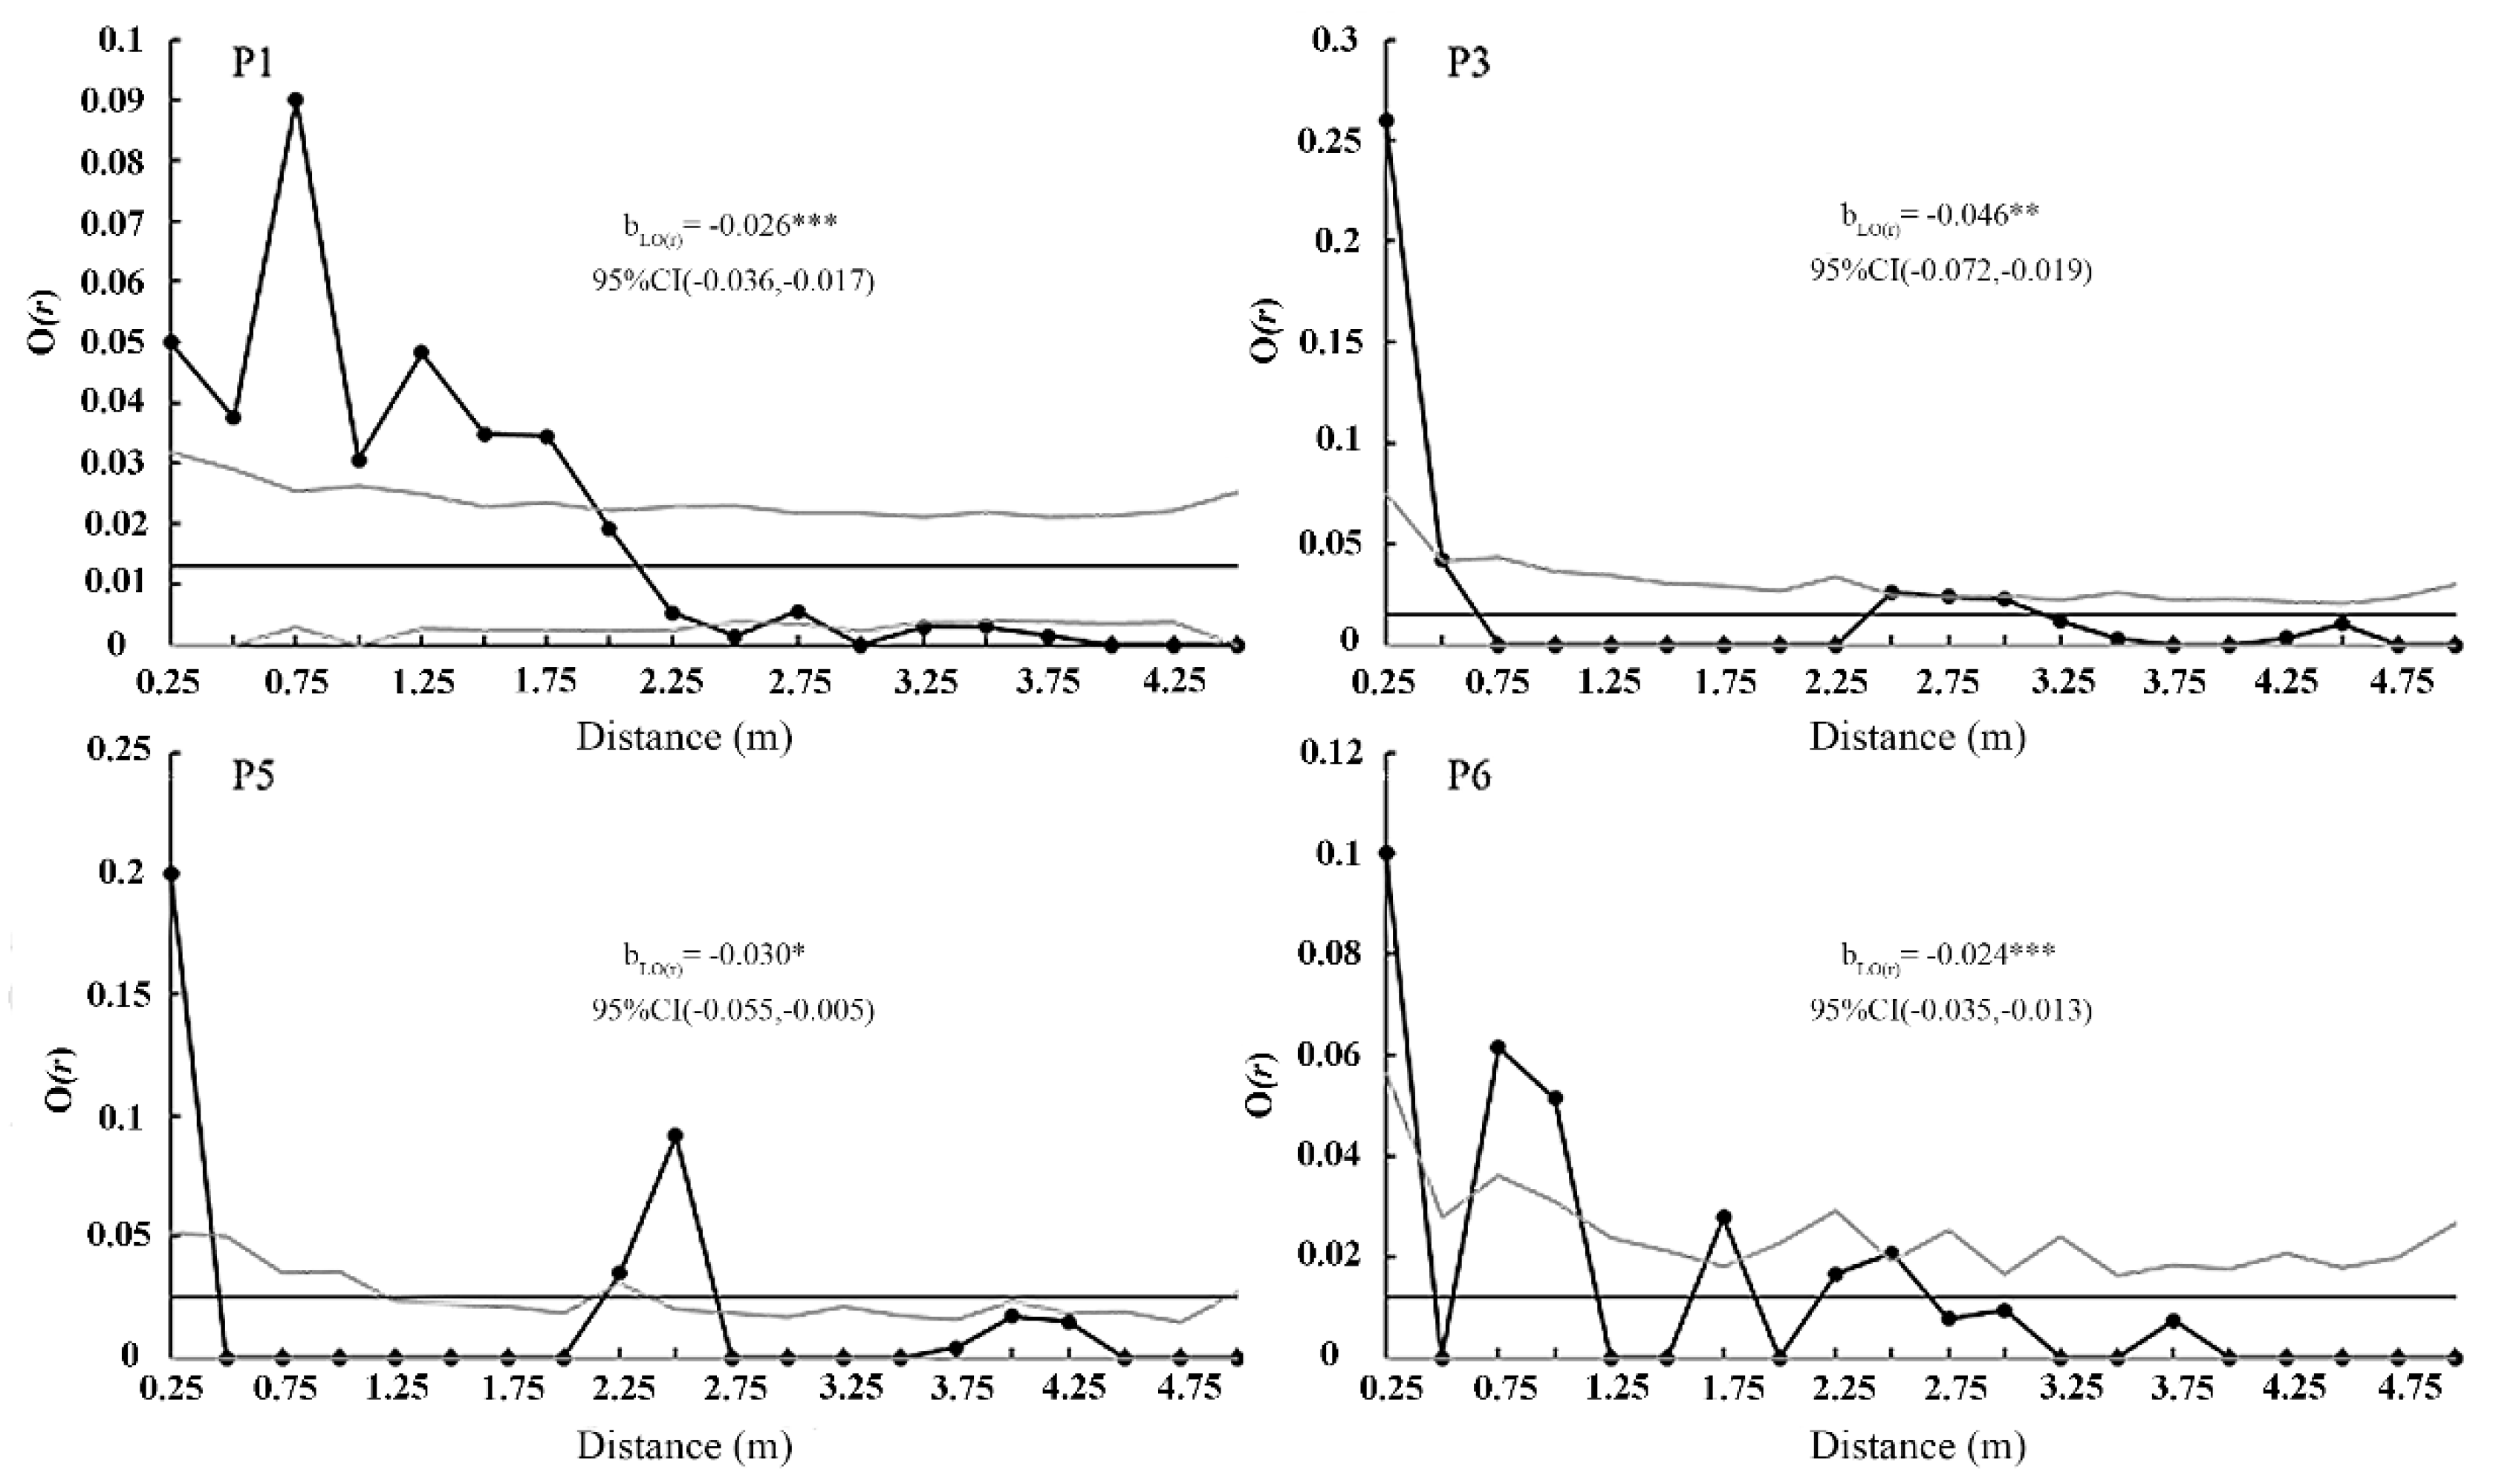
3.4. Spatial Distribution

The spatial distribution of individuals of P. deliciosa showed the characteristics of aggregated distributions on a small scale within the three populations (Figure 3). The results of the non-cumulative univariate O-ring O(r) statistic analysis of the horizontal spatial distribution showed that the individuals of P. deliciosa within the populations had significant aggregated distribution characteristics in small-scale space (Figure 4A), and the SD populations were at radii of r = 0.25, 0.5 and 1–2 m; ED populations were at radii of r = 0.25, 0.5, 1–1.5 and 2–2.5 m; YJ populations were at radii of r = 0.25–1.5, 2, 3, 4, 4.5 and 5 m (Figure 4A); SD, ED, and YJ populations aggregated the most at radii of 0.25, 0.25 and 0.5 m, respectively. The bLO(r) values of the three populations were all significantly less than 0 (P < 0.05). The SD population had the highest bLO(r) at -0.171 (95% CI: -0.294, -0.048). The bLO(r) of the ED population was -0.028 (95% CI: -0.051, -0.005), and the bLO(r) of the YJ population was -0.014 (95% CI: -0.005): -0.024, -0.004). The bLO(r) value of the SD population was not significantly different from that of the ED population but was significantly different from that of the YJ population. The individual dot pattern intensity (λ) was the highest in YJ, reaching 0.0160, with SD and ED of 0.0138 and 0.0080, respectively (Figure 4A). In terms of vertical spatial distribution, the individuals of the SD and ED populations were both distributed below 4 m with most individuals distributed at 1–1.9 m (Figure 4B). In general, the vertical spatial distribution of the individuals in the three populations is mainly concentrated below 4 m, with 1–1.9 m being the largest in number and frequency (Figure 5A, B); The distribution frequency of individuals at 0–1 m and 1–1.9 m was significantly higher than that of other height ranges (P < 0.05) (Figure 5B).
The spatial distribution of individuals of P. hainanensis showed the characteristics of aggregated distributions on a small scale in 9 quadrats (Figure 6). In terms of the horizontal spatial distribution pattern, the O-ring statistic analysis results of the P1, P4, P5, and P6 quadrats with more than 10 individuals each showed significant aggregated distribution for P. hainanensis individuals in the quadrats in the small-scale space (Figure 7). The P1 quadrat was at a radius of r = 0.25–2.25 m; the P4 quadrat was at 0.25–0.75 m; the P5 quadrat was at radii of 0.25, 2.25, and 2.5 m; the P6 quadrat was at radii of 0.25, 0.75, 1.75, and 2.5 m (Figure 7). The P1 quadrat had the highest aggregation intensity at 0.5 m, and the P4, P5, and P6 quadrat had the highest aggregation intensity at 0.25 m. The bLO(r) values of the four quadrats were all significantly less than 0 (P < 0.05). The highest bLO(r) for the P1 quadrat was -0.171 (95% CI: -0.294, -0.048); -0.028 (95% CI: -0.051, -0.005) for the ED population and -0.014 (95% CI: -0.024, -0.004) for the YJ population. The bLO(r) of the SD population was not significantly different from that of the ED population, but was significantly different from that of the YJ population (P < 0.05). The individual point pattern intensity (λ) was the highest in the P5 quadrat, reaching 0.0250; the intensities for P3, P2, and P6 were 0.015, 0.013, and 0.012, respectively (Figure 7). In terms of vertical spatial distribution, the distribution heights of individuals within the 9 quadrats were different for each distance class (Table 8). Only the individuals in the P1 quadrat were represented in each vertical distance class studied; the individuals in the P5, P6, and P7 were distributed in only one distance class, which was 0–0.9, 2–2.9, and 0–0.9 m, respectively (Table 8). Overall, the 0–0.9 m and 2–2.9 m vertical distance classes had the largest number of individuals, but there was no significant difference in the 1–1.9 and 3–4 m vertical distance classes (Table 8).

4. Discussion

4.1. Plant Community Structure and Floristic Characteristics

Epiphytes are strongly influenced by the microclimate of the forest canopy, and understanding its plant community structure and zonation characteristics can reflect to some extent the ability of the epiphyte to adapt to the environmental climate [24] P. deliciosa and P. hainanensis are rich in community species, with relatively scattered family and genera distributions and also complex flora distributions. A total of 159 species of 53 families, 134 genera, and 159 species of vascular plants were counted in the 3 sample plots of P. deliciosa, while a total of 61 species of 34 families, 53 genera, and 61 species of vascular plants were counted in the 2 sample plots of P. hainanensis. The species of P. deliciosa were more abundant than those of P. hainanensis. However, the plant communities of P. deliciosa and P. hainanensis also have certain similarities. The most dominant family for both Phalaenopsis is Euphorbiaceae. Rubiaceae and Orchidaceae, commonly found in tropical regions, are also an important part of the two epiphytic orchid communities, reflecting the tropical nature of the community. The 134 genera of P. deliciosa and 53 genera of P. hainanensis have typical tropical characteristics, with the tropical components (2-7 flora types) of P. deliciosa and P. hainanensis accounting for 95.52% and 77.36%, respectively.

4.2. Epiphytic Habit

Epiphytes have a very high species diversity, accounting for about 10% of extant vascular plants [25]ey are a class of vascular plants that germinate non-parasitically on other plants and depend on the structural support of other plants in all stages of life. It is one of the most prominent life forms in the tropical forest canopy layer [26]. Epiphytes often suffer from intermittent water scarcity due to lack of access to soil water, and water availability is often the most limiting factor for epiphytes. For this reason, epiphytic vascular plants have developed a series of epiphytic-related traits such as a water reservoir, succulent leaves, succulent stems, and a crassulacean acid metabolism (CAM) cycle [4,27]. The evolution of epiphytic traits has prompted independence and rapid diversification of some plant families, such as Orchidaceae, Bromeliaceae, and Leptosporangiopsida, among which Orchidaceae account for two-thirds of all epiphyte species [7,25].
The epiphytic habit is an extremely important evolutionary characteristic of orchids [7,8]. It affects the survival, formation, proliferation, and differentiation of orchids, and also promotes the formation of species diversity of orchids. More than 70% of orchid species are epiphytic and most species are distributed in tropical regions [5]. Epiphytes usually show a preference for host trees, but rarely a strictly exclusive preference for a particular host tree [30].
A total of 41 epiphytic hosts of P. deliciosa in this study showed that their host trees had strong adaptability; S. taxoides and S. ilicifolius had the largest number of epiphytes. There are a total of 17 epiphytic hosts of P. hainanensis, among which S. ilicifolius and M. yunnanensis have the most epiphytes. The preferred tree species of the two kinds of Phalaenopsis epiphytes are shrubs. Although the distribution altitudes are quite different, both P. deliciosa and P. hainanensis show epiphytic preference for the drought-tolerant S. ilicifolius. This might be because the distribution areas of the two Phalaenopsis belong to habitats with high light intensity and thermal resources but low humidity. Shrubs, such as S. ilicifolius, have become the dominant species in this area. The dominance of both Phalaenopsis using S. ilicifolius as host might also be affected by the physical and chemical properties of S. ilicifolius bark and the presence of fungi.
Most epiphytic orchids like tall trees as their epiphytic hosts. These trees, as host or umbrella species for epiphytes, provide a relatively large attaching area to protect the epiphyte population and provide a relatively stable environment, such as sufficient light, water, and heat for the epiphytes [30]. In general, epiphytic orchid plants are widely distributed in the canopy layer, which may be related to the diverse micro-environment of the canopy layer, where the lateral branches extend horizontally, providing a suitable microclimate in the canopy. Seeds and seedlings attach easier to branches and horizontal branches, and the presence of a large amount of moss and humus is also conducive to seed attachment and germination. However, the two kinds of Phalaenopsis in this study resided in a very dry habitat with small branches and trunks. In this habitat, there are significantly fewer types of competing epiphytes; therefore, the two Phalaenopsis secure their ecological niche. This may be due to the fact that Phalaenopsis plants have developed a special drought-resistant mechanism in the evolutionary process to combat harsh habitats. The root system of P. deliciosa and P. hainanensis can extend more than 2 m along the main trunk of the epiphyte host, retaining water and nutrients to a greater extent.

4.3. Spatial Distribution

The seed flow and pollen flow of orchids are different from other plants. First, although orchids produce large quantities of “dusty” seeds that could be dispersed by wind over great distances, many studies have shown that the orchids’ seed flow is limited by a variety of factors. The seeds of orchids do not have endosperm, and their seed germination depends completely on mycorrhizal fungi for infection and provision of nutrients necessary for germination and seedling growth. High-density mycorrhizal fungi colonies often take adult plants as microsites, resulting in the germination of orchid seeds near the individual female parent. The individuals in the three populations of P. deliciosa all aggregated on a small scale in the horizontal distribution pattern. The vertical distribution pattern is below 5 m and concentrated within a distance range of 1–1.9 m. The individuals in the 9 quadrats of P. hainanensis also had aggregated distributions on the small scale in the horizontal distribution. The vertical distribution pattern appeared below 4 m, without any significant difference in the number of distributions in the different distance classes; the highest number of individuals were distributed at heights of 0–0.9 m and 2–2.9 m. The three-dimensional spatial distribution shows that both P. deliciosa and P. hainanensis exhibit a type of aggregation distribution on a small scale, by aggregating on the same host tree or adjacent host trees.
Orchids are mycorrhizal fungi-dependent plants, and the colonization of adult individuals is often also an area enriched with mycorrhizal fungi [29]. Therefore, most of the orchid seed germination and seedling renewal occur within a short distance from the adult individual, sometimes even only a few meters away [28]. The seed germination rate also decreases with increasing distance from the adult individual. Our results also indicate that the occurrence of this aggregation phenomenon may be related to the distribution of mycorrhizal fungi.
The spatial distribution pattern of epiphytic orchids varies with vegetation types. Gravendeel et al. (2004) [7] reported that the environmental factors of the epiphytic microhabitat and the characteristics of the host tree determine the distribution pattern of epiphytes on the host tree to a large extent. In this study, the vertical distribution heights of the two Phalaenopsis species were both low. This may be related to the preference for specific epiphytic tree species. The preferred epiphytic tree species of P. deliciosa and P. hainanensis are shrubs, with low growth height, also resulting in low epiphytic heights of the vertical spatial distributions.

5. Conclusions

Orchidaceae plants are widely distributed in various terrestrial ecosystems except for polar and desert regions. They are one of the most evolved and advanced plants. There are more than 800 genera and about 30,000 species. Orchids are important indicator species in tropical rainforests. Nearly 80% of orchid species are distributed in tropical rainforests, and 70% of them are epiphytes. The biological characteristics of orchids themselves make them extremely demanding on their habitats. Habitat decline and human collection often result in devastating damage to orchid populations, leading to the gradual degradation or disappearance of many wild orchid populations. Half (about 56.5%) of orchids, including vulnerable, endangered, or critically endangered species, are facing extinction.
In previous studies on epiphytic orchids, the focus was on tall trees in rainforests. Not enough attention was paid to orchids distributed in secondary forests, forest margins, damaged habitats, and areas with harsh environments. In this study, the preference for the host tree and habitat adaptability of P. deliciosa and P. hainanensis highlights their characteristics of extremely high stress resistance, and provide valuable information resources for further studying the evolution mechanism and exploring genetic breeding of Phalaenopsis. In the attempt to preserve forest resources, attention should be paid to these species worthy of protection in secondary forests and habitats, which suffer from considerable habitat destruction. This information is also significant for revealing the species dispersal mechanisms and species formation under changing forest environments.

Author Contributions

For research articles with several authors, a short paragraph specifying their individual contributions must be provided. The following statements should be used “Conceptualization, Haotian Zhong and Wenchang Li; methodology, Wenchang Li; software, Haotian Zhong; validation, Wenchang Li, Haotian Zhong and Zhiheng Chen; formal analysis, Wenchang Li; investigation, Wenchang Li; resources, Wenchang Li; data curation, Wenchang Li; writ-ing—original draft preparation, Haotian Zhong; writing—review and editing, Haotian Zhong.; visualization, Wenchang Li, Haotian Zhong and Zhiheng Chen; su-pervision, Zhe Zhang; project administration, Zhe Zhang; funding acquisition, Zhe Zhang All authors have read and agreed to the published version of the manuscript.” Please turn to the CRediT taxonomy for the term explanation. Authorship must be limited to those who have contributed substantially to the work reported.

Funding

This research was supported by Natural Science Foundation (No. 32201347) and Hainan Natural Science Foundation No. 322RC569.

Conflicts of Interest

Declare conflicts of interest or state “The authors declare no conflicts of interest.” Authors must identify and declare any personal circumstances or interest that may be perceived as inappropriately influencing the representation or interpretation of reported research results.:

Appendix A

Table A1. The species list of Phalaenopsis hainanensis community.
Family Genus Species
Liliaceae Dracaena Dracaena angustifolia
Dracaena cambodiana
Flacourtiaceae Scolopia Scolopia saeva
Hydnocarpus Hydnocarpus hainanensis
Homalium Homalium hainanense
Euphorbiaceae Croton Croton laevigatus
Koilodepas Koilodepas hainanense
Suregada Suregada glomerulata
Cleistanthus Cleistanthus concinnus
Drypetes Drypetes hainanensis
Drypetes indica
Drypetes perreticulata
Breynia Breynia fruticosa
Baccaurea Baccaurea ramiflora
Bischofia Bischofia javanica
Alchornea Alchornea rugosa
Sapium Sapium insigne
Antidesma Antidesma hainanense
Bridelia balansae
Actephila Actephila merrilliana
Mallotus Mallotus hookerianus
Mallotus peltatus
Mallotus yunnanensis
Aporusa Aporusa dioica
Erismanthus Erismanthus sinensis
Fabaceae Ormosia Ormosia semicastrata
Dalbergia Dalbergia peishaensis
Dalbergia tsoi
Dalbergia odorifera
Bowringia Bowringia callicarpa
Millettia Millettia tsui
Derris Derris trifoliata
Annonaceae Polyalthia Polyalthia laui
Fissistigma Fissistigma oldhamii
Fissistigma polyanthum
Desmos Desmos chinensis
Alphonsea Alphonsea mollis
Mitrephora Mitrephora thorelii
Artabotrys Artabotrys hainanensis
Dasymaschalon Dasymaschalon trichophorum
Uvaria Uvaria macclurei
Menispermaceae Diploclisia Diploclisia glaucescens
Burseraceae Canarium Canarium album
Ancistrocladaceae Ancistrocladus Ancistrocladus tectorius
Mimosaceae Albizia Albizia corniculata
Albizia odoratissima
Acacia Acacia pennata
Gramineae Schizostachyum Schizostachyum pseudolima
Apocynaceae Wrightia Wrightia pubescens
Ervatamia Ervatamia hainanensis
Alyxia Alyxia sinensis
Hunteria Hunteria zeylanica
Violaceae Rinorea Rinorea bengalensis
Malvaceae Pterospermum Pterospermum heterophyllum
Microcos Microcos paniculata
Sterculia Sterculia lanceolata
Firmiana Firmiana hainanensis
Fagaceae Lithocarpus Lithocarpus corneus
Castanopsis Castanopsis formosana
Meliaceae Turraea Turraea pubescens
Aglaia Aglaia odorata var. microphyllina
Toona Toona sinensis
Amoora Amoora tsangii
Dipterocarpaceae Hopea Hopea hainanensis
Vatica Vatica mangachapoi
Pandanaceae Pandanus Pandanus tectorius
Asclepiadaceae Hoya Hoya carnosa
Verbenaceae Vitex Vitex quinata
Sphenodesme Sphenodesme pentandra
Callicarpa Callicarpa longissima
Loganiaceae Strychnos Strychnos cathayensis
Strychnos angustiflora
Strychnos umbellata
Magnoliaceae Paramichelia Paramichelia baillonii
Oleaceae Fraxinus Fraxinus griffithii
Osmanthus Osmanthus matsumuranus
Jasminum Jasminum grandiflorum
Jasminum nervosum var. elegans
Connaraceae Ellipanthus Ellipanthus glabrifolius
Rourea Rourea Microphylia
Pandaceae Microdesmis Microdesmis caseariifolia
Anacardiaceae Spondias Spondias pinnata
Spondias lakonensis
Lannea Lannea coromandelica
Toxicodendron Toxicodendron succedaneum
Lythraceae Lagerstroemia Lagerstroemia balansae
Rubiaceae Lasianthus Lasianthus chinensis
Lasianthus hirsutus
Paederia Paederia scandens
Psychotria Psychotria straminea
Psychotria rubra
Tarennoidea Tarennoidea wallichii
Ixora Ixora hainanensis
Antirhea Antirhea chinensis
Fagerlindia Fagerlindia depauperata
Aidia Aidia oxyodonta
Catunaregam Catunaregam spinosa
Wendlandia Wendlandia uvariifolia subsp. chinensis
Chasalia Chasallia curviflora
Tarenna Tarenna mollissima
Canthium Canthium horridum
Rosaceae Photinia Photinia benthamiana
Moraceae Antiaris Antiaris toxicaria
Streblus Streblus ilicifolius
Streblus taxoides
Theaceae Eurya Eurya nitida
Capparaceae Capparis Capparis dasyphylla
Capparis Capparis zeylanica
Capparis hainanensis
Sapotaceae Chrysophyllum Chrysophyllum roxburghii
Sarcosperma Sarcosperma laurinum
Combretaceae Combretum Combretum punctatum
Terminalia Terminalia hainanensis
Ebenaceae Diospyros Diospyros strigosa
Diospyros cathayensis
Rhamnaceae Sageretia Sageretia thea
Myrtaceae Syzygium Syzygium chunianum
Cleistocalyx Cleistocalyx operculatus
Clusiaceae Garcinia Garcinia oblongifolia
Samydaceae Casearia Casearia vililimba
Olacaceae Erythropalum Erythropalum scandens
Celastraceae Euonymus Euonymus chinensis
Euonymus laxiflorus
Sapindaceae Arytera Arytera littoralis
Litchi Litchi chinensis
Dimocarpus Dimocarpus longan
Sapindus Sapindus mukurossi
Dilleniaceae Tetracera Tetracera asiatica
Scrophulariaceae Paulownia Paulownia kawakamii
Convolvulaceae Erycibe Erycibe schmidtii
Argyreia Argyreia acuta
Melastomataceae Memecylon Memecylon scutellatum
Ulmaceae Gironniera Aphananthe cuspidata
Caesalpiniaceae Sindora Peltophorum dasyrrhachis
Rutaceae Murraya Murraya exotica
Glycosmis Glycosmis pentaphylla
Lauraceae Cryptocarya Cryptocarya metcalfiana
Dehaasia Dehaasia hainanensis
Litsea Litsea baviensis
Litsea variabilis
Litsea monopetala
Beilschmiedia Beilschmiedia appendiculata
Machilus Machilus suaveolens
Machilus chinensis
Cinnamomum Cinnamomum tsoi
Cinnamomum burmannii
Boraginaceae Carmona Carmona microphylla
Myrsinaceae Maesa Maesa japonica
Rapanea Rapanea neriifolia
Ardisia Ardisia densilepidotula
Ardisia crenata
Bignoniaceae Radermachera Radermachera hainanensis
Markhamia Markhamia stipulata var. kerrii
Palmae Arenga Arenga westerhoutii
Daemonorops Daemonorops margaritae
Calamus Calamus simplicifolius
Caryota Caryota ochlandra
Licuala Licuala spinosa
Licuala fordiana
Total 53 Family 134 Genus 159 Species
Table A2. The species list of Phalaenopsis hainanensis community.
Family Genus Species
Aspleniaceae Neottopteris Neottopteris nidus
Liliaceae Dracaena Dracaena cambodiana
Flacourtiaceae Scolopia Scolopia saeva
Euphorbiaceae Croton Croton cascarilloides
Euphorbia Euphorbia hainanensis
Drypetes Drypetes perreticulata
Actephila Actephila merrilliana
Mallotus Mallotus tenuifolius
Mallotus yunnanensis
Annonaceae Alphonsea Alphonsea mollis
Alphonsea monogyna
Artabotrys Artabotrys hexapetalus
Balsaminaceae Impatiens Impatiens hainanensis
Davalliaceae Davallia Davallia mariesii
Elaeagnaceae Elaeagnus Elaeagnus gonyanthes
Drynariaceae Pseudodrynaria Pseudodrynaria coronans
Zingiberaceae Pommereschea Pommereschea lackneri
Hamamelidaceae Distylium Distylium racemosum
Malvaceae Erythropsis Erythropsis pulcherrima
Sterculia Sterculia lanceolata
Acanthaceae Barleria Barleria cristata
Fagaceae Quercus Quercus bawanglingensis
Gesneriaceae Chirita Chirita heterotricha
Orchidaceae Coelogyne Coelogyne fimbriata
Luisia Luisia morsei
Eria Eria quinquelamellosa
Eria gagnepainii
Dendrobium Dendrobium aurantiacum var. denneanum
Dendrobium aduncum
Pholidota Pholidota yunnanensis
Cryptochilus Cryptochilus roseus
Vanda Vanda subconcolor
Liparis Liparis viridiflora
Liparis yunnanensis
Meliaceae Aglaia Aglaia odorata var. microphyllina
Loganiaceae Fagraea Fagraea ceilanica
Magnoliaceae Paramichelia Paramichelia baillonii
Oleaceae Fraxinus Fraxinus griffithii
Osmanthus Osmanthus matsumuranus
Jasminum Jasminum nervosum var. elegans
Anacardiaceae Pistacia Pistacia chinensis
Rubiaceae Antirhea Antirhea chinensis
Begoniaceae Begonia Begonia peltatifolia
Moraceae Streblus Streblus ilicifolius
Streblus taxoides
Ficus Ficus subpisocarpa
Ficus parvifolia
Ficus tinctoria subsp. gibbosa
Sapotaceae Planchonella Planchonella obovata
Myrtaceae Decaspermum Decaspermum gracilentum
Euonymus Euonymus laxiflorus
Ulmaceae Celtis Celtis sinensis
Ulmus Ulmus tonkinensis
Caesalpiniaceae Gleditsia Gleditsia sinensise
Rutaceae Clausena Clausena excavate
Micromelum Micromelum falcatum
Lauraceae Dehaasia Dehaasia hainanensis
Myrsinaceae
Bignoniaceae
Rapanea Rapanea linearis
Radermachera Radermachera frondosa
Total 34 Famliy 53 Genus 61 Species

References

  1. Liu, G.-F.; Ding, Y.; Zang, R.-G.; Xu, Y.-Y.; Lin, C.; Li, X.-C. Diversity and Distribution of Vascular Epiphytes in the Tropical Natural Coniferous Forest of Hainan Island, China. Chin. J. Plant Ecol. 2010, 34, 1283–1293. [Google Scholar]
  2. Gentry, A.H.; Dodson, C.H. Diversity and Biogeography of Neotropical Vascular Epiphytes. Ann. Mo. Bot. Gard. 1987, 74, 205–233. [Google Scholar] [CrossRef]
  3. Bramwell, D. How Many Plant Species Are There? Plant Talk 2002, 28, 32–33. [Google Scholar]
  4. Benzing, D.H. Vascular Epiphytes; Cambridge University Press: Cambridge, UK, 1990. [Google Scholar]
  5. Bergstrom, B.J.; Carter, R. Host-Tree Selection by an Epiphytic Orchid, Epidendrum magnoliae Muhl. (Green Fly Orchid), in an Inland Hardwood Hammock in Georgia. Southeast. Nat. 2008, 7, 571–580. [Google Scholar] [CrossRef]
  6. Fay, M.F.; Chase, M.W. Orchid Biology: From Linnaeus via Darwin to the 21st Century. Ann. Bot. 2009, 104, 359–364. [Google Scholar] [CrossRef]
  7. Gravendeel, B.; Smithson, A.; Slik, F.J.W.; Schuiteman, A. Epiphytism and Pollinator Specialization: Drivers for Orchid Diversity? Philos. Trans. R. Soc. B: Biol. Sci. 2004, 359, 1523–1535. [Google Scholar] [CrossRef]
  8. Givnish, T.J.; Spalink, D.; Ames, M.; Lyon, S.P.; Hunter, S.J.; Zuluaga, A.; Iles, W.J.D.; Clements, M.A.; Arroyo, M.T.K.; Leebens-Mack, J.; et al. Orchid Phylogenomics and Multiple Drivers of Their Extraordinary Diversification. Proc. R. Soc. B: Biol. Sci. 2015, 282, 20151553. [Google Scholar] [CrossRef] [PubMed]
  9. Zotz, G. How Fast Does an Epiphyte Grow? Selbyana 1998, 16, 150–154. [Google Scholar]
  10. Winkler, M.; Hietz, P. Population Structure of Three Epiphytic Orchids (Lycaste aromatica, Jacquiniella leucomelana and J. teretifolia) in a Mexican Humid Montane Forest. Selbyana 2001, 22, 27–33. [Google Scholar]
  11. Callaway, R.M.; Reinhart, K.O.; Moore, G.W.; Moore, D.J.; Pennings, S.C. Epiphyte Host Preferences and Host Traits: Mechanisms for Species-Specific Interactions. Oecologia 2002, 132, 221–230. [Google Scholar] [CrossRef]
  12. Wells, T.C.E.; Willems, J.H. (Eds.) Population Ecology of Terrestrial Orchids; SPB Academic Publishing: The Hague, The Netherlands, 1991. [Google Scholar]
  13. Otero, J.T.; Bayman, P.; Ackerman, J.D. Variation in Mycorrhizal Performance in the Epiphytic Orchid Tolumnia variegata In Vitro: The Potential for Natural Selection on Fungal Effectiveness. Aust. J. Bot. 2005, 53, 353–361. [Google Scholar] [CrossRef]
  14. Jersáková, J.; Malinová, T. Spatial Aspects of Seed Dispersal and Seedling Recruitment in Orchids. New Phytol. 2007, 176, 237–241. [Google Scholar] [CrossRef]
  15. Curtis, J.T.; McIntosh, R.P. The Interrelations of Certain Analytic and Synthetic Phytosociological Characters. Ecology 1951, 32, 434–455. [Google Scholar] [CrossRef]
  16. IUCN SSC Orchid Specialist Group. Global Action Plan for Orchid Conservation; IUCN: Gland, Switzerland, 2016. [Google Scholar]
  17. Chen, X.; Liu, Z.; Zhu, G.; Lang, K.; Ji, Z.; Luo, Y. Phalaenopsis. In Flora of China; Wu, Z.-Y., Raven, P.H., Hong, D.-Y., Eds.; Science Press: Beijing, China; Missouri Botanical Garden Press: St. Louis, MO, USA, 2009; Volume 25, pp. 478–483. [Google Scholar]
  18. Long, W.-X.; Zang, R.-G.; Ding, Y. Community Characteristics of Tropical Forests in Bawangling, Hainan. Chin. J. Plant Ecol. 2013, 37, 597–608. (In Chinese) [Google Scholar]
  19. Greig-Smith, P. Quantitative Plant Ecology, 3rd ed.; University of California Press: Berkeley, CA, USA, 1983. [Google Scholar]
  20. Ye, W.-H.; et al. Method for Calculating Shrub Layer Coverage. Acta Phytoecol. Sin. 2008, 32, 112–119. (In Chinese) [Google Scholar]
  21. Wu, Z.-Y. Floristic Regions and Components of Chinese Seed Plants. Biodivers. Sci. 2011, 19, 147–154. (In Chinese) [Google Scholar]
  22. Song, X.-Q. Epiphytic Selectivity Index (ESI) for Host Preference of Epiphytes. J. Trop. Biol. 2005, 2, 45–50. (In Chinese) [Google Scholar]
  23. Wiegand, T.; Moloney, K.A. Rings, Circles, and Null-Models for Point Pattern Analysis in Ecology. Oikos 2004, 104, 209–229. [Google Scholar] [CrossRef]
  24. Cruz, A.C.R.; Corrêa, N.M.; Murakami, M.; Amorim, T.A.; Faria, A.P.G.; Matthews, S.J. Importance of the Vertical Gradient in the Variation of Epiphyte Community Structure in the Brazilian Atlantic Forest. Flora 2022, 295, 152137. [Google Scholar] [CrossRef]
  25. Zotz, G. The Systematic Distribution of Vascular Epiphytes—A Critical Update. Bot. J. Linn. Soc. 2013, 171, 453–481. [Google Scholar] [CrossRef]
  26. Zotz, G.; Bader, M.Y. Epiphytic Plants in a Changing World: Global Change Effects on Vascular and Non-Vascular Epiphytes. In Progress in Botany; Lüttge, U., Beyschlag, W., Büdel, B., Eds.; Springer: Berlin, Germany, 2009; Volume 70, pp. 147–170. [Google Scholar]
  27. Zotz, G. Plants on Plants—The Biology of Vascular Epiphytes; Springer: Cham, Switzerland, 2016. [Google Scholar]
  28. Arditti, J.; Ghani, A.K.A. Tansley Review No. 110. Numerical and Physical Properties of Orchid Seeds and Their Biological Implications. New Phytol. 2000, 145, 367–421. [Google Scholar] [CrossRef] [PubMed]
  29. Rasmussen, H.N. Terrestrial Orchids: From Seed to Mycotrophic Plant; Cambridge University Press: Cambridge, UK, 1995. [Google Scholar]
  30. Greig-Smith, P. Quantitative Plant Ecology, 3rd ed.; University of California Press: Berkeley, CA, USA, 1983. [Google Scholar]
  31. Curtis, J.T.; McIntosh, R.P. The Interrelations of Certain Analytic and Synthetic Phytosociological Characters. Ecology 1951, 32, 434–455. [Google Scholar] [CrossRef]
  32. Zotz, G.; Vollrath, B. The Epiphyte Vegetation of the Palm Socratea exorrhiza—Correlations with Tree Size, Tree Age and Bryophyte Cover. J. Trop. Ecol. 2003, 19, 81–90. [Google Scholar] [CrossRef]
Figure 1. The location of Bawangling Nature Reserve (BNR) in Hainan Island (Modified from Long et al. [18]).
Preprints 183780 g001
Figure 2. The distribution of sample plots of Phalaenopsis deliciosa and Phalaenopsis hainanensis in Bawangling.
Preprints 183780 g002
Figure 3. Spatial three-dimensional distribution of three Phalaenopsis deliciosa populations. Note: The red ball represents the spatial position of the plant, and the green, blue and black solid dots represent the projection of the plant position on each plane, respectively.
Preprints 183780 g003
Figure 4. Spatial distribution pattern of three Phalaenopsis deliciosa populations. Note: A, observed O(r)-statistic estimates for univariate analysis. The black solid circle represents the O(r) vaule at different distance r. Envelopes defined by the 5% highest and lowest values generated from 999 Monte Carlo simulations under the null hypothesis of complete spatial randomness (CSR) are indicated by grey lines. The thin solid line indicates the first-order intensity (λ) of the point pattern within populations. bLO(r) represents the slope of the linear regression of the O-ring statistic, O(r) against log spatial distance, ln(r). *P < 0.05, **P < 0.01. B, Vertical distribution pattern.
Preprints 183780 g004
Figure 5. The number of individuals and the average distribution frequency in vertical spatial distributions the three Phalaenopsis deliciosa populations. Note: The same letter along columns are not significantly different.
Preprints 183780 g005
Figure 6. Spatial three-dimensional distribution of nine Phalaenopsis hainanensis sample plots. Note: Sample plots P1 to P6 are located in EXL population and P7 to P9 are located in YZC population. The red ball represents the spatial position of the plant, and the green, blue and black solid dots represent the projection of the plant position on each plane, respectively.
Preprints 183780 g006
Figure 7. Spatial distribution pattern of four Phalaenopsis hainanensis sample plots. Note: Observed O(r)-statistic estimates for univariate analysis. The black solid circle represents the O(r) vaule at different distance r. Envelopes defined by the 5% highest and lowest values generated from 999 Monte Carlo simulations under the null hypothesis of complete spatial randomness (CSR) are indicated by grey lines. The thin solid line indicates the first-order intensity (λ) of the point pattern within populations. bLO(r) represents the slope of the linear regression of the O-ring statistic, O(r) against ln(r). *P < 0.05, **P < 0.01, ***P < 0.001.
Preprints 183780 g007
Table 1. Geographic information of Phalaenopsis deliciosa and Phalaenopsis hainanensis.
Population Longitude Latitude Altitude Sample Area No. of Quadrats
Phalaenopsisdeliciosa
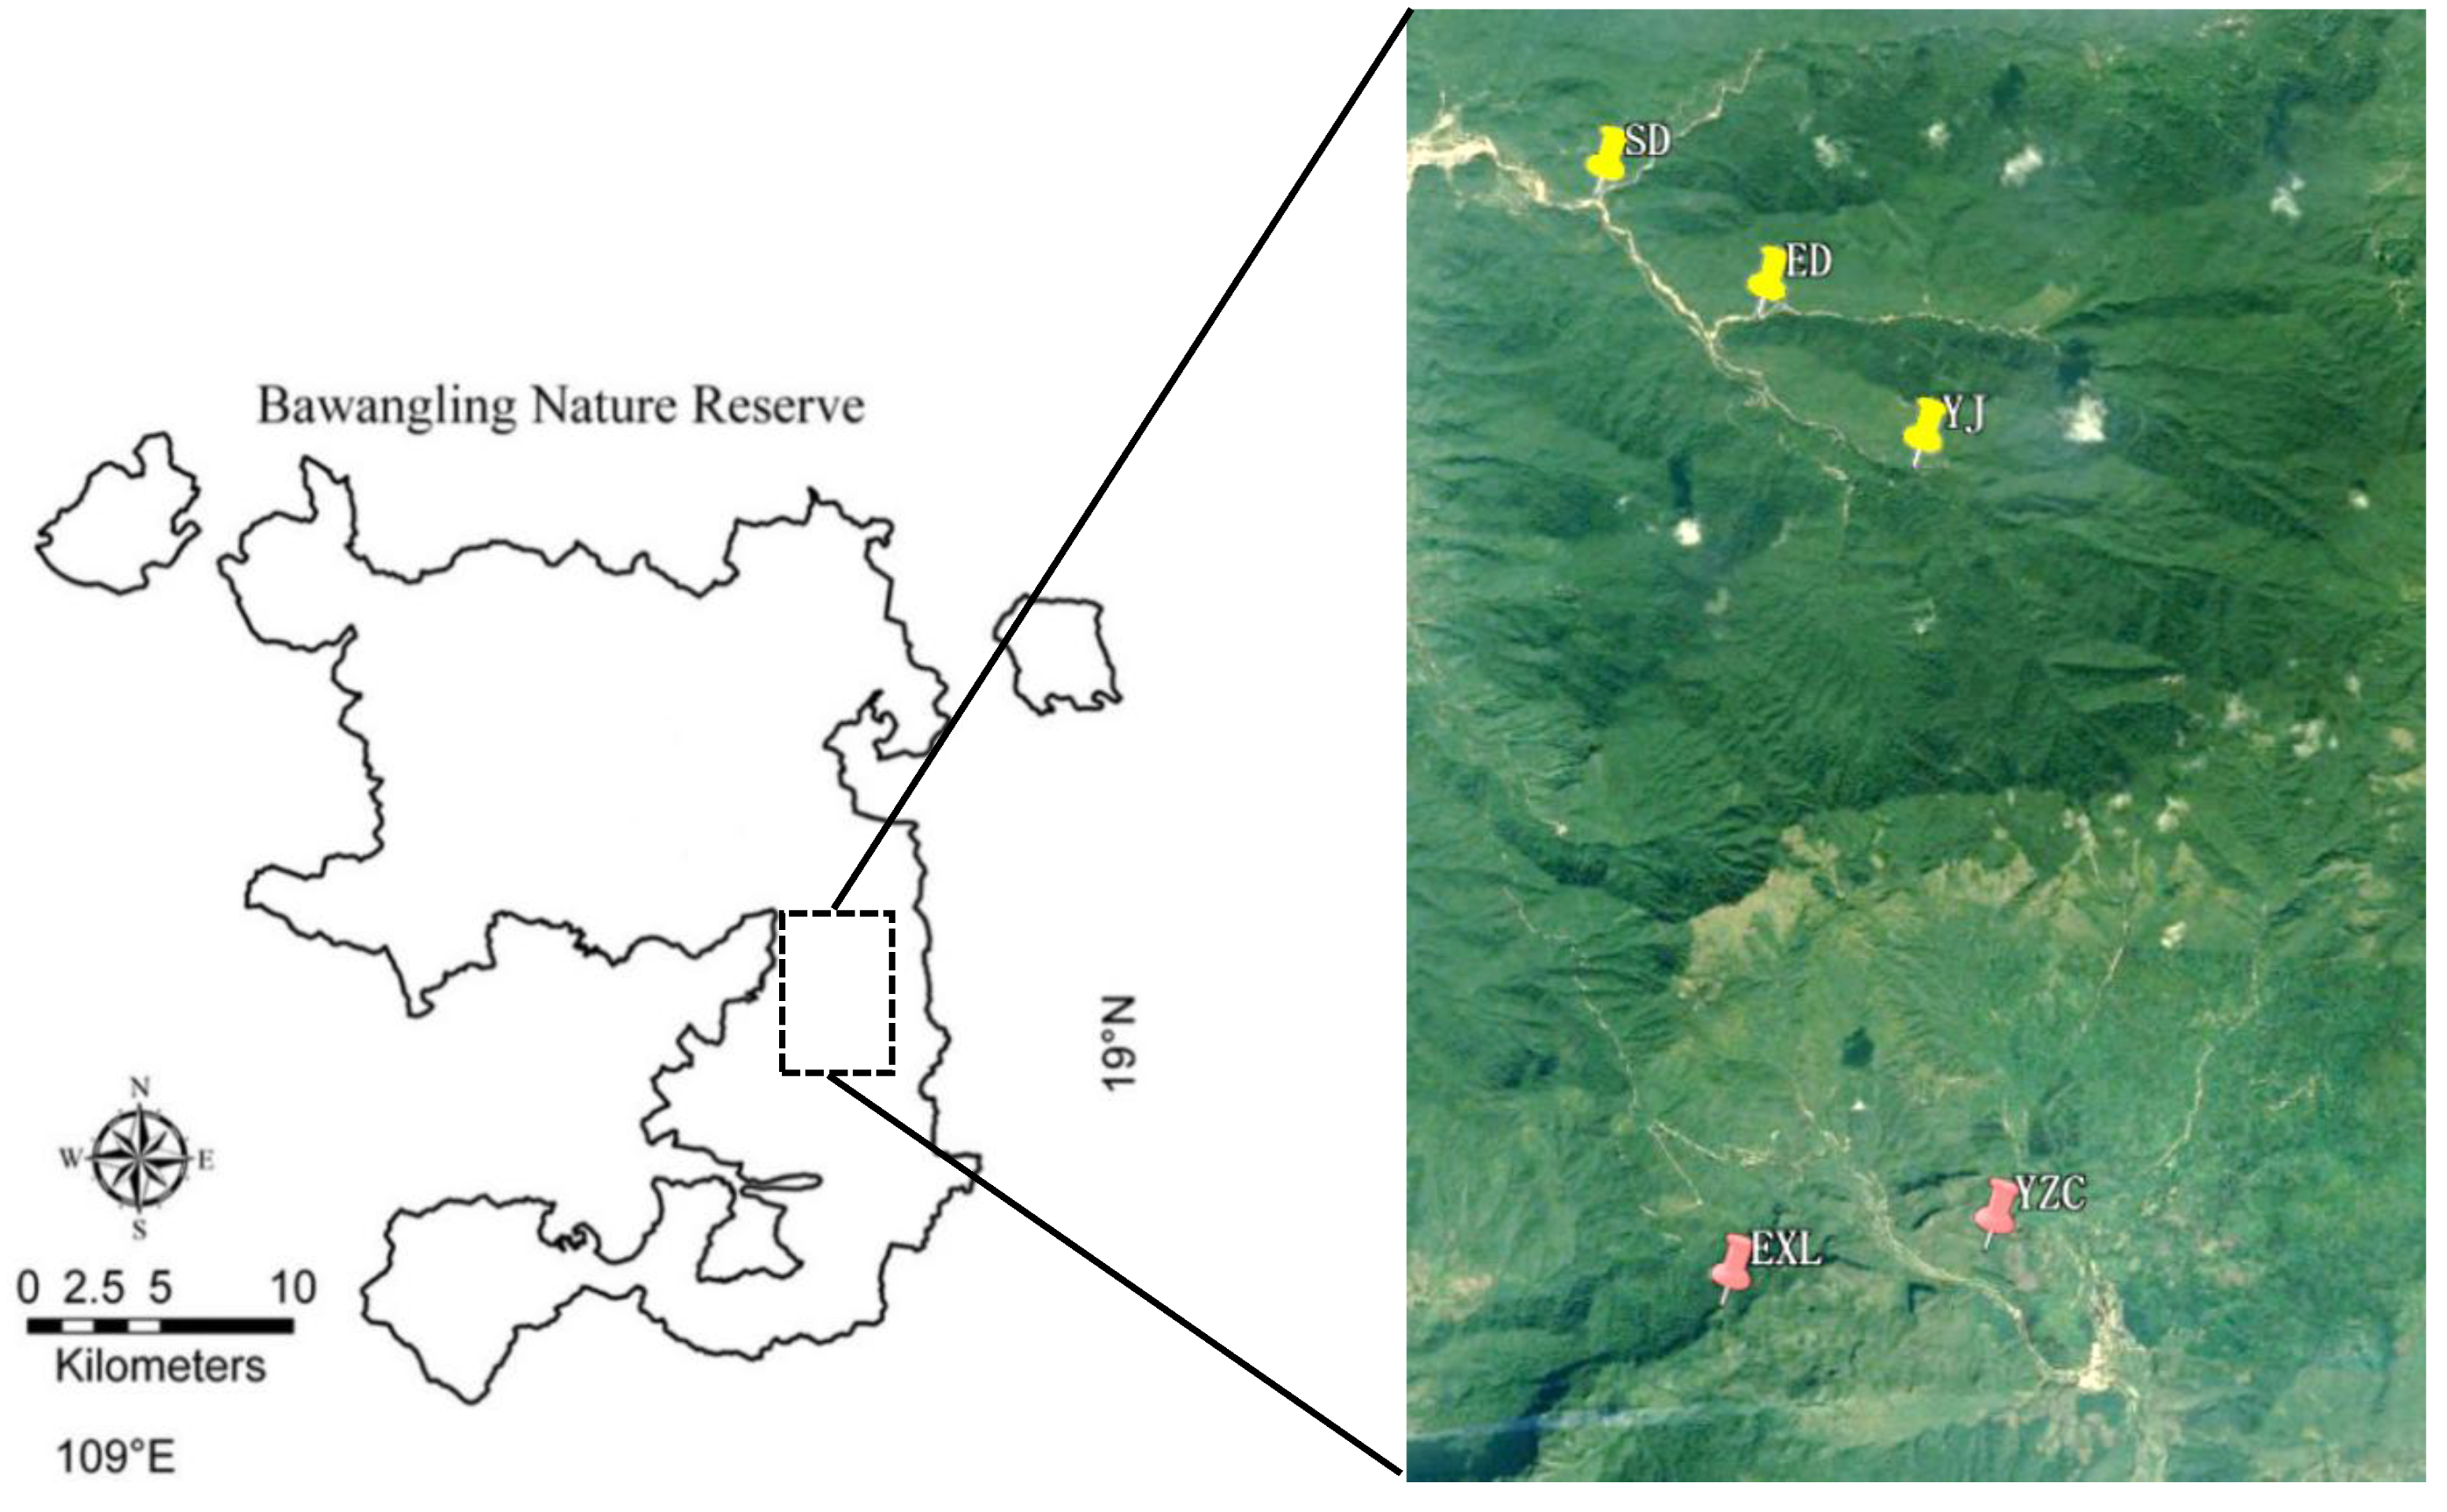
Third stage power station (SD) E: 109° 6’3.77” N: 19° 6’39.97” 230 m 5 m × 100 m 1
Second stage power station (ED) E: 109° 6’56.33” N: 19° 5’59.18” 284 m 5 m × 70 m 1
Yajia Power Station (YJ) E: 109° 7’46.34” N: 19° 5’8.74” 476 m 10 m × 70 m 1
Phalaenopsis hainanensis
Erxian Ridge (EXL) E: 109° 6’34.26” N: 19° 0’50.89” 1 050 m 10 m × 10 m 6
Coconut Village (YZC) E: 109° 7’59.55” N: 19° 1’5.07” 600 m 10 m × 10 m 3
Table 2. The species’ importance value in tree layer of Phalaenopsis deliciosa community.
Population Host Species Relative Abundance Relative Frequency Relative Coverage Importance Value
YJ Streblus taxoides 19.13 8.72 9.28 12.37
Erismanthus sinensis 7.54 5.96 11.99 8.50
Streblus ilicifolius 8.70 5.50 7.56 7.25
Hydnocarpus hainanensis 7.25 7.80 5.38 6.81
ED Mallotus peltatus 14.29 8.41 10.15 10.95
Erismanthus sinensis 5.44 4.67 7.85 5.99
SD Streblus ilicifolius 35.62 13.71 21.11 23.48
Streblus taxoides 24.12 12.57 11.06 15.92
Terminalia hainanensis 3.98 6.86 30.56 13.80
Dasymaschalon trichophorum 6.86 9.14 4.49 6.83
Cleistanthus concinnus 4.65 6.86 4.30 5.27
Total Streblus ilicifolius 20.13 7.20 10.80 12.71
Streblus taxoides 18.44 8.20 8.23 11.62
Terminalia hainanensis 2.00 2.60 10.90 5.17
Note: Only species with an important value greater than 5% are listed.
Table 3. The species’ importance value in shrub layer of Phalaenopsis deliciosa community.
Population Host Species Relative Abundance Relative Frequency Relative Coverage Importance Value
YJ Schizostachyum pseudolima 30.28 13.51 58.64 34.14
Streblus ilicifolius 11.31 6.76 10.26 9.44
Streblus taxoides 8.56 6.08 11.62 8.75
Dasymaschalon trichophorum 7.95 9.46 4.20 7.20
ED Schizostachyum pseudolima 50.78 20.00 75.26 48.68
Licuala fordiana 8.59 7.27 11.68 9.18
SD Schizostachyum pseudolima 20.42 17.98 57.08 31.83
Streblus ilicifolius 25.46 23.60 13.43 20.83
Dasymaschalon trichophorum 15.38 15.73 15.19 15.44
Streblus taxoides 16.45 14.61 6.96 12.67
Actephila merrilliana 16.98 14.61 4.48 12.02
Total Schizostachyum pseudolima 28.93 16.04 63.67 36.21
Dasymaschalon trichophorum 10.32 10.24 7.05 9.20
Streblus taxoides 10.80 7.51 5.92 8.08
Streblus ilicifolius 11.52 7.17 5.10 7.93
  Actephila merrilliana 8.76 6.14 2.07 5.66
Note: Only species with an important value greater than 5% are listed.
Table 4. The species’ importance value in tree layer of Phalaenopsis hainanensis community.
Population Host Species Relative Abundance Relative Frequency Relative Coverage Importance Value
EXL Quercus bawanglingensis 15.84 5.41 19.37 13.54
Streblus ilicifolius 14.85 8.11 17.21 13.39
Mallotus yunnanensis 19.80 5.41 11.28 12.16
Sterculia lanceolata 8.91 8.11 6.48 7.83
Aglaia odorata var. microphyllina 5.94 5.41 4.49 5.28
Osmanthus matsumuranus 1.98 5.41 8.29 5.22
YZC Streblus ilicifolius 14.74 4.65 13.21 10.86
Clausena excavata 16.84 6.98 7.52 10.45
Dehaasia hainanensis 7.37 9.30 12.13 9.60
Mallotus yunnanensis 7.37 2.33 14.24 7.98
Total Streblus ilicifolius 14.87 6.33 14.43 11.88
Mallotus yunnanensis 13.85 3.80 13.46 10.37
Dehaasia hainanensis 4.62 6.33 9.56 6.83
Clausena excavata 8.72 5.06 6.31 6.70
Quercus bawanglingensis 9.23 3.80 5.90 6.31
  Sterculia lanceolata 6.67 6.33 3.26 5.42
Note: Only species with an important value greater than 5% are listed.
Table 5. The species’ importance value in shrub layer of Phalaenopsis hainanensis community.
Population Host Species Relative Abundance Relative Frequency Relative Coverage Importance Value
EXL Mallotus yunnanensis 38.46 12.50 46.88 32.61
Croton cascarilloides 19.23 12.50 23.44 18.39
YZC Schefflera arboricola 16.67 50.00 67.57 44.74
Paramichelia baillonii 83.33 50.00 32.43 55.26
Total Mallotus yunnanensis 31.25 11.11 36.36 26.24
Schefflera arboricola 12.50 22.22 24.24 19.65
Croton cascarilloides 15.63 11.11 18.18 14.97
  Paramichelia baillonii 15.63 11.11 7.27 11.34
Note: Only species with an important value greater than 5% are listed.
Table 6. The flora distribution of vascular plants of Phalaenopsis deliciosa and Phalaenopsis hainanensis community.
Geographical Areal-Types Phalaenopsis deliciosa Phalaenopsis hainanensis
No. of Genus Proportion No. of Genus Proportion
1 Cosmopolitan 1 0.75 3 5.66
2 Pantropic 29 21.64 14 26.42
3 Trop. Asia & Trop. Amer. disjuncted 6 4.48 1 1.89
4 Old World Tropics 18 13.43 4 7.55
5 Trop. Asia toTrop. Australasia 21 15.67 8 15.09
6 Trop. Asia to Trop. Africa 13 9.7 1 1.89
7 Trop. Asia:India-Malasia 41 30.6 13 24.53
8 North Temperate 1 0.75 5 9.43
9 E. Asia & N. Amer. disjuncted 2 1.49 1 1.89
12 Central Asia,West Asia to the Mediterranean / / 1 1.89
14 E. Asia 2 1.49 2 3.77
Total 134 100 53 100
Table 7. Epiphytic selective index of Phalaenopsis deliciosa.
Species Abundance Frequence Total Plants Relative Abundance Relative Frequency Relative Dominance Epiphytic Index
Streblus ilicifolius 40 36 82 23.39 12.12 30.15 21.89
Streblus taxoides 34 41 55 19.88 13.80 20.22 17.97
Mallotus peltatus 11 15 17 6.43 5.05 6.25 5.91
Erismanthus sinensis 9 18 15 5.26 6.06 5.51 5.61
Sphenodesme pentandra 9 13 12 5.26 4.38 4.41 4.68
Hydnocarpus hainanensis 4 19 7 2.34 6.40 2.57 3.77
Artabotrys hainanensis 7 7 10 4.09 2.36 3.68 3.38
Dasymaschalon trichophorum 3 18 5 1.75 6.06 1.84 3.22
Acacia pennata 6 5 6 3.51 1.68 2.21 2.47
Koilodepas hainanense 4 8 6 2.34 2.69 2.21 2.41
Antirhea chinensis 3 6 7 1.75 2.02 2.57 2.12
Euonymus laxiflorus 3 9 3 1.75 3.03 1.10 1.96
Aporusa dioica 1 12 1 0.58 4.04 0.37 1.66
Millettia tsui 4 3 4 2.34 1.01 1.47 1.61
Tetracera asiatica 3 5 3 1.75 1.68 1.10 1.51
Ellipanthus glabrifolius 1 10 1 0.58 3.37 0.37 1.44
Diospyros cathayensis 1 8 2 0.58 2.69 0.74 1.34
Tarenna mollissima 1 8 1 0.58 2.69 0.37 1.22
Pterospermum heterophyllum 2 4 3 1.17 1.35 1.10 1.21
Strychnos angustiflora 1 5 3 0.58 1.68 1.10 1.12
Derris trifoliata 2 4 2 1.17 1.35 0.74 1.08
Vitex quinata 1 5 2 0.58 1.68 0.74 1.00
Amoora tsangii 1 6 1 0.58 2.02 0.37 0.99
Aphananthe cuspidata 1 4 2 0.58 1.35 0.74 0.89
Diploclisia glaucescens 2 2 2 1.17 0.67 0.74 0.86
Alphonsea mollis 1 3 2 0.58 1.01 0.74 0.78
Dalbergia peishaensis 2 1 2 1.17 0.34 0.74 0.75
Litchi chinensis 1 3 1 0.58 1.01 0.37 0.65
Rourea Microphylia 1 2 1 0.58 0.67 0.37 0.54
Sterculia lanceolata 1 2 1 0.58 0.67 0.37 0.54
Alyxia sinensis 1 2 1 0.58 0.67 0.37 0.54
Garcinia oblongifolia 1 2 1 0.58 0.67 0.37 0.54
Sarcosperma laurinum 1 2 1 0.58 0.67 0.37 0.54
Hunteria zeylanica 1 2 1 0.58 0.67 0.37 0.54
Argyreia acuta 1 1 1 0.58 0.34 0.37 0.43
Fissistigma oldhamii 1 1 1 0.58 0.34 0.37 0.43
Fraxinus griffithii 1 1 1 0.58 0.34 0.37 0.43
Murraya exotica 1 1 1 0.58 0.34 0.37 0.43
Ormosia semicastrata f. litchiifolia 1 1 1 0.58 0.34 0.37 0.43
Jasminum nervosum var. elegans 1 1 1 0.58 0.34 0.37 0.43
Table 8. Epiphytic selective index of Phalaenopsis hainanensis.
Species Abundance Frequence Total Plants Relative Abundance Relative Frequency Relative Dominance Epiphytic Index
Streblus ilicifolius 8 5 19 23.53 13.16 41.30 26.00
Mallotus yunnanensis 9 3 9 26.47 7.89 19.57 17.98
Sterculia lanceolata 2 5 2 5.88 13.16 4.35 7.80
Ulmus tonkinensis 1 5 1 2.94 13.16 2.17 6.09
Clausena excavata 1 4 1 2.94 10.53 2.17 5.21
Osmanthus matsumuranus 1 3 1 2.94 7.89 2.17 4.34
Schefflera arboricola 2 1 2 5.88 2.63 4.35 4.29
Fraxinus griffithii 1 2 1 2.94 5.26 2.17 3.46
Antirhea chinensis 1 2 1 2.94 5.26 2.17 3.46
Erythropsis pulcherrima 1 1 2 2.94 2.63 4.35 3.31
Ficus subpisocarpa 1 1 1 2.94 2.63 2.17 2.58
Microtropis submembranacea 1 1 1 2.94 2.63 2.17 2.58
Radermachera frondosa 1 1 1 2.94 2.63 2.17 2.58
Jasminum nervosum var. elegans 1 1 1 2.94 2.63 2.17 2.58
Ficus parvifolia 1 1 1 2.94 2.63 2.17 2.58
Streblus taxoides 1 1 1 2.94 2.63 2.17 2.58
Artabotrys hexapetalus 1 1 1 2.94 2.63 2.17 2.58
Table 9. The individual number of vertical distributions in nine sample plots.
Population Sample Plot Number Epiphytic Height (m) Total
0–0.9 1–1.9 2–2.9 3–4
EXL P1 5 7 8 1 21
P2 5 1 0 0 6
P3 0 5 4 0 9
P4 0 0 1 9 10
P5 10 0 0 0 10
P6 0 0 10 0 10
YZC P7 2 0 0 0 4
P8 0 4 1 0 5
P9 3 0 1 0 4
Total 25 17 25 10 77
Disclaimer/Publisher’s Note: The statements, opinions and data contained in all publications are solely those of the individual author(s) and contributor(s) and not of MDPI and/or the editor(s). MDPI and/or the editor(s) disclaim responsibility for any injury to people or property resulting from any ideas, methods, instructions or products referred to in the content.
Copyright: This open access article is published under a Creative Commons CC BY 4.0 license, which permit the free download, distribution, and reuse, provided that the author and preprint are cited in any reuse.
Prerpints.org logo

Preprints.org is a free preprint server supported by MDPI in Basel, Switzerland.

Subscribe

Disclaimer

Terms of Use

Privacy Policy

Privacy Settings

© 2025 MDPI (Basel, Switzerland) unless otherwise stated