Submitted:
20 October 2025
Posted:
05 November 2025
You are already at the latest version
Abstract
Hospitals are water-intensive facilities that must simultaneously assure reliable potable supply and consistent compliance at their wastewater treatment plants (IPAL/WWTP). Using the RSJD Dr. Amino Gondohutomo (Semarang) as a case study, we translate daily consumption into wastewater loading under a conventional 80/20 grey–blackwater split. The data records 221.80 m³/day of water demand, which implies about 174.91 m³/day domestic wastewater to the IPAL; these values allow a data-driven assessment rather than assumptions. The operation is constrained by two interlocking limits: an installed IPAL capacity of 240 m³/day and a wastewater discharge permit (IPLC) capping the daily effluent to 175 m³/day to Kali Gemah, creating a narrow hydraulic margin during peak-load days. We develop two indicators, (i) daily effluent-quota compliance and (ii) process loading relative to capacity, and test operational scenarios with and without equalization and controlled outflow. On the supply side, a planned full switch to PDAM (municipal water) in 2025 is documented, potentially reducing dependence on groundwater and improving upstream quality control. Effluent-quality monitoring shows most months in 2024 met domestic standards, with an October episode (coliforms, ammonia, phosphate) resolved via draining the disinfection basin and chlorine-dose adjustment, underscoring the importance of SOPs and QA/QC. We find that, although process capacity is ample, the daily discharge quota is tight; therefore, right-sized equalization (6–12 h of average flow) and day-sum outflow control are pivotal to maintain compliance, complemented by disciplined QA/QC and integrated debit monitoring. The PDAM switch further supports aquifer conservation and operational reliability.
Keywords:
hospital wastewater
; IPAL/WWTP
; discharge permit (IPLC)
; equalization
; Semarang
Introduction
Wastewater Treatment Plant (WWTP), known as IPAL in Indonesian, play a crucial role in environmental sustainability by treating wastewater to remove pollutants and recover resources. WWTP are essential for removing pollutants such as organic matter, nitrogen, and phosphorus from wastewater, preventing adverse environmental impacts (Bayat-Varkeshi et al., 2017). Modern WWTP focus on resource recovery, including water reuse, energy production, and nutrient recovery (Twi-Yeboah et al., 2024). Techniques like anaerobic digestion and microbial fuel cells are used to enhance energy efficiency and resource recovery (Arun et al., 2023). Greenhouse Gas Emissions: WWTP operations can contribute to greenhouse gas emissions, including CO₂, CH₄, and N₂O. Strategies to minimize these emissions include controlling operational variables like dissolved oxygen concentration and temperature (Bassin et al., 2021).
Improving energy efficiency of WWTP is a key focus, with strategies such as anaerobic digestion and advanced oxidation processes being explored to reduce energy consumption and operational costs (Arias et al., 2019; Tsalas et al., 2024). This is high operational costs and energy-intensive processes are significant challenges (Tsangas et al., 2023). Then, evaluating the economic sustainability of WWTPs in different regions can provide insights into best practices and foster improvements in governance and technology (Santos, 2021).
Hospital wastewater treatment plants (HWWTP) are essential for managing the complex and hazardous effluents generated by healthcare facilities (Khan et al., 2021). These effluents contain a variety of contaminants, including pharmaceuticals, pathogens, heavy metals, and emerging contaminants (ECs) such as endocrine-disrupting compounds and personal care products (Ramírez-Coronel et al., 2023). Effective treatment of hospital wastewater is crucial to prevent environmental pollution and protect public health (Xiong et al., 2020).
But there are several warnings. Hospital wastewater treatment plants are significant sources of microplastics (MPs) entering the environment. Studies have identified polypropylene as the predominant polymer in hospital wastewater, highlighting the need for further assessment and control measures (Kamani et al., 2024). Another pollutant concentrations also present in hospital wastewater which can vary significantly by region and hospital type (Niu et al., 2025). Untreated or inadequately treated hospital wastewater poses serious threats to public health and the environment. Effective treatment methods are essential to reduce the spread of infectious diseases and environmental contamination (Rodriguez-Mozaz et al., 2017; Dewi et al., 2022).
Hospitals are inherently water-intensive facilities such as clinical services, sanitation, laundry, kitchen/food & beverage (F&B), worship areas, and building utilities all depend on reliable potable-water supply and consistently compliant wastewater treatment (Verlicchi et al., 2015; Herrmann et al., 2015; Hassoun-Kheir et al., 2020). For large referral hospitals embedded in dense urban corridors, the operational pressure on both water supply and the wastewater treatment plant (WWTP/IPAL) increases, and compliance must be demonstrated not only for effluent quality but also for regulated discharge volumes. In this context, RSJD Dr. Amino Gondohutomo (Semarang) offers a representative case because it has namely a daily water demand of 221.80 m³/day, which, under a conventional 80/20 split between grey water and black water, translates into an estimated domestic wastewater flow to the IPAL of 174.91 m³/day. These values enable a data-driven assessment of the hospital’s water footprint and treatment loading rather than a purely assumptive one (Paulus et al., 2019).
Downstream, the hospital’s wastewater operations are constrained by two interlocking controls, the installed IPAL capacity and the conditions of the wastewater discharge permit (IPLC). The addendum states an installed IPAL capacity of 240 m³/day, while the IPLC limits the maximum daily effluent discharge to 175 m³/day to Kali Gemah. This juxtaposition, ample process capacity (240 m³/day) but a tight daily discharge quota (175 m³/day), necessitates careful flow management (equalization and controlled outflow), especially during peak-load days, to ensure the cumulative daily effluent never exceeds the licensed limit to the receiving water body.
On the supply side, the hospital is also undergoing a strategic transition. The document records a planned full switch to PDAM (municipal water) starting in 2025, implying a deliberate reduction in reliance on groundwater abstraction. Beyond supply reliability, this decision has clear environmental benefits: it reduces pressure on local aquifers in a heavily built-up setting and simplifies upstream quality assurance. In short, switching to PDAM is both a resource-governance measure and a long-term environmental safeguard for the Semarang aquifer system.
Figure 1.
Map of Groundwater Basins in Semarang CityTechnically, coupling the water balance from PDAM (and any legacy groundwater) through end-uses and into the IPAL with the IPLC constraint is central to understanding the hospital’s hydraulic margin. Given the current numbers at RSJD, the gap between estimated daily wastewater (174.91 m³/day) and the daily discharge limit (175 m³/day) is extremely narrow. Routine fluctuations such as busy visitation days, high-intensity internal activities, or short operational disturbances could push daily effluent over the limit unless actively managed. This sharpens the case for a properly sized equalization (EQ) tank to flatten both flow and concentration (BOD, COD, TSS) entering the biological process, and for outflow control that caps the day-sum effluent to stay within the 175 m³/day quota.

In terms of effluent quality, the hospital’s internal monitoring summary shows that most months in 2024 complied with domestic wastewater standards; however, October recorded three exceedances (coliforms, ammonia, phosphate). Corrective actions like draining the disinfection basin and adjusting chlorine dosing, returned the system to compliance (Yuan et al., 2015; Zhu et al., 2021). Practically, this episode illustrates two points: (i) the inherent sensitivity of treatment performance when loads and operations are not fully stabilized, and (ii) the effectiveness of prompt corrective measures when SOPs, preventive maintenance, and QA/QC are consistently applied. It also underscores that where volume limits are tight, operational discipline matters as much as design capacity.
From a policy and governance perspective, the combination of 240 m³/day installed capacity and a 175 m³/day discharge cap places RSJD in a precautionary operating regime: both discharge rate and daily accumulation must be actively controlled. Many large facilities find themselves compliant on quality but tripped by daily volume. Accordingly, integrated debit monitoring at the IPAL influent and the effluent hour by hour, together with daily bookkeeping is as crucial as laboratory quality testing. Merging a measured water balance, operational logs (as in power downtimes, maintenance, peak-load events), and response protocols (as in extreme-rain SOPs and scheduling of water-intensive activities) yields a more resilient risk posture under the permit’s quota.
In the scholarly literature, a notable research gap, particularly in Indonesian hospital contexts, is the scarcity of measured, facility-wide operational datasets that simultaneously capture water balance, daily discharge-quota compliance, and effluent-quality dynamics over time for a single campus, let alone a major psychiatric referral hospital. While many publications discuss hospital IPAL design in general terms, few demonstrate the causal links between operational scheduling, daily water balance, unit operations (EQ, biological, disinfection), and day-sum compliance with IPLC quotas (Pariente et al., 2022). Likewise, the empirical benefits of switching to PDAM for aquifer sustainability and upstream quality control, warrant quantitative evidence grounded in RSJD’s actual numbers rather than normative argumentation.
Against this backdrop, this article pursues five objectives: (1) to assemble a measured water balance for RSJD from the official document, mapping supply, use, wastewater (80%); (2) to evaluate whether the 240 m³/day IPAL capacity can sustain compliance with the 175 m³/day IPLC cap on a daily-sum basis and under realistic operational variability; (3) to quantify the hydraulic margin on busy days and simulate the role of equalization and controlled outflow in protecting the quota; (4) to review the effluent-quality performance documented to date and derive operational QA/QC recommendations (preventive maintenance, disinfection strategy, representative sampling); and (5) to assess the benefits of the PDAM switch for supply reliability and aquifer conservation.
The contributions are both practical and methodological. Practically, we articulate an operational decision framework, how large an EQ tank is “enough,” how to shape the daily outflow to respect the 175 m³ limit, and which leading indicators to monitor to avoid quota violations. Methodologically, we demonstrate how to convert static ANDAL figures into a dynamic water balance and operational risk map (flow-and-quality), a blueprint replicable at other hospitals governed by stringent IPLC quotas. The October episode serves as a learning case connecting sound design with disciplined operations.
Method
We conducted a quantitative case study at RSJD Dr. Amino Gondohutomo (Semarang) that integrates (i) a facility-level water balance, (ii) daily effluent-quota compliance checks, and (iii) operational scenarios for flow equalization and controlled outflow at the hospital’s wastewater treatment plant (IPAL/WWTP). The system has one IPAL with installed capacity of 240 m³/day, and a discharge permit (IPLC) that caps daily effluent to 175 m³/day to Kali Gemah.
We extracted the hospital’s daily potable-water demand (221.80 m³/day) from the field survey and converted it to domestic wastewater using a conventional 80/20 grey/blackwater split, yielding 174.91 m³/day to the IPAL. The table also disaggregates uses (patients, visitors, staff, canteen, worship, utilities), which we preserve for contribution analysis. We used the IPLC daily effluent limit (175 m³/day) to Kali Gemah and the installed IPAL capacity (240 m³/day) to construct compliance and loading indicators (U.S. EPA, 1976; Virginia Administrative Code, 2025)..
The previous environmental document records a planned full switch to PDAM (municipal water) from 2025, which we treat as an upstream scenario affecting the hospital’s water footprint and groundwater reliance. The hospital performs monthly effluent monitoring and semiannual receiving-water monitoring. The summary shows most months in 2024 comply, with an October episode (coliforms, ammonia, phosphate) mitigated via draining the disinfection basin and chlorine-dose adjustment, used here as an operations/QA case.
We define boundaries from supply (PDAM and any legacy groundwater) to effluent at the licensed outlet to Kali Gemah. Unmetered internal losses (minor leaks, flushing) are not explicitly modeled due to lack of continuous data and are assumed small relative to totals. Wastewater estimation uses the 80% of consumption convention (grey-water dominated domestic loads) as cited in the document’s technical references; this aligns with standard engineering practice for hospital-domestic flows.
We construct a daily mass balance at campus scale:
where Qdemand is the hospital’s total daily water demand and Qww the domestic wastewater sent to the IPAL. For RSJD, Qdemand is roughly 221.80 m3/day or Qww 174.91 m3/day. This becomes the hydraulic load compared against the IPLC quota (175 m³/day) and the installed capacity (240 m³/day).
We compute two quantitative indicators:
Daily Effluent-Quota Compliance (DEQC)
DEQC ≤ 1 denotes volume compliance. When only the balance is available, Qeffluent,day is proxied by Qww subject to equalization storage.
Process Loading Index (PLI)
with PLI<1 indicating loads below installed capacity.
We evaluate two operational “what-if” scenarios. Scenario A is when there is no additional equalization. Qeffluent,day ≈ Qww. This tests a conservative, peak-day situation where the IPLC quota could be approached or exceeded without buffering. The focus is DEQC. Scenario B, equalization + controlled outflow, providing buffer storage (equalization) to flatten influent quality and cap effluent day-sum at ≤175 m3/day. While the capacity limit (240) and IPLC cap (175) are fixed, we parameterize EQ size (engineering guidance ≈6–12 h of average flow) as an operational lever and assess improvements in DEQC robustness. We also note the upstream PDAM switch (2025) as a policy scenario that reduces groundwater abstraction and simplifies inbound water-quality control.
Effluent-quality monitoring was conducted at two fixed points within the hospital sewer treatment system, which are T1 IPAL inlet (S O7O.0’39.024”; E 110O.27’.732”) and T2 IPAL outlet (S O7O.0’.39.204”; E 110O.27’44.161”). Routine monitoring followed the hospital schedule of monthly final-effluent tests and semiannual receiving-water checks; inlet sampling at T1 was performed in parallel with effluent sampling at T2 during the same campaign to ensure comparability. Unless otherwise stated, samples were grab samples collected during typical daytime operation (outside of shock-loading events), preserved per method requirements, and transported under chain-of-custody to an accredited laboratory. The analyte suite comprised pH, BOD, COD, TSS, oil & fat, ammonia (NH₃-N), total coliform, and flow indicators, aligning with the domestic wastewater standard referenced in the hospital’s permit documentation. Field records captured date/time, sampler, weather, operational notes, and any deviations from SOP. We cross-reference these with ops logs (power downtimes, basin maintenance) to interpret anomalies.
We perform a stress test on DEQC by perturbing Qww by +10 to 20% to emulate busy-day spikes without equalization. A sensitivity analysis varies the conversion factor f over 0.75–0.85 (within domestic-flow norms) to examine the robustness of recommendations. Permit limits and installed capacity remain fixed to the values in the document.
All quantitative inputs are taken from the hospital’s primary data and related IPLC text. We do not alter permit values but evaluate compliance against them. The chief limitation is the absence of continuous (hourly) time series for demand/effluent and equalization levels. Thus, some scenario work adopts conservative (peak-day) assumptions. Continued monitoring is required to refine the operational model and verify day-sum margins.
Results and Discussion
3.1. Result
The primary data on Andal resulted a daily potable-water demand of 221.80 m³/day and converts this to domestic wastewater of 174.91 m³/day using an 80/20 grey–blackwater convention. It disaggregates contributions from patient sanitation (366 beds), visitors (350 persons/day), staff (431 persons), canteen (500 persons), worship area (1,000 persons), and utilities (cleaning/irrigation), and then aggregates to the total water demand and wastewater sent to the IPAL. This establishes a measured, component-level water balance for the campus rather than a purely parametric estimate.
Importantly, it notes a planned transition to PDAM (municipal water) beginning in 2025, signifying a strategic shift away from groundwater for the hospital’s base supply. In methodological terms, this PDAM switch is treated as an upstream operational scenario that may reduce aquifer pressure and simplify input-quality control for the treatment system.
On the process side, it recognizes one IPAL and an IPLC permit that caps daily effluent discharge at 175 m³/day to the Kali Gemah drainage. The same passage states that the hospital has one IPAL with capacity 240 m³/day, creating a characteristic asymmetry: the installed process capacity (240) exceeds the daily discharge quota (175), so daily compliance hinges not on treatment capacity per se but on how effluent is released and summed over each day.
We note that other parts of the document (legacy/equipment summaries) still carry the earlier “200 m³/day” reference for IPAL capacity; however, the capacity-plus-IPLC passage that also cites the 175 m³/day daily cap and the Kali Gemah receiver is the most explicit statement of current permitting conditions.
Using the measured balance, the estimated daily wastewater to IPAL is 174.91 m³/day. When compared with the IPLC daily cap of 175 m³/day, the implied Daily Effluent-Quota Compliance (DEQC) ratio is 0.999 on an average day, i.e., a razor-thin margin between the typical campus load and the daily discharge quota. In operational terms, even modest day-to-day variability (visitation peaks, housekeeping, episodic flushing, or minor metering error) could push the day-sum beyond the licensed limit if effluent is discharged at the same rate it is received. This finding directly motivates flow equalization and controlled outflow to decouple influent fluctuations from effluent day-sum release.

Table 1.
Initial Measurements of The Samples.
| Scenario | Daily low (m³/d) | Quota Status |
| Baseline | 174.91 | Compliant |
| Peak +10% | 192.40 | Exceeds |
| Peak +20% | 209.90 | Exceeds |
| +EQ 6–12 h (capped) | ≤175.00 | Compliant |
Sources : Primary Data, 2025.
The bars plot the estimated day-sum effluent released from the hospital’s IPAL under three conditions: Baseline (174.9 m³/day), Peak +10% (192.4 m³/day), and Peak +20% (209.9 m³/day). The dashed horizontal line marks the daily discharge quota of 175 m³/day set by the permit. At baseline, the column sits just below the quota (DEQC = 0.999), indicating a razor-thin hydraulic margin, namely routine noise (metering error, brief housekeeping flushes, short maintenance events) could flip compliance. Under +10% and +20% peaks values that are realistic on busy visitation or event days, the day-sum effluent exceeds the quota by roughly 17.4 m³ and 34.9 m³, respectively, if effluent is discharged at the same rate it is received.
Figure 2.
Daily effluent under baseline and peak-day scenarios versus the IPLC quota.
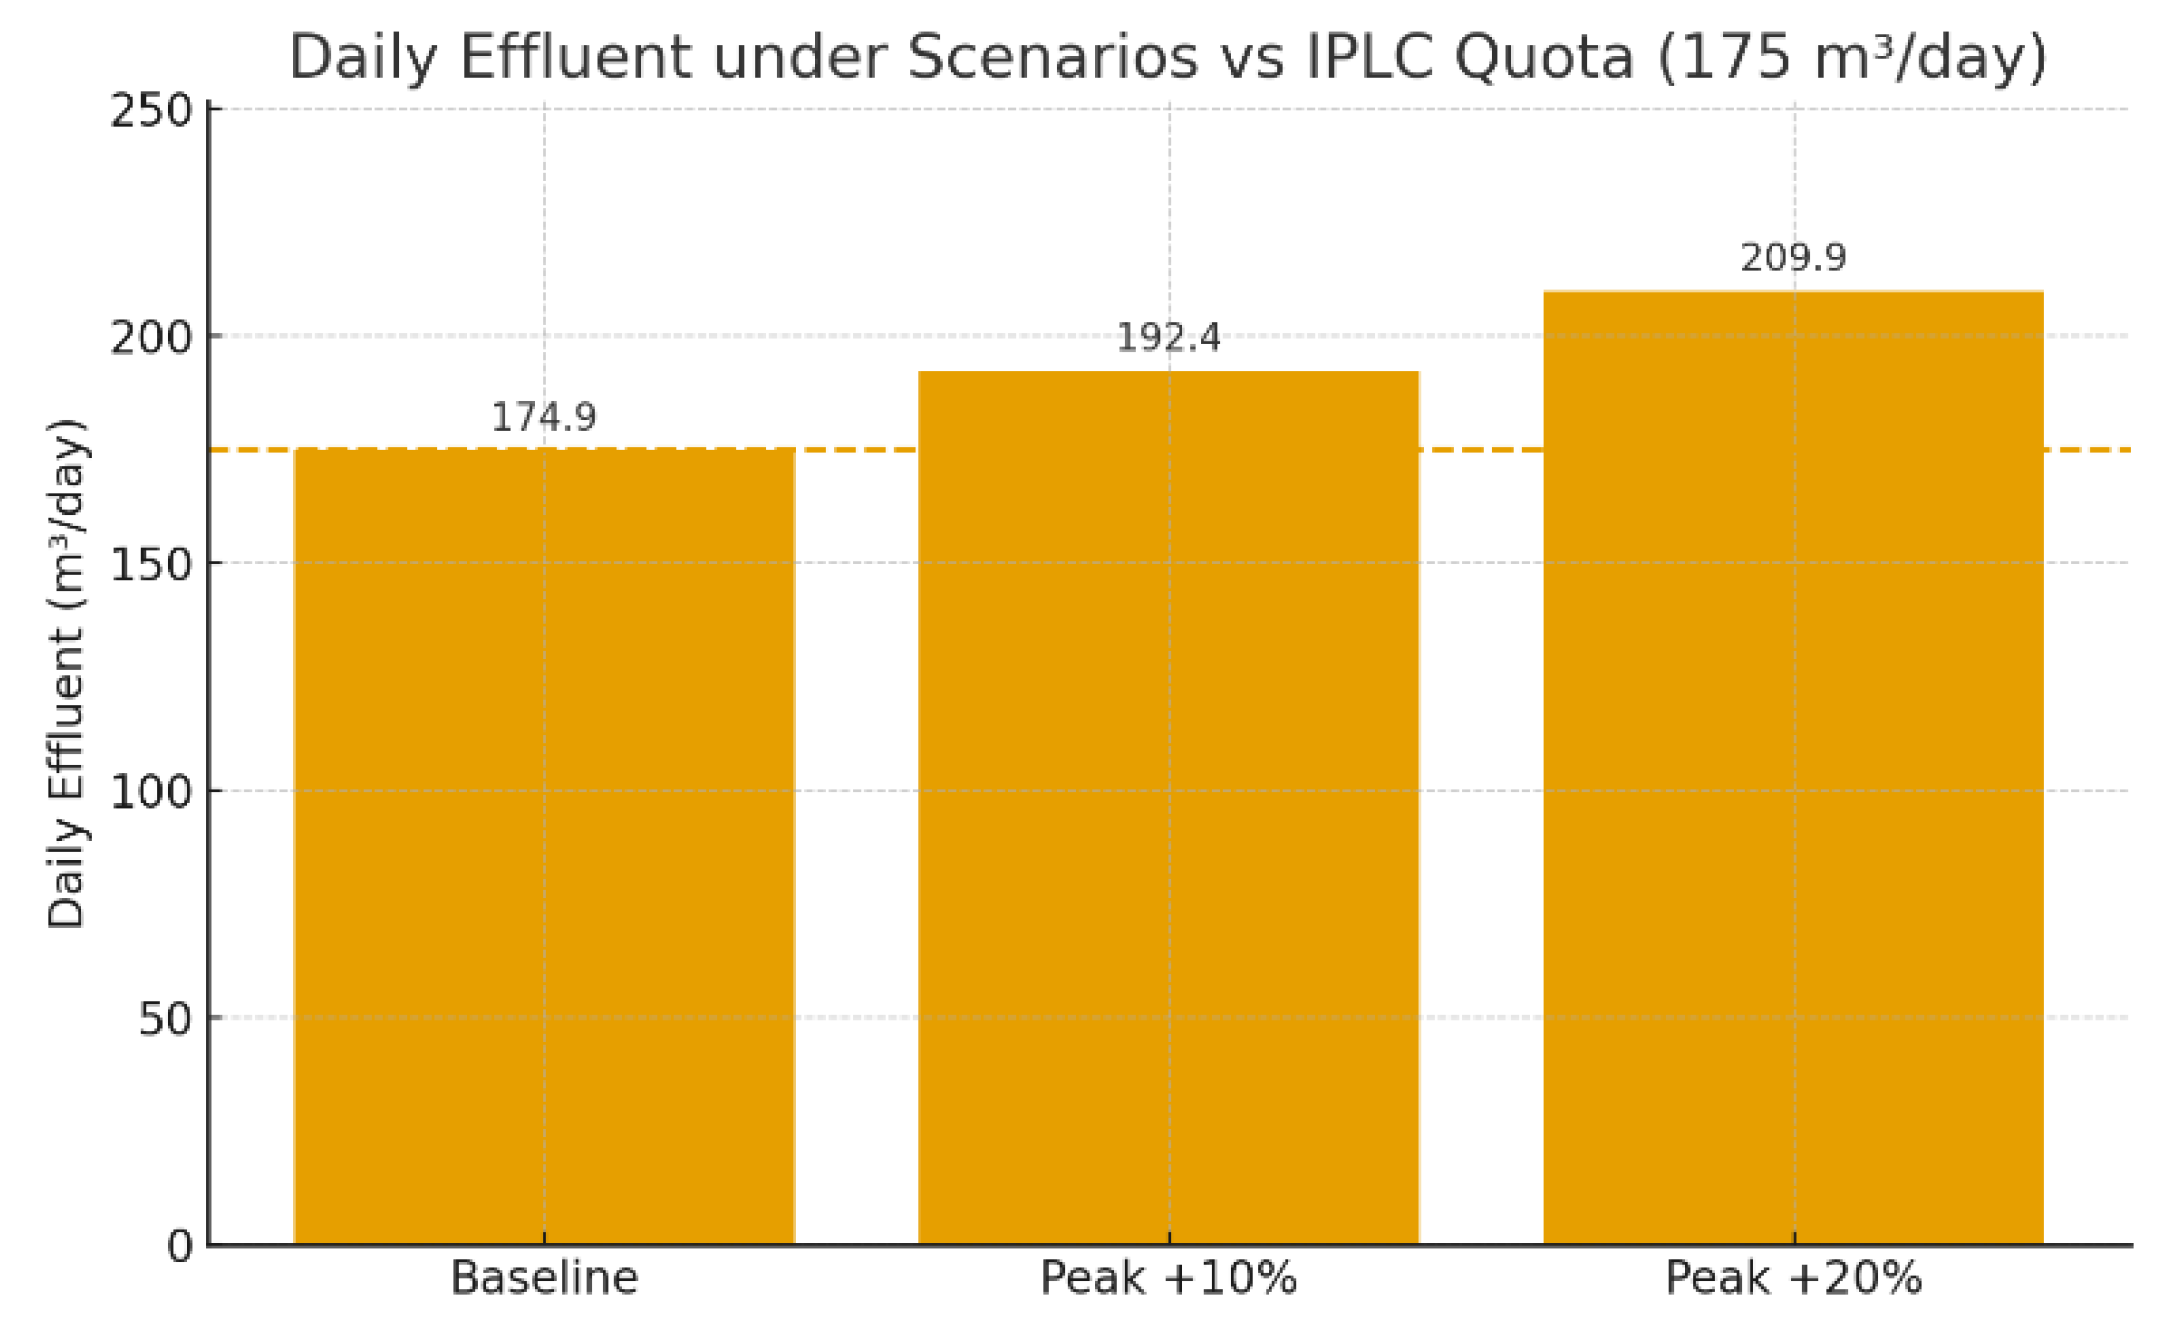
Operationally, the figure makes two points. First, the plant is not capacity-limited (process PLI < 1 at these loads); volume quota is the binding constraint. Second, to remain compliant across peaks, equalization (6–12 h of average flow, 45–90 m³ working volume) must be paired with metered outflow so that the cumulative day-sum is actively capped at ≤ 175 m³. In practice, this means blending and buffering influent in the EQ tank, releasing treated effluent on a controlled schedule (and, where feasible, timing releases to off-peak hydrologic windows), while maintaining routine QA/QC at disinfection.
Relative to the installed capacity of 240 m³/day, the measured influent (174.91 m³/day) implies a Process Loading Index (PLI) near 0.73, indicating that the biological process is not hydraulically overloaded in steady conditions. This is consistent with a plant that can, in principle, treat the expected flows effectively, provided that influent variability is dampened and that unit processes (screening, equalization, SBR, disinfection) are operated within control envelopes. Where the inventory table lists 200 m³/day, the same load would correspond to PLI = 0.87, still sub-critical but with a smaller operational headroom. Either way, the binding constraint remains the daily effluent quota rather than the nominal treatment capacity.
Figure 3.
Process Loading Index (PLI) under baseline and peak-day scenarios relative to the capacity threshold.
Figure 3.
Process Loading Index (PLI) under baseline and peak-day scenarios relative to the capacity threshold.
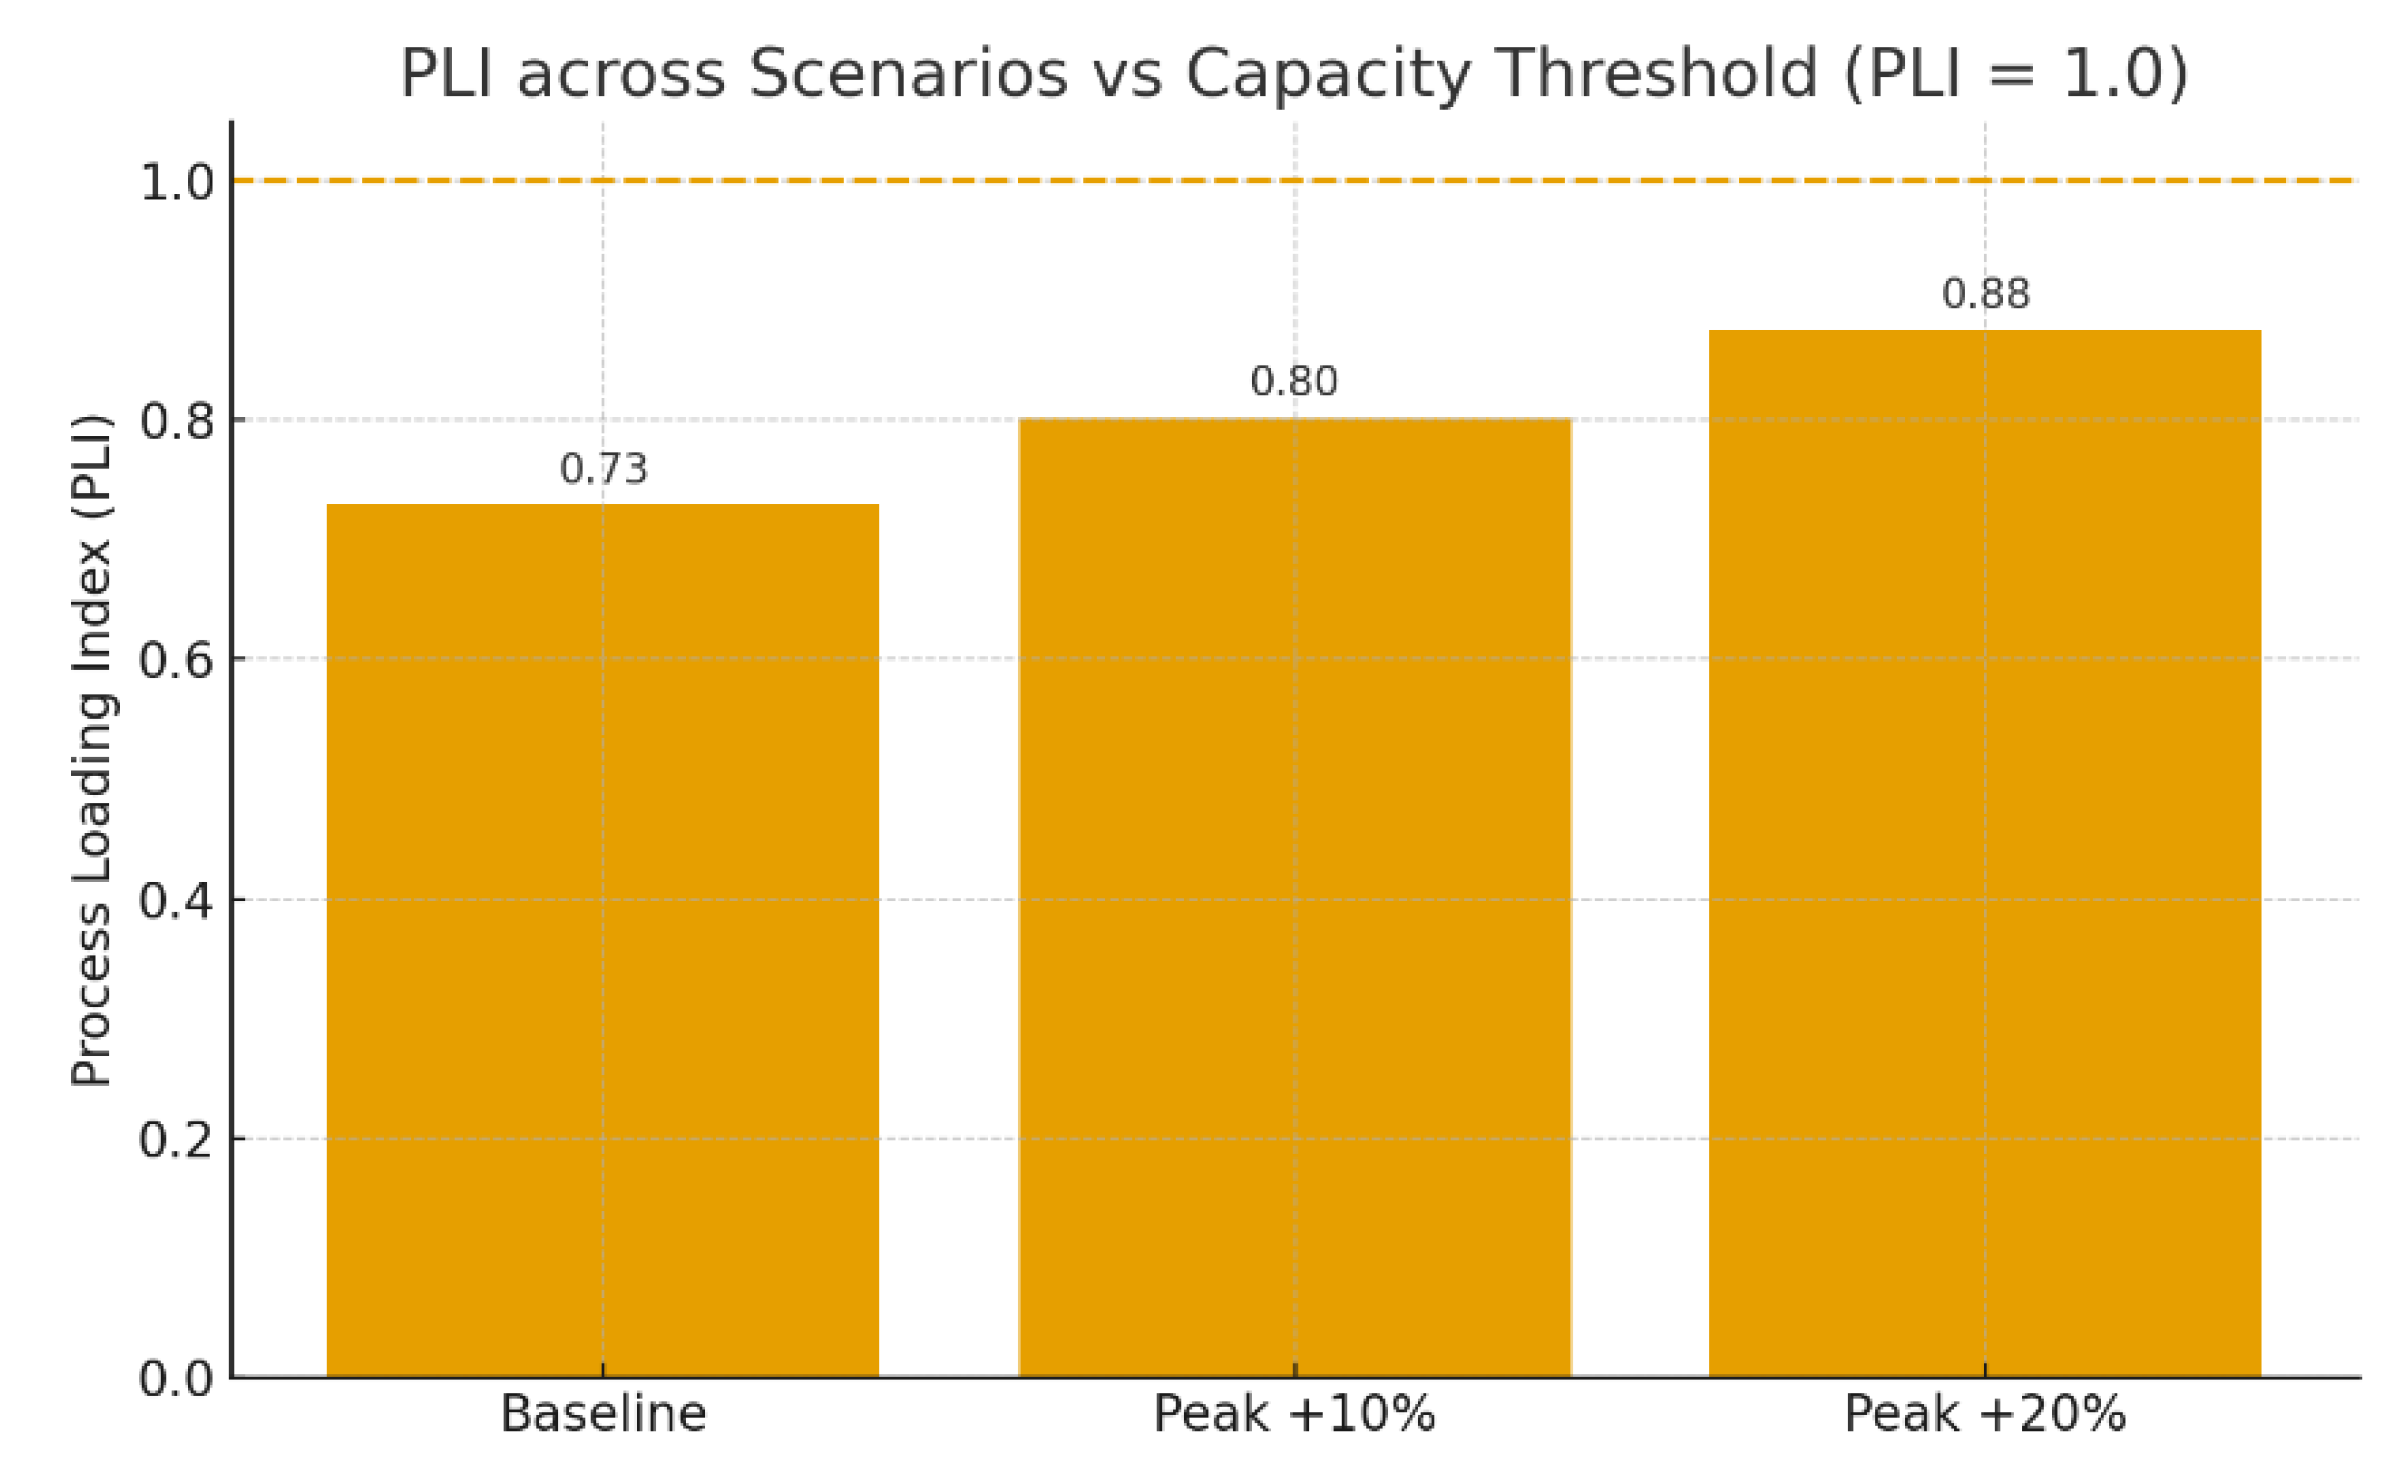
Bars show PLI = influent / installed capacity (240 m³/day) for Baseline (PLI = 0.73), Peak +10% (0.80), and Peak +20% (0.88). The dashed line at PLI = 1.0 denotes the nominal capacity envelope. Even at +20% peaks, the process remains below hydraulic capacity (PLI < 1), indicating no process overload. This confirms that daily volume quota (175 m³/day) is the binding constraint; compliance therefore depends on equalization + metered outflow to keep the day-sum effluent ≤ 175 m³.
The monitoring summary states that for July, August, September, November, and December all parameters met the applicable domestic wastewater standards, while October recorded three exceedances, which are MPN coliform, ammonia, and phosphate. The corrective actions documented were draining the disinfection basin and adjusting chlorine dosage, with subsequent months returning to compliance. From a process-control standpoint, this pattern is consistent with a system that is broadly capable yet sensitive to operational upsets, particularly at the disinfection and nutrient-control end.
Table 2.
Waste Water Analysis.
| No | Parameter | Inlet | Outlet | Standard | Unit | Compliance | Removal (%) |
| 1 | pH | 6.8 | 6.4 | 6–9 | – | Yes | – |
| 2 | BOD | 12.8 | 5.4 | 30 | mg/L | Yes | 57.8 |
| 3 | COD | 38.6 | 16.3 | 100 | mg/L | Yes | 57.7 |
| 4 | TSS | 21.6 | 4.3 | 30 | mg/L | Yes | 80.2 |
| 5 | Oil & Fat | <1 | <1 | 5 | mg/L | Yes | – |
| 6 | Ammonia | 2.6 | 0.8 | 10 | mg/L | Yes | 69.2 |
| 7 | Total Coliform | 12 | 16 | 3000 | MPN/100 ml | Yes | – |
| 8 | Flow/ Debit | 75 | 75 | 100 | L/person/day | Yes | – |
Source: Laboratory Result, 2024.
All parameters complied with the applicable domestic standards at the time of sampling. Physico-chemical removal was moderate to high, BOD = 58%, COD = 58%, TSS = 80%, and ammonia = 69%, consistent with a stable biological process followed by disinfection. Oil & fat remained <1 mg/L across inlet–outlet (non-detect), indicating effective grease control upstream. Total coliform showed a slight increase from 12 to 16, but still sat well below the reference threshold (3000 MPN/100 mL), pointing to adequate disinfection performance at the time of testing. The flow indicator (75 L/person/day) also satisfied the operational benchmark (≤100). Altogether, these results align with the discussion that process capacity is not the limiting factor; instead, daily discharge quota requires equalization plus metered outflow to maintain day-sum compliance.
The permit text ties the daily discharge cap (175 m³/day) to discharging into drainage along Brigjend Sudiarto/Kali Gemah, aligning treatment operations with the capacity and condition of the downstream drainage system. Separate hydrologic text in the addendum notes localized constraints in parts of the southern drainage, which heighten the need for controlled, steady releases from the hospital to avoid exacerbating peak flows during heavy rain. This strengthens the operational case for equalization not only to manage the IPLC day-sum but also to harmonize discharge timing with receiving-drain capacity.
1.2. Discussion
The core operational insight is that daily volume compliance, not hydraulic throughput, is the hospital’s binding constraint. With 174.91 m³/day typical wastewater generation against a 175 m³/day IPLC cap, the headroom is essentially zero. In the absence of buffering, even routine perturbations 10–20% peak-day spikes from visitation or periodic housekeeping, could breach the day-sum quota. While the process trains (SBR/biological) can handle the flows on a capacity basis, the temporal pattern of effluent release must be actively controlled to keep the cumulative daily discharge within the limit. Equalization is therefore not optional, it is the principal compliance instrument under a day-sum regime.
To test robustness against plausible variation in the conversion factor f (share of demand that becomes domestic wastewater), we probed a domestic range of 0.75–0.85 and compared it with the baseline implied by the ANDAL (f≈0.789, since 174.91/221.80). As shown in Table 3, even at the lower bound f=0.75 the process remains comfortably below capacity (PLI = 0.693) and well within the daily quota (DEQC = 0.951). At the baseline f=0.789, DEQC is = 0.999, a razor-thin margin which necessitating equalization and metered outflow to reliably cap the day-sum at ≤175 m³/day. At the upper bound f=0.85, the day-sum would exceed the quota by ~13.53 m³ (DEQC = 1.077) even though the process is still not hydraulically overloaded. These bounds confirm that volume quota compliance, not process capacity, is the binding constraint, and that equalization + outflow capping are required under reasonable parameter uncertainty.
Table 3.
Sensitivity of daily compliance to the conversion factor.
| Scenario (f) | Wastewater to IPALQww (m³/day) |
DEQC = Qeffluent/ 175 |
Over-quota (m³/day) | PLI =Qinfluent/240 |
| Lower-bound (0.75) | 166.35 | 0.951 | 0.00 | 0.693 |
| Baseline (0.789) | 174.91 | 0.999 | 0.00 | 0.730 |
| Upper-bound (0.85) | 188.53 | 1.077 | 13.53 | 0.786 |
Source: Analysis, 2025.
For hospitals with pronounced diurnal and day-to-day fluctuations, an EQ volume on the order of 6–12 hours of average flow is generally sufficient to flatten peak influent and allow a metered, capped outflow such that ∑Qeffluent ≤ 175 m³/day. At RSJD’s measured load, this implies an EQ working volume roughly 45–90 m³, adjustable upward if quality stabilization (BOD/COD/TSS) is prioritized or if load spikes are known to be sharper on event days. Operationally, EQ should be equipped with level sensing, gentle mixing/aeration to prevent anaerobiosis and odors, and outflow control tied to a daily effluent budget. In addition to volume compliance, EQ improves biological process stability by blending high-strength streams with domestic flows before the SBR.
The presence of 200 m³/day capacity in the equipment inventory versus 240 m³/day in the permit-context passage is typical of multi-year documentation where upgrades or nameplate ratings evolve. For compliance governance, the more probative text is the one that explicitly couples capacity with the IPLC language and the named receiver (Kali Gemah). In practice, whether 200 or 240, the operating policy does not change, the day-sum cap dominates, and the EQ-plus-metered outflow strategy remains the safest path to robust compliance.
The laboratory results show full compliance against domestic standards at the time of sampling: BOD (58% removal), COD (58%), TSS (80%), ammonia (69%), oil & fat below detection, and pH within the 6–9 band; total coliform remained far below the reference threshold. This profile is consistent with a biologically stable train followed by effective disinfection, but it also highlights sensitivities at the tail end of treatment where disinfection hydraulics and dosing discipline matter. To harden performance, the priorities are (i) maintain verified residual chlorine and prevent short-circuiting in the contact tank (ii) keep aeration DO in the 2–3 mg/L envelope and SRT in the process window to avoid ammonia breakthroughs (iii) ensure representative sampling (timed to diurnal patterns and annotated with operational context); and (iv) institutionalize preventive cleaning of the disinfection basin and routine calibration of flow meters/online probes.
Because the licensed outfall discharges to the Brigjend Sudiarto/Kali Gemah drainage, hydraulic performance downstream can influence risk upstream. Seasonal sedimentation and reduced conveyance in parts of the southern drain imply that unmodulated peak releases from the hospital could compound local surges during rainfall. Equalization (EQ) is therefore a dual-purpose instrument, it protects the daily quota (by capping day-sum effluent) and harmonizes release timing with the receiving drain’s capacity. In practice, this means operating the EQ not only as a blender but as a modest time-shift buffer, scheduling controlled outflow to off-peak hydrologic windows when feasible, while keeping internal grates/sumps clear to minimize backwater effects at the campus boundary.
The planned full switch to PDAM (from 2025) reduces reliance on groundwater and tends to stabilize both pressure and quality at the point of entry, benefits that simplify the upstream half of the water balance and support aquifer conservation. However, the central compliance bottleneck remains downstream, the 175 m³/day discharge quota. Even with steadier PDAM supply, peaks in internal demand still translate to peaks in wastewater generation unless buffered. Hence, the PDAM transition should be read as a complementary measure: it improves upstream reliability and sustainability, while EQ + metered outflow remains the decisive control pair for day-sum compliance.
Under a daily-quota regime, governance is operationalized through three layers, (1) real-time volume control, sub-daily logging of effluent flow with a running discharge budget that operators actively manage to keep the cumulative total ≤ 175 m³/day; (2) routine laboratory assurance, monthly IPAL effluent tests and semiannual receiver checks, tied to acceptance criteria and corrective actions; and (3) EQ levels, influent flow, rainfall, power outages, maintenance, and dosing adjustments recorded alongside lab data. Together, these layers transform the plant from a passive treatment asset into a permit-aligned control system. Practically, standard operating procedures should codify daily set-points for outflow, escalation, and a clear record-keeping protocol that survives audits.
Two constraints shape the current evidence base. First is the lack of continuous (hourly) time series for flow and EQ levels, and the second is historical discrepancies in listed treatment capacity (200 vs 240 m³/day). Neither changes the conclusion that the daily discharge quota is the binding constraint, but both motivate a short verification agenda, install/validate influent–effluent flow metering and EQ level logging; reconcile nameplate versus effective capacity in a single operations sheet; and extend sensitivity checks beyond peak-day stress tests to include parameter uncertainty. Notably, even at the upper-bound f, process loading (PLI) remains < 1, while volume compliance can be lost, reinforcing that equalization and day-sum capping are non-negotiable for robust, auditable compliance.
Conclusion
This case study shows that RSJD Dr. Amino Gondohutomo’s wastewater system is process-capable but quota-constrained. The measured water balance (221.80 m³/day demand) translates to 174.91 m³/day domestic wastewater, essentially sitting on top of the daily discharge limit of 175 m³/day. Even though the installed WWTP (IPAL) capacity (240 m³/day) provides hydraulic headroom, the day-sum quota is the binding constraint.
Peak-day stress tests (+10–20%) demonstrate that unbuffered operations would exceed the permit despite PLI remaining <1, confirming that compliance hinges on how effluent is released over the day, not on nameplate treatment capacity. Quality data indicate broadly compliant performance with good removals BOD/COD/TSS/NH₃-N and oil/grease control, while reminding us that the tail end or disinfection and nutrient control, is sensitive to operational discipline. Discharging to the Brigjend Sudiarto/Kali Gemah drainage further underlines the need to smooth and time releases to avoid compounding local hydrologic peaks. The planned full switch to PDAM from 2025 is a positive upstream measure, which is supporting aquifer conservation and stabilizing inlet conditions, but it does not remove the downstream reality that the hospital operates under a tight daily volume regime.
Recommendation
Operationally, the priority is to install/operate effective equalization (6–12 hours of average flow; 45–90 m³ working volume) and pair it with metered outflow so the cumulative discharge is actively capped at ≤175 m³/day. Treat the plant as a permit-aligned control system, as to implement a daily discharge budget, sub-daily flow logging, and clear escalation rules as when to throttle outflow or temporarily store. Strengthen QA/QC loops at the disinfection and biological stages like verify residual chlorine/contact time, hold DO 2–3 mg/L, keep SRT within target, and align sampling to diurnal patterns with thorough ops annotations. Coordinate discharge timing with receiving-drain capacity (favor off-peak hydrologic windows), and keep internal drainage hardware as grates/sumps clear to minimize backwater effects.
As governance housekeeping, reconcile any legacy capacity figures in one operations sheet; validate influent/effluent metering and EQ-level logging; and retain concise, auditable records linking lab results to operating conditions and corrective actions. Finally, maintain the planned PDAM switch to stabilize supply and reduce groundwater reliance, then use the stability it brings to fine-tune EQ set-points and outflow schedules. Taken together, these steps convert today’s razor-thin margin into a robust, defensible operating envelope that meets both the letter and the spirit of the discharge permit.
References
- Arias, A., Feijoo, G., & Moreira, M. T. (2019). Technoeconomic analysis, life cycle assessment and economic analysis of wastewater and sludge treatment systems. In Elsevier eBooks (pp. 85–114). [CrossRef]
- Arun, J., Nirmala, N., Dawn, S., Priyadharsini, P., Kumar, B. S., & Kabilan, K. (2023). Microalgae-based processes for resource recovery from municipal wastewater treatment plants. In Elsevier eBooks (pp. 27–40). [CrossRef]
- Bassin, J. P., Castro, F. D., Valério, R. R., Santiago, E. P., Lemos, F. R., & Bassin, I. D. (2021). The impact of wastewater treatment plants on global climate change. In Elsevier eBooks (pp. 367–410). [CrossRef]
- Mohammadi, K., & Najib, R. (2017). BOD and COD Estimation in WastewBayat-Varkeshi, M., Mohammadi, K., & Najib, R. (2017). BOD and COD Estimation in Wastewater Outflow via Artificial Neural Network. In Advances in Science, Technology & Innovation/Advances in science, technology & innovation (pp. 875–876)ater Outflow via Artificial Neural Network. In Advances in Science, Technology & Innovation/Advances in science, technology & innovation (pp. 875–876). [CrossRef]
- Dewi, I. U., Azizah, R., Husnina, Z., Sumantri, A., Qomariah, N., Suhariono, S., Jauharoh, S. N. A., & Latif, M. (2022). Effectiveness of wastewater treatment installation and liquid waste quality in Dr. Soetomo General Hospital, Surabaya. JURNAL KESEHATAN LINGKUNGAN, 14(1), 45. [CrossRef]
- Hassoun-Kheir, N., Stabholz, Y., Kreft, J., De La Cruz, R., Romalde, J. L., Nesme, J., Sørensen, S. J., Smets, B. F., Graham, D., & Paul, M. (2020). Comparison of antibiotic-resistant bacteria and antibiotic resistance genes abundance in hospital and community wastewater: A systematic review. The Science of the Total Environment, 743, 140804. [CrossRef]
- Herrmann, M., Olsson, O., Fiehn, R., Herrel, M., & Kümmerer, K. (2015). The significance of different health institutions and their respective contributions of active pharmaceutical ingredients to wastewater. Environment International, 85, 61–76. [CrossRef]
- Kamani, H., Ghayebzadeh, M., Azari, A., & Ganji, F. (2024). Characteristics of microplastics in a hospital wastewater treatment plant effluent and hazard risk assessment. Environmental Processes, 11(1). [CrossRef]
- Khan, M. T., Shah, I. A., Ihsanullah, I., Naushad, M., Ali, S., Shah, S. H. A., & Mohammad, A. W. (2021). Hospital wastewater as a source of environmental contamination: An overview of management practices, environmental risks, and treatment processes. Journal of Water Process Engineering, 41, 101990. [CrossRef]
- Niu, J., Liu, Y., Ma, C., Lu, Y., Wang, H., & Dong, Q. (2025). Analysis of the effects, existing problems and flexible management suggestions in hospital wastewater treatment: A systematic perspective. Journal of Water Process Engineering, 72, 107565. [CrossRef]
- Pariente, M., Segura, Y., Álvarez-Torrellas, S., Casas, J., De Pedro, Z., Diaz, E., García, J., López-Muñoz, M., Marugán, J., Mohedano, A., Molina, R., Munoz, M., Pablos, C., Perdigón-Melón, J., Petre, A., Rodríguez, J., Tobajas, M., & Martínez, F. (2022). Critical review of technologies for the on-site treatment of hospital wastewater: From conventional to combined advanced processes. Journal of Environmental Management, 320, 115769. [CrossRef]
- Paulus, G. K., Hornstra, L. M., Alygizakis, N., Slobodnik, J., Thomaidis, N., & Medema, G. (2019). The impact of on-site hospital wastewater treatment on the downstream communal wastewater system in terms of antibiotics and antibiotic resistance genes. International Journal of Hygiene and Environmental Health, 222(4), 635–644. [CrossRef]
- Ramírez-Coronel, A. A., Mohammadi, M. J., Majdi, H. S., Zabibah, R. S., Taherian, M., Prasetio, D. B., Gabr, G. A., Asban, P., Kiani, A., & Sarkohaki, S. (2023). Hospital wastewater treatment methods and its impact on human health and environments. Reviews on Environmental Health, 39(3), 423–434. [CrossRef]
- Rodriguez-Mozaz, S., Lucas, D., & Barceló, D. (2017). Full-Scale plants for dedicated treatment of hospital effluents. In The handbook of environmental chemistry (pp. 189–208). [CrossRef]
- Santos, E. (2021). On the Path of Sustainability in Wastewater Treatment: The Golden Mean Applied to Regional Context. IOP Conference Series Earth and Environmental Science, 812(1), 012012. [CrossRef]
- Tsalas, N., Golfinopoulos, S. K., Samios, S., Katsouras, G., & Peroulis, K. (2024). Optimization of energy consumption in a wastewater treatment plant: An overview. Energies, 17(12), 2808. [CrossRef]
- Tsangas, M., Papamichael, I., Banti, D., Samaras, P., & Zorpas, A. A. (2023). LCA of municipal wastewater treatment. Chemosphere, 341, 139952. [CrossRef]
- Twi-Yeboah, N., Osei, D., Dontoh, W. H., Asamoah, G. A., Baffoe, J., & Danquah, M. K. (2024). Enhancing energy efficiency and resource recovery in wastewater treatment plants. Energies, 17(13), 3060. [CrossRef]
- U.S. Environmental Protection Agency. (1976). Evaluation of flow equalization at a small wastewater treatment plant (EPA-600/2-76-181). U.S. EPA. EPA NELP.
- Verlicchi, P., Aukidy, M. A., & Zambello, E. (2015). What have we learned from worldwide experiences on the management and treatment of hospital effluent? — An overview and a discussion on perspectives. The Science of the Total Environment, 514, 467–491. [CrossRef]
- Virginia Administrative Code. (2025). 9VAC25-790-830: Flow equalization. Commonwealth of Virginia, State Water Control Board. https://law.lis.virginia.gov/admincode/title9/agency25/chapter790/section830/.
- Xiong, Z., Liu, W., Cao, J., Liu, Y., Zhang, H., Jiang, Y., Yang, J., & Lai, B. (2020). The influence and inspiration of COVID-19 epidemic on the construction of hospital sewage prevention and control system. Journal of Civil and Environmental Engineering, 42(6), 134–142. [CrossRef]
- Yuan, Q., Guo, M., & Yang, J. (2015). Fate of Antibiotic Resistant Bacteria and Genes during Wastewater Chlorination: Implication for Antibiotic Resistance Control. PLoS ONE, 10(3), e0119403. [CrossRef]
- Zhu, L., Shuai, X., Xu, L., Sun, Y., Lin, Z., Zhou, Z., Meng, L., & Chen, H. (2021). Mechanisms underlying the effect of chlorination and UV disinfection on VBNC state Escherichia coli isolated from hospital wastewater. Journal of Hazardous Materials, 423, 127228. [CrossRef]
Disclaimer/Publisher’s Note: The statements, opinions and data contained in all publications are solely those of the individual author(s) and contributor(s) and not of MDPI and/or the editor(s). MDPI and/or the editor(s) disclaim responsibility for any injury to people or property resulting from any ideas, methods, instructions or products referred to in the content. |
© 2025 by the authors. Licensee MDPI, Basel, Switzerland. This article is an open access article distributed under the terms and conditions of the Creative Commons Attribution (CC BY) license (http://creativecommons.org/licenses/by/4.0/).
Copyright: This open access article is published under a Creative Commons CC BY 4.0 license, which permit the free download, distribution, and reuse, provided that the author and preprint are cited in any reuse.


