
Submitted:
04 November 2025
Posted:
06 November 2025
You are already at the latest version
Abstract
The efforts to achieve early detection of autism spectrum disorders (ASD) are becoming increasingly important due to the high prevalence that continues to persist globally. The World Health Organization (WHO) and other official institutions agree that in marginalized regions, it is urgently necessary to develop effective alternatives and methods to improve the quality of life of children and their families. This study presents an integrated model for the early detection of ASD, based on the analysis of parental observations and supported by validated diagnostic tools. The proposed approach consists of four sequential modules, aiming to improve early detection through techniques such as natural language processing (NLP) and machine learning (ML) metrics. Records from two Latin American countries were standardized, thereby consolidating a single database comprising 153 records of children aged 2 to 6 years. The Parent Interview Instrument (PII) was administered by specialists to caregivers and subsequently compared with standardized tests. Encouraging results were obtained from the support vector machine (SVM) classification algorithm, yielding an accuracy range of 89.88%–91.34%, a maximum precision of 90.02%, a recall of 89.02%, and a maximum F-measure of 91.12%. The results of the case study allow us to identify disorders related to autism, such as the repetition of behaviors, difficulties in social interaction, and issues with verbal expression. This contribution aligns with the United Nations Sustainable Development Goal 3, which promotes health and well-being.
Keywords:
autism
; opinion mining
; early identification
; machine learning classifiers
1. Introduction
Various specialists widely address the definition of autism; in general, it is represented by a spectrum of conditions related to repetitive behaviors, deficits in social interaction, and communication in general [1]. It is a scientific responsibility to study the complexities of autism spectrum disorders (ASD) to develop effective solutions that promote acceptance in an inclusive environment within society [2,3]. A systematic and efficient methodology is necessary to address the issue and improve the overall quality of life for the individual concerned, as well as their family members. Organizations such as the World Health Organization (WHO), the Centers for Disease Control and Prevention (CDC), and other government agencies consistently report higher rates of autism than in previous years. Defining characteristics are often identified during the first year of life and subsequently manifest as signs of autism between 12 and 24 months of age, or even later [4]. For child development, early detection strategies are of utmost importance, as they can support children with this condition by providing specialized therapies or personalized treatments that have the potential to significantly improve outcomes in three key areas: communication, social interaction, and behavioral progress.
On the other hand, there is a great deal of debate surrounding the diagnosis of autism; however, efforts must continue because cases appear unique and varied, but patterns have also been identified that can contribute to understanding this neurodevelopmental condition. Multiple approaches have been developed to diagnose ASD, including those that integrate brain imaging, behavioral recordings, and digital biomarkers. Most rely on the expertise of professionals who implement instruments such as surveys for pre-screening. However, models are often complex and require a considerable investment of time, and the data can be ambiguous and biased by the data collector. From a modern perspective, researchers are exploring more agile and robust assessment tools that can address these challenges and provide clearer, faster, and more reliable information.
As part of our comprehensive approach, we use Opinion Mining (OM), a validated method that uses algorithms to interpret unstructured information, including potentially useful content, mainly in textual data [5]. By processing the information with classification algorithms, it was possible to identify relevant patterns and signs associated with autism. The use and application of these natural language processing (NLP) techniques, together with machine learning algorithms, allow us to uncover valuable information that can improve decision-making [6]. The effectiveness of OM has been demonstrated in various scientific works, including those related to coronavirus (COVID-19) [7], diabetes [8], psychiatric and psychological support [9], vaccines [10], medications [11,12], and patient feedback and experience [13]. The versatility of OM is effectively applied to health-related issues, enabling innovative solutions that improve patient care and treatment outcomes.
This article is structured in five sections. The first introduces the general perspective of autism and advances in this regard; the second explains the introduction of the proposed ASDMO-ML model. The third section presents the architecture of the proposed model and its subsequent application in a case study (fourth section). Finally, the fifth section describes the conclusions, discussion, and remaining challenges. In current clinical practice, the challenge is significant and ongoing in accurately identifying autism [14]. It is important to highlight that this work presents a comprehensive approach to OM and standardized tests to facilitate early and effective identification of ASD by specialists.
2. Related Contributions
The scientific community acknowledges that the theoretical and methodological foundation of the investigation ensures that the contribution is beneficial to the enhancement and advancement of the academic discipline. Traditional diagnostic methods often require high specialization and a lot of attention and time, making them less accessible for early detection of autism. In recent years, ML techniques and OM, also called sentiment analysis (SA), have emerged as promising tools for the early detection of ASD, offering cost-effective and scalable solutions. This response explores the role of ML models and SA in the early detection of ASD, highlighting key findings from relevant research papers.
In an article by Thata et al. [15], the potential of typical classifiers such as decision tree (DT) and random forest (RF) was demonstrated, achieving maximum scores of 99%. The authors structured the data with behavioral and medical attributes. There is interesting work, such as that of Fiza et al. [16], in which behavioral biomarker identification (BBI) was demonstrated using logistic regression (LR), deep neural networks (DNN), and RF integration. The results are relevant, with BBI sensitivity close to 90% and specificity of 94%, which was excellent at eliminating false positives by excluding situations unrelated to autism, thereby advancing the topic. Another study reported perfect classification using the RF and gated recurrent unit (GRU) methods, reinforcing the relevance of deep recurrent models in ASD detection [17]. Authors Balaji and Kanaga [18] publish an intelligent recommendation system based on stochastic gradient descent, K-means clustering, and deep neural networks (DNN). An accuracy of 99.54% was achieved, with significant implications for non-clinical screening and adaptive education across diverse age groups. Similarly, another article highlights that results from machine learning (ML) algorithms such as RF and DTs can achieve near-perfect performance on both clinical and non-clinical datasets [19]. Efforts involving neuroimaging data have also shown promising results. Another interesting work by Aghdam et al. [20] is based on resting-state functional magnetic resonance imaging (rs-fMRI) data, utilizing convolutional neural networks (CNNs). The authors used samples from individuals between 5 and 10 years old in the global Autism Brain Imaging Data Exchange (ABIDE) I and II datasets, with the following results: ABIDE I, accuracy = 0.72, sensitivity = 0.71, specificity = 0.73; for ABIDE II, accuracy = 0.7, sensitivity = 0.58, specificity = 0.80.
Loganathan et al. [3] employed a hybrid ResNet101-BiGRU model optimized with CHGSO, achieving 98% accuracy using EEG signals. Similarly, Bhandage et al. [21] utilized deep belief networks and the AWSO optimizer on the ABIDE dataset, reaching 93.5% specificity and outperforming other neural architectures. Furthermore, RethikumariAmma and Ranjana [22] further demonstrated the potential of neuro-fuzzy systems by employing DNFN optimized with FHGO, achieving over 93% accuracy in ASD classification using functional imaging data.
On the other hand, studies like Hossain et al. [23] focused on optimizing feature selection techniques, identifying MLP combined with Relief-F as the most accurate classifier while relying on only ten features from a large dataset. Koehler et al. [24] approached the problem from the lens of social interaction, using facial and bodily synchrony in dyadic video data. Facial synchrony alone yielded the best classification performance, highlighting the diagnostic power of non-verbal cues. Recent advances in data privacy have led to the integration of federated learning, as shown by Shoaib Farooq et al. [1]. His study applied Fuzzy Logic (FL) to train classifiers locally across four datasets and aggregate predictions using a meta-classifier, achieving 99% accuracy in children while preserving data confidentiality.
Recently, Rai et al. [45] published a hybrid deep learning framework called ASD-HybridNet. This system integrates temporal data from regions of interest (ROIs), functional connectivity, and functional magnetic resonance imaging (fMRI). The authors demonstrate the effectiveness of their results. Another similar model proposed by Daliri et al. [46] emphasizes the OAFDFL (Optimized Active Fuzzy Deep Federated Learning) framework, which is composed of three components: federated learning, active learning, and deep fuzzy learning. According to the results, the best F-score, recall, and precision were obtained using the proposed method, as 90, 89, and 88%, respectively. A non-intrusive vision-assisted method is proposed by Negin et al. [25] using the Bag-of-Visual-Words approach with Multi-Layer Perceptron (MLP), Gaussian Naive Bayes (GNB), and Support Vector Machine (SVM) classifiers for recognizing ASD associated behaviors. The results in Acc. % and UAR % were 79 and 77, respectively, confirming that the action recognition-based system can potentially be used to assist clinicians with reliable results. A similar idea to our proposal is that of Rubio et al. [26], who integrated NLP and deep learning to analyze social media narratives. Using models such as LSTM, Bi-LSTM, and BERTweet, their system achieved an 88% accuracy in identifying ASD-related patterns in unstructured texts. This highlights a growing interest in exploiting narrative and linguistic data for ASD diagnosis through OM and SA.
Together, these works illustrate the diversity and richness of approaches to ASD detection, ranging from structured physiological data to behavioral narratives and EEG imaging, with a strong trend toward hybrid and privacy-preserving Artificial Intelligence (AI) models. These contributions set a solid foundation for developing intelligent, interpretable, context-aware ASD diagnostic tools. The distinguishing characteristic of the proposed model lies in its comprehensive and easily interpretable framework; it may also be regarded as a promising alternative in the integration of OM.
3. Proposed Flow Architecture
Figure 1 presents the model, which consists of four modules that collectively illustrate the general framework. This framework begins with care provided in a specialized center and culminates in obtaining results for the alignment and improvement of the ASD diagnosis.
4. Application: Case Study
4.1. Consolidation and Homogenization of the Main Dataset
Initially, a principal database was consolidated, comprising two databases from two specialized autism centers, one in Mexico and the other in Chile. Although both countries are Latin American, there may be factors that influence the treatment of autism in children.
From a multidimensional perspective, diagnostic, therapeutic, familial, legal, and cultural, Mexico and Chile demonstrate a coordinated effort to provide children with autism with earlier, more comprehensive, and more humane care, recognizing the specific needs of individuals with ASD. The specialists from both countries who contributed to the databases for this work recognize this alignment, and it serves as a basis for strengthening shared strategies to ensure the full inclusion of individuals with ASD in our Latin American societies. To standardize the information from both databases, we applied the same Parent Interview Instrument (PII) to parents or caregivers, constituting a valuable source of unstructured data. This testimony enables us to capture observed behaviors in everyday contexts, as well as emotional and social descriptions, and early subjective indicators that complement the results. A total of 153 questionnaires were processed using NLP analysis techniques.
4.2. Module I: Data Repository
This first module describes the instruments used. The Autism Diagnostic Interview-Revised (ADI-R) is recognized as a structured instrument used in suspected cases of autism. It is recommended for people older than 2 years and focuses on stereotypical behaviors, the degree of social interaction, and the issue of expressive communication [27]. Likewise, the ADI-R has been validated in various regions of the world, including Latin America, Asia, and North America, providing technical confidence and linguistic and cultural diversity. In addition, its repeatability and adaptability are important characteristics for its use in diverse study populations [28,29]. Another instrument considered in our study was the Modified Checklist for Autism in Toddlers - Revised with Follow-up (M-CHAT-R/F), which serves to identify ASD in a timely, early manner in children aged approximately 18 to 30 months. The importance of this is reflected in the detection of preliminary indicators during the development stage, which allows for intervention and improvement in general forecasts [30]. This tool facilitates integration into typical pediatrician examinations because it is a simple questionnaire that parents or caregivers can easily administer. The M-CHAT-R/F is not a conclusive diagnosis, but it provides visibility into behaviors associated with autism, enabling stronger patient assessments. Another integrative instrument considered is the Childhood Autism Rating Scale (CARS), a proven clinical tool that assesses the presence and severity of autism in children. This test identifies early signs, enabling timely interventions to support appropriate and normal child development [31].
The primary instruments used, such as the PII and the standardized assessments, emphasize the need for a highly trained professional interviewer and a knowledgeable informant, usually a parent or caregiver, to ensure the accurate collection of data that feeds into the proposed system. Table 1 summarizes the datasets collected at two centers specializing in the assessment and diagnosis of ASD in children. The datasets originate from various geographical locations and comprise medical records of children aged 2 to 6 years.
A structured MO approach, explicitly using the PII method, was applied at each center to support the identification of behavioral patterns associated with ASD. In addition, standardized diagnostic instruments were used at each center to ensure data reliability.
4.3. Module II: Corroboration Proposal Through OM
The proposal for OM corroboration is processed utilizing the NLP toolkit within the Python version 3.12.8 environment. Pertinent information is extracted from the administered questionnaires, and the discernible patterns correlate with the elaborated opinions expressed in the responses.
4.3.1. Pre-Processing
Capitalization. This process involves determining how to handle uppercase and lowercase letters in text, whether to normalize them or preserve the useful emotional intensity information. This can be useful in SA, where product reviews are analyzed, and this decision directly impacts the quality and accuracy of the analysis. However, in this work, parental narratives are used to explain the environment of a potentially autistic child, so it was decided to convert all sentences to lowercase, allowing for a standardized and consistent textual analysis.
Tokenization. The text is segmented into smaller parts called tokens, which can be words or subwords. Algorithms need to understand, classify, and extract sentiment from text.
Terms filtering. At this step, the infrequent lexicon is omitted, referred to as stop words, which includes prepositions, some definite auxiliary verbs, pronouns that do not clarify the information or are vague, and some conjunctions. This process is essential in tasks such as text classification since the effectiveness of the model can be significantly increased by representing documents more concisely by selecting key terms [32]. Table 2 shows the results of the three processes described above for a real response. It can be seen that the percentage of valid tokens is approximately 40%.
n-Grams. An n-Gram, which is defined as a contiguous sequence of tokens of a specified length n, mitigates ambiguities inherent in the text while simultaneously furnishing critical features that enhance the performance of ML models and facilitate a more nuanced and compelling analysis of textual data.
Term weighting. The process of term weighting enhances the fidelity of textual representation, augments the accuracy of predictive models, and guarantees that computational algorithms concentrate on the most pertinent characteristics of a given document or corpus. In the absence of term weighting, models may misconstrue or overlook the authentic semantics inherent in the text. As a term weighting scheme, it was decided to use TF-IDF (Term Frequency - Inverse Document Frequency) since it is an effective range technique, as can be seen in Figure 2, since it allows the evaluation of the relevance of a word in a document concerning a complete corpus, adapting perfectly to the description previously stated [33].
Equations that support TF-IDF are:
In Equations (1) and (2), N denotes the aggregate total of documents, while df (t) signifies the document count that includes the term t. Similarly, TF (t, d) indicates the frequency of the term t within document d.
4.3.2. Processing
K-means clustering. Although it is overused, its use is justified because it is one of the most efficient clustering algorithms because it has the potential to discover internal structures, alternative classifications, and complex relationships in clinical, behavioral, or linguistic data, promoting advances in personalized diagnosis and understanding the heterogeneity of autism. The K-means algorithm produces both a source vocabulary and a clustering vocabulary as its results. The clustering source vocabulary constitutes the preliminary lexicon utilized to initialize cluster centroids [34]. This method divides a dataset into k groups called clusters. This function operates via an iterative mechanism, whereby each data point is allocated to its cluster centroid, ensuring that it is situated closer to it than to the centroids of other clusters, thereby minimizing the intra-cluster distance at each iterative phase. Subsequently, Subsequently, the initial value of k will be related to the total number of functional domains. The first cluster is determined according to linguistic communication, the second by the level of reciprocal social interaction, and the third by repetitive behaviors.
In the context of similarity metrics, the distance between the k-centroids associated with each instance found in the term matrix is computed. The similarity determination is predicated upon the Euclidean distance, as delineated in Equation (3).
In this study, m=n denotes a two-dimensional space and pertains to the dimensions of the environment wherein the points are analyzed to compute the Euclidean distance that separates them. The distance among the documents can be approximated by evaluating the cosine similarity, which is articulated as a vector, with each attribute documenting the frequency of the terms (Equation (4)).
where: The vector product is indicated by a dot and represents the length of the vector d.
ML approach - Categorization. It can be employed to classify the documents based on their content and similarity, leveraging techniques such as supervised learning (SL) algorithms that utilize labeled data for training purposes.
The decision to use five classifiers was made based on a literature review showing promising results in this context. One of SVM’s most notable attributes is its accurate and reliable performance, making it a leading category of SL algorithms. This classifier is suitable for multiclass problems containing high-dimensional data [35,36]. The KNN classifier is a valid and latent option for this type of study. This algorithm stands out for being simple yet highly effective. It is recommended for processing medium-sized data sets, where interpretation and simplicity are essential [37]. Another classification algorithm, RF, augments predictive precision by integrating numerous decision trees, alleviating overfitting and enhancing generalization across heterogeneous datasets [38]. Compared to alternative algorithms, its efficacy exhibits variability contingent upon the particular application and dataset attributes. As another alternative, the LR classifier has become widely used and remains highly effective, interpretable, and efficient, especially in text classification tasks [39]. Many ML systems often use it as a reference model and fundamental component. Based on the prevailing assumption that all features of this classifier exhibit independence, the Naive Bayes (NB) algorithm was implemented. This method is fast to train and is widely used in document and text classification due to its efficiency in processing high-dimensional data sets [40].
4.4. Module III: Evaluate Instrument
Validation and evaluation. This stage ensures the reliability, accuracy, and applicability of the results obtained, which are crucial to the scientific process. Validation verifies that the model accurately predicts and measures what is required, while evaluation quantifies overall performance using indicators. A group of specialists with more than 10 years of experience was selected from both autism centers to categorize the comments into three categories: linguistic and communicative aspects, level of reciprocal social interaction, and repetitive behavior patterns. The labeled test set encompasses all remarks within the primary dataset. The multi-class confusion matrix (MCCM) serves as an evaluative instrument used in classification dilemmas characterized by multiple classes, facilitating comparison between the true (actual) labels and those predicted by an ML model. The MCCM, which encapsulates the classification outcomes of the test dataset, has been procured [41]. GridSearchCV is an essential tool for optimizing Python-based ML algorithms by systematically exploring combinations of hyperparameters through cross-validation. This process often leads to significant improvements in both model performance and robustness. In this case, the dataset was divided into training and testing sets, with 5-fold cross-validation applied to ensure reliable evaluation. The most popular metrics used to evaluate the model’s effectiveness are presented in Equations (5)–(10).
In this context, TN signifies the outcome of a true negative, TP delineates the true positive, FP represents a false positive, and FN denotes a false negative result. Table 3 shows the performance in terms of the percentage of the classifiers used in this research to test the model on the main dataset.
Including MCC (Matthews Correlation Coefficient) and AUC-ROC (Area Under the Receiver Operating Characteristic Curve) metrics enhances the classifier performance evaluation by providing a more balanced, robust, and threshold-independent assessment. MCC ensures a comprehensive analysis even under conditions of class imbalance, while AUC-ROC evaluates the global discriminatory ability of the models.
The graphs of the four performance metrics segments are presented in Figure 3. Accuracy quantifies the aggregate proportion of accurate, positive, and negative prognostications produced by the model. It is emphasized that SVM exhibits the most reliable and consistent efficacy, with performance metrics ranging from 89.88% to 91.34%, thereby signifying a substantial level of overall dependability. In the best case, NB and KNN also maintain acceptable performance, with ranges of 88.5% and 86.3%, respectively, while LR and RF remain below 84%, indicating less effectiveness. Precision represents the proportion of true positives among all predicted positives, with SVM again showing the highest results at 90.02%. It can be noted that the KNN and NB algorithms showed accuracies above 85%, which is acceptable. Recall indicates the proportion of true positives identified among all true positive cases, which is crucial in medical settings where the priority is to minimize false negatives and undetected children with ASD. SVM and NB achieved the most efficient results, reaching 89.02% and 87.03%, respectively. Finally, the F-measure averages Precision and Recall, helping to assess the balance between the two metrics. Finally, the SVM achieves a maximum of 91.12%, while NB and KNN classifiers show acceptable F-measure, ranging from 85 to 86%. Finally, LR shows a performance imbalance, with 80%.
The diagrams provide a clear, visual way to interpret the results. Figure 4 shows the box plots of the classifiers used in this work. It can be noted that SVM shows higher, more consistent performance, with the highest values, compared to MCC, which shows minimal variability. In the image, each box plot summarizes the central tendency and variability of the MCC scores obtained in the model evaluation. The red line represents the median, while the boxes indicate the interquartile range (IQR), which contains 50% of the values.
Figure 5 shows a generated heatmap that enables quick and visual identification of which model performs best in each evaluated metric, with particular emphasis on the SVM, which excels in most indicators. It also facilitates relative comparisons between models, highlighting their strengths and weaknesses in terms of Precision, Accuracy, Recall, and F-measure. This representation is especially useful when comparing multiple algorithms simultaneously in different dimensions, providing a comprehensive view of each one’s performance.
4.5. Module IV: Evaluation - Identification
In autism, it is difficult to establish uniform criteria or consistent patterns because there is no standard profile; each case has its own peculiarities. However, efforts continue to unravel patterns or trends that improve diagnosis. In this fourth section of the model, it is shown that, independent of the integration of OM, the ADI-R, when integrated with M-CHAT-R/F, CARS, and ADOS-2, improves the accuracy and effectiveness in identifying cases of autism, particularly in grades 1 and 2, mild or moderate, respectively. This finding facilitates the development of personalized intervention strategies that could significantly improve the conditions of people with autism. In most assessments, particularly those that exhibit greater nuance and are consistent with mild autism, the ADI-R and the ADOS-2 are used to gather comprehensive information necessary for a more accurate diagnostic conclusion. The ADOS-2 offers high diagnostic accuracy, early identification capabilities, and a thorough assessment of autism traits. It is a semi-structured observational evaluation tool that enables professionals to observe and engage with the individual under examination within a regulated setting [42,43]. The findings derived from the model’s categories indicate that the primary manifestations or symptoms include language development, selective eating behaviors, behavioral outbursts (such as tantrums), sensory processing alterations (including sleep disturbances), sensitivity to auditory stimuli or tactile sensations, and limited social engagement (characterized by restricted play). These symptomatic indicators facilitate the validation of observational findings and significantly enhance the diagnostic capabilities of specialists, enabling them to determine at an early stage whether the child presents with mild, moderate, or severe symptoms.
Figure 6.
The image shows children under observation, performing some exercises and pictograms, each one showing different behavioral traits that led to the general categorization of the degree of autism they may have according to the signals detected by the ASDOM-ML model.
Figure 6.
The image shows children under observation, performing some exercises and pictograms, each one showing different behavioral traits that led to the general categorization of the degree of autism they may have according to the signals detected by the ASDOM-ML model.

The categorization was based on the Diagnostic and statistical manual of mental disorders (DSM-5), which provides a consistent and standardized classification of disorders and criteria for assigning a specific level of autism. Regardless of the results presented regarding the classification of autism level using AI classifiers, Table 4 below shows the total population studied and the category in which it was most dispersed. It is worth noting that broader screenings within the spectrum and the current increasing prevalence tend to identify children with less severe levels, which in this case is level 1 (mild), with the most significant presence in the dispersion of results.
5. Conclusions and Discussion
Efforts and contributions of all kinds must continue to improve the accuracy of identifying signs related to ASD. This article proposes a model aimed at the early detection of ASD based on parental narratives (PII) and standardized assessment instruments through a corroboration proposal of OM, NLP, and ML algorithms. The initial stage emphasizes the importance of visiting a specialized center when possible symptoms are detected. The approach offers a promising alternative to traditional diagnostics by integrating unstructured sources into a supervised computational method. Likewise, adequate integration with standardized clinical instruments, such as the ADI-R, the CARS scales and M-CHAT-R/F have a significant reputation in the evaluation of children. They are verified and proven techniques that provide an in-depth assessment in the three typical categories of autism, which are language-communication, social interaction, and repetitive behaviors. Text pre-processing and processing techniques are applied in the second stage, including capitalization, tokenization, term filtering, and term weighting using the TF-IDF algorithm. Subsequently, the K-means clustering algorithm is used, and categorization is carried out using classifiers such as NB, SVM, KNN, RF, and LR. Among the algorithms evaluated, the SVM classifier demonstrated superior accuracy, sensitivity, and metric balance performance, positioning it as the most effective in this context. For the final module of evaluation, it is suggested that combining NLP and OM with standardized tests with ADOS-2 contributes to a more accurate identification of signs of ASD.
The proposed model stands out for its ability to process unstructured, subjective information into structured, robustly analyzed results. This feature becomes relevant in marginalized areas where specialized clinical resources are scarce, where it can serve as an easy-to-use, accessible, and complementary tool for specialist decision-making, aiming to improve the quality of life of patients and their families. The advantages are evident, but it is worth noting that it can be improved. Even when integrating specialized instruments, the system’s generalization is limited by the homogenization and consolidation of data sources, which can bias the interpretation and categorization of behaviors. Expanding and diversifying datasets, using more robust algorithms, and improving accuracy across various clinical contexts, such as facial expressions and visual behavior via eye-tracking, are recommended. This would significantly enhance accuracy. In addition to the above, it is recommended to develop an easy-to-use graphical interface that would enable continued model strengthening. Likewise, this article considers the privacy of the data collected and notes that this type of model poses ethical and legal challenges associated with restricting sensitive data, particularly in child populations.
Finally, this scientific contribution aligns with the third Sustainable Development Goal (SDG) of the United Nations (UN) 2030 Agenda [44], specifically focusing on health and well-being. The ASDOM-ML model makes a significant contribution to the development of AI-assisted diagnostic tools. However, its implementation will depend on overcoming technical, cultural, and ethical barriers, as well as its validation in diverse clinical contexts. Consolidating these approaches represents a step toward more equitable, early, and personalized systems for early ASD care.
Author Contributions
Conceptualization, J.R.G.-R. and E.R.-R.; methodology, E.R.-R.; software, J.R.G.-R.; validation, G.C.-R., J.D.-M. and M.M.-S.; formal analysis, E.R.-R.; investigation, J.R.G.-R.; resources, M.A.D.-M; data curation, J.R.G.-R.; writing—original draft preparation, J.D.-M.; writing—review and editing, M.A.D.-M.; visualization, M.M.-S.; supervision, E.R.-R.; project administration, J.R.G.-R.; funding acquisition, E.R.-R. All authors have read and agreed to the published version of the manuscript.
Funding
This research was funded by The Secretary of Science, Humanities, Technology and Innovation (SECIHTI) through postdoctoral grant 5905826 (CVU/grant holder 384910).
Institutional Review Board Statement
Not applicable.
Informed Consent Statement
Not applicable.
Data Availability Statement
All data are available upon request.
Acknowledgments
We appreciate support from the Secretariat of Public Education (SEP) through the Tecnologico Nacional de Mexico (TecNM)—Instituto Tecnologico de Orizaba, who sponsored this work. We also thank the specialized autism centers located in Orizaba, Veracruz, Mexico, and Valdivia, Region de Los Ríos , Chile, for their advice, validation, and data acquisition.
Conflicts of Interest
The authors declare no conflicts of interest. The funders had no role in the design of the study; in the collection, analyses, or interpretation of data; in the writing of the manuscript, or in the decision to publish the results.:
References
- Farooq, M.S.; Tehseen, R.; Sabir, M.; Atal, Z. Detection of autism spectrum disorder (ASD) in children and adults using machine learning. Sci Rep. 2023, 13, 1–13. [Google Scholar] [CrossRef]
- Mukherjee, S.B. Autism Spectrum Disorders - Diagnosis and Management. Indian J Pediatr. 2017, 84, 307–14. [Google Scholar] [CrossRef]
- Loganathan, S.; Geetha, C.; Nazaren, A.R.; Fernandez Fernandez, M. H. Autism spectrum disorder detection and classification using chaotic optimization based Bi-GRU network: An weighted average ensemble model. Expert Syst Appl. 2023, 230, 120613. [Google Scholar] [CrossRef]
- WHO. World Health Organization 2025. Available online: https://www.who.int/es/news-room/fact-sheets/detail/autism-spectrum-disorders (accessed on 16 February 2025).
- Liu, B. The Problem of Sentiment Analysis. Sentiment Analysis and Opinion Mining; 1st ed.; Springer Cham, Switzerland, 2012, 1, 9–22. [Google Scholar] [CrossRef]
- Grande-Ramírez, J.R.; Roldán-Reyes, E.; Aguilar-Lasserre, A.A.; Juárez-Martínez, U. Integration of Sentiment Analysis of Social Media in the Strategic Planning Process to Generate the Balanced Scorecard. Appl Sci. 2022, 12, 1–16. [Google Scholar] [CrossRef]
- Guo, F.; Liu, Z.; Lu, Q.; Ji, S.; Zhang, C. Public Opinion About COVID-19 on a Microblog Platform in China: Topic Modeling and Multidimensional Sentiment Analysis of Social Media. J Med Internet Res. 2024, 26, 1–17. [Google Scholar] [CrossRef]
- Gabarron, E.; Dorronzoro, E.; Rivera-Romero, O.; Wynn, R. Diabetes on Twitter: A Sentiment Analysis. J Diabetes Sci Technol. 2019, 13, 439–444. [Google Scholar] [CrossRef] [PubMed]
- Kumar, S.; Prabha, R.; Samuel, S. Sentiment analysis and emotion detection with healthcare perspective. Stud Comput Intell. 2022, 1024, 189–204. [Google Scholar] [CrossRef]
- D’Andrea, E.; Ducange, P.; Bechini, A.; Renda, A.; Marcelloni, F. Monitoring the public opinion about the vaccination topic from tweets analysis. Expert Syst Appl. 2019, 116, 209–26. [Google Scholar] [CrossRef]
- Gopalakrishnan, V.; Ramaswamy, C. Patient opinion mining to analyze drugs satisfaction using supervised learning. J Appl Res Technol. 2017, 15, 311–9. [Google Scholar] [CrossRef]
- Colón-Ruiz, C.; Segura-Bedmar; I. Comparing deep learning architectures for sentiment analysis on drug reviews. J Biomed Inform. 2020, 110, 103539. [Google Scholar] [CrossRef]
- AlMuhaideb, S.; AlNegheimish, Y.; AlOmar, T.; AlSabti, R.; AlKathery, M.; AlOlyyan, G. Analyzing Arabic Twitter-Based Patient Experience Sentiments Using Multi-Dialect Arabic Bidirectional Encoder Representations from Transformers. Comput Mater Contin. 2023, 76, 195–220. [Google Scholar] [CrossRef]
- Grande-Ramírez, J.R.; Roldán-Reyes, E.; Delgado-Maciel, J.; Cortes-Robles, G.; Meza-Palacios, R. Model to Early Detection of Autism Spectrum Disorder Through Opinion Mining Approach. Lecture Notes in Computer Science, Springer Nature Switzerland; 2025; vol. 14857, 1-14. [CrossRef]
- Thatha, V.N.; Veerasekharreddy, B.; Onyx, B.H.; Reddy, P.S; Manisha, Y.; Chowdary, V.D. A Machine Learning Model for Timely Autism Spectrum Disorder Detection. Int Conf Intell Syst Cybersecurity, ISCS 2024, 1058, 67. [Google Scholar] [CrossRef]
- Fiza, S.; Sunil, M.P.; Shukla, G. Predictive Analytics and AI for Early Diagnosis and Intervention in Autism Spectrum Disorders. 3rd IEEE Int Conf ICT Bus Ind Gov ICTBIG 2023, 10456267. [Google Scholar] [CrossRef]
- Lodha, S.; Lodha, N.; Malani, H.; Devashetti, P.; Rajguru, A. Early diagnosis of Autism using Machine Learning techniques and Gated Recurrent Units. 8th Int Conf Adv Comput Commun Syst ICACCS 2022, 1, 1152–8. [Google Scholar] [CrossRef]
- Balaji, V.; Raja, S.K.S. Recommendation learning system model for children with autism. Intell Autom Soft Comput. 2022, 31, 1301–15. [Google Scholar] [CrossRef]
- Khudhur, D.D.; Khudhur, S.D. The classification of autism spectrum disorder by machine learning methods on multiple datasets for four age groups. Meas Sensors 2023, 27, 100774. [Google Scholar] [CrossRef]
- Aghdam, M.A.; Sharifi, A.; Pedram, M.M. Diagnosis of Autism Spectrum Disorders in Young Children Based on Resting-State Functional Magnetic Resonance Imaging Data Using Convolutional Neural Networks. J Digit Imaging 2019, 1, 899–918. [Google Scholar] [CrossRef]
- Bhandage, V.; Rao, K. M.; Muppidi, S.; Maram, B. Autism spectrum disorder classification using Adam war strategy optimization enabled deep belief network. Biomed Signal Process Control 2023, 86, 104914. [Google Scholar] [CrossRef]
- RethikumariAmma, K.N.; Ranjana, P. Pivotal region and optimized deep neuro fuzzy network for autism spectrum disorder detection. Biomed Signal Process Control 2023, 83, 104634. [Google Scholar] [CrossRef]
- Hossain, M.D.; Kabir, M.A.; Anwar, A.; Islam, M.Z. Detecting autism spectrum disorder using machine learning techniques: An experimental analysis on toddler, child, adolescent and adult datasets. Heal Inf Sci Syst. 2021, 9. [Google Scholar] [CrossRef]
- Koehler, J.C.; Dong M., S.; Bierlich, A.M.; Fischer, S.; Späth, J. , Plank, I.S., et al. Machine learning classification of autism spectrum disorder based on reciprocity in naturalistic social interactions. Transl Psychiatry 2024, 14, 1–9. [Google Scholar] [CrossRef]
- Negin, F.; Ozyer, B.; Agahian, S.; Kacdioglu, S.; Ozyer, G.T. Vision-assisted recognition of stereotype behaviors for early diagnosis of Autism Spectrum Disorders. Neurocomputing 2021, 446, 145–55. [Google Scholar] [CrossRef]
- Rubio-Martín, S.; García-Ordás, M.T.; Bayón-Gutiérrez, M.; Prieto-Fernández, N.; Benítez-Andrades, J.A. Enhancing ASD detection accuracy: a combined approach of machine learning and deep learning models with natural language processing. Heal Inf Sci Syst. 2024, 12. [Google Scholar] [CrossRef] [PubMed]
- Rutter, M.; Le Couteur, A.; Lord, C. ADI-R. Entrevista para el diagnóstico del Autismo - Edición revisada., 3th ed.; Western Psychological Services: California, EE. UU, 2024. [Google Scholar]
- Vanegas, S.B.; Magaña, S.; Morales, M. Clinical Validity of the ADI-R in a US- Based Latino Population. J Autism Dev Disord. 2016, 46, 1623–35. [Google Scholar] [CrossRef] [PubMed]
- Bashirian, S.; Soltanian, A.R.; Seyedi, M.; Khazaei, S.; Jenabi, E.; Razjouyan, K.; et al. The psychometric properties of the Iranian version of Autism Diagnostic Interview-Revised (ADI-R) in children with autism spectrum disorder. Adv Autism 2022, 8, 39–45. [Google Scholar] [CrossRef]
- Coelho-Medeiros, M.E.; Bronstein, J.; Aedo, K.; Pereira, J.A.; Arraño, V.; Perez, C.A. , et al. M-CHAT-R/F validation as a screening tool for early detection in children with autism spectrum disorder. Rev Chil Pediatr. 2019, 90, 492–9. [Google Scholar] [CrossRef] [PubMed]
- Moulton, E.; Bradbury, K.; Barton, M.; Fein, D. Factor Analysis of the Childhood Autism Rating Scale in a Sample of Two Year Olds with an Autism Spectrum Disorder. J Autism Dev Disord. 2019, 49, 2733–46. [Google Scholar] [CrossRef]
- Onan, A.; Korukoǧlu, S.; Bulut, H. Ensemble of keyword extraction methods and classifiers in text classification. Expert Syst Appl. 2016, 57, 232–47. [Google Scholar] [CrossRef]
- Wendland, A.; Zenere, M.; Niemann, J. Introduction to Text Classification: Impact of Stemming and Comparing TF-IDF and Count Vectorization as Feature Extraction Technique. Commun Comput Inf Sci. 2021, 1442, 1–14. [Google Scholar] [CrossRef]
- Zhou, Q.; Lei, Y.; Du, H.; Tao, Y. Public concerns and attitudes towards autism on Chinese social media based on K-means algorithm. Sci Rep. 2023, 13, 1–8. [Google Scholar] [CrossRef]
- Goudjil, M.; Koudil, M.; Bedda, M.; Ghoggali, N. A Novel Active Learning Method Using SVM for Text Classification. Int J Autom Comput. 2018, 15, 290–8. [Google Scholar] [CrossRef]
- Brandão, J.G.; Castro Junior, A.P.; Pacheco, V.M.G; Rodrigues, C.G.; Belo, O.M.O.; Coimbra, A.P.; et al. Optimization of machine learning models for sentiment analysis in social media. Inf Sci (Ny) 2025, 694, 121704. [Google Scholar] [CrossRef]
- Sinha, A.; Rout, B.; Mohanty, S.; Mishra, S.R.; Mohapatra, H.; Dey, S. Exploring Sentiments in the Russia-Ukraine Conflict: A Comparative Analysis of KNN, Decision Tree and Logistic Regression Machine Learning Classifiers. Procedia Comput Sci. 2024, 235, 1068–76. [Google Scholar] [CrossRef]
- Haque, N.; Islam, T.; Erfan, M. An exploration of machine learning approaches for early Autism Spectrum Disorder detection. Healthc Anal 2025, 7, 100379. [Google Scholar] [CrossRef]
- Shah, K.; Patel, H.; Sanghvi, D.; Shah, M. A Comparative Analysis of Logistic Regression, Random Forest and KNN Models for the Text Classification. Augment Hum Res. 2020, 5, 23–35. [Google Scholar] [CrossRef]
- Sánchez-Franco, M.J.; Navarro-García, A.; Rondán-Cataluña, F.J. A naive Bayes strategy for classifying customer satisfaction: A study based on online reviews of hospitality services. J Bus Res. 2019, 101, 499–506. [Google Scholar] [CrossRef]
- Heydarian, M.; Doyle, T.E.; Samavi, R. MLCM : Multi-Label Confusion Matrix. IEEE Access 2022, 19083, 95. [Google Scholar] [CrossRef]
- Saure, E.; Laasonen, M.; Kylliäinen, A.; Hämäläinen, S.; Lepistö-Paisley, T.; Raevuori, A. Social communication and restricted, repetitive behavior as assessed with a diagnostic tool for autism (ADOS-2) in women with anorexia nervosa. J Clin Psychol. 2024, 1, 1–16. [Google Scholar] [CrossRef]
- Ji, S.I.; Park, H.; Yoon, S.A.; Hong, S.B. A Validation Study of the CARS-2 Compared With the ADOS-2 in the Diagnosis of Autism Spectrum Disorder: A Suggestion for Cutoff Scores. J Korean Acad Child Adolesc Psychiatry 2023, 34, 45–50. [Google Scholar] [CrossRef]
- United Nations. 3 Ensure healthy lives and promote well-being for all at all ages 2025. Available online: https://sdgs.un.org/goals/goal3 (accessed on 18 April 2025).
- Rai, J.; Pradan, P.C.; Saikia, H.; Bhutia, R.; Singh, O. P. ASD-HybridNet: A hybrid deep learning framework for detection of autism spectrum disorder. Magn Rason Imaging 2025, 124, 110492. [Google Scholar] [CrossRef] [PubMed]
- Daliri, A.; Khalilian, M.; Mohammadzadeh, J.; Hosseini, S. S. Optimized active fuzzy deep federated learning for predicting autism spectrum disorder. Network Modeling Analysis in Health Informatics and Bioinformatics 2025, 14, 31. [Google Scholar] [CrossRef]
Figure 1.
Proposed model ASDOM-ML for the early identification of ASD using the NLP approach.
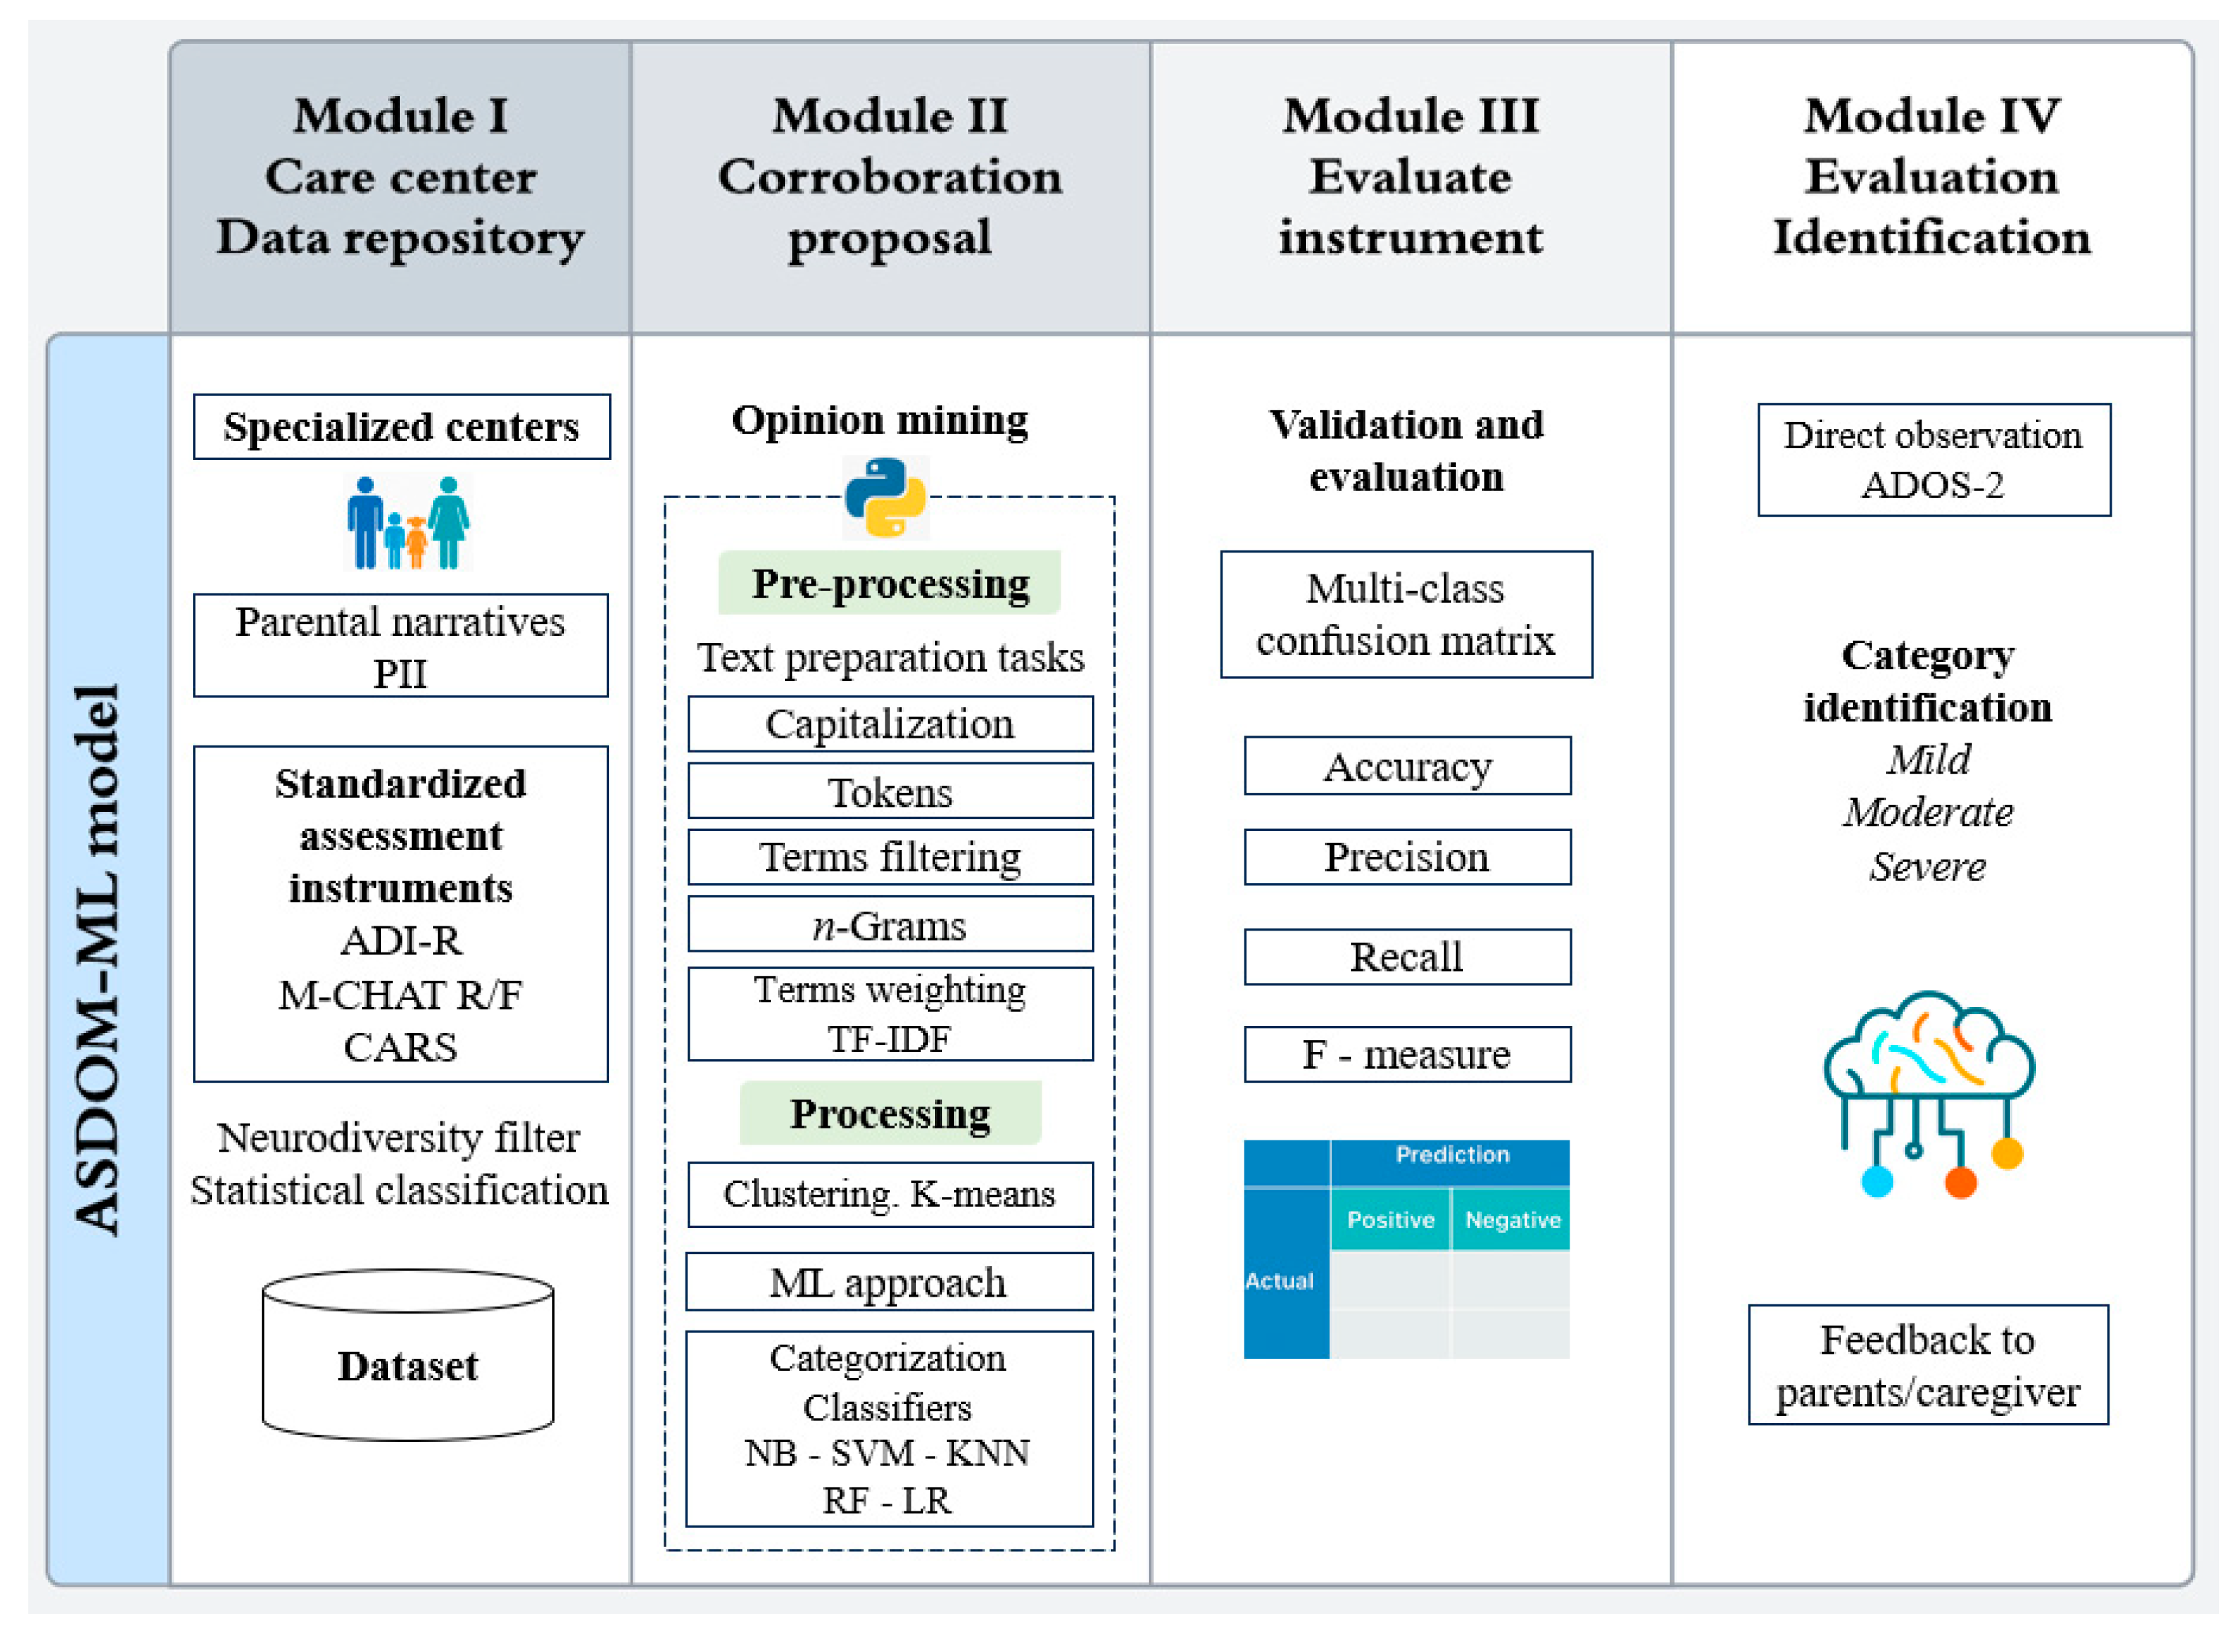
Figure 2.
Conceptual map on the main uses of the TF-IDF method in NLP.
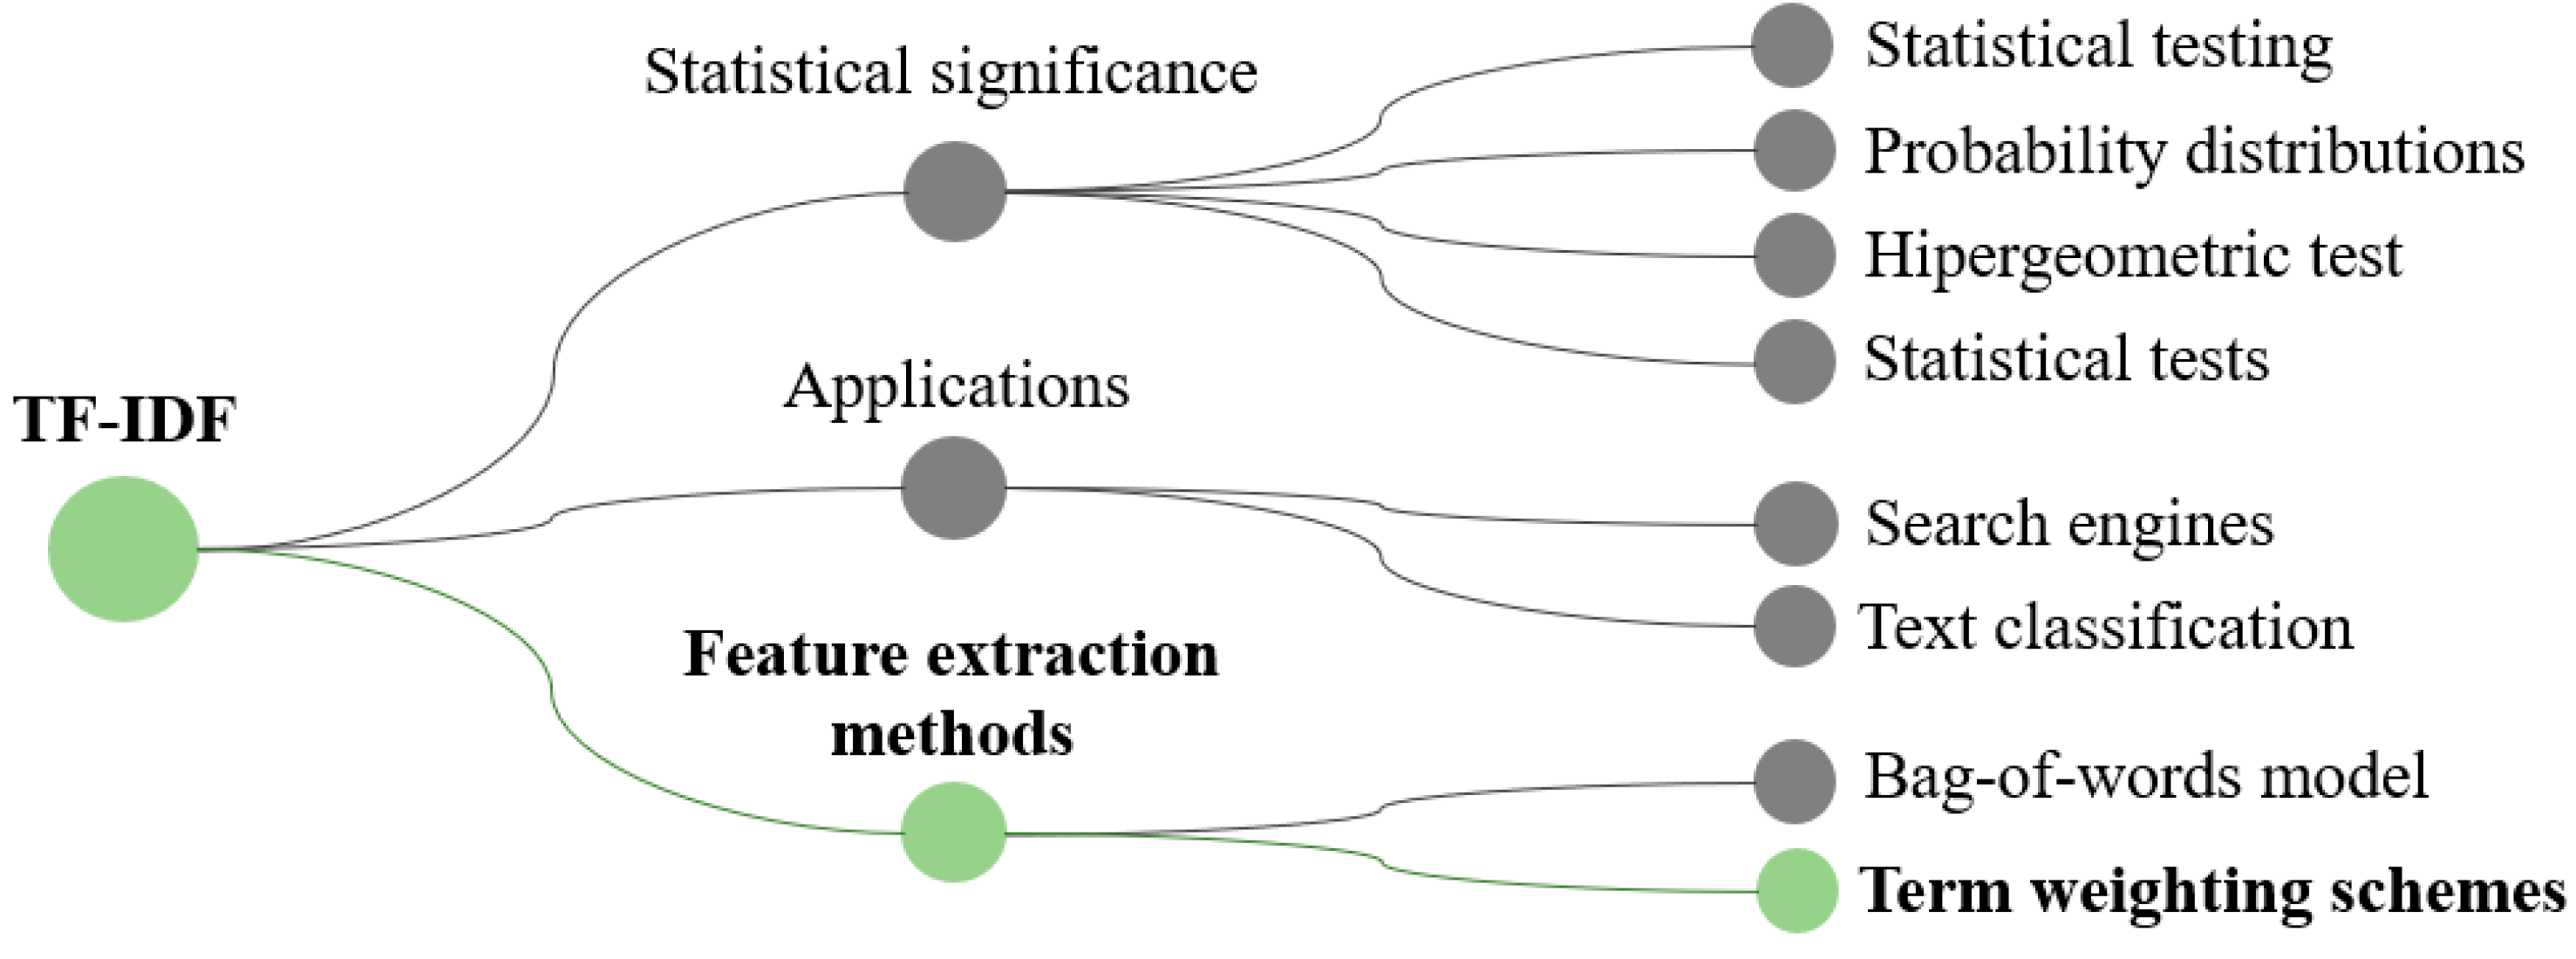
Figure 3.
Performance trends of the classifiers by metric.
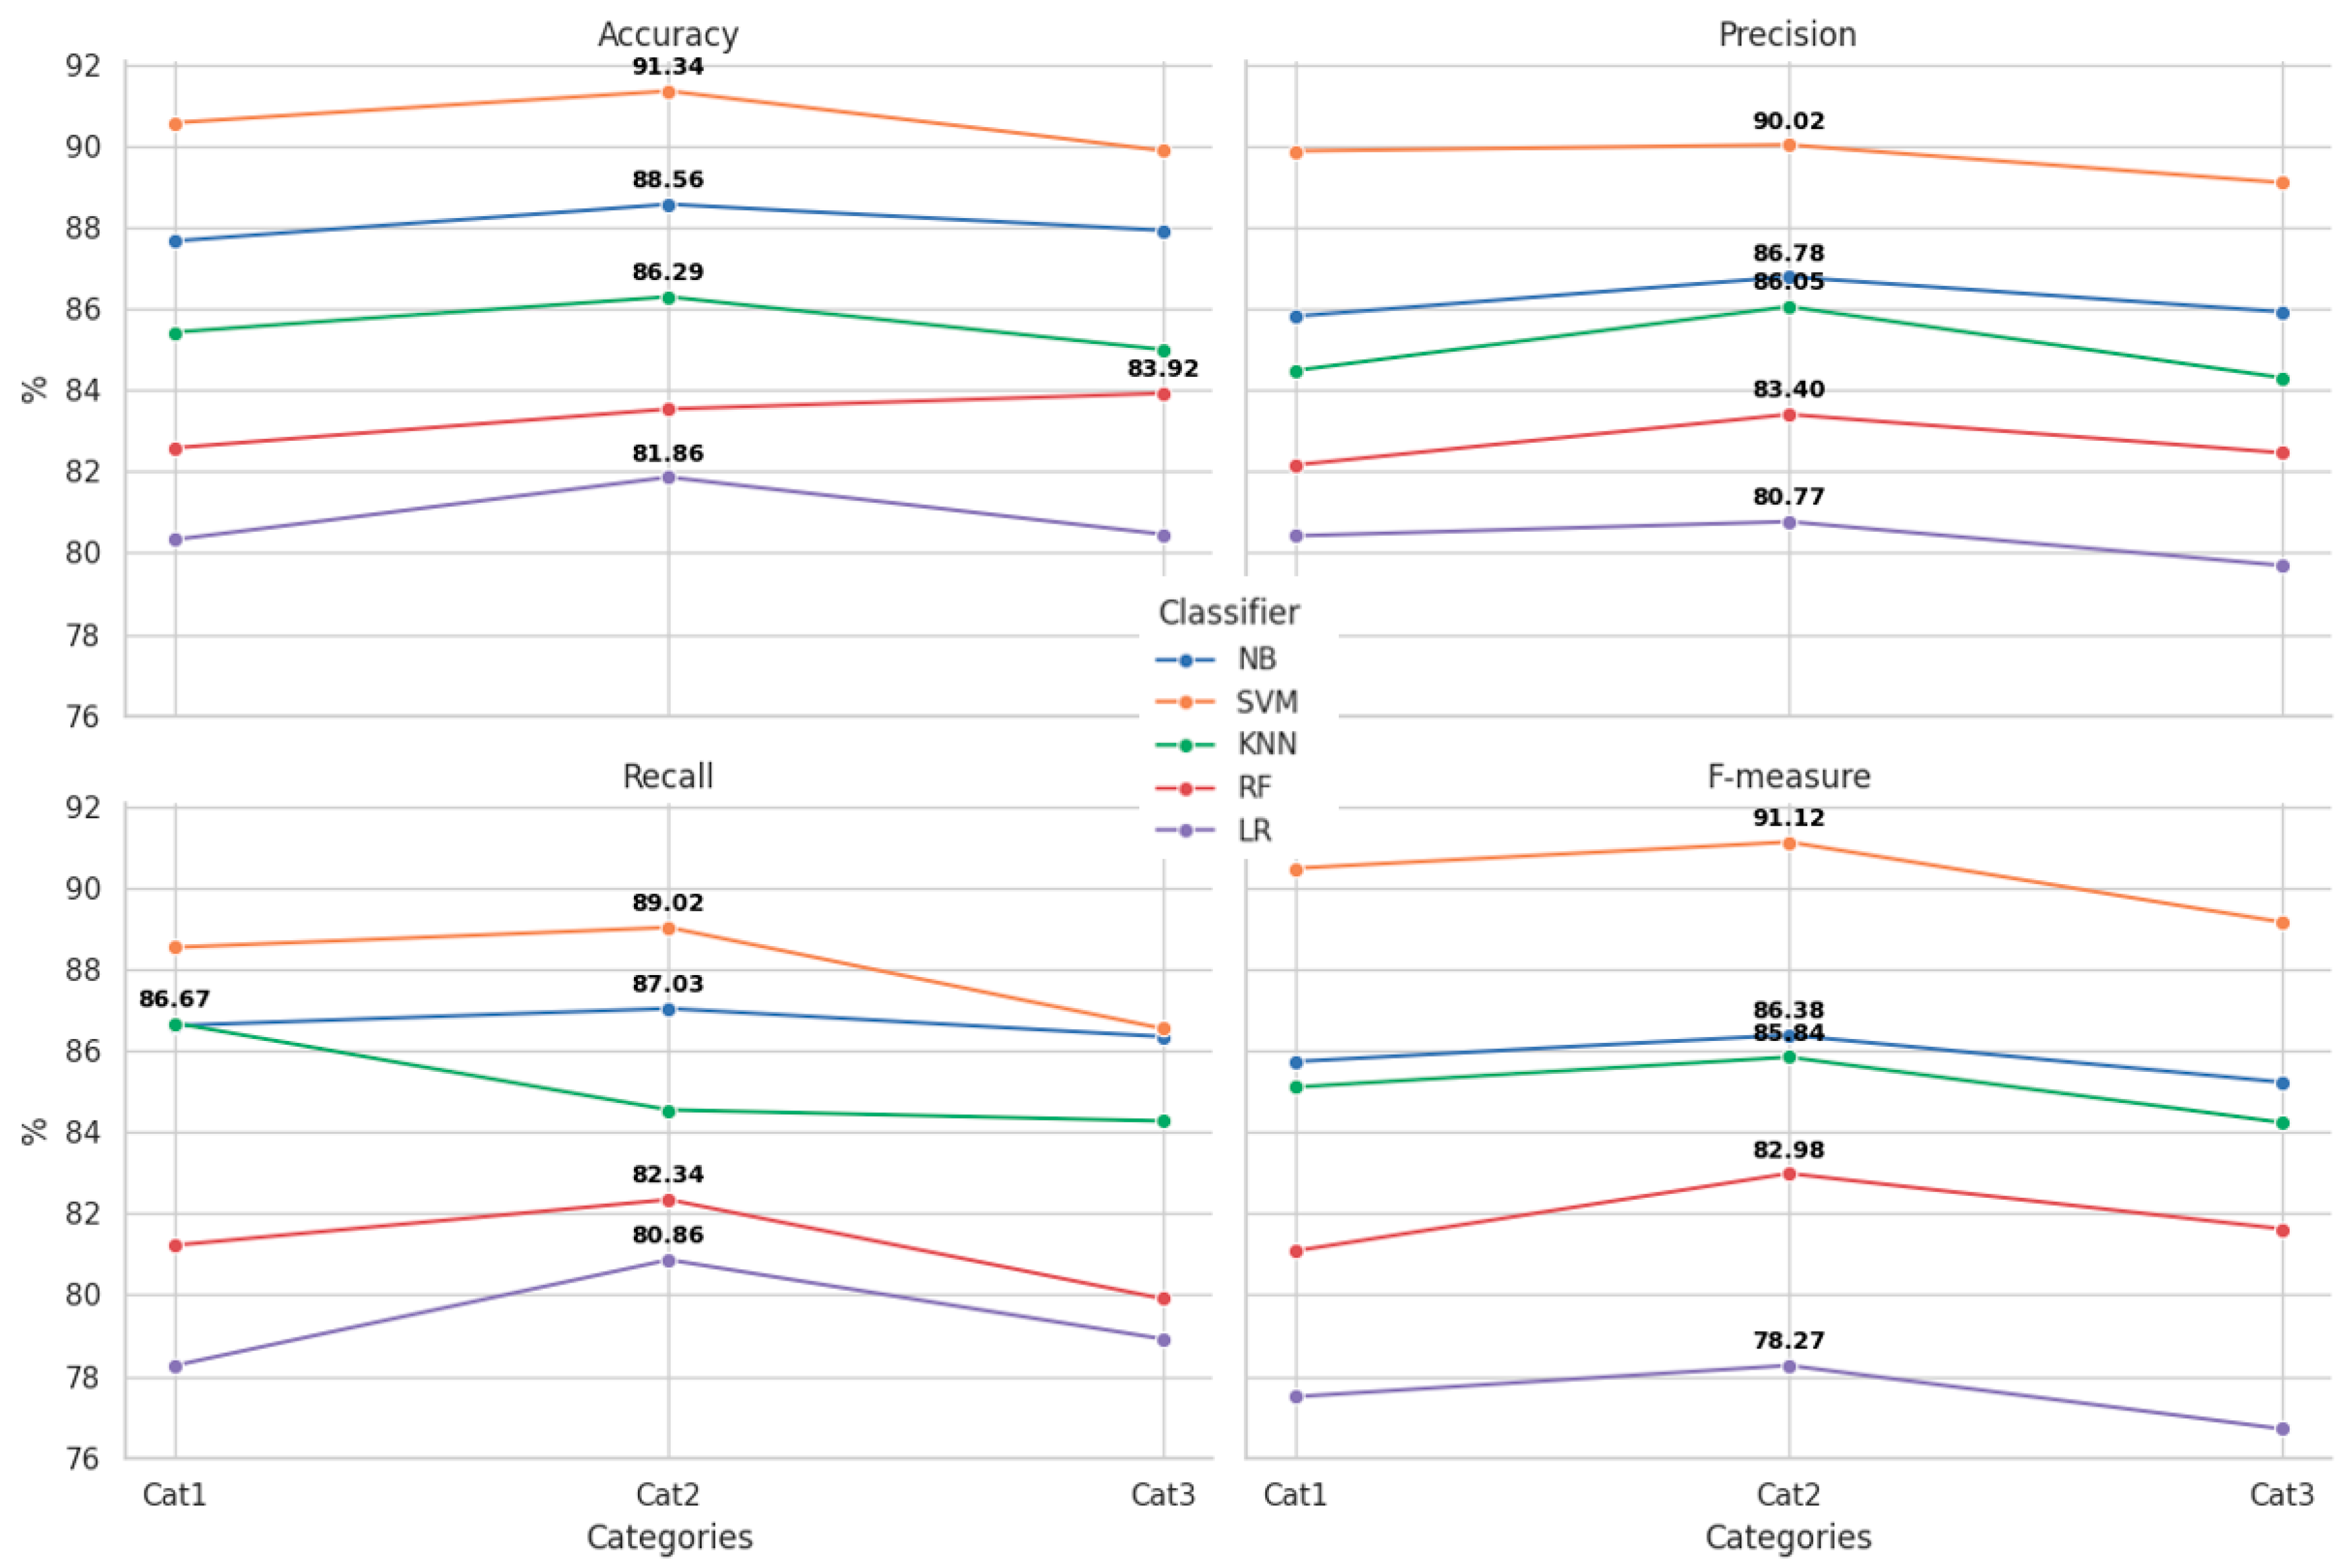
Figure 4.
MCC distribution by classifier.
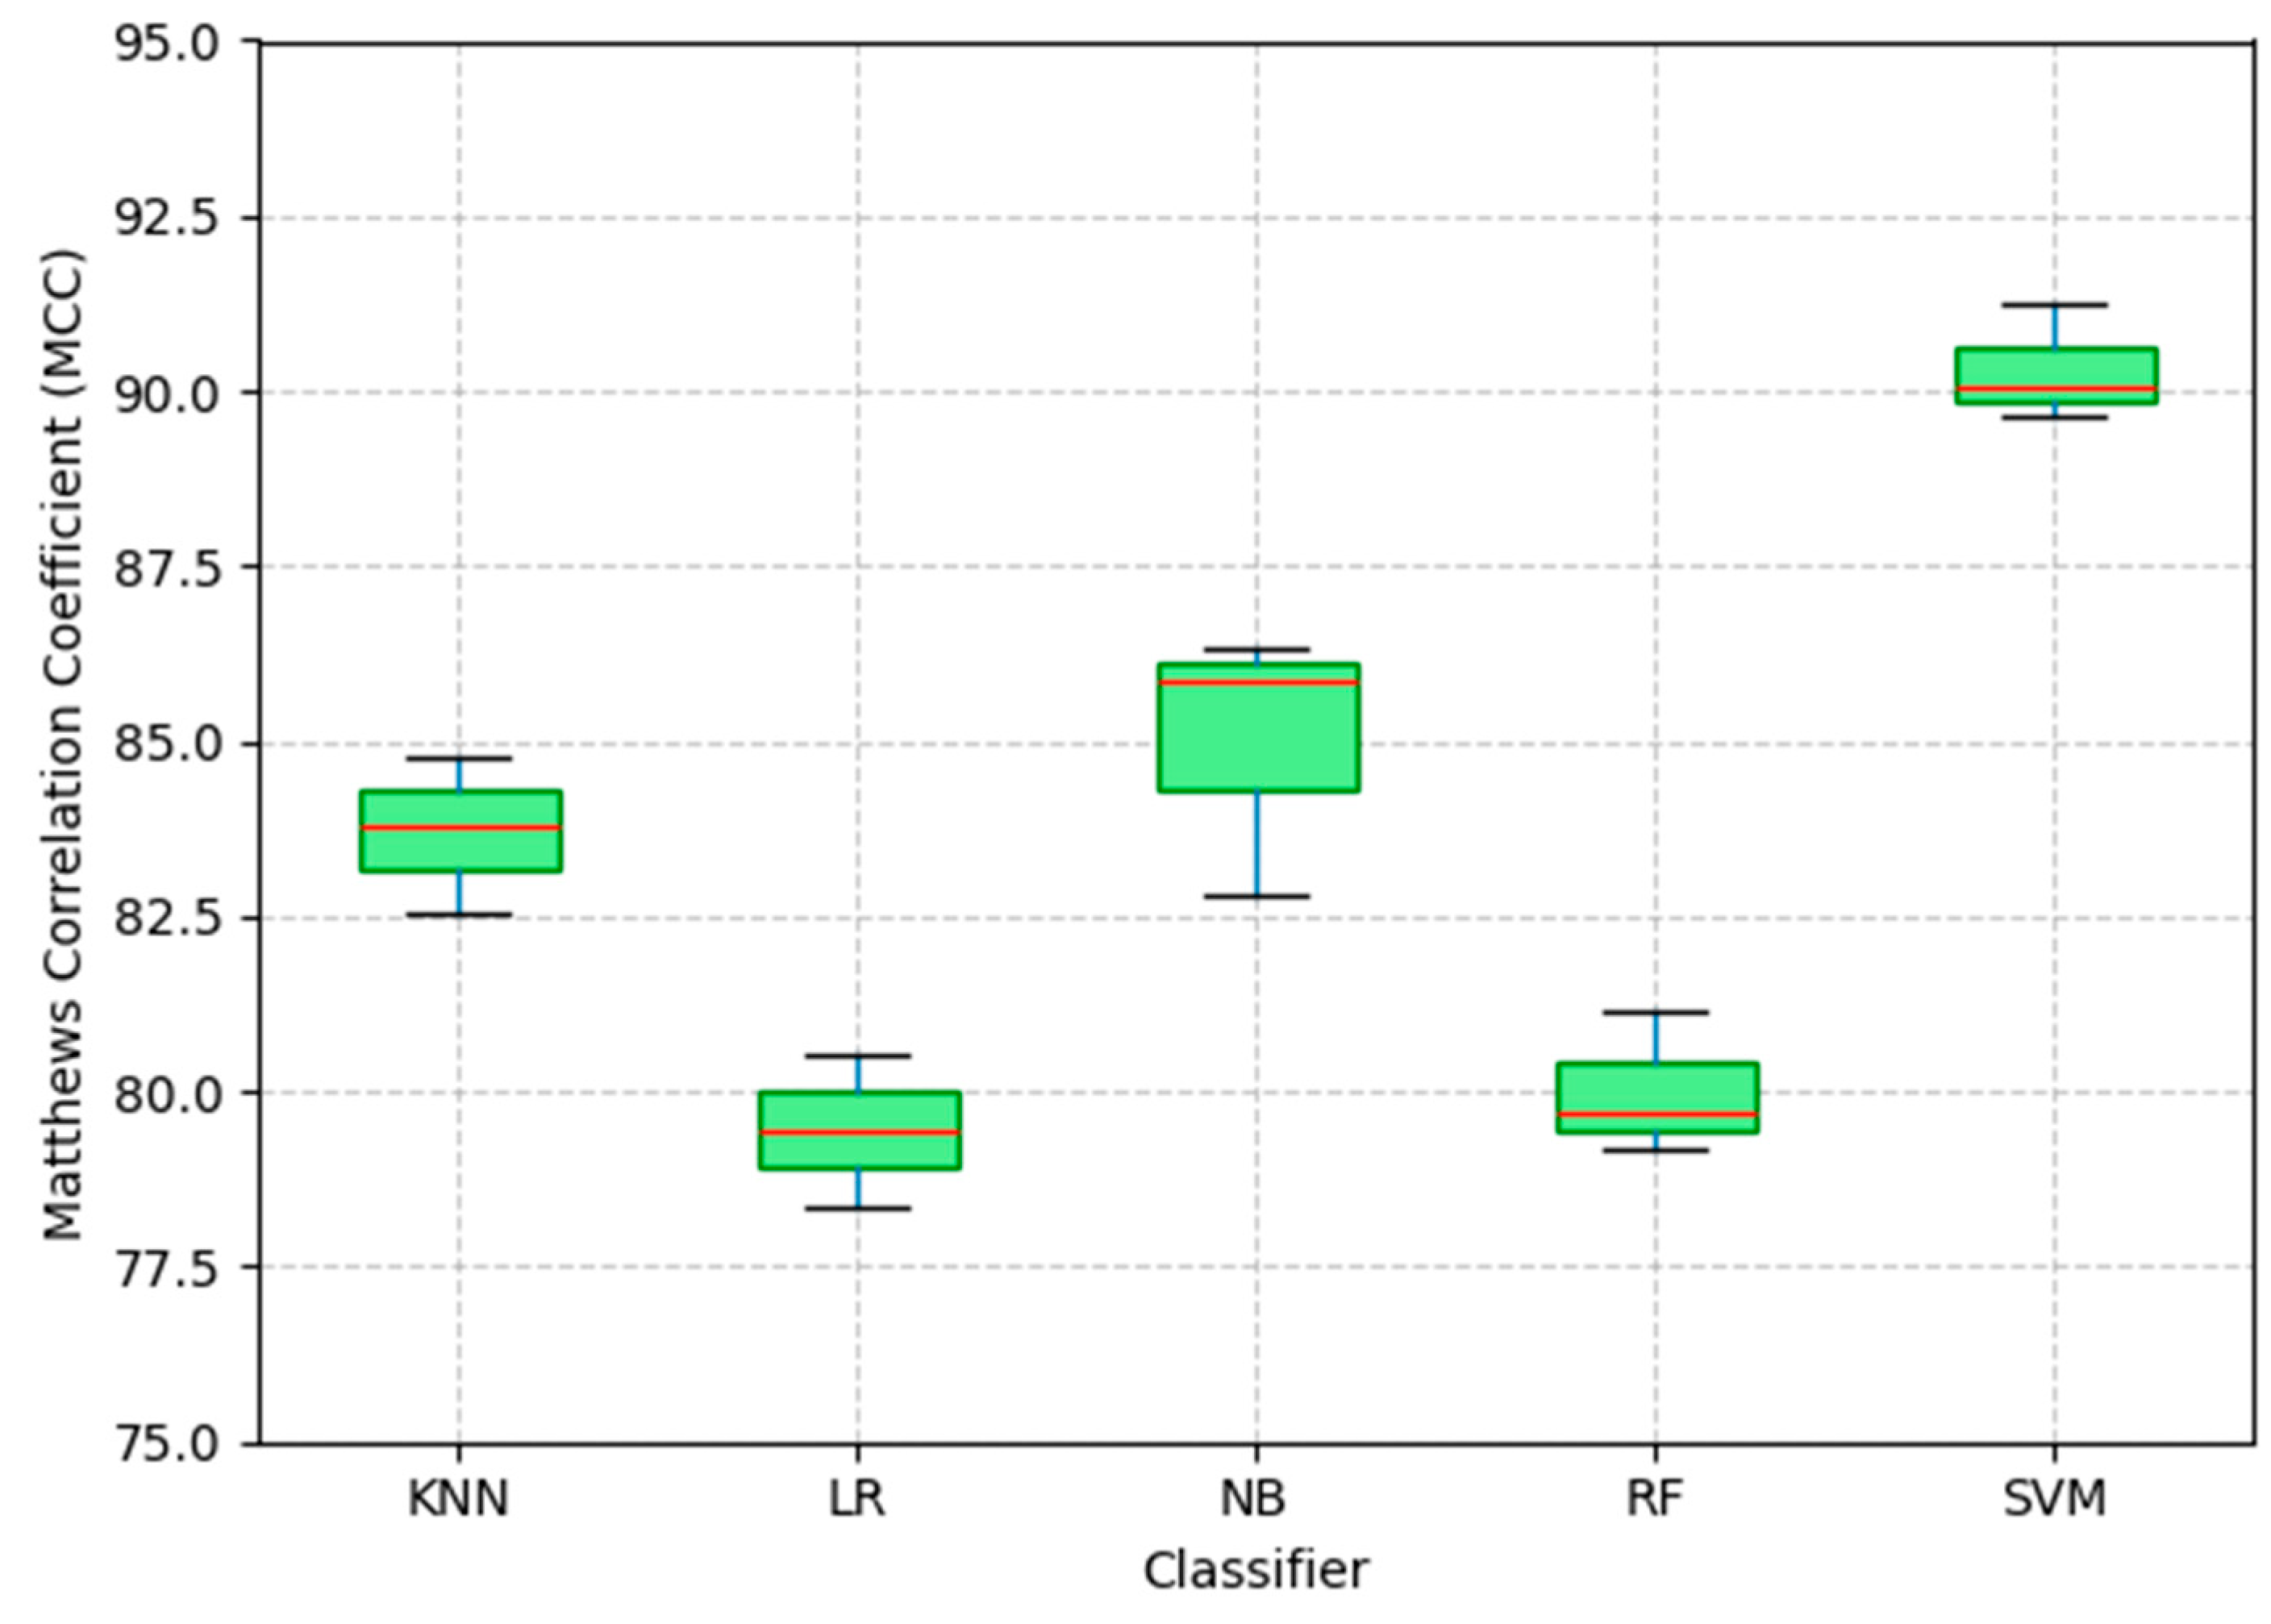
Figure 5.
Classifiers performance heatmap by metric.
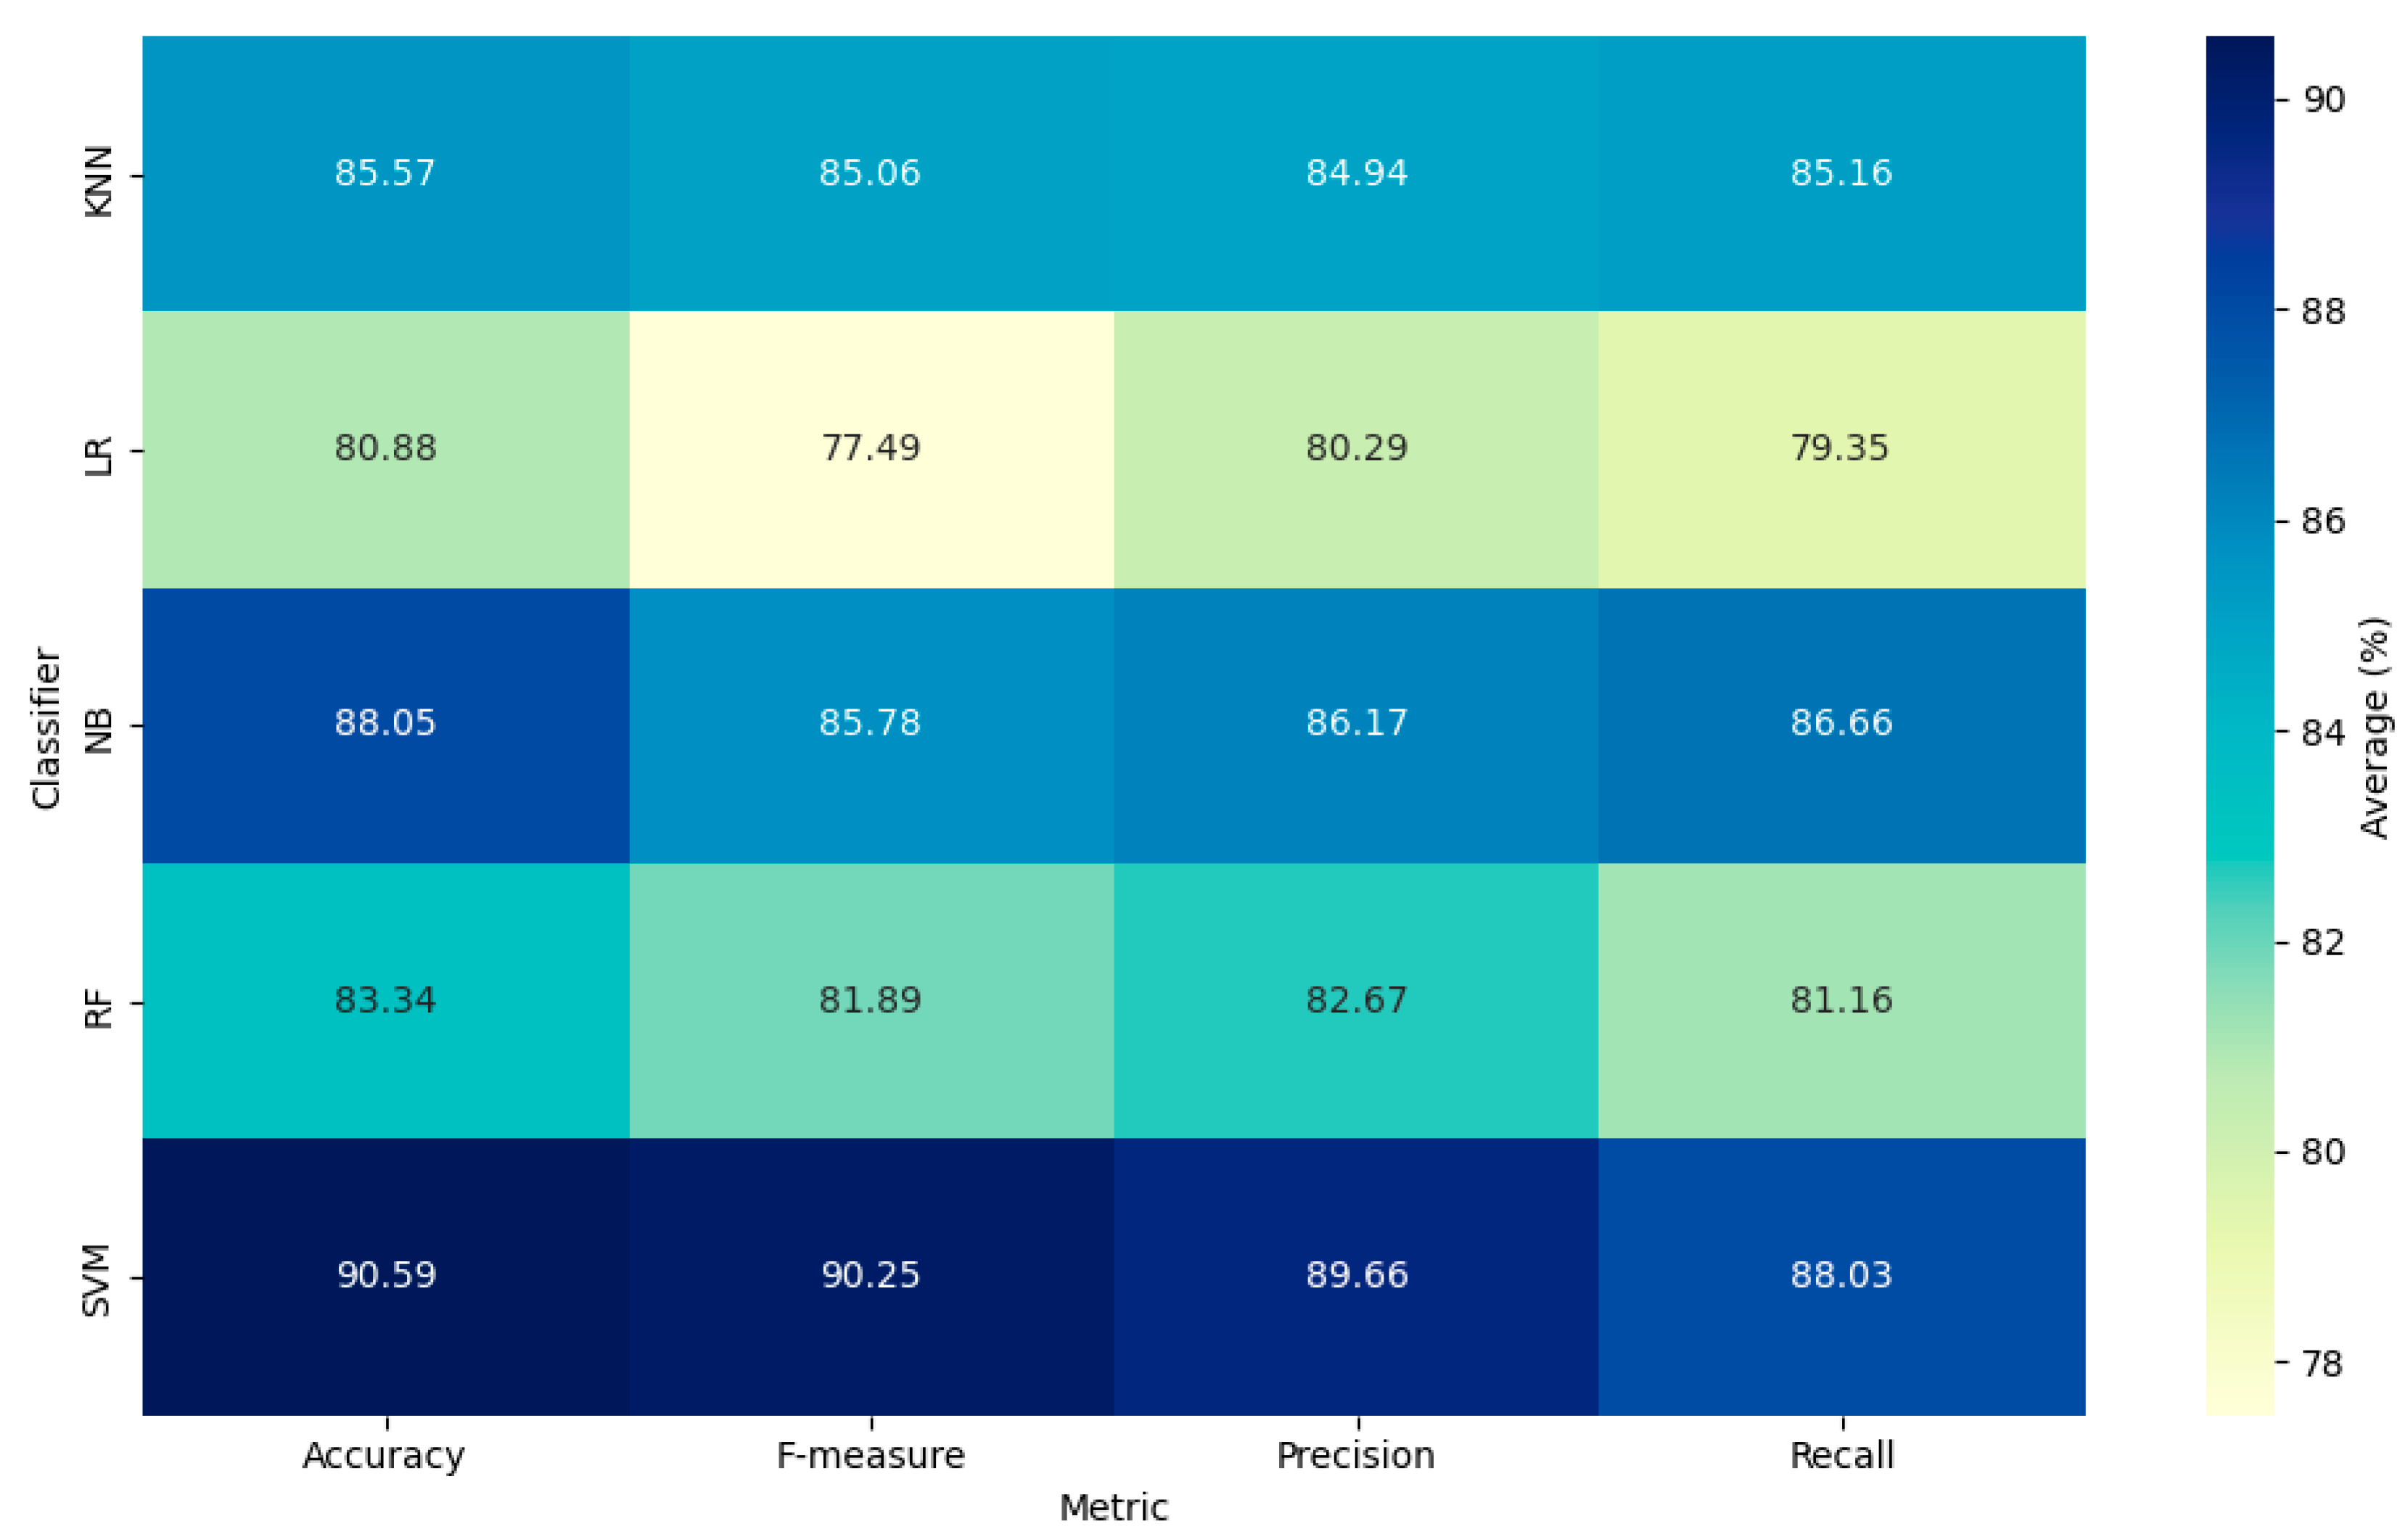

Table 1.
Case study datasets.
| Specialized center | Region/Country | Categories | No. of files | Age range | OM approach | Standardized assessment instruments |
|---|---|---|---|---|---|---|
| Center 1 | Orizaba, Veracruz, Mexico | Children | 82 | 2-6 | PII | ADI-R - ADOS 2 |
| Center 2 | Valdivia, Región de Los Ríos, Chile | Children | 71 | 2-6 | PII | M-CHAT R/F - CARS |
Table 2.
Processes of capitalization, tokenization, and term filtering.
| Example question | Process | Status | Response | Valid tokens |
|---|---|---|---|---|
| Does the child make eye contact when you speak to him or her or call his or her name? | Capitalization | Before | Not always. Sometimes he doesn’t respond when I call him, even if I’m close. He rarely looks me in the eyes, except for a few seconds or if I keep trying | 100% |
| After | {not always. sometimes he doesn’t respond when i call him, even if i’m close. he rarely looks me in the eyes, except for a few seconds or if i keep trying} | |||
| Tokenization | After | {“not”, “always”, “sometimes”, “he”, “doesn’t”, “respond”, “when”, “i”, “call”, “him”, “even”, “if”, “i’m”, “close”, “he”, “rarely”, “looks”, “me”, “in”, “the”, “eyes”, “except”, “for”, “a”, “few”, “seconds”, “or”, “if”, “i”, “keep”, “trying”} | 100% | |
| Terms filtering | After | {“sometimes”, “respond”, “call”, “close”, “rarely”, “looks”, “eyes”, “few”, “seconds”, “keep”, “trying”} | 37% |
Table 3.
Performance metrics of the classifiers used.
| Classifier | Categories | Accuracy | Precision | Recall | F - Measure | MCC | AUC-ROC |
|---|---|---|---|---|---|---|---|
| 1 | 87.66 | 85.81 | 86.61 | 85.73 | 85.87 | 88.15 | |
| NB | 2 | 88.56 | 86.78 | 87.03 | 86.38 | 86.33 | 89.56 |
| 3 | 87.92 | 85.92 | 86.34 | 85.22 | 82.79 | 84.32 | |
| 1 | 90.56 | 89.87 | 88.53 | 90.47 | 90.03 | 91.76 | |
| SVM | 2 | 91.34 | 90.02 | 89.02 | 91.12 | 91.22 | 92.15 |
| 3 | 89.88 | 89.09 | 86.54 | 89.15 | 89.62 | 92.73 | |
| 1 | 85.42 | 84.48 | 86.67 | 85.1 | 82.57 | 86.83 | |
| KNN | 2 | 86.29 | 86.05 | 84.54 | 85.84 | 84.76 | 87.99 |
| 3 | 84.99 | 84.3 | 84.27 | 84.23 | 83.81 | 85.6 | |
| 1 | 82.58 | 82.16 | 81.22 | 81.08 | 81.17 | 83.67 | |
| RF | 2 | 83.53 | 83.4 | 82.34 | 82.98 | 79.19 | 84.8 |
| 3 | 83.92 | 82.46 | 79.91 | 81.62 | 79.69 | 83.4 | |
| 1 | 80.33 | 80.42 | 78.27 | 77.5 | 78.36 | 79.92 | |
| LR | 2 | 81.86 | 80.77 | 80.86 | 78.27 | 80.54 | 82.32 |
| 3 | 80.46 | 79.69 | 78.92 | 76.71 | 87.87 | 81.48 |
Table 4.
Dispersion of detections by category.
| Center | Age range | Gender | Level of autism detected | No. of files | % |
|---|---|---|---|---|---|
| 1 | 2-6 | Male | 1 | 26 | 32% |
| 2 | 15 | 18% | |||
| 3 | 12 | 15% | |||
| Female | 1 | 9 | 11% | ||
| 2 | 16 | 20% | |||
| 3 | 4 | 5% | |||
| Subtotal | 82 | 54% | |||
| 2 | 2-6 | Male | 1 | 21 | 30% |
| 2 | 11 | 15% | |||
| 3 | 11 | 15% | |||
| Female | 1 | 9 | 13% | ||
| 2 | 12 | 17% | |||
| 3 | 7 | 10% | |||
| Subtotal | 71 | 46% | |||
| Total | 153 | 100% |
Disclaimer/Publisher’s Note: The statements, opinions and data contained in all publications are solely those of the individual author(s) and contributor(s) and not of MDPI and/or the editor(s). MDPI and/or the editor(s) disclaim responsibility for any injury to people or property resulting from any ideas, methods, instructions or products referred to in the content. |
© 2025 by the authors. Licensee MDPI, Basel, Switzerland. This article is an open access article distributed under the terms and conditions of the Creative Commons Attribution (CC BY) license (http://creativecommons.org/licenses/by/4.0/).
Copyright: This open access article is published under a Creative Commons CC BY 4.0 license, which permit the free download, distribution, and reuse, provided that the author and preprint are cited in any reuse.


