
Submitted:
04 November 2025
Posted:
06 November 2025
You are already at the latest version
Abstract
Aiming at the problems of identification and utilization efficiency evaluation of urban high-intensity development areas, and based on the general trend of urban spatial development from points to areas, this study proposes a method for identifying high-intensity development areas based on seed grid, which involves area growth, merging and segmentation, by drawing on the region growing method in image recognition. In this method, the Getis-Ord Gi* statistic of grid floor area ratio is used as the criterion to screen seed grids, and the region identification results are evaluated from the rationality of the geometric shape of the area and the independence of spatial relations. Furthermore, using gridded permanent population density, digital brightness of urban night-time lights, and point of interest (POI) density data, the utilization efficiency of high-intensity development areas is evaluated from the perspectives of population carrying capacity and industrial agglomeration. Finally, Shenzhen City is taken as an example to verify the proposed identification and utilization efficiency evaluation methods for high-intensity development areas. The results show that the proposed identification method has a good effect, and the identified high-intensity development areas have reasonable geometric shapes and independent spatial relations; in terms of utilization efficiency, the overall utilization efficiency of high-intensity development areas in Shenzhen is relatively low, especially the areas at the edge of the central district and non-central districts fail to attract population activities matching the intensity of construction.
Keywords:
grid
; urban planning
; Getis-Ord Gi*
; geometric form
; spatial independence
1. Introduction
With the rapid development of the economy, the process of urban-rural integration in China has been accelerating continuously. In 2024, the average urbanization rate in China reached 67%, far exceeding the global average of 57%. The urbanization rate of 25 key cities in China surpassed 80%, among which Shenzhen, Urumqi, Foshan, Dongguan, Zhuhai, and Xiamen recorded rates over 90%—with Shenzhen even hitting an extremely high rate of 99.8%. To cope with the rapid growing of urbanization rate, the intensive use of urban land and high-intensity development have become core characteristics of modern urban development. By 2024, China had built more than 2,800 high-rise buildings over 150 meters in height, accounting for over 50% of the global total. Among the top 10 cities worldwide in terms of the number of such high-rises, 6 are in China. Specifically, Hong Kong ranks first with 657 buildings, while Shenzhen takes second place with 513 buildings. Against this backdrop, the core functional areas of first-tier cities, relying on their highly intensive land development and industrial agglomeration effects, make the main contributions to the city’s GDP and innovative vitality. For instance, in 2024, Yuehai Sub-district in Nanshan District, Shenzhen, achieved a GDP of 477.9 billion yuan, contributing 12.9% of Shenzhen’s total GDP with only 1% of the city’s land area.
However, in actual operation, the population carrying capacity and industrial agglomeration capacity of many high-intensity development areas have not effectively matched their construction intensity, resulting in a structural underutilization phenomenon characterized by "high input but low output". In June 2025, the global office vacancy rate exceeded 20% for the first time, with the vacancy rate of Grade A office buildings in Shenzhen even approaching 30%. The national residential vacancy rate stood at 21.3%, while that of Shenzhen reached 16.8%—far exceeding the internationally recognized warning line of 10%. On one hand, this phenomenon stems from internal factors such as changes in the urban economic structure, shifts in industrial demand, and an increase in new supply. On the other hand, external factors include the inadequacy of supporting infrastructure for transportation, medical care, education, shopping, and daily life. Data from the National Bureau of Statistics shows that from 2012 to 2022, the area of built-up districts across the country increased by nearly 40%, while the growing of indicators such as per capita length of municipal roads, public green spaces, and medical and health service points lagged relatively behind. Recently, in response to issues in high-intensity development areas—such as the lag in public service facilities, insufficient road network carrying capacity, and declining environmental quality—many cities have launched special "urban renewal" initiatives. These initiatives aim to make up for the deficiency in utilization efficiency by adding educational and medical facilities, transportation nodes, and implementing smart management measures. Accurately identifying high-intensity development areas and evaluating their utilization efficiency is a prerequisite for these efforts.
Therefore, to achieve effective connection among "planning, operation, and service" in urban management, and address the issues of identifying urban high-intensity development areas and evaluating their utilization efficiency, this study proposes an identification approach for high-intensity areas based on seed grid growing, in accordance with the basic characteristic of urban spatial development from "point to area". First, data such as gridded development intensity, permanent population density, digital brightness of urban nighttime lights, and point of interest (POI) density are acquired using GIS and web crawler technologies. The Getis-Ord Gi* statistic of grid development intensity is then used as the criterion to screen seed grids. Furthermore, drawing on methods related to image recognition, an identification method for high-intensity development areas is proposed, which involves area growing, merging, and segmentation based on seed grids. The identification results are evaluated from two aspects: the rationality of the geometric form of the areas and the independence of their spatial relationships. Finally, using population, digital nighttime light brightness, and POI data, the utilization efficiency of the areas is evaluated from perspectives including population carrying capacity and industrial agglomeration.
2. Literature Review
2.1. Identification of High-Intensity Development Areas
As a fundamental task in urban spatial governance and optimal allocation of resources, the identification of high-intensity development areas has attracted widespread attention. Current research focuses primarily on the integration of data sources, optimization of identification methods, and introduction of emerging technical means.
The diversification of data sources provides strong support for the accurate identification of high-intensity areas. With the widespread application of various data sources such as remote sensing images, points of interest (POIs), and building base maps, the accuracy and precision of area identification have been significantly improved. For instance, Peng et al. [1] used a Self-Organizing Feature Map (SOFM) model to integrate land development scale, density, and form, thereby realizing the effective extraction of urban fringe expansion areas in Beijing; Huang et al. [2] constructed a functional intensity index based on POI density, which enabled the accurate identification of urban functional areas. However, existing studies lack the identification of high-intensity areas based on urban construction characteristics, making it difficult to effectively and quickly identify high-intensity central areas of cities using existing actual data while preserving the spatial correlation between grids.
Traditional clustering methods have been widely applied in area identification studies. For example, Yuan et al. [3] combined dynamic call records and POI data, and used kernel density estimation and K-means clustering techniques to identify functional areas within the Third Ring Road of Beijing. Song Jie [4] improved the fast search and find of density peaks (FSFDP) clustering algorithm, providing a tool capable of discovering potential patterns in spatiotemporal grid data and performing natural grouping. With the increasing complexity of data, machine learning methods have begun to be introduced. Li et al. [5] used the random forest method to analyze the mixing degree of functional zones in Chongqing, revealing the diversity and clustering of functional divisions in the central urban area. Niu et al. [6] introduced the Doc2Vec embedding model to learn the relationship between POI categories and regional spatial attributes, and realized cluster classification by training spatial region vectors. Sun et al. [7] integrated nighttime light data and taxi trajectory data through deep learning, constructing a multi-source fusion framework for refined identification of urban boundaries.
Currently, the stability of clustering methods often depends on parameter selection and the uniformity of data distribution, making them suitable for regular-shaped areas. In contrast, machine learning methods have higher requirements for data quality, are more sensitive to data missing or noise, and have relatively low interpretability. Their identification effect is limited when processing fine-grained land parcels, especially with certain limitations in the detection of small irregular parcels. Although these methods have improved the multi-dimensional adaptability of spatial structure identification, they rely heavily on data quality and model stability, and the identification results lack coherence and robustness.
Research on urban center system identification, which is closely related to the identification of high-intensity development areas, provides an important reference for understanding the spatial intensity distribution of cities. Yi Minyi et al. [8] identified areas with high agglomeration of both service facilities and residents’ activities based on the factor superposition method, and used road networks to correct boundaries, finally determining the spatial scope of public activity centers. Qin Shiwen et al. [9] identified the urban center system of Nanjing through comprehensive superposition of multiple indicators, based on business type distribution, vitality intensity, and development intensity. Wei Wei et al. [10] used a multi-source data fusion method to conduct hierarchical identification of urban centers in the main urban area of Hangzhou. Although these studies comprehensively considered multiple factors such as Floor Area Ratio (FAR), business type distribution, and vitality intensity, they often adopted simple superposition or weighting methods, lacking in-depth analysis of the interaction relationships between various factors. In addition, most studies only identified central points or hotspots through methods such as kernel density analysis, failing to clearly define the spatial scope and boundaries of the centers.Urban centers are often the core areas of high-intensity development, but existing studies have not effectively established a method system from center identification to the delineation of complete boundaries of high-intensity areas, making it difficult to accurately grasp the integrity of spatial form and the characteristics of internal heterogeneity of high-intensity development areas.
Furthermore, improving the accuracy of regional boundary identification in complex urban contexts remains a major challenge faced by the industry. Recent studies have begun to explore new algorithms based on Bayesian optimization, wavelet transform, and multi-resolution segmentation. Ren et al. [11] proposed a novel RScan algorithm for identifying activity areas based on grid density, and conducted an empirical analysis of second-hand housing transaction activities and their spatiotemporal evolution in Shenyang. He et al. [12] used wavelet transform to fuse data and segmented images through a multi-resolution segmentation method, realizing the delineation and verification of urban agglomeration boundaries.
In recent years, image recognition methods have also been gradually introduced into urban spatial research, and have demonstrated superior automation and accuracy, especially in land parcel boundary identification and area segmentation. For example, Huang et al. [13] constructed a Semi-Transfer Deep Convolutional Neural Network (STDCNN) and conducted parcel-level identification on high-resolution remote sensing images of Hong Kong and Shenzhen, achieving accuracies of up to 91.25% and 80% respectively. This verifies the feasibility of this method in delineating complex areas. Wang et al. [14] applied the EfficientNetV2 model to the identification of 14 types of land use in core urban areas such as Tangshan, achieving an accuracy of 84.56%, which can support the evaluation of land use efficiency in high-intensity development areas. Although image recognition has not yet formed a standard system in the identification of high-intensity areas, its cross-domain potential in boundary extraction, spatial segmentation, and efficiency identification is providing technical support for adaptive identification methods based on gridded spatial structures.
2.2. Analysis of High-Intensity Development Areas
As urban space develops toward compactness and intensification, the analysis of factors influencing the Utilization efficiency and utilization efficiency of high-intensity areas has become a key research direction in both academic and practical fields. Current research findings mainly focus on the following aspects.
Regarding the utilization efficiency of high-intensity urban areas, scholars have constructed diverse evaluation index systems from different perspectives and conducted empirical analyses. He et al. [15] proposed a land use efficiency index from the perspective of "spatial vacancy-utilization rate", integrating nighttime light data, population density, and facility density to evaluate the efficiency of fringe areas in 36 megacities. This fills the gap in traditional methods regarding the evaluation of urban functional carrying capacity. Ruan et al. [16] constructed a "construction intensity-utilization efficiency" index. By combining multi-source data, they classified areas into three categories: "low efficiency", "overload", and "matched", effectively identifying the mismatch between construction investment and actual utilization. Xia et al. [17] conducted an empirical analysis of the coupling relationship between land use intensity and urban vitality in five cities including Beijing and Shanghai, and revealed the efficiency imbalances of "overcrowding" or "resource idleness" in different regions. Qiao et al. [18] proposed a method for industrial land identification and efficiency evaluation by integrating OpenStreetMap and POI data, analyzing the spatial characteristics of industrial zones within the Fifth Ring Road of Beijing, such as "significant north-south differences and agglomeration of low-efficiency areas". Li et al. [19] proposed a "parcel-level" urban land use efficiency evaluation method that integrates multi-source spatiotemporal data. This method breaks through the previous limitation of coarse granularity at the "city-level or street-level" and verifies the impact of factors such as planning policies, facilities, and transportation on spatial differences in efficiency.
Building on efficiency evaluation, research has further explored the mechanism of action of various influencing factors. Geng et al. [20] identified facility service capacity as a key influencing factor of construction efficiency. By establishing a Backpropagation (BP) Neural Network model, they evaluated the key impacts on land use efficiency and pointed out the problem of mismatch between facilities and population at administrative boundaries. Qi et al. [21] found a widespread negative correlation between land use intensity and ecosystem services, emphasizing that ecological constraints should be taken into account during urban development. Li et al. [22] used GIS analysis methods to examine "leisure space distribution" and crowd activity levels. Their empirical results showed that different spatial structures have significant differences in their impact on the intensity of human activities, indicating that the spatial structure of high-intensity areas should be diverse and highly compatible. To address spatial matching differences between facilities and construction intensity, studies often adopt accessibility analysis and spatial autocorrelation methods. Xu et al. [23] applied a big data matching model to evaluate facility equity. By overlaying Baidu Heatmap data with POI data, they evaluated facility service efficiency from the perspective of the 15-minute living circle for the first time, and proposed a community-oriented accessibility index to realize equity evaluation at the micro scale. Wang et al. [24] introduced the concept of underground space development intensity and conducted an empirical analysis of Wuhan’s underground space. They found that its spatial distribution exhibits the characteristics of "global dispersion and local agglomeration", providing methodological innovation for the evaluation of urban three-dimensional space load.
2.3. Urban Spatial Theories
Although the phenomenon of urban high-intensity development is supported by theories such as the Central Place Theory and the Compact City Theory at the macro level, and guided by planning theories such as building density control at the micro level, at the meso scale of area identification, existing theories lack specialized theoretical explanations for the formation mechanism and boundary determination of continuous high-intensity development areas. Therefore, this study will draw on relevant urban spatial theories to analyze the formation mechanism and spatial characteristics of high-intensity development areas, and select appropriate identification methods based on this analysis.
(1) Spatial Agglomeration Mechanism of the growing Pole Theory
The growing Pole Theory was proposed by French economist François Perroux in 1955 [30]. This theory argues that economic development exhibits an unbalanced spatial distribution, with economic activities tending to form an agglomeration effect at specific locations. Perroux pointed out [31] that a growing pole is an economic unit composed of leading industries or innovative enterprises. Through forward and backward linkage effects, it forms industrial clusters, which in turn drive the economic development of surrounding areas. The core of this theory lies in explaining the spatial concentration of economic activities and their diffusion mechanism.
From the perspective of urban development intensity, the formation process of high-intensity development areas is highly consistent with the growing Pole Theory. High-intensity development in cities often originates from core land parcels with location advantages, such as central business districts (CBDs), transportation hubs, or areas surrounding important public facilities. Due to their scarcity and irreplaceability, these core parcels become "seeds" of urban development, attracting substantial capital investment and construction activities. As development intensity increases, these core parcels exert a polarization effect on the surrounding areas: through means such as land value appreciation, infrastructure improvement, and accessibility enhancement, they drive a gradual increase in the development intensity of adjacent parcels, ultimately forming continuous high-intensity development areas.
(2) Supporting Role of the Spatial Agglomeration Theory
The Spatial Agglomeration Theory holds that the concentration of economic activities in geographical space generates an agglomeration economy effect—i.e., the spatial proximity of enterprises and activities leads to improved production efficiency and reduced costs [32]. This theory explains why economic activities are not evenly distributed across space but tend to form dense agglomerations in specific regions [33].
In the context of urban development intensity, the Spatial Agglomeration Theory reveals the economic logic behind the formation of high-intensity development areas. First, the intensification of land use can reduce the average cost of infrastructure construction, achieving economies of scale. Second, the mixed functions and increased density within high-intensity development areas help shorten commuting distances and lower transportation costs. Third, the agglomeration effect promotes the exchange of knowledge and information, improving the efficiency of innovative activities. At the same time, the spatial proximity and distance decay characteristics emphasized by the agglomeration theory also provide a theoretical basis for understanding the spatial distribution patterns of high-intensity development activities. Therefore, the formation of urban high-intensity development areas is a natural outcome of the market mechanism, reflecting the economic rationality of land resource allocation.
(3) Spatial Logic of Urban Morphology Theory
Urban Morphology Theory provides a crucial perspective for understanding the spatial characteristics of high-intensity development areas. Conzen‘s [34] Urban Morphology Theory emphasizes the historical evolution process of urban form, arguing that urban form is the result of the combined effects of the natural environment, socio-economic conditions, and planning policies. This theory decomposes urban form into three layers: street systems, land parcel structures, and building forms, with a focus on the identification of morphological units and the delineation of boundaries.
The concept of "Morphological Frame" in Conzen’s theory holds significant guiding significance for the identification of high-intensity development areas. The Morphological Frame refers to the existing spatial structure that restricts urban development, including elements such as natural terrain, historical streets, and important buildings—these elements exert a path-dependent influence on subsequent development [35]. The formation of high-intensity development areas is often constrained and guided by the existing Morphological Frame, exhibiting spatially relatively independent and internally agglomerated characteristics. This spatial organization logic provides a theoretical basis for area identification methods based on the independence of spatial relationships: the interior of an area shows high agglomeration due to functional similarity and development continuity, while different areas remain relatively independent due to the separation effect of the Morphological Frame. This thus forms identifiable spatial boundaries and functional zones.
(4) Structural Guidance of Urban Central System Theory
Urban Central System Theory provides an important theoretical framework for understanding the formation and distribution of high-intensity development areas from the perspective of macro-spatial structure. The evolution of urban spatial structure follows the basic law of development from a single-center to a multi-center network, and its spatial expansion exhibits diverse characteristics, including different patterns such as continuous expansion, axial development, and leapfrog growing [36].
In the development of modern cities, high-intensity development is often concentrated in key nodes of the urban central system. These nodes form a development pattern in space that is both mutually independent and functionally interconnected [37]. Due to differences in their status and functions within the urban system, each central node exhibits different agglomeration intensities and spheres of influence, thereby forming hierarchical high-intensity development areas in urban space. This spatial organization model reflects the agglomeration economy effect and functional division characteristics of urban development.
Urban Central System Theory reveals two important spatial characteristics of high-intensity development areas: first, the interior of each area shows high spatial agglomeration due to functional concentration and factor aggregation; second, different areas maintain relative independence due to functional division and spatial separation. This spatial characteristic of "internal cohesion and external separation" provides a theoretical basis for the identification of high-intensity development areas. Specifically, by analyzing the agglomeration degree of spatial factors and the interrelationships between regions, it is possible to effectively identify and delineate high-intensity development areas with relatively complete functions and relatively clear boundaries.
The formation of urban high-intensity development areas follows the agglomeration-diffusion mechanism of the growing Pole Theory, the economic logic of the Spatial Agglomeration Theory, the spatial organization laws of the Urban Morphology Theory, and the structural evolution laws of the Urban Central System Theory. Therefore, this study will draw on the achievements of these theories and adopt the grid growing method: starting from high-intensity cores, it will gradually incorporate relevant grids to realize the "growing" of areas through adjacency relationship judgment and spatial independence evaluation, and finally determine the boundaries of areas characterized by internal agglomeration and external independence.
2.4. Summary of the Literature Review
Although a large number of research results have been achieved in the identification and analysis of urban high-intensity areas at home and abroad, there are still the following shortcomings:
(1) Existing identification methods have insufficient accuracy and coherence in boundary identification. They fail to accurately identify features and grid neighborhood relationships, making it difficult to capture the irregular shapes of area edges. Additionally, the algorithms lack interpretability and robustness.
(2) Research on the utilization efficiency of high-intensity development areas mainly focuses on the selection of different evaluation indicators, but there is a lack of refined evaluation studies that distinguish between different land use attributes.
Research on the identification and efficiency evaluation of high-intensity areas is relatively independent, and there is a lack of a systematic analysis framework that covers the process from identification to evaluation and then to optimization. Although existing studies consider different land use attributes in efficiency evaluation, the connection between methods in the identification stage and the evaluation stage is not close enough, making it difficult to form a complete decision support system. (Professor Zou, please check if this paragraph is correct.)To address the above shortcomings, the grid-based growing regression identification method proposed in this study uses high FAR grids as seeds, and combines dynamic gradient thresholds with a non-maximum suppression algorithm to realize adaptive boundary expansion and redundancy removal. This method can effectively ensure the validity of features and boundary coherence in irregular areas, while also guaranteeing the interpretability of the method and the flexibility of parameters, thus having applicability for identification at different scales. By connecting to the efficiency-matching evaluation system and revealing the influencing mechanism through spatial regression analysis, a closed-loop decision support process of "identification-diagnosis-optimization" is finally constructed. This process has significant advantages in improving identification accuracy, enhancing the objectivity of evaluation, and supporting comparative analysis of schemes.
3. Methodology and Data
3.1. Identification Method of High-Intensity Development Areas Based on Region Growing
The region growing algorithm is an image recognition algorithm based on pixel neighborhood information. Its core idea is to start from seed pixels and gradually merge adjacent pixels into a single region, while maintaining a certain degree of similarity and connectivity during the merging process. The advantages of this algorithm lie in its speed, accuracy, and reliability, enabling precise segmentation and recognition of targets in images. Considering that its algorithmic logic is highly consistent with the identification approach for high-intensity development areas established in Section 4.1 of this study, the region growing algorithm from the field of image recognition is selected to identify urban high-intensity development areas.
The implementation process of the region growing algorithm is as follows: First, seed pixels are set, and region growing is initiated from these seeds. During the growing process, specific similarity criteria are used to determine whether a current pixel belongs to the target region. These criteria include grayscale similarity, color similarity, texture similarity, and more. If the current pixel is deemed to belong to the target region, it is merged into the region; if not, the algorithm continues to explore surrounding pixels. The region growing process concludes only when all pixels adjacent to the seed pixels have been merged into the target region, at which point the region becomes an independent set of pixels.
Considering that areas grown from multiple seeds are likely to overlap, the area identification algorithm proposed in this study consists of three parts: growing of high-intensity development areas, merging and segmentation of high-intensity development areas and screening of final high-intensity development areas.
3.1.1. Region Growing of High-Intensity Development Areas
(1) Selection of Seed grids
Seed grids serve as the starting point for region growing, and the quality of their selection directly affects the growing outcome. Generally, the closer a seed grid is to the actual center of an area, the better the growing effect. The Getis-Ord * statistic in hot-spot analysis is precisely capable of identifying the spatial clustering locations of grid elements. Therefore, this study selects the Getis-Ord * statistic of grids as the indicator for seed grid selection, with the specific calculation formula as follows:
Among them, represents the Getis-Ord * statistic of grid ; denotes the spatial weight between grid and grid ; stands for the straight-line distance between grid and grid ; indicates the average value of development intensity of all grids when the size of grid is ; and represents the standard deviation of development intensity of all grids when the size of grid is .
Considering that the number of high-intensity development areas is usually small, this study sets the seed grid selection criterion as the upper 5th percentile of the Getis-Ord * statistics of all grids, resulting in seed grids ().
(2) Seed grid Growing
Preliminary high-intensity development areas ()are obtained by conducting growing starting from each seed grid (). The specific growing steps are as follows:
Step 1: Initiate the growing of a specific area from its corresponding seed grid , i.e., [define the initial state of the area as the seed grid .
Step 2: During the growing phase of a specific area (b), the grid to be incorporated into the growing area shall be the one with the highest development intensity among all adjacent grids of the area at that phase.
Step 3: If adding this grid results in the average development intensity of area being greater than a preset threshold, incorporate the grid into area and return to Step 1; otherwise, terminate the growing of area .
3.1.2. Merging and Segmentation of High-Intensity Development Areas
Since there may be overlaps between the preliminary high-intensity development areas obtained through seed grid growing, it is necessary to merge or segment the overlapping areas.
(1) Merging Conditions
Merging refers to combining two overlapping areas into a new area while deleting the original two areas. Considering that the preliminary areas are generated by seed grid growing and the importance of overlapping regions to the areas, the two areas will be merged if either of the following two conditions is met: The seed grids of both areas are within the overlapping region; The overlapping region is important to both areas (i.e., removing the overlapping region will reduce the average development intensity of the areas).
(2) Segmentation Conditions
Segmentation refers to removing the overlapping part of two overlapping areas from one or both areas, while deleting the original one or two areas. Considering the importance of the initial overlapping region to the areas, if the overlapping region is unimportant to a specific area (i.e., removing the overlapping region will reduce the average development intensity of the area), the overlapping region will be removed from that area to form a new area. If there is no seed grid in the new area, the area will also be deleted.
(3) Merging and Segmentation Steps
The preliminary high-intensity development areas ()are respectively merged and segmented to obtain the final high-intensity development areas (). The specific merging and segmentation steps are as follows:
Step 1: Select the two areas with the largest overlapping region from all current areas.
Step 2: Merge or segment these two areas according to the merging conditions and segmentation conditions, and update the areas. If there are still overlapping regions between areas, return to Step 1; otherwise, terminate the process.
3.1.3. Screening of Final High-Intensity Development Areas
Typically, urban planning imposes certain requirements on the area of a district. Meanwhile, considering that the high-intensity development districts in this study are derived from the growing of seed grids, two screening criteria are proposed, one of which is that the area of a district should include at least one seed grid. By removing the districts in ()that do not meet these two screening criteria, the final high-intensity development districts are obtained as ().
3.2. Evaluation Method of Identification
To comprehensively evaluate the accuracy and rationality of high-intensity development areas identified using the grid-based growing method, this study will introduce relevant indicators to conduct an assessment from multiple perspectives, including the development intensity distribution, geometric form, and spatial relationships of the areas.
3.2.1. Stability of Area Development Intensity
The stability and consistency of development intensity distribution within an area are important criteria for judging the accuracy of area identification. Therefore, this study introduces the coefficient of variation of grid development intensity within the area as an evaluation indicator for the stability of area development intensity. The specific calculation formula is as follows:
Among them, represents the coefficient of variation of the development intensity of all grids in area ; (denotes the variance of the development intensity of all grids in area ; and stands for the mean value of the development intensity of all grids in area . According to common standards, a value less than 0.3 indicates good stability.
3.2.2. Rationality of Area's Geometric Form
Regarding the geometric form of an area, there are generally no prescribed shape requirements; typically, it is sufficient that the boundary is not excessively tortuous, overly elongated, or deeply indented. Therefore, this study introduces the convexity of the area as an evaluation indicator for the rationality of the area’s geometric form. The convexity of an area is the ratio of its area to the area of its minimum convex hull. Among them, the minimum convex hull of the area can be efficiently obtained using the Graham scan algorithm, and the specific calculation formula is as follows:
Among them, represents the convexity of Area ; denotes the minimum convex hull of Area . According to common standards, a value greater than 0.8 indicates good rationality.
3.2.3. Independence of Area Spatial Relationships
The spatial independence and agglomeration trend of areas are important criteria for judging the accuracy of area identification. Typically, indicators for evaluating independence include the centroid distance between areas and the minimum buffer overlap rate. Since the centroid distance is suitable for scenarios where areas have regular shapes and small differences in area—conditions that high-intensity development areas do not meet—this study selects the minimum buffer overlap rate between areas as the evaluation indicator for the independence of area spatial relationships. The specific calculation formula is as follows:
Among them, represents the minimum buffer overlap rate of Area when the buffer is set to grids; denotes the minimum buffer overlap rate between Area and Area when the buffer is set to grids; stands for the area of Area; and refers to the buffer zone obtained by expanding the area outward by grids when the buffer is set to grids. According to common standards, a value less than 0.2 indicates good independence.
3.3. Evaluation Method of Utilization Efficiency
High-intensity development implies high costs, and its Utilization efficiency is directly related to the economic development level of the area and the sustainable utilization of resources. Therefore, based on the analysis in Section 3.2, this study selects three factors—permanent population density, digital brightness of night-time lights, and point of interest (POI) density—to evaluate the Utilization efficiency of high-intensity development areas. First, the single Utilization efficiency indicators for grids and areas corresponding to the three factors are elaborated respectively; further, the comprehensive Utilization efficiency indicators for grids and areas are presented.
3.3.1. Single Utilization Efficiency Indicator
The Utilization efficiency of high-intensity development areas is an indicator relative to development intensity. Therefore, this study proposes to use the ratio of the factor level to the development intensity level as the Utilization efficiency indicator for that factor. Among them, the factor level reflects the relationship between the described area and the average situation. The specific calculation formulas for the single Utilization efficiency indicators of the three factors are as follows:
Among them, 、 and respectively represents the permanent population density level, digital brightness level of night-time lights, and POI (Point of Interest) density Utilization efficiency of Grid ; 、、 and respectively denotes the development intensity level, permanent population density level, digital brightness level of night-time lights, and POI density Utilization efficiency of Area ; 、、 and stands for the overall average development intensity, average permanent population density, average digital brightness of night-time lights, and average POI density.
3.3.2. Comprehensive Utilization Efficiency Indicator
Since the Utilization efficiency of different factors reflects population and industrial agglomeration across different dimensions, this study selects the one with the highest Utilization rate among the three factors as the comprehensive Utilization efficiency indicator for grids. The specific calculation formula is as follows:
Among them, represents the comprehensive Utilization efficiency of Grid ; denotes the comprehensive Utilization efficiency of Area . With reference to general confidence level standards and a slight relaxation of requirements, this study holds that when the Utilization efficiency falls within the ranges of [0, 0.8), [0.8, 1.2], and (1.2, ∞) respectively, it is classified as low efficiency, matched efficiency, and high efficiency.
3.4. Data Sources
Urban high-intensity development refers to a development model that achieves efficient land use by concentrating the input of capital, technology, and labor on limited land, and by increasing building density, FAR, population capacity, and other indicators. Its core characteristics include high-density building clusters, high population agglomeration, high industrial agglomeration, etc. The core characteristics are as follows:
(1) Spatial Intensification: Characterized by typical forms such as high-rise buildings, underground space development, and three-dimensional transportation.
(2) Functional Complexity: An "integrated complex" model that integrates residence, commerce, office, and entertainment functions.
(3) Capital and Technology Intensity: Relying on high-investment infrastructure and construction technologies (such as prefabricated buildings and deep foundation pit support).
3.4.1. Selection of Factors
As described in Section 3.1, urban high-intensity development is characterized by high building density, high population agglomeration, and high infrastructure load. Industrial conditions are typically described using indicators such as investment, GDP, and tax revenue; however, these indicators often have a relatively coarse granularity—at most, they can only be refined to the street level, making them unsuitable for the grid-based research in this study. Therefore, considering that Points of Interest (POIs) reflect industrial distribution and their density should be highly correlated with industrial agglomeration, this study selects development intensity as the main factor for identifying high-intensity development areas, and population density and POI density as the main factors for evaluating the utilization efficiency of such areas.
(1) Development Intensity
Development intensity is a core planning indicator for measuring the proportion of constructed space in a region, primarily used in territorial spatial planning and intensive land use management. It is calculated as the percentage ratio of urban construction land area to the total area of the administrative region, and a control system is established through indicators such as building density and FAR.
(2) Population Density
Population density can be divided into two categories: static population density and dynamic population density. In this study, static population density is measured using permanent population density. For dynamic population density, due to the lack of direct measurement data, and considering that the digital brightness of urban nighttime lights should be highly correlated with dynamic population, this study uses the digital brightness of nighttime lights as the basis for measuring dynamic population density.
(3) POI Density
POI (Point of Interest) is a common term in geographic information systems (GIS) and map services, typically referring to a specific location on a map that represents a type of site capable of attracting people. POIs include various types such as buildings, shopping facilities, catering services, transportation hubs, and medical institutions. Since this study uses POI density to measure infrastructure load, it mainly selects non-building entity POIs, specifically covering 8 categories: enterprises, shopping facilities, catering services, entertainment venues, educational institutions, accommodation services, public services, and medical institutions.
3.4.2. Acquisition of Data
(1) Development Intensity
The development intensity data required in this study is derived from China’s building data (including outline vectors and heights) obtained from the Zenodo database, and is calculated under the assumption that the floor height of buildings is 3 meters. The data corresponds to the year 2020, has a size of 41 GB, and adopts the WGS1984 coordinate system.
The building outline data in this dataset is sourced from the vector data of 280 million buildings across five East Asian countries released by scholars such as Qian Shi. This vector data is extracted from Google Earth images (with a spatial resolution of 0.5 m at Level 18) spanning 2020 to 2022 [25,26]. The building height information is estimated using machine learning methods: multi-source remote sensing features and building morphological features are integrated, and input features for the model are extracted from multi-source datasets via the Google Earth Engine (GEE) platform. Therefore, the data accuracy is guaranteed.
(2) Permanent Population Density
The permanent population density data required in this study is obtained from the national 100-meter resolution population grid data shared by Professor Chen Yuehong’s team on the figshare platform. The data corresponds to the year 2020 and uses the Albers_Conic_Equal_Area coordinate system.
Chen Yuehong’s team developed a population downscaling method using stacked ensemble learning and geospatial big data, generating China’s 100-meter resolution population grid data from the Seventh National Population Census data [27]. Compared with the LandScan global population dataset, the data from China’s national population census is more accurate and reliable for counting China’s domestic population distribution. Thus, the data accuracy is guaranteed.
(3) Digital Brightness of Nighttime Lights
The global nighttime light data is sourced from the research by scholars such as Chen Zuoqi on long-time-series global NPP-VIIRS-like nighttime light data obtained through cross-sensor calibration. The original data provided on the official website includes two formats: global nighttime light data from 2000 to 2018, and masked global nighttime light data from 2013 to 2023 (the mask refers to the removal of light data from global water system areas) [28]. The data corresponding to the year 2020 is selected for this study.
(4) POI Density
The seven categories of POI density data required in this study are obtained by calling the API interface of the POI search module on the Amap Open Platform. A total of 8 types of data are collected, including enterprises, shopping facilities, catering services, entertainment venues, educational institutions, accommodation services, public services, and medical institutions. The data corresponds to the year 2020 and adopts the GCJ02 coordinate system [29].
3.4.3. Data Gridization
According to the research needs, the grid size is determined (). Using the administrative boundary as a mask, ArcGIS is employed to perform gridization processing with a unified grid size (specifically including boundary clipping, grid encoding, etc.), dividing the study area into grid units (). On the basis of unifying the data coordinate system into WGS1984, the data obtained in Section 3.2.2 is associated with grid units to derive the development intensity, permanent population density, digital brightness of nighttime lights, and POI density for each grid unit, which are respectively denoted as 、、和.
3.5. Study Area
Shenzhen has long maintained rapid economic growing, which has attracted a large influx of population, capital, and industrial agglomeration. The sustained increase in land demand has driven the high-intensity development of land. By the end of 2024, Shenzhen’s construction land area had reached 1,027.25 square kilometers, and its land development intensity was approximately 50%—far exceeding the internationally recognized warning threshold of 30%. Currently, the shortage of land and spatial resources has become a bottleneck restricting the city’s further development, making it extremely important to fully improve the Utilization efficiency of already built high-intensity development areas. Therefore, this study selects Shenzhen as the object of case analysis. On the one hand, it will use Shenzhen’s relevant data to verify and analyze the research results of this study; on the other hand, it is hoped that this research can provide references for Shenzhen’s future urban planning, especially the optimization of high-intensity development areas.
3.5.1. Grid Division
The total area of Shenzhen is 1997.47 square kilometers. Considering both refined analysis and computational efficiency, this study sets the grid size to 200 meters; specifically, the city of Shenzhen is divided into 34,940 grid units using ArcGIS software, as shown in Figure 1 below.
3.5.2. Data Processing
Using the data sources and relevant methods outlined in Section 3.2.2, this study collected data on Shenzhen’s development intensity, permanent population, digital brightness of night-time lights, and Points of Interest (POI) respectively, and gridized these datasets.
(1) Development Intensity
There are 34,710 non-null grid units for development intensity, with a mean value of 1.15 and a maximum value of 17.89. The values are mainly concentrated between 0.5 and 3.0, accounting for approximately 85% of the total, as detailed in Figure 2 and Figure 3.
(2) Permanent Population Density
There are 35,081 non-null grid units for permanent population density, with a mean value of 107.73 and a maximum value of 359. The values are mainly concentrated between 30 and 160, accounting for approximately 50% of the total, as detailed in Figure 4 and Figure 5.
(3) Digital Brightness of Night-Time Lights
There are 89,547 non-null grid units for the digital brightness of night-time lights, with a mean value of 23.44 and a maximum value of 173.18. The values are mainly concentrated between 5 and 50, accounting for approximately 72% of the total, as detailed in Figure 6 and Figure 7.
(4) POI Density
4. Results and Discussion
4.1. Identification of High-Intensity Development Areas
4.1.1. Region Growing of High-Intensity Development Areas
(1) Selection of Seed Grid
Based on the method described in Section 3.1.1, a total of 1,747 seed grids were screened out. The development intensity of these seed grids is mainly concentrated between 3.5 and 6.0, with an average value of 4.67, which is much higher than the overall average of 1.15. The proportion of extremely high values greater than 8.0 is less than 5%, mainly distributed in a few high-density hotspots such as the Futian Central Business District and the core area of Nanshan Science and Technology Park, as detailed in Figure 10 and Figure 11.
(2) Seed Grid Growing
Based on the method outlined in Section 3.1.1, 1,747 initial areas were generated by growing 1,747 seed grids in accordance with growing rules. The results exhibit a spatial distribution highly consistent with the direction of the city’s core areas: they form strip-shaped or block-shaped clusters along rail transit corridors, major arterial roads, and existing business agglomeration areas. Meanwhile, the growing radius is larger in high-density hotspots such as Futian Central Area and Nanshan Science and Technology Park.
Regarding the distribution of the average FAR of candidate areas, the values generally fall between 3.0 and 6.5, with an average of approximately 4.23—slightly lower than the average level of seed grids. This indicates that while maintaining a high-density context, more secondary areas with slightly lower carrying capacity at the edges (but still categorized as high-intensity) were incorporated during this stage. The extremely high values above 8.0 correspond to several ultra-high-density clusters dominated by commercial and scientific research functions. Details are shown in Figure 12 and Figure 13.
4.1.2. Merging and Segmentation
Based on the method described in Section 3.1.2, a total of 212 final high-intensity development areas were obtained by merging and splitting the 1,747 initial areas. These areas account for 12.5% of the total area, among which the largest one is located in Futian Central Area, covering approximately 9.88.
(1) Analysis of Development Intensity
The peak of the average development intensity density of the areas appears around 2.8, meaning the development intensity of most areas is evenly distributed near the upper limit of the planned FAR. The maximum development intensity reaches 8.3, corresponding to several large-scale commercial or scientific research areas, which belong to ultra-high-density development. Low-intensity areas with a development intensity of less than 2.5 account for approximately 15%, serving as reserved areas for new districts or ecological buffer zones. Details are shown in Figure 14 and Figure 15.
(2) Area Analysis
Over 80% of the areas have an area of less than , indicating that high-intensity development units in Shenzhen present a clustered pattern of being numerous and small-scale. This pattern is conducive to maintaining functional compactness within the areas and ensuring nearby accessibility to public services. Medium-to-large-scale areas with an area exceeding account for less than 10%, and are only concentrated in a few core areas such as Futian Central Area and Nanshan Science and Technology Park. These few extra-large areas bear the important responsibility of regional-level service provision and transportation hub allocation in urban renewal or special planning. Therefore, it is necessary to strengthen the planning of internal roads, green spaces, and functional zoning to avoid imbalances in supporting facilities. Details are shown in Figure 16.
4.2. Evaluation of Identification
(1) Rationality of Area's Geometric Form
The rationality of the areas’ geometric shapes was evaluated based on the convexity index outlined in Section 3.2.2. The results show that the geometric shapes of the areas are highly rational: 96% of the areas have a convexity index greater than 0.9, while only two areas have a convexity index less than 0.8 (0.7 and 0.65 respectively), located in Bao’an Central Area and Futian Central Area. However, since these two areas are relatively large in size and their shapes are not excessively distorted, they fall within the acceptable range. Details are presented in Table 1 and Figure 17.
(2) Independence of Area Spatial Relationships
The independence of the areas’ spatial relationships was evaluated based on the minimum buffer overlap rate outlined in Section 3.2.3. The results show that the independence of the areas’ spatial relationships is extremely strong: there are only 19 polygon pairs with a minimum buffer overlap rate greater than 0.2, accounting for less than 0.1% of the total. Details are presented in Table 2 and Figure 18.
4.3. Evaluation of Utilization Efficiency
Based on the method outlined in Section 5.2, the utilization efficiency of each area was calculated separately. The results show that the proportions of areas with low, matched, and high Utilization efficiency are 42.2%, 55.7%, and 2.1% respectively. The distribution of Utilization efficiency is concentrated between 0.5 and 0.8, presenting a slightly right-skewed normal distribution, with the overall Utilization efficiency being relatively low. Details are shown in Figure 19 and Figure 20.
A large number of areas at the edge of central districts and non-central areas have problems such as vacant construction and insufficient utilization, failing to attract a population volume that matches the scale of construction. The data distribution of the low-efficiency group is relatively scattered, and some areas have extremely low Utilization efficiency, with serious issues in land use and population attraction. In contrast, the values of the high-efficiency group are generally relatively high, indicating an imbalance in Utilization efficiency. Details are shown in Figure 21.
5. Summary
Based on the practical needs of rapid urbanization and the intensive utilization of core functional areas in China, this study explores the deviation between planning indicators and actual development from the perspective of urban spatial intensification and the balanced development of public services. Currently, domestic and international research on area identification and Utilization efficiency evaluation mainly focuses on the neighborhood or city scale, lacking micro-level identification and diagnosis methods for plot-level and grid-level units. The method proposed in this study not only ensures boundary consistency but also possesses data integration capabilities, enabling effective accurate positioning of high-intensity areas and optimization of resource allocation. Taking Shenzhen as an example, the effectiveness and practicality of the method were verified through the identification of high-intensity development areas and the evaluation of the matching between population agglomeration and industrial agglomeration.
Against the backdrop where inventory renewal has become the dominant model for urban development, the method proposed in this study holds significant reference value for design management and control as well as resource allocation optimization in urban renewal. By accurately identifying high-intensity development areas and their Utilization efficiency, it can provide a scientific basis for urban density zoning control, the delineation of renewal units, and the reallocation of public resources, thereby supporting refined urban design optimization and governance decision-making.
Future research can be expanded and deepened in the following aspects:
First, in terms of identification accuracy optimization, the boundaries generated by the current method are still based on grid units. In the future, it will be necessary to further conduct spatial matching and correction with physical elements such as urban road networks and land parcel boundaries, so that the identification results can better meet the actual needs of urban management. At the same time, through multi-resolution and multi-scale collaborative processing, the grid accuracy and identification thresholds can be adaptively adjusted according to the heterogeneous characteristics of different regions, thereby improving the applicability of the algorithm under complex terrain and various development intensity conditions.
Second, in terms of function-oriented optimization, future research should take more account of the differentiated characteristics of land use attributes. It should focus on functional centers with urban public functions, commercial centers, industrial agglomeration areas, etc., while adopting differentiated identification strategies for residential and other living-related land uses. For thematic scenarios with different functional orientations, more detailed efficiency indicators and optimization strategies can be designed to meet the needs of differentiated governance and refined management.
Third, in terms of spatiotemporal dynamic monitoring, multi-source time-series data and 3D digital twin technology can be further introduced to construct a grid spatiotemporal sequence database. This will enable dynamic monitoring and trend prediction of the evolution process of high-intensity development areas, providing support for forward-looking planning of urban development.
Finally, in terms of spatial scale expansion, the research perspective can be extended from a single city to urban agglomerations or metropolitan areas. Through cross-city data integration and collaborative identification, the resource allocation models of high-intensity development areas at a larger scale can be explored, providing decision support for regional coordinated development.
Author Contributions
Conceptualization, L. Z., J.Q. Q. and H.L. H.; methodology, L. Z. and H.L. H.; software, H.L. H.; validation, J.Q. Q.; formal analysis, L. Z.; investigation, L. Z. and H.L. H.; resources, Y. Z.; data curation, L. Z. and H.L. H.; writing—original draft preparation, L. Z. and H.L. H.; writing—review and editing, J.Q. Q. ; visualization, L. Z. and H.L. H.; supervision, L. Z.; funding acquisition, J.Q. Q and L. Z.. All authors have read and agreed to the published version of the manuscript.
Funding
This work was supported by The National Natural Science Foundation of China, No. 2023YFC3807400 (Sub-project No.2023YFC3807403) , Shenzhen Bay Area Urban Construction Development Co., Ltd. (SWFZ-2025HT-013-GC-CTA-PD), Shenzhen Science and Technology Plan Project (No.KJZD20230923115223047) & Shenzhen Higher Education Stable Support Plan Project(No.20231123103157001).
Data Availability Statement
The data used to support the findings of this study are available from the corresponding author upon request.
Conflicts of Interest
The authors declare that they have no conflicts of interest.
References
- Peng, J.; Liu, Q.; Blaschke, T.; et al. Integrating land development size, pattern, and density to identify urban–rural fringe in a metropolitan region. Landscape Ecology. 2020, 35, 2045–2059. [Google Scholar] [CrossRef]
- Huang, C.; Xiao, C.; Rong, L. Integrating Point-of-Interest Density and Spatial Heterogeneity to Identify Urban Functional Areas. Remote Sensing. 2022, 14, 4201. [Google Scholar] [CrossRef]
- Yuan, G.; Chen, Y.; Sun, L.; et al. Recognition of Functional Areas Based on Call Detail Records and Point of Interest Data. Journal of Advanced Transportation. 2020, 16, 8956910. [Google Scholar] [CrossRef]
- Song, J. Study on Density Peak Clustering Analysis Method for Geographical Spatiotemporal grid Data [D].Nanjing: Nanjing Normal University, 2021.
- Li, Y.; Liu, C.; Li, Y. Identification of Urban Functional Areas and Their Mixing Degree Using Point of Interest Analyses. Land. 2022, 11, 996. [Google Scholar] [CrossRef]
- Niu, H.; Silva, E.A. Delineating urban functional use from points of interest data with neural network embedding: A case study in Greater London. Computers, Environment and Urban Systems. 2021, 88, 101651. [Google Scholar] [CrossRef]
- Sun, X.; Liu, X.; Zhou, Y. Delineating Peri-Urban Areas Using Multi-Source Geo-Data: A Neural Network Approach and SHAP Explanation. Remote Sensing. 2023, 15, 4106. [Google Scholar] [CrossRef]
- Yi, M.; Bai, X.; Gao, W. Identification and Evolution Characteristics Analysis of Shenzhen Public Center System [C]. Urban Planning Society of China, Hefei Municipal People's Government. Beautiful China, Joint Construction, Governance and Sharing: Proceedings of the 2024 Annual Conference of China Urban Planning (16. Spatial Development Theory and Analysis Technology).
- Qin, S.; Yang, J.; Liao, Z. Identification and Evaluation of Urban Center System Based on Multi-Source Data: A Case Study of Nanjing [J]. Southern Architecture, 2020, 11–19. [Google Scholar]
- Wei, W.; Nian, Z. Study on Identification of Urban Center System in the Main Urban Area of Hangzhou Based on Multi-Source Data [J]. Chinese & Overseas Architecture 2024, 85–90. [Google Scholar]
- Ren, J.; Gao, X. Grid Density Algorithm-Based Second-Hand Housing Transaction Activity and Spatio-Temporal Characterization: The Case of Shenyang City, China. ISPRS International Journal of Geo-Information. 2024, 13, 286. [Google Scholar] [CrossRef]
- He, X.; Yuan, X.; Zhang, D.; et al. Delineation of Urban Agglomeration Boundary Based on Multisource Big Data Fusion—A Case Study of Guangdong–Hong Kong–Macao Greater Bay Area (GBA). Remote Sensing. 2021, 13, 1801. [Google Scholar] [CrossRef]
- Huang, B.S.Y. Urban land-use mapping using a deep convolutional neural network with high spatial resolution multispectral remote sensing imagery[J]. Remote Sensing of Environment: An Interdisciplinary Journal 2018, 214. [Google Scholar] [CrossRef]
- Wang, Z.; Liang, Y.; He, Y.; et al. Refined Land Use Classification for Urban Core Area from Remote Sensing Imagery by the EfficientNetV2 Model. Applied Sciences. 2024, 14, 7235. [Google Scholar] [CrossRef]
- He, T.; Lu, Y.; Yue, W.; et al. A new approach to peri-urban area land use efficiency identification using multi-source datasets: A case study in 36 Chinese metropolitan areas[J]. Applied Geography, 2023.
- Ruan, L.; He, T.; Xiao, W.; et al. Measuring the coupling of built-up land intensity and use efficiency: An example of the Yangtze River Delta urban agglomeration[J]. Sustainable Cities and Society, 2022, 87, 10. [Google Scholar] [CrossRef]
- Xia, C.; Yeh, G.O.; Zhang, A. Analyzing spatial relationships between urban land use intensity and urban vitality at street block level: A case study of five Chinese megacities[J]. Landscape and Urban Planning, 2020, 193, 103669. [Google Scholar] [CrossRef]
- Qiao, L.; Huang, H.; Tian, Y. The Identification and Use Efficiency Evaluation of Urban Industrial Land Based on Multi-Source Data[J]. Sustainability 2019, 11. [Google Scholar] [CrossRef]
- Li, J.; Zhu, Y.; Liu, J.; et al. Parcel-level evaluation of urban land use efficiency based on multisource spatiotemporal data: A case study of Ningbo City, China[J]. Transactions in GIS, 2021.
- Geng, B.; Fu, M.; Shan, J.; et al. Evaluation of urban residential land use efficiency with a neural network from the perspective of service facility capacity[J]. Journal of Land Use Science, 2021, 16, 413–432. [Google Scholar] [CrossRef]
- Qi, Y.; Wang, R.; Shen, P.; et al. Impacts of Land Use Intensity on Ecosystem Services: A Case Study in Harbin City, China. Sustainability. 2023, 15, 14877. [Google Scholar] [CrossRef]
- Li, X.; Kozlowski, M.; Ismail, S.B.; et al. Spatial Distribution Characteristics of Leisure Urban Spaces and the Correlation with Population Activity Intensity: A Case Study of Nanjing, China[J]. 2024.
- Xu, H.; Zhao, J.; Yu, X. A Community-Oriented Accessibility Index of Public Health Service Facilities: A Case Study of Wuchang District, Wuhan, China. Sustainability. 2023, 15, 10870. [Google Scholar] [CrossRef]
- Wang, B.; Liu, Y.; Tong, Z.; et al. Spatiotemporal Dynamic Characteristics of Land Use Intensity in Rapidly Urbanizing Areas from Urban Underground Space Perspectives. Sustainability. 2023, 15, 13008. [Google Scholar] [CrossRef]
- Che, Y.; Li, X.; Liu, X.; Wang, Y.; Liao, W.; Zheng, X.; Zhang, X.; Xu, X.; Shi, Q.; Zhu, J.; Yuan, H.; Dai, Y. (2024). Building height of Asia in 3D-GloBFP [Data set]. Zenodo.
- Che, Y.; Li, X.; Liu, X.; Wang, Y.; Liao, W.; Zheng, X.; Zhang, X.; Xu, X.; Shi, Q.; Zhu, J.; Yuan, H.; Dai, Y. : 3D-GloBFP: the first global three-dimensional building footprint dataset, Earth Syst. Sci. Data Discuss. [CrossRef]
- Chen, Y.; Xu, C.; Ge, Y.; et al. A 100-m gridded population dataset of China’s seventh census using ensemble learning and geospatial big data[J]. Earth System Science Data Discussions, 2024, 2024, 1–19. [Google Scholar] [CrossRef]
- Chen, Zuoqi; Yu, Bailang; Yang, Chengshu; Zhou, Yuyu; Yao, Shenjun; Qian, Xingjian; Wang, Congxiao; Wu, Bin; Wu, Jianping, 2020, "An extended time-series (2000-2023) of global NPP-VIIRS-like nighttime light data", https://doi.org/10.7910/DVN/YGIVCD, Harvard Dataverse, V5, UNF:6:qMXz0adYK5q7pFqKgsCFOQ== [fileUNF].
- Chen Zuoqi, Yu Bailang*. Yang Chengshu, Zhou Yuyu, Yao Shenjun, Qian Xingjian, WangCongxiao, Wu Bin, Wu Jianping. An Extended Time Series (2000-2018) of Global NPp-VIIRSLike Nighttime Light Data from a Cross-Sensor Calibration. Earth System Science Data. 202113, 889-906.
- Perroux, F. Note sur la notion de pole de croissance[J]. Economie Appliquee, 1955, 1, 307–320. [Google Scholar] [CrossRef]
- Mønsted, M. Francois Perroux's theory of "growing pole" and "development" pole: A critique[J]. Antipode, 1974, 6, 106–113. [Google Scholar] [CrossRef]
- Rosenthal, S.S.; Strange, W.C. Evidence on the nature and sources of agglomeration economies[J]. Handbook of Regional and Urban Economics, 2004, 4, 2119–2171. [Google Scholar]
- Duranton, G.; Puga, D. Micro-foundations of urban agglomeration economies[J]. Handbook of Regional and Urban Economics, 2004, 4, 2063–2117. [Google Scholar]
- Conzen, M.R.G. Alnwick, Northumberland: A Study in Town-Plan Analysis[M]. London: Institute of British Geographers Publication, 1960.
- Whitehand, J.W.R. British urban morphology: the Conzenian tradition[J]. Urban Morphology, 2001, 5, 103–109. [Google Scholar] [CrossRef]
- Hall, P.; Pain, K. The Polycentric Metropolis: Learning from Mega-city Regions in Europe[M]. London: Earthscan, 2006.
- GU, Z.; Pang, H. Spatial Connection and Hierarchical Division of China's Urban System Based on the Gravity Model [J]. Geographical Research, 2008, 27, 1–12. [Google Scholar]
Figure 1.
200m-Resolution Grid Map of Shenzhen.
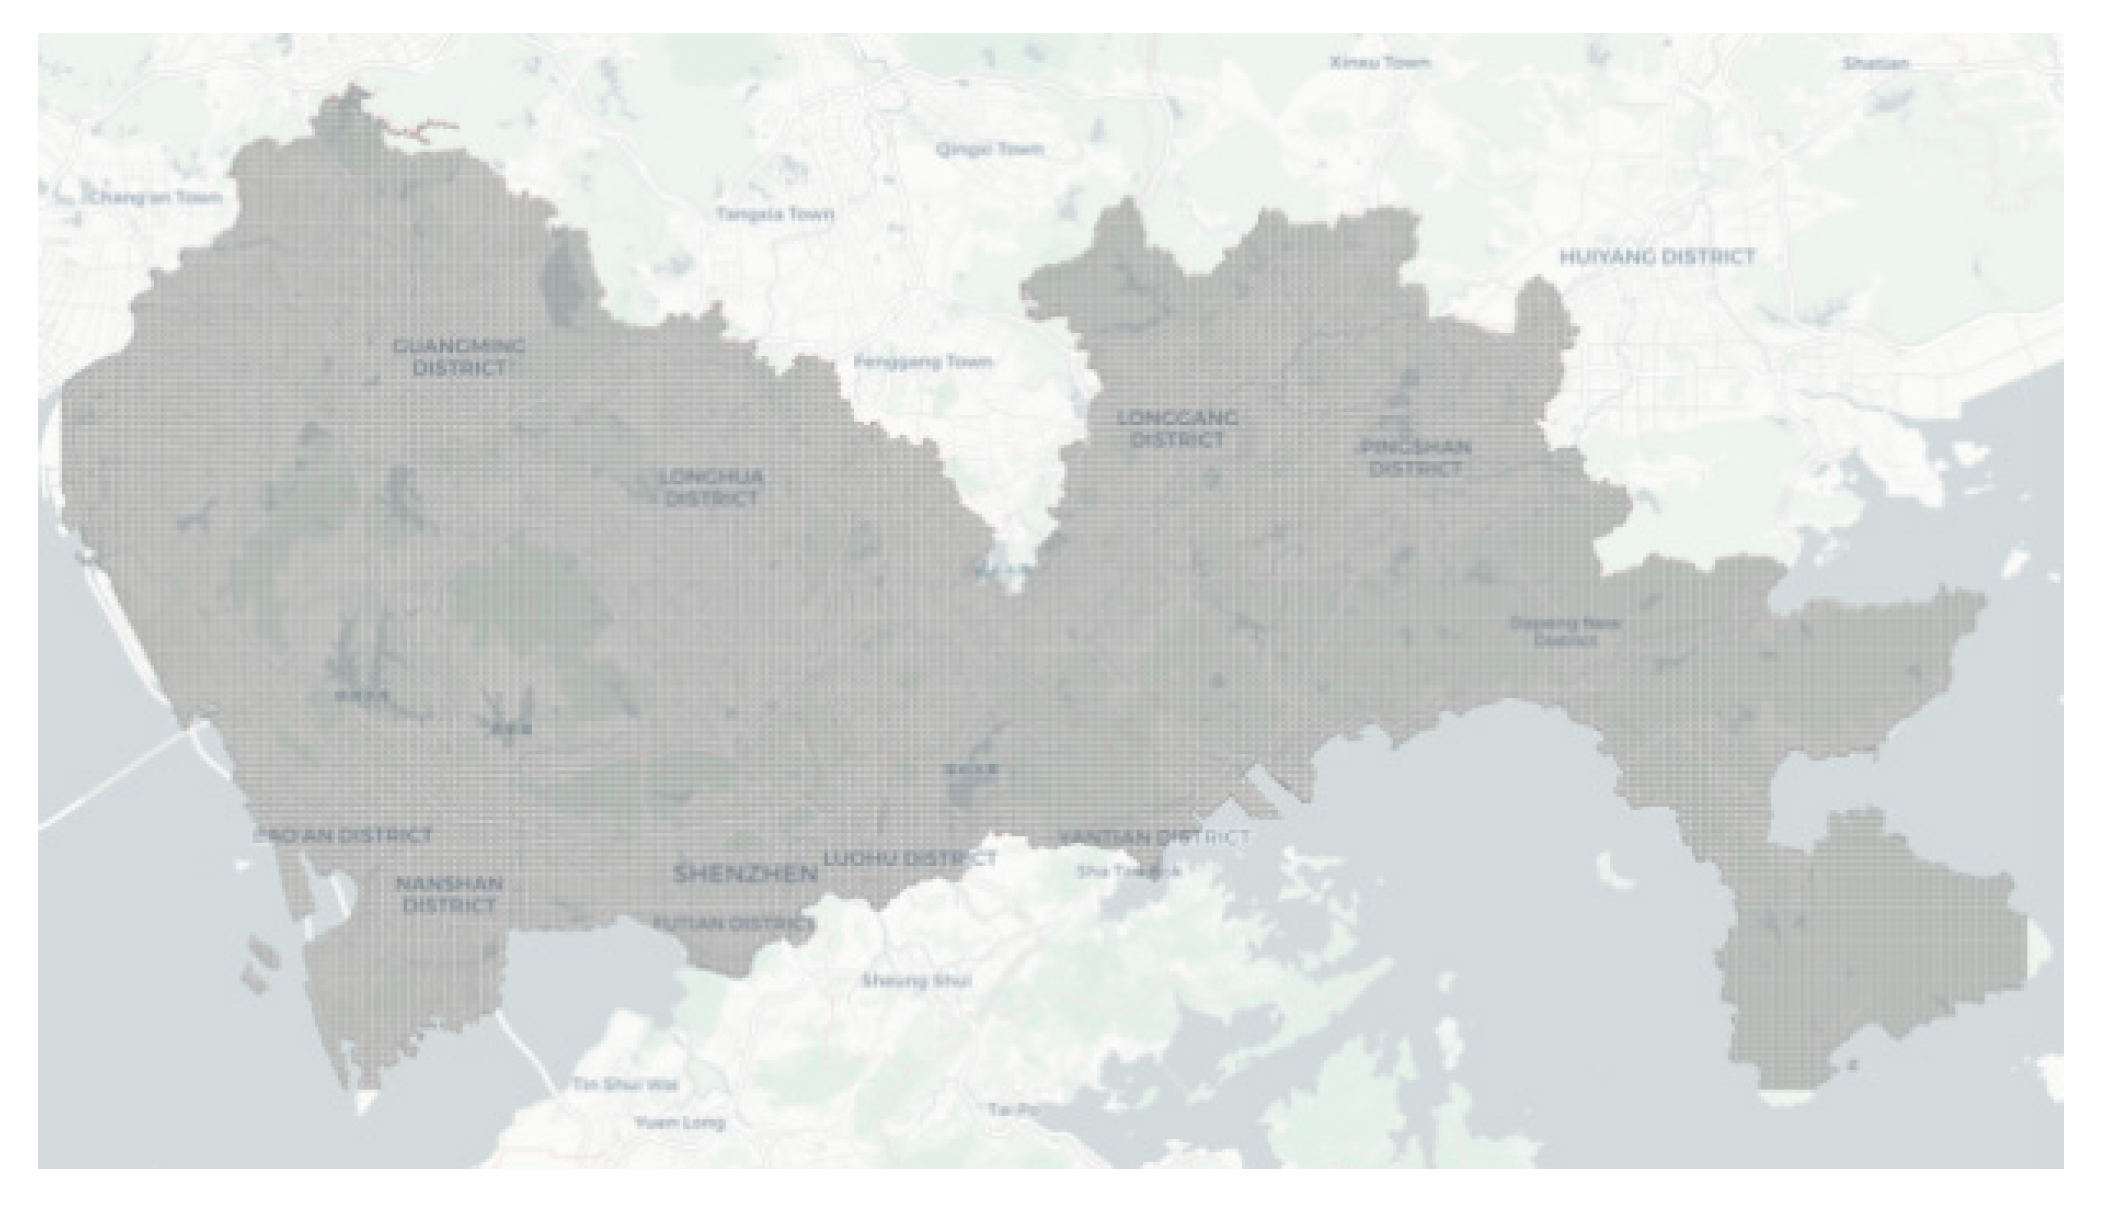
Figure 2.
grid Map of Development Intensity in Shenzhen.
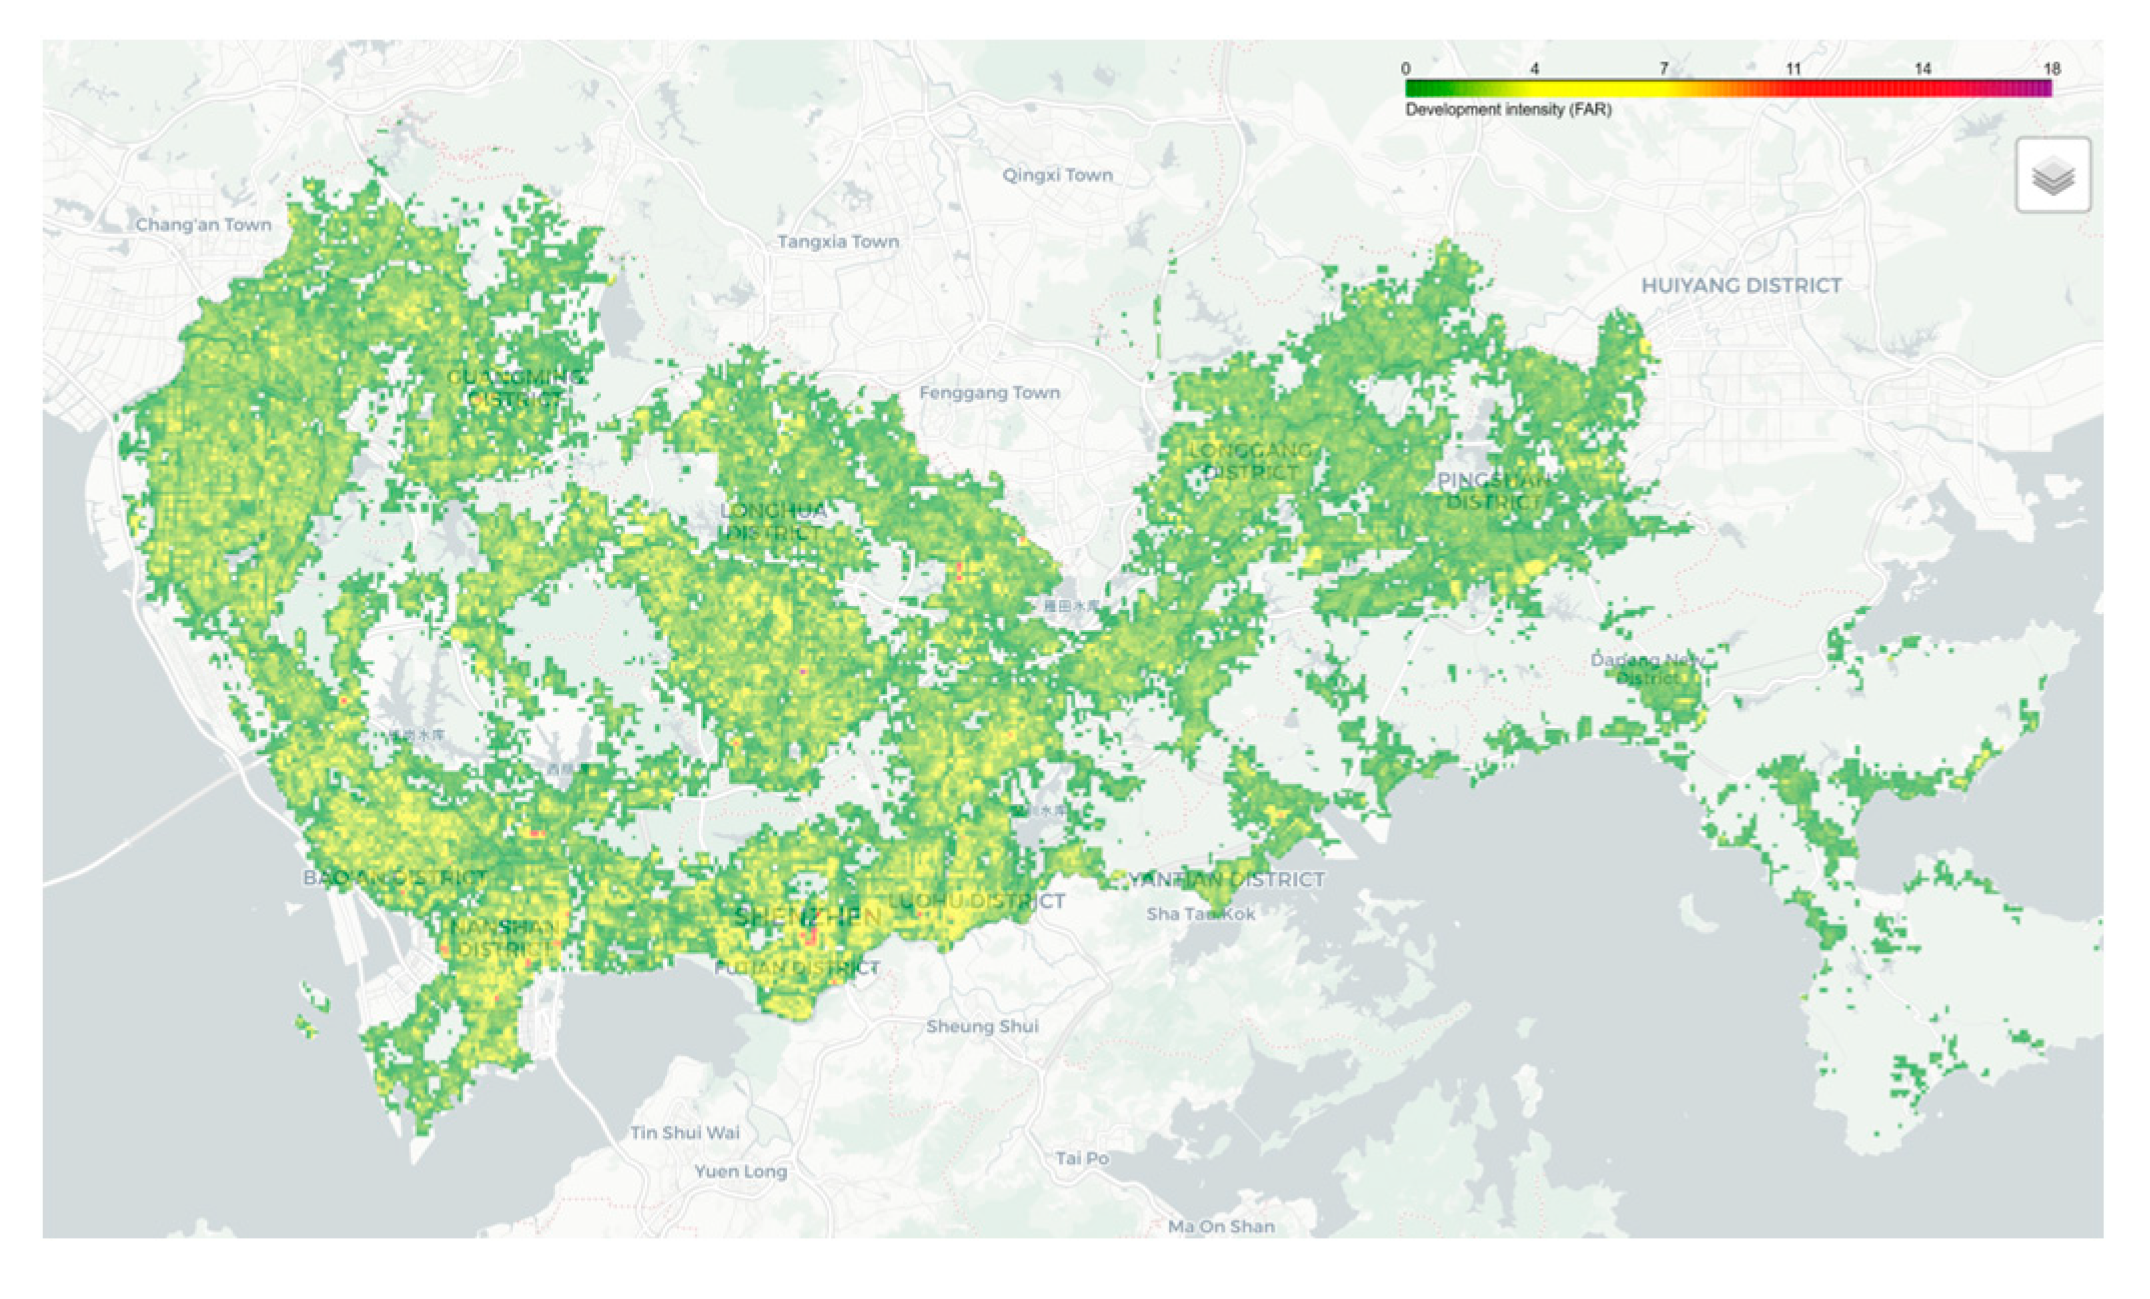
Figure 3.
Distribution Map of grid Development Intensity in Shenzhen.
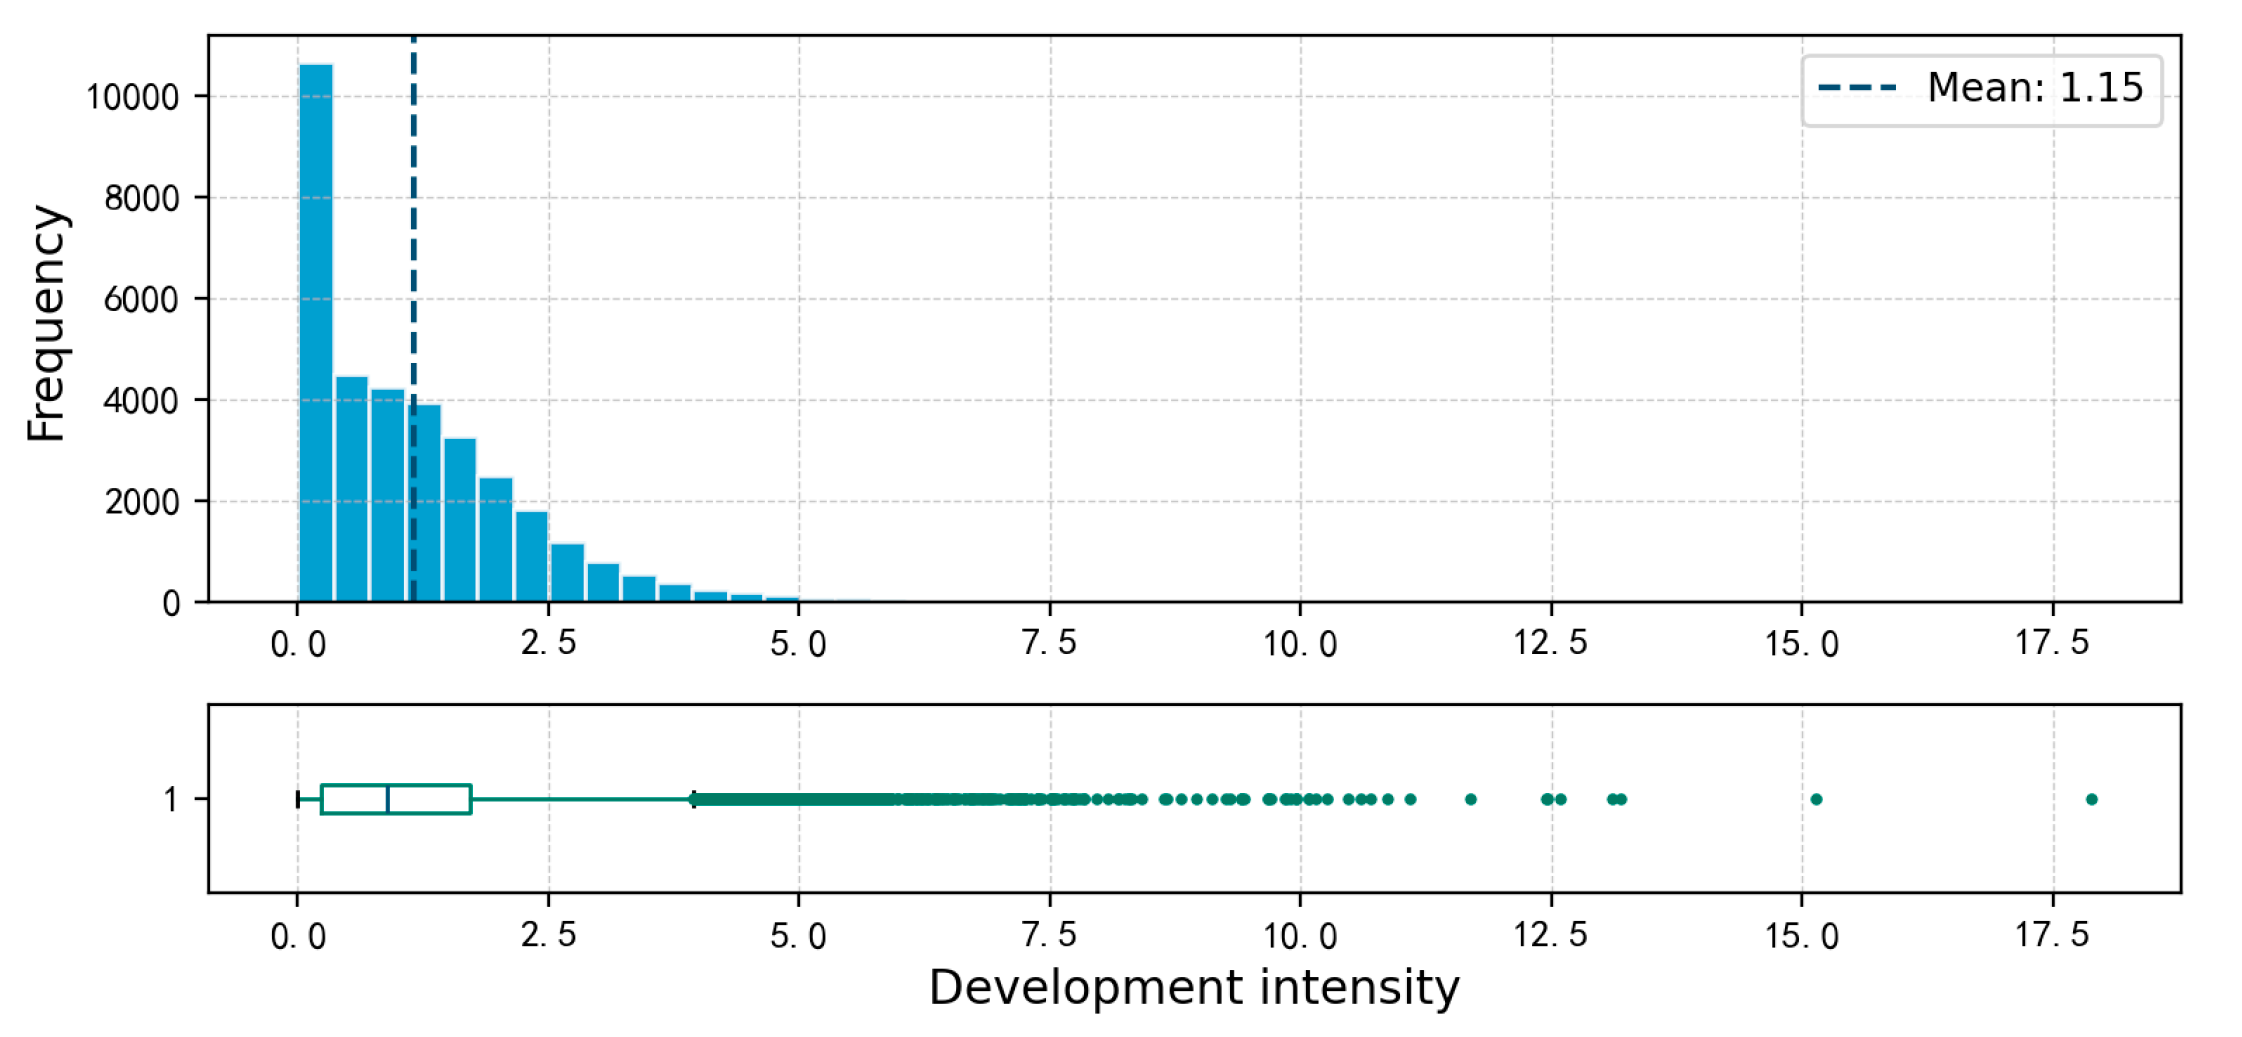
Figure 4.
grid Map of Permanent Population Density in Shenzhen.
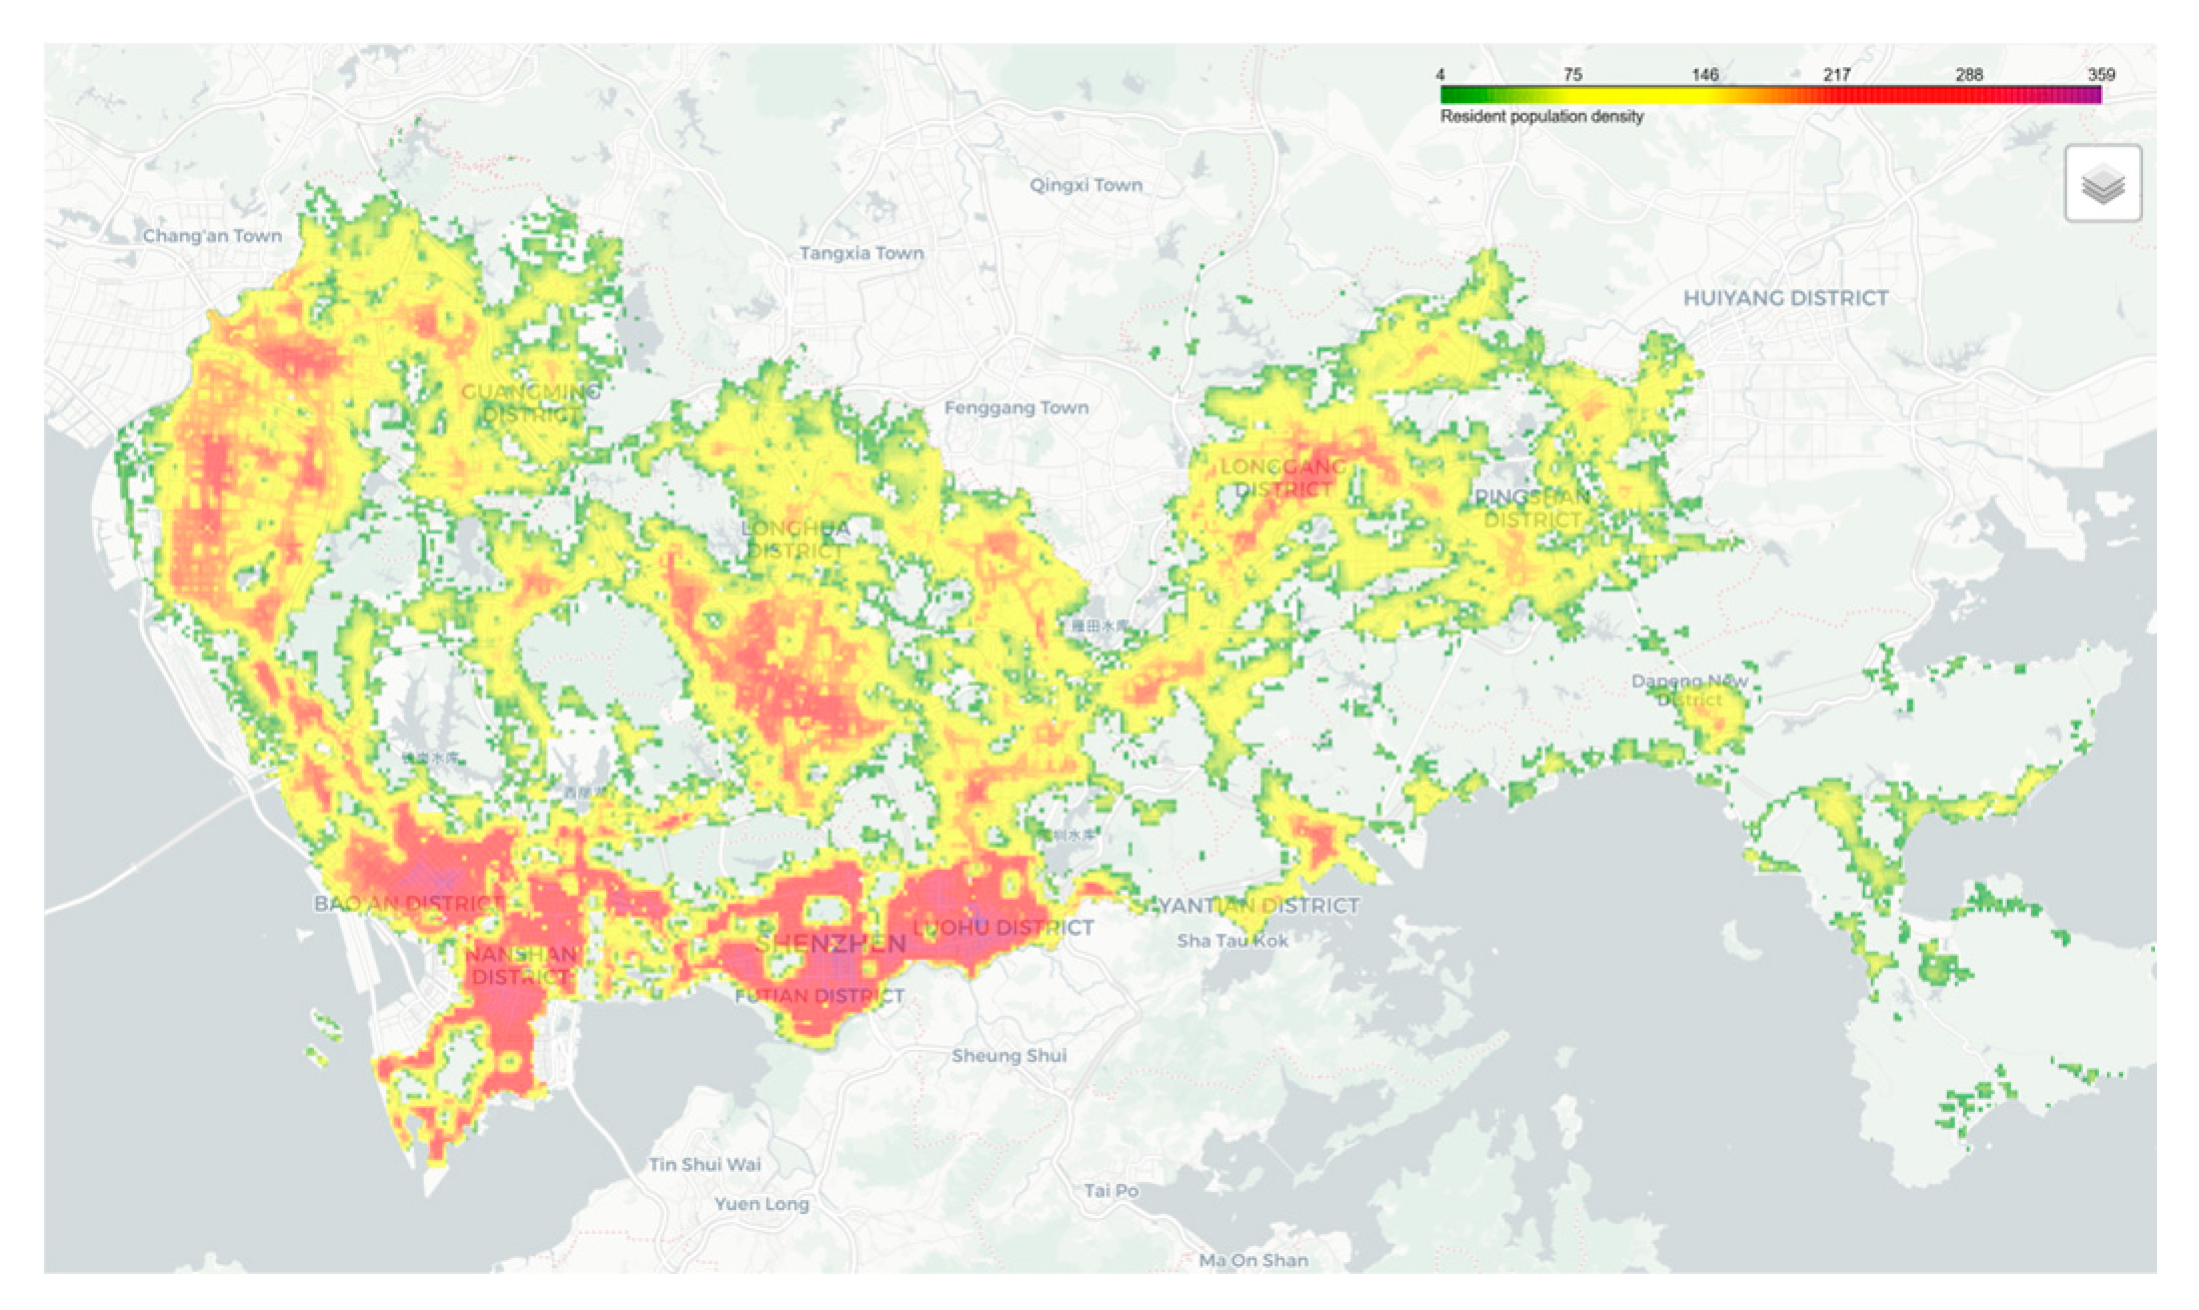
Figure 5.
Distribution Map of grid Permanent Population Density in Shenzhen.
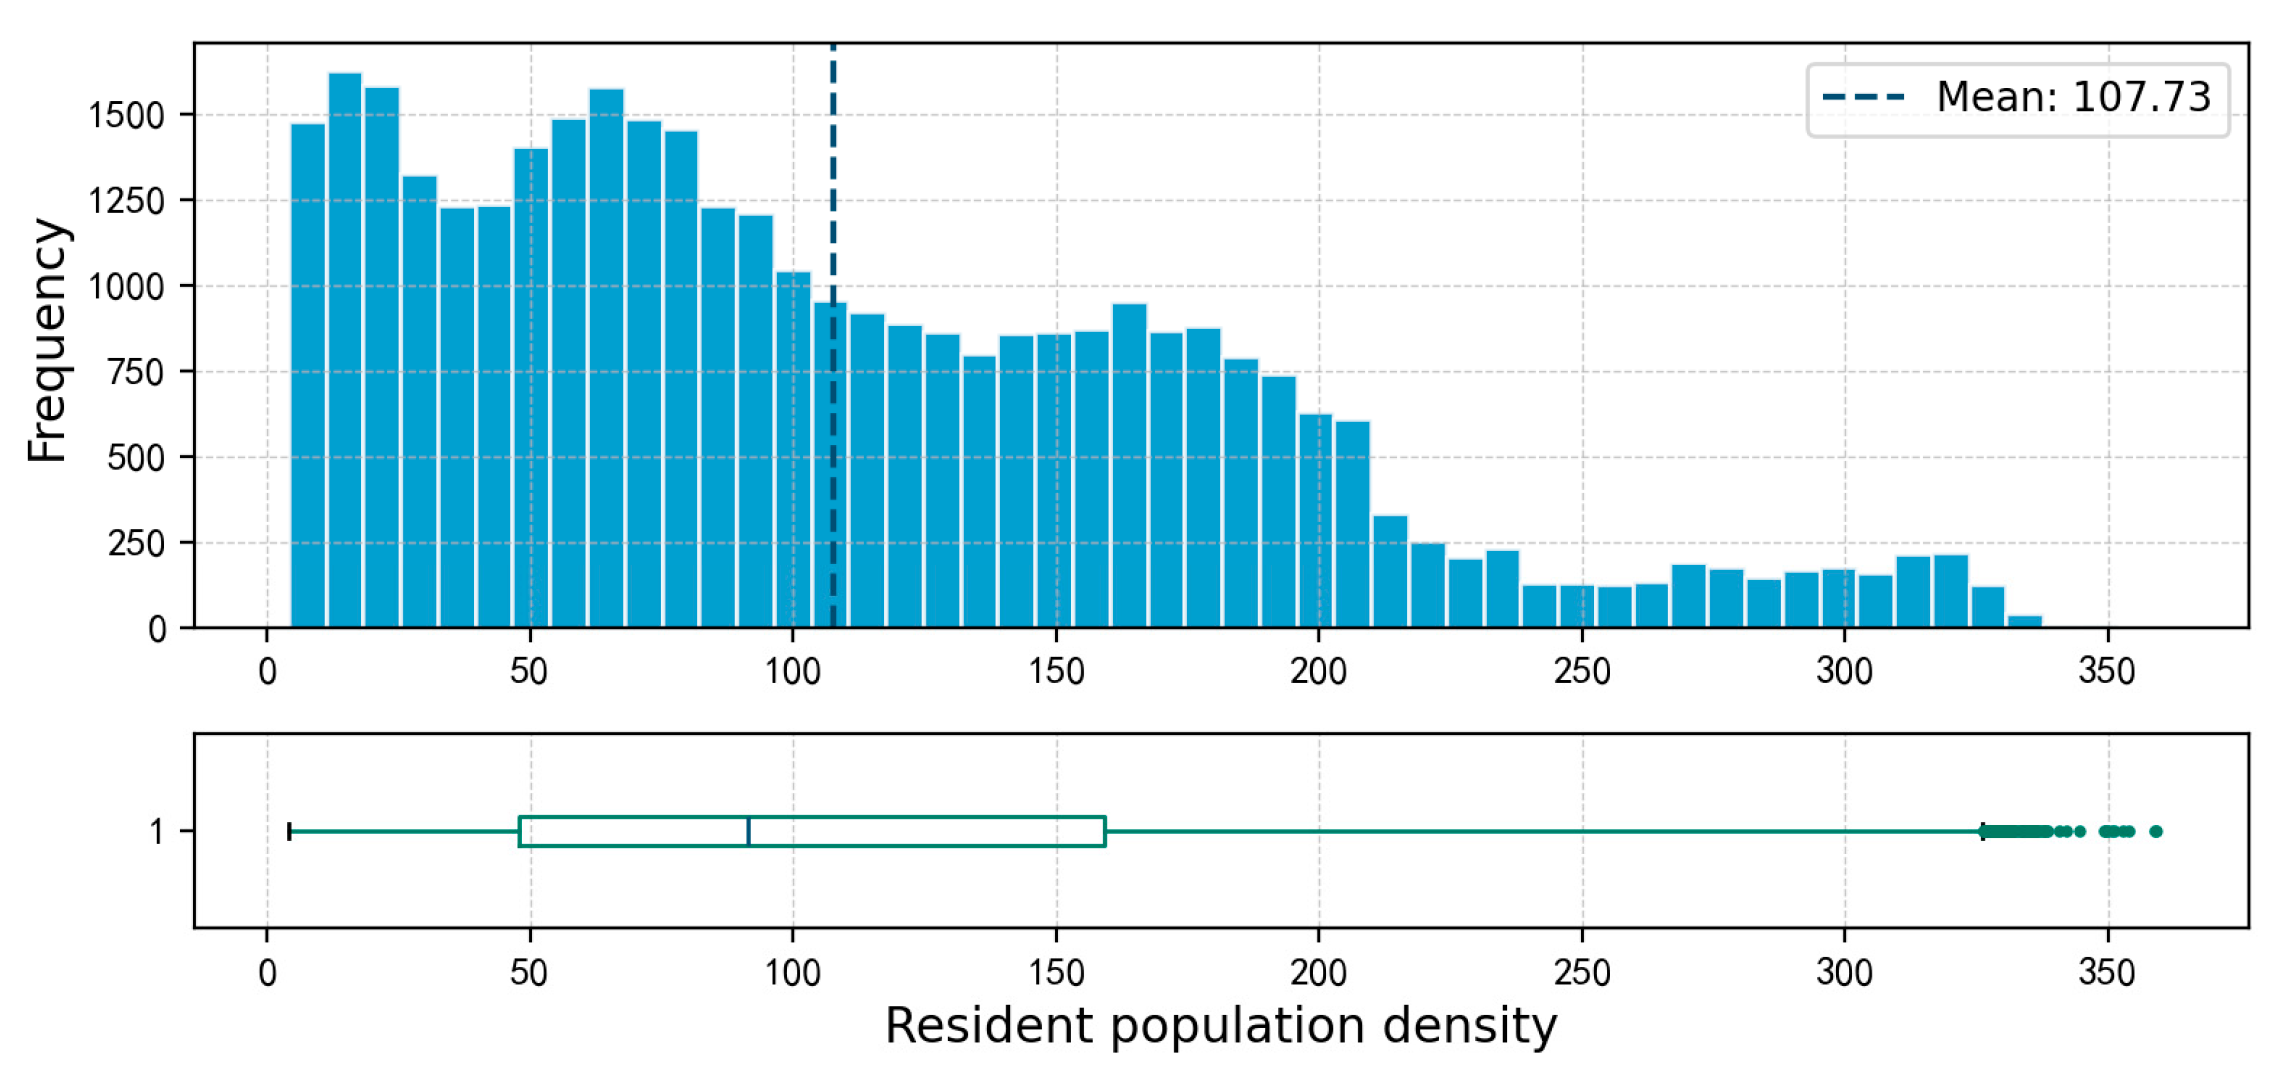
Figure 6.
grid Map of Digital Brightness of Night-Time Lights in Shenzhen.
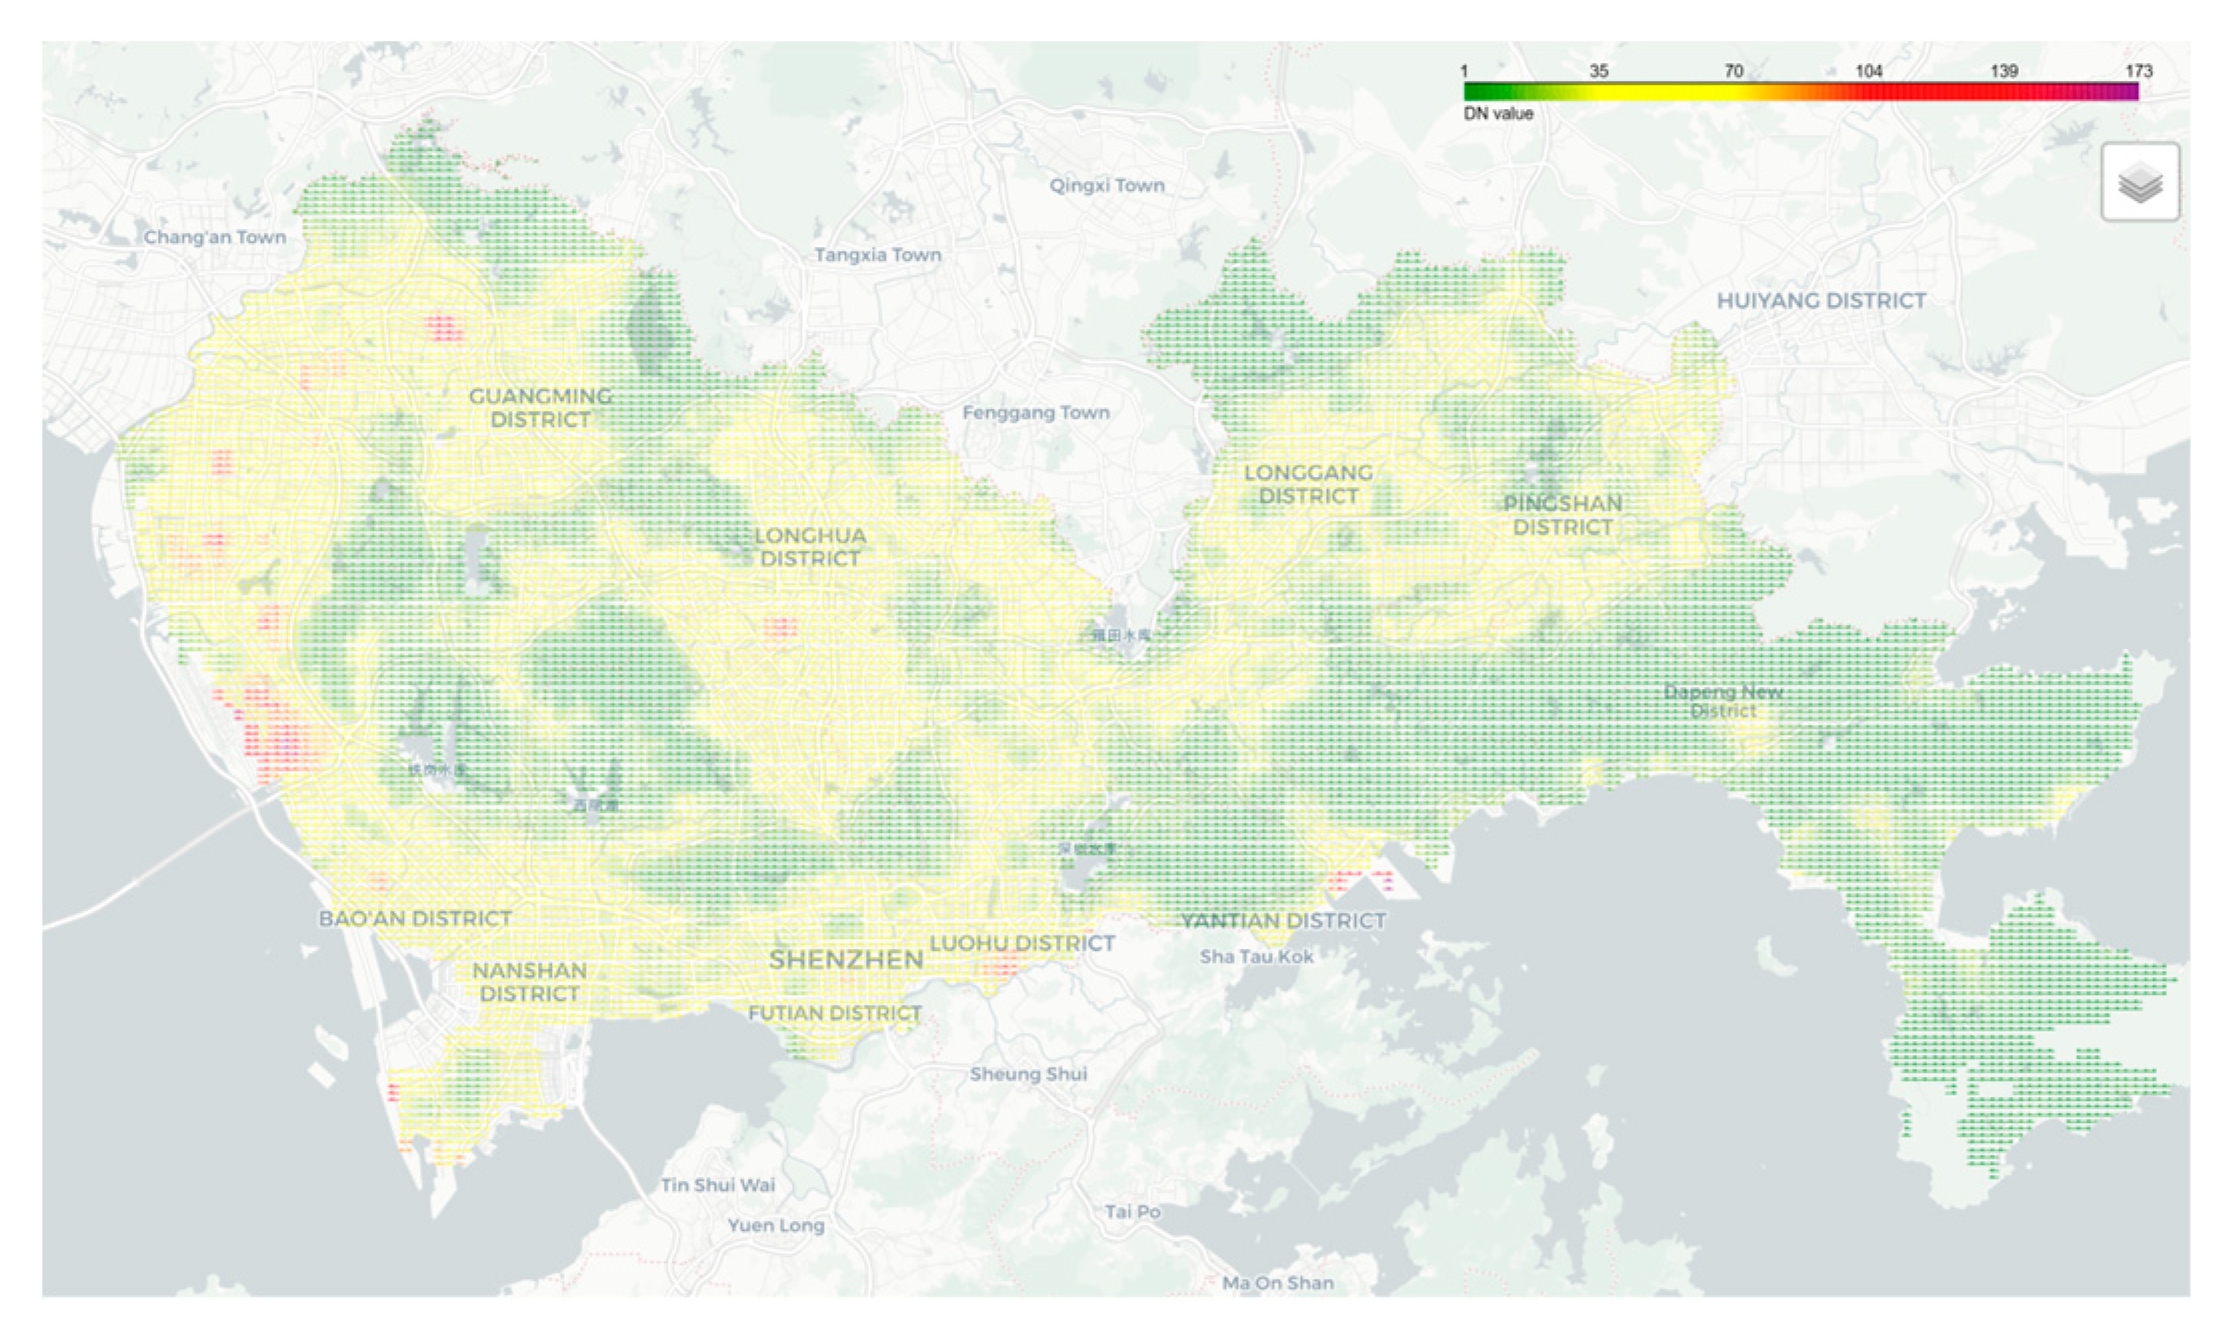
Figure 7.
Distribution Map of grid Digital Brightness of Night-Time Lights in Shenzhen.
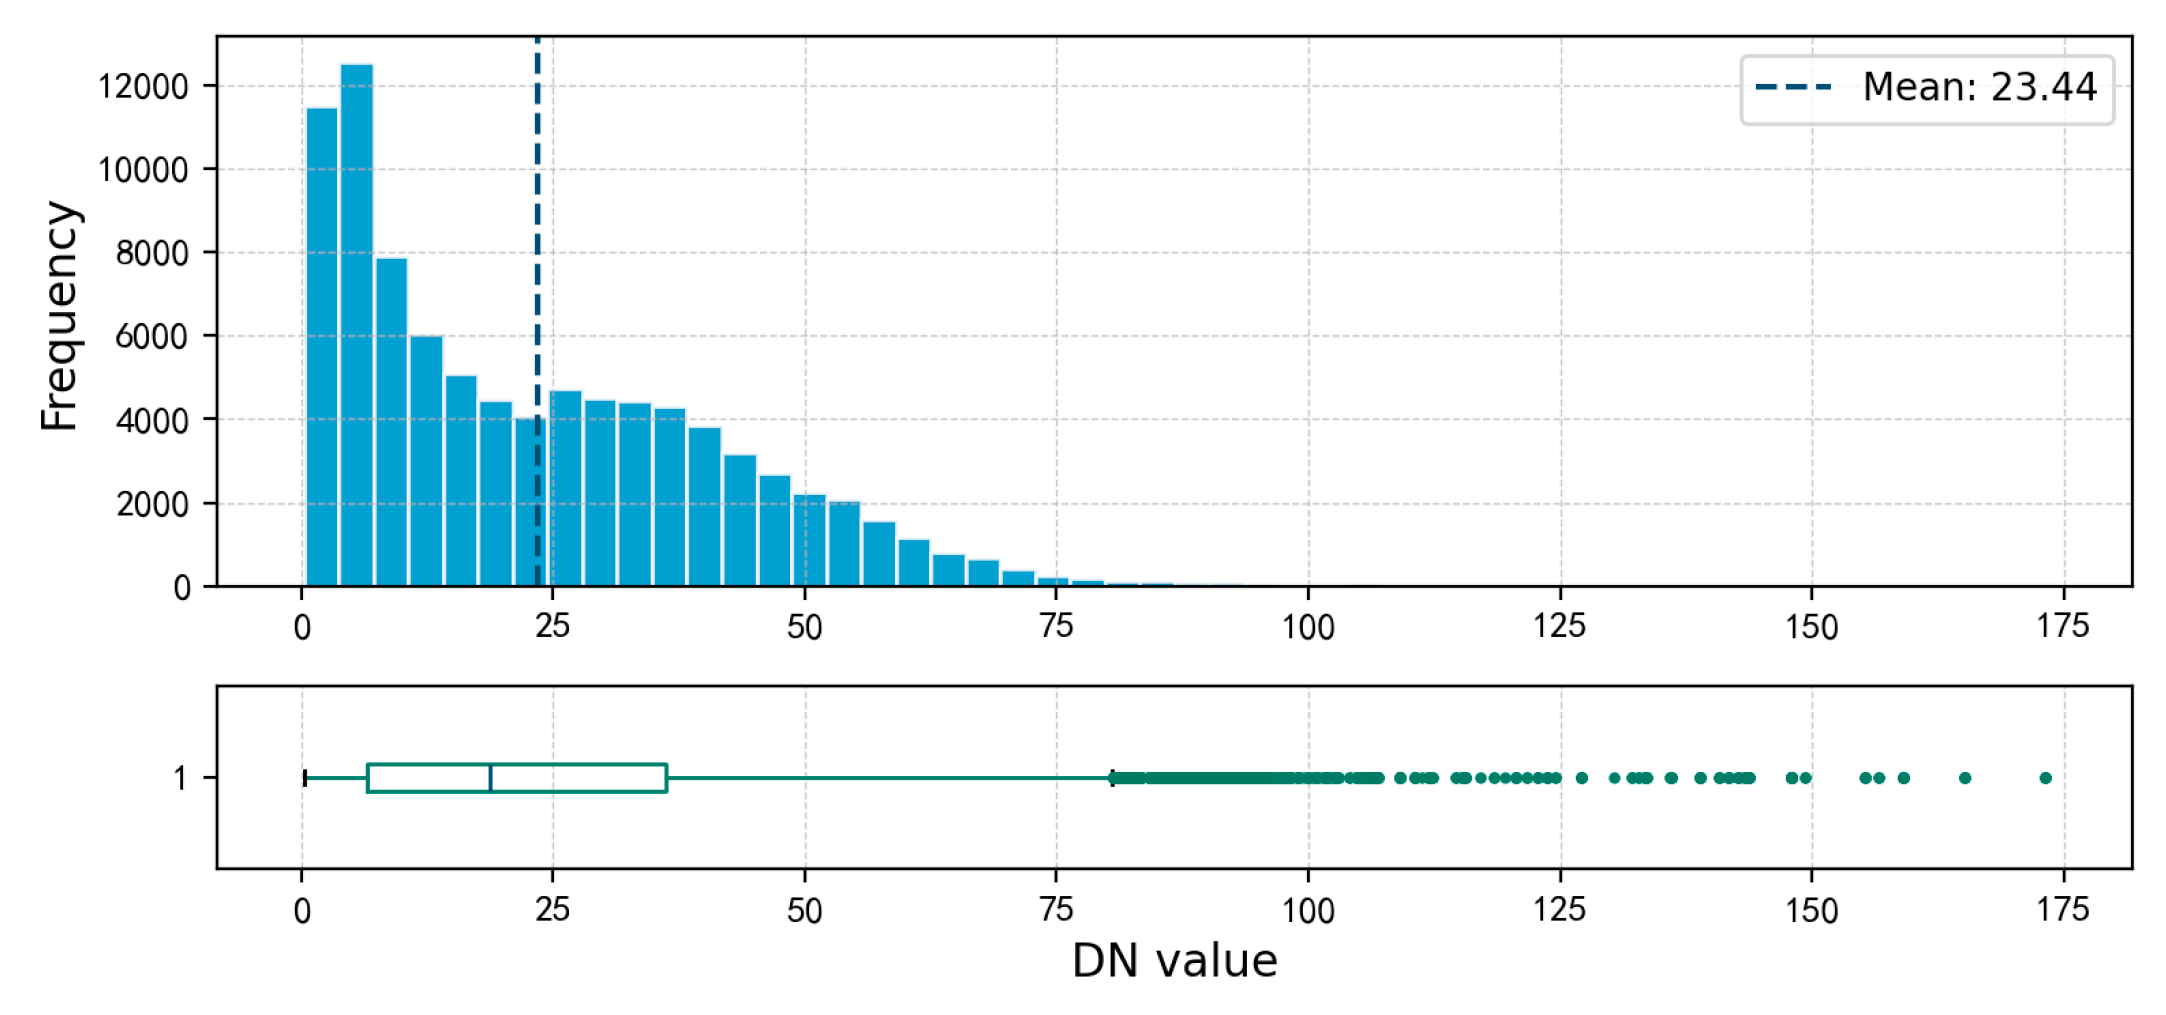
Figure 8.
grid Map of POI (Point of Interest) Density in Shenzhen.
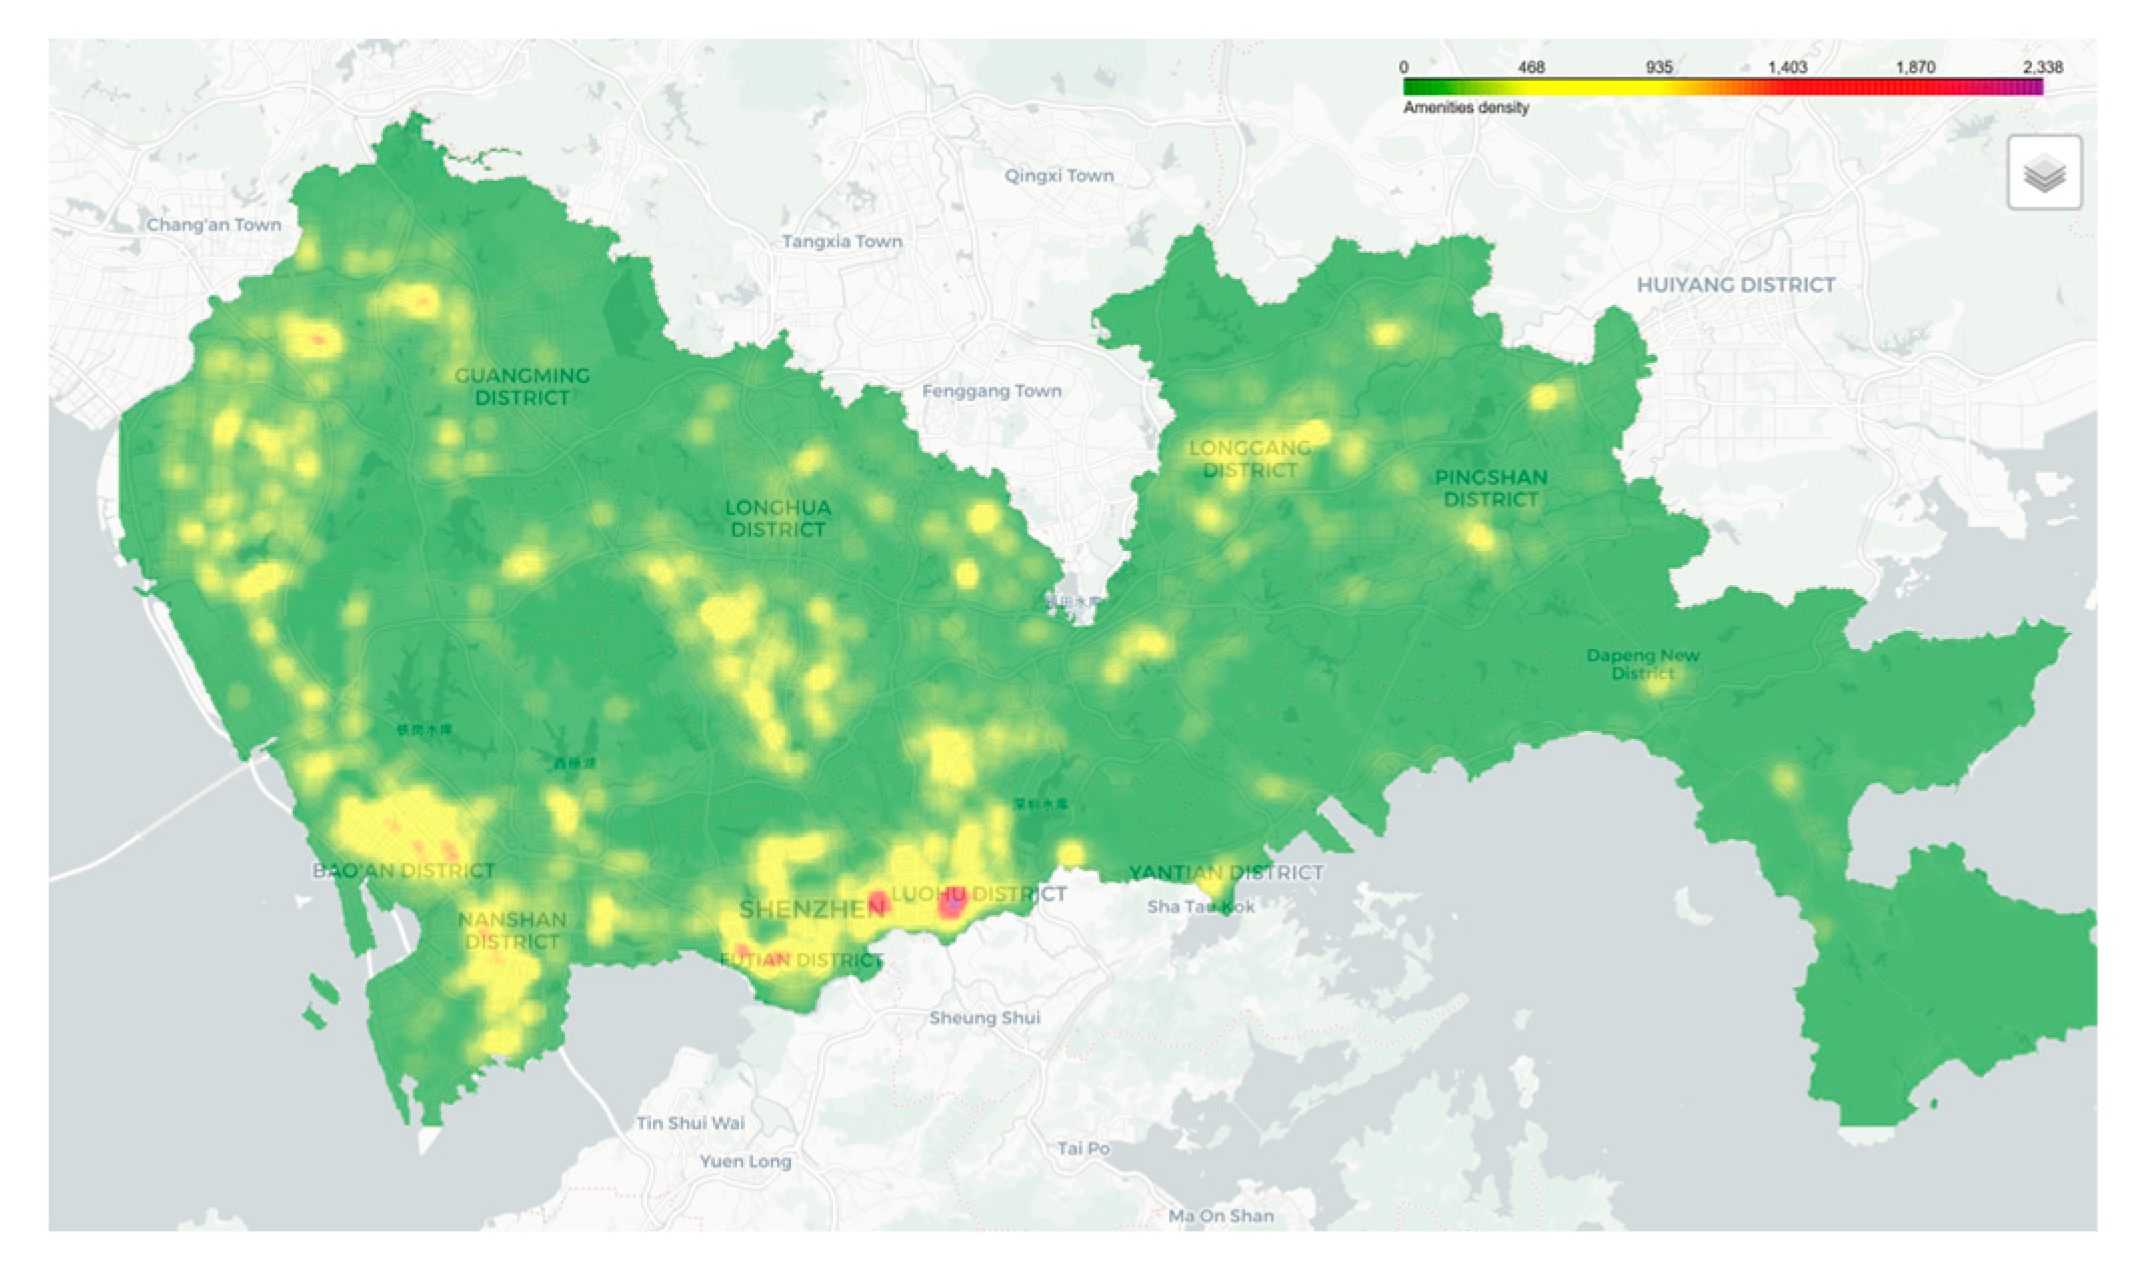
Figure 9.
Distribution Map of grid POI (Point of Interest) Density in Shenzhen.
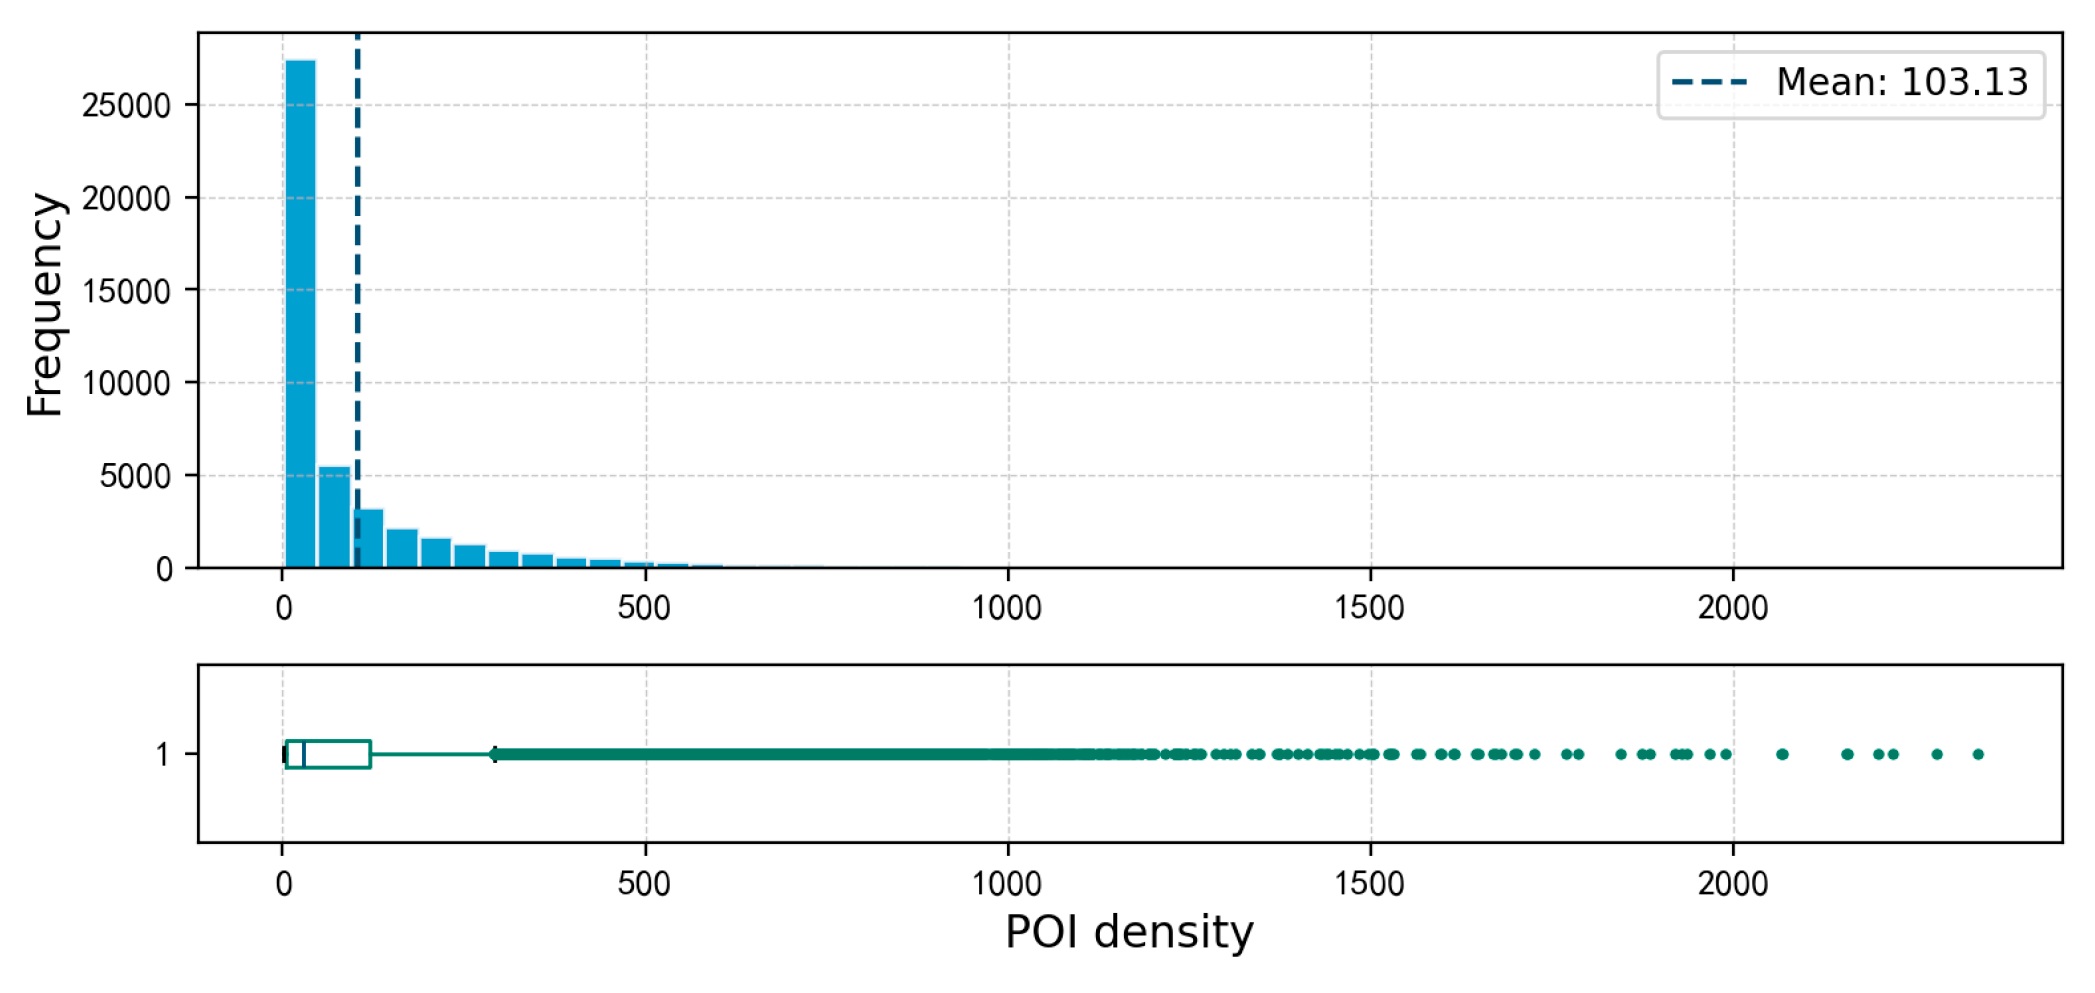
Figure 10.
Seed Grid Map of Shenzhen.
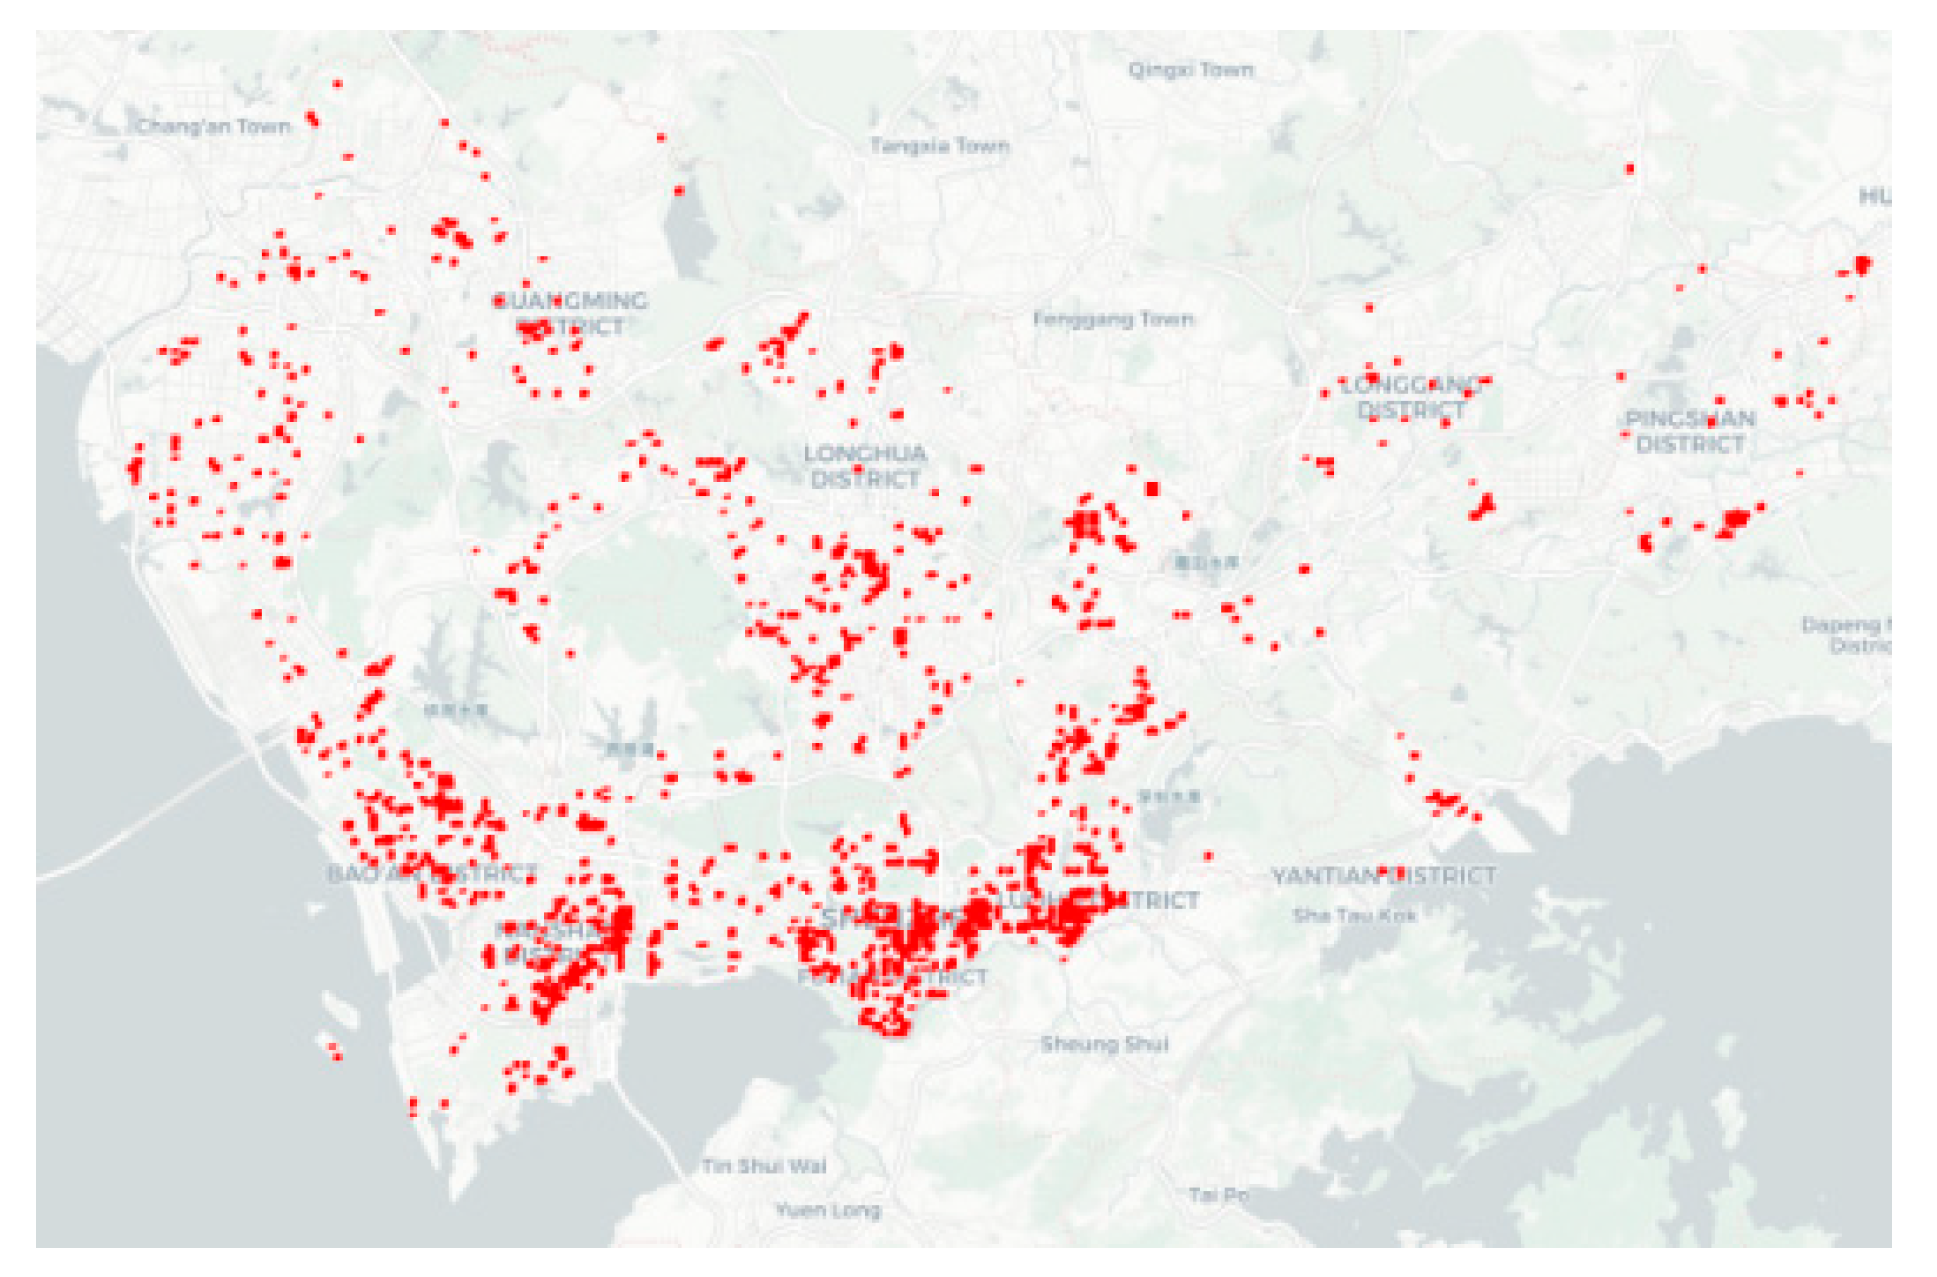
Figure 11.
Distribution Map of Seed Grid Development Intensity in Shenzhen.
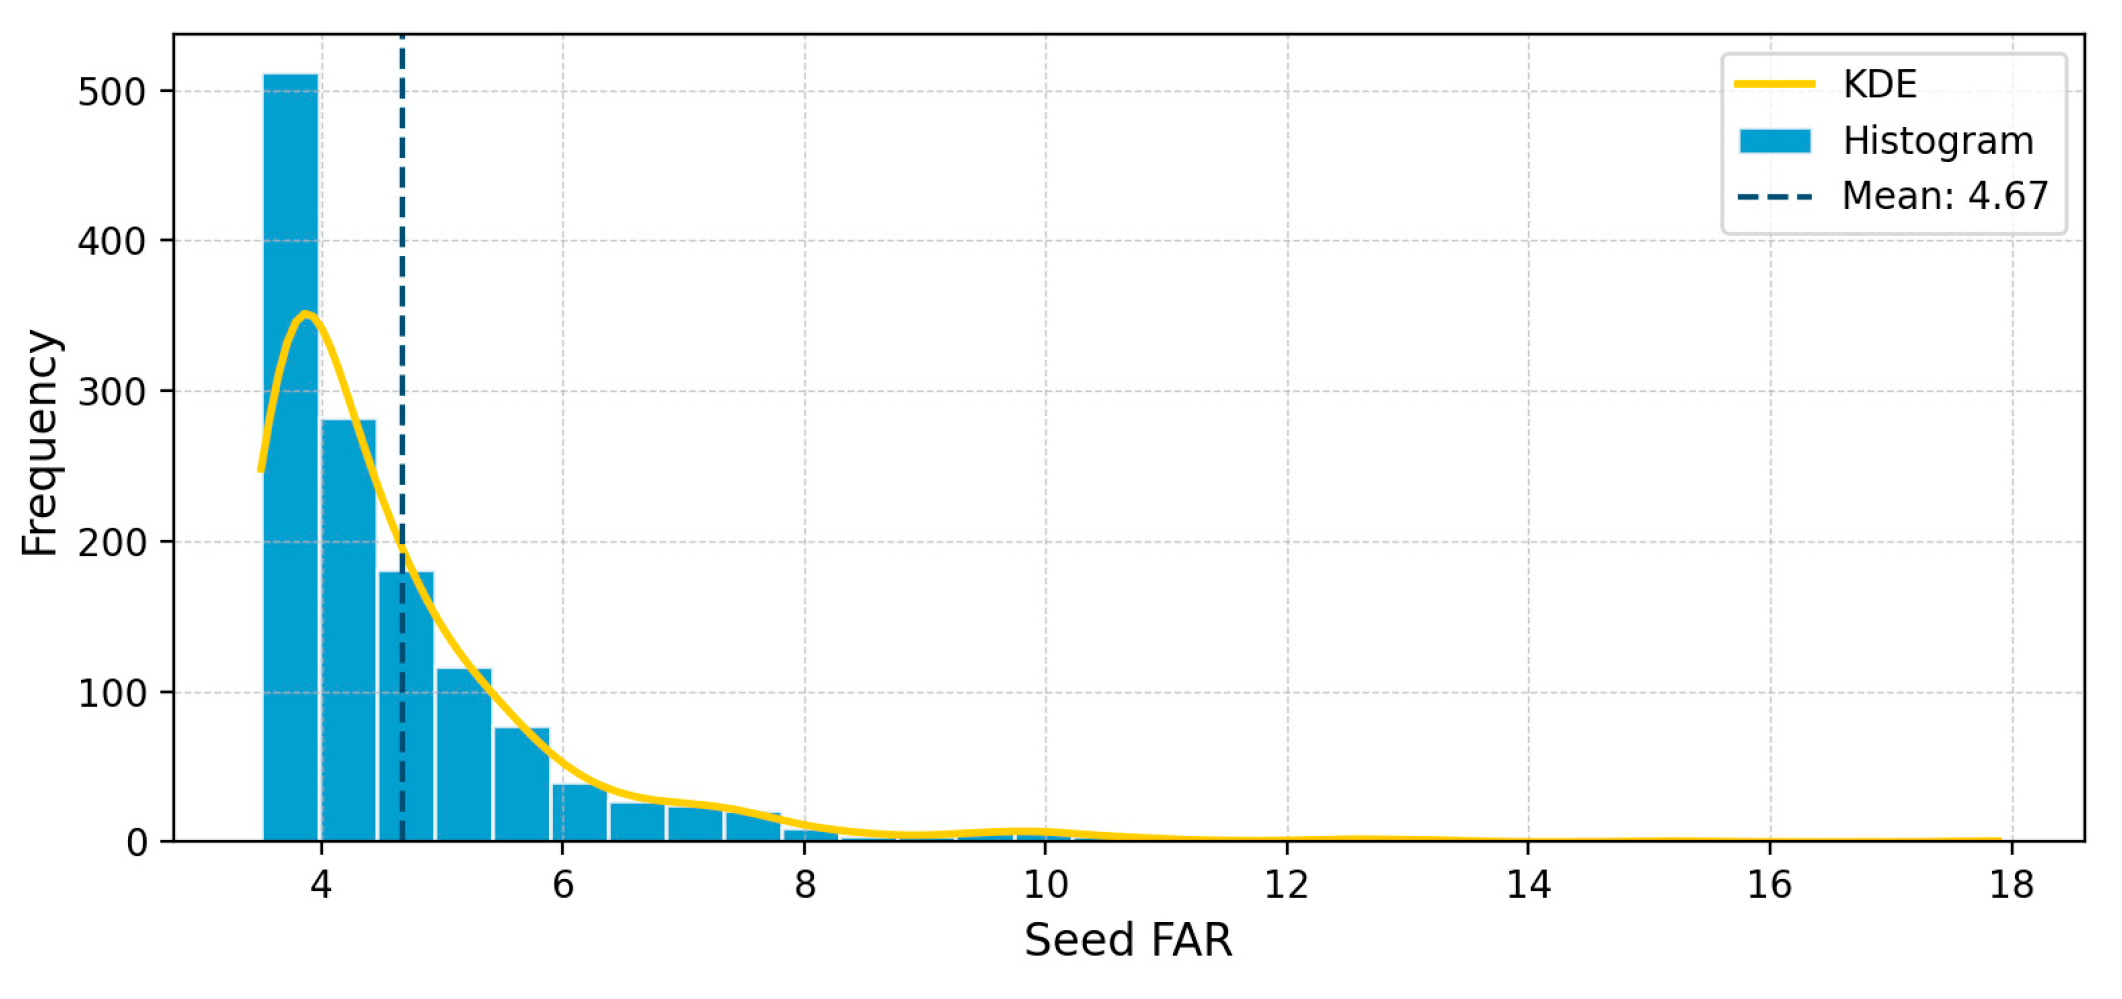
Figure 12.
Map of Initial High-Intensity Development Areas in Shenzhen.
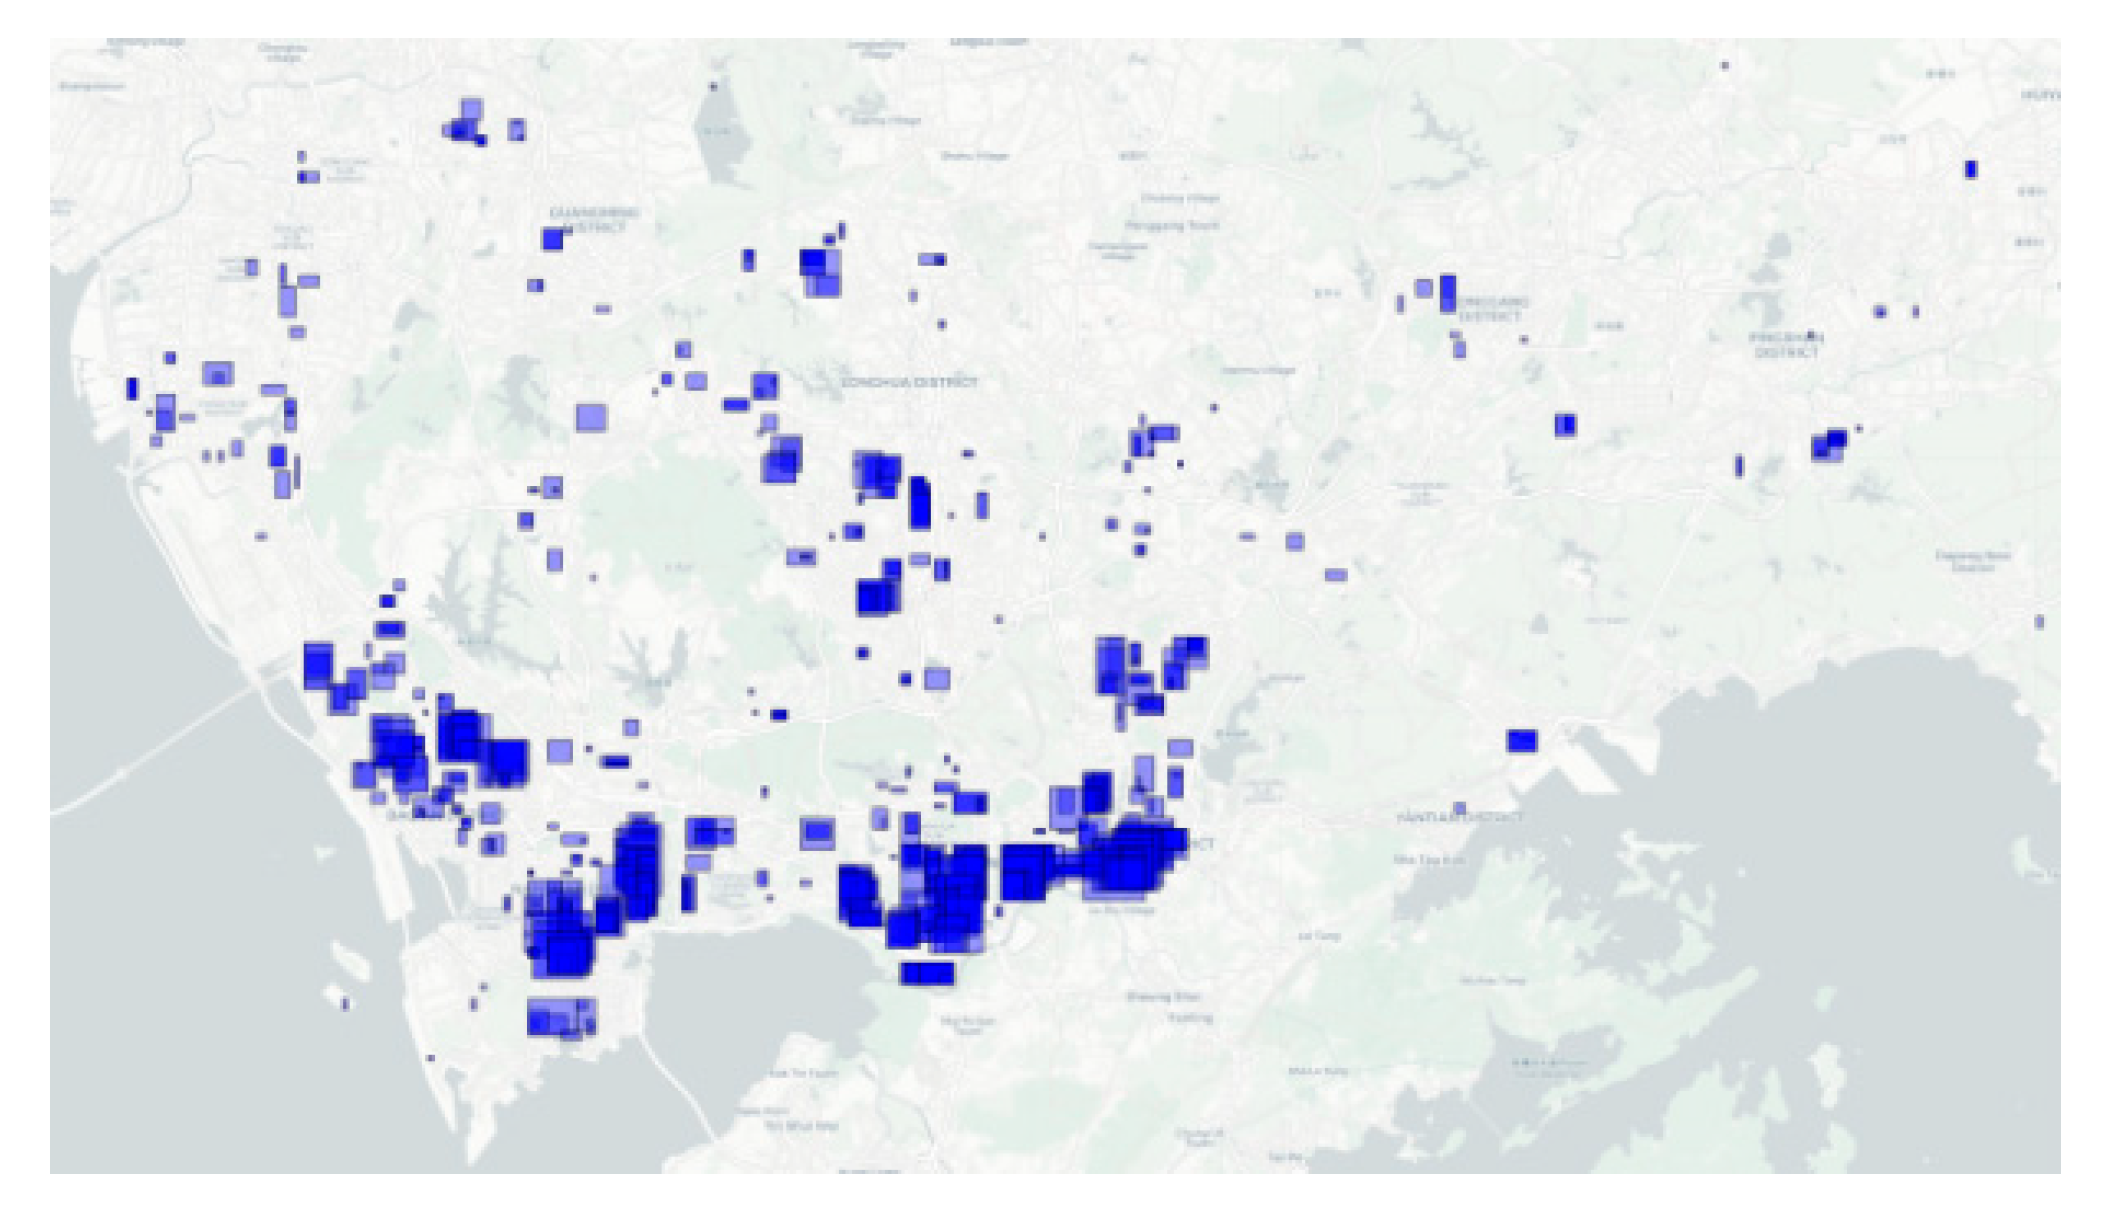
Figure 13.
Distribution Map of Development Intensity in Initial High-Intensity Development Areas in Shenzhen.
Figure 13.
Distribution Map of Development Intensity in Initial High-Intensity Development Areas in Shenzhen.
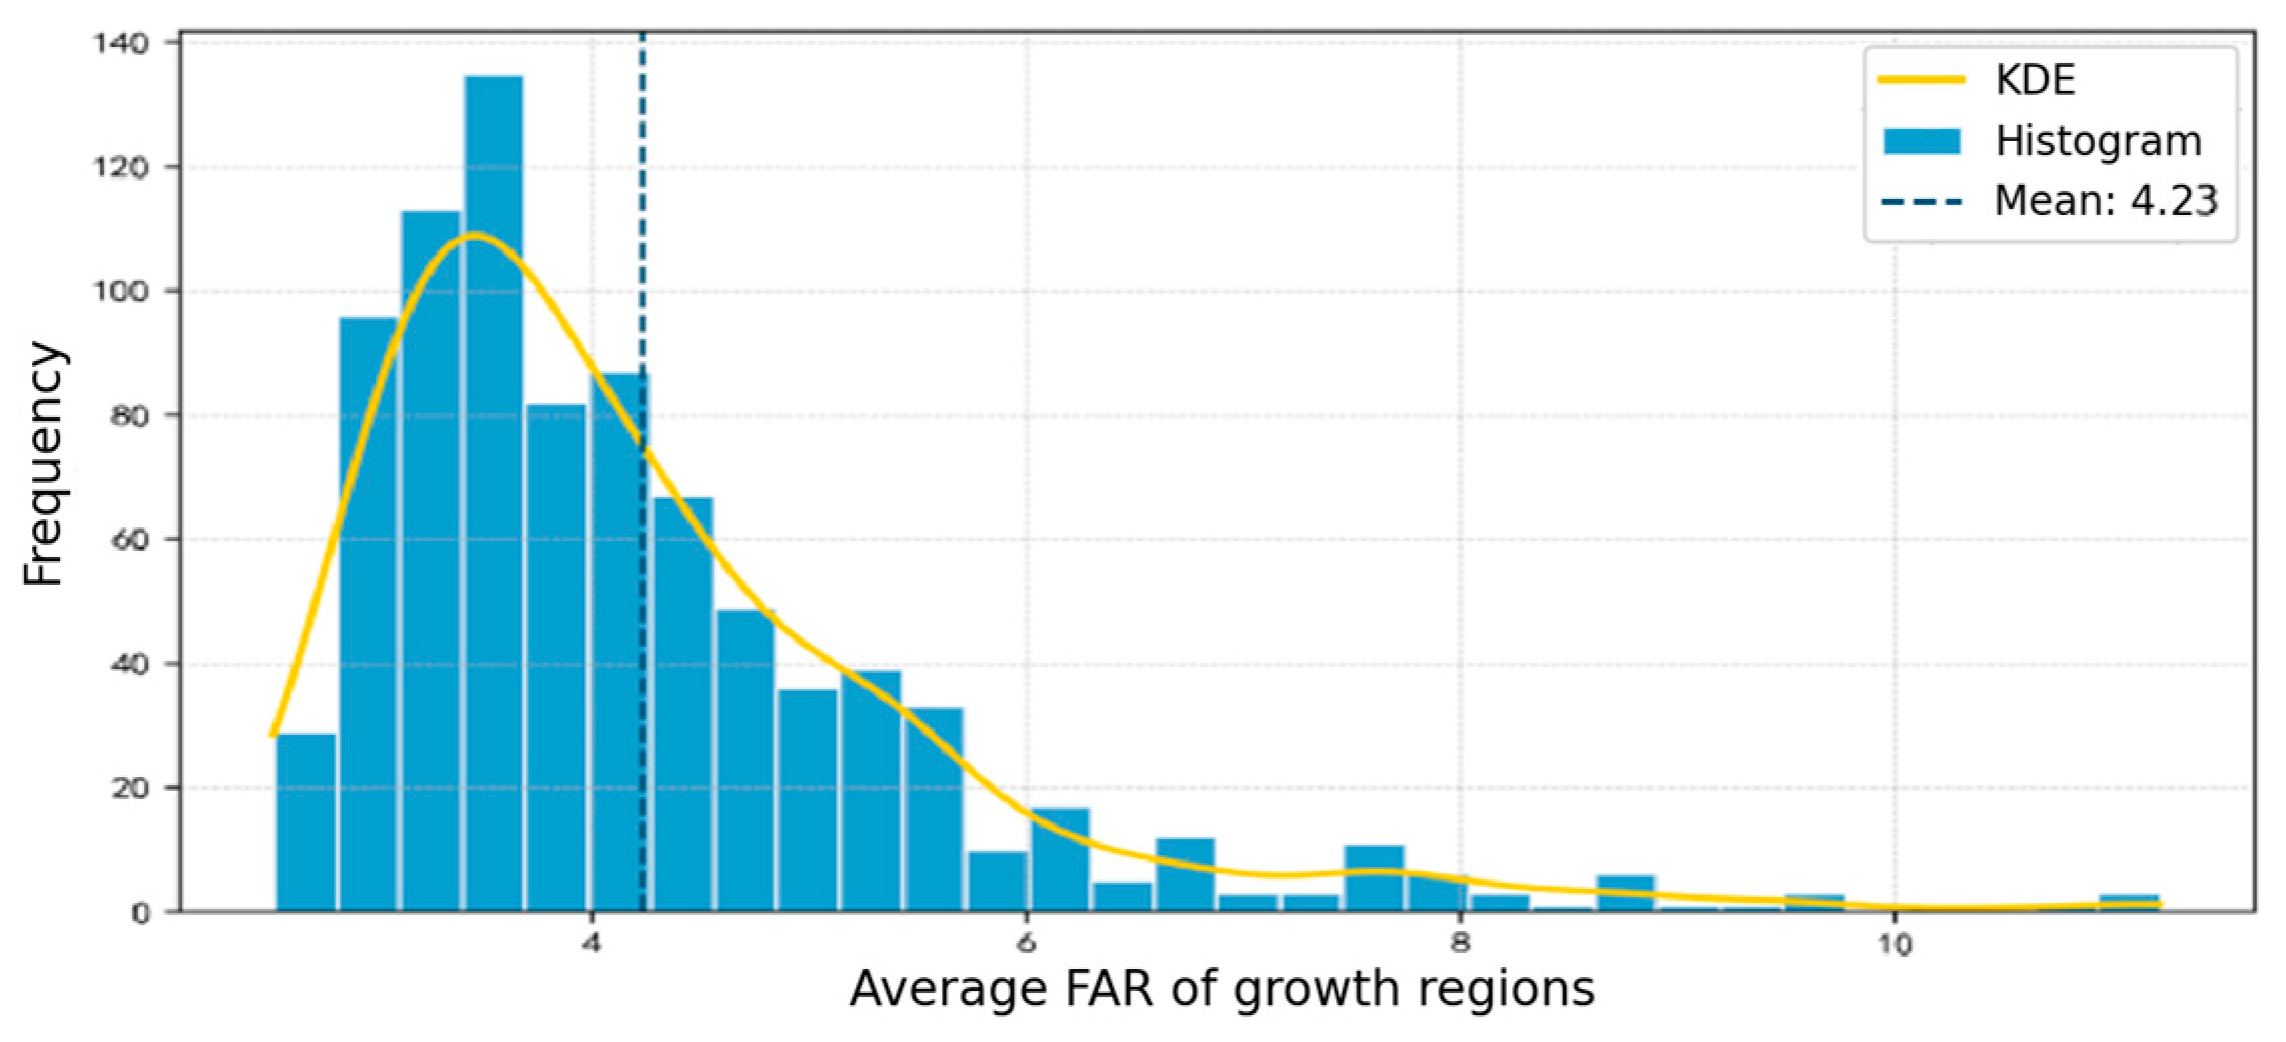
Figure 14.
Map of High-Intensity Development Areas in Shenzhen.
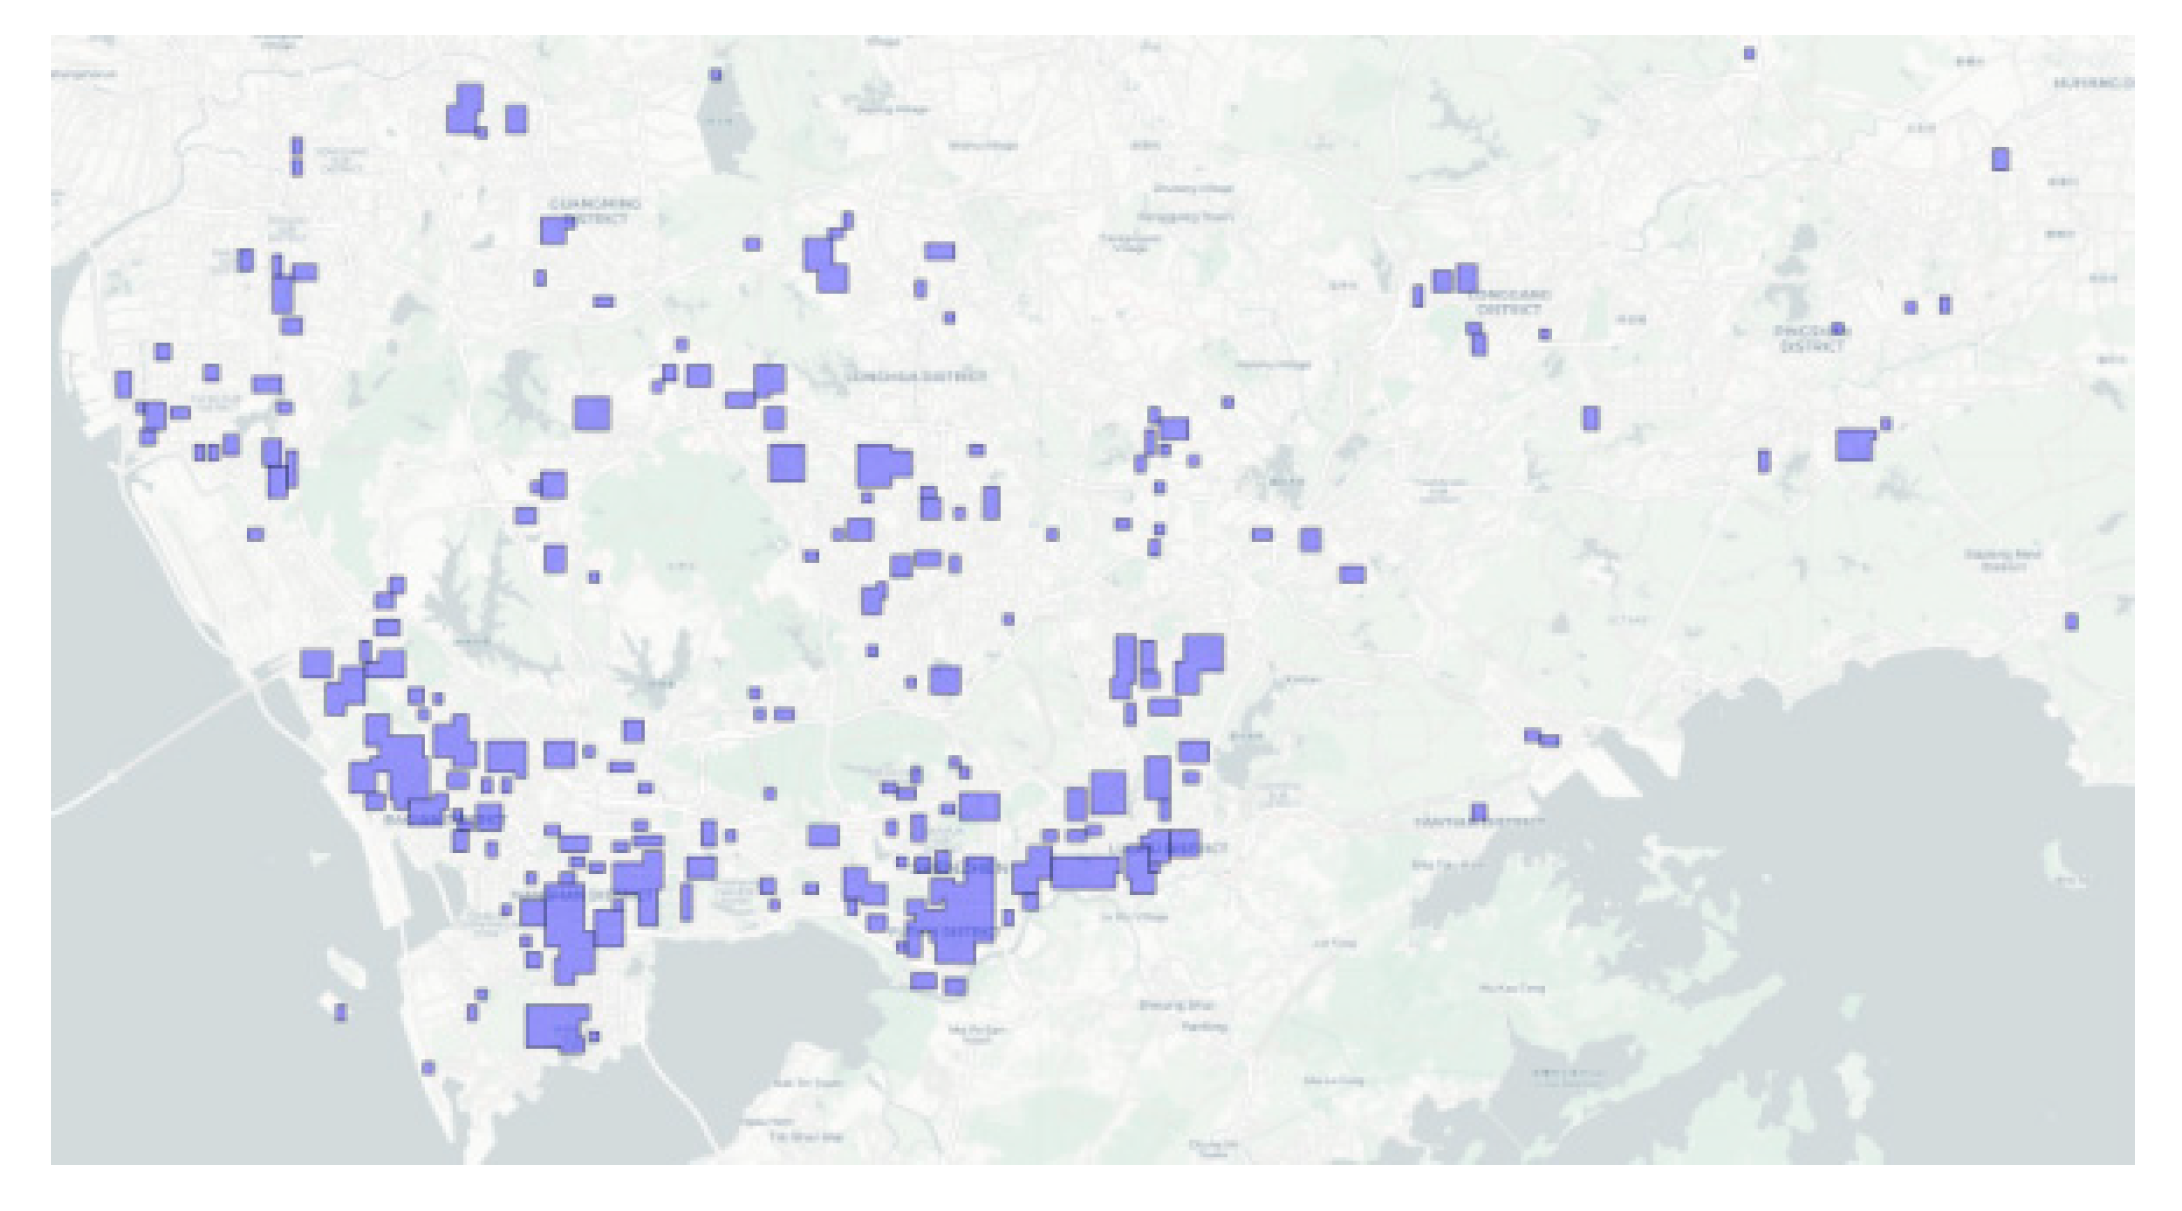
Figure 15.
Distribution Map of Development Intensity in High-Intensity Development Areas in Shenzhen.
Figure 15.
Distribution Map of Development Intensity in High-Intensity Development Areas in Shenzhen.
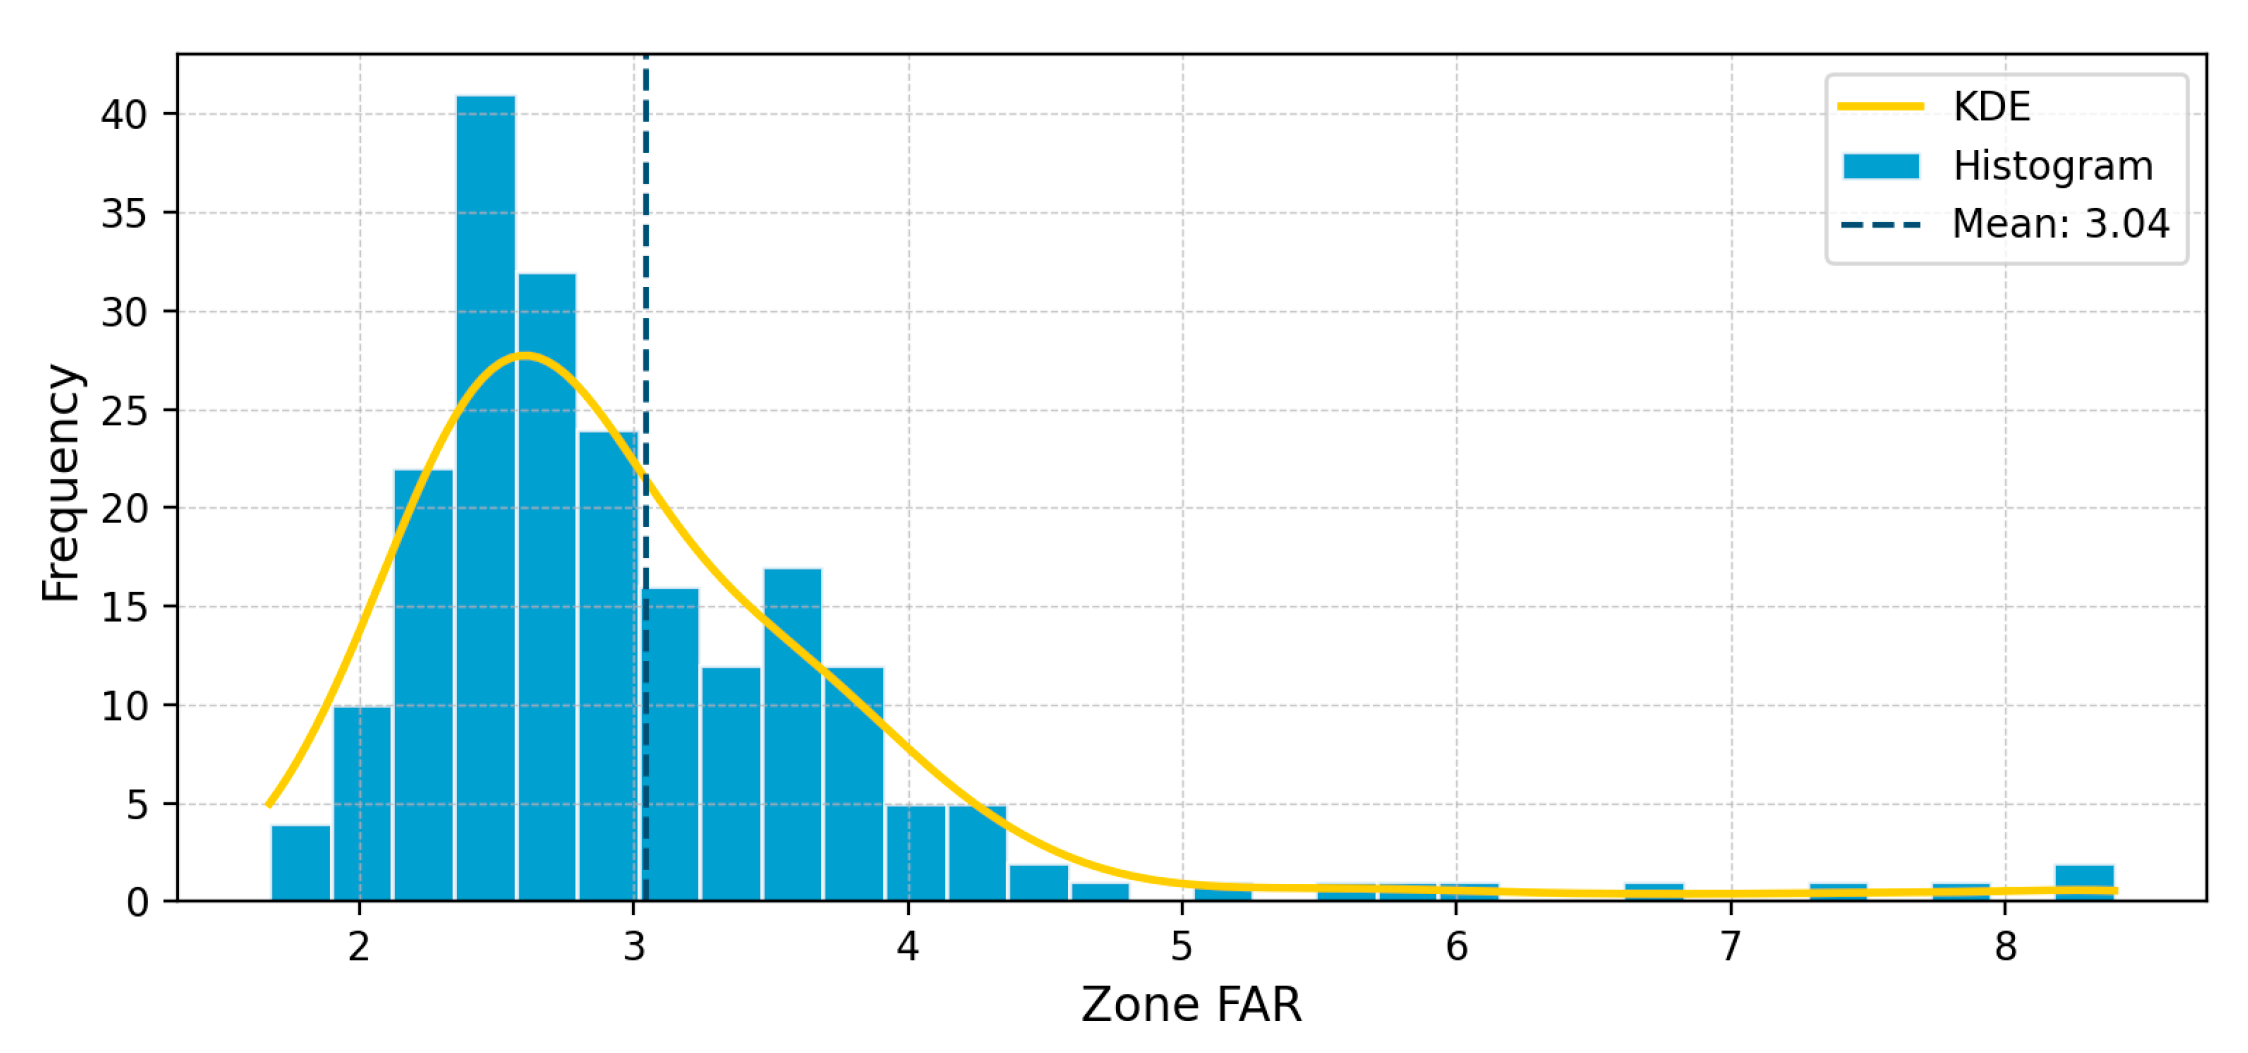
Figure 16.
Area Proportion of High-Intensity Development Areas in Shenzhen.
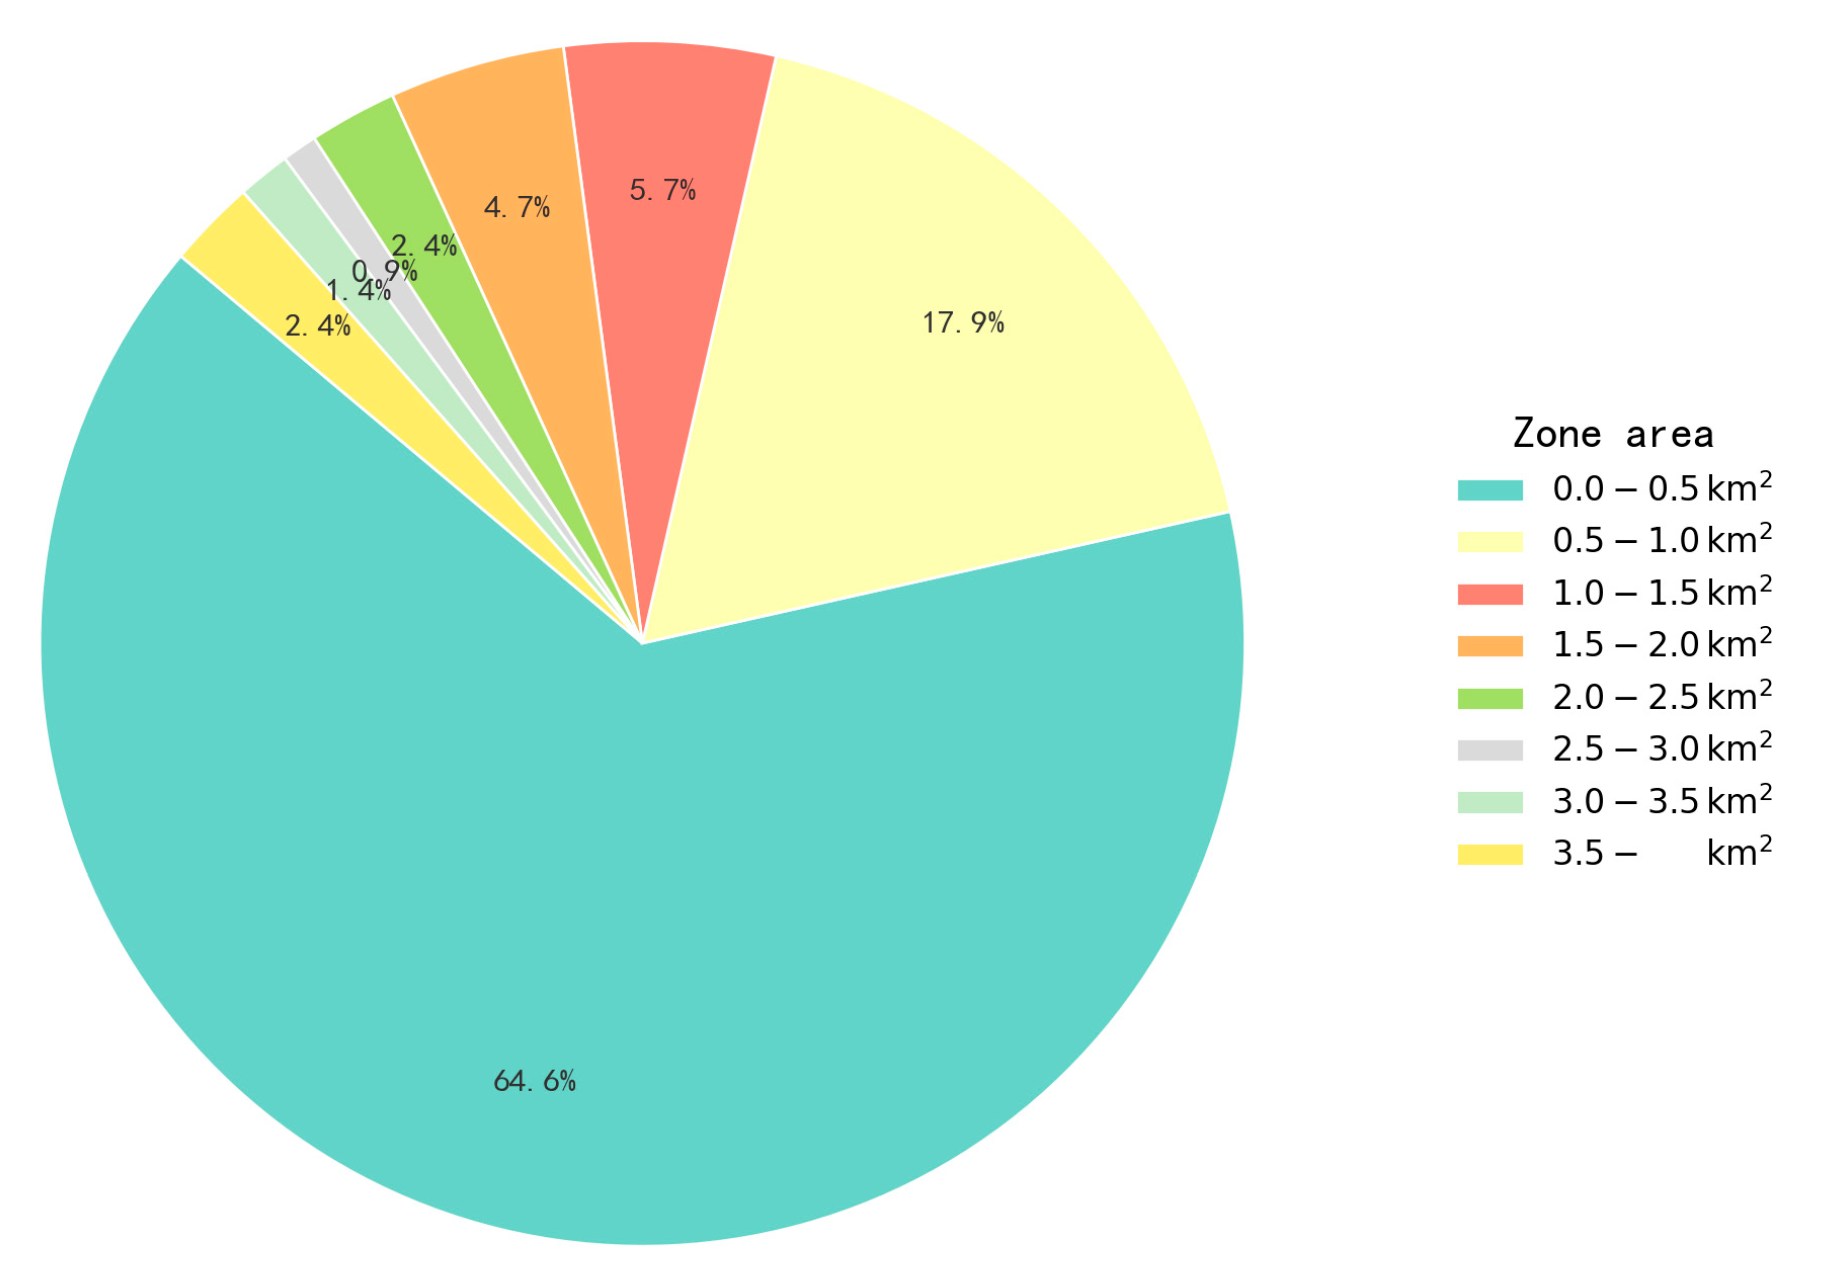
Figure 17.
Convexity Map of High-Intensity Development Areas in Shenzhen.
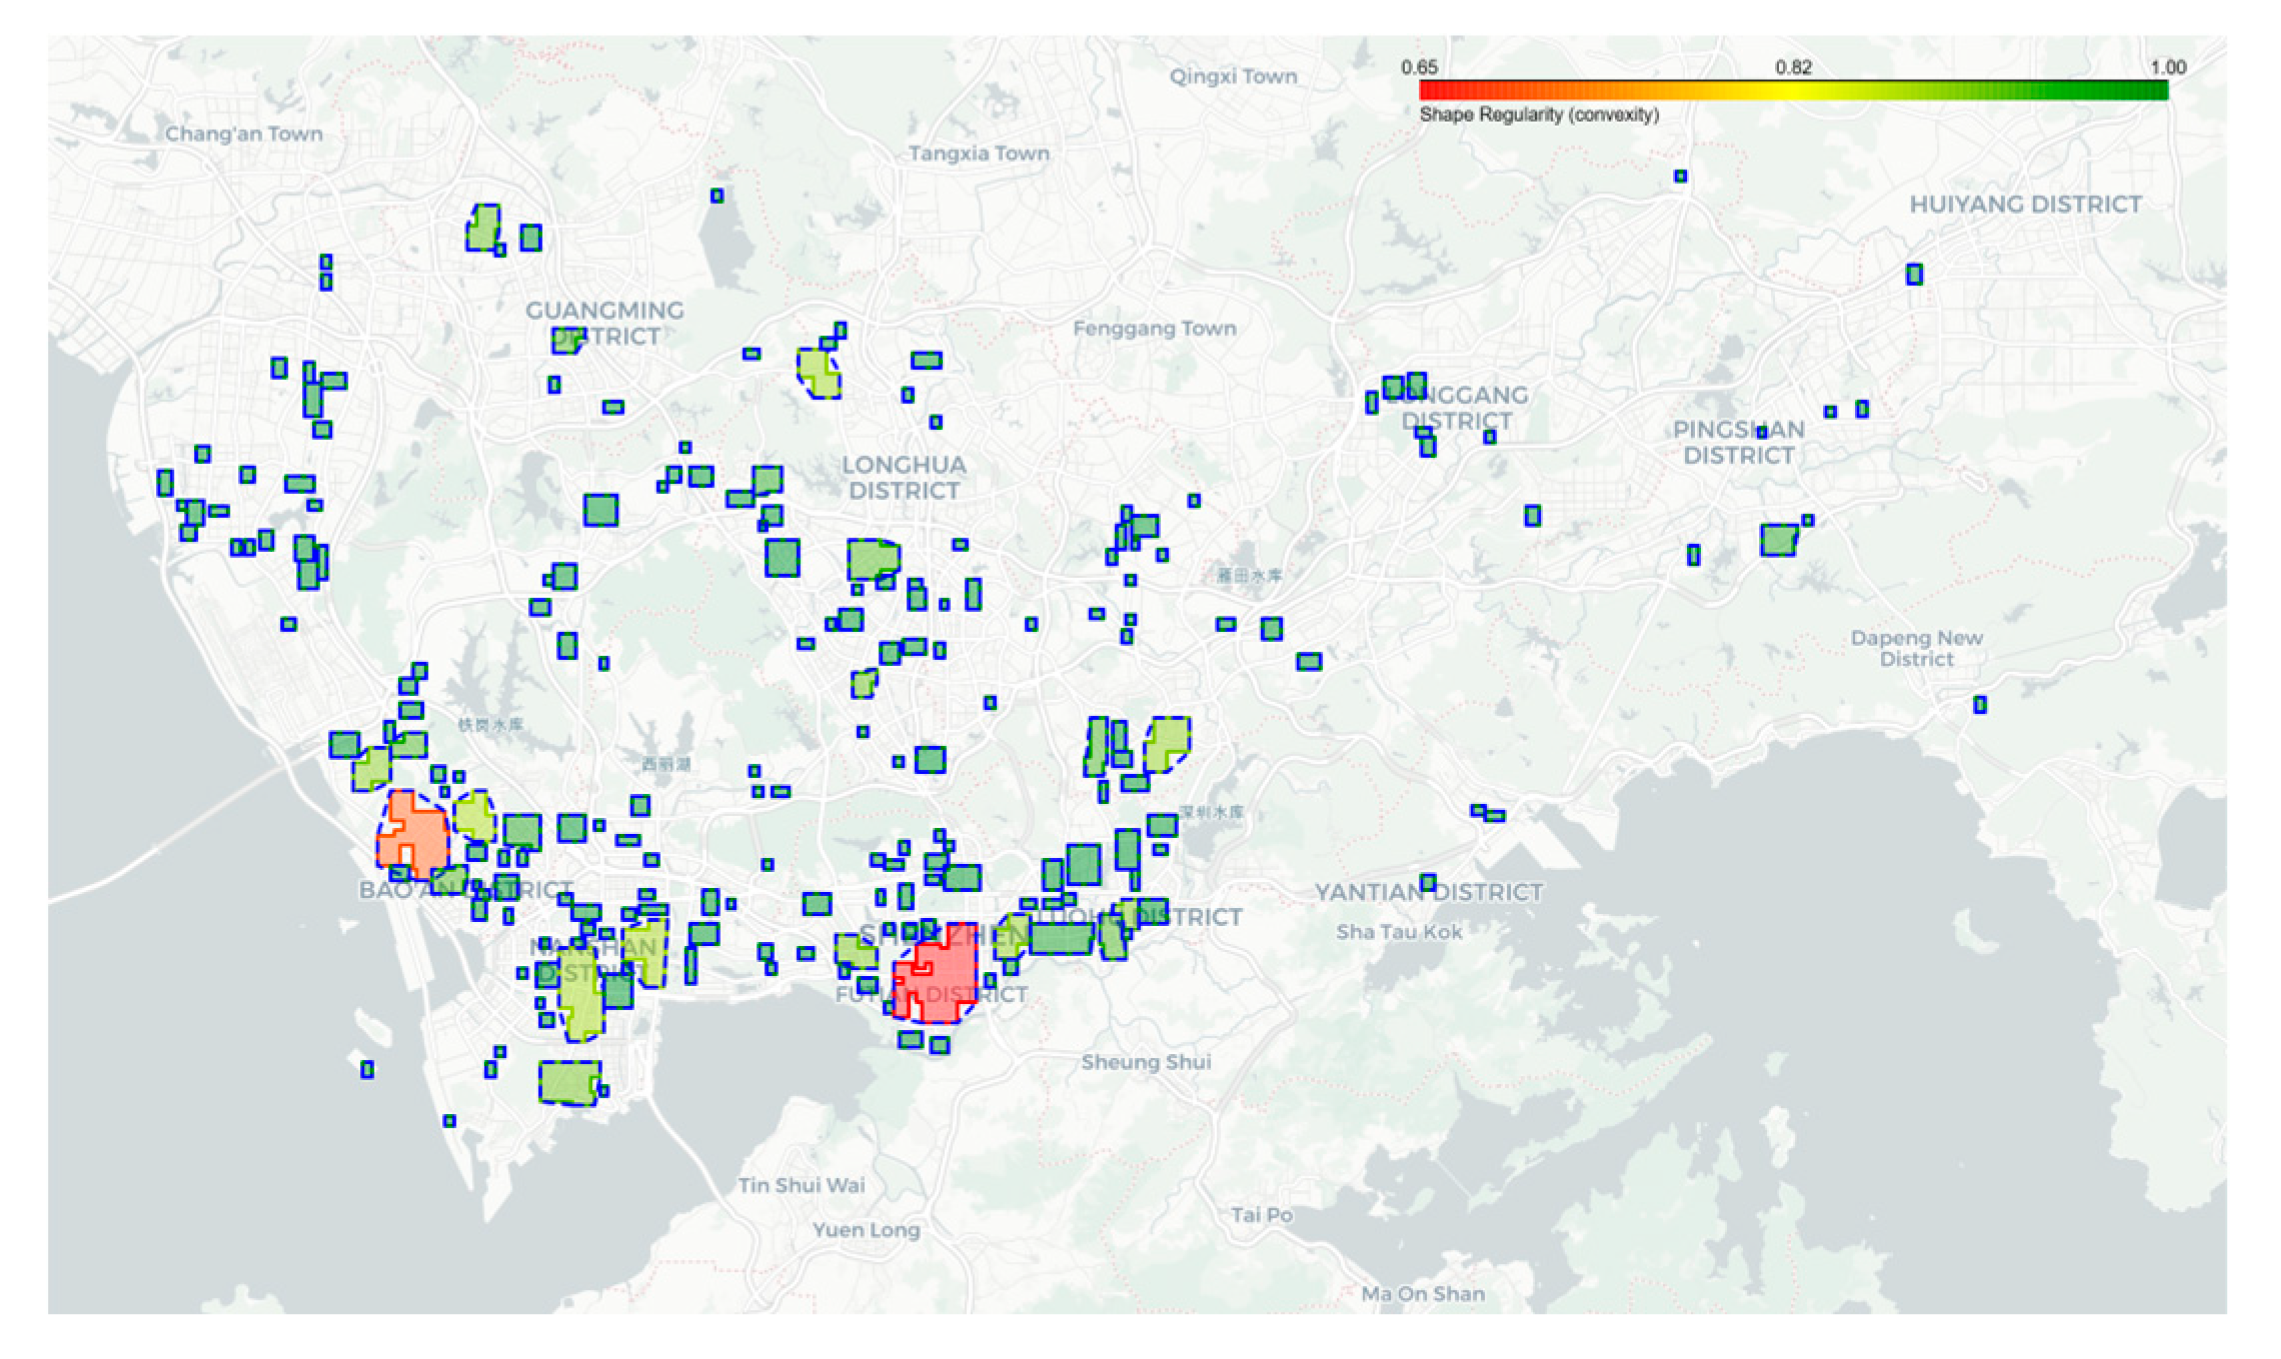
Figure 18.
Map of Minimum Buffer Overlap Rate of High-Intensity Development Areas in Shenzhen.
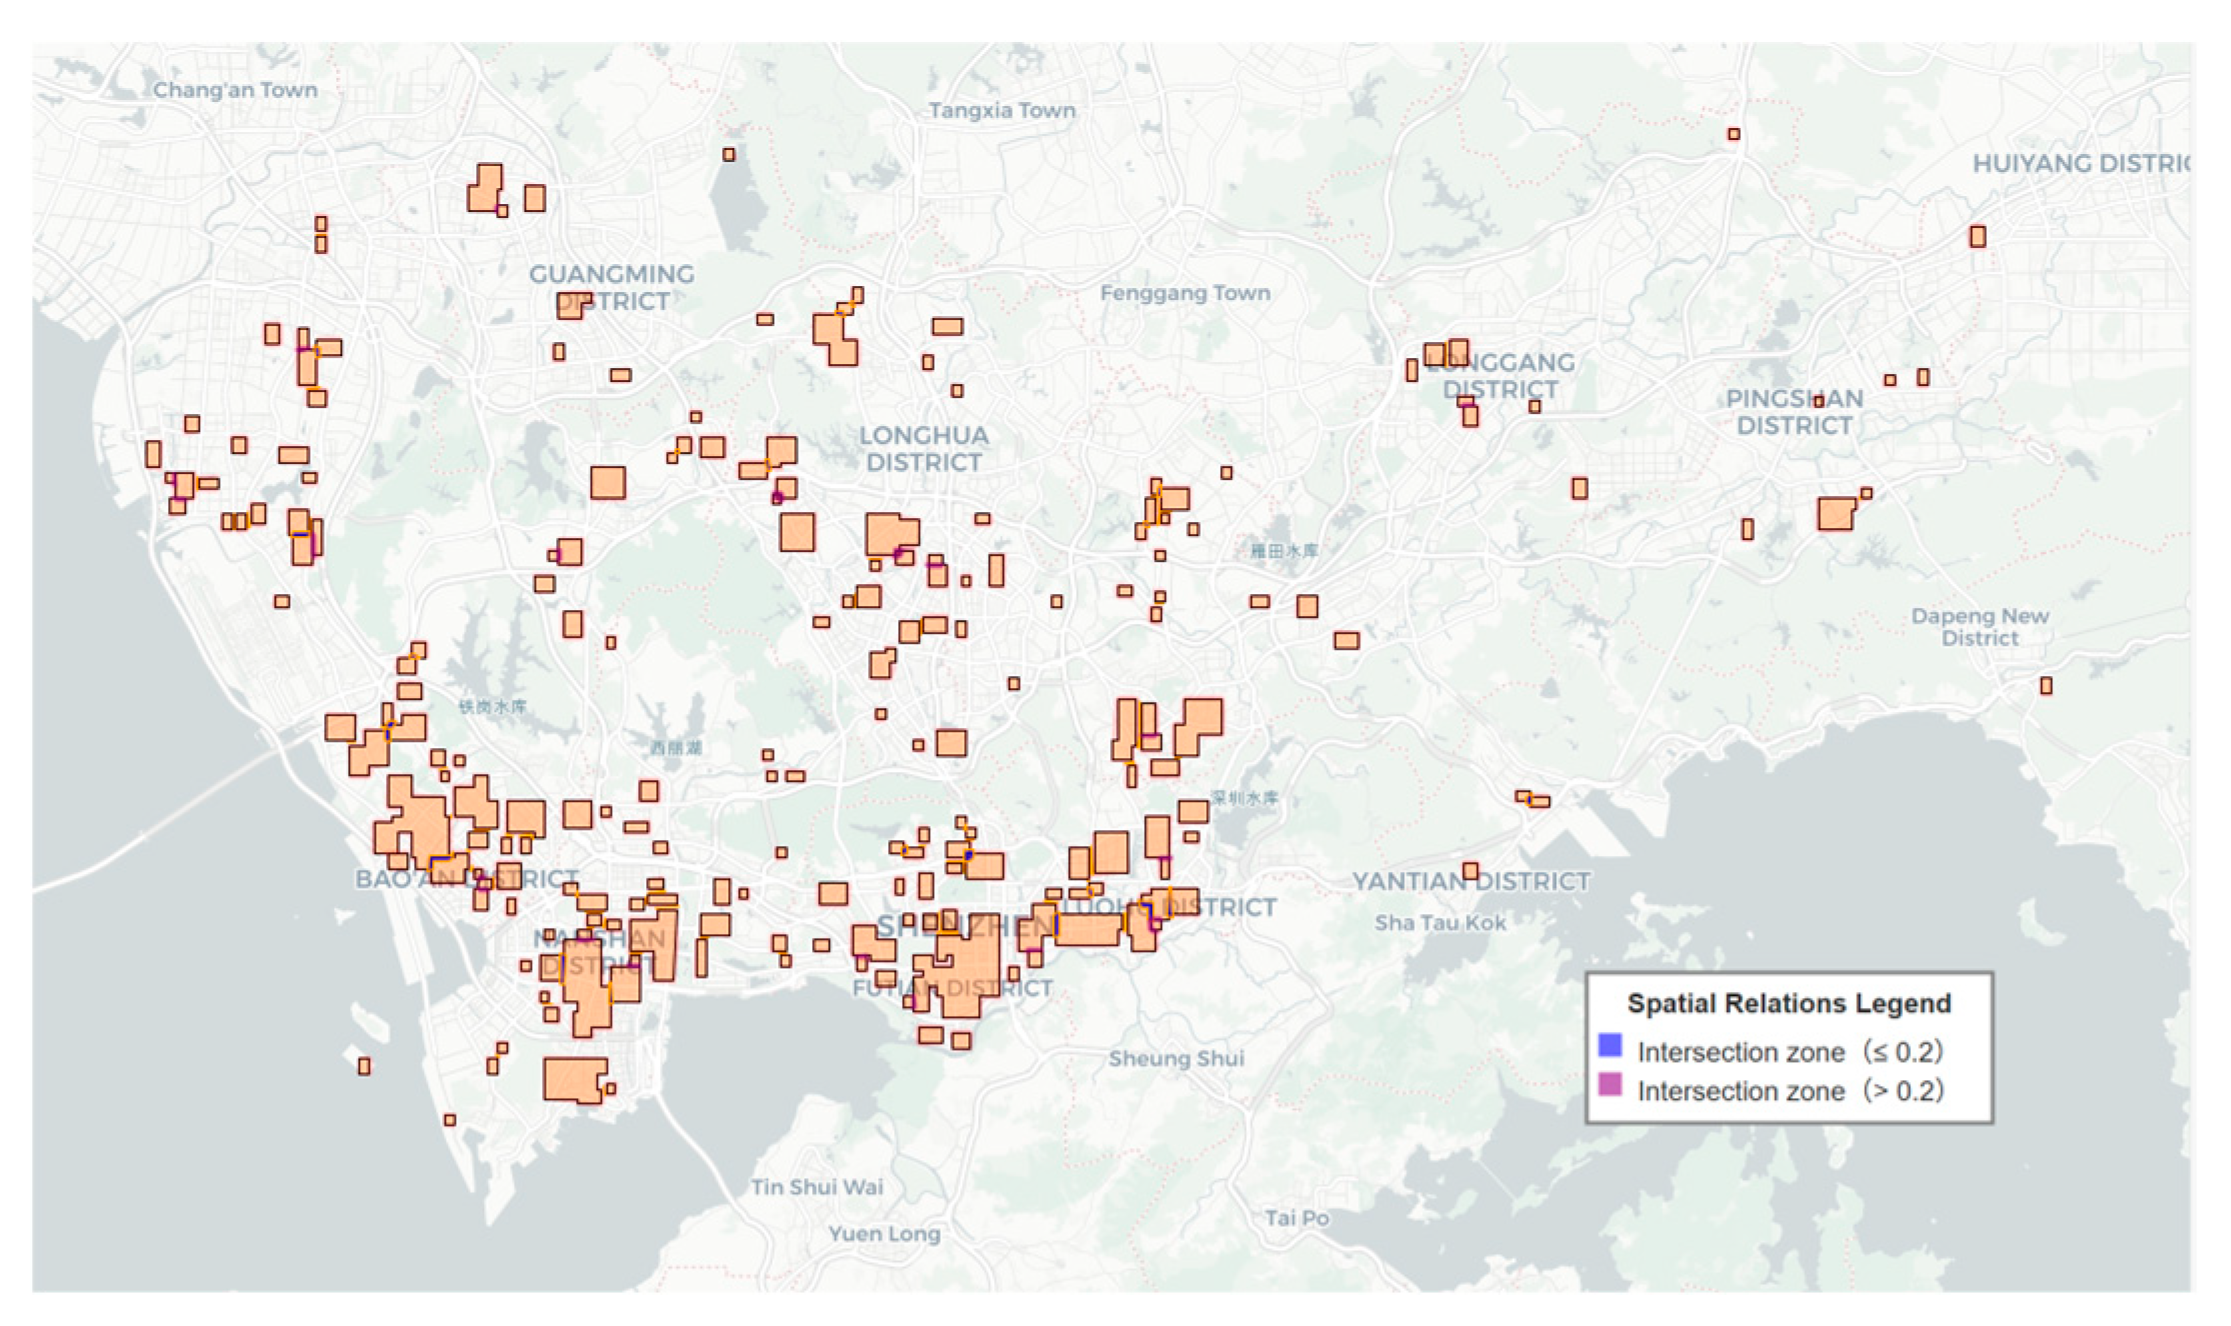
Figure 19.
Utilization Efficiency Map of High-Intensity Development Areas in Shenzhen.
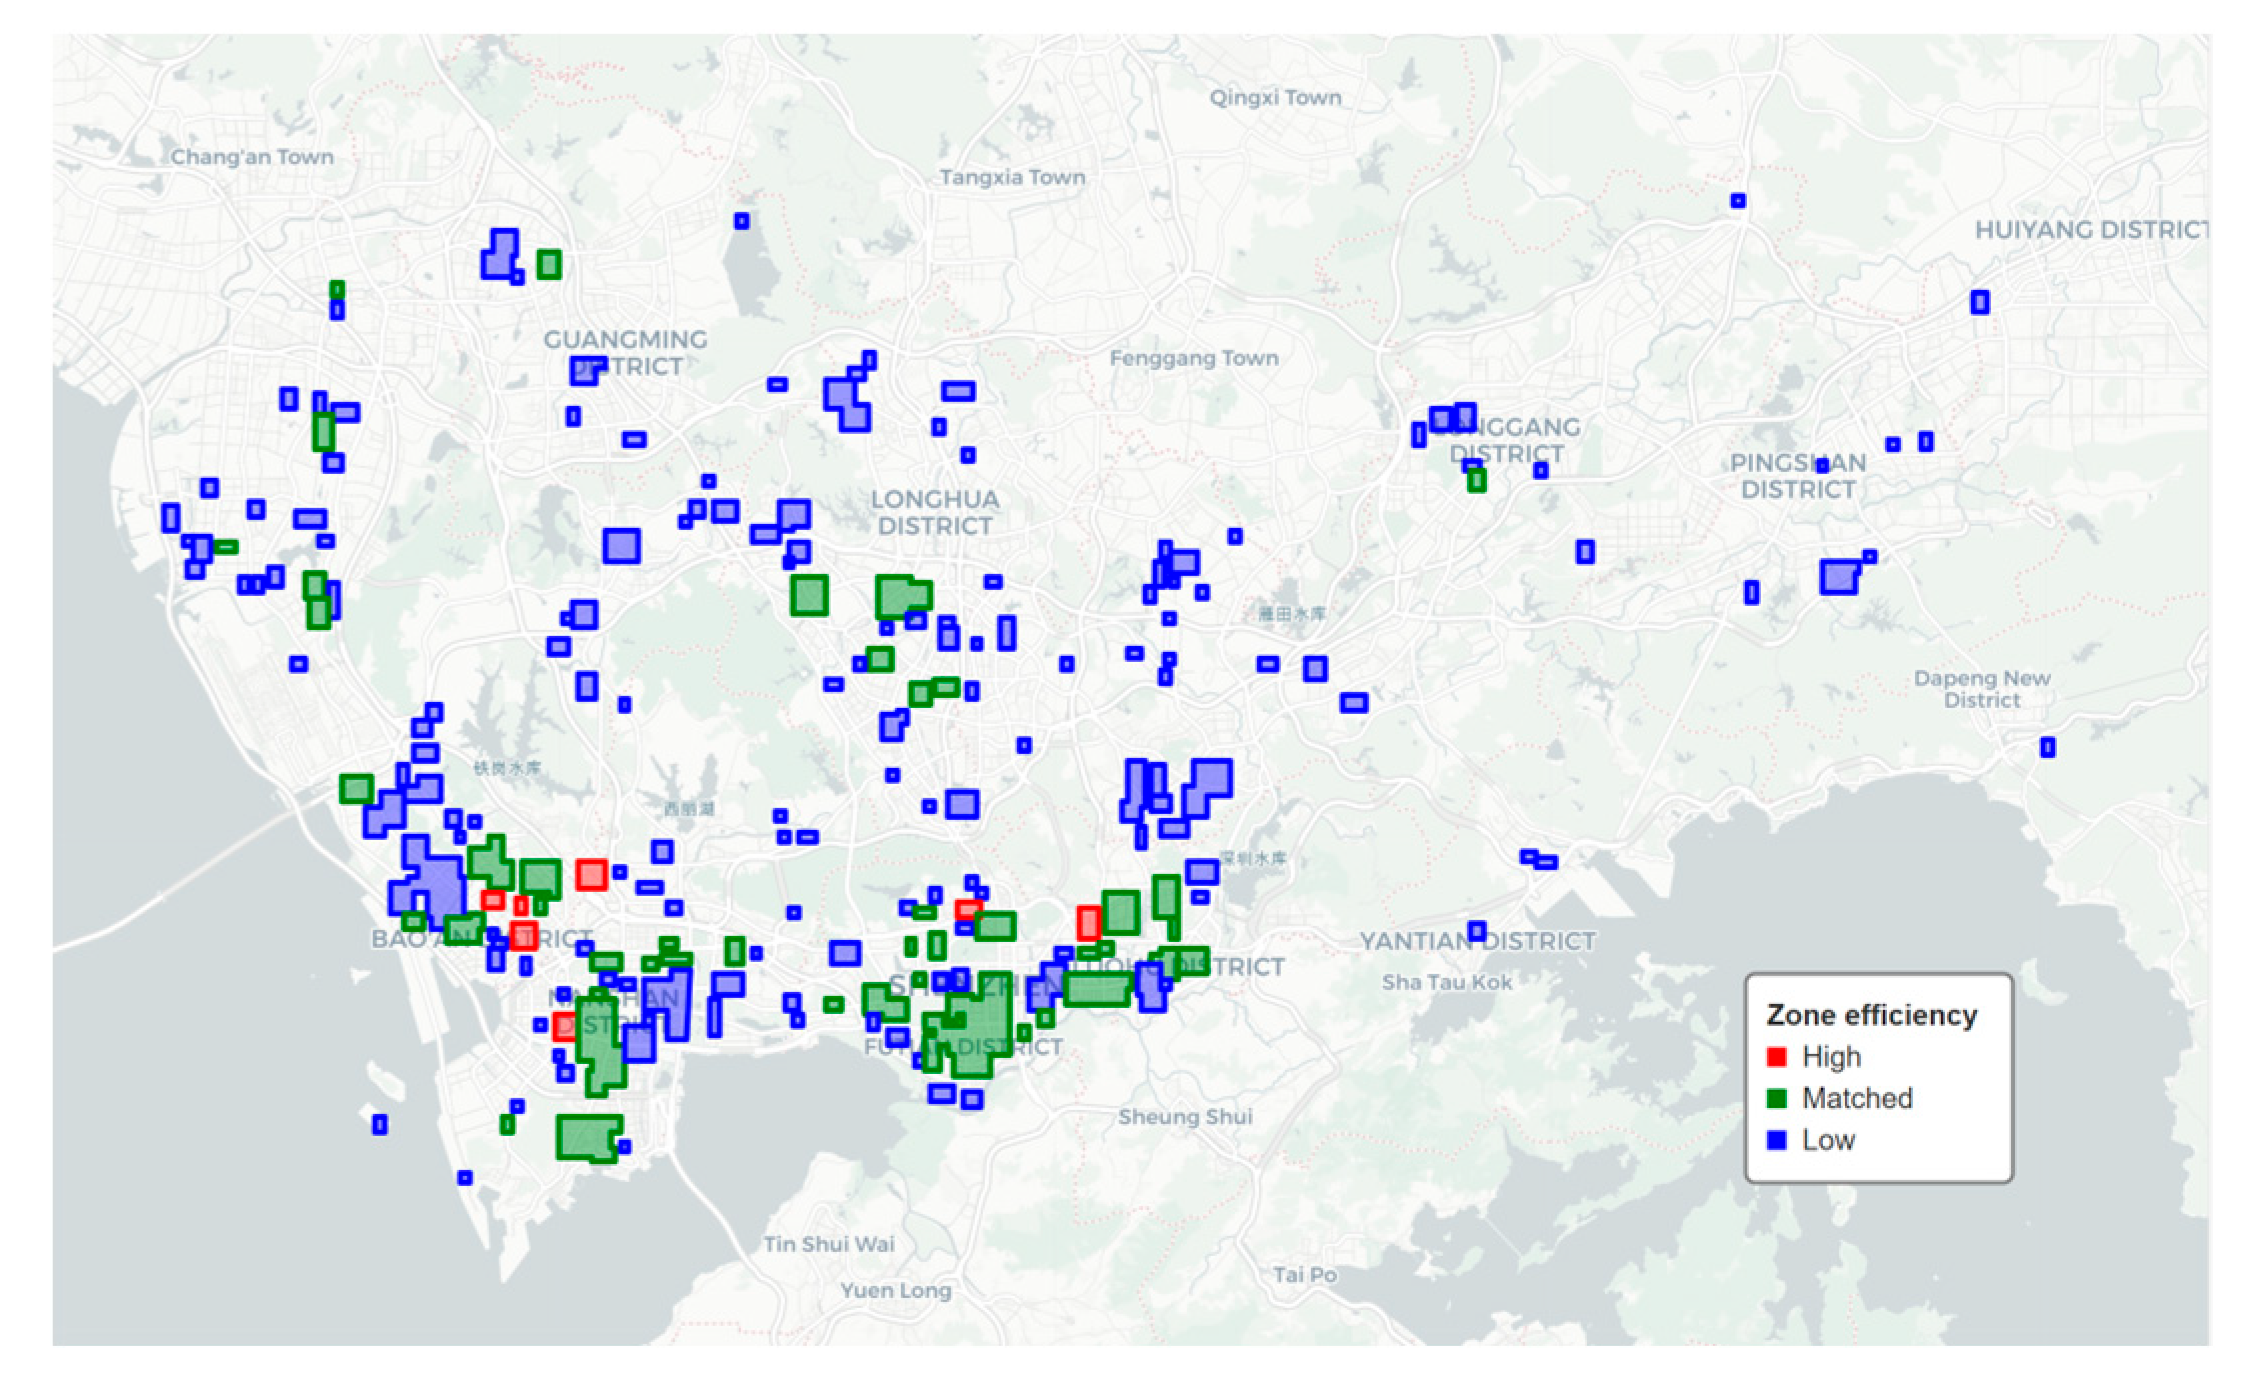
Figure 20.
Distribution Map of Utilization Efficiency in High-Intensity Development Areas in Shenzhen.
Figure 20.
Distribution Map of Utilization Efficiency in High-Intensity Development Areas in Shenzhen.
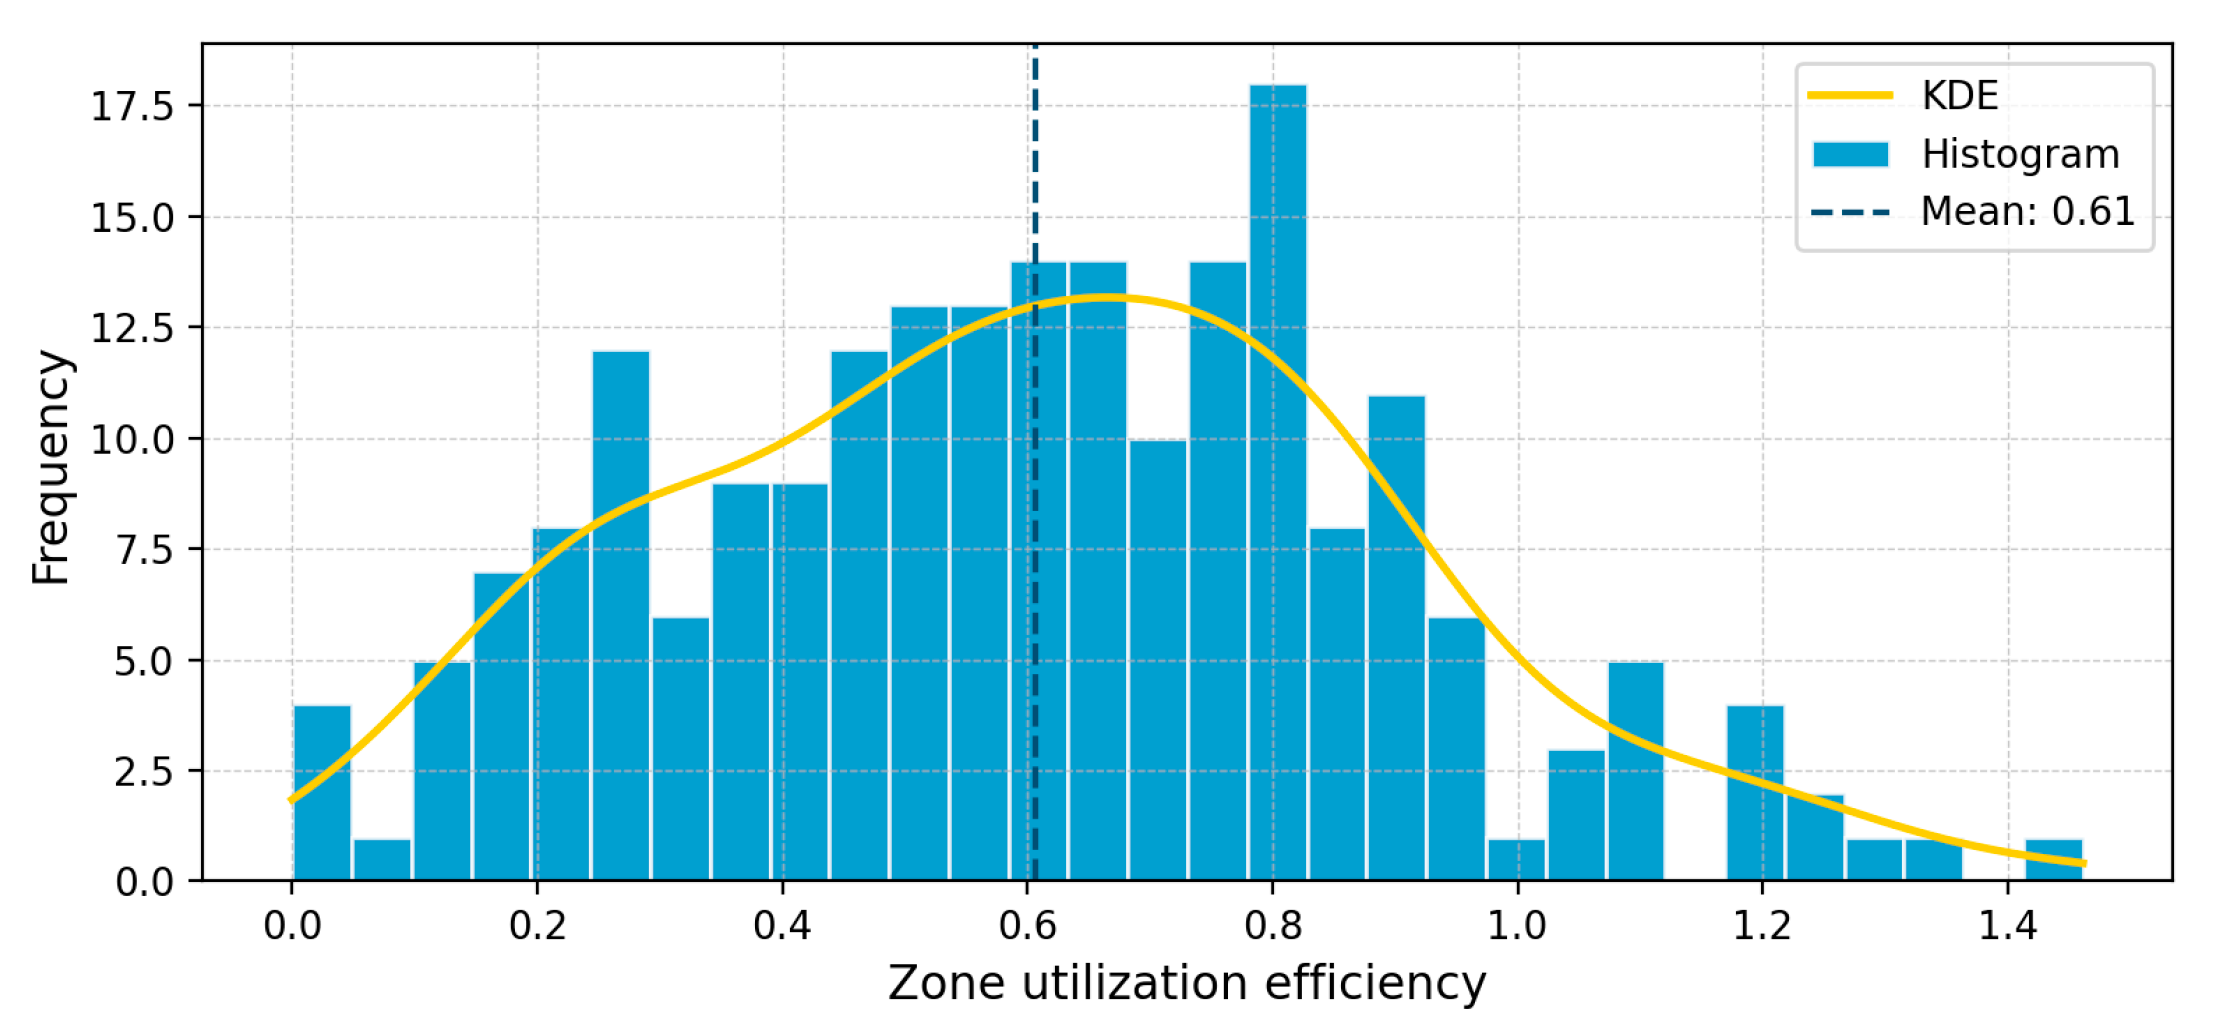
Figure 21.
Box Plot of Utilization Efficiency of High-Intensity Development Areas in Shenzhen.
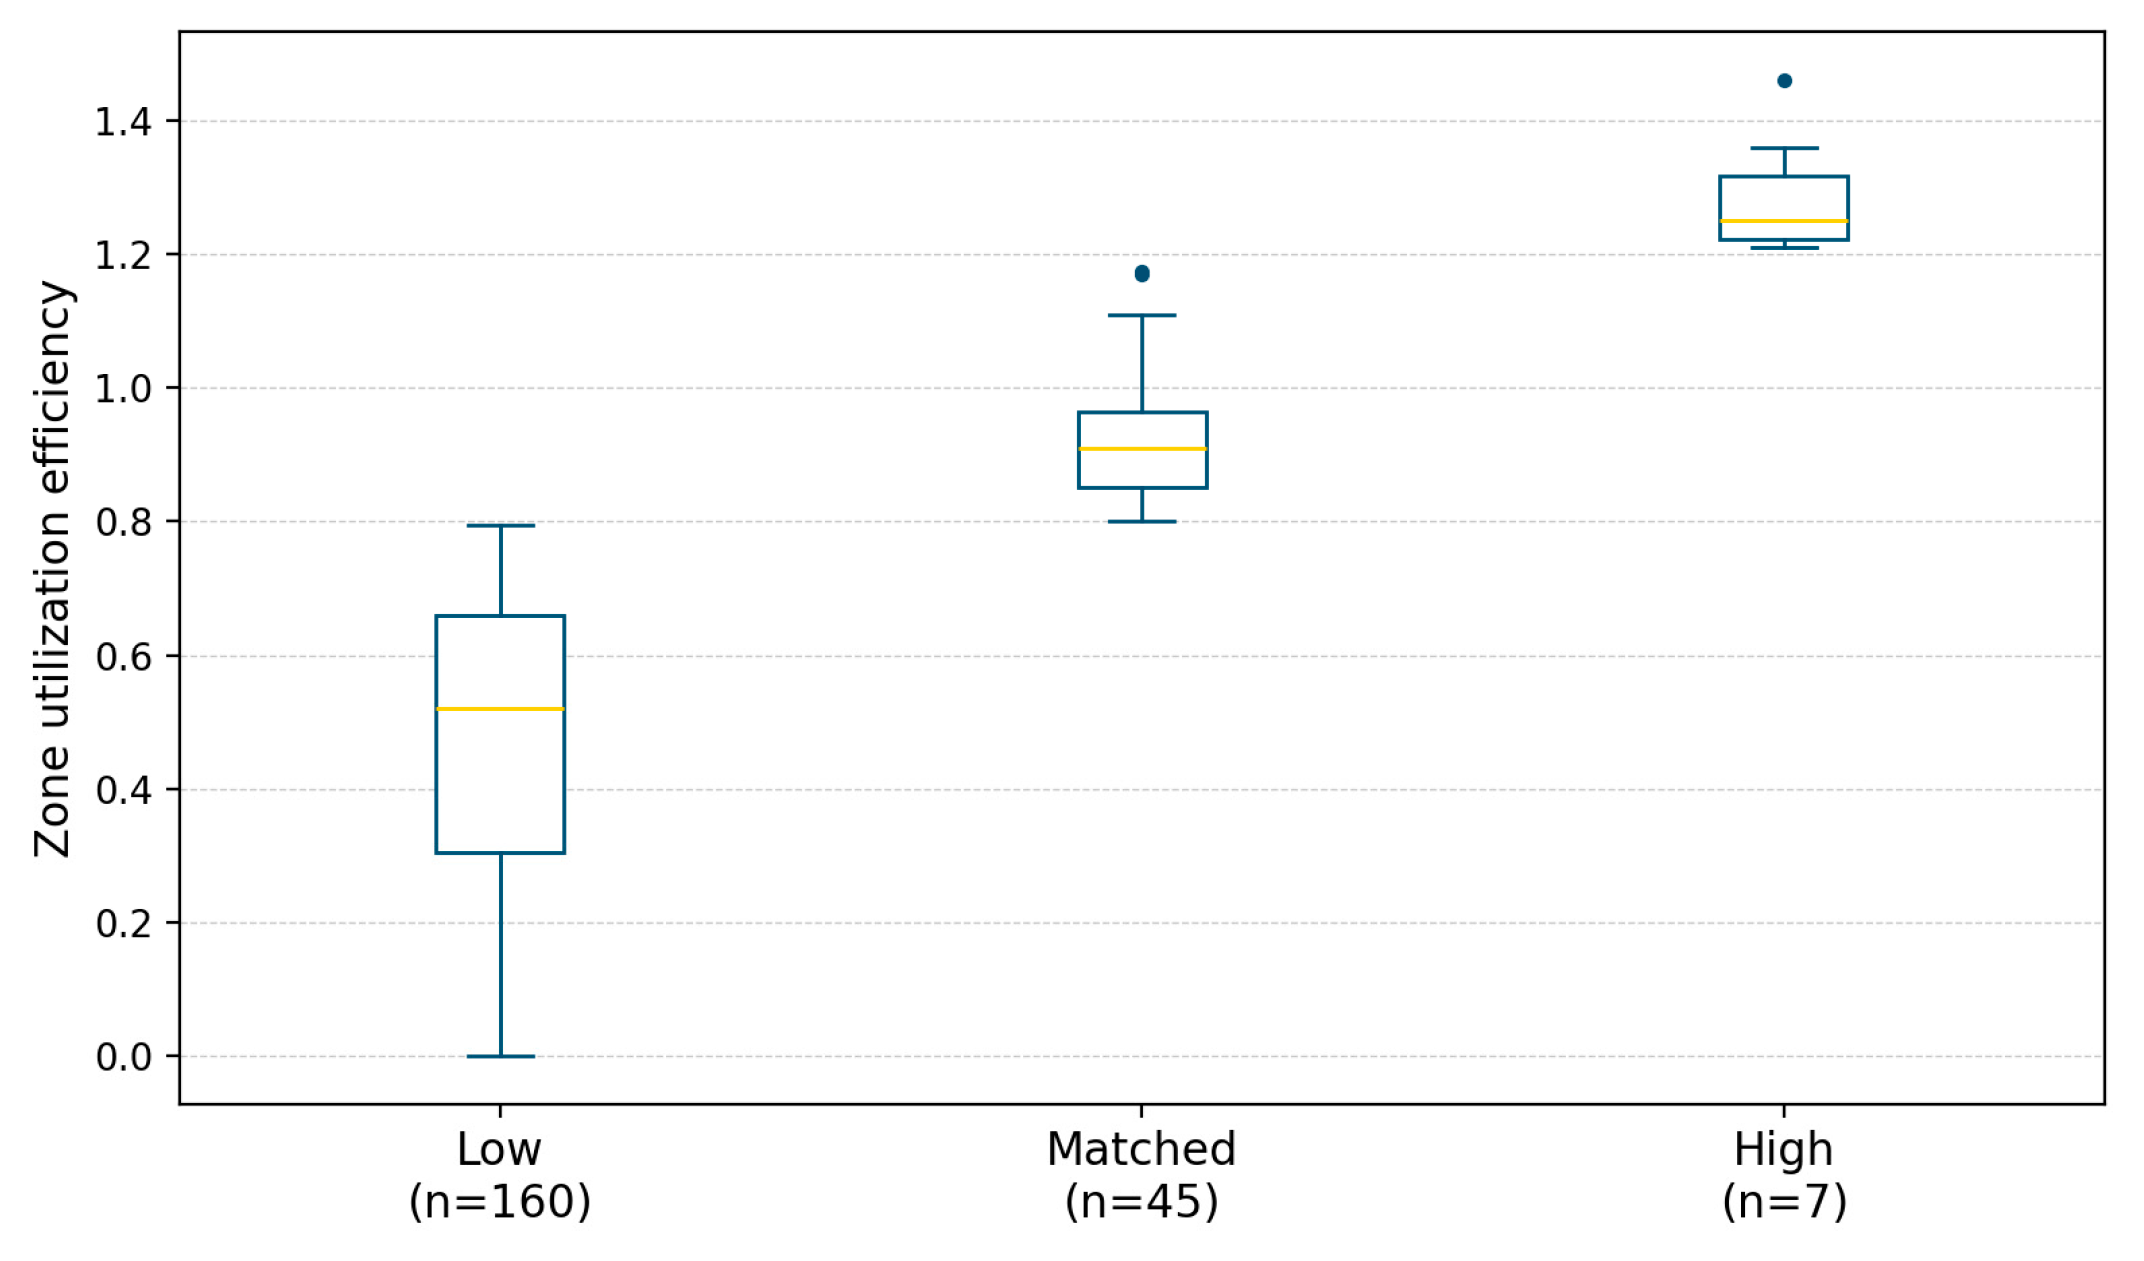

Table 1.
Convexity Distribution of High-Intensity Development Areas in Shenzhen.
| Convexity | (0.6, 0.7] | (0.7, 0.8] | (0.8, 0.9] | (0.9, 1.0] |
|---|---|---|---|---|
| Number of Areas | 1 | 1 | 6 | 204 |
Table 2.
Distribution of Minimum Buffer Overlap Rate of High-Intensity Development Areas in Shenzhen.
Table 2.
Distribution of Minimum Buffer Overlap Rate of High-Intensity Development Areas in Shenzhen.
| Buffer Overlap Rate | [0.0, 0.1) | [0.1, 0.2) | [0.2, 0.3) | [0.3, 0.4) | [0.4, 0.5) |
|---|---|---|---|---|---|
| Number of Area Pairs | 22438 | 15 | 11 | 7 | 1 |
Disclaimer/Publisher’s Note: The statements, opinions and data contained in all publications are solely those of the individual author(s) and contributor(s) and not of MDPI and/or the editor(s). MDPI and/or the editor(s) disclaim responsibility for any injury to people or property resulting from any ideas, methods, instructions or products referred to in the content. |
© 2025 by the authors. Licensee MDPI, Basel, Switzerland. This article is an open access article distributed under the terms and conditions of the Creative Commons Attribution (CC BY) license (http://creativecommons.org/licenses/by/4.0/).
Copyright: This open access article is published under a Creative Commons CC BY 4.0 license, which permit the free download, distribution, and reuse, provided that the author and preprint are cited in any reuse.


