
Submitted:
06 July 2023
Posted:
07 July 2023
You are already at the latest version
Abstract
In the recent past, China has experienced rapid urbanization as a result of diverse growth factors. In such a context, it is crucial to evaluate the expansion of urban entities in order to implement sustainable urban planning strategies in China. Since, urban entities are the spatial reflection of the concentration of human activities, the delineation of urban areas upon the boundaries of built-up surfaces has resulted from inconsistent understanding and identification of urban areas. The study has attempted to extract and evaluate the growth of urban entities in 336 prefecture cities in China mainland (2000-2020) upon a novel approach using consistent night light images. The urban entities were extracted using the light intensities of the SNPP-VIIRS-like data. After extracting urban entities, a rationality assessment was carried out comparing derived urban entities with the LandScan population product, Landsat, and road networks. Also, the results were compared with other physical extents products such as MODIS and the HE. According to the findings, urban entities are basically consistent with the LandScan, road networks, and those with the HE and MODIS. But, urban entities accurately reflect the concentration of human activities than impervious extents of MODIS and the HE. At the prefecture levels, urban entities elevated from 8082 km2 to 74,417 km2 between 2000 and 2020 showing a 10.8% growth rate. By providing a supplementary resource and guide for trustworthy urban mapping, the research will expand new research directions that address the issues of variations of NTL data brightness thresholds dynamics on regional, and global scales.
Keywords:
Impervious extents
; Nighttime light data
; Prefecture cities
; SNPP-VIIRS-like
; Urban entities
1. Introduction
Urbanization is a complicated phenomenon that is accompanied by population movements, changes in the rural-urban divide, and flows of matter and energy. In recent years, urbanization has expanded into a significant spatial phenomenon on a global scale. In 1950, 25% of the world’s population lived in cities [1] and currently, urban areas are home to 50% of the world’s population [2]. Especially in less developed countries, the urban population will increase to 56.4% by 2030 [3]. Urbanization is one of the most significant factors in human-induced land cover and land-use change, even though urban areas make up only a small portion of the entire Earth's surface [4]. Urbanization and its evolution have been studied using a range of spatial-temporal scales, using remote sensing techniques as the primary source of consistent and continuous data [4,5,6]. The urban system is intricate, with many interconnected components. A key component of the urban system is the impervious surface, which is made up mostly by buildings, roads, and other infrastructure and serves as population and economic hubs [6].
Urban entity expansion needs to be continuously monitored due to worsening conditions of overcrowding, housing shortages, inadequate infrastructure, and growing ecological issues [2]. Therefore, it is necessary to implement effective spatial planning and monitoring measures to reduce the negative effects of urban entity expansion. It is especially well suited to anticipate those processes in urban environments using multi-temporal and multi-spectral data. Different size cities can be seen in the geographical space as a result of urbanization, especially major cities that have been rapidly urbanizing during the last two decades in China [7]. Sustainable urban development in China requires maintaining a balance between human activities, the environment, population, and urbanization by monitoring changes in urban entities in order to inform policy decisions on urban environmental management and planning. Major changes brought about by urbanization in China include population and economic transition from the countryside to urban areas. As a country of the global south, China experiences the largest population concentration around urban areas and as a result of these developments, it also bought about more socioeconomic benefits and adverse environmental impacts. Following the implementation of economic reforms, the country underwent a significant rural-to-urban shift, with an increase in the concentration of inhabitants in and surrounding urban regions from 1978 to 2012, from 17.9% to 52.6%, respectively [8]. Recent decades have seen a marked increase in the rate of urbanization due to migration and the expansion of urban boundaries. In contrast, the 2010 population census in China showed that about 50% of the country’s population was categorized as urban. The turning point for China came after 2011 when for the first time in its history, the majority of the country’s settlements were classified as urban. Today’s new stage of development in China incorporates urbanization as a key component and direction. The second stage of China’s urbanization, or the stage of steady expansion, has been reached, according to the theory of urbanization development [9].
Identifying urban areas based on distinct urban characteristics might be a reliable entry point for analyzing and predicting urban expansion to address future sustainable development issues. Urban areas are frequently thought of as impervious areas filled by roads, buildings, and other constructions [4,10]. Typically, the qualities of man-made structures are used to demarcate urban entities [11]. However, it is ineffective in evaluating how human activities are concentrated together [12]. Additionally, it is essential to illustrate the other socioeconomic functions of urban dwellers using various urban structures [13]. However, it is challenging to apply this to wider spatial-temporal coverage. Urban entities, which have a concentration of population and human activities, are the areas that spread positive externality. The concentration of human socioeconomic activities, continuity, and physical structures across a larger spatial coverage are the three main features of urban entities. Applying economic-based variables to characterize urban entities, such as the vacancy rate of urban housing, will increase the accuracy of the urban entity definition. Upon this, some researchers [14,15] advocated using an integrated definition in conjunction with socioeconomic factors and physical structures as a more effective way to define urban boundaries and their expansion. Government institutes normally use population density or size as the primary criterion for designating urban entities. The two most popular datasets that utilize for the identification of urban entities are LandScan, and World Pop datasets [16]. Since different countries have diverse population and density characteristics, it is challenging to extract cohesive urban entities using population size variances or density. Urban entity mapping on a wider scale has plenty many options when using remotely sensed data. Nowadays, Landsat, Sentinel, and Moderate Resolution Imaging Spectrometer (MODIS) data are typically used to produce urban entity maps. These datasets are primarily intended to reveal the temporal and spatial distributions of urban impervious areas. But prevailing urban laws, suggest that urban expansion is a complicated process and urban entities shouldn't be primarily identified upon their impervious surfaces [17]. Although daylight satellite imagery can be used to track land use changes, their spectrally varied nature makes it difficult to use them to study urbanization dynamics [18,19]. However, Defense Meteorological Satellite Program’s Operational Line-scan System (DMSP/OLS), and Suomi National Polar Partnership-Visible Infrared Imaging Radiometer Suite instrument onboard (SNPP-VIIRS) nighttime light (NTL) images offer a unique proxy to extract urban dynamics. As a result, since the 1990s DMSP/OLS images have been utilized for different urban studies, including demographic dynamics, city lights, electricity consumption, urbanization, gross domestic products in urban areas, and greenhouse gas emissions [18,19,20,21].
Urban centers will become difficult, and inconvenient places for commuters, service seekers, and urban dwellers as a result of a lack of space and amenities. Given that it allows urban geographers and planners to map urban areas, and has a significant impact on resource management and socioeconomic development in cities, the evaluation of urban entities is a main urban research direction. As a rapidly urbanizing country, numerous studies have been conducted to extract urban entities from NTL data in China. While few scholars [22] tried to introduce correcting techniques for multi-satellite NTL stable light data to identify urban expansion in China others [23] quantified the dynamics of urban entities. Most researchers have used new methods, and new-generation NTL data for urban entity extraction as well as compared their findings with DMSP-OLS data [7,18,24,25]. Urban extraction using DMSP/OLS data and NTL intensity were also key focusing areas in previous researchers [26,27]. Previous researchers have also used neighborhood statistics, NDVI, and local-optimized threshold analysis using nighttime stable light data and VIIRS data to trace urban growth in China [28,29,30,31]. Few scholars explored the characteristics and trends of urban development in urban agglomerations using DMSP/OLS data [32]. Predicting and quantifying urban growth in coastal cities using DMSP-OLS was another research focus of some scholars [33,34,35,36]. In most recent research few scholars used the K-means algorithm to pinpoint sub-urbanization patterns using SNPP-VIIRS data comparing finding with LandScan population, road network, and impervious extent data products [37,38,39].
Due to the long coverage of DMSP/OLS satellite imagery, it is possible to identify multi-stage urban dynamics in both spatial and temporal dimensions. Thus, using these NTL data, the rapid, sluggish, saturated, and de-urbanization stages may be nicely observed. Due to the spectral and geographical complexity of the land cover within cities, fine-resolution remote sensing of urban areas is also difficult. Fortunately, night light sensors offer the unique ability to track human activities from a distance, in contrast to most conventional sensors [26]. DMSP/OLS nighttime light composite data is one of the most efficient urban information sources. As well as, SNPP-VIIRS has a significant amount of enhancements in terms of spatial resolution, and calibrations [40]. Artificial lights emitted from cities both human settlements and functions can be captured at night using DMSP/OLS and VIIRS. Since NTL data have a positive correlation with socioeconomic indicators and the density and height of built-up areas, it has been widely used to detect dynamics in urban land use, particularly in impervious surface and urban land use intensification. In particular, DMSP-OLS and SNPP-VIIRS data, are frequently used to extract urban entities, population, and gross domestic product, and analyze carbon emissions [27,41,42,43]. There are two advantages to using NTL images to detect urban entities. These data have the capability to map urban areas on large spatial-temporal scales and can precisely pinpoint where human activities are concentrated with low spatial resolution [44]. According to scholars in the field of night light remote sensing, there are two main problems with urban mapping utilizing NTL data. Most studies only take into account impervious surfaces as urban entities. Thus, impervious surfaces were considered as the urban entities in the majority of urban entity mapping research [4,45,46,47,48] although few studies recognized the relevance of urban entity extraction and the ability of NTL to extract urban entities. Though, DMSP-OLS and SNPP-VIIRS act as valuable resources for urban growth monitoring those studies lack prefecture-level cities in China. Thus, the applicability and validity of urban entities derived through NTL are to be analyzed further. Urban mapping in China using NTL is solely upon the short temporal scales based on DMSP and SNPP-VIIRS data except for a few studies [48,49]. But, the accurate, long-term SNPP-VIIRS-like data have the ability to identify, and extract urban growth at prefecture levels.
The study tried to extract and map urban entities in prefecture cities during 2000-2020 from an urban entity perspective using SNPP-VIIRS-Like data from the Harvard Dataverse. The research was organized under five sub-sections listed below. Whereas Section 1 is devoted to explaining the research background and literature survey and Section 2 describes the study area, materials, and methods. Results and findings were thoroughly explained in Section 3 where compression was made between NTL data and other data products like LandScan and HE. In the discussion Section, it was presented the similarities and differences of the key findings with similar research works along with limitations. Section 5 gives the conclusions and future research directions.
2. Materials and Methods
2.1. Study area
There are 336 prefecture-level divisions (Figure 1) in China including 7 prefectures, 299 prefecture-level cities (including four major municipalities), and 30 autonomous prefectures [50]. After merging the administrative districts and using 2019 as the base year, 336 prefecture cities were chosen as the experimental object. For the analysis purpose, these prefecture cities were categorized into seven groups upon provincial coverage as north, northeast, northwest, east, central, south, and southwest prefectures. For result validation purposes 270 prefectures (Figure 1c) were selected upon the availability of socioeconomic data of extracted urban entities considering 2000 as the base year. Using prefecture-level cities as the research unit made sense for the investigation because of two unique characteristics. While municipal districts, counties, and county-level cities are administrative units inside prefecture-level cities that are geographically closer and have a comparable political, socioeconomic, and physical environment [51]. And also, these territories also have internal connections and independence [52]. But, these units connect the province and county levels as bridges that coordinate the development policies, programs, and plans vise-verse [51].
2.2. Materials
Newly generated SNPP-VIIRS-like data from 2000 to 2020 was primarily used as the major data source to extract urban entities in prefecture cities that are available as open-source data in Harvard Dataverse [53]. These data can nicely eliminate saturation and overflow effect. When compared to DMSP-OLS-like data, the integrated SNPP-VIIRS and DMSP-OLS data can support as a consistent data source and act as extended SNPP-VIIRS-like data. Based on the DMSP-OLS data, NPP-VIIRS-like data was generated using cross-sensor calibration from 2000 to 2012, and the corrected SNPP-VIIRS data from 2013 to 2020 was used as consistent NTL data for the study.
The rationality assessment of the extracted urban entities was done using population data of the LandScan data can be available from Oak Ridge National Laboratory developed using multi-source data. Another justification for using those data for the study was LandScan provides a more accurate assessment of day and night populations as well as population distribution on different impervious surfaces [54]. LandScan has also been extensively used for urban area verification at various spatial scales [37,39].
To compare the urban entities with artificial impervious extents MODIS Land Cover Type version 6 (MODIS) data products as the first reference. Since MODIS is a frequently used data set for urban mapping which was developed from supervised classifications and post-processing [55] the data were used as one of reference for verification of urban areas that are produced from SNPP-VIIRS-like data [39].
As a second reference urban built-up areas (HE) data products proposed by He et al. [48] were used. With 90.9% overall accuracy and 0.47% kappa these data are freely available in National Tibetan Plateau Data Center and datasets have developed through a fully convolutional network by using multi-source remote sensing data and effective to represent built-up areas with long time series.
Additional remote sensing data on Landsat and Globeland were downloaded from the USGS earth explorer and Globeland data server. The open street map (OSM) was used to extract the road networks. Spatial data on national, provincial, and prefecture administrative boundaries were obtained from the National Geomatics Center of China. The nature of the spatial data sources of the study was presented in Table 1. China City statistical yearbook was used to collect statistical data on urban GDP in prefecture cities for the years 2000, 2005, 2010, 2015, and 2020 [55].
2.3. Methods
The study was conducted using the various methods depicted in (Figure 2). To extract urban entities between 2000 and 2020, K-means unsupervised classification was used after downloading the SNPP-VIIRS-like data. Secondly, image post-processing was done to increase the accuracy of the urban entity products that were retrieved. After accuracy assessments were conducted by verifying the level of overall accuracy (OA) and kappa coefficient rationality assessment was conducted to compare urban entities with other urban products and socioeconomic data. Below are further details on the k-means classification and image post-processing methods.
2.3.1. Extracting urban entities using the K-means classification
Due to different brightness values for various urban forms, the threshold method cannot extract the boundaries of urban entities effectively. The mutation detection method also has several requirements to extract different urban areas and boundaries [55]. The K-means algorithm is a classical unsupervised image classification method that provides a fast and efficient procedure to image classification [56]. Compared to other methods K-means algorithm has less uncertainty in the extracted results. The K-means method has been used by several researchers in their previous studies also [39,58,59]. Thus, the K-means algorithm was used to extract urban entities of prefecture cities (2000-2020) using SNPP-VIIRS-like data.
The method was developed to extract urban and non-urban pixels automatically with reasonable zoning. Although the NTL intensity in urban-rural transition zone has a gradually weakening tendency, the difference in NTL intensity from urban centers to rural hinterlands exhibits a substantial trend [58,59,60]. As a result, by identifying the differences between urban and rural NTL brightness intensities, urban entities can be efficiently retrieved. In the study, a K-means algorithm was used to identify urban entities by identifying the variation in NTL intensity. The algorithm divided the datasets of n (here it is n=2) items into k clusters based on distance from urban centers to rural peripheries. The K-means algorithm is frequently utilized for many applications because of the high rate of the uniqueness of the extracted outputs through the straightforward clustering procedure. The method was developed to extract urban and non-urban pixels automatically with reasonable zoning. The calculation formula then is as follows [39].
As per the formula E is the minimum square error of cluster C= {Cl, C2, C3,... Ck} for sample x clustering from the SNPP-VIIRS-like data. The smaller the E value is, the higher the similarity of the samples in the cluster is. is the center of cluster Ci when iterating j+1 times. The Sum of the error square criterion function will be applied in the research for the clustering criteria function as follow [39].
where P represents all pixels in cluster Ci, and Mi is the arithmetic mean of all pixels in cluster Ci. JC is a mapping between data objects and cluster centers. Since JC can reflect the error of clustering results of classification it is essential to identify the clustering results that can reduce JC. The feature types of each pixel in an image were identified using cluster analysis. After the NTL images were divided into a series of pixel matrices recognizing a variety of objects when there are clear variations in the real ground. After the k-means clustering iteration built-up and non-built-up areas were separated from the SNPP-VIIRS-like data on a pixel scale and color variations.
2.3.2. Post-processing
Post-processing was done in order to maintain the consistency of the dynamics of urban entities from 2000-2020. The Post-processing procedure followed three main steps. As the first step iterative temporal filtering was performed for binary urban entities that were founded on the theory put forth by He et al. [45] according to which an urban region that emerges in one year will remain in the next. Second, a logical reasoning improvement was conducted to check the irreversible conversion between urban and non-urban areas [56]. The justification for deleting the urban entities less than 2 km2 was that size does not satisfy to perform as an urban area [16,45]. Through these steps, it was tried to obtain more precise and trustworthy urban entity results for prefecture cities in China over the past 20-year period with high spatial and temporal consistency.
3. Results
3.1. Evaluating the Expansion of urban entities from 2000-2020
According to the results, the total urban entities in China prefectures were elevated from 8082 km2 to 74,417 km2 showing a 10.8% growth rate over 20 years. But, urban entity expansion rates and patterns show noticeable variations over seven regions that are in the different socioeconomic and urban development phases (Figure 3). The highest UE growth observed in eastern and southern prefectures was 27,640 km2 and 9340 km2 respectively. The lowest growth can be observed in northeastern (2897 km2) and northwestern (5207 km2) prefectures. In eastern prefectures, Shanghai reported the highest growth from 660 km2 to 2852 km2 from 2000-2020 (Figure 4g). Guangzhou is a rapidly growing prefecture in the southern prefectures (Figure 4m). According to the results, it has expanded from 375 km2 to 1635 km2 during 2000-2020.
In northern prefectures, rapid urban entity expansion was observed in Beijing as it has grown from 783 km2 to 2150 km2 during the concerned period (Figure 4a). From a temporal perspective, some of the capitals like Chongqing, and Chengdu (Figure 5m,n) have shown a rapid expansion rate of 2015 upward. On the contrary, the small provincial capitals like Xining, Lhasa (Figure 5h,l), Haikou, and Hohhot (Figure 4e,o) have illustrated slow urban entity expansion during the entire time period.
3.2. Compare results with the LandScan population and road networks
The majority of research findings related to urban area identification differ in terms of urban definitions [45,60]. Thus, quantitative and visual evaluations were carried out to validate the results because urban entities indicate the concentration of human activity. Due to the fact that urban entities reflect human activities, findings were contrasted with the LandScan population and road network products.
The extracted results of urban entities with existing built-up areas were compared to find parallels and discrepancies. For rationality assessment, 270 prefecture cities were selected upon the availability of data. This essentially helps the reader comprehend how various urban definitions of the urban entity in China are depicted. It was anticipated that by using all of these approaches, the rationality of the urban entity results produced for Chinese prefectures would enhance.
For comparison purposes, the 2015 LandScan data product was categorized into four population density classes: 1-500,500-1000, 1000-1500, and >1500 person/km2. These limits are the optimum threshold to hold urban entities in different stages that avoid unclear urban classifications [16,39]. Thus, a rationality assessment was conducted using four prefecture cities including Shanghai, Beijing, Shenzhen, and Guangzhou. Figure 6 illustrates how urban entities could be captured according to variations in population density of at least 500 person/km2.
It was revealed that a spatial consistency between extracted urban entities with the areas having population density at least >500 person/km2 of LandScan population product within these cities. Although, certain variations were noted between extracted urban entities and LandScan population density product the majority of urban entities in the prefecture cities overlay with a population density more than the minimal threshold class of 500 person/km2. The finding confirmed that extracted urban entities effectively reflect the human activity concentration in urban areas. And also, as shown in (Figure 6l,k), the built-up areas in the Landsat product basically overlay with the urban entities and LandScan population density. But, some areas in Beijing were classified as urban entities even though their population density was less than 500 person/km2 and non-built-up areas in Landsat (Figure 6b,f,j).
In Guangzhou, some detected areas of urban entities with population density >1500 person/km2 are non-built-up areas in Landsat (Figure 6h,l). But, if there are not many human constructions when taking into account the population size, density, and concentrations of human activities, those are the urban entities. These results show that both urban entities and population density are consistent with human activities as a whole. Geographically, the concentration of human activities is associated with the travel patterns of the community. For rationality assessment, a visual comparison between the OSM road network and the urban entities was made using six capitals (Figure 7).
In this context road network of the six provincial capitals overlay with the boundaries of extracted urban entities. It was revealed that road networks perfectly overlapped with the extracted urban entities. It shows that with increasing the road network density NTL intensity was also increased (Figure 7a–c,g–i). Motorways and primary roads can be identified as the medium of interaction among urban entities while secondary and living streets main medium of interaction within the urban entities. At the fringe of urban entities, there is a high spatial consistency with entity boundaries and living and secondary roads, especially in Chongqing, Shanghai, and Beijing (Figure 7d–f). But as small provincial capitals with less population size as well as human activities, it was difficult to identify similar spatial consistency among urban boundaries and living street and other roads in the Hohhot, Haikou, and Lhasa capitals (Figure 7j–l). But as a whole spatial consistency canbe prevalent since SNPP-VIIRS-like data can extract the lights of the automobile at night in the cities as the media of human commuting proving that SNPP-VIIRS-like data basically align with human activities.
3.3. Compare results with the Global urban products
As remote sensing products, MODIS and HE is commonly used global urban products for urban area evaluation and analysis, especially for post-evaluating references. Extracted urban entities (UE) from SNPP-VIIRS-like data were overlaid with two global urban products that reflect the impervious surfaces (MODIS) or urban built-up areas (HE) to verify the rationality of the extracted results from NTL data. As shown in (Figure 8) extracted outputs from urban entities were basically consistent with the total areas of the HE and MODIS in Prefecture cities.
With observing the R2 value not less than 0.5145. Further, it was found that relatively low root-mean-square errors (RMSE not exceed 657. But, it was found that most prefecture cities were positioned at the bottom right of the 1:1 line, showing that total urban entities were generally lower than the total areas derived from the HE and MODIS. To further verify the results of total urban areas derived from UE, HE, and MODIS were calculated from the basis of regions and at the national level (Figure 9).
Overall, it was observed that the total areas of urban entities are normally lower than the total areas detected by MODIS and HE urban areas. But, it could be observed that a relatively stable trend of urban entities changes for all three products; UE, HE, and MODIS within the concerned time period. This inconsistency can occur as a result of excluding some impervious or built-up areas within large patches and urban periphery from SNPP-VIIRS-like data since urban entities were detected not only upon built-up areas but also on the concentration of human activities. The situation is also consistent with the findings of Zhao et al. [49] who indicated urban entities can be shown about 20-45% difference from the impervious surfaces. Urban entities demonstrated relative agreement with LandScan population product with a population density of at least >500/person/km2 in selected prefecture cities of Shanghai, Guangzhou, Shenzhen, and Chengdu (Figure 10).
But, there are some spatial differences also. In Tianjin city, some areas with population density <500 person/km2 were detected as urban areas in three urban products: HE; MODIS; UE (Figure 10d–f). Although, compare with HE and MODIS urban entities have good spatial consistency with LandScan population density. As evident in Guangzhou city HE does not identify the urban patches with population density >500 person/km2 even >1500 person/km2 as urban areas. But, SNPP-VIIRS-like data extracted those small patches also as urban entities (Figure 10g,i). HE and MODIS identified non-populated extents also urban areas as in the case of Chengdu (Figure 10m–o). But, in urban entities, those non-populated areas were excluded from urban areas. The comparison proved that the impervious surfaces are normally greater than the urban entities due to differences in urban object attributes that can be identified by SNPP-VIIRS-like data. These results are consistent with Figure 5 and Figure 6.
Urban entities have higher spatial consistency than HE and MODIS, according to comparisons. Urban entities' overall accuracy (OA) and Kappa were 74.29%-99.34% and 0.22-0.75, respectively. The OA and kappa of HE were 76.05%-97.88% and 0.22-0.59, respectively. For MODIS OA and kappa were 78.69%–97.85% and 0.21-0.65, respectively. Accordingly, compared with other urban references of LandScan population products urban entities can be considered as a more effective product for delineating urban extents that considered the socioeconomic background of urban areas.
4. Discussion
4.1. Efficiency of SNPP-VIIRS-like data for urban mapping
Decision-makers are normally concerned with visual surfaces when they distinguish urban and rural areas in planning and development initiatives. Since human activity surfaces are telling another story apart from the built-up areas and or the peaceful environment when identifying and demarcating urban areas mental pictures are not valid further [45]. As complex and dynamic landscapes urban areas consisted of different spatial features and characteristics. Thus, clear-cut urban boundaries are very difficult to see in reality. When only used said physical features or human activity surface it is very difficult to demarcate urban areas. So, the efficient way is to use a method that integrates both aspects. NTL data and impervious surfaces demonstrate the controversial pictures. Thus, spatial variations could be observed after comparing the NTL data, Globeland 30 product, and landSat8 image for the year 2020 in five provincial capitals (Figure 11). Shi et al. [39] also used the same data products to assess the applicability of NTL data for urban mapping.
It tried to differentiate the gray surface derived from three different products. In Globeland and Landsat8 images, the impervious surfaces are displayed in red or purple color (Figure 11a–j). But in NTL images, the same land cover type is displayed in different colors (Figure 11k–o). This variation occurred in the different perceptions of urban entities. Ma et al. and Zhou et al. [27,62] emphasized that human perceptions are also to be considered when identifying urban areas along with other physical impervious constructions such as road networks and buildings. Shi et al. [39] further indicated that other social sensing data is also to be integrated for accurate urban entity extraction. The lack of long-time series data also affects urban entity extraction. But, NTL data can be used to capture and identified both the geographical extent of human activities and the differences in impervious surfaces [42,51]. Thus, characteristics of urban surfaces such as size, shape, and activities can effectively detect using SNPP-VIIRS-like data with compare to DMSP-OLS data. Most of the previous research was mainly focused on physical surface extraction than human activity surfaces and socioeconomic information [25,63]. But, in a few previous studies, the capability of NTL data to capture human activity surface was highlighted. However, those works also used the built-up area as a boundary demarcation parameter [47,62]. Similar findings were observed by Shi et al. [39] in their global urban entity extraction research performed using SNPP-VIIRS-like data.
4.2. Relationship between urban growth and urban economic development
Previous researchers also have sought to determine how well NTL data can evaluate urban expansion and urban economic development. The correlation between the urban entity and urban GDP was evaluated by Shi et al [39]. Our study extracted urban areas for 270 cities compared with urban GDP during 2000-2020. It tried to find the relationship between urban GDP and derived urban areas: UE, HE, and MODIS. As shown in (Figure 12) all regression passed the significance test (>0.01) of correlation coefficient (R2) values of total urban areas and urban GDP.
During the concerned period R2 value for UE and GDP range from 0.6189-0.7543 (Figure 12a–e). The correlation coefficient between HE and GDP range from 0.5553-0.8532 (Figure 12f–j). The R2 value for MODIS and GDP ranges from 0.4467-0.5840 (Figure 12k–o). Could be identified a strong correlation between the urban entity and urban GDP than MODIS. Though, the R2 value of HE and GDP little higher than UE these results better presented the relationship between urban growth and socioeconomic growth, especially in terms of urban GDP. Shi et al [39] observed that higher correlation between urban entities and GDP than HE and MODIS when they measure the correlation between the urban area and urban GDP growth.
4.3. Applicability of K-Means Classification for urban mapping
The main difference between the previous studies and our study is the urban entity definition approach. In most previous studies NTL data were transformed into impervious surfaces/built-up area data using threshold method and mutation detection [48,64]. Threshold methods have omitted some high-populated areas as urban patches in most prefecture cities. Mutation detection is also a common method that detects urban areas with supporting data. So, considerable misidentifications of urban areas could be observed in most cities from HE, and MODIS products. But, the urban entities extracted using K-means classification in this study can be considered as the type of impervious surface that take into consideration the optimal thresholds of socioeconomic activities since SNPP-VIIRS-like data can reflect the actual distribution of human activities. The advantage of the K-mean is extracting urban areas in a rapid and efficient manner using NTL intensity without additional data. Shi et al [39] also proved that considering pixel characteristics the K-means classification can be used for comparative analysis in any spatiotemporal dimension.
4.4. Limitation and future research direction
Due to the lack of data as the main component of the study rationality assessment was only conducted based on 270 prefecture cities that available socioeconomic data from 2000-2020. And also, due to time and resource constraints, it was not measured the relationship between urban entities and other socioeconomic variables such as urban population, and electricity consumption in the study. Integrating those aspects in future research would be more beneficial for better urban management decisions through investigating urban growth and socioeconomic growth in emerging Asian countries like China.
As a study in a single country, it was not prevalent greater brightness variations over prefecture cities. But, Shi et al. [39] have proved that due to significant brightness variations of NTL data over different continents in different socioeconomic development levels, it is essential to use more realistic and accurate methods for urban entity mapping. In that way, urban areas would be extracted and evaluated more accurately and effectively since brightness variations reflect the different human activity zones in urban areas.
5. Conclusions
The study basically tests the effectiveness of SNPP-VIIRS-like data for the extraction of urban entities of prefecture cities in China during 2000-2020. As one of the advantages updated results of the study would be more useful for future urban area monitoring. The rationality assessment proved that extracted urban entities spatially fit with the LandScan population product and road networks. It further supports to confirm the notion of urban entities reflect the spatial distribution of human activity surface too. In the study, it was further compared the extracted urban entities with the conventional impervious surface and built-up area data as MODIS and HE to delineate the similarities and differences. It also confirmed that urban entities are basically consistent with these data products. Regression results also derived the positive relationship between urban entities and socioeconomic development variables such as urban GDP.
The extracted urban entity results revealed urban areas in China were elevated from 8082 km2 to 74,417 km2 reporting a 10.8% growth rate during the past 20 years. Most provincial capitals including Shanghai, Beijing, and Chongqing have shown considerable growth except for a few small provincial capitals such as Lhasa, and Haikou. Since NTL data brightness thresholds reflect different variations of the global context in future urban mapping research new methods should be applied to derive more realistic urban entities which address the variations of NTL brightness values.
Author Contributions
Conceptualization, K.S., and S.J.; methodology, N.W.; software, N.W; validation, N.W.; formal analysis, N.W.; resources, K.S.; writing—original draft preparation, N.W.; review and editing, S.J.; visualization, N.W.; supervision, S.J.; funding acquisition, S.J. All authors have read and agreed to the published version of the manuscript.
Funding
This research was funded by Chongqing Social Science Planning Project (No. 2020PY28), and Natural Science Foundation of Chongqing (No. CSTB2022NSCQ-MSX0336).
Acknowledgments
Authors express gratitude to the anonymous reviewers and editors for their valuable comments provided on improving the quality of the manuscript. The authors are grateful to the Earth Observation Group, National Tibetan Plateau Data Center, U.S. Geological Survey (USGS), and Oak Ridge National Laboratory for providing DMSP, HE, Landsat, MODIS, Globeland, and LandScan data relevant to the study.
Conflicts of Interest
No potential conflict of interest was reported by the authors.
References
- Habitat, UN. ANNOTATION of the concept of the United Nations Human Settlements Program (UN-HABITAT) project; Russian state scientific research and design institute of Urbanistics: Moscow, Russia, 2006; pp1-14; http://hdl.handle.net/11374/681.
- Thapa, R.B.; Murayama, Y. Examining spatiotemporal urbanization patterns in Katmandu valley, Nepal: remote sensing and spatial metrics approach. Remote sens. 2009, 1, 534–556. [Google Scholar] [CrossRef]
- United Nations, Department of Economic, and Population Division Social Affairs. World urbanization prospects, The 2018 revision; Department of Economic and Social Affairs PD: New York, USA, 2018; pp. 1–126. https://population.un.org/wup/publications/Files/WUP2018-Report.pdf.
- Zhou, Y.; Smith, S. J.; Elvidge, C. D.; Zhao, K.; Thomson, A.; and Imhoff, M.A. Cluster-based method to map urban area from DMSP/OLS nightlights. Remote Sens. Environ. 2014, 147, 173–185. [Google Scholar] [CrossRef]
- Schneider, A.; Mark, A. F.; and Potere. D. Mapping global urban areas using MODIS 500-m data: New methods and datasets based on urban ecoregions. Remote Sens. Environ. 2010, 114(8), 1733–1746. [CrossRef]
- Zhang, Q.; Seto, K.C. Mapping urbanization dynamics at regional and global scales using multi-temporal DMSP/OLS nighttime light data. Remote Sens. Environ. 2011, 115, 2320–2329. [Google Scholar] [CrossRef]
- Fan, J.; Ma, T.; Zhou, C.; Zhou, Y.; Xu, T. Comparative estimation of urban development in China’s cities using socioeconomic and DMSP/OLS night light data. Remote Sens. 2014, 6, 7840–7856. [Google Scholar] [CrossRef]
- Bai, X.; Shi, p.; and Liu, Y. Society: Realizing China’s Urban Dream. Nature 2014, 509 (7499), 158–160. [CrossRef]
- Lu, L.; Zhang, Y.; and Luo, T.T. Difficulties and Strategies in the Process of Population Urbanization: A Case Study in Chongqing of China. The open J. of Soc. Sci. 2014, 2, 90–95. [Google Scholar] [CrossRef]
- Zhang, X.; Liu, L.; Wu, C.; Chen, X.; Gao, Y.; Xie, S.; Zhang, B. Development of a global 30 m impervious surface map using multi-source and multi-temporal remote sensing datasets with the Google Earth Engine platform. Earth Sys. Sci. Data. 2020, 12(3), 1625–48. [Google Scholar] [CrossRef]
- Gong, P.; Li, X.; Wang, J.; Chen, B.; Hu, T.; Liu, X.; Xu, B.; Yang, J.; Wei., Z. Annual maps of global artificial impervious area (GAIA) between 1985 and 2018. Remote Sens. Environ. 2020, 236, 111510. [Google Scholar] [CrossRef]
- Ellison, G.; Edward, L. G.; William, R. K. What causes industry agglomeration? Evidence from coagglomeration patterns. American Eco. Rev. 2010, 100(3), 1195–213. [Google Scholar] [CrossRef]
- Keuschnigg, M. Scaling trajectories of cities. Pro. Nat. Ac. Sci. 2019, 116(28), 13759–13761. [Google Scholar] [CrossRef]
- Lv, Y.; Lin, Z.; Guobiao, Y.; and Xinqi, Z. Detecting the true urban polycentric pattern of Chinese cities in morphological dimensions: A multi-scale analysis based on geospatial big data. Cities. 2021, 116. [Google Scholar] [CrossRef]
- Chen, Z.; Bailang, Y.; Yingjie, H.; Chang, H.; Shi, K.; Jianping, W. Estimating house vacancy rate in metropolitan areas using NPP-VIIRS nighttime light composite data. IEEE J. Sel. Top. Appl. Earth Obs. Remote Sens. 2015, 8(5), 2188–2197. [Google Scholar] [CrossRef]
- Henderson, J.V.; Dzhamilya, N.; and Sebastian, K. Measuring urban economic density. J. Ur. Econ. 2019, 103188. [Google Scholar] [CrossRef]
- Grove, J.; Morgan, M.; Cadenasso, L.; and Steward, T.P. The Baltimore School of urban ecology. Yale University Press. 2015. [Google Scholar]
- Xu, T.; Ma, T.; Zhou, C.; Zhou, Y. Characterizing Spatio-Temporal Dynamics of Urbanization in China Using Time Series of DMSP/OLS Night Light Data. Remote Sens. 2014, 6, 7708–7731. [Google Scholar] [CrossRef]
- Imhoff, M.L.; Lawrence, W. T.; Stutzer, D. C.; and Elvidge, C. D. A technique for using composite DMSP/OLS city lights satellite data to map urban area. Remote Sens. Environ. 1997, 61(3), 361–370. [Google Scholar] [CrossRef]
- Elvidge, C.D.; Baugh, K. E.; Kihn, E. A.; Kroehl, H. W.; and Davis, E. R. Mapping city lights with nighttime data from the DMSP operational line scan system. Photo. Eng. Remote Sens. 1997, 63(6), 727–734. [Google Scholar]
- Small, C.; Francesca, P.; Elvidge, C.D. Spatial analysis of global urban extent from DMSP-OLS night lights. Remote Sens. Environ. 2005, 96(3), 277–291. [Google Scholar] [CrossRef]
- Liu, Z.; He., C.; Zhang, Q.; Huang, Q.; Yang, Y. Extracting the dynamics of urban expansion in China using DMSP-OLS nighttime light data from 1992 to 2008. Landscape Ur. Pl. 2012, 106 (1), 62–72. [CrossRef]
- Ma, T.; Zhou, C.; Tao, P.; Haynie, S.; Fan, J. Quantitative estimation of urbanization dynamics using time series of DMSP/OLS nighttime light data: A comparative case study from China’s cities. Remote Sens. Environ. 2012, 124, 99–107. [Google Scholar] [CrossRef]
- Shi, K.; Huang, C.; Yu, B.; Yin, B.; Huang, Y.; and Wu., J. Evaluation of NPP-VIIRS night-time light composite data for extracting built-up urban areas. Remote Sens. Lett. 2014, 5 (4), 358–366. [Google Scholar] [CrossRef]
- Ma, Q.; He, C.; Wu, J.; Liu, Z.; Zhang, Q.; and Sun, Z. quantifying spatiotemporal patterns of urban impervious surfaces in China: An improved assessment using nighttime light data. Landscape Ur. Pl. 2014, 130, 36–49. [Google Scholar] [CrossRef]
- Xiao, P.; Wang, X.; Feng, X.; Zhang, X.; and Yang, Y. Detecting China’s Urban Expansion over the Past Three Decades Using Nighttime Light Data. IEEE J. Sel. Top. Appl. Earth Obs. remote Sens. 2014, 7(10), 4095–4106. [Google Scholar] [CrossRef]
- Ma, T.; Zhou, Y.; Zhou, C.; Haynie, S.; Pei, T.; Xu, T. Night-time light derived estimation of spatiotemporal characteristics of urbanization dynamics using DMSP/OLS satellite data. Remote Sens. Environ. 2015, 158, 453–464. [Google Scholar] [CrossRef]
- Su, Y et al. A new method for extracting built-up urban areas using DMSP-OLS nighttime stable lights: A case study in the Pearl River Delta, southern China. GI Science Remote Sens. 2015, 52(2), 218–238. [CrossRef]
- Shi, K.; Chen, Y. Shi, K.; Chen, Y.; Yu,B.; Xu,T.; Li, L.; Huang, C.; Liu, R.; Chen, Z.; Wu, J. Urban Expansion and Agricultural Land Loss in China: A Multi-scale Perspective. Sustainability 2016, 8(790), 2–16. [Google Scholar] [CrossRef]
- Ju, Y.; Dronova, I.; Ma, Q.; Zhang, X. Analysis of urbanization dynamics in mainland China using pixel-based night-time light trajectories from 1992 to 2013. Int. J. Remote Sens. 2017, 38(21), 6047–6072. [Google Scholar] [CrossRef]
- Dou, Y.; Zhifeng, L.; He, C.; and Yue, H. Urban Land Extraction Using VIIRS Nighttime Light Data: An Evaluation of Three Popular Methods. Remote Sens. 2017, 9(175), 1–18. [Google Scholar] [CrossRef]
- Liu, Y.; Delahunty, T.; Zhao, N.; and Cao, G. These lit areas are undeveloped: Delimiting China’s urban extents from threshold nighttime light imagery. Int. J. App. Earth Obs. Geoinf. 2016, 50, 39–50. [Google Scholar] [CrossRef]
- Chen, Z.; Yu, B.; Song, W.; Liu, H.; Wu, Q.; Shi, K.; and Wu, J. A New Approach for Detecting Urban Centers and Their Spatial Structure with Nighttime Light Remote Sensing. IEEE Tra. Geosci. Remote Sens. 2017, 55(11), 6305–6319. [Google Scholar] [CrossRef]
- Lin, Z.; Xu, H.S. Monitoring of the Urban Expansion Dynamics in China's East Coast Using DMSP/OLS Nighttime Light Imagery. J. Geo. inf. Sci. 2019, 21(7), 1074–1085. [Google Scholar] [CrossRef]
- Ma, M.; Lang, Q.; Yang, H.; Shi, K.; Ge, W. Identification of Polycentric Cities in China Based on NPP-VIIRS Nighttime Light Data. Remote Sens. 2020, 12(3248), 2–28. [Google Scholar] [CrossRef]
- Zheng, Y.; Zhou, Q.; He, Y.; Wang, C.; Wang, X.; Wang, H. An Optimized Approach for Extracting Urban Land Based on log-Transformed DMSP-OLS Nighttime Light, NDVI, and NDWI. Remote Sens. 2021, 13(766), 1–22. [Google Scholar] [CrossRef]
- Liu, S.; Shi, K.; Wu, Y. Identifying and evaluating suburbs in China from 2012 to 2020 based on SNPP–VIIRS nighttime light remotely sensed data. Int. J. App. Earth Obs. Geo info. 2022, 114(103041), 1–13. [Google Scholar] [CrossRef]
- Zheng, Y.; He, Y.; Zhou, Q.; Wang, H. Quantitative Evaluation of Urban Expansion using NPP-VIIRS Nighttime Light and Landsat Spectral Data. Sus. Cities Soc. 2022, 76(103338), 1–12. [Google Scholar] [CrossRef]
- Shi, K.; Wu, Y.; Liu, S.; Chen, Z.; Huang, C.; and Cui, Y. Mapping and evaluating global urban entities (2000–2020): A novel perspective to delineate urban entities based on consistent nighttime light data. GI Sci. Remote Sens. 2023, 60(1), 1–20. [Google Scholar] [CrossRef]
- Elvidge, C.D.; Baugh, K. E.; Zhizhin, M.; and Hsu, F. Why VIIRS data are superior to DMSP for mapping nighttime lights. Proc. Asia-Pac. Adv. Netw. 2013, 35, 62–69. [Google Scholar] [CrossRef]
- Zheng, Y.; Tang, L.; Wang, H. An improved approach for monitoring urban built-up areas by combining NPP-VIIRS nighttime light, NDVI, NDWI, and NDBI. J. Cleaner Pro. 2021, 328(129488), 1–13. [Google Scholar] [CrossRef]
- Shi, K.; Chang, Z.; Chen, Z.; Wu, J.; Yu, B. Identifying and evaluating poverty using multi-source remote sensing and point of interest (POI) data: A case study of Chongqing, China. J. Cle. Pro 2020, 255(120245). [Google Scholar] [CrossRef]
- Shi, K.; Shen, J.; Wu, Y.; Liu, S.; Li. L. Carbon dioxide (CO2) emissions from the service industry, traffic, and secondary industry as revealed by the remotely sensed nighttime light data. Int. J. Digi. Earth 2021, 14(11), 1514-1527. [CrossRef]
- Elvidge, C. D.; Sutton, P.C.; Ghosh, T.; Tuttle, B.T.; Baugh, K.E.; and Bright, E. A Global Poverty Map Derived from Satellite Data. Com Geo Sci. 2009, 35(8), 1652–1660. [Google Scholar] [CrossRef]
- Hu, X.; Qian, Y.; Pickett, S.T.; and Zhou, W. Urban mapping needs up-to-date approaches to provide diverse perspectives of current urbanization: A novel attempt to map urban areas with nighttime light data. Landscape Ur. Pl 2020, 195(103709). [Google Scholar] [CrossRef]
- Chen, Z.; Yu, B.; Zhou, Y.; Liu, H.; Yang, C.; Shi, K.; and Wu, J. Mapping global urban areas from 2000 to 2012 using time-series nighttime light data and MODIS products. IEEE J. Sel. Top. Appl. Earth Obs. Remote Sens. 2019, 12(4), 1143–1153. [Google Scholar] [CrossRef]
- Zhao, M.; Zhou, Y.; Li, X.; Cao, W.; He, C.; Yu, B.; Li, X.; Elvidge, C.D.; Cheng, W.; Zhou, C. Applications of satellite remote sensing of nighttime light observations: Advances, challenges, and perspectives. Remote Sens. 2019, 11(17), 1971. [Google Scholar] [CrossRef]
- He, C.; Liu, Z.; Gou, S.; Zhang, Q.; Zhang, J.; and Xu, L. Detecting global urban expansion over the last three decades using a fully convolutional network. Environ. Res. Lett. 2019, 14 (3), 034008. [Google Scholar] [CrossRef]
- Zhao, M.; Zhou, Y.; Li, X.; Cheng, W.; Zhou, C.; Ma, T.; Li, M.; and Huang, K. Mapping Urban Dynamics (1992–2018) in Southeast Asia Using Consistent Nighttime Light Data from DMSP and VIIRS. Remote Sens. Environ. 2020, 248. [Google Scholar] [CrossRef]
- National bureau of statistics. China. Statistical year book, China Statistical press: Beijing, China. 2021. http://www.stats.gov.cn/tjsj/ndsj/2021/indexeh.htm.
- Chien, S. S. Prefectures and prefecture-level cities: the political economy of administrative restructuring in China local administration In tradition and changes of sub-national hierarchy, Editor Chung. J.H; and Tao-Chiu L. Routledge. Oxon. UK.2010; pp.127-143.
- Wang, Y.; and Wang, J. (2019). Does industrial agglomeration facilitate environmental performance: New evidence from urban China? J. Environ. Mgt. 2019, 248, 109244. [Google Scholar] [CrossRef]
- Chen, Z.; Yu, B.; Yang, C.; Zhou, Y.; Yao, S.; Qian, X.; Wang, C.; Wu, B.; Wu, J. An extended time series (2000–2018) of global NPP-VIIRS-like nighttime light data from a cross-sensor calibration. Earth Sys. Sci. Data. 2021, 13(3), 889–906. [Google Scholar] [CrossRef]
- Rose, A.N.; and Bright, E. The LandScan Global Population Distribution Project: current state of the art and prospective innovation. In. Technical Report. Oak Ridge National Lab (ORNL), Oak Ridge, TN. USA. 2014.
- Sulla-Menashe, D.; and Friedl, M.A. User Guide to Collection 6 MODIS Land Cover (MCD12Q1 and MCD12C1) Product. USGS. Reston, VA, USA; 2018; pp1-18.
- Li, X.; Gong, P.; and Liang, L.A. 30-year (1984–2013) record of annual urban dynamics of Beijing City derived from Landsat data. Remote Sens. Environ. 2015, 166, 78–90. [Google Scholar] [CrossRef]
- National Bureau of statistics. China. City statistical yearbook. China statistics press; Beijing, China. 2000-2020. https://data.cnki.net/yearBook/single?id=N2022040095.
- Yang, M.; Tan, C.; and Li, W. Spatial Recognition of the Urban-Rural Fringe of Beijing Using DMSP/OLS Nighttime Light Data. Remote Sens. 2017, 9(11), 1141. [Google Scholar] [CrossRef]
- Delmelle, E. C. Five Decades of Neighborhood Classifications and Their Transitions: A Comparison of Four US Cities, 1970–2010. App. Geo. 2015, 57, 1–11. [Google Scholar] [CrossRef]
- Feng, Z.; Peng, J.; and Wu., J. Using DMSP/OLS Nighttime Light Data and K–Means Method to Identify Urban–Rural Fringe of Megacities. Habitat Int. 2020, 103(102227). [Google Scholar] [CrossRef]
- Xie, Y.; Weng, Q.; and Fu, P. Temporal variations of artificial nighttime lights and their implications for urbanization in the conterminous United States, 2013–2017. Remote Sens. Environ. 2019, 225, 160–174. [Google Scholar] [CrossRef]
- Zhou, Y.; Li, X.; Asrar, G.R.; Smith, S.J.; and Imhoff. M. A global record of annual urban dynamics (1992-2013) from nighttime lights. Remote Sens. Environ. 2018, 219, 206-220. [Google Scholar] [CrossRef]
- Levin, N.; Kyba, C.; Zhang, Q.; Miguel, A.S.D.; Román, M.O.; Li, X.; Portnov, B.A.; Molthan, A.L.; Jechow, A.; and Miller, S.D. Remote sensing of night lights: A review and an outlook for the future. Remote Sens. Environ. 2020, 237(111443). [Google Scholar] [CrossRef]
- Xu, Z.; Jiao, L.; Lan, T.; Zhou, Z.; Cui, H.; Li, C.; Xu, G.; and Liu., Y. Mapping Hierarchical Urban Boundaries for Global Urban Settlements. Int. J. App. Earth Obs. Geo info. 2021, 103 (102480). [Google Scholar] [CrossRef]
Figure 1.
(a) Provinces in PR of China; (b) Prefecture divisions; (c) selected prefecture divisions.
Figure 1.
(a) Provinces in PR of China; (b) Prefecture divisions; (c) selected prefecture divisions.
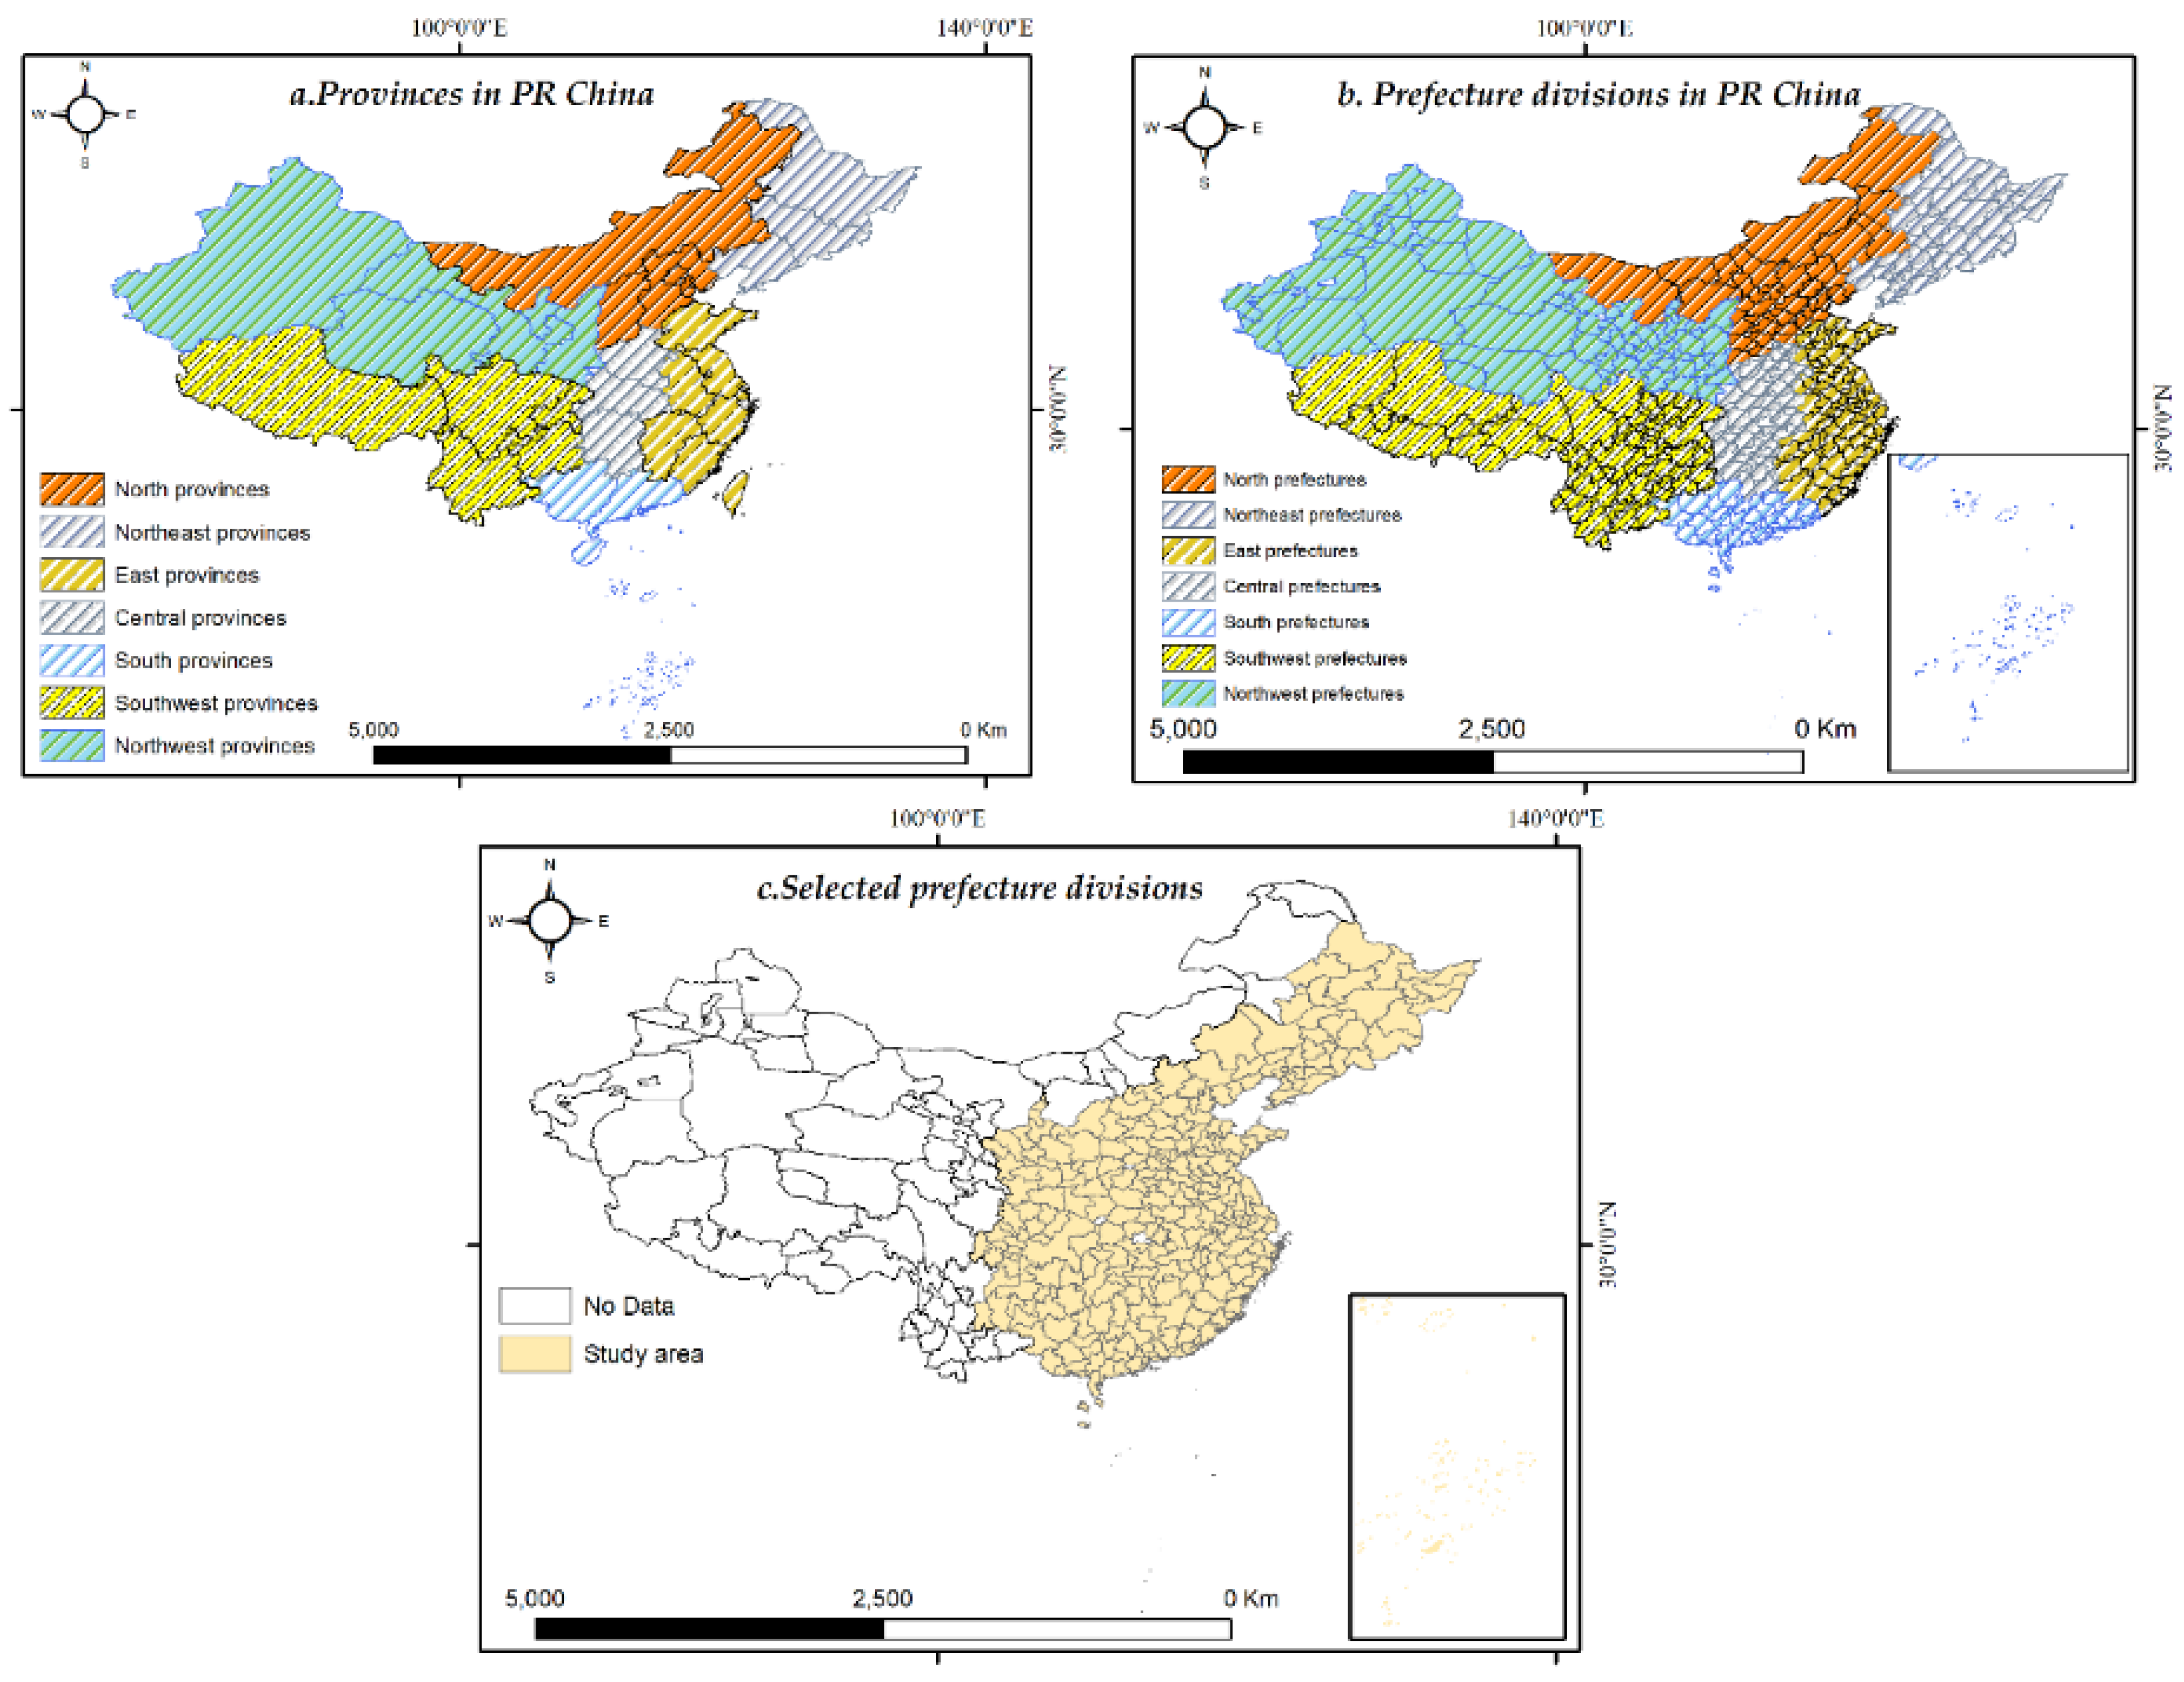
Figure 2.
Methodological flowchart of the study.
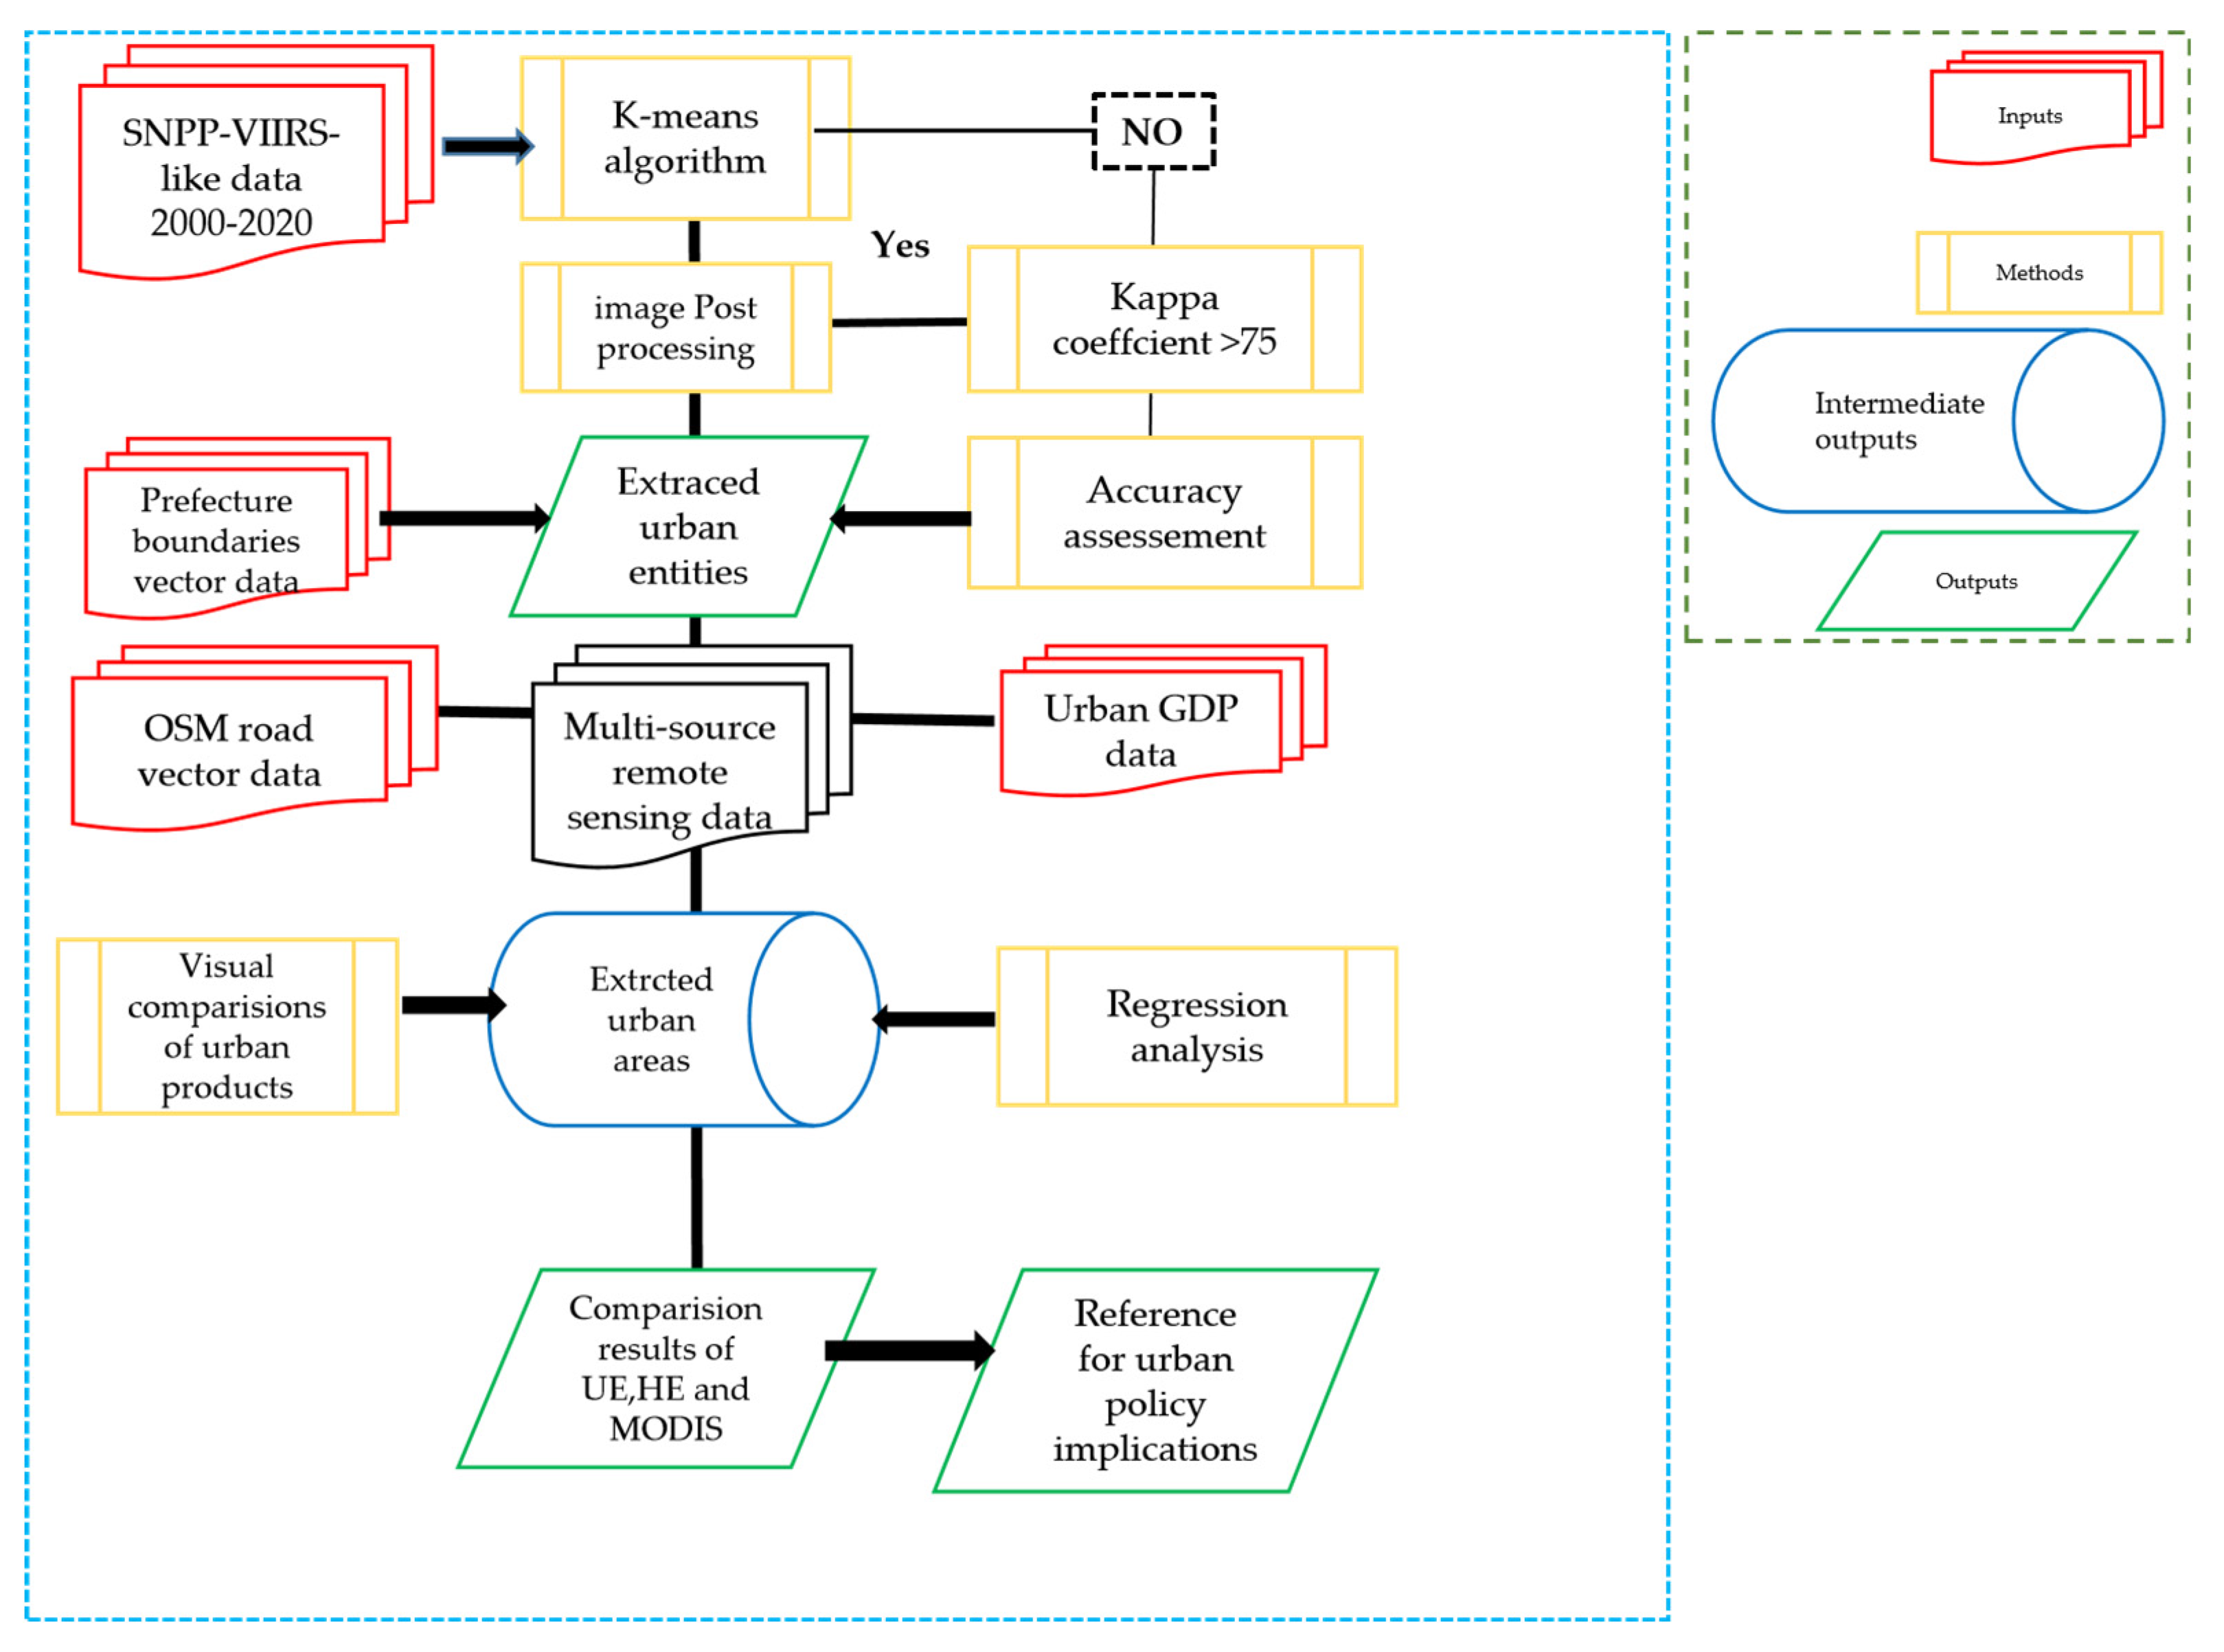
Figure 3.
Growth of UE, HE, and MODIS urban areas during 2000-2020.
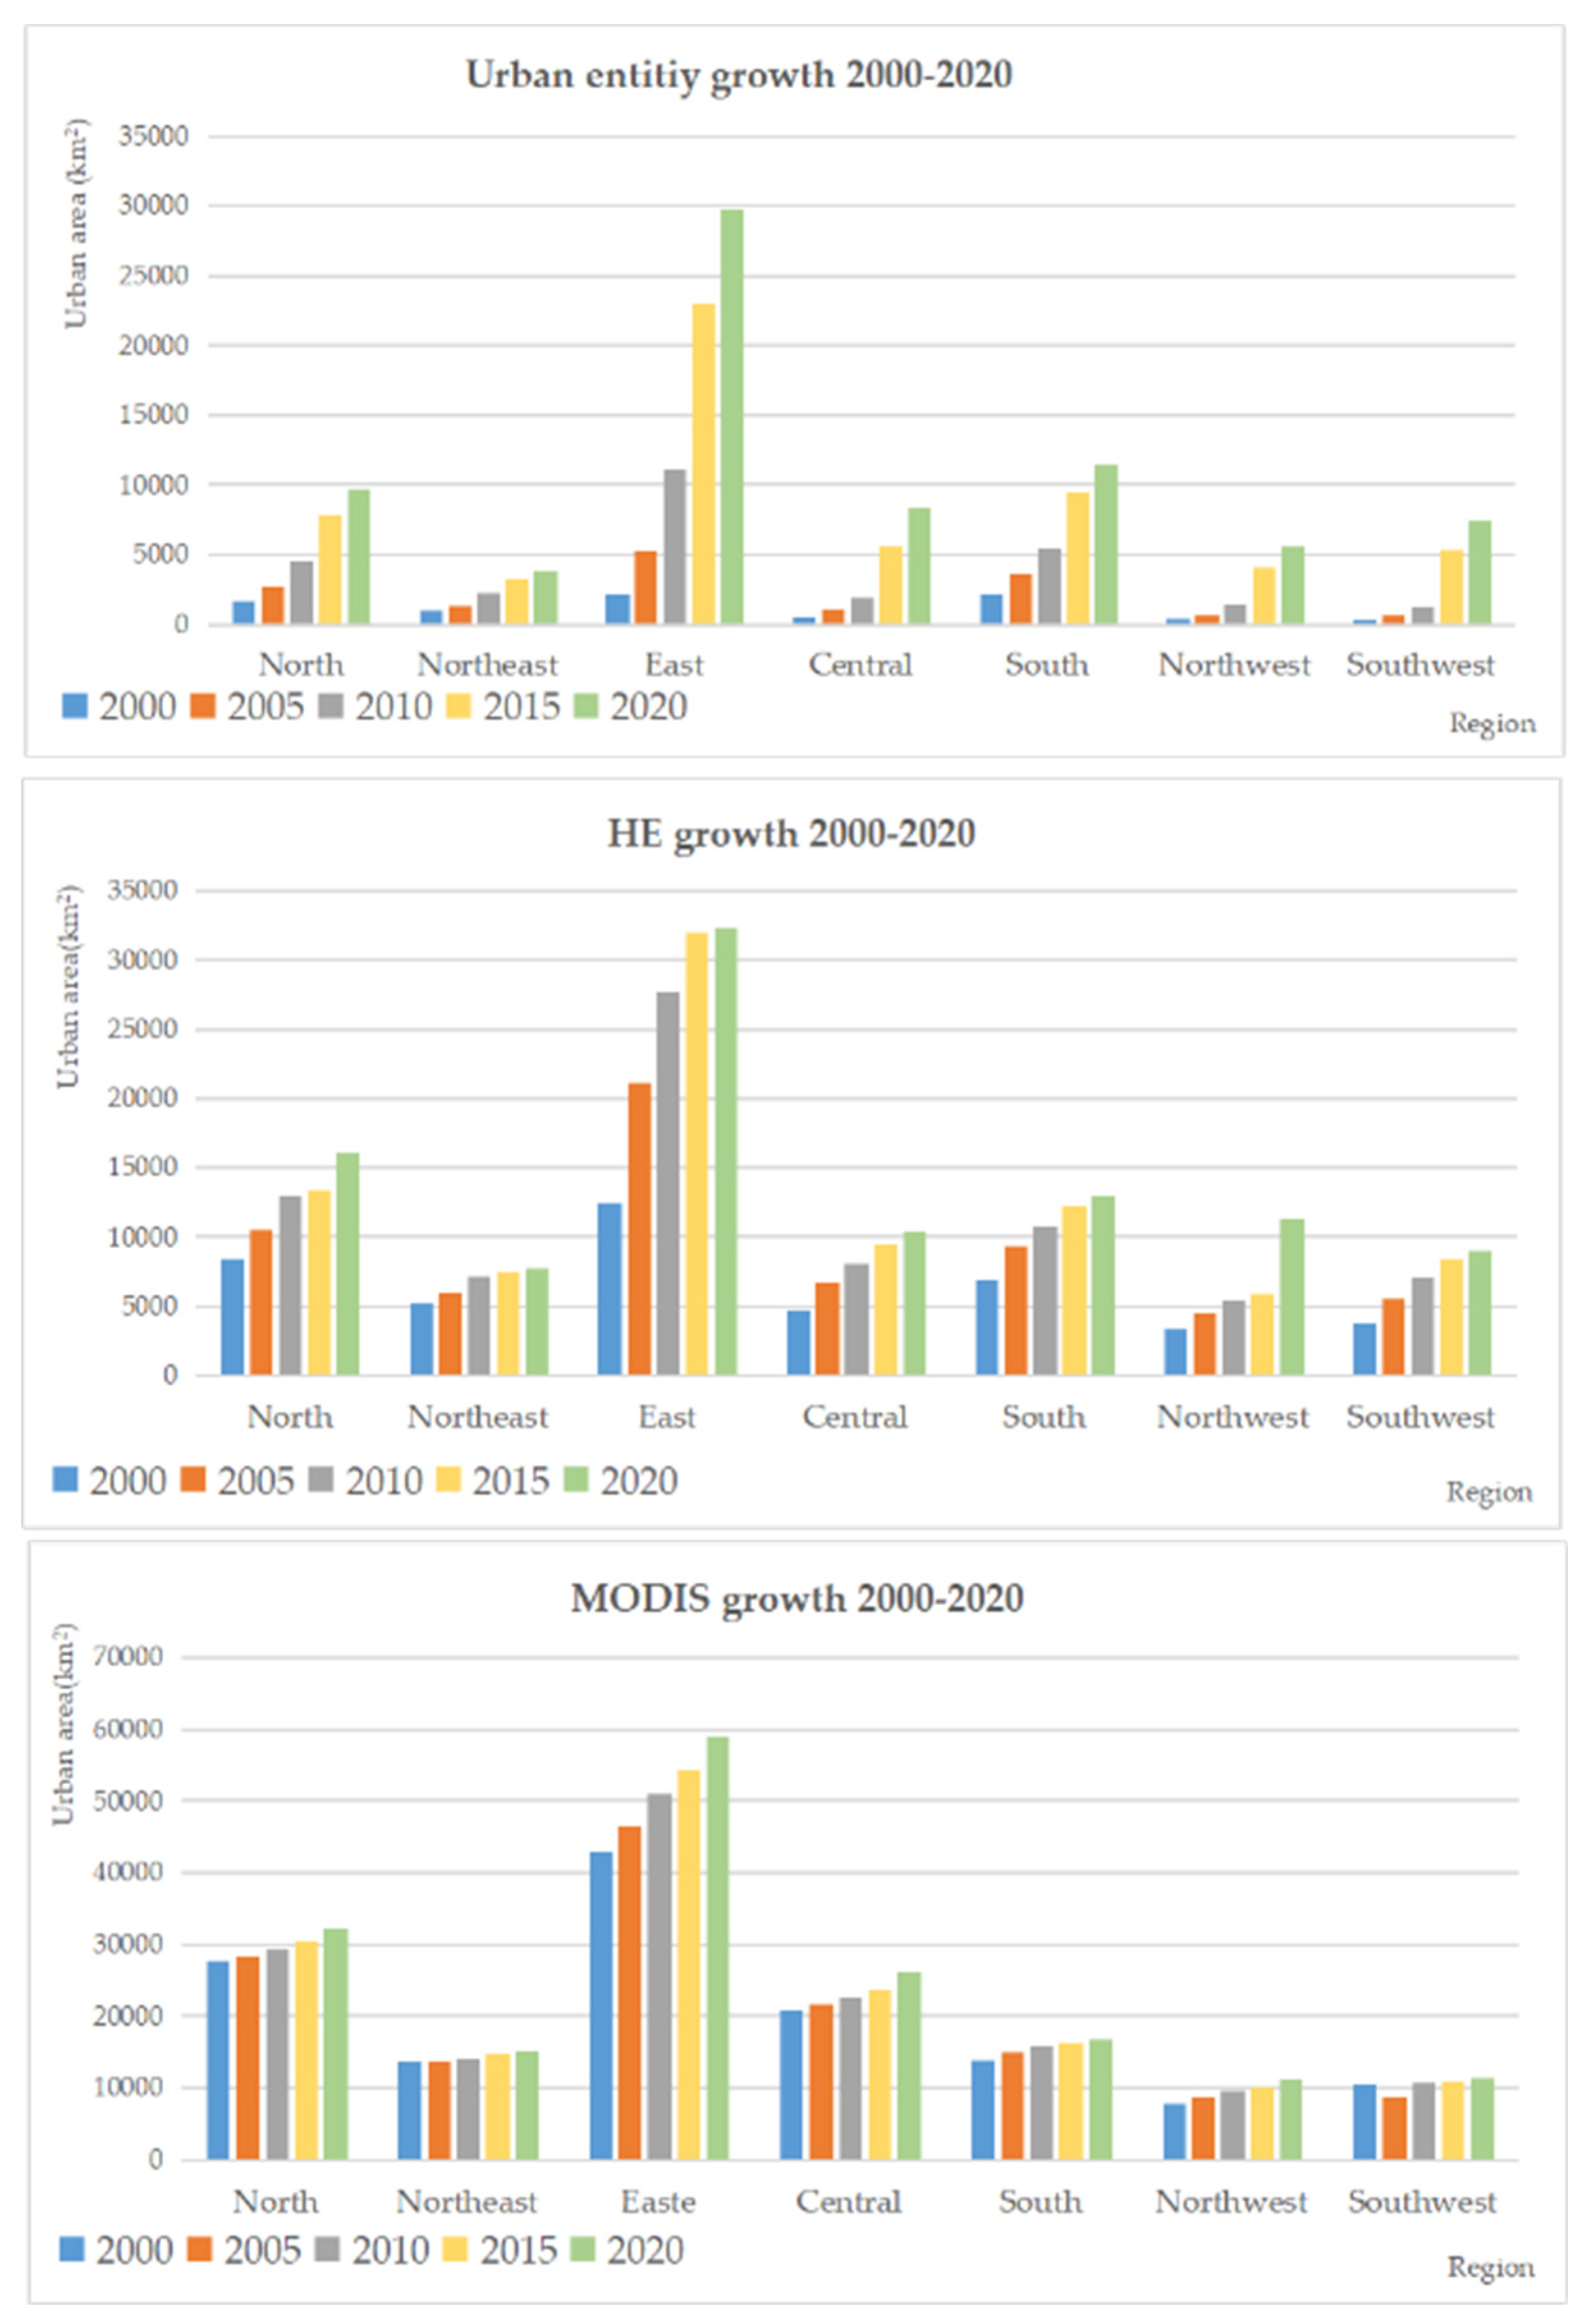
Figure 4.
Expansion of urban entities of capitals in northern, eastern, and southern provinces, 2000-2020.
Figure 4.
Expansion of urban entities of capitals in northern, eastern, and southern provinces, 2000-2020.
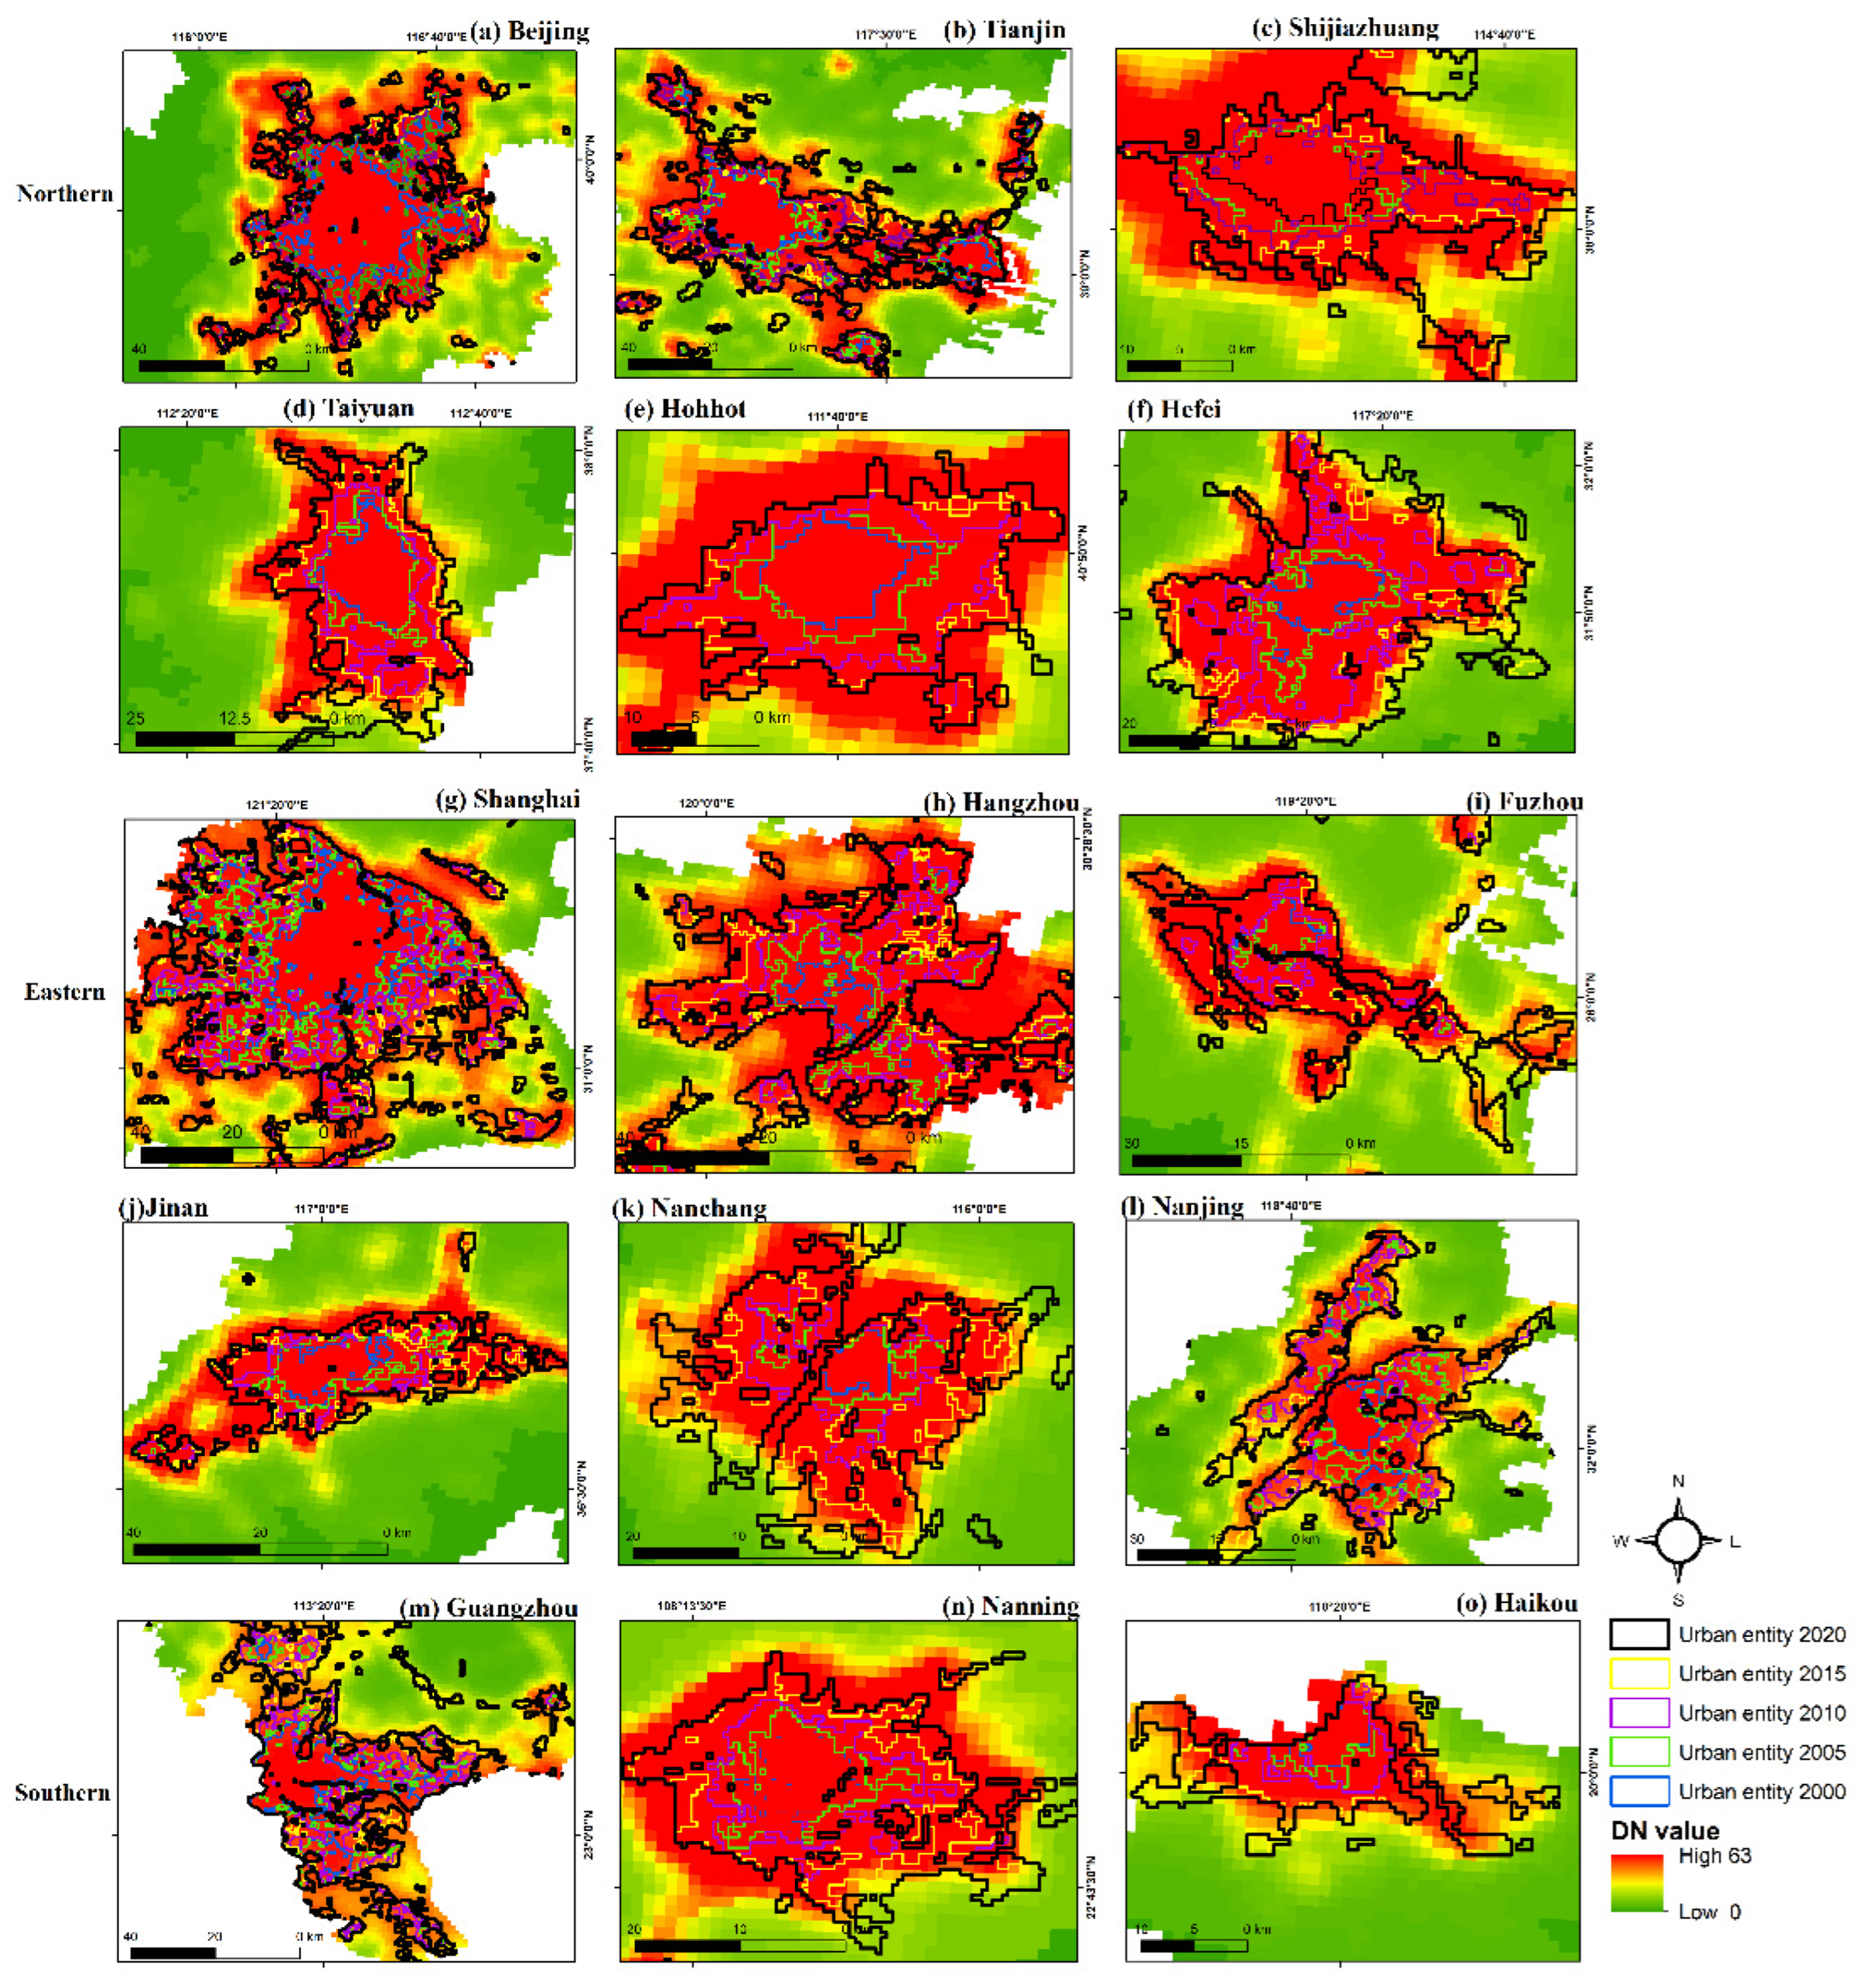
Figure 5.
Expansion of urban entities of capitals in central, northeast, northwest, and southwest provinces, 2000-2020.
Figure 5.
Expansion of urban entities of capitals in central, northeast, northwest, and southwest provinces, 2000-2020.
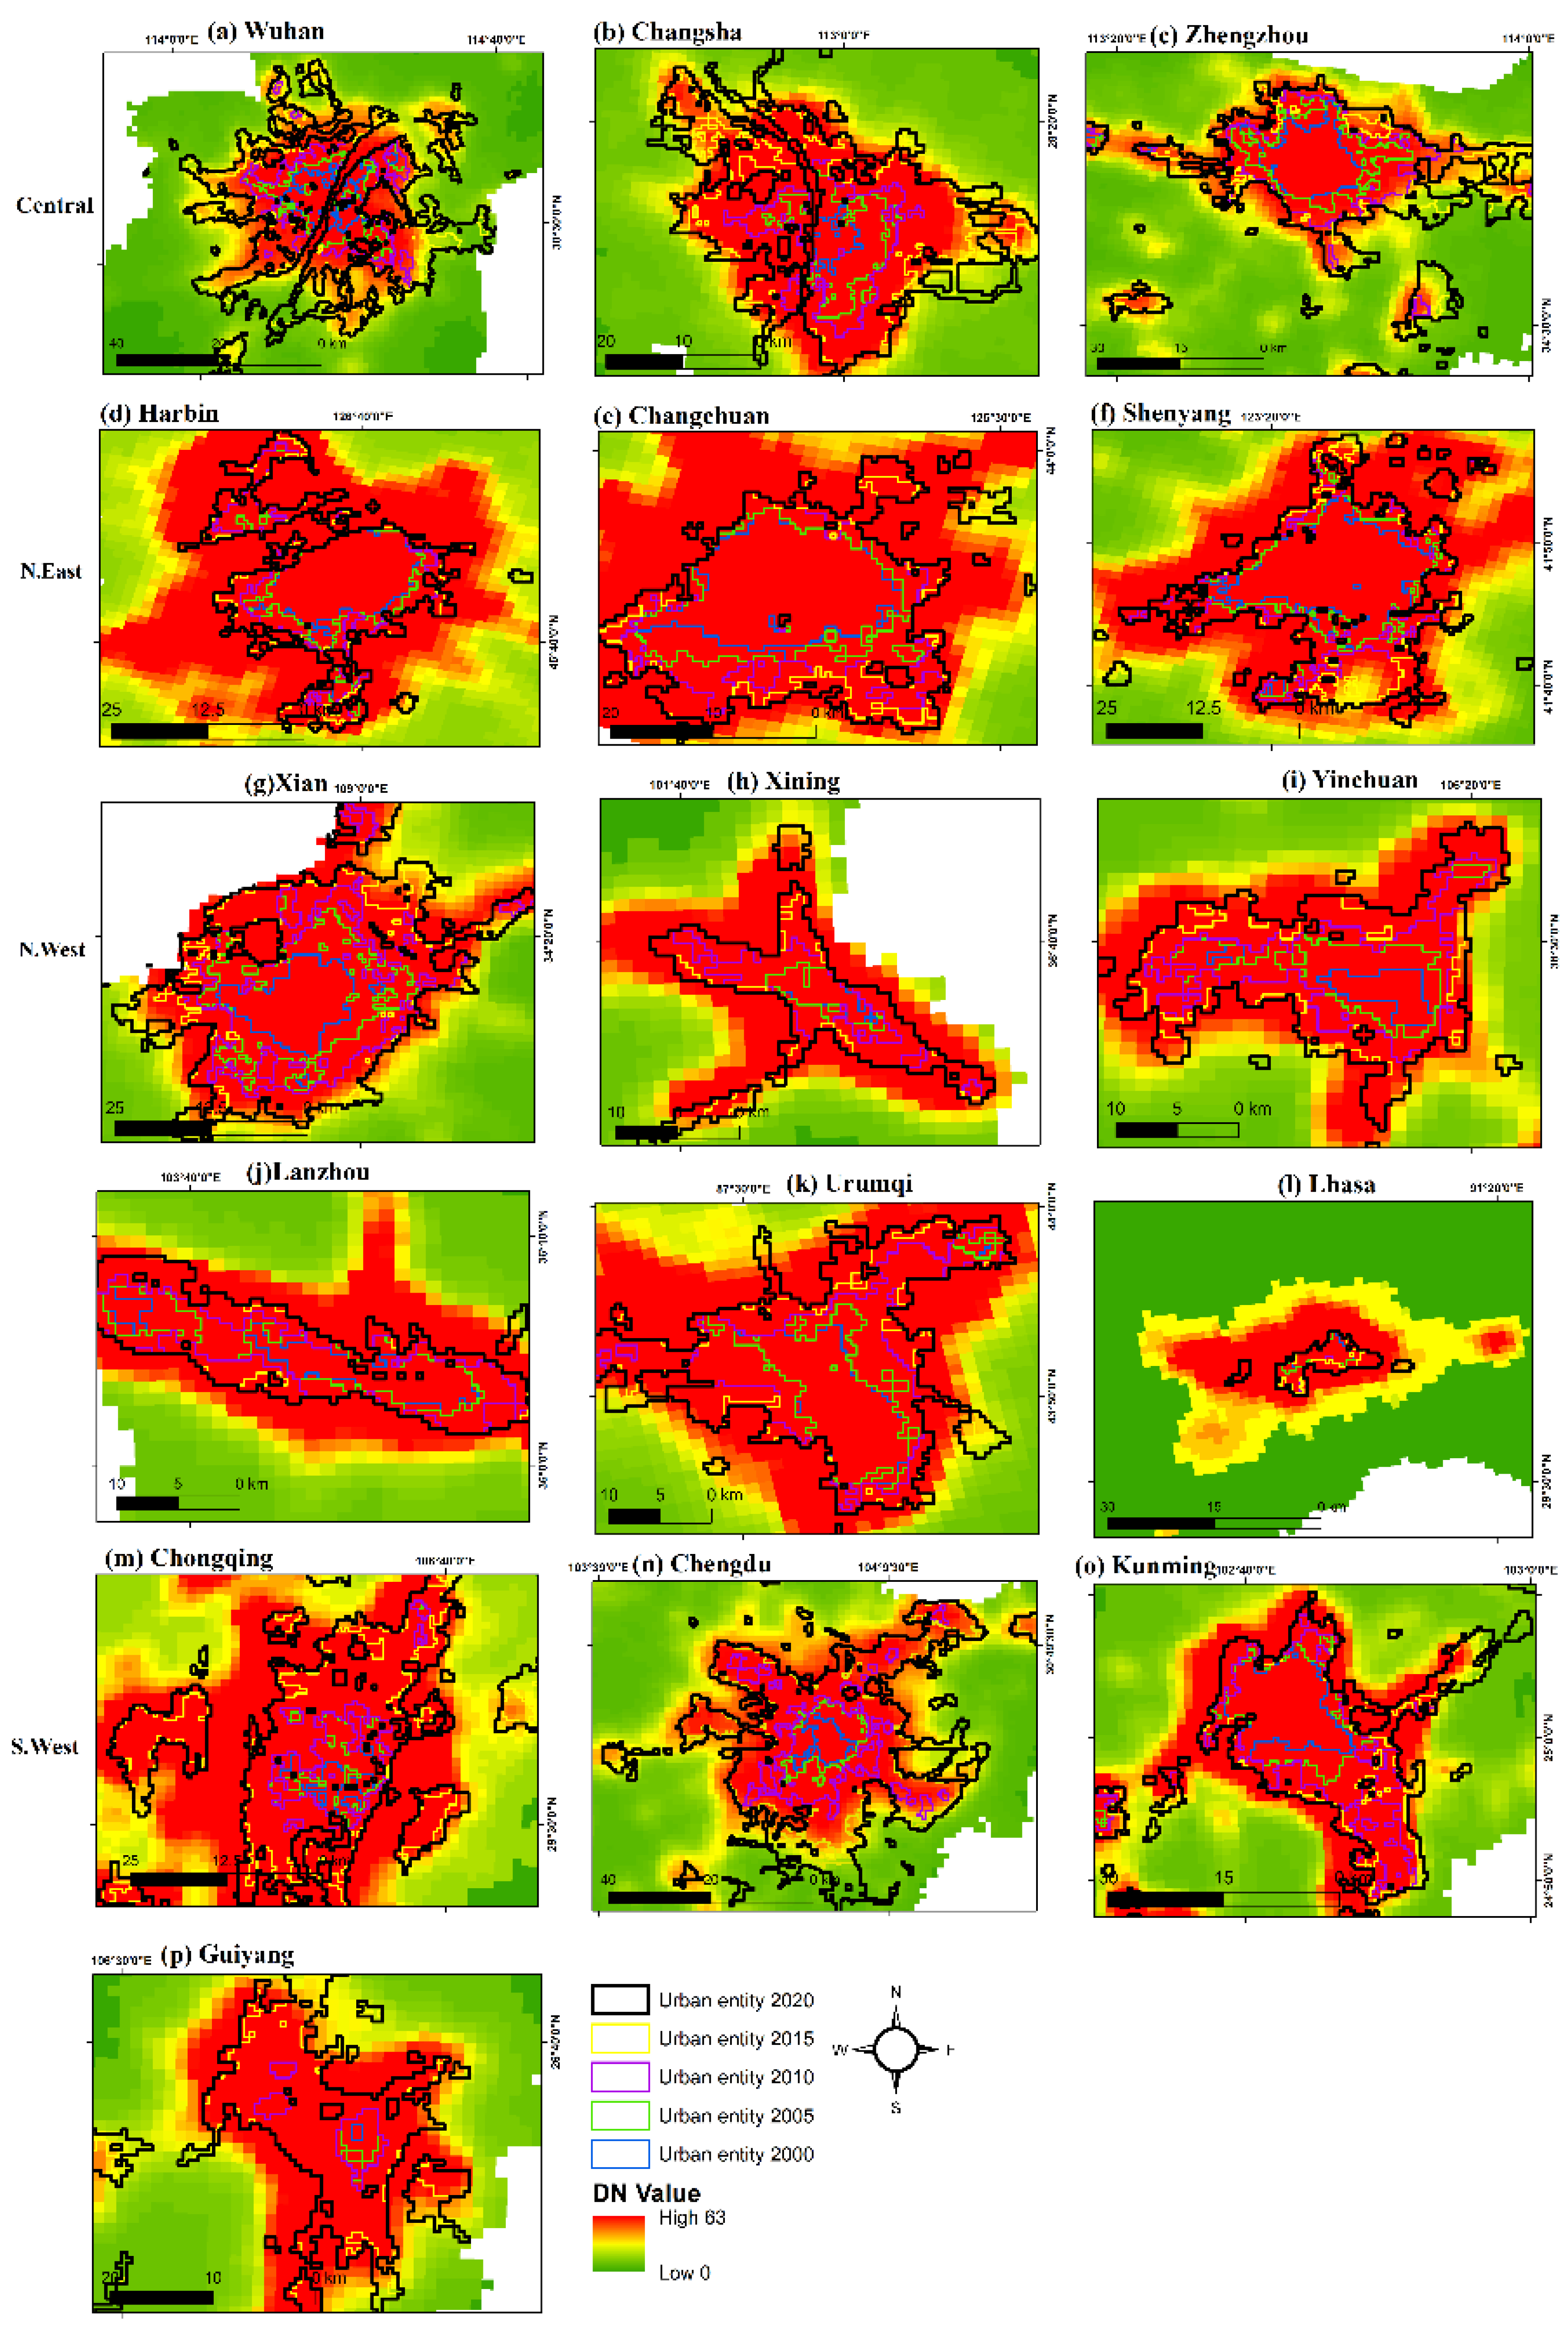
Figure 6.
Extracted urban entities (a) Shanghai; (b) Beijing; (c) Shenzhen; (d) Guangzhou with LandScan product and Landsat8 images, 2015.
Figure 6.
Extracted urban entities (a) Shanghai; (b) Beijing; (c) Shenzhen; (d) Guangzhou with LandScan product and Landsat8 images, 2015.
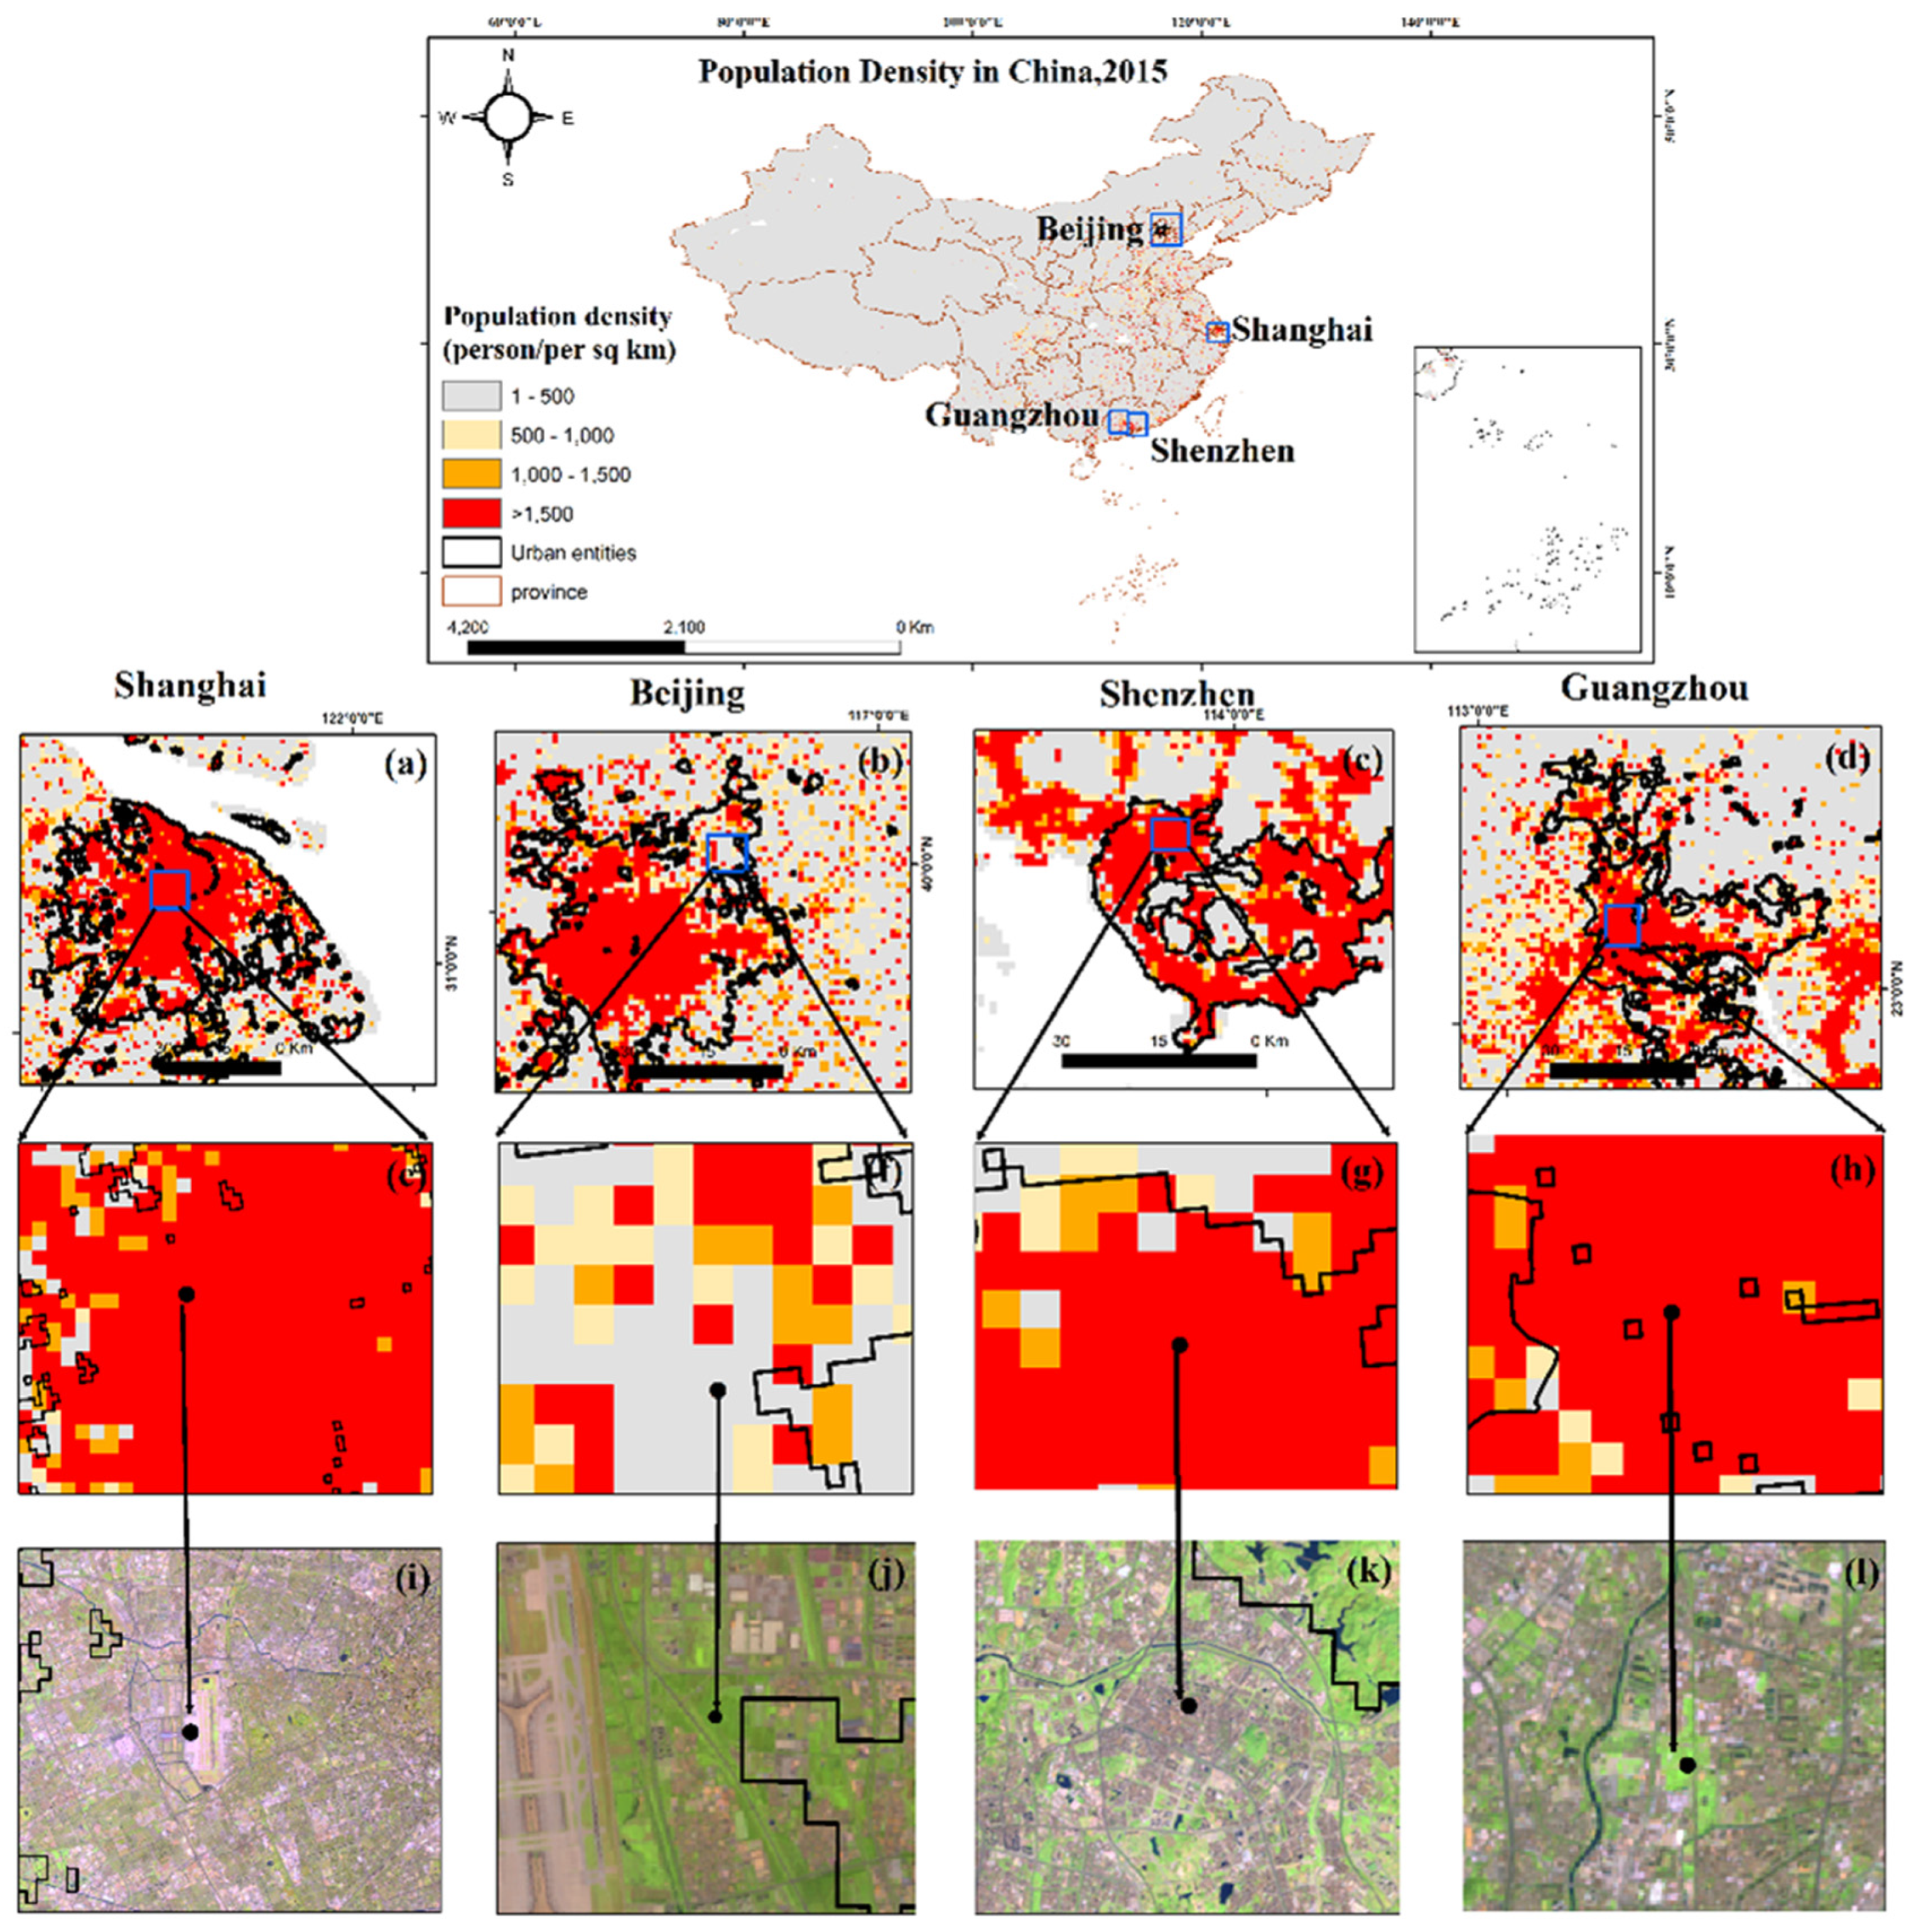
Figure 7.
Extracted urban entities of six provincial capitals with OSM road networks, 2015.
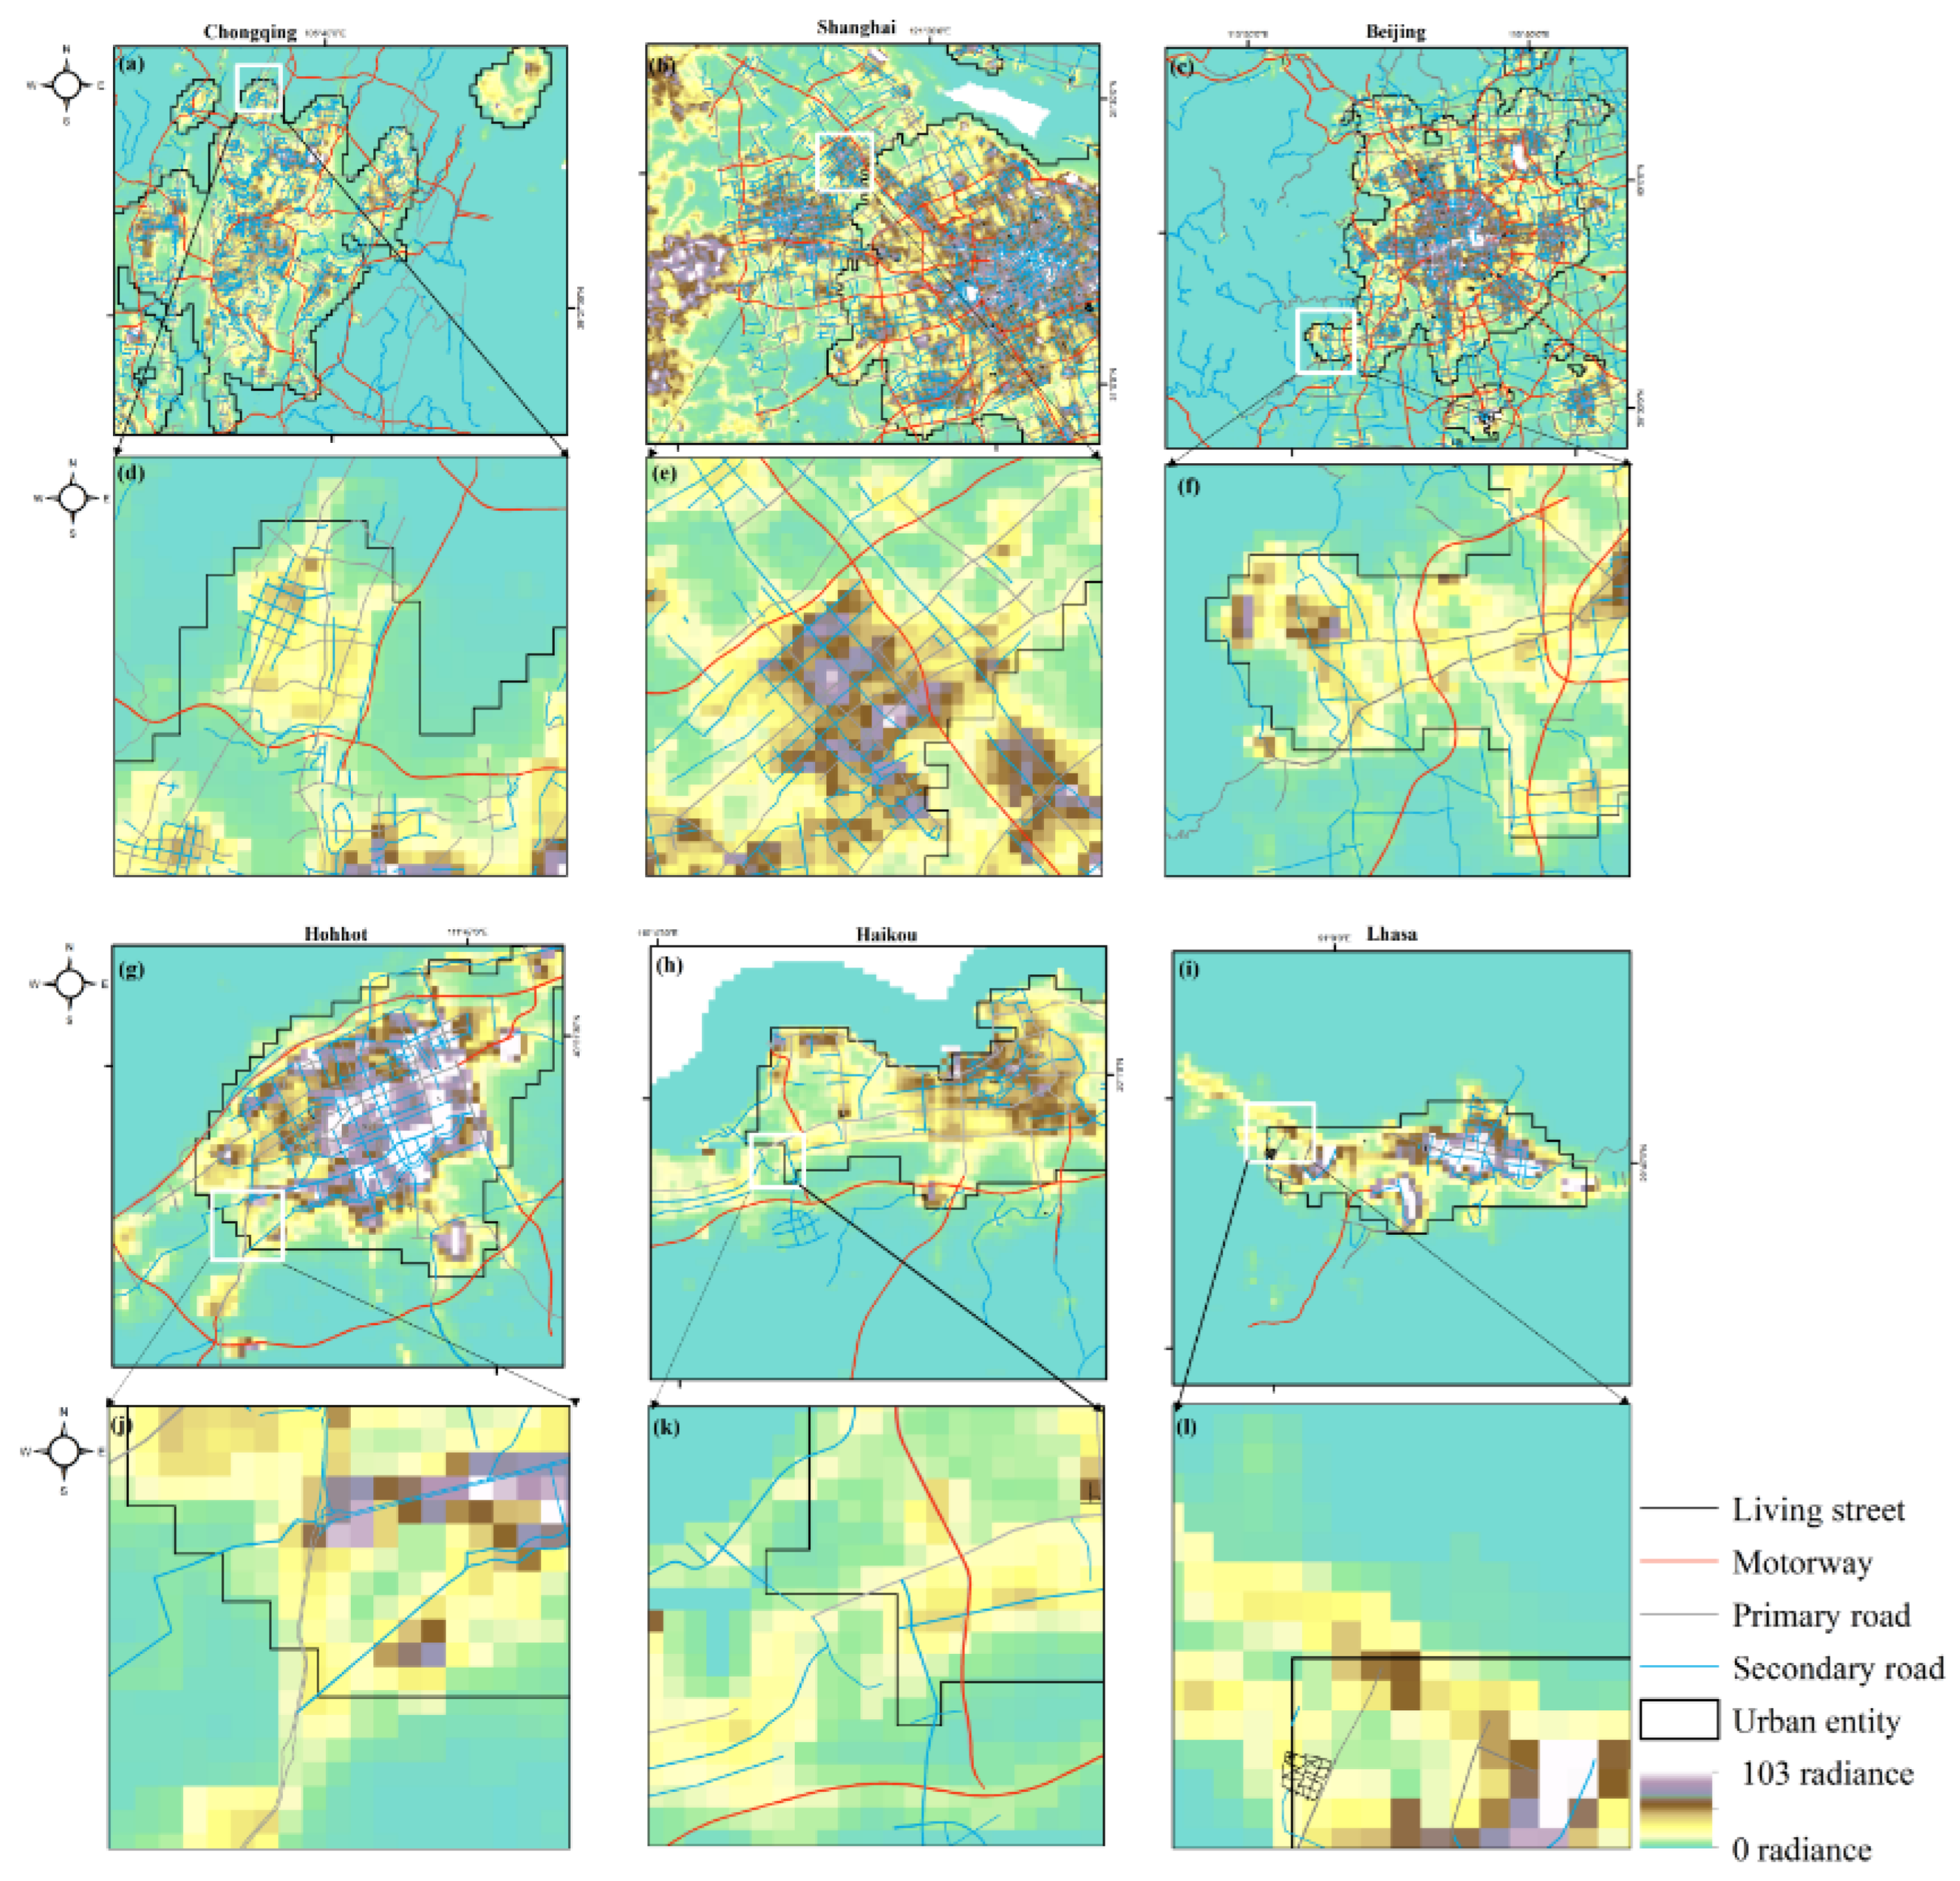
Figure 8.
Regression results of total urban areas of UE, HE, and MODIS from 2000-2020.
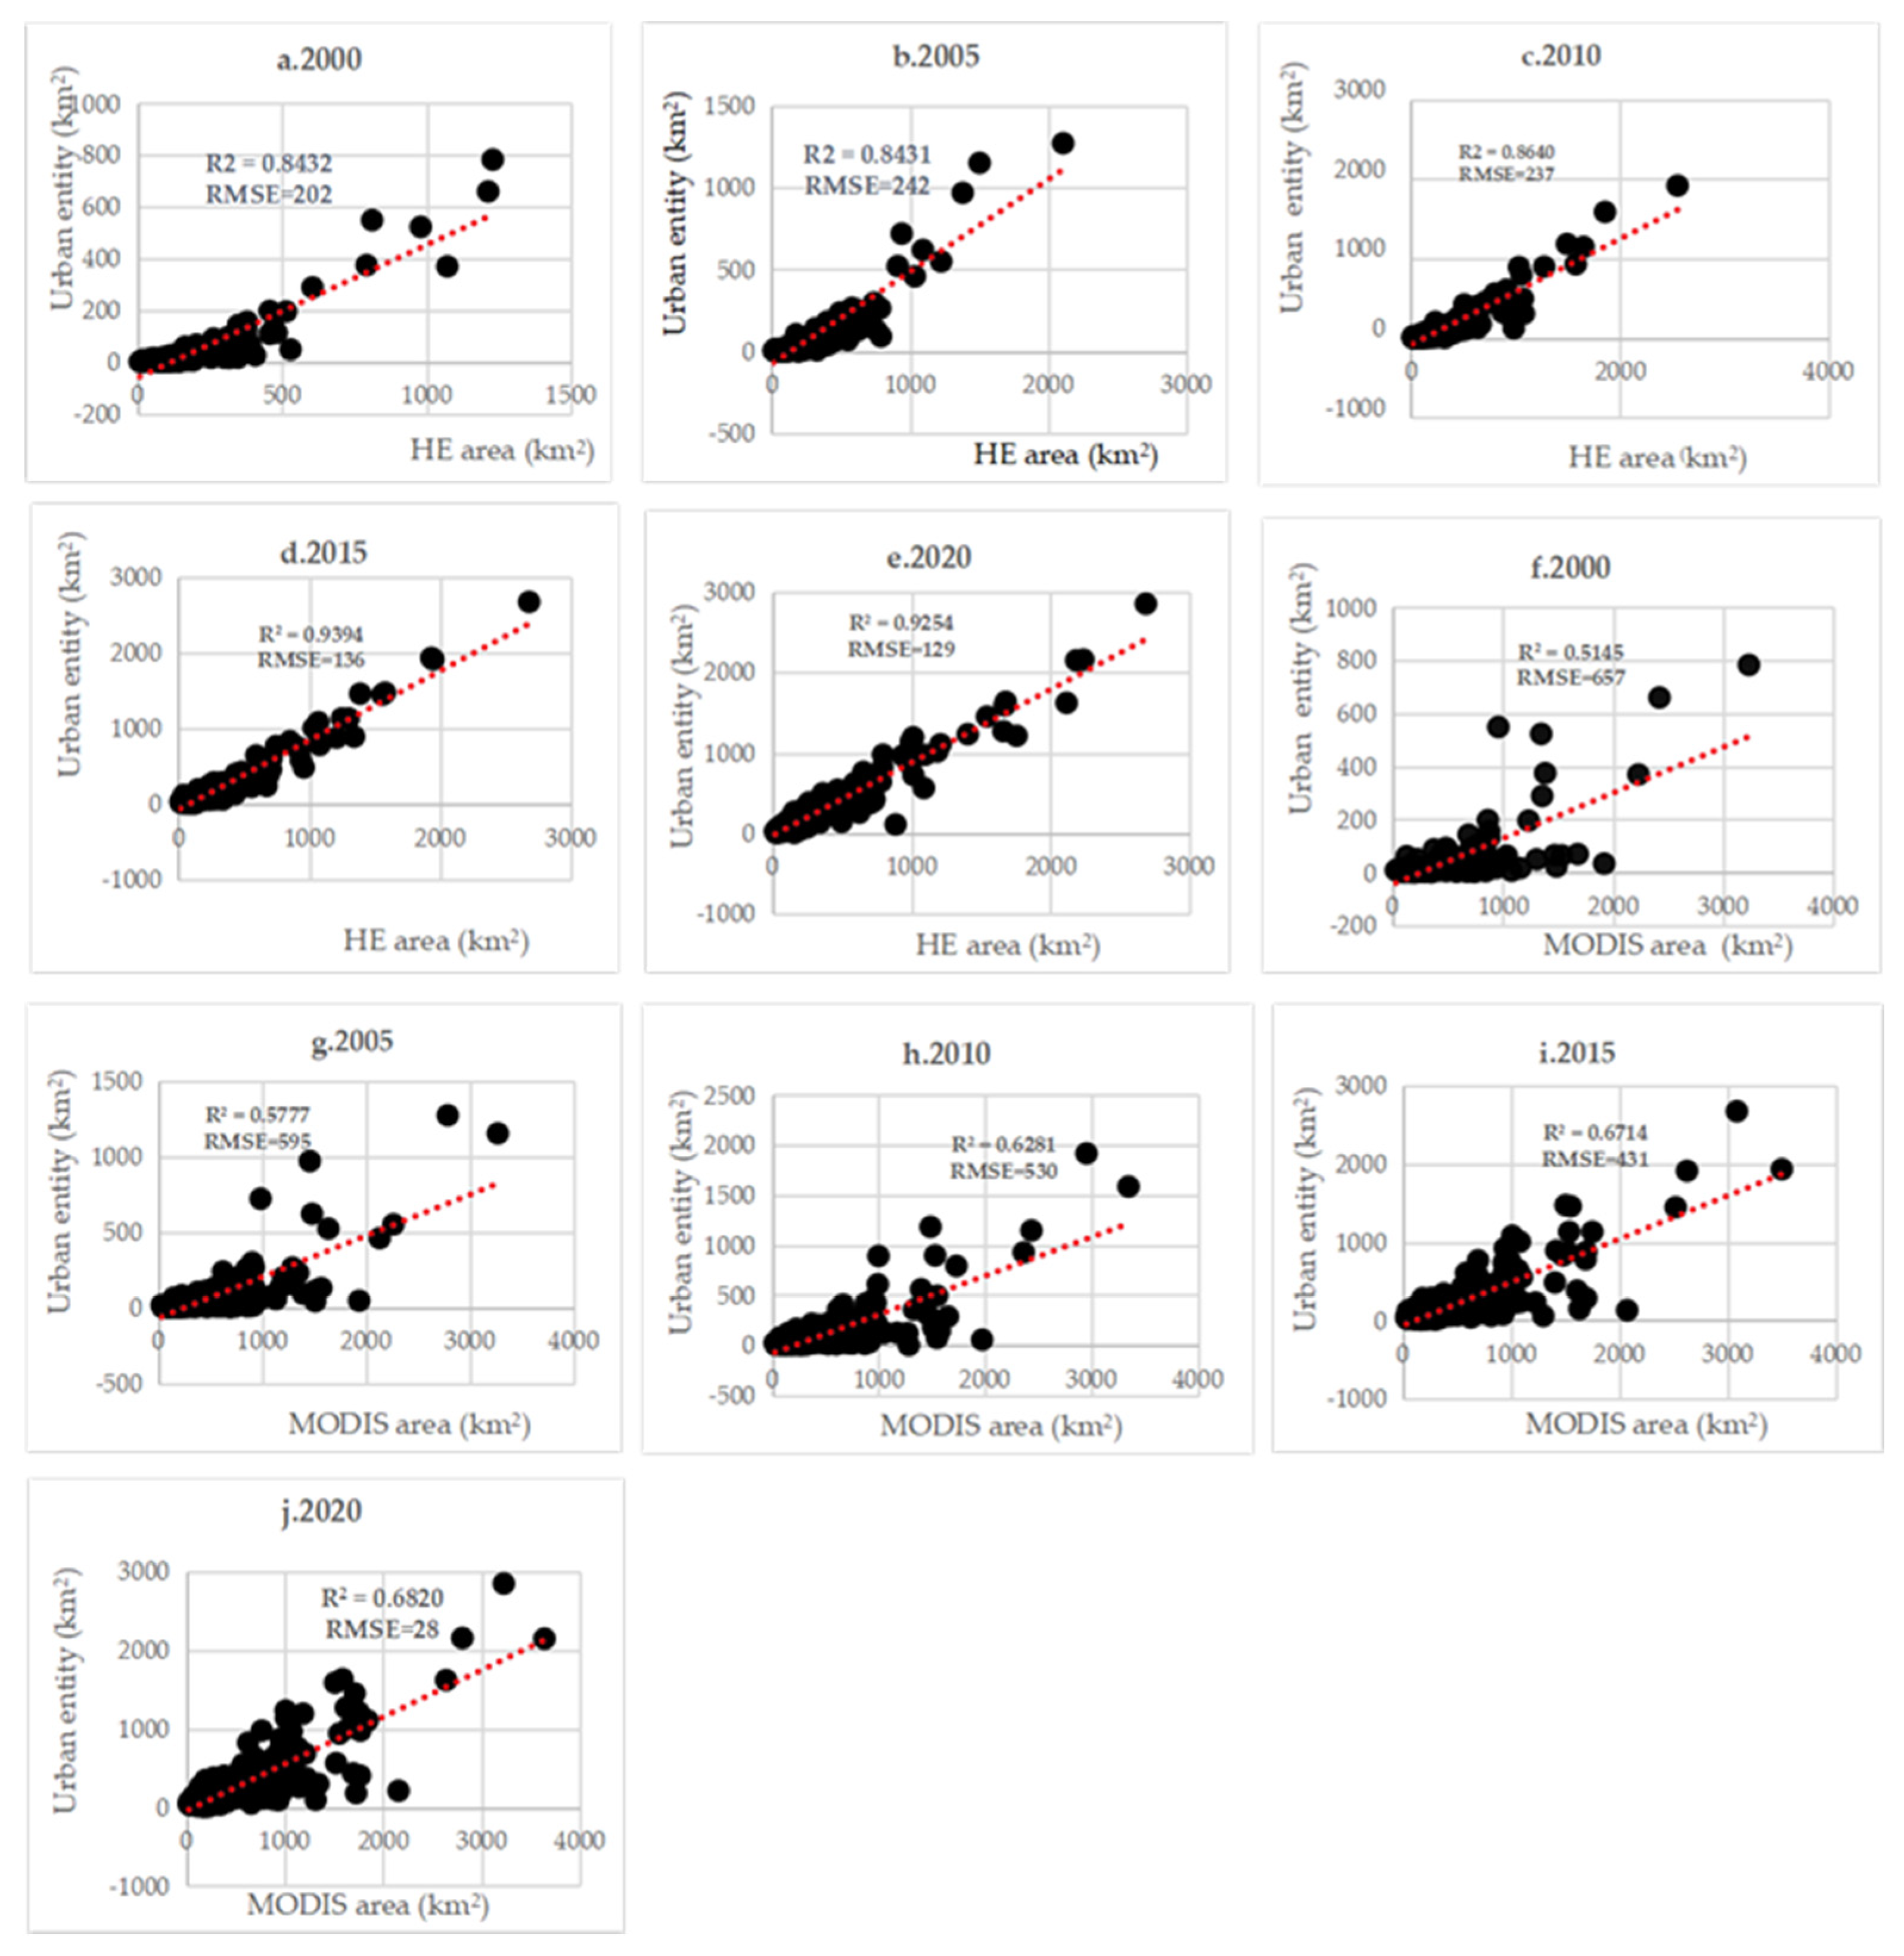
Figure 9.
Comparison results of urban areas for UE, HE, MODIS on provincial, and, national levels, 2000-2020.
Figure 9.
Comparison results of urban areas for UE, HE, MODIS on provincial, and, national levels, 2000-2020.
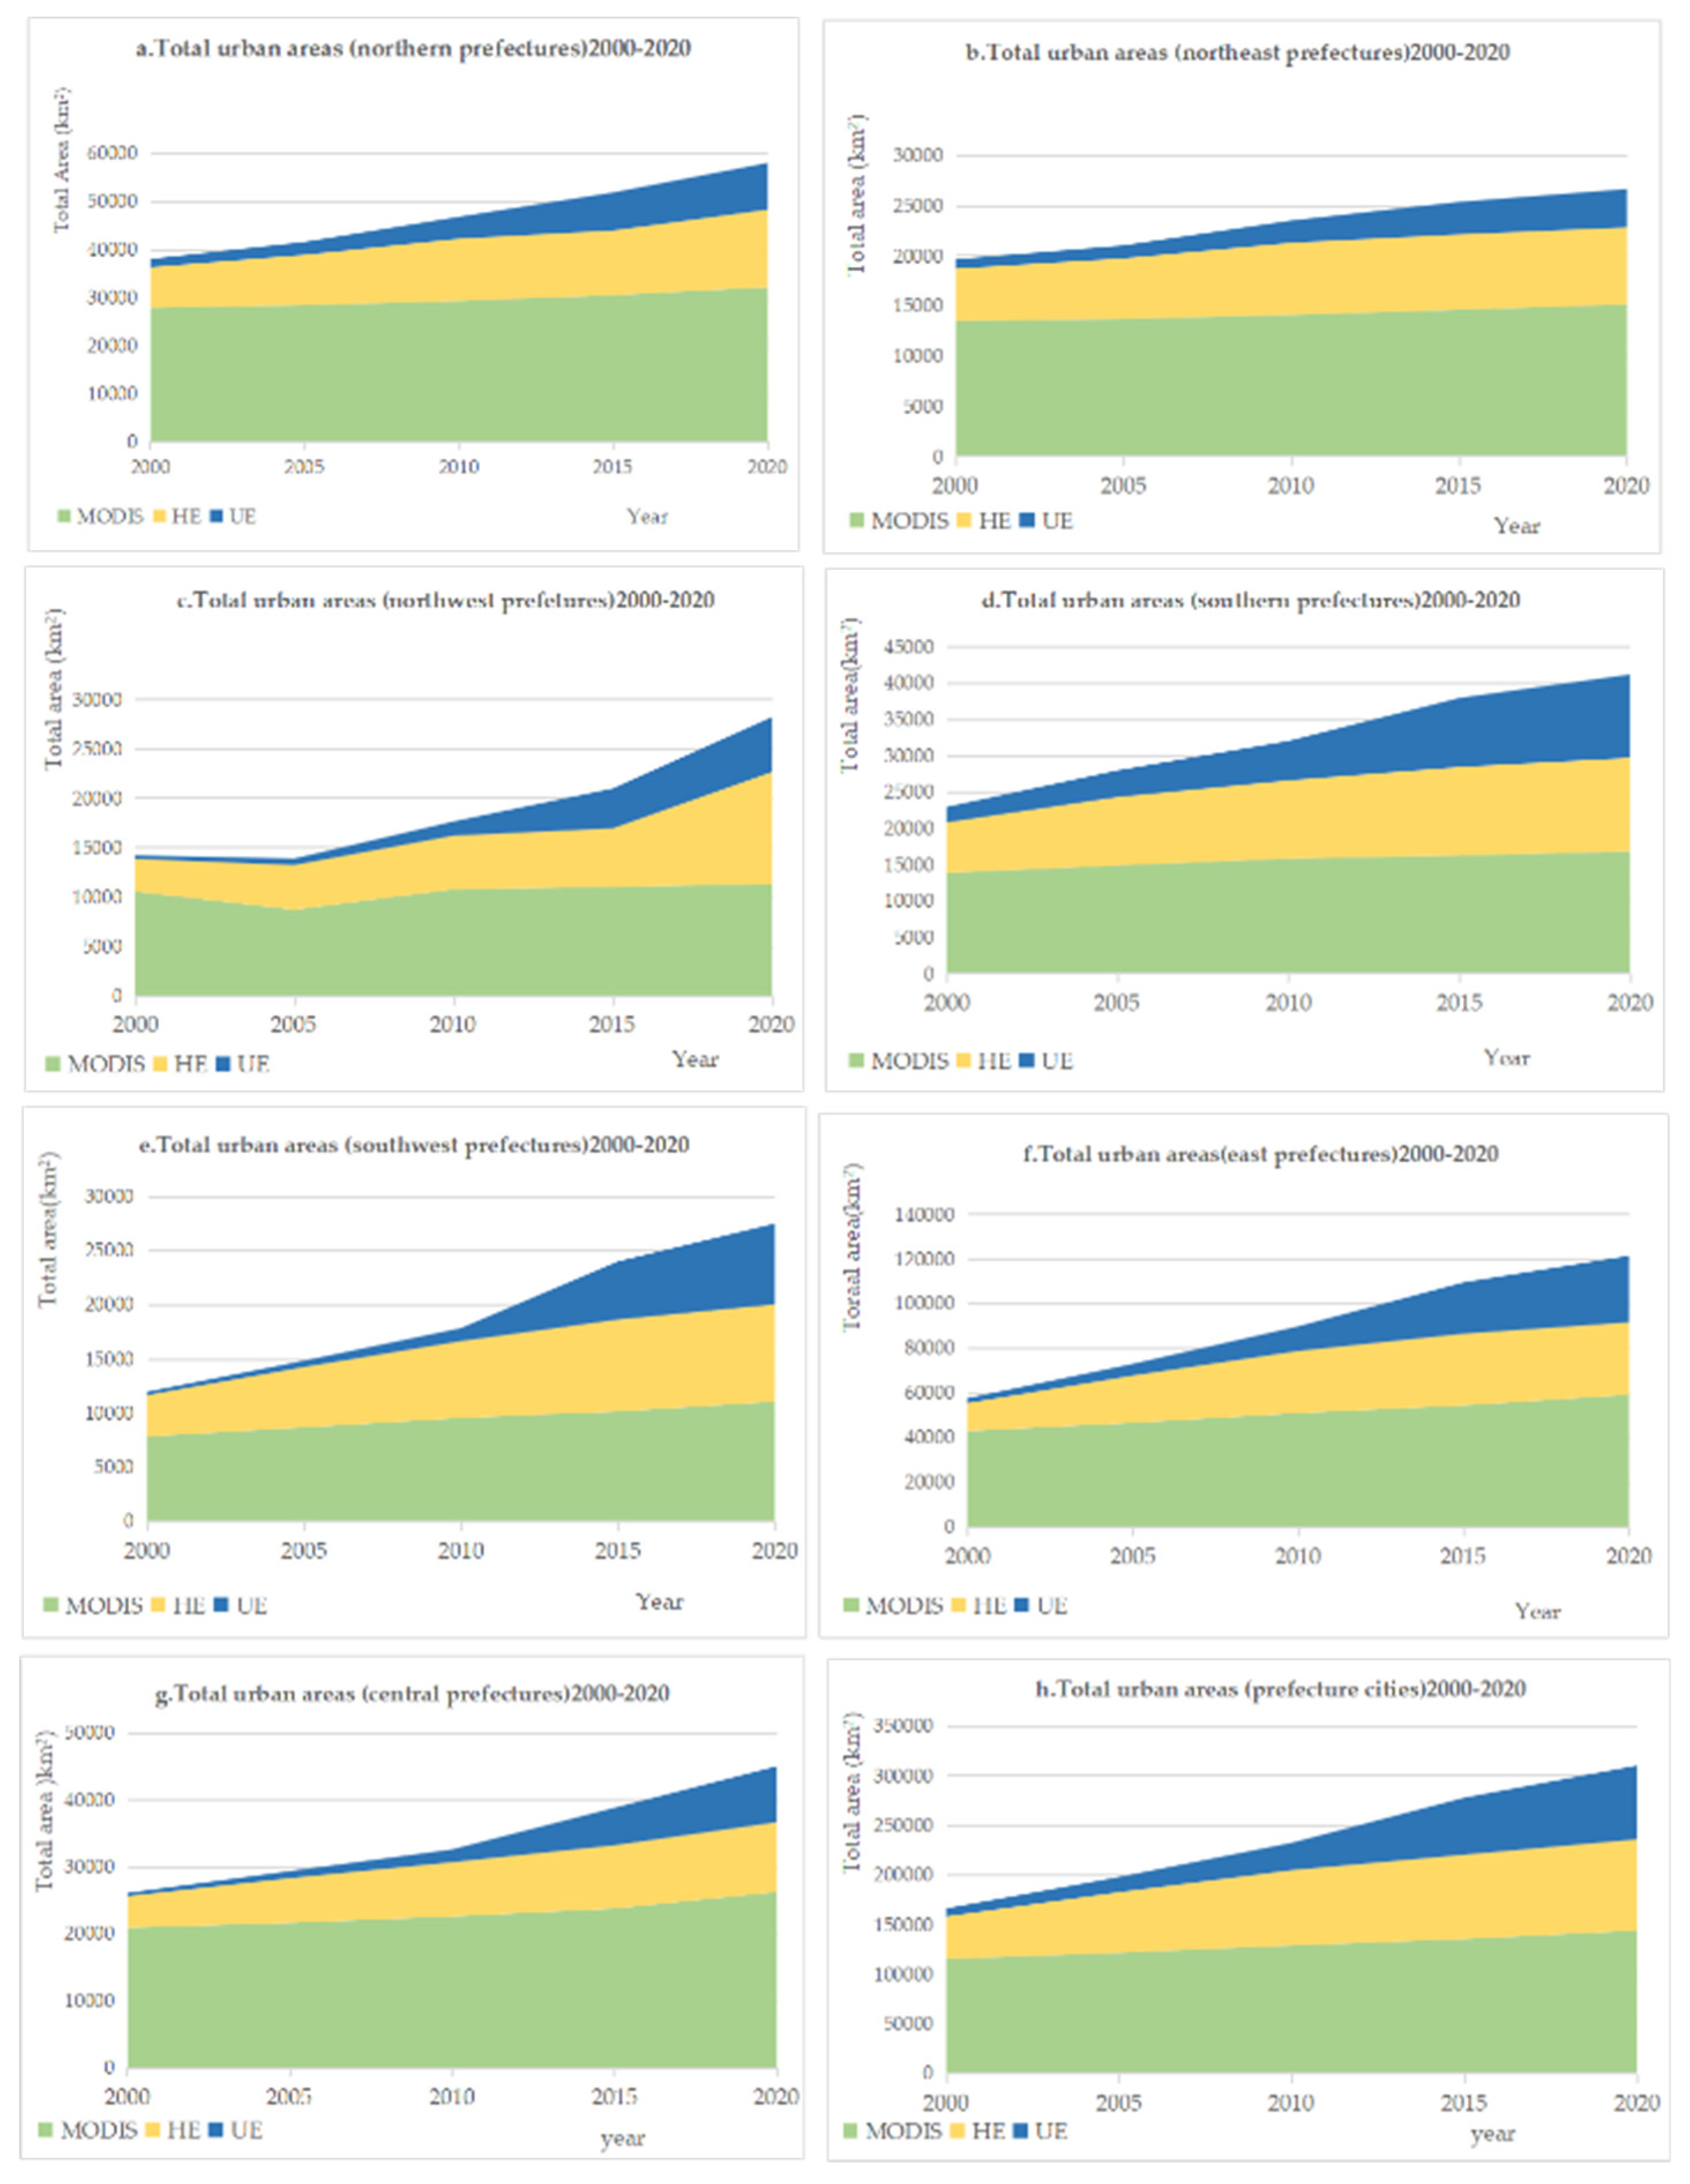
Figure 10.
Extracted urban entities of selected prefectures with HE, MODIS, and LandScan population product, 2015.
Figure 10.
Extracted urban entities of selected prefectures with HE, MODIS, and LandScan population product, 2015.
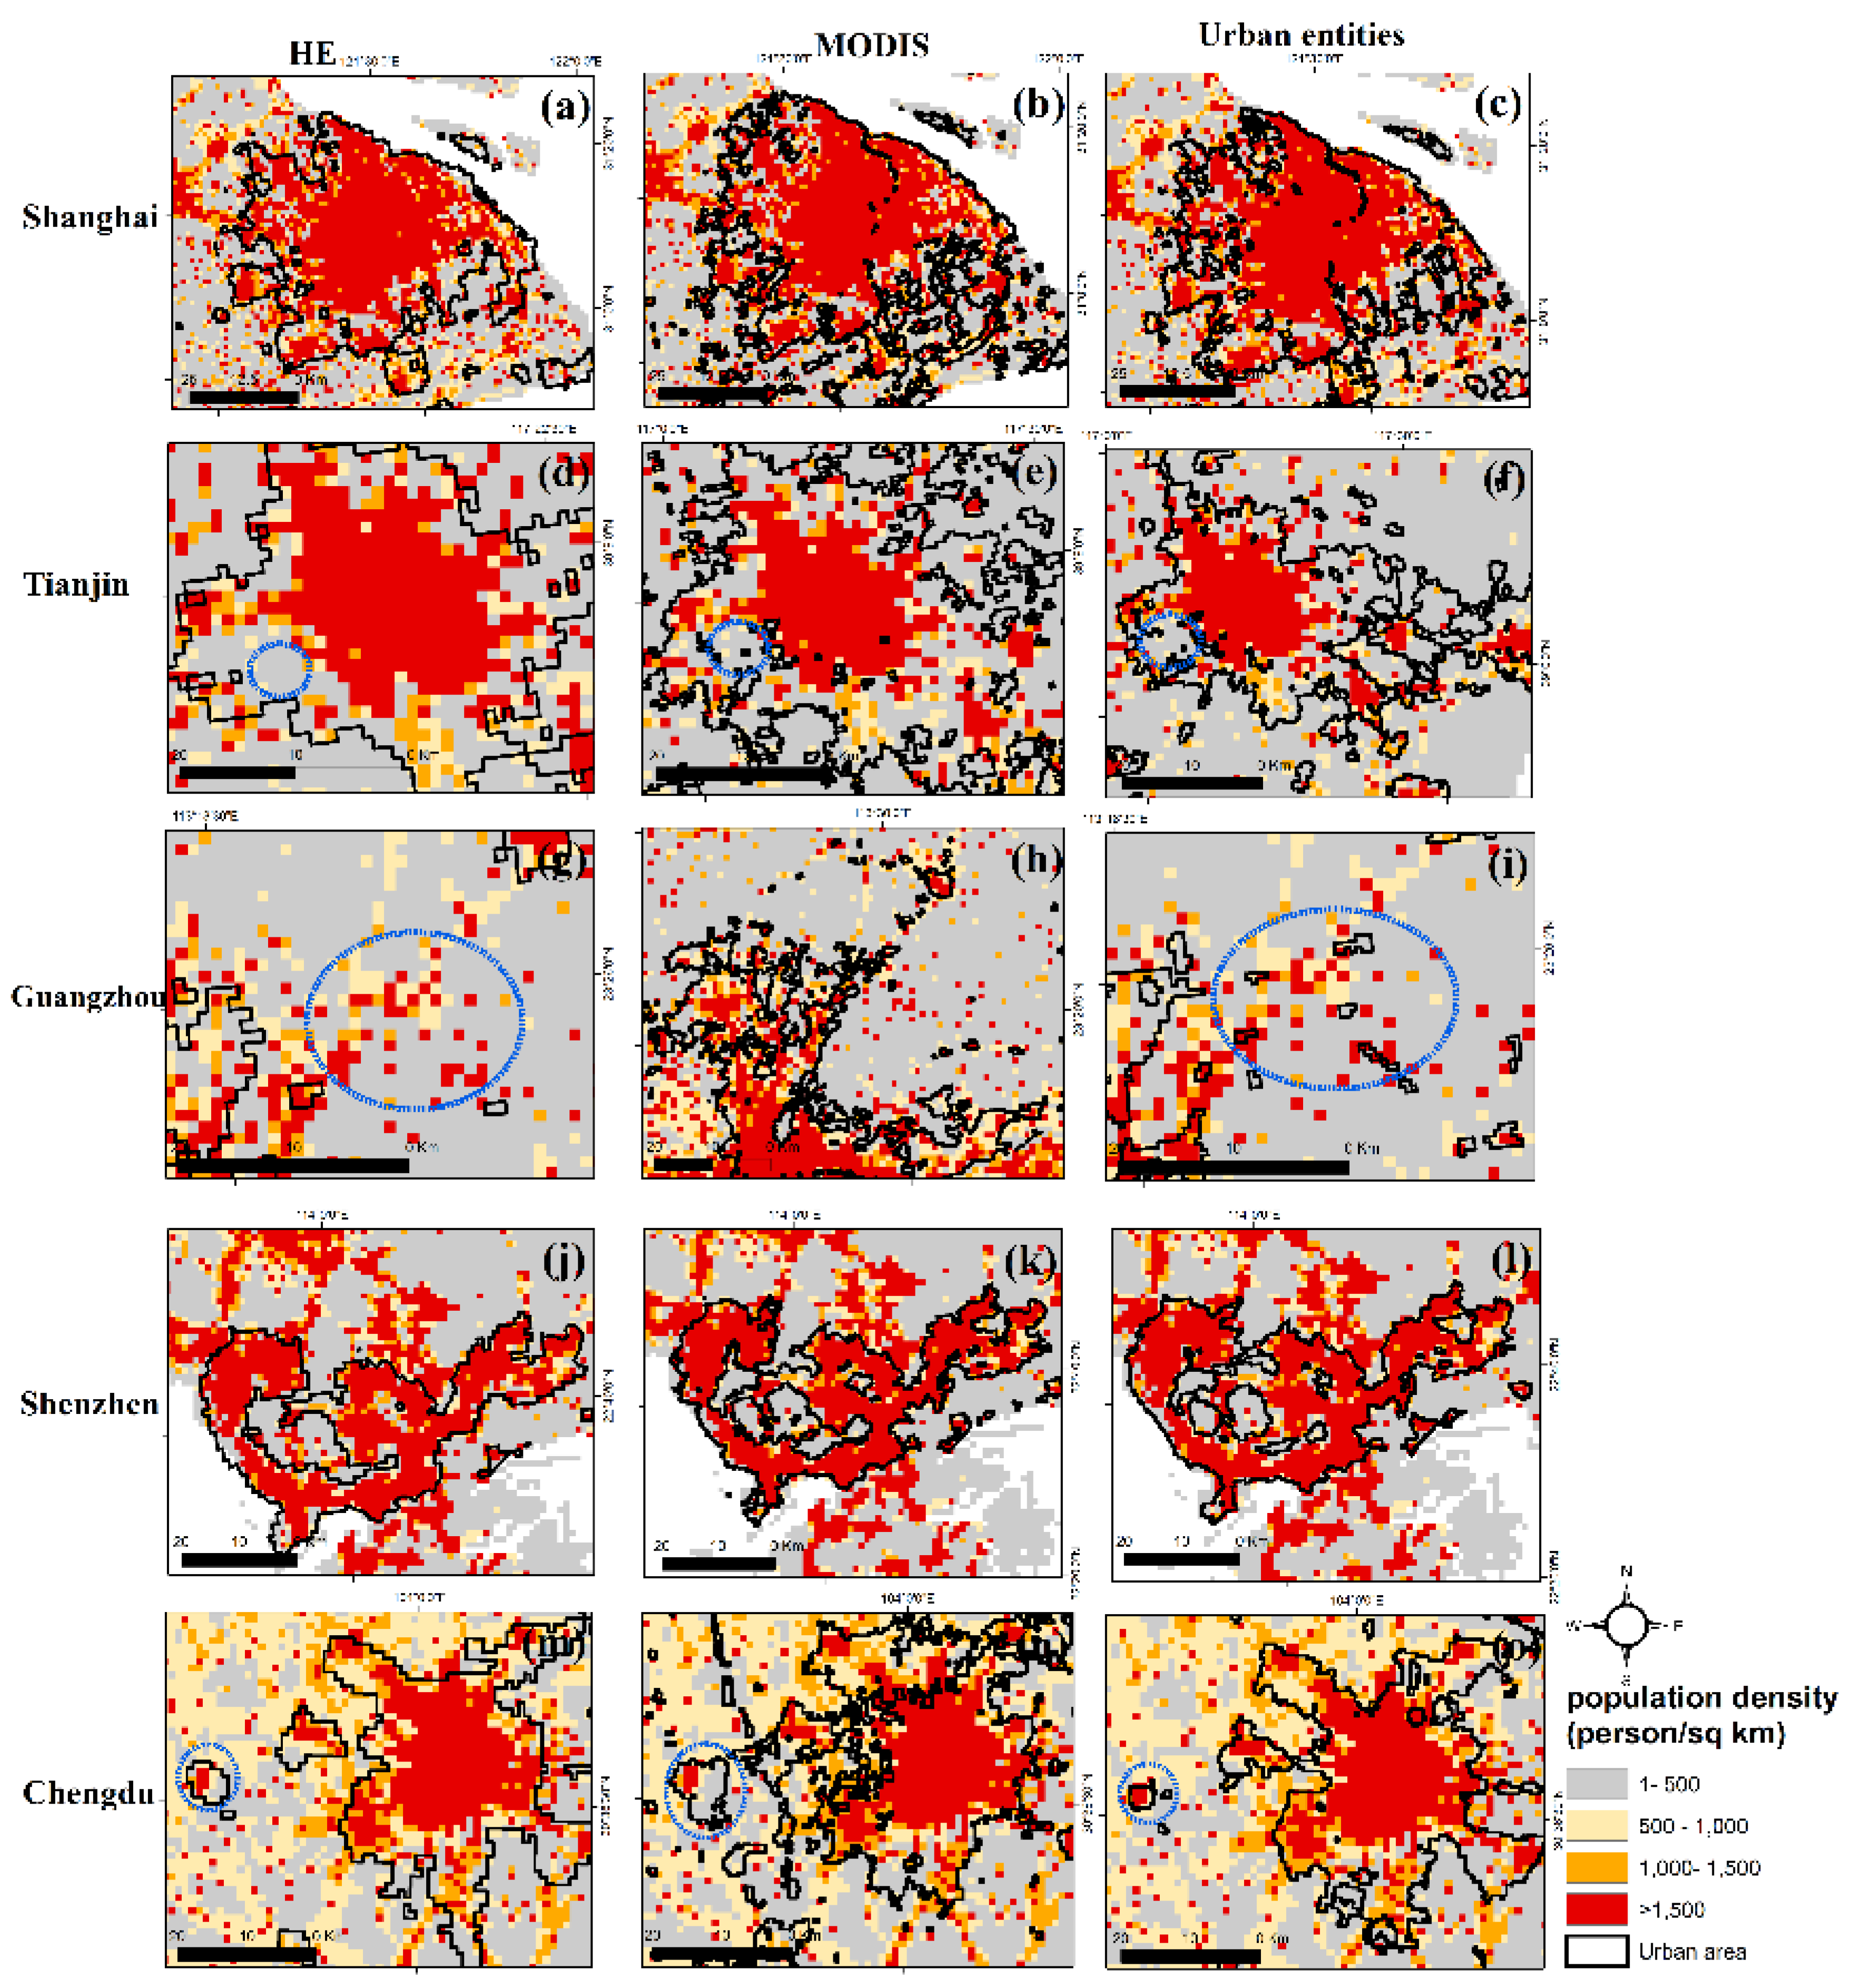
Figure 11.
Visual differences of urban entities of five capitals in Globeland, Landsat8, and SNPP-VIIRS-like images in 2020.
Figure 11.
Visual differences of urban entities of five capitals in Globeland, Landsat8, and SNPP-VIIRS-like images in 2020.
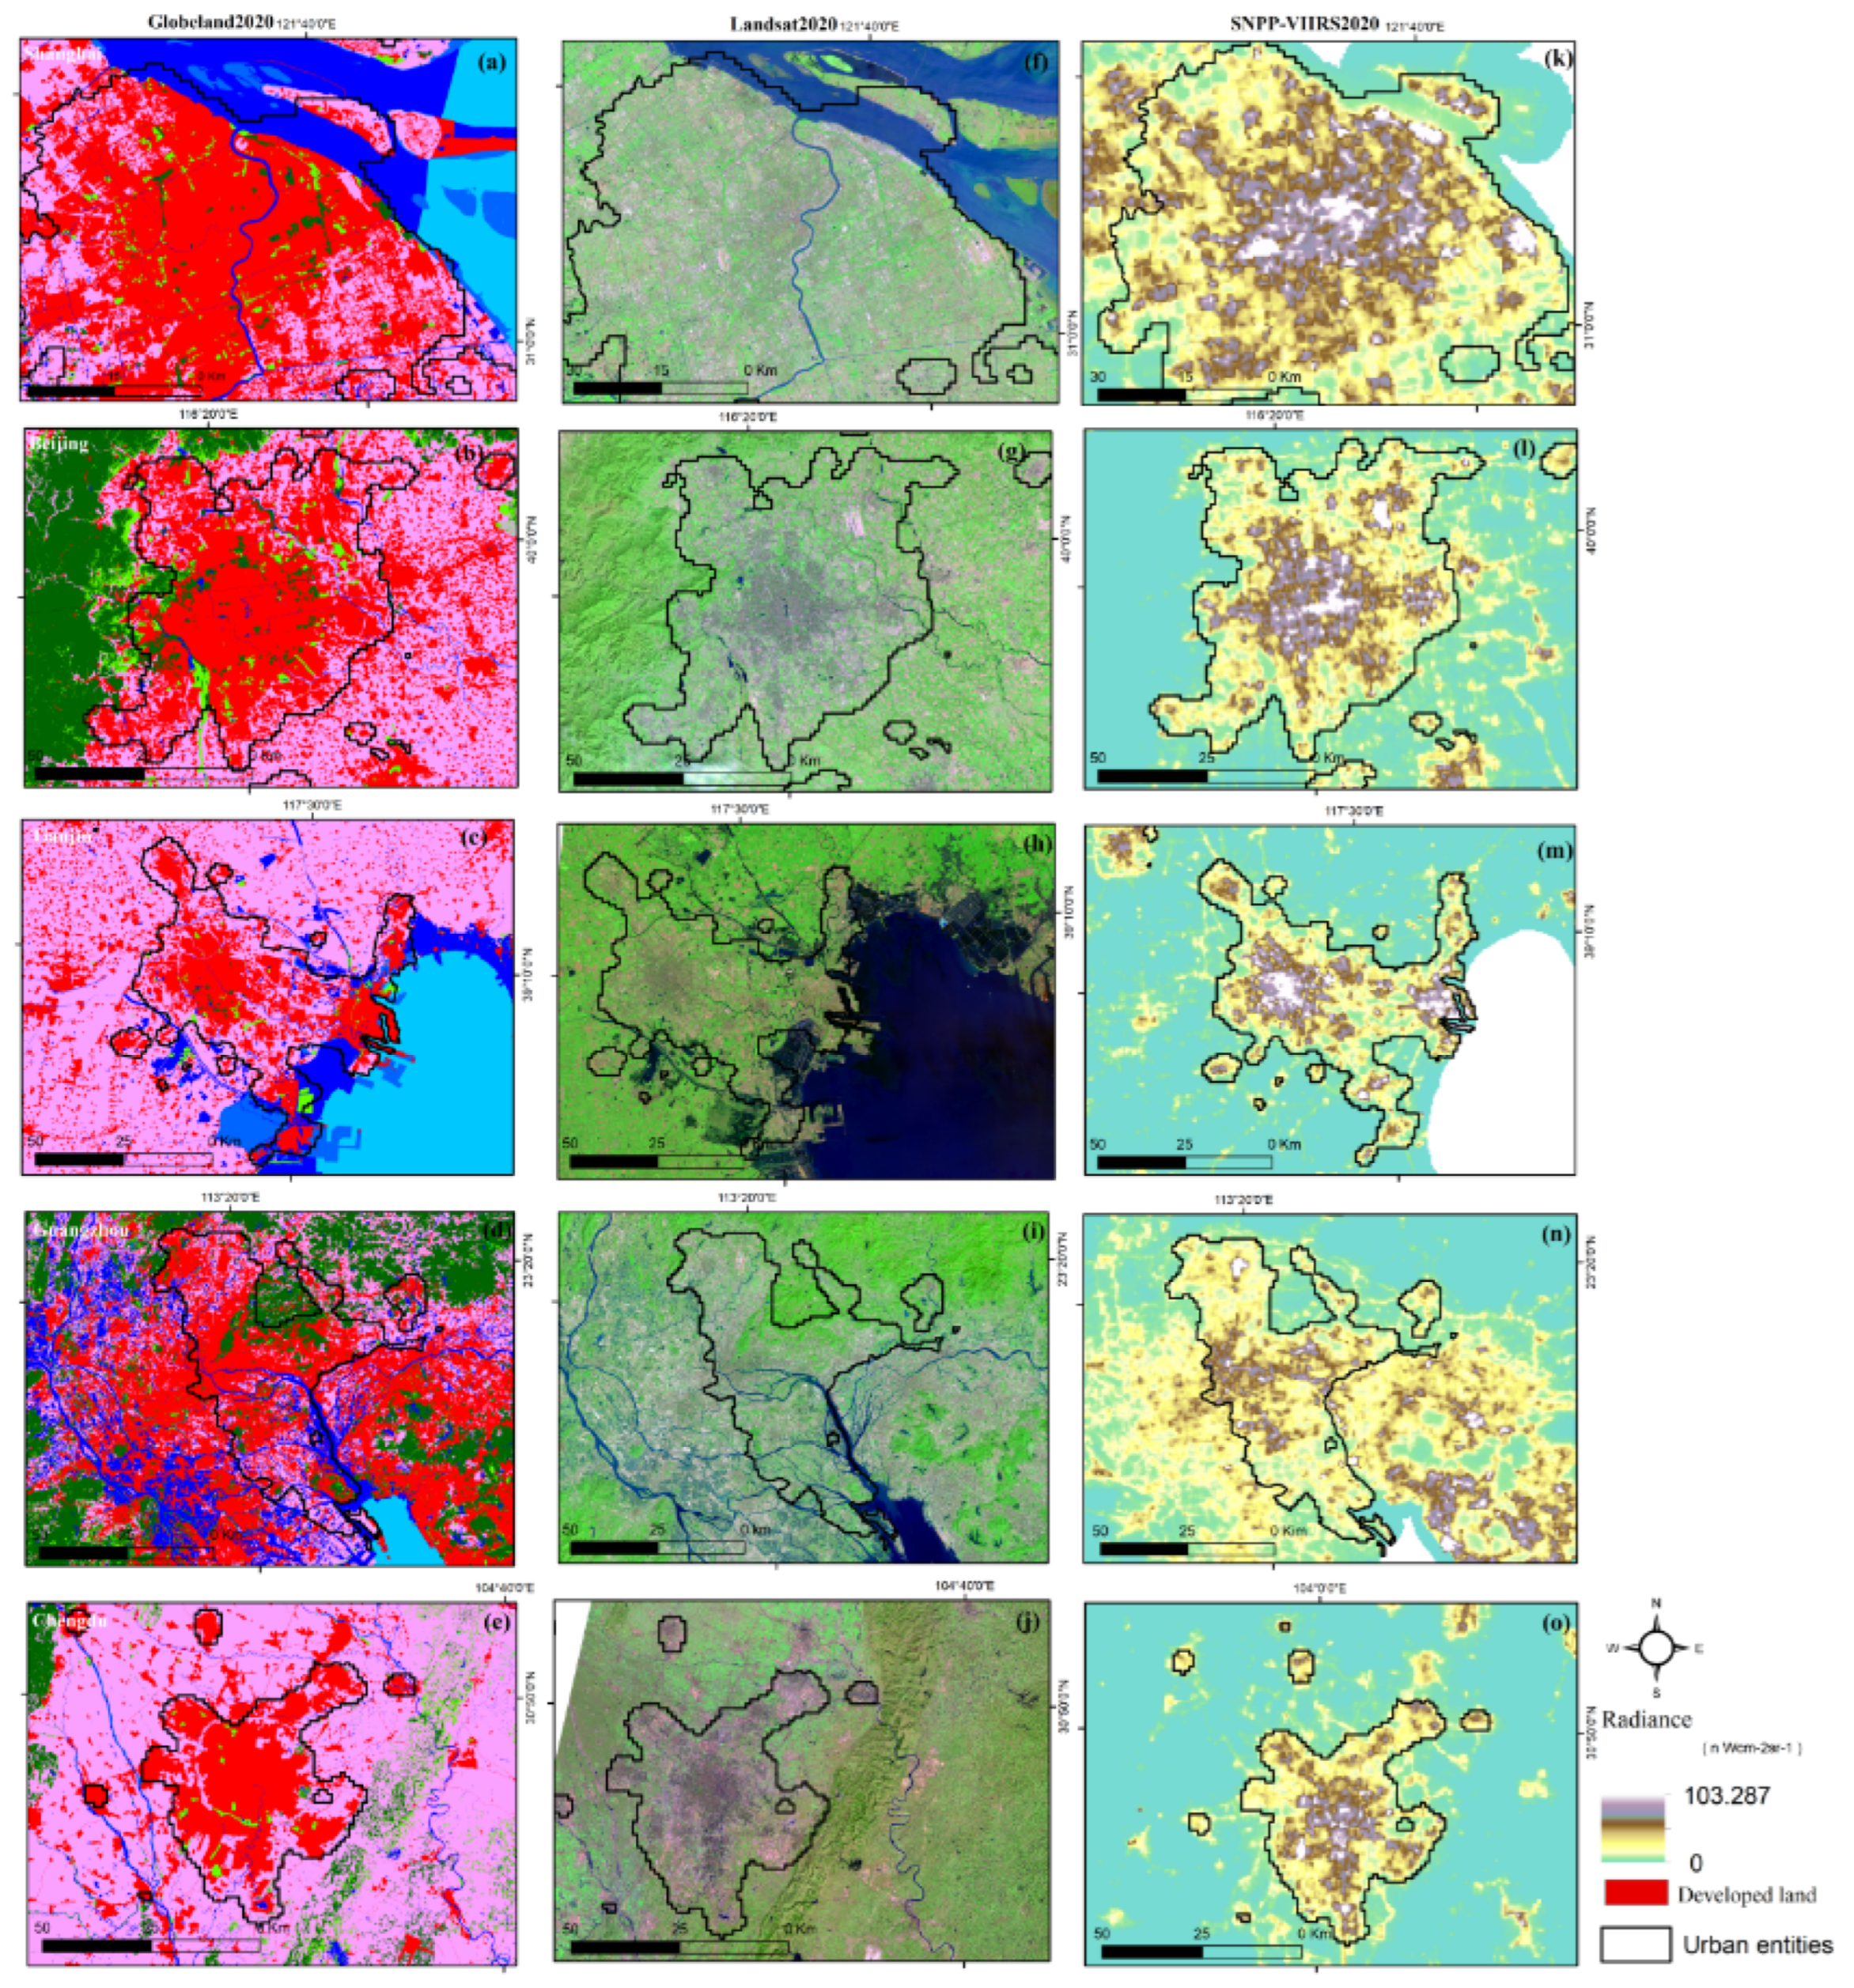
Figure 12.
Regression results of total urban areas for UE, HE, MODIS, and urban GDP 2000-2020.
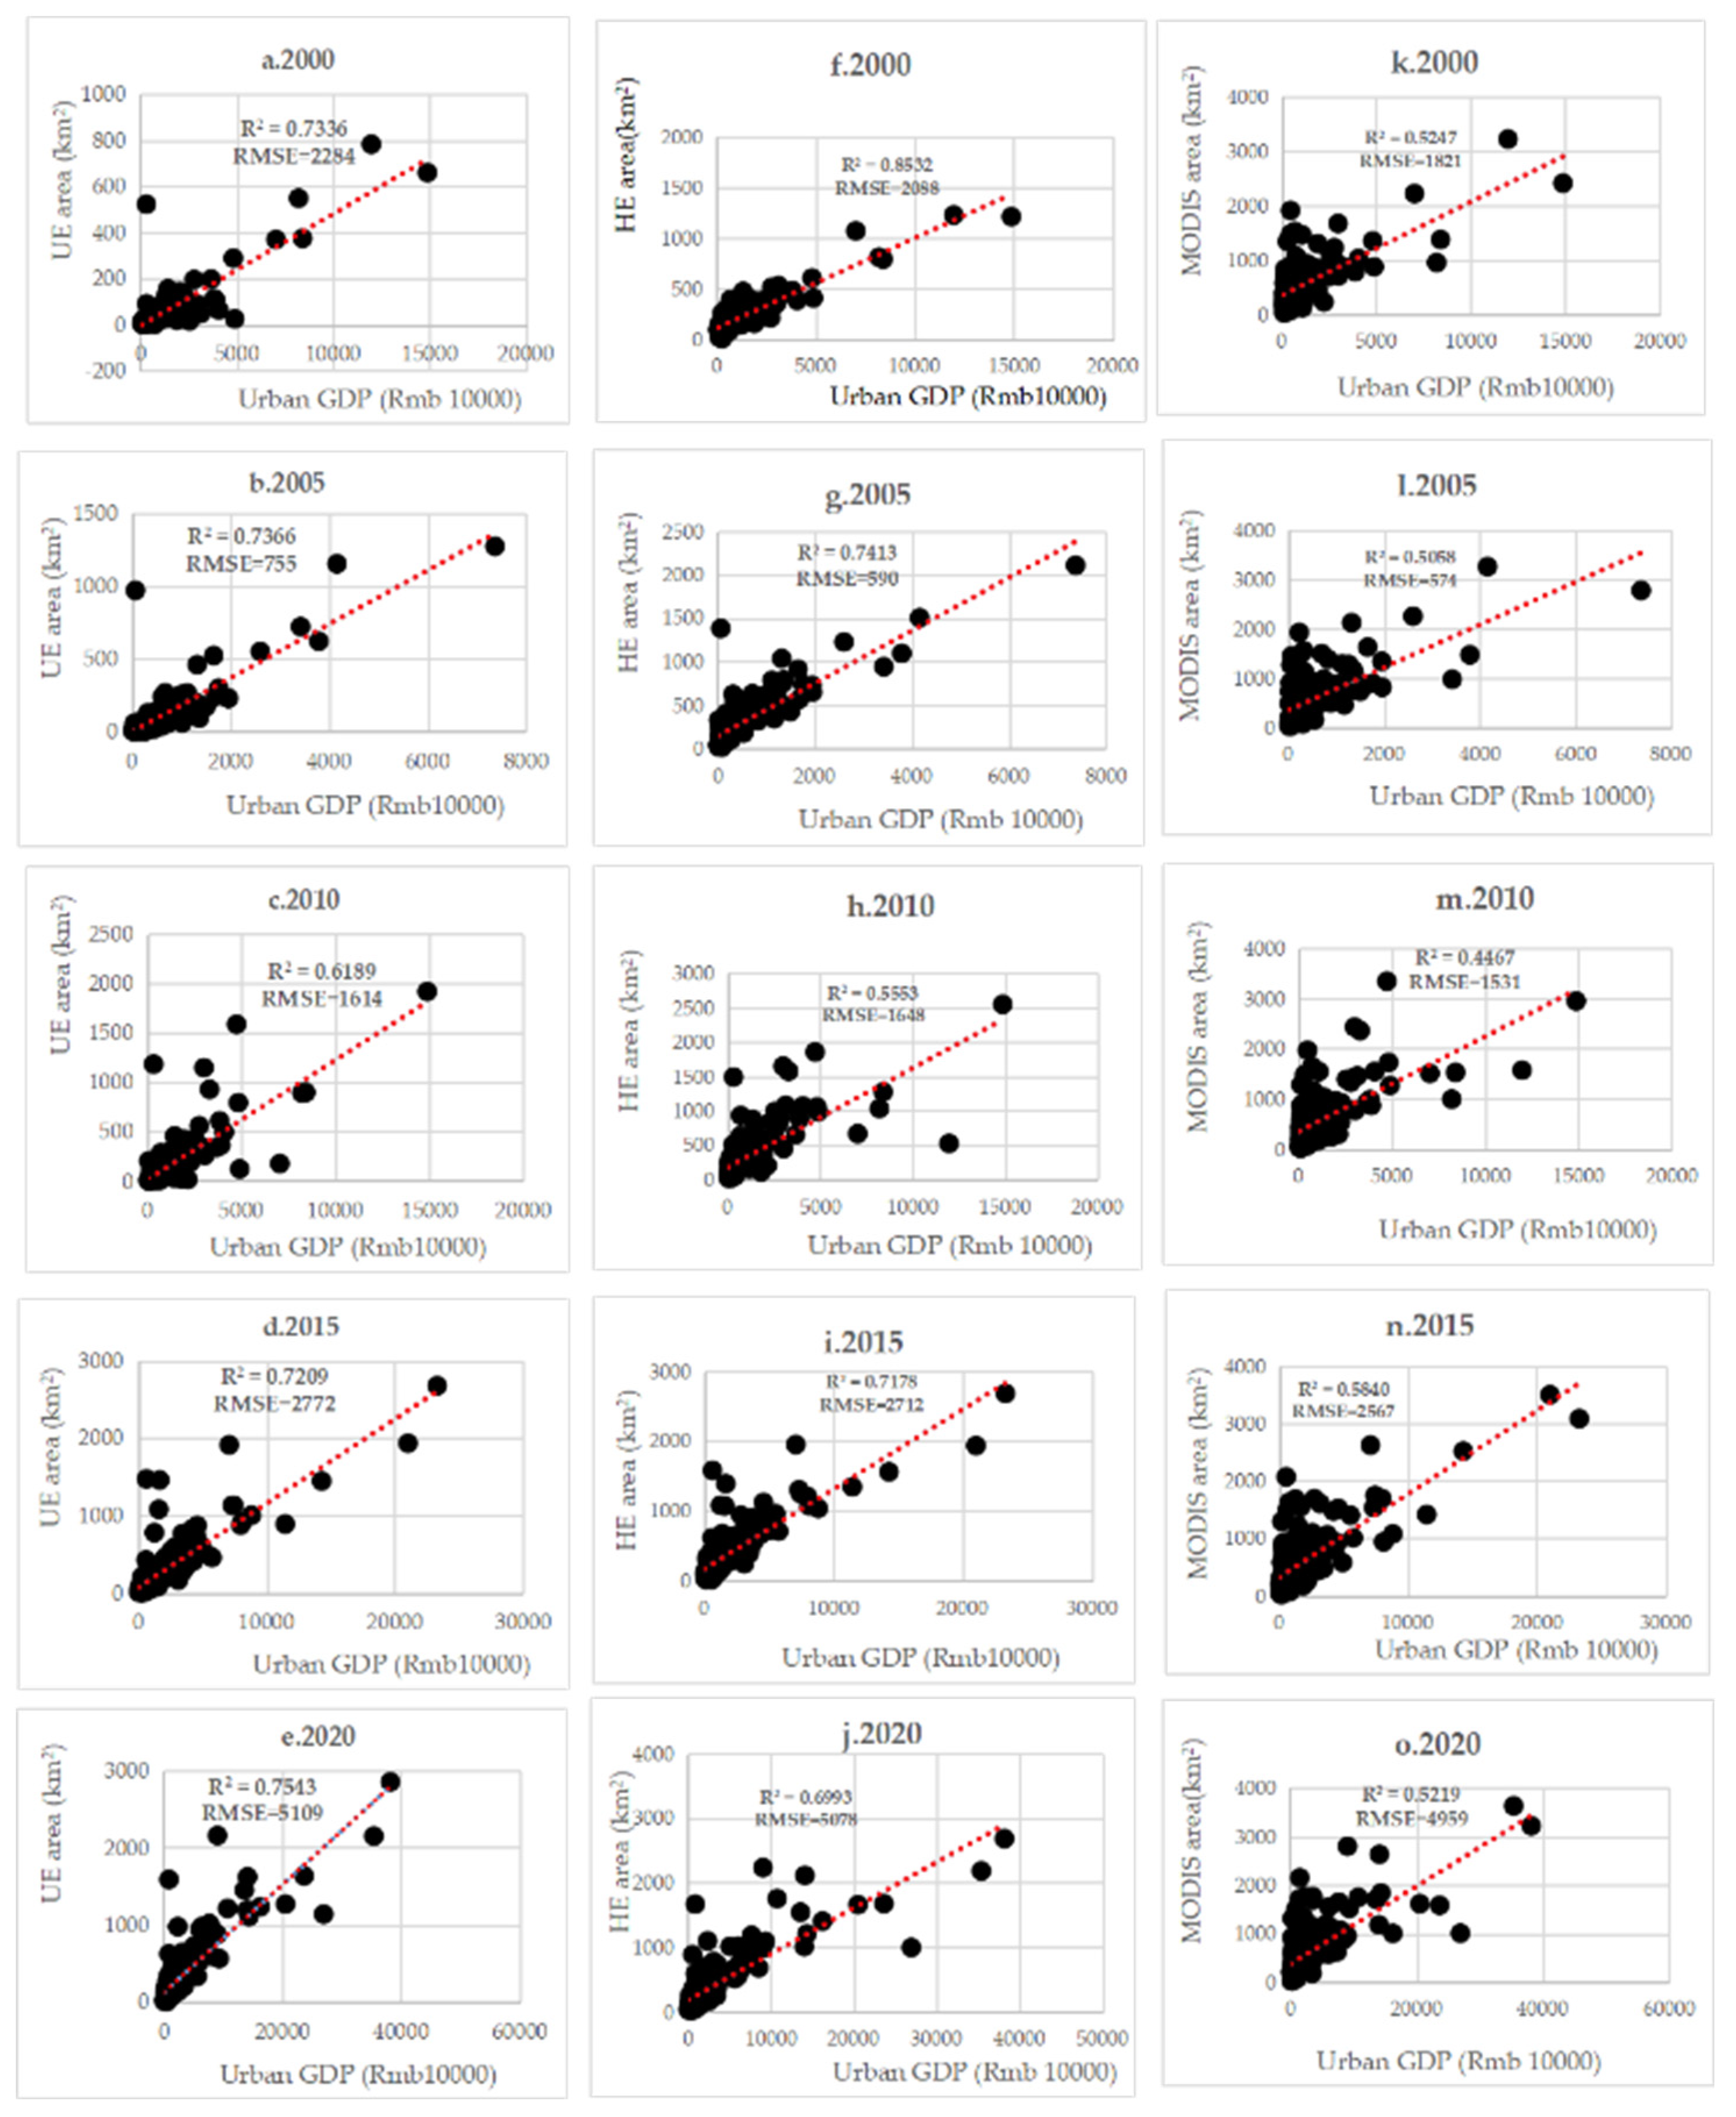

Table 1.
Spatial data sources of the study.
| Data | Year | Format | Resolution/scale | Source |
|---|---|---|---|---|
| SNPP-VIIRS-like | 2015-2020 | Raster | 500 m | https://dataverse.harvard.edu/dataset.xhtml |
| NPP-VIIRS-like | 2000,2005, 2010 |
Raster | 500 m | https://dataverse.harvard.edu/dataset.xhtml |
| LandScan | 2015 | Raster | 1000 m | https://www.un-spider.org/links-and-resources/data-sources/landscan |
| HE | 2015 | Raster | 1000 m | http://data.tpdc.ac.cn/zh-hans/data/3100de5c-ac8d-4091-9bbf-6a02de100c88/ |
| MODIS | 2015 | Raster | 500 m | https://ladsweb.modaps.eosdis.nasa.gov/search/order/1/MCD12Q1--6 |
| GlobeLand30 | 2020 | Raster | 30 m | http://www.globallandcover.com/defaults_en.html? |
| OSM | 2015 | Vector | 1:5000 | https://www.openstreetmap.org |
| LandSat8 | 2015 | Raster | 30 m | https://earthexplorer.usgs.gov/ |
| Prefecture boundaries | 2019 | Vector | 1:50,000,000 | http://ngcc.sbsm.gov.cn/article/en/ |
Disclaimer/Publisher’s Note: The statements, opinions and data contained in all publications are solely those of the individual author(s) and contributor(s) and not of MDPI and/or the editor(s). MDPI and/or the editor(s) disclaim responsibility for any injury to people or property resulting from any ideas, methods, instructions or products referred to in the content. |
© 2023 by the authors. Licensee MDPI, Basel, Switzerland. This article is an open access article distributed under the terms and conditions of the Creative Commons Attribution (CC BY) license (http://creativecommons.org/licenses/by/4.0/).
Copyright: This open access article is published under a Creative Commons CC BY 4.0 license, which permit the free download, distribution, and reuse, provided that the author and preprint are cited in any reuse.


