
Submitted:
20 November 2024
Posted:
21 November 2024
You are already at the latest version
Abstract
Senegalese cities have experienced rapid urbanisation, leading to profound landscape changes. Dakar, one of the cities with the fastest urban expansion, has seen major negative impacts on the availability and quality of its green spaces. This study examines the spatio-temporal evolution of Dakar’s green spaces over recent decades. Using satellite imagery, this study produces land use maps to quantify green space coverage. The results show a gradual decline in green spaces in Dakar between 1990 and 2022. 1990 green spaces covered an estimated 13.36 % of Dakar’s area, which decreased significantly to 9.54 % by 2022. Meanwhile, other land uses, such as built-up areas, increased significantly during this period, from 19.23 % in 1990 to 39.34 % in 2022. This pattern highlights the growing challenge of green space availability as built-up areas expand rapidly, particularly when growth is unplanned. This study underscores the importance of sustainable urban planning that integrates the protection and conservation of Dakar’s vegetation to preserve vital ecosystem services.
Keywords:
Urban expansion
; Green space
; Ecosystem services
; Dakar
1. Introduction
Urbanisation is a worldwide complex phenomenon resulting from the rapid increase of the urban population, since 2008 more than half the world’s population has lived in cities [1], which led to rapid urban expansion. Urban expansion is reshaping landscapes worldwide, becoming one of the key factors of the land use system [2]. The rapid growth of the urban population and the expansion of urbanised areas affect natural and human systems at all geographical scales. Today, studies have shown the immeasurable speed of conversion of forests and agricultural lands during the decades of urbanisation, which has led to a dramatic expansion of impervious surfaces at the cost of natural ecosystems and urban green spaces. [3].
Urban green spaces are generally defined as any area naturally and artificially vegetated and located inside or at the periphery of cities [4]. These spaces are structural components of the urban fabric and are necessary for the liveability of cities [5,6]. Since the nineteenth century, the importance of urban green spaces has been increasingly recognised worldwide, as they serve not only to simulate urban beauty but also to promote the resilience and health of city dwellers [7]. These spaces include parks, forest gardens, allotments, wetlands, and urban trees and can be public or private, and are directly or indirectly available for uses such as active or passive recreation, and positive influence on the urban environment [8]. The importance of urban green spaces lies in the range of functions, services and benefits they provide that contribute to the quality of life and sustainability of cities [9]. These benefits, better known as ecosystem services, are classified into four great categories such as support services, provisioning services, regulating services and cultural services [10]. Their role in maintaining ecological balance and supporting urban resilience can be summarised as carbon sequestration and storage, air purification, temperature regulation, noise reduction, flood regulation, and habitat for biodiversity [11,12,13,14,15,16,17,18]. Among other benefits, green spaces can contribute to the well-being of residents and improve their health [19] by enhancing mental health, physical fitness, cognitive and immune function, and by reducing overall mortality rates [20]. In other terms, urban green spaces improve the quality of life in cities [21].
Despite their importance and the services provided, green spaces are increasingly disappearing from urban areas due to the rapid development of cities caused by a growing population [22]. Indeed, natural areas are frequently converted into built-up environments. This leads to the degradation of vegetation, which provides essential ecosystem services [23]. Urban vegetation loss due to expansion has wide-ranging implications. Studies indicate that the decline in vegetation cover not only reduces biodiversity but also exacerbates urban heat island effects, leading to elevated local temperatures and increased energy demands, air and water pollution, increased flood risk, and increased carbon emissions from cities exacerbating climate change [24,25]. Among other consequences, given the importance of green spaces for health [26], the reduction of green spaces must harm residents’ mental and physical health, as access to nature within urban areas is increasingly limited. In densely populated cities, where concrete dominates the landscape, green spaces provide havens of peace and serve as areas for recreational and social activities. This is especially evident in rapidly urbanising regions, where the pace of development outstrips efforts to preserve and restore green spaces [27].
Generally, in Senegal, the degradation of the vegetal resources has become an undeniable reality. [28,29], particularly in urban areas. Urban expansion in Senegal is accelerating as cities grow to accommodate rapidly increasing populations, especially in metropolitan areas like Dakar. While crucial for economic development and housing, this expansion often comes at the expense of natural landscapes and green spaces, leading to significant urban vegetation degradation [30,31,32]. Dakar, the capital of Senegal, is a rapidly expanding conurbation with an urbanisation rate of 97.2 %, growing in an unplanned manner and facing the gradual occupation of its natural and agricultural land mainly in peri-urban areas [33,34]. Once known as the Cape Verde Peninsula for its natural greenery, Dakar has experienced a gradual decline in green spaces, increasingly replaced by grey infrastructures [35], contributing to a lower quality of urban life. Despite, the important role of urban vegetation in Dakar, limited research has focused on understanding the extent of its degradation under urban expansion. This article examines the degradation of green spaces in Dakar, exploring the extent and impacts of urban expansion on the city’s environmental resources. By analysing land use changes over several decades, the study aims to inform urban planning policies that protect and restore green spaces, promoting a sustainable balance between development and ecological preservation in Dakar city.
2. Materials and Methods
2.1. Study Area
Called the Cape Verde Peninsula, Dakar, the capital of Senegal, is located in the extreme west of Senegal (West Africa) between longitude 17°10 and 17°32 West and latitude 14°53 and 14°35 North. It is bounded to the east by the region of Thies and by the Atlantic Ocean to the north, west and south (Figure 1). One of Senegal’s 14 regions, Dakar, the smallest region, covers an area of 550 km2 or 0.28 % of the national territory [36]. The region of Dakar is divided into departments, arrondissements and districts. Dakar belongs to the Sahelian domain of Senegal but has a canary-type climate, and is strongly influenced by geographical and atmospheric factors. The temperature varies between 17 and 25° C from December to April and 27 to 30° C from May to November. The region of Dakar is generally situated between isohyets 300 and 600 mm [37].
2.2. Data Collection
The Landsat images (Path 205, Row 50) were collected to analyse the spatio-temporal evolution of the vegetation of the study areas from 1990 to 2022. For this analysis, images from the same period of the year, the dry season, were used to minimise high cloud cover and to ensure the consideration of permanent green spaces without the influence of rainfall. The images were downloaded from the United States Geological Survey (USGS) data portal. The following table (Table 1) describes the data used.
2.3. Data Processing
In remote sensing, significant progress has been made to produce land use and land cover maps. Numerous initiatives have been undertaken to facilitate remote sensing practices through open-source software. In this context, the classification of Landsat images was conducted using Qgis software with the Semi-automatic Classification plugin (SCP). The SCP plugin, integrated into mapping software, enables supervised land use and land cover classification from remotely sensed images [38,39]. The image classification followed several steps within the SCP plugin (Figure 2).
The first step involves image preprocessing, which includes atmospheric and radiometric correction to enhance image quality for accurate interpretation. This was achieved using the plugin’s image conversion option, enabling both atmospheric and radiometric corrections. Next, the study was extracted using the “Clip Raster Bands” option. The supervised classification method was then employed to produce land use and land cover maps with the help of the SCP plugin’s “Band Processing” option. Following image preprocessing and study area extraction, a false colour composition was created using selected bands. This colour composition identified five land cover classes in the Dakar region (Table 2).
In the SCP dock, training inputs were assigned to each class, and the classification was then performed using the Random Forest algorithm, a machine-learning algorithm consisting of multiple decision trees [40]. After classification, an accuracy assessment was conducted using Overall accuracy and Kappa coefficients, widely applied in remote sensing. The results appeared to be acceptable, with overall accuracy coefficients ranging from 75.15 % to 96.99 %, and Kappa coefficients ranging from 0.66 to 0.95.
Changes in land use and land cover were done using the SCP plugin’s “Cross-classification option.” The maps were cross-tabulated two by two, covering 1990-2002, 2002-2012, 2012-2022, and 1990-2022. Following this step, the matrix tables were analysed to illustrate the changes.
3. Results
3.1. Land Use/Cover of the Dakar City from 1990 to 2022
The analysis of land use and land cover in the Dakar region from 1990 to 2022 reveals a strong spatial dynamic, with a general dominance of two main classes which are bare land and built-up area (Figure 3 and Figure 4).
Figure 5 shows that in 1990, bare land was the dominant class covering 46.34 % of the total area, or 25 116.39 ha, followed by agriculture land at 19.35 % (10 486.35 ha) and built-up area at 19.23 % (10 424.52 ha). Green space and water bodies occupied lower proportions at 13.36 % (7 242.84 ha) and 1.72 % (931.32 ha) respectively.
Twelve years later, in 2002, green spaces and water had declined considerably. Green space represented only 7.88 % of the total area of Dakar, or 4 269.6 ha, a reduction of 2 973.24 ha. Water body also decreased covering only 0.97 % (528.03 ha), a reduction of 403.29 ha. A similar decrease was observed in the agricultural land, which accounted for 15.19 % (8 232.93 ha), a decrease of 2 253.42 ha. Conversely, bare land and built-up area expanded, covering 52.26 % (28 325.34 ha) and 23.7 % (12 845.52 ha) with an increase of 3 208.95 ha 2 421 ha respectively.
The built-up area grew in 2012, covering 29.13 % (15 791.58 ha) of the Dakar region’s land area, an increase of 2 946.06 ha. Unlike previous years, the urban vegetation of Dakar showed a slight increase in coverage. In 2012, green space covered 12.54 % (6 794.37 ha) of the Dakar region, representing an increase of 2 524.77 ha. This increase was also observed in the water surface area which rose to 1.58 % (855.72 ha), an increase of 327.69 ha. Agriculture land experienced a significant loss during this period, decreasing to 5.34 % (2 894.85 ha), a drastic reduction of 5 338.08 ha. A similar declining trend was noted in the bare land class, which reduced by 460.44 ha, covering 52.41 % (27 864.9 ha) in 2012.
The year 2022 was characterised by an overall reduction in all land cover types, except for the built-up area, which continued to grow rapidly. The built-up area reached 39.32 % (21 311.28 ha) of the total area of Dakar which increased by 10.19 % (5 519.7 ha) over just 10 years. In contrast, vegetation cover declined again to 9.54 % (5 170.59 ha), a loss of 3 % (1 620.75 ha). The water area, agriculture land, and bare land classes accounted for 1.57 % (853.02 ha), 4.29 % (2 324.61 ha), and 45.28 % (2 4541.92 ha) respectively.
3.2. Land Cover Changes in the Dakar Region from 1990 to 2022
The results reveal a significant shift in land cover in Dakar from 1990 to 2022, with these changes substantially impacting vegetation cover. The matrix tables illustrate the transformation of land cover classes over the years studied. The matrix results indicate a high instability level in Dakar green spaces, marked by their conversion into other land use types. Between 1990 and 2002, only 11.14 % of green spaces remained stable (Table 3). Additionally, a considerable portion of vegetation cover was lost, with 3.07 % converted to agricultural land and another 1.77 % to bare land, highlighting the extent of vegetation cover degradation, and a total loss of 5.2 %. Agriculture land expanded, with 9.25 % of bare land converted to agricultural use. Conversely, bare land decreased as it transitioned to agricultural land and built-up areas. Built-up areas grew by 5.14 % at the expense of bare land, representing an overall increase of 5.4 % in built-up areas.
Between 2002 and 2012, significant changes continued, with vegetation cover decreasing sharply, leaving only 5 % relatively stable (Table 4). Meanwhile, 7.93 % of bare land and 2.63 % of built-up areas were converted to green space, leading to a 4.07 % increase in green areas. However, this period also experienced the greatest vegetation loss, with 4.75 % of green space converted to bare land, while agricultural land and the built-up regions expanded by 1.18 % and 1.22 % of vegetation, respectively. The built-up areas notably decreased, losing over 10 % of its surface to bare land, though it saw a slight increase elsewhere. Similarly, agricultural land expanded, claiming 4.94 % of bare land.
Between 2012 and 2022, green spaces showed much greater stability (Table 5). Vegetation cover increased by 8.41 %, with only minor changes observed. During this period, the matrix table reveals that small portions of green spaces were converted to water (0.02 %), agricultural land (0.07 %), bare land (0.85 %) and built-up (0.18 %). Additionally, green spaces expanded as 3.05 % of bare land was transformed into green space, reflecting efforts to develop green areas and reforest the city. In contrast, water surface area continued to decline significantly, as did built-up areas, which decreased slightly by 10.16 %. Specifically, the built-up areas declined by 10.19 % in favour of the bare land category, resulting in a 6.51 % increase in bare land.
The overall class transfer matrix from 1990 to 2022 shows very low stability for the green space class (Table 6), with only 3.66 % of the area remaining as green spaces over this period. However, there were some positive changes in favour of green space, with 5.49 % of bare land converted to green space, and 3.62 % of the built-up area also becoming vegetation. The water and agricultural land classes contributed smaller amounts to vegetation, with 0.31 % and 0.28 %, respectively. Conversely, green space experienced significant losses, with 3 % of its space converted to bare land, 1.76 % to agricultural land, 0.97 % to built-up areas and 0.14 % to water. Water class saw the greatest decline, losing 7.8 % of its surface area between 1990 and 2022. In contrast, agriculture land, bare land and built-up areas experienced substantial expansion, with agriculture land increasing by 15.06 %, bare land by 1.05 %, and built-up areas by 20.09 %. Built-up areas, in particular, have become increasingly sprawling over the years.
4. Discussion
Changes in land use are influenced by various factors, including socio-economic and environmental contexts. [41]. From this perspective, the landscape of Dakar has undergone considerable transformations over the years, with all land use categories significant changes during the study period (Figure 6). Except, for built-up areas, classes such as green spaces, water, agricultural land, and bare land have shown a downward trend between 1990 and 2022. As green spaces were gradually converted, their spatial coverage diminished substantially, with the largest losses occurring between 1990 and 2002, where 3.07 % was converted to agricultural land, and between 2002 and 2012, where 4.75 % of vegetation became bare soil. These declines result from intense human pressures.
Figure 6.
Land use/cover change in Dakar from 1990 to 2002 (A), from 2002 to 2012 (B) and from 2012 to 2022 (C).
Figure 6.
Land use/cover change in Dakar from 1990 to 2002 (A), from 2002 to 2012 (B) and from 2012 to 2022 (C).
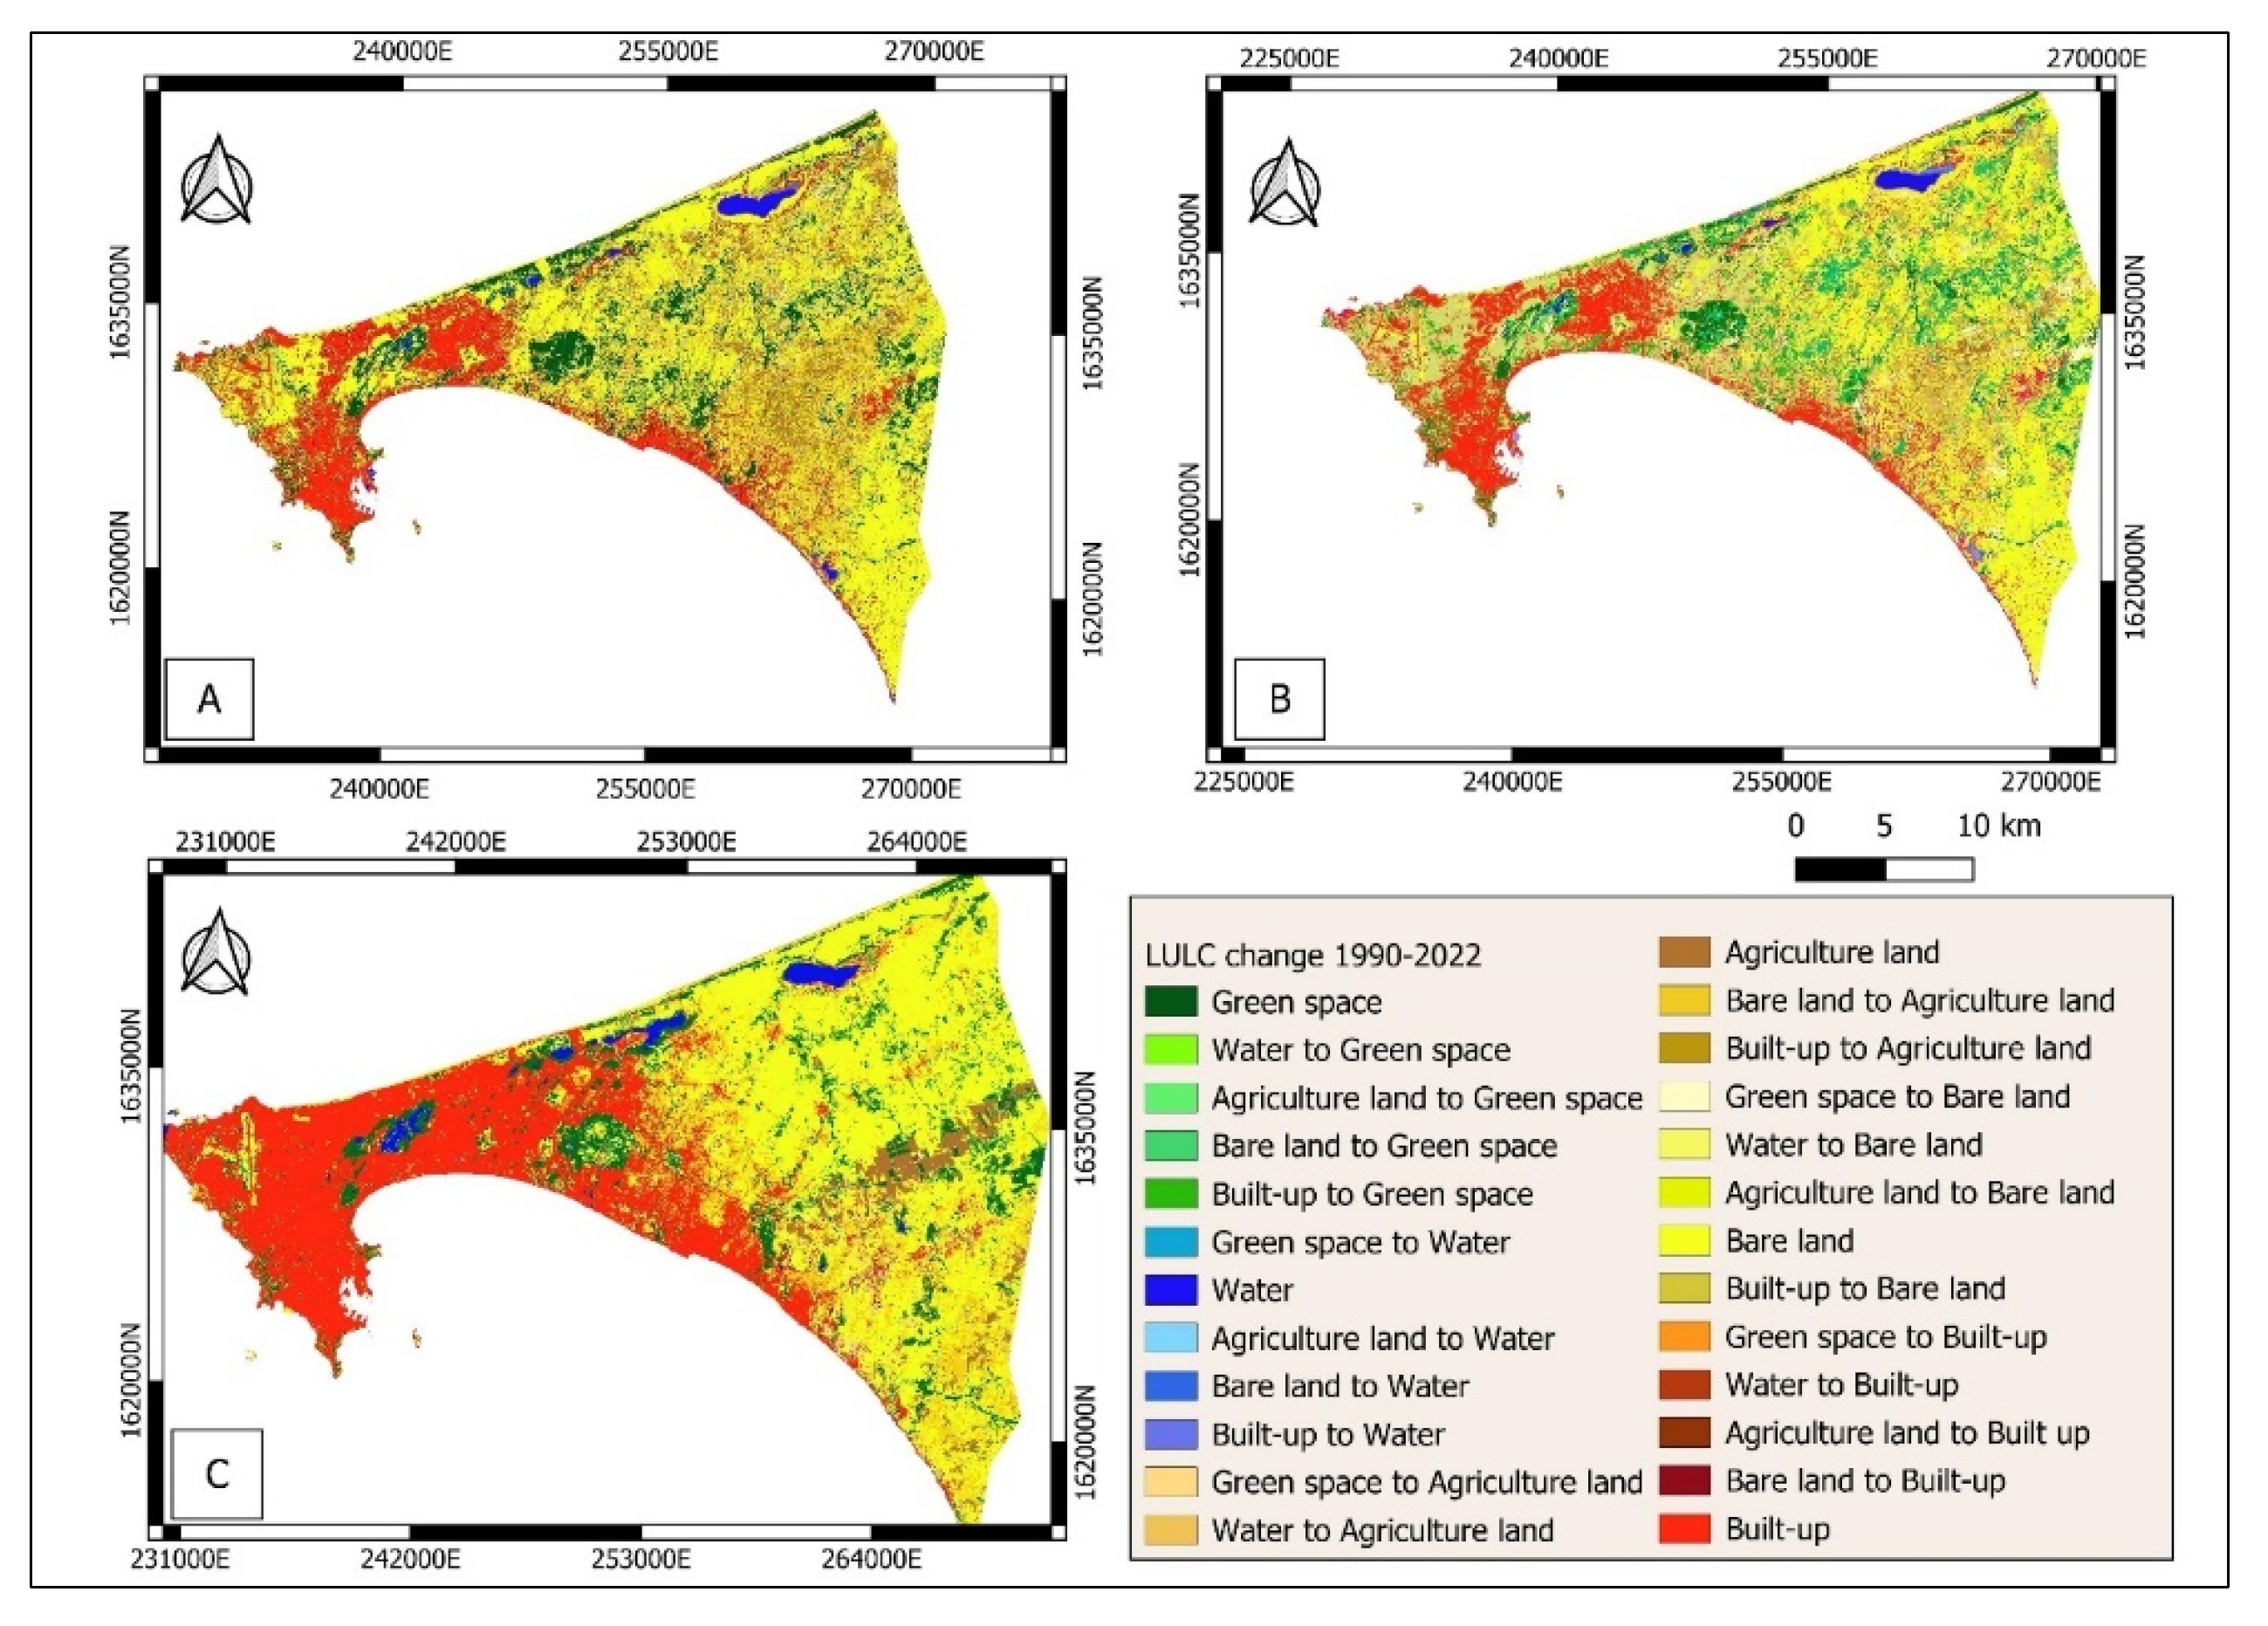
Conversely, Dakar’s built-up areas have expanded rapidly, driven by the rising demand for housing and infrastructure to meet the population’s needs. Rapid demographic growth and migratory flows have increased the number of built-up areas. Urban expansion became especially evident from 2012 onwards as development shifted from the city’s west to its east. This trend has been confirmed by another study which found that between 1989 and 2014, Dakar’s built-up areas expanded at the expense of other land uses, with built-up area changes ranging from 30.6 to 118.6 km2, out of a total surface of 550 km2 [42]. Comparing these results to those found in this current study, confirms Dakar’s rapid urban growth, with built-up areas reaching 213.11 km2 in 2022 compared to 104.24 km2 in 1990.
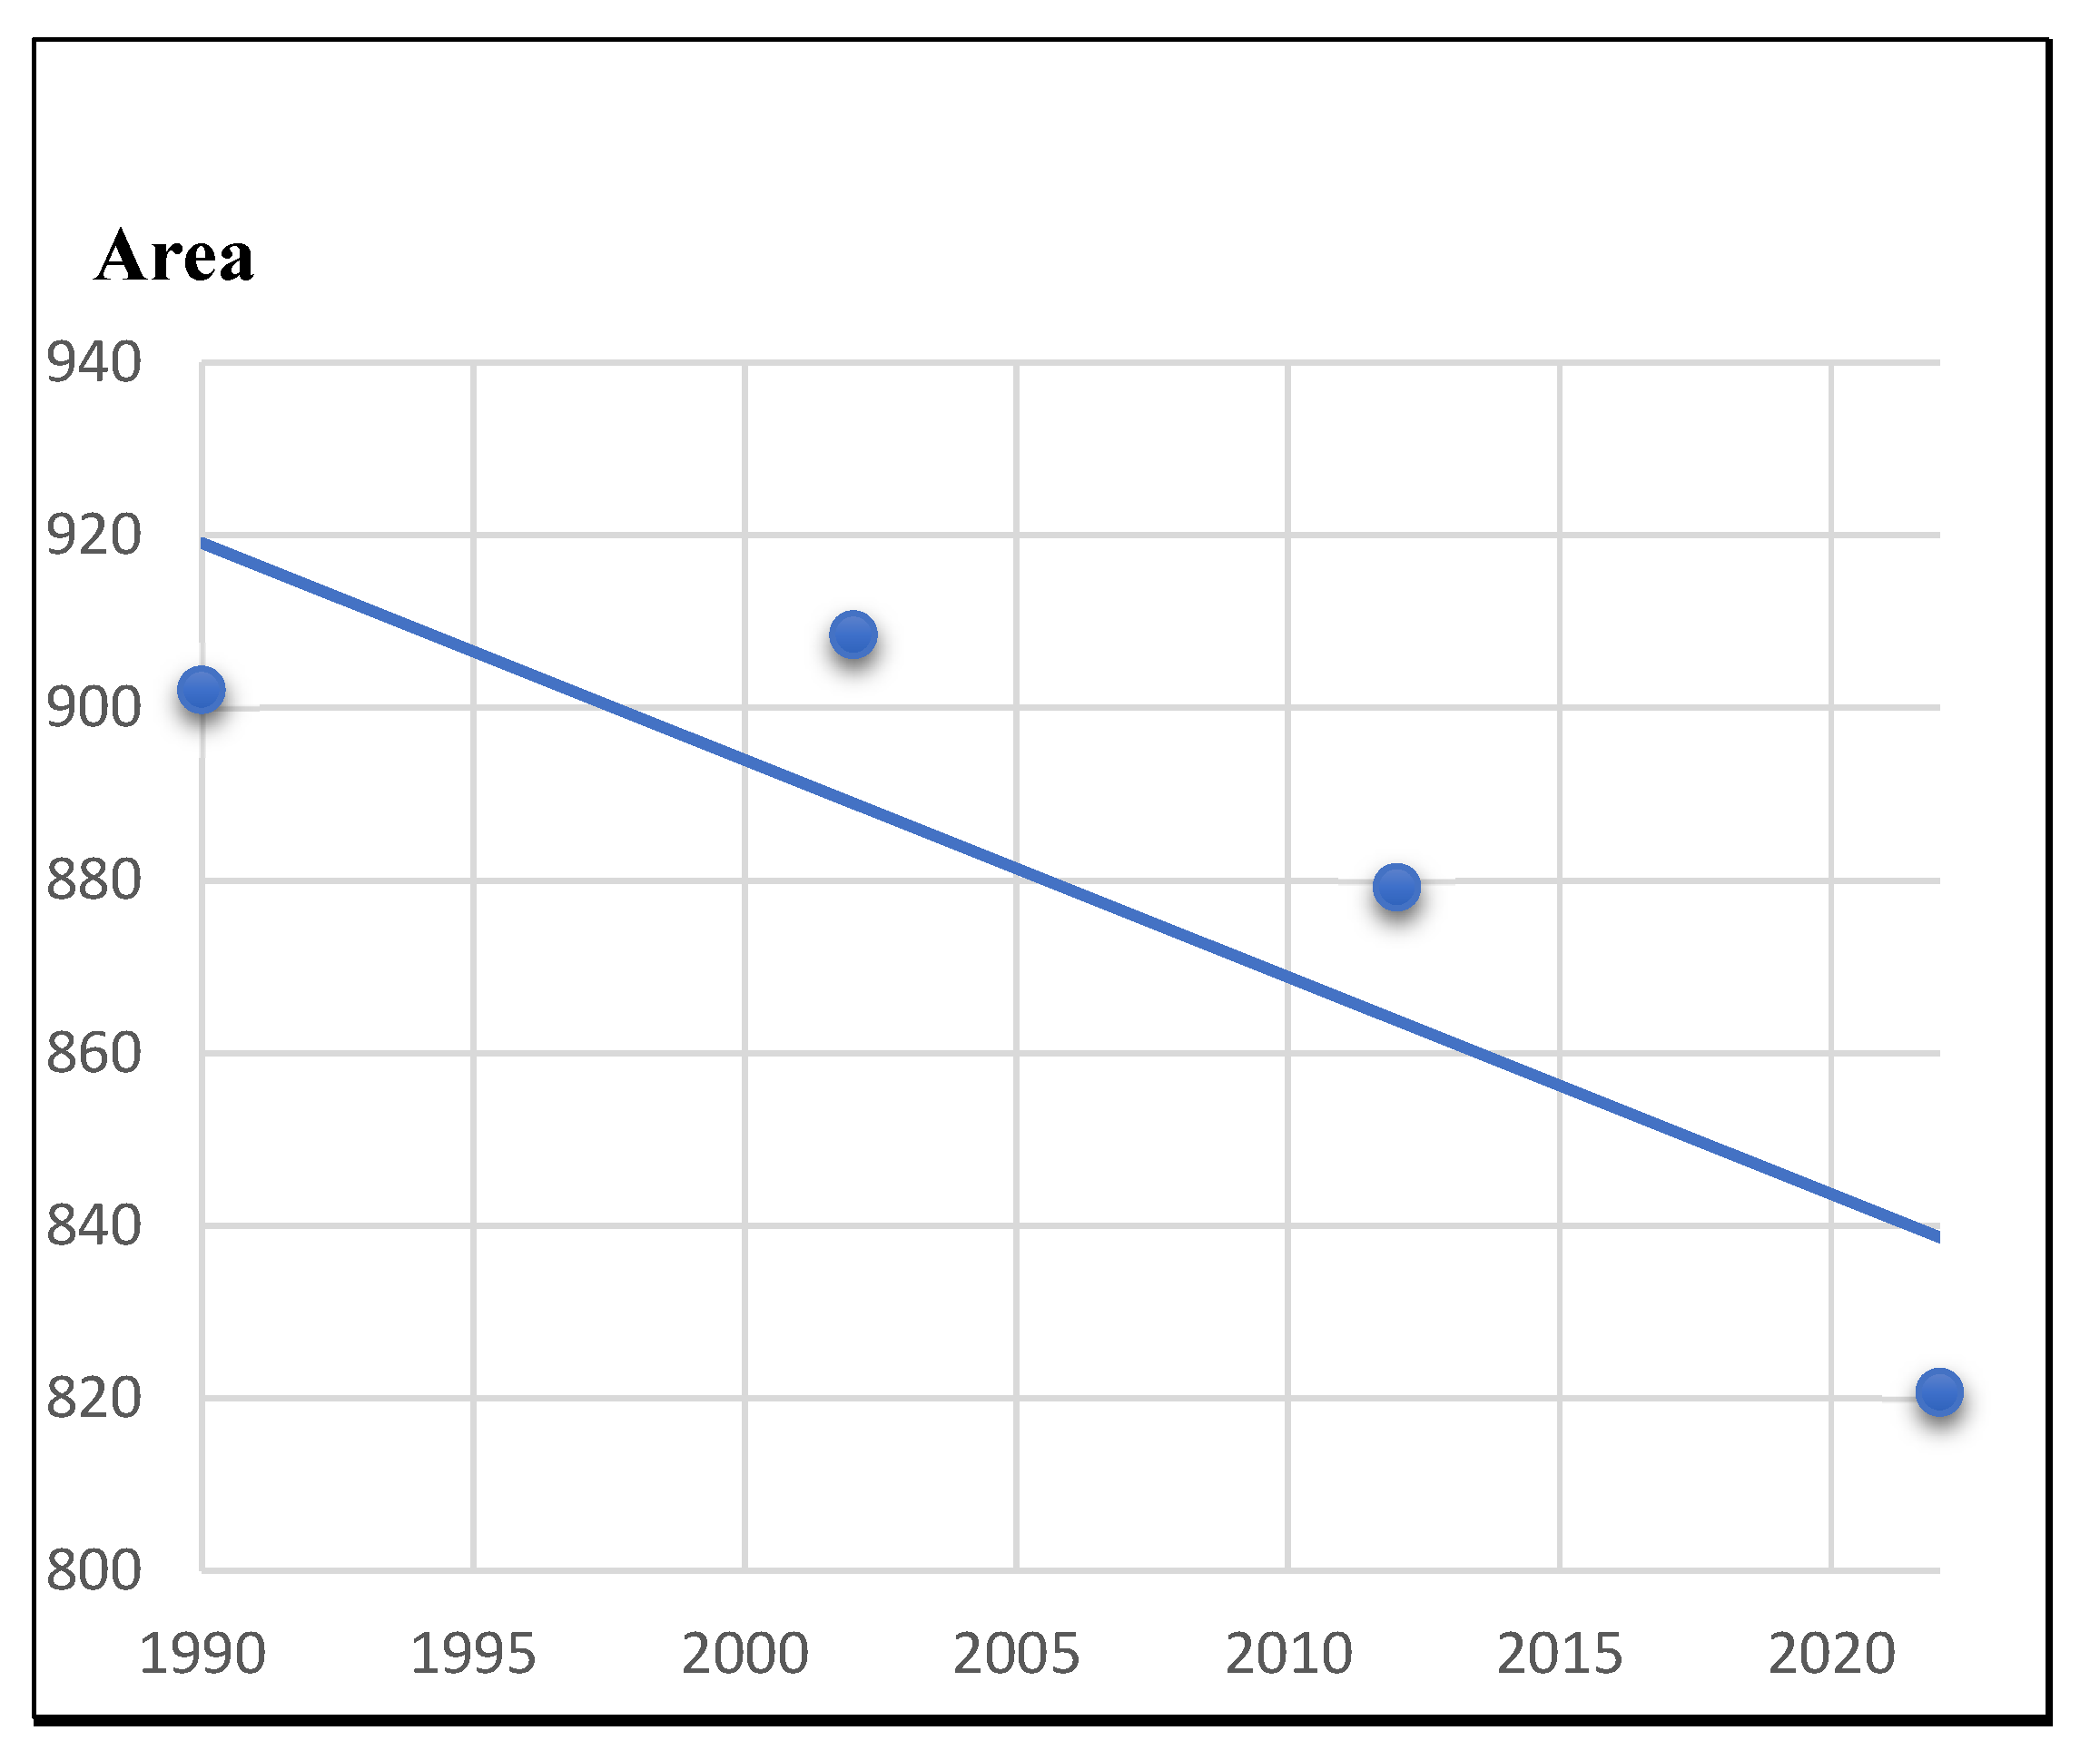
Changes in green spaces are most pronounced in unprotected peripheral green areas, which have gradually disappeared, becoming either built-up or bare soil. However, protected green spaces are also not immune to this trend. Dakar has three major public green spaces, which are the city’s main green lungs. These areas are protected by presidential decree. These green spaces such as the Hann Forest and Zoological Park, the Mbao Classified Forest, and the Great Niaye and Dependence Urban Natural Reserve have experienced decreasing plant cover over the years, as shown in Figure 6. The figure shows a gradual decline in vegetation cover of these three large green spaces. From 902.07 ha in 1990 to 820.71 ha in 2022, a decrease of 81.36 ha. This reduction is due to multiple declassifications permitting the construction of road infrastructure, such as the motorway that crosses the reserve and classified forest, as well as administrative buildings, as seen in Hann Park (Figure 7).
Figure 6.
Changes in vegetation cover of the three major green spaces in Dakar from 1990 to 2022.
Globally, urban green spaces have significantly declined, as documented by several studies. [43,44]. In Africa, for example, in Kumasi, Ghana, green spaces are often replaced by buildings and bare soil [45]. In Ethiopia, a similar pattern was observed, with green spaces transformed into open unvegetated areas due to urban development [46]. Green spaces are also shrinking in parts of Asia due to extensive urbanisation. For instance, a spatio-temporal study of Mumbai, India, revealed significant changes from 1988 to 2018 driven by urban expansion, increased built-up areas, and notably migratory flows [47].
5. Conclusions
This study investigated the evolution of Dakar’s green spaces between 1990 and 2022. Landsat imageries, land use and land cover were used to quantify green spaces over time. The results showed a downward trend in Dakar’s green spaces over time and space. The study revealed that Dakar’s urban expansion has resulted in a significant reduction in green spaces, both qualitatively and qualitatively. Dakar’s development has proceeded at an exponential rate, destroying plant cover and, at the same, a redistribution of open spaces where other green spaces could be developed. Moreover, the reduction in green spaces would not be without consequences, mainly an increase in urban heat islands, flooding, and air quality, which is a recurring environmental problem in the city. This would impact on the quality of life of the inhabitants. Hence there is a need for sustainable urban planning that would take into account the development aspects and the conservation of Dakar’s environment.
To address this issue, it is crucial to implement policies that actively preserve green spaces in the city, which is urgently needed to prevent further loss. Additionally, expanding green space development with community participation such as reforestation days held during the rainy season is essential. To fully understand the implications of spatial changes in Dakar, continued monitoring of plant resources and assessing the impact on ecosystem services in this rapidly growing city are both critical. With the urbanisation of Dakar, protecting green spaces is essential to ensure sustainability, enhance resilience to climate change, and improve the quality of life in the Senegalese capital.
Author Contributions
Conceptualisation, M.C., O.M., E.M., A.N.F. and A.A.O.; methodology, M.C.; formal analysis, M.C.; investigation, M.C.; data curation, M.C.; writing—original draft preparation, M.C., O.M., E.M., A.N.F.; writing—review and editing, M.C., O.M., E.M., A.N.F.; supervision, M.C., O.M., E.M., A.N.F. All authors have read and agreed to the published version of the manuscript.
Funding
This research was funded by the West African Science Service Centre on Climate Change and Adapted Land Use (WASCAL) supported by the German Federal Ministry of Education and Research.
Data Availability Statement
The satellite data used in this study are free and available on the website Earth Explorer via https://earthexplorer.usgs.gov
Acknowledgements
The authors acknowledge the support of WASCAL CC HH staff. We thank the University of Applied Sciences, Neubrandenburg, Germany for their support. We are grateful to the Natural Ecosystem and Environment Research Unit, Environmental Sciences Institute, Cheikh Anta Diop University, Dakar, Senegal for their contribution to this work.
Conflicts of Interest
The authors declare no conflicts of interest.
References
- V. Saini, “Mapping Environmental Impacts of Rapid Urbanisation and Deriving Relationship between NDVI , NDBI and Surface Temperature : A Case Study Mapping Environmental Impacts of Rapid Urbanisation and Deriving Relationship between NDVI , NDBI and Surface Temperat,” Sci. Environ., 2022. [CrossRef]
- T. Weith, T. Barkmann, N. Gaasch, S. Rogga, C. Strauß, and J. Zscheischler, Sustainable Land Management in a European Context. 2021.
- Q. Zhong, J. Ma, B. Zhao, X. Wang, J. Zong, and X. Xiao, “Remote Sensing of Environment Assessing spatial-temporal dynamics of urban expansion , vegetation greenness and photosynthesis in megacity Shanghai , China during 2000–2016,” Remote Sens. Environ., vol. 233, no. July, p. 111374, 2019. [CrossRef]
- R. Fratini and E. Marone, “Repository istituzionale dell ’ Università degli Studi di Firenze Green-space in Urban Areas : Evaluation of Ficiency of Public Spending for Management of Green Urban Areas,” Int. J. E-bus. Dev., vol. 1, no. 1, pp. 9–14, 2011.
- A. Sangwan, A. Saraswat, N. Kumar, S. Pipralia, and A. Kumar, “Urban Green Spaces Prospects and Retrospect’s,” in Urban Green Spaces [Working Title], IntechOpen, 2022.
- Z. Yu, X. Guo, Y. Zeng, M. Koga, and H. Vejre, “Variations in land surface temperature and cooling e ffi ciency of green space in rapid urbanization : The case of Fuzhou city , China ☆,” Urban For. Urban Green., vol. 29, no. September 2017, pp. 113–121, 2018. [CrossRef]
- C. Swanwick, N. Dunnett, and H. Woolley, “Nature, role and value of green space in towns and cities: An overview,” Built Environ., vol. 29, no. 2, pp. 94–106, 2003. [CrossRef]
- C. A. Mensah, “Urban Green Spaces in Africa: Nature and Challenges,” Int. J. Ecosyst., vol. 2014, no. 1, pp. 1–11, 2014. [CrossRef]
- J. Bush, G. Ashley, B. Foster, and G. Hall, “Integrating green infrastructure into urban planning: Developing melbourne’s green factor tool,” Urban Plan., vol. 6, no. 1, pp. 20–31, 2021. [CrossRef]
- H. Tallis and P. Kareiva, “Essay ecosystem services,” Curr. Biol., vol. 15, no. 18, p. 746, 2007, [Online]. Available: http://esd.uvm.edu/.
- S. Hamada and T. Ohta, “Urban Forestry & Urban Greening Seasonal variations in the cooling effect of urban green areas on surrounding urban areas,” Urban For. Urban Green., vol. 9, no. 1, pp. 15–24, 2010. [CrossRef]
- S. A. Haq, “Urban Green Spaces and an Integrative Approach to Sustainable Environment,” vol. 2011, no. July, pp. 601–608, 2011. [CrossRef]
- R. Kadaverugu, C. Gurav, A. Rai, A. Sharma, and C. Matli, “Quantification of heat mitigation by urban green spaces using InVEST model — a scenario analysis of Nagpur City , India,” 2021.
- D. J. Nowak, E. J. Greenfield, R. E. Hoehn, and E. Lapoint, “Carbon storage and sequestration by trees in urban and community areas of the United States,” Environ. Pollut., vol. 178, pp. 229–236, 2013. [CrossRef]
- M. V. Oviantari, I. M. Gunamantha, N. P. Ristiati, I. M. P. A. Santiasa, and P. P. Y. Astariani, “Carbon sequestration by above-ground biomass in urban green spaces in Singaraja city,” IOP Conf. Ser. Earth Environ. Sci., vol. 200, no. 1, 2018. [CrossRef]
- N. Shishegar, “The Impact of Green Areas on Mitigating Urban Heat Island Effect : A Review,” no. January 2014, 2015.
- H. Tang, “Spatiotemporal Dynamics of Green Spaces in the Beijing—Tianjin—Hebei Region in the Past 20 Years,” pp. 1–15, 2018. [CrossRef]
- L. Wu and S. K. Kim, “Health outcomes of urban green space in China: Evidence from Beijing,” Sustain. Cities Soc., vol. 65, p. 102604, 2021. [CrossRef]
- K. Tzoulas and P. James, “Finding links between urban biodiversity and human health and well-being,” Environment, pp. 208–217, 2004, [Online]. Available: http://usir.salford.ac.uk/11380/.
- World Health Organization, “Urban green spaces: A brief for action,” 2017. [Online]. Available: http://www.euro.who.int/__data/assets/pdf_file/0010/342289/Urban-Green-Spaces_EN_WHO_web.pdf?ua=1.
- G. Kothencz, R. Kolcsár, P. Cabrera-Barona, and P. Szilassi, “Urban green space perception and its contribution to well-being,” Int. J. Environ. Res. Public Health, vol. 14, no. 7, 2017. [CrossRef]
- C. A. Mensah, “Destruction of urban green spaces : A problem beyond urbanization in Kumasi city ( Ghana ),” vol. 3, no. 1, pp. 1–9, 2014. [CrossRef]
- D. A. Puplampu and Y. A. Boafo, “Exploring the impacts of urban expansion on green spaces availability and delivery of ecosystem services in the Accra metropolis,” Environ. Challenges, vol. 5, no. July, p. 100283, 2021. [CrossRef]
- D. R. Richards et al., “Rapid urbanisation in Singapore causes a shift from local provisioning and regulating to cultural ecosystem services use,” vol. 46, no. December 2019, 2020. [CrossRef]
- X. Li and L. C. Stringer, “The Impacts of Urbanisation and Climate Change on the Urban Thermal Environment in Africa,” pp. 1–21, 2022.
- S. Xiao et al., “The dynamics of vegetation and implications for ecosystem services in the context of urbanisation : An example from Huangyan-Taizhou , China The dynamics of vegetation and implications for ecosystem services in the context of urbanisation : An example from Huangyan-Taizhou , China,” Ecol. Eng., vol. 179, no. June, p. 106614, 2022. [CrossRef]
- M. Ramaiah and R. Avtar, “Urban Green Spaces and Their Need in Cities of Rapidly Urbanizing India: A Review,” Urban Sci., vol. 3, no. 3, p. 94, 2019. [CrossRef]
- B. Sambou, “Evaluation de l’état, de la dynamique et des tendances évolutives de la flore et de la végétation ligneuses dans les domaines soudanien et sub-guinéen au Sénégal,” Doctorat, Université Cheikh Anta Diop, Sénégal, 2004.
- S. D. Dieng, “Identification et évaluation des services écosystémiques fournis par Cordyla pinnata (Lepr. Ex A.Rich.) Milne-Redh., Detarium microcarpum Guill. et Perr. et Detarium senegalense J.F. Gmel. : cas de la Forêt Classée de Patako et de ses environs (Centre-Ouest)”, Doctorat, Université Cheikh Anta Diop de Dakar, Sénégal, 2017.
- Ba. H. Badiane Sidia Diaouma, Deme Mamoudou, Sy Thierno Bachir, “Etude exploratoire de la réhabilitation et des pratiques des espaces verts publics à Dakar ( Sénégal ),” vol. 7, no. 1, pp. 947–955, 2023.
- S. Diaouma and B. E. Mbaye, “Zones humides urbaines à double visage à Dakar : opportunité ou menace ?,” Sci. Eaux Territ. la Rev. d’Irstea Sci. Eaux &Territoires La Rev. d’Irstea, pp. 1–5, 2018.
- M. A. Dieng and M. Keita, “Télédé tection et SIG dans l ’ analyse spatio -temporelle de la dynamique urbaine de Dakar , Sénégal,” vol. 13, no. 2, pp. 292–306, 2017.
- T. Sane and A. Ndiaye, “Les risques liés au temps et au climat,” XIXe Colloq. Int. Climatol., p. 572, 2006.
- Regional Service of Statistics and Demography of Dakar, “Situation Economique Et Sociale Regionale 2019,” 2021. [Online]. Available: http://www.ansd.sn/index.php?option=com_regions&view=region&layout=ses&id=1.
- M. Diagne, “Entre géographie culturelle et phytogéographie : Croyances traditionnelles en milieu Lébou dakarois : le dynamisme et les permanences.,” Université Cheikh Anta Diop de Dakar, 2008.
- C. Faye, “Changements climatiques observés sur le littoral sénégalais ( Région de Dakar ) depuis 1960 : Etude de la variabilité des tendances sur les températures et la pluviométrie,” Nat. Technol., no. March, pp. 65–78, 2019, [Online]. Available: http://www.univ-chlef.dz/revuenatec.
- B. Seremane, B. Kannan, V. Ravikumar, K. Arunadevi, and R. Jagadeeswaran, “Assessing Land Use Dynamics of Lower Bhavani Basin Using Multiple GIS Platforms,” vol. 13, no. 10, pp. 1090–1096, 2023. [CrossRef]
- P. Saraf and D. G. Regulwar, “Land Use Land Cover Analysis for Godavari Basin in Maharashtra Using Geographical Information System and Remote Sensing,” pp. 21–31, 2024. [CrossRef]
- K. Tempa and K. Raj, “Semi— automatic classification for rapid delineation of the geohazard— prone areas using Sentinel— 2 satellite imagery,” SN Appl. Sci., no. March, 2022. [CrossRef]
- S. Sambou, “Dynamique de la végétation et des stocks de carbone de la forêt classée de Patako et sa périphérie (Centre-ouest du Sénégal)”, Doctorat, Université Cheikh Anta Diop de Dakar, Sénégal, 2017.
- C. Kamusoko, “Dakar Metropolitan Area,” pp. 257–273, 2017. [CrossRef]
- R. Assaye, K. V Suryabhagavan, M. Balakrishnan, and S. Hameed, “Geo-Spatial Approach for Urban Green Space and Environmental Quality Assessment : A Case Study in Addis Ababa City,” pp. 191–206, 2017. [CrossRef]
- C. Munyati and J. H. Drummond, “Loss of urban green spaces in Mafikeng, South Africa,” World Dev. Perspect., vol. 19, no. June, p. 100226, 2020. [CrossRef]
- B. Festus Nero, “International Journal of Remote Sensing Urban green space dynamics and socio-environmental inequity: multi-resolution and spatiotemporal data analysis of Kumasi, Ghana Urban green space dynamics and socio-environmental inequity: multi-resolution and spatiotemporal data analysis of Kumasi, Ghana,” 2017. [CrossRef]
- M. Biazen Molla, C. O. Ikporukpo, and C. O. Olatubara, “The Spatio-Temporal Pattern of Urban Green Spaces in Southern Ethiopia,” Am. J. Geogr. Inf. Syst., vol. 2018, no. 1, pp. 1–14, 2018. [CrossRef]
- M. Matsa et al., “Loss of urban green spaces due to increased land use / cover changes between 2000-2019: The case of Gweru city, Zimbabwe,” African Geogr. Rev., vol. 00, no. 00, pp. 1–19, 2021. [CrossRef]
Figure 1.
Location map of the study area.
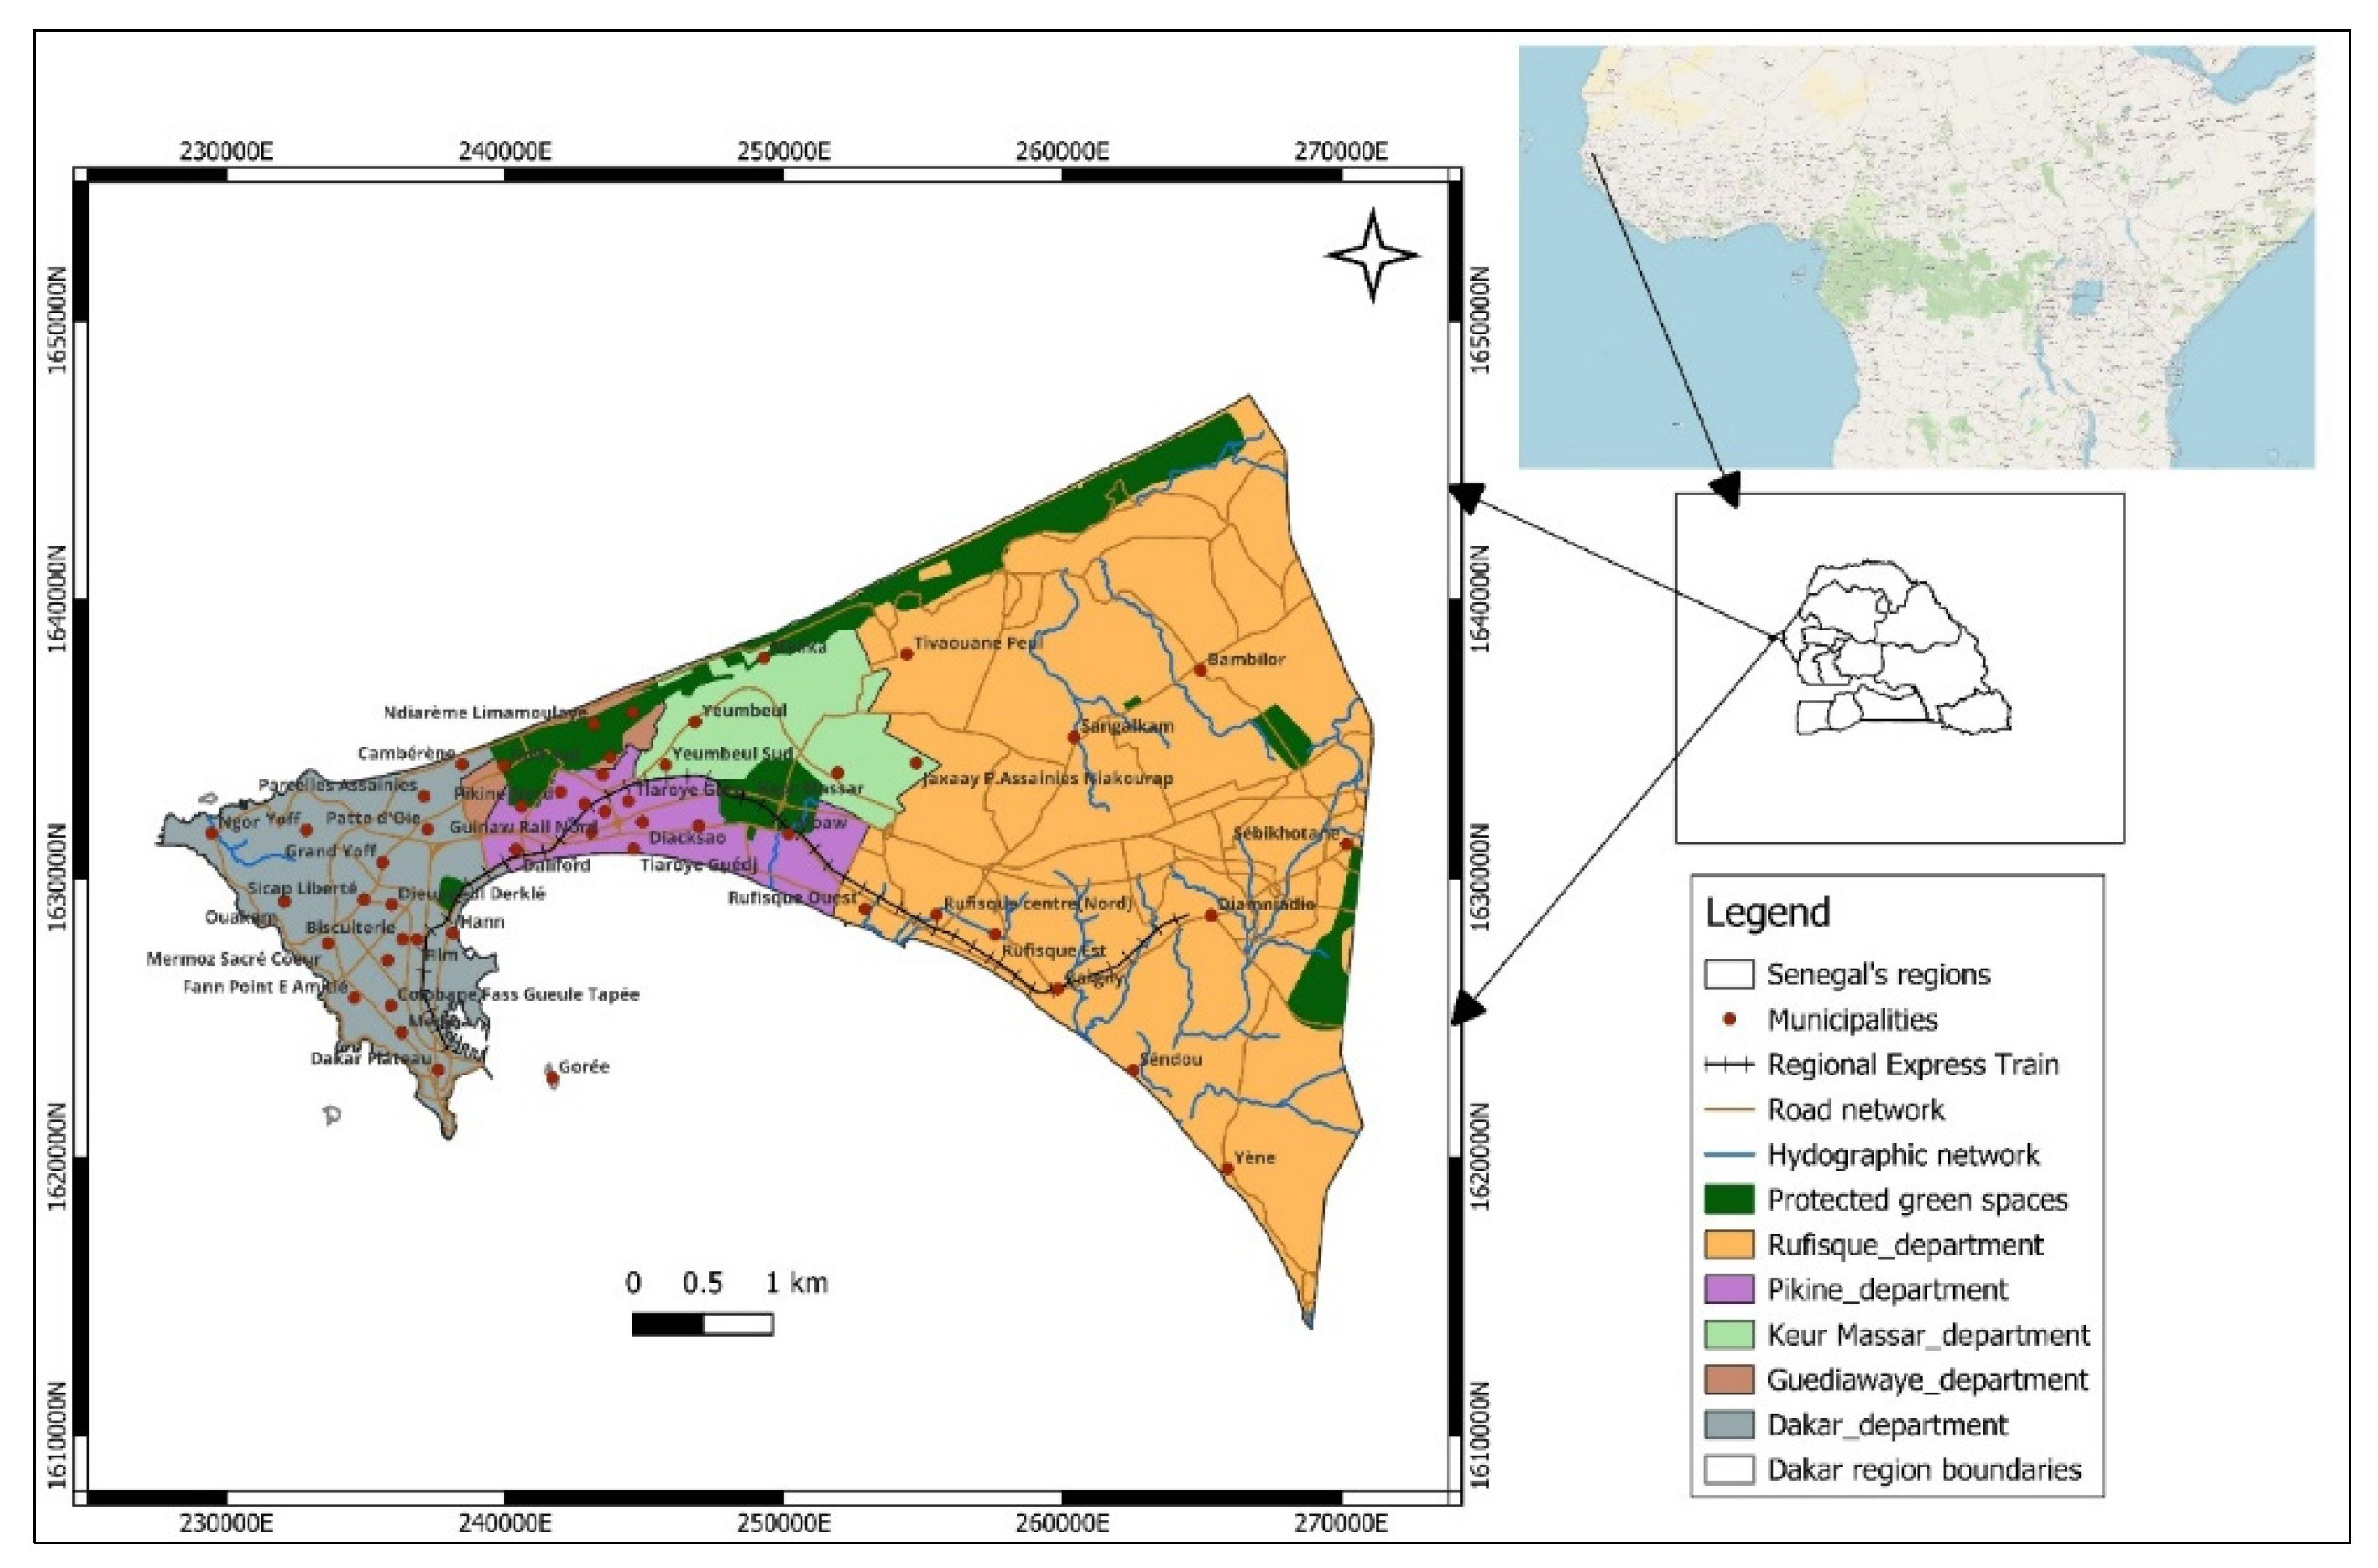
Figure 2.
Flowchart of processing Landsat data.
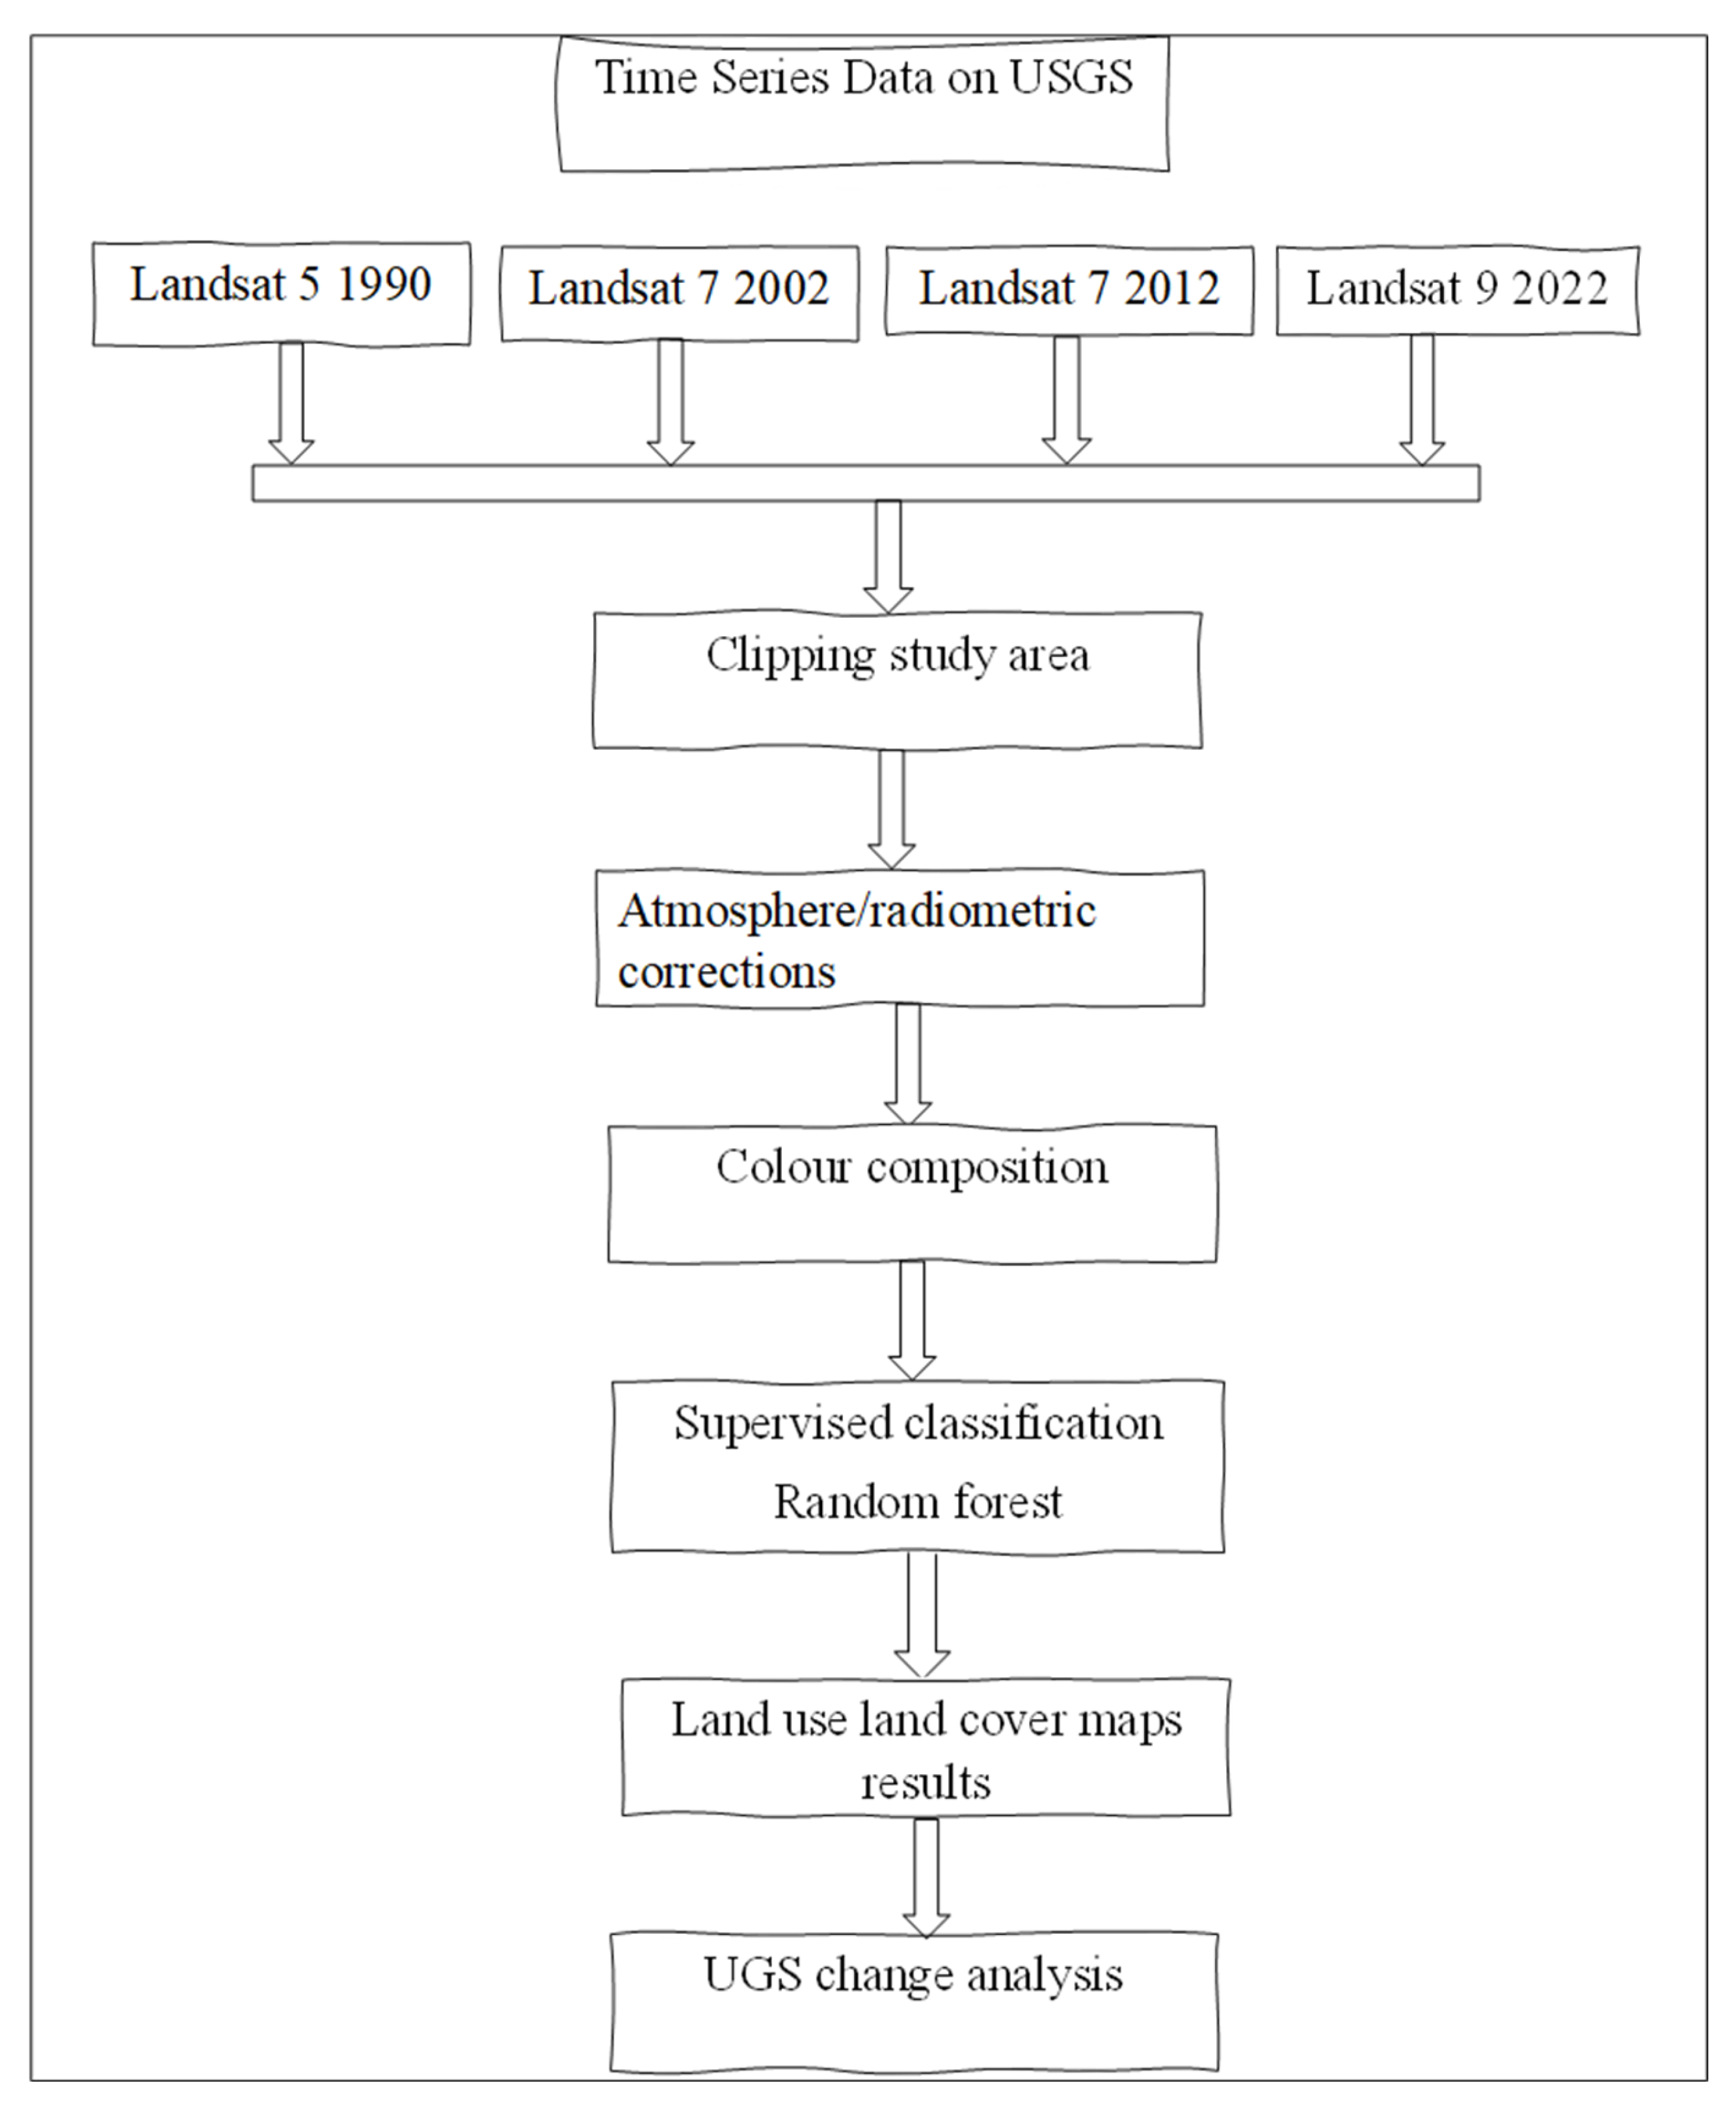
Figure 3.
Land cover classes of Dakar from 1990 (A) and 2002 (B).
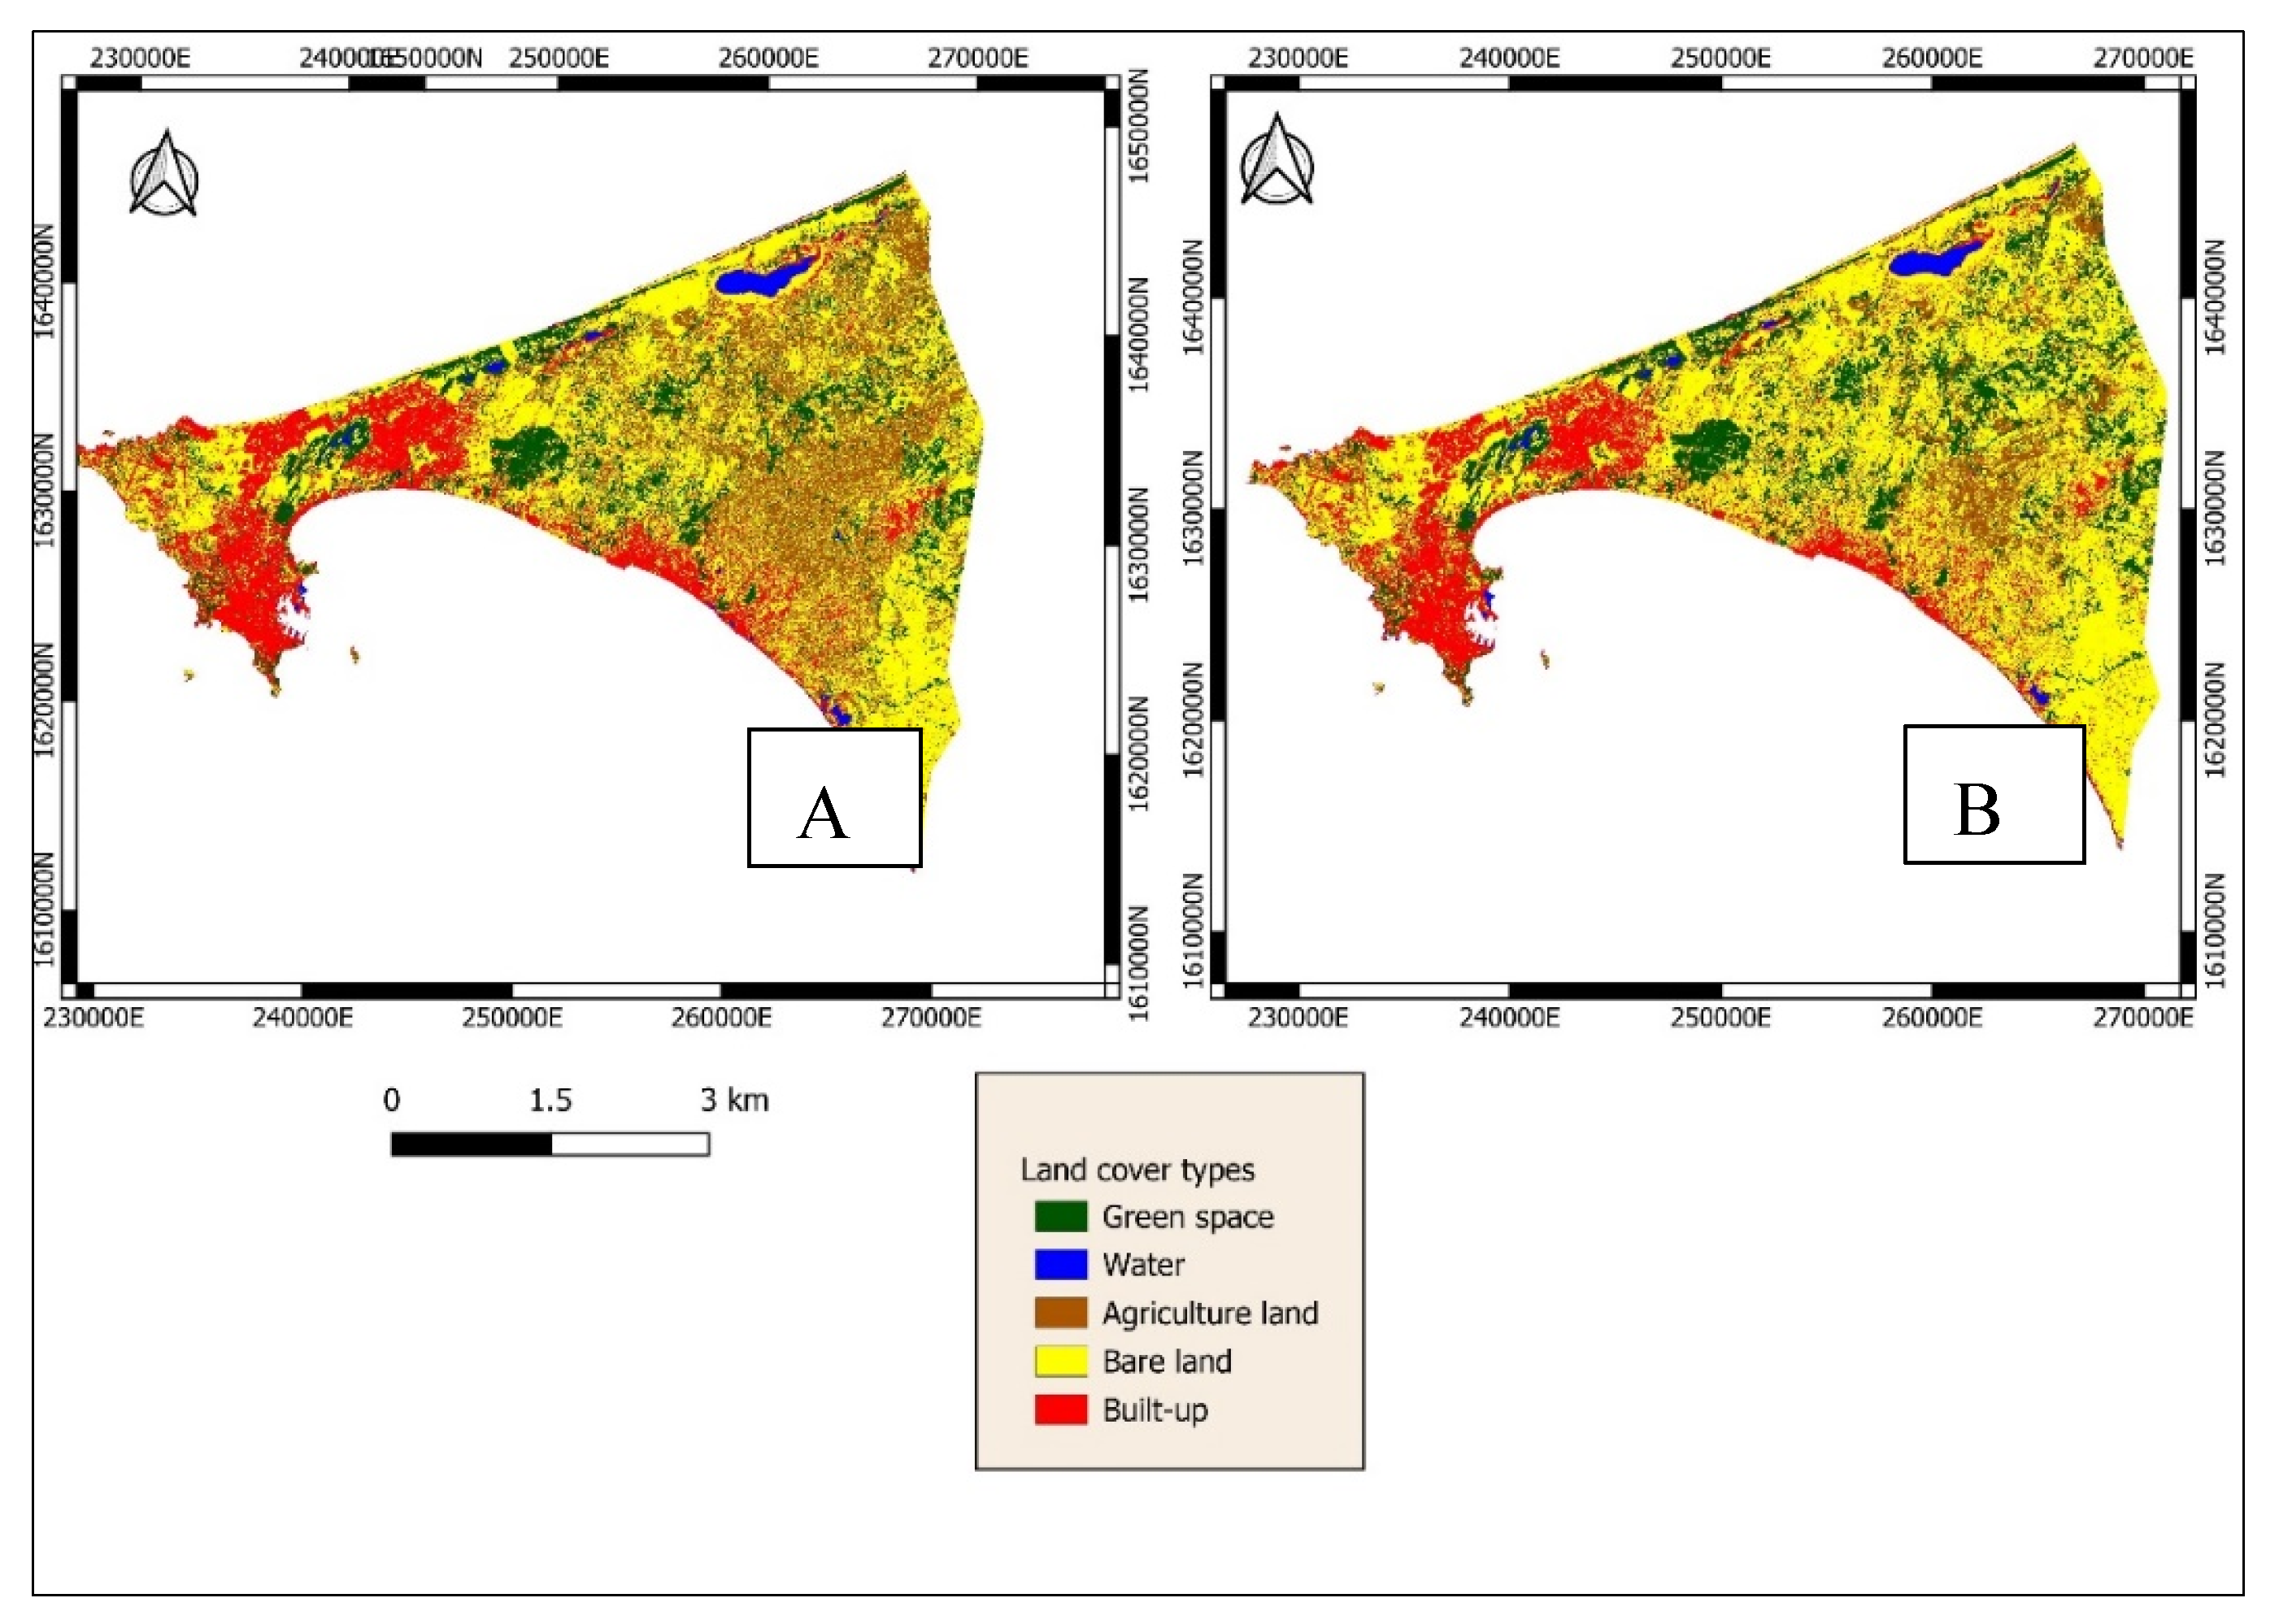
Figure 4.
Land cover classes of Dakar from 2012 (C) and 2022 (D).
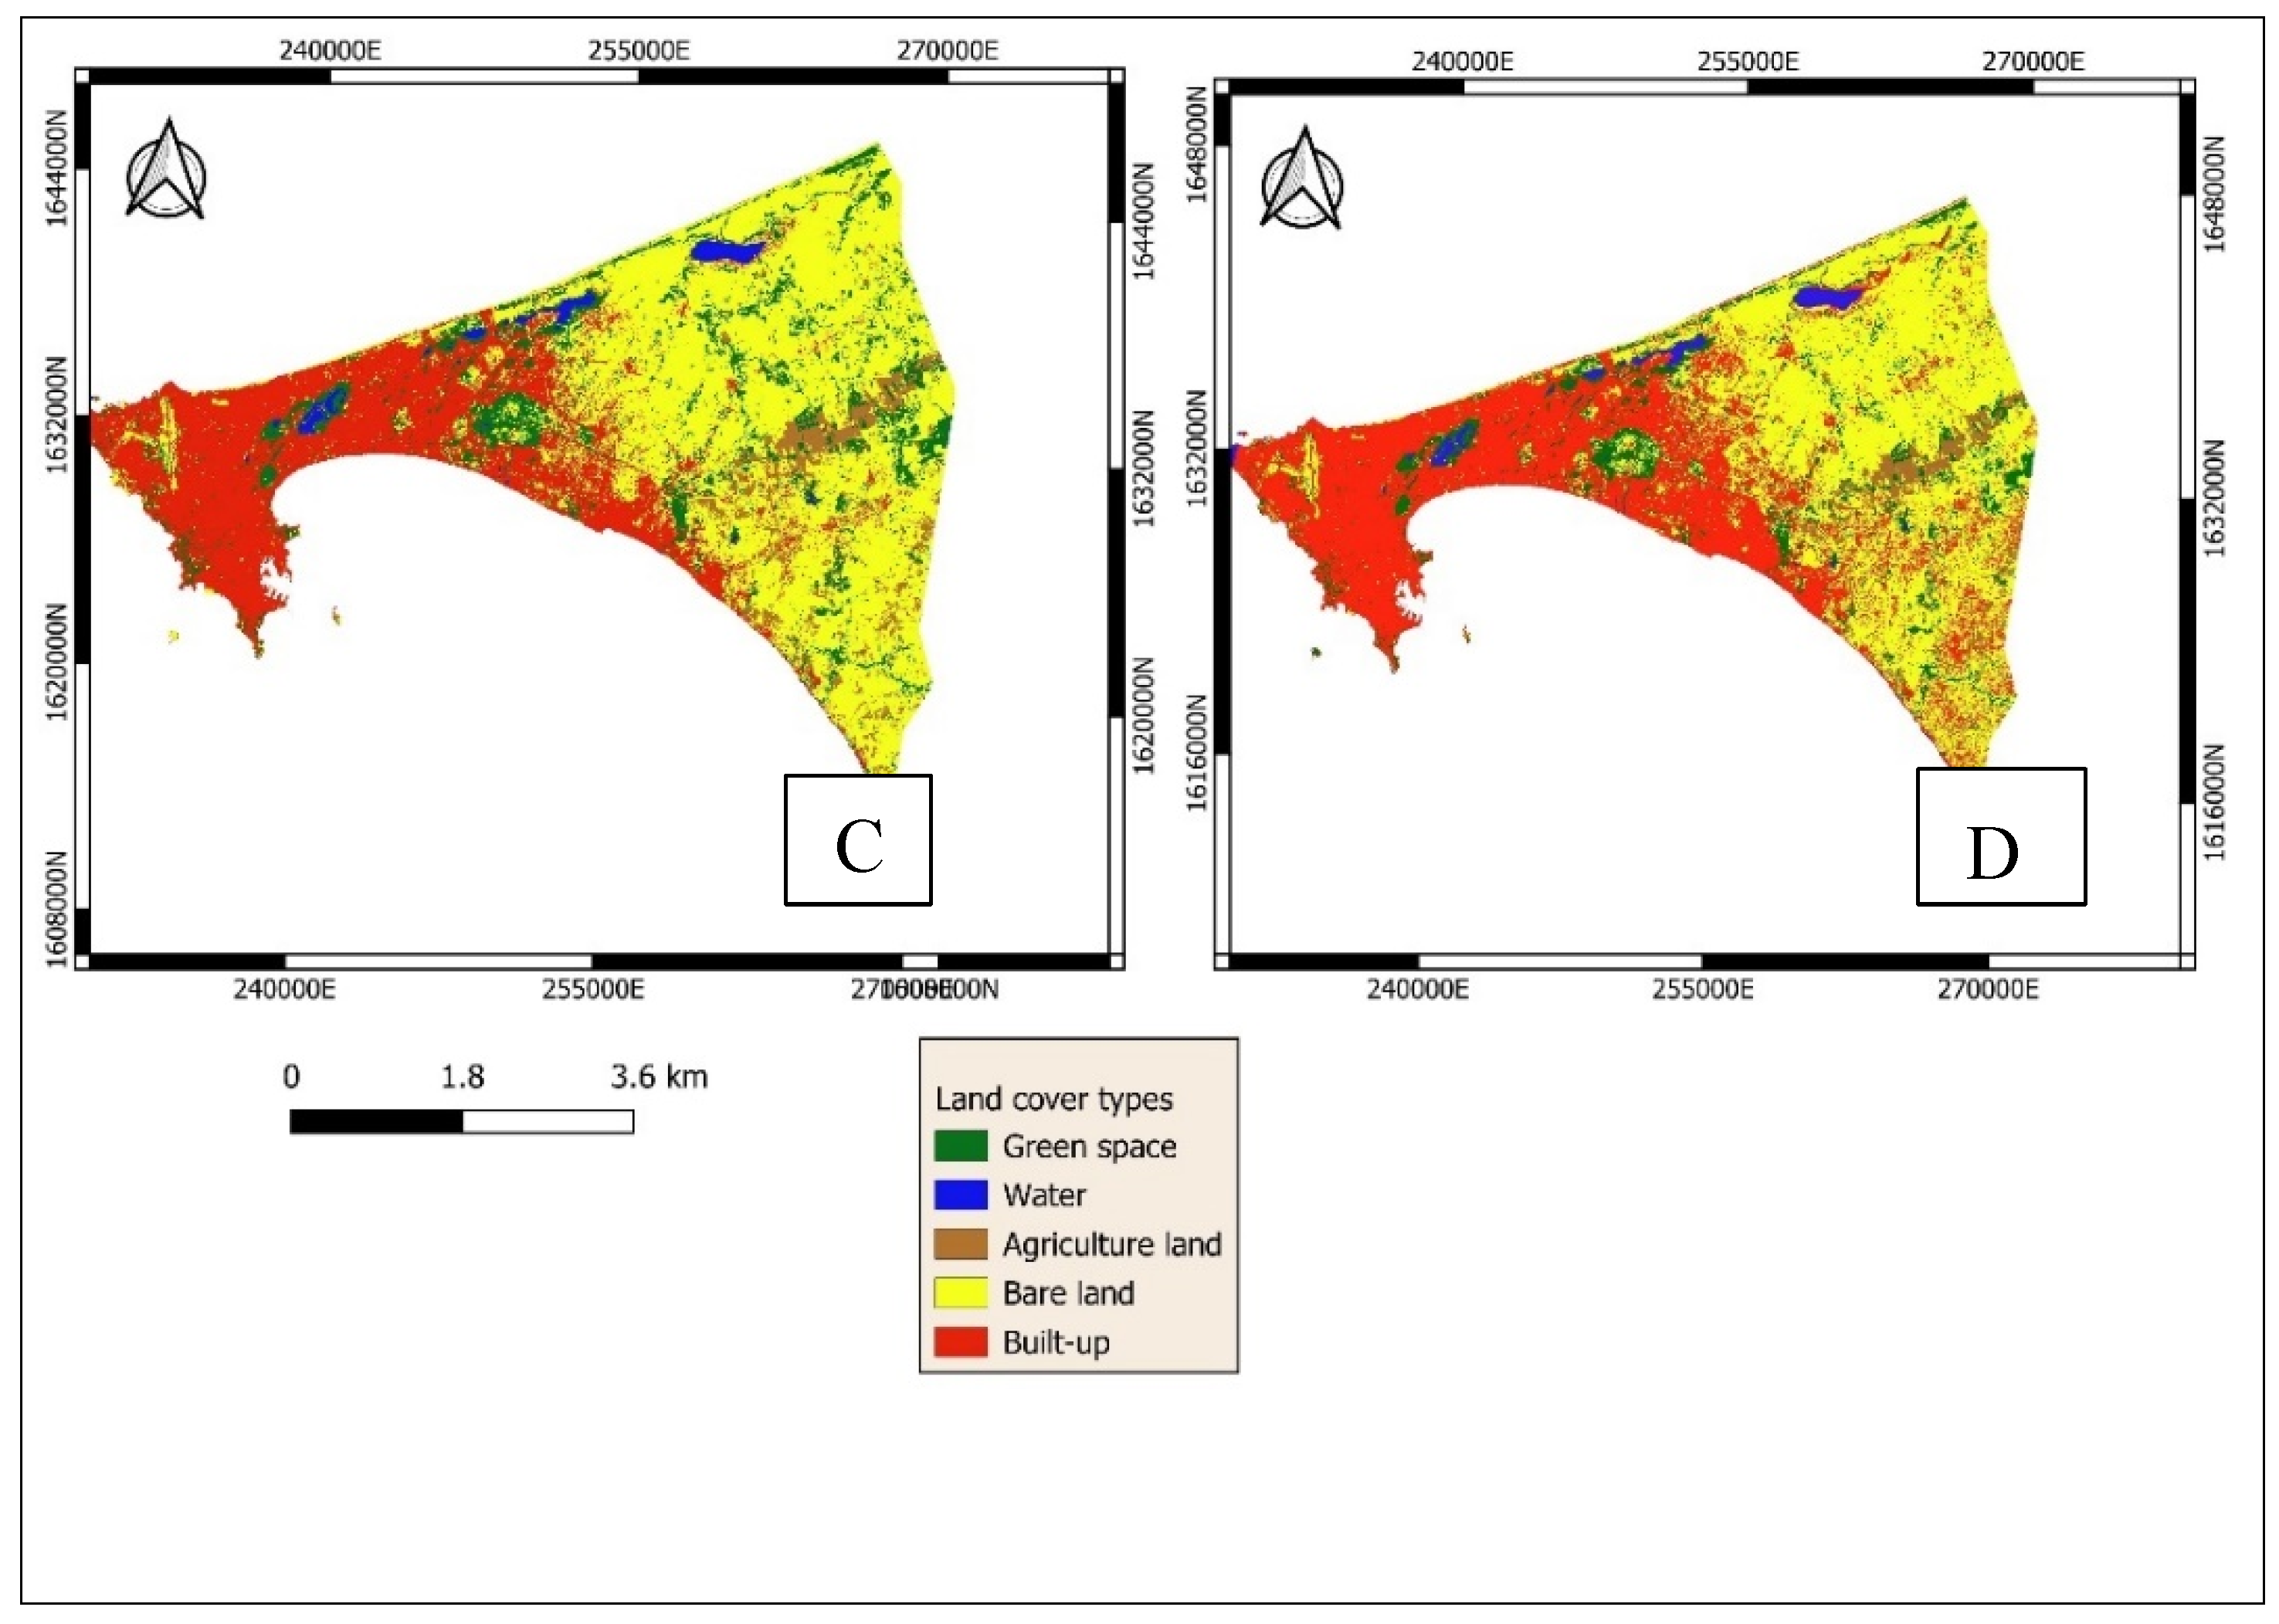
Figure 5.
Percentage of land use types in the city of Dakar from 1990 to 2022.
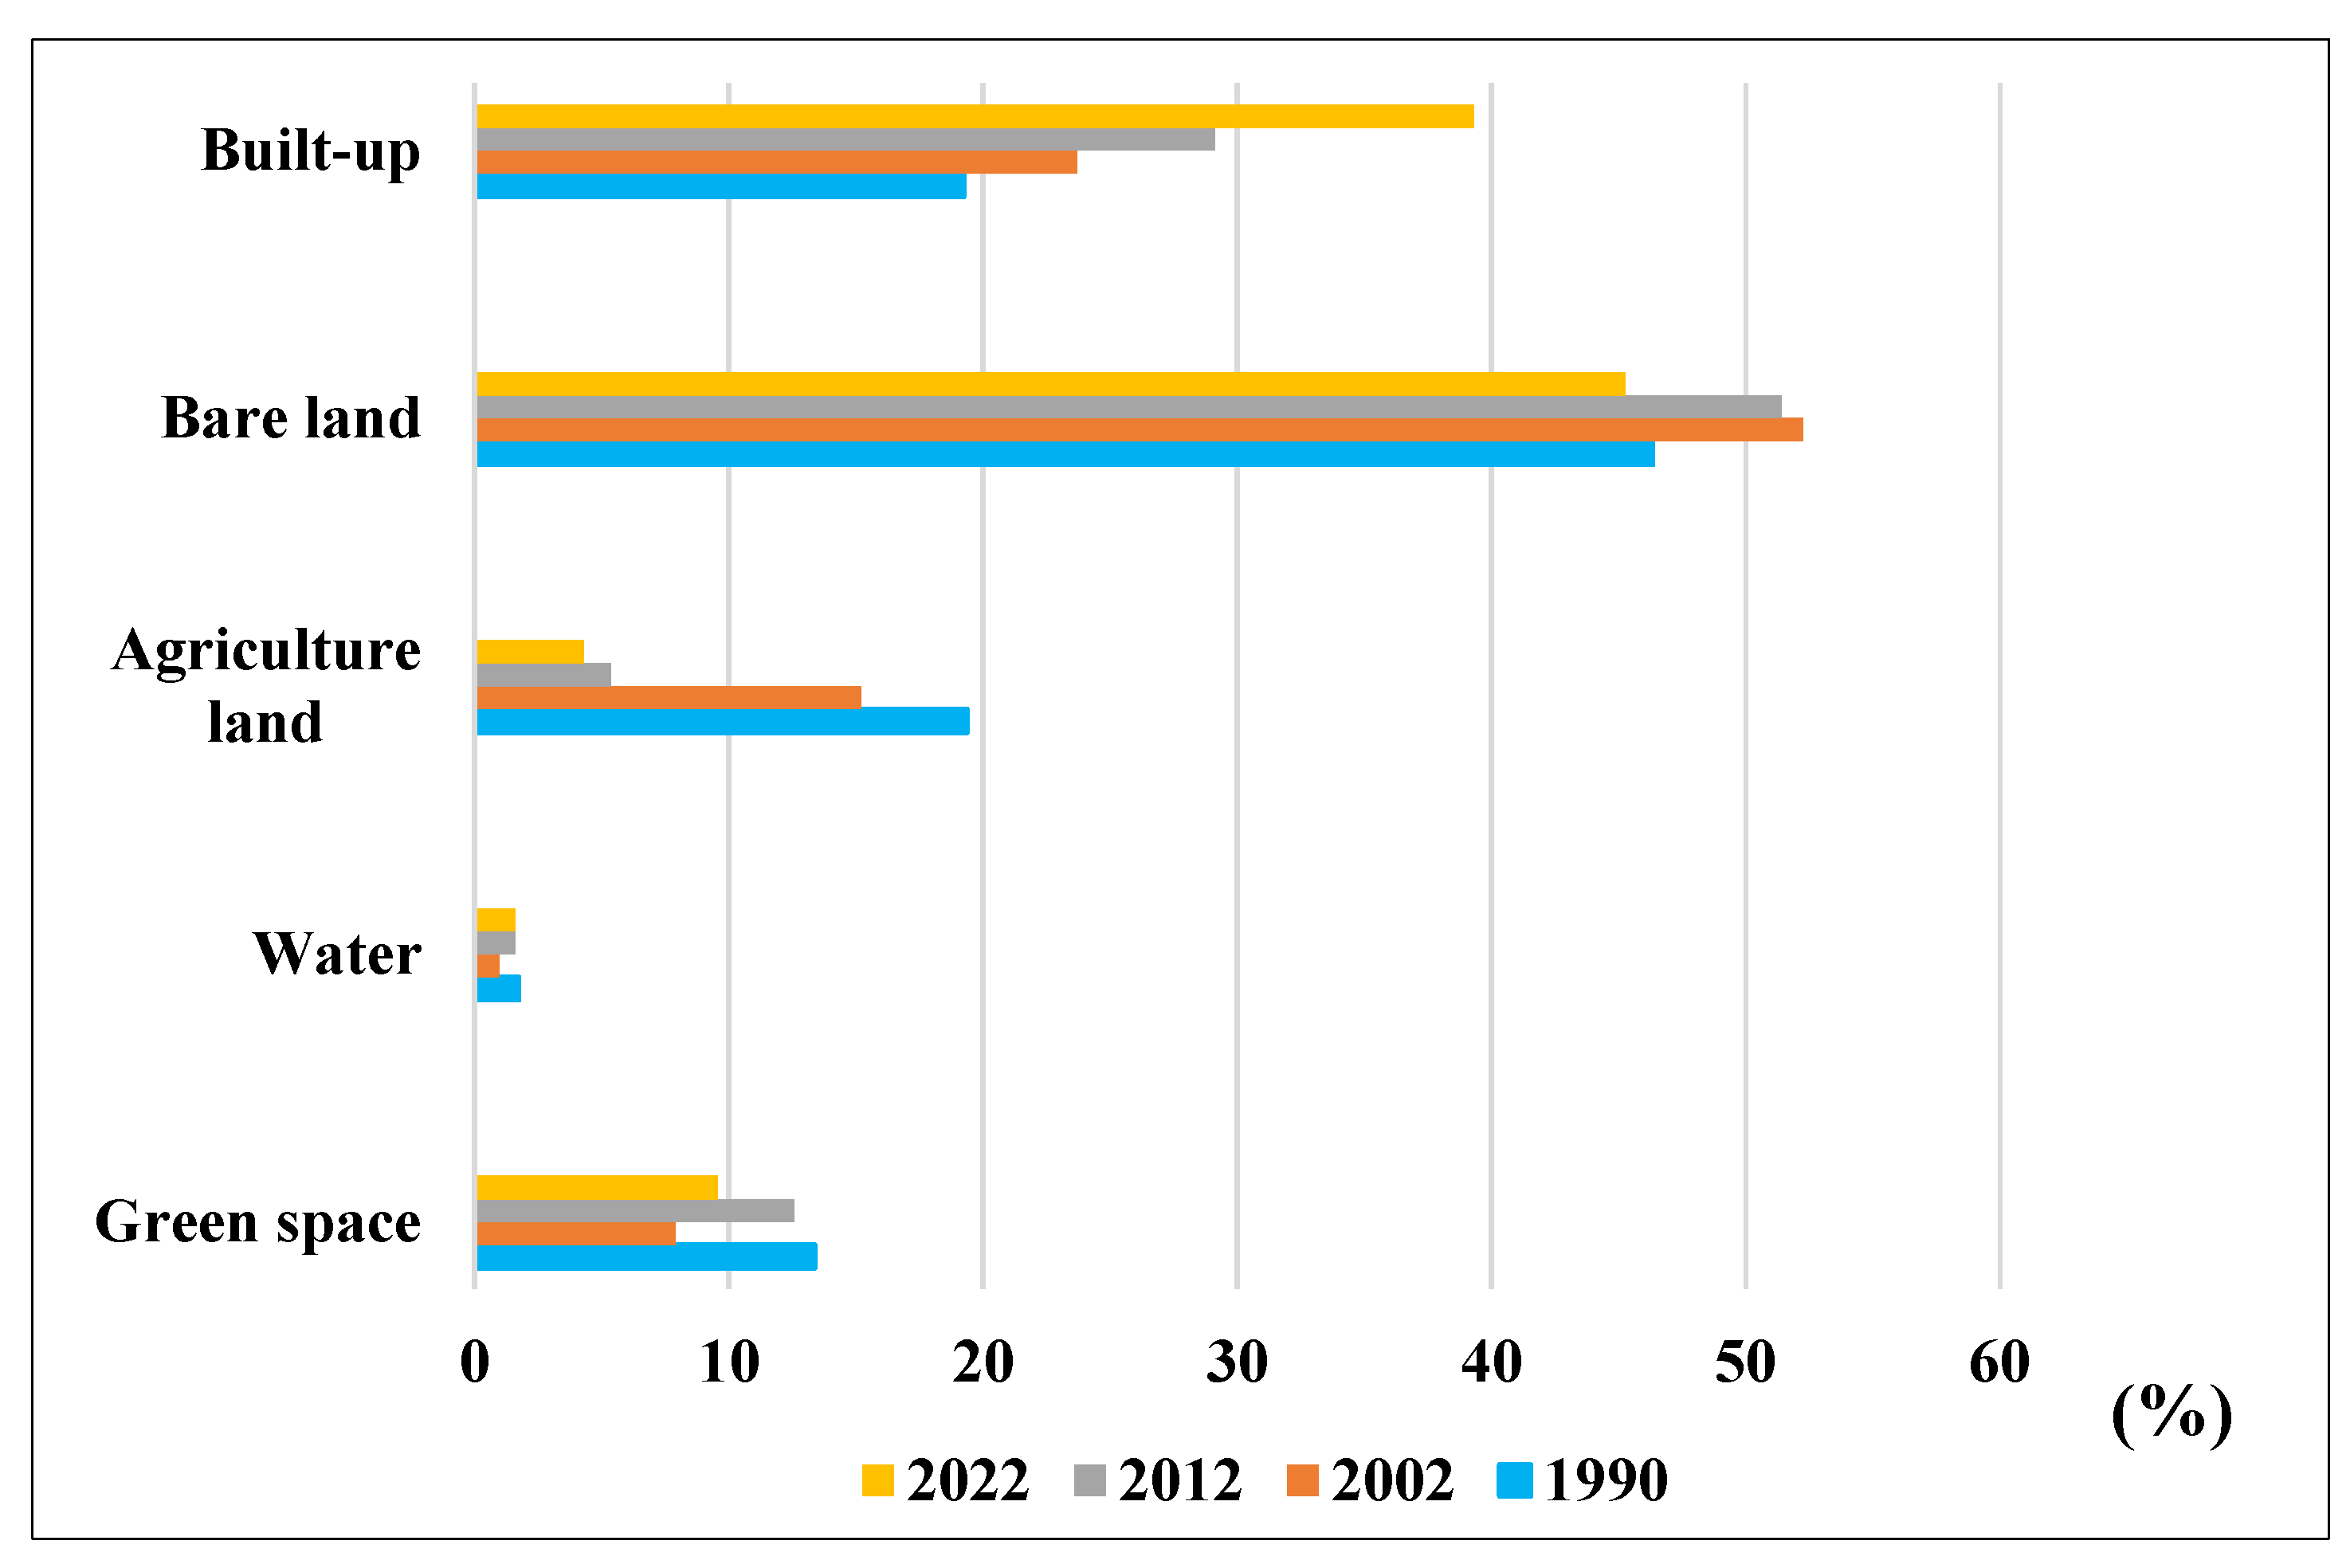
Figure 7.
Photos illustrating the fragmentation of green spaces in Dakar: (A) motorway crossing the Mbao Classified Forest, (B) buildings located in Hann Forest and Zoological Park.
Figure 7.
Photos illustrating the fragmentation of green spaces in Dakar: (A) motorway crossing the Mbao Classified Forest, (B) buildings located in Hann Forest and Zoological Park.
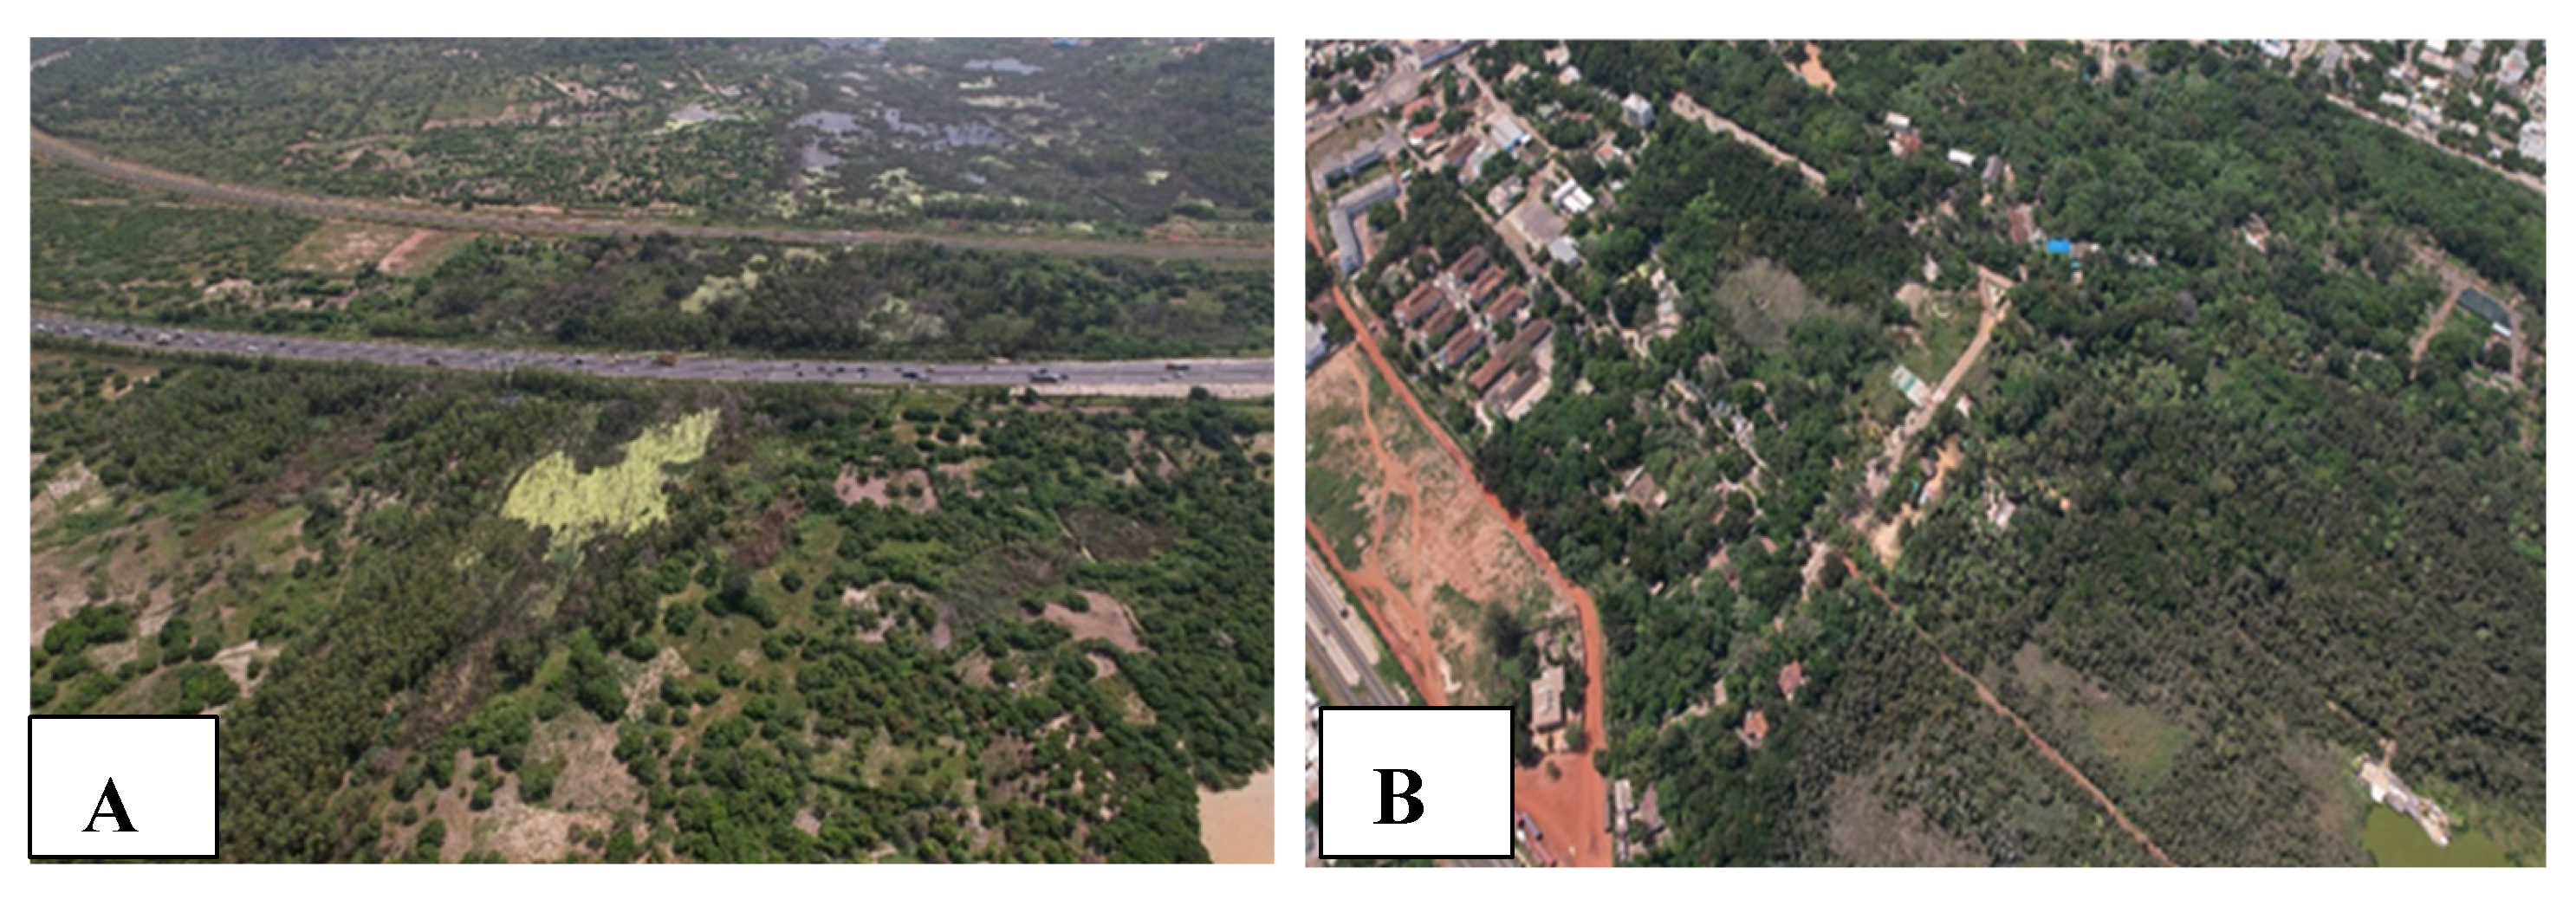

Table 1.
Satellite images chosen for the spatiotemporal dynamics analysis.
| Satellite | Path/Row | Sensor | Spectral bands | Acquisition date |
|---|---|---|---|---|
| Landsat 9 | 205/50 | OLI_TIRS | 11 | 09/04/2022 |
| Landsat 7 | 205/50 | ETM | 8 | 31/05/2012 |
| Landsat 7 | 205/50 | ETM | 8 | 18/04/2002 |
| Landsat 5 | 205/50 | TM | 7 | 05/12/1990 |
Table 2.
Land cover class description.
| Land use and land cover types | Description |
| Green space | All areas of vegetation including public and private green spaces. |
| Water | Areas of water like lakes, rivers, and ponds. |
| Agriculture land | Cultivated areas such as fields, and market gardens area. |
| Bare land | Areas devoid of vegetation or bare soil, rocks, and tannins. |
| Built-up | Impervious areas including buildings, and roads. |
Table 3.
Land use and land cover matrix from 1990 to 2002 in percentage.
| 2002 | Land cover types | 1990 | |||||
| Green space | Water | Agriculture land | Bare land | Built-up | Total | ||
| Green space | 11.14 | 0.19 | 3.07 | 1.77 | 0.17 | 16.34 | |
| Water | 0.09 | 1.11 | 0 | 0.03 | 0.03 | 1.26 | |
| Agriculture land | 0.09 | 0.01 | 6.45 | 1.64 | 0.06 | 8.25 | |
| Bare land | 1.43 | 0.08 | 9.25 | 39.08 | 5.14 | 54.98 | |
| Built-up | 0.62 | 0.33 | 0.57 | 3.82 | 13.84 | 19.18 | |
| Total | 13.37 | 1.72 | 19.34 | 46.34 | 19.24 | 100 | |
Table 4.
Land use and land cover matrix from 2002 to 2012 in percentage.
| 2012 | Land cover types | 2002 | |||||
| Greenspace | Water | Agriculture land | Bare land | Built-up | Total | ||
| Green space | 5 | 0.12 | 1.18 | 4.75 | 1.22 | 12.27 | |
| Water | 0.3 | 0.74 | 0.02 | 0.25 | 0.26 | 1.57 | |
| Agriculture land | 0.48 | 0.02 | 1.33 | 3 | 0.39 | 5.22 | |
| Bare land | 7.93 | 0.16 | 4.94 | 33.86 | 4.9 | 51.79 | |
| Built-up | 2.63 | 0.22 | 0.78 | 13.11 | 12.41 | 29.15 | |
| Total | 16.34 | 1.26 | 8.25 | 54.97 | 19.18 | 100 | |
Table 5.
Land use and land cover matrix from 2012 to 2022 in percentage.
| 2022 | Land cover types | 2012 | |||||
| Green space | Water | Agriculture land | Bare land | Built-up | Total | ||
| Green space | 8.41 | 0.02 | 0.07 | 0.85 | 0.18 | 9.53 | |
| Water | 0 | 1.55 | 0.01 | 0.02 | 1.58 | ||
| Agriculture land | 0.09 | 0 | 4 | 0.2 | 0 | 4.29 | |
| Bare land | 3.05 | 0 | 0.98 | 40.54 | 0.71 | 45.28 | |
| Built-up | 0.72 | 0 | 0.16 | 10.19 | 28.24 | 39.31 | |
| Total | 12.27 | 1.57 | 5.21 | 51.79 | 29.15 | 99.99 | |
Table 6.
Land use and land cover matrix from 1990 to 2022 in percentage.
| 2022 | Land cover types | 1990 | |||||
| Green space | Water | Agriculture land | Bare land | Built-up | Total | ||
| Green space | 3.66 | 0.14 | 1.76 | 3 | 0.97 | 9.53 | |
| Water | 0.31 | 0.77 | 0.04 | 0.19 | 0.27 | 1.58 | |
| Agriculture land | 0.28 | 0.03 | 2.01 | 1.78 | 0.19 | 4.29 | |
| Bare land | 5.49 | 0.18 | 11.85 | 24.31 | 3.45 | 45.28 | |
| Built-up | 3.62 | 0.61 | 3.69 | 17.05 | 14.36 | 39.33 | |
| Total | 13.36 | 1.73 | 19.35 | 46.33 | 19.24 | 100 | |
Disclaimer/Publisher’s Note: The statements, opinions and data contained in all publications are solely those of the individual author(s) and contributor(s) and not of MDPI and/or the editor(s). MDPI and/or the editor(s) disclaim responsibility for any injury to people or property resulting from any ideas, methods, instructions or products referred to in the content. |
© 2024 by the authors. Licensee MDPI, Basel, Switzerland. This article is an open access article distributed under the terms and conditions of the Creative Commons Attribution (CC BY) license (http://creativecommons.org/licenses/by/4.0/).
Copyright: This open access article is published under a Creative Commons CC BY 4.0 license, which permit the free download, distribution, and reuse, provided that the author and preprint are cited in any reuse.


