
Submitted:
04 November 2025
Posted:
04 November 2025
You are already at the latest version
Abstract
Background/Objectives: Long-term alternate-day fasting (ADF) effectively combats obesi-ty, but short-term effects are less clear. Like other diets, ADF-induced weight loss often in-cludes muscle loss, and whether protein supplementation mitigates this is uncertain.
This study examined the effects of short-term ADF on body composition and health, and whether protein supplementation preserves muscle mass during weight loss in young Asian men with unhealthy BMI (≥23.0 kg/m2). Methods: Twenty participants were re-cruited for a single-arm trial to address the first objective, and 26 participants were ran-domly assigned to a control (C) or protein group (P) in a follow-up trial to address the second objective. Participants alternated between feeding (ad libitum) and fasting (400-600 kcal consumed between 12-2 PM) days for four weeks. P consumed 25 g whey protein as part of the fasting day meal. Pre-post body composition was assessed using bioelectrical impedance analysis. Anthropometry, fasting blood glucose (FG) and resting blood pres-sure (BP) were measured weekly. Results: Since interaction effects were absent, data from all three groups were combined for analyses. Four weeks ADF significantly (p< .001) re-duced body (2.4 kg), fat (1.6 kg), and fat-free (0.8 kg) mass. BP and FG remained un-changed (p=.753-.919). No significant differences were detected between C and P in any measure. Conclusions: Short-term ADF effectively reduces body and fat mass, but also muscle mass which cannot be attenuated with protein supplementation during fasting days. Future studies should explore the effectiveness of protein or leucine supplementa-tion, throughout the feeding and fasting days, in preserving muscle during weight loss.
Keywords:
weight loss
; muscle preservation
; intermittent fasting
; alternate-day fasting
; short-term
; body composition
; blood glucose
; blood pressure
1. Introduction
Globally, 43.5% of adults (age-standardized) are overweight (BMI 25.0-29.9 kg/m2) and 15.8% obese (≥ 30.0 kg/m2) [1], making obesity a global health epidemic. In Singapore, 40.7% and 13.9% are overweight and obese, respectively, with higher prevalence when guidelines for increased cardiovascular disease (CVD) risk in Asians are used instead (23.0-27.4 kg/m2 and ≥ 27.5 kg/m2) [2,3]. Given that obesity is a risk factor for chronic diseases including metabolic syndrome, CVD, diabetes, cancer and overall mortality [4], its increasing prevalence constitutes a growing public health concern.
To combat obesity, various weight loss strategies have been promoted. Recently, the use of intermittent fasting (IF) has gained significant interest due to its purported benefits on lipid profile [5], cardiovascular and metabolic health [6], on top of promoting weight loss [7]. Essentially, IF involves alternating between periods of food abstinence (fasting) and food consumption (feeding) [8]. Fasting periods can range from 16-20 hours/day, and up to 48 hours/week [7]. In particular, alternate day fasting (ADF), which involves alternating every 24 hours between feeding (ad libitum food intake) and fasting days (a small meal of ~400-600 kcal or 25% of daily caloric needs), has been one of the most well-researched and popularized IF protocols [9].
The health benefits associated with ADF are manifold. Current evidence suggests that ADF reduces BMI, body mass, fat mass, total and low-density lipoprotein cholesterol, triglycerides, and systolic and diastolic blood pressure [10,11]. Compared with very-low-calorie dieting (VLCD), 3-12 weeks ADF leads to greater reduction in fat mass and lower reduction in fat-free mass while decreasing hunger and improving satiety and dieting satisfaction, illustrating superior adherence rates and ease of compliance [12]. Of note, a longer-term study lasting six months showed non-superior adherence rates with ADF compared to a traditional calorie restriction diet [13]. Regardless, existing ADF studies typically range from 8-48 weeks, long durations that are hardly motivating to individuals looking to lose weight [10,11,12]. Moreover, short-term weight cut while maintaining muscle mass would be relevant to athletes, especially those participating in sports with weight categories or in which aesthetics plays a significant role. To date, only a handful of studies have investigated the effects of short-term (2-4 weeks) ADF, all of which conducted in predominantly Caucasian populations [14,15,16,17,18,19,20]. Collectively, these studies showed that two weeks ADF was insufficient to induce weight loss in overweight young men [16], and at least 3-4 weeks was required to reduce body mass and fat mass in non-obese and obese young to middle-age adults [14,15,17,18,19,20]. It remains unclear whether short-term ADF can improve body composition in a mixed normal weight to obese group, especially among Asian populations with increased CVD risks (BMI ≥ 23.0 kg/m2).
Despite the purported health benefits associated with ADF, as with other weight loss diets, muscle loss is a major concern [21]. Importantly, studies comparing between ADF and no-diet controls consistently report significant muscle loss in the ADF group [11]. Additionally, while some studies suggest that high protein intake may preserve muscle during weight loss [22,23], others have reported no differences between high protein or control on muscle preservation [24,25]. At present, there is no evidence to suggest the preservatory effects of protein on muscle during ADF.
Considering these gaps, the objectives of the present study are to investigate: 1) whether short-term (4-week) ADF has beneficial effects on body composition, and 2) if increased protein intake through whey protein supplementation can preserve muscle during weight loss, among Asian young men with unhealthy BMI levels. To achieve these objectives, a single-arm pilot study was conducted with the main aim of addressing the first objective, and a follow-up randomized-controlled trial (RCT) was conducted to address the second objective. Additionally, the effects of 4-week ADF on other health markers, including fasting blood glucose and resting blood pressure, were explored. We hypothesized that 4-week ADF is sufficient to induce weight loss, and that protein supplementation during fasting days can reduce diet-induced muscle loss in normo-weight to obese young men with increased cardiovascular risks (BMI ≥ 23.0 kg/m2).
2. Materials and Methods
2.1. Study 1 Design
In this single-arm study (S), 20 young men (21-35 years) with increased CVD risks (BMI ≥ 23.0 kg/m2) were recruited to undergo four weeks (28 days) of ADF. Studies that found effective weight loss following ADF used a sample size of 8 or 16 [15,17,26] and hence, we targeted a sample size of 20 to buffer for dropouts. Body composition was assessed pre- and post-intervention, while anthropometry, fasting blood glucose and resting blood pressure were measured weekly. Participants completed weekly physical activity questionnaire and dietary records. Ethics approval was obtained from the Nanyang Technological University (NTU) Institutional Review Board (IRB-2016-09-055). There were no changes to methods and outcome measures after trial commencement.
2.1.1. Participant Screening
Participants were screened according to the following inclusion criteria: 1) male, 2) 21-35 years old, 3) do not smoke or use tobacco products (including shisha), and 4) BMI ≥ 23.0 kg/m2. Additionally, participants who met any of the following exclusion criteria were excluded from the study: 1) unable to adhere to physical activity and diet requirements, 2) failed an exercise stress test, 3) health condition(s) that might be worsened with fasting, 4) taking long-term medication(s) for heart, blood, lung, liver, kidney or joint condition(s), and 5) taking other long-term alternative medication including traditional Chinese medicine that are may affect the study’s measurements. Eligible participants signed informed consent before their inclusion into the study.
2.1.2. ADF Protocol
The ADF protocol began at 12AM and alternated between fasting and feeding days in 24-hour cycles. On fasting days, no food and beverages were allowed except for plain water and/or zero-calorie beverages, and a small meal containing 400-600 kcal consumed [9] between 12-2PM to standardize the total duration of fasting and feeding. On feeding days, food and beverages were allowed to be consumed ad libitum. Participants maintained consistent physical activity levels throughout the study.
2.1.3. Laboratory Sessions
Participants visited the laboratory (Human Bioenergetics Laboratory, Physical Education and Sports Science, National Institute of Education, NTU, Singapore) on 5 occasions across 5 weeks. They abstained from intentional physical activity (except activities of daily living) for at least 48 hours, alcohol and/or caffeine for at least 24 hours, and fasted overnight for at least 10 hours before each laboratory session.
2.1.4. Body Composition
Body composition was assessed pre- and post-intervention (first and fifth laboratory sessions) through bioelectrical impedance analysis (BIA) using the InBody 720 (Biospace Co. Ltd., Seoul, Korea), where measurements of total body fat mass (FM), fat-free mass (FFM), skeletal muscle mass (SMM), appendicular fat-free mass (AFFM), percentage body fat (PBF), visceral fat area (VFA), and hydration status (intracellular water/extracellular water; ICW/ECW) were obtained. FM index (FMI), FFM index (FFMI), SMM index (SMMI) and AFFM index (AFFMI) were calculated using the respective measures in kilograms divided by square of height in meters (kg/m2). The use of multi-frequency BIA for the purpose of assessing body composition has been extensively validated to gold-standard methods [27,28,29] and used in other weight loss studies [17,26,30]. Participants started their 4-week ADF intervention within 1 week from the first session.
2.1.5. Anthropometry
Body height (m) and mass (kg) were measured weekly using the ID1Plus electronic weighing scale (Mettler Toledo, Singapore) and seca 242 stadiometer (seca GmbH & Co. KG, Hamburg, Germany), respectively. BMI was calculated using body mass in kilograms divided by the square of height in meters (kg/m2).
2.1.6. Health Assessments
Fasting blood glucose (FG) and resting blood pressure (BP) were also measured weekly. For FG (mmol/L), a tiny drop of blood was obtained through finger-pricking using the ACCU-CHEK Safe-T-Pro Plus lancet (Roche Diabetes Care GmbH, Mannheim, Germany), and analyzed using the OneTouch Ultra 2 blood glucose meter (LifeScan, Malvern, PA, USA). Resting systolic (SBP) and diastolic (DBP) blood pressure (mmHg) were assessed using the OMRON HEM-907 blood pressure monitor (OMRON healthcare Co. Ltd., Kyoto, Japan).
2.1.7. Physical Activity Questionnaire and Dietary Record
The global physical activity questionnaire (GPAQ) [31] was administered weekly to estimate physical activity levels (MET-min). Participants completed a 2-day dietary record of any 2 fasting days each week, and total energy intake (kcal), protein (g), fat (g) and carbohydrate (g) content were analyzed for each recorded day.
2.2. Study 2 Design
In this two-arm RCT, 26 young men (21-35 years) with increased CVD risks (BMI ≥ 23.0 kg/m2) were recruited to undergo four weeks (28 days) of ADF, and randomly assigned to one of two groups: control (C) or protein group (P) in blocks of 2 (CP or PC) to ensure equal sample size in each group. Participants in P additionally consumed protein supplements on the fasting day (Figure 1). Compromise power calculation using G*Power version 3.1.9.2 for a 2 (group) x 2 (time) repeated measures ANOVA (rANOVA) interaction effect is 0.85 with 26 total participants (based on the final number of 13 participants in study 1), f effect size of 0.25, beta/alpha ratio of 1 and correlation of 0.5 among repeated measures. Ethics approval was obtained from the NTU IRB (IRB-2017-08-010). Inclusion/exclusion criteria were identical to Study 1, and eligible participants signed informed consent before their inclusion into the study. There were no changes to methods and outcome measures after trial commencement.
2.2.1. ADF Protocol
The ADF protocol was identical to Study 1, where a small, self-selected meal (400-600 kcal) was consumed between 12-2PM on fasting days. For group P, a 25 g whey protein supplement (125 kcal) was consumed as part of the fasting day meal, with the remaining 275-475 kcal coming from self-selected food items. On feeding days, food and beverages were allowed to be consumed ad libitum.
Apart from the distinction in fasting day meal for group P, the rest of the study design and protocols were identical to that of Study 1, including laboratory measurements, health assessments, and physical activity questionnaires and dietary records.
2.3. Statistical Analyses
SPSS Statistics version 27.0 (IBM, Chicago, IL, USA) and JASP version 0.16.3 (JASP Team) were used for data analyses. Differences in body composition pre- and post-intervention (and between groups for Study 2) were first analyzed separately for Study 1 (within-subjects analyses; group S) and Study 2 [time, group (C and P), and interaction effects]. When no interaction effects were present, data from all three groups were combined for within-subjects analyses. Significance level was set at p≤.05.
For Study 1 (S), within-subjects t-test were conducted for variables with parametric data: BM, FM, FFM, SMM, AFFM, BMI, PBF, VFA, and hydration status (ICW/ECW). Wilcoxon test was performed for non-parametric variables: FMI, FFMI, SMMI, and AFFMI.
For Study 2 (C and P), 2 (groups) x 2 (time: pre-post) rANOVA was conducted for ICW/ECW. For the other variables (BM, FM, FFM, SMM, AFFM, FFMI, SMMI, AFFMI, BMI, PBF, FMI and VFA), due to non-normality of data, generalized estimating equations (GEE) were performed using robust estimator, normal distribution with log link function, and exchangeable correlation matrix. Model selections were done first based on smallest goodness of fit, and then smaller covariances of parameter estimate. There were no significant interactions and main effects were reported based on estimated marginal means to adjust for unequal sample size if any.
For combined analyses, within-subjects t-test were conducted for variables with parametric data: BM, FM, FFM, SMM, AFFM, BMI, PBF, FMI, VFA, and ICW/ECW. Wilcoxon test was performed for non-parametric variables: FFMI, SMMI, and AFFMI.
Differences in average calories and protein content of the fasting day meals between Groups P and C were analyzed using between-subjects t-test and Welch test, respectively. For all t-tests and Welch tests, effect sizes were calculated using Cohen’s d (.2, small; .5, medium; .8, large). For Wilcoxon tests, effect sizes were calculated using the matched rank biserial correlation coefficient, rrb (.1, small; .3, medium; .5, large). For rANOVA, partial eta squared, η²p effect sizes were used (.01, small; .06, medium; .14, large).
As for weekly measurements (i.e., GPAQ, SBP, DBP, and FG), due to non-normality of data, GEE was performed for GPAQ, SBP, and DBP using robust estimator with normal distribution with log link function, and autoregressive correlation matrix, while an unstructured correlation matrix was used for FG. Similarly, model selections were done first based on smallest goodness of fit, and then smaller covariances of parameter estimate. There were no significant interactions for study 2 and any significant time effect was followed using simple contrast against baseline (pre-intervention) with Sidak correction for multiple comparisons. Results were based on estimated marginal means.
3. Results
3.1. Participants
Among the 20 participants recruited for Study 1 (between February and March 2017) and 26 participants for Study 2 (between January and March 2018), N=7 and N=2 of them dropped out, respectively (8 unable to commit; 1 uncontactable). Therefore, data from N=37 participants (N=13 and N=24, respectively) were used for analyses, with a total of N=13 in Group S, N=13 in Group C, and N=11 in Group P. Participant characteristics are displayed in Table 1.
3.2. Fasting Day Meal
On fasting days, group S consumed on average 525 (SD 151) kcal for the fasting meal, of which 25 (7)%, 37 (15)%, and 38 (12)% came from protein, fat, and carbohydrates, respectively. Group P consumed 495 (50) kcal, of which 40 (8)%, 26 (6)%, and 34 (13)% came from protein, fat, and carbohydrates. Group C consumed 533 (38) kcal, of which 22 (4)%, 33 (5)%, and 46 (5)% came from protein, fat, and carbohydrates. Independent samples t-test revealed that, despite consuming fewer calories (p=.045, d=-.9), group P consumed significantly higher protein (p<.001. d=3.0) on the fasting day than group C (Figure 2), as intended.
3.3. Hydration Status
ICW/ECW is an indicator of hydration status, which can affect BIA results. There was no significant difference in pre-post ICW/ECW for group S (p=.827, d=-.06), and no significant interaction (p=.744, η²p<0.01) and main effect of time on ICW/ECW for groups P and C (p=.978, η²p<0.01), suggesting that pre-post hydration status was consistent in both studies.
3.4. Body Composition
Post-intervention (Figure 3), group S lost significant amounts of BM (p<.001, d=-1.79), FM (p=.007, d=-.91), FFM (p=.041, d=-.63), SMM (p=.032, d=-.67), FFMI (p=.027, d=-.69), SMMI (p=.021, d=-.71), BMI (p<.001, d=-1.62), FMI (p=.006, d=-.82), and VFA (p<.001, d=-1.36). Changes in AFFM (p=.235, d=-.35), AFFMI (p=.244, d=-.39), and PBF (p=.097, d=-.50) were not significant. For groups P and C, there were no significant interaction effects of group and time on any measure (p=.179–.807). However, main effect of time was significant for all measures with reduction post-intervention: BM (p<.001, d=-.21), FM (p< .001, d=-.23), FFM (p=.004, d=-.11), SMM (p=.004, d=-.10), AFFM (p=.003, d=-.08), FFMI (p=.002, d=-.14), SMMI (p=.002, d=-.13), AFFMI (p=.001, d=-.12), BMI (p<.001, d=-.23), PBF (p<.001, d=-.26), FMI (p<.001, d=-.24), and VFA (p<.001, d=-.27).
Since no significant interaction effects were present between groups P and C, data from all three groups (N = 37) were combined for within-subjects analyses. The results showed significant losses in all measures of body composition post-intervention, which were BM, FM, FFM, SMM, AFFM, FFMI, SMMI, AFFMI, BMI, PBF, FMI, and VFA (Table 2). Corresponding changes in BM, FM, and FFM for each participant are depicted in Figure 4 to visualize individual responses. All but 2 participants lost BM (coefficient of variation, CV of change=.65) but the changes in FM (CV=.78) and FMM (CV=1.68) were more varied. While the change in BM is correlated to changes in FM (Spearman correlation coefficient, ρ=.586, p<.001) and FFM (ρ=.537, p<.001), respectively, there is no correlation between FM and FFM changes (ρ=-.291, p<.081; correlation data not shown).
3.5. Physical Activity and Blood Markers
There were no significant interaction effects between groups P and C (data not shown) in weekly physical activity level [GPAQ (p=.426)], SBP (p=.653), DBP (p=.818), and thus, data from studies 1 and 2 were combined (Table 3). Analysis of the combined data showed a significant difference in GPAQ levels across time (p<.001). Simple contrast against baseline revealed significant reductions in GPAQ levels between baseline and end of week 2 (p=.002), and between baseline and end of week 3 (p=.004).
Analyses of the combined data showed significant differences in DBP (p=.021) and FG (p<.001) across time but not for SBP (p=.562). Post-hoc analyses revealed significant reductions in DBP between baseline and end of week 3 (-2.8 mmHg, p=.028), and in FG between baseline and end of week 1 (-.22, p=.026). There were, however, no significant pre-post differences in DBP (p=.809), or FG (p=.919) from baseline to post-intervention.
4. Discussion
To our knowledge, this is the first study to investigate the effects of short-term ADF on body composition, and the effects of whey protein supplementation on muscle preservation during short-term ADF, among normal weight to obese (Asian) young men with increased CVD risks.
4.1. Effectiveness of Short-Term ADF on Body Composition
Our results showed that four weeks ADF was sufficient to induce significant reductions (Figure 4) in body mass (35/37 participants) and fat mass (33/37). However, there was a concomitant decrease in muscle (fat-free mass) as well (28/37). Increased protein intake through whey protein supplementation during fasting days did not alleviate muscle loss.
There was a significant loss in body mass of 2.4 kg (2.9%) after four weeks of ADF, a rate that is clinically important and within safe recommendations of 0.45-0.9 kg/week [32]. This agrees with previous literature where 3-4 weeks [14,15,17,18,19,20], but not two weeks [16], of ADF was sufficient and effective for weight loss. Since weight loss is mainly determined by overall energy deficit [33], the energy deficit accumulated with < 3 weeks of ADF is likely insufficient to promote significant weight loss, and at least 3-4 weeks is required to accrue sufficient energy deficit to alter body mass among normal weight to obese individuals.
Four weeks ADF reduced fat mass by an average of 1.6 kg (68.2% of total weight loss) and other obesity indices including BMI (-3.0%), FMI (-8.3%), PBF (-5.9%), and VFA (-9.0%), with large effect sizes for all indices. However, this was accompanied with significant muscle loss in terms of FFM by an average of 0.8 kg (31.8% of total weight loss), SMM (-1.2%), AFFM (-1.0%), FFMI (-1.3%), SMMI (-1.3%), and AFFMI (-1.0%), with moderate effect sizes for all indices (Table 2). This is supported by the findings of other weight loss studies, where regardless of dietary intervention, a significant loss of lean mass or FFM (25-42% of total weight loss) can be expected [12,34]. Due to the physiological demands of calorie restriction and weight loss, there is a natural decrease in basal and postprandial muscle protein synthesis (MPS) [35], which exerts deleterious effects on muscle regardless of the type of diet implemented [10].
4.2. Effectiveness of Protein Supplementation During Fasting Day
Interestingly, whey protein supplementation, despite increasing fasting day protein intake significantly by 1.7x in group P (49.4 g) compared to group C (28.5 g), was not effective in attenuating muscle loss. Corroboratively, several studies have reported that increased protein intake alone during energy restriction and weight loss does not improve or preserve muscle [24,25,36]. One possible reason for the absence of a significant effect could be that the difference in body mass-adjusted protein consumption between groups P (0.55-0.57 g/kg/day) and C (0.38-0.39 g/kg/day) was too small (0.16-0.19 g/kg/day) to detect any meaningful difference. Notably, fasting day protein intake for both groups was below the recommended dietary allowance of 0.8 g/kg (body mass)/day, an amount typically recommended to prevent protein deficiency [37]. Nonetheless, it is hardly feasible to enforce a fasting day protein intake of 0.8 g/kg/day, as that would represent an average protein intake of ~71.5 g (286kcal) for the P group, which equates to 47.7-71.5% of total fasting day calories (400-600 kcal) coming from protein alone. Protein intake on feeding days was also not measured or controlled in these studies, consistent with the nature of ADF and its evaluation for effectiveness. As such, a further explanation for group P not experiencing greater muscle preservation could be that the protein intake on feeding days was not sufficient to compensate for the lower protein consumed on fasting days in either group.
Indeed, a previous meta-analysis found that, during a weight loss diet, high protein intakes averaged at 1.25 g/kg/day, compared to standard protein intakes of 0.72 g/kg/day, resulted in greater losses in body mass and fat mass while preserving FFM [23]. Future ADF studies could explore increasing protein intake on both the feeding and fasting days in order to bring up the total protein intake, averaged across both feeding and fasting days, closer to the amount of 1.25 g/kg/day or higher.
Importantly, recent studies have demonstrated that protein quality (leucine amount) may be a better determinant of MPS and muscle anabolism than protein quantity [38,39]. While leucine intake was not monitored in the present study, there is merit in exploring the effectiveness of leucine interventions on muscle preservation during weight loss in future studies.
Nonetheless, increased protein consumption can improve satiety [40], which could explain the small (38 kcal) but significant (p=.045) lower caloric intake on fasting days in P group compared to C group. Although no significant differences were detected in terms of weight loss between groups, decreased energy intake and improved satiety through increased protein consumption could result in superior weight loss that is clinically relevant over longer periods of time.
4.3. Potential Influence of Physical Activity Type on Muscle Mass Preservation
Physical activity and resistance training habits could have further confounded the effects of protein supplementation on muscle preservation. While our GPAQ analyses revealed no significant changes in physical activity levels, and no interaction effect between groups P and C throughout the intervention, physical activity was quantified using energy expenditure (MET·min/week), and not differentiated by the type of activity. Given that resistance training provides potent anabolic stimulus for muscle hypertrophy through the stimulation of MPS with [41] or without [42] increased protein intake, more specific measures and analyses of resistance training and physical activity could elucidate our understanding of the effects of protein supplementation on muscle preservation during weight loss.
4.4. Effectiveness of Short-Term ADF on Blood Health Indices
The lack of a significant pre-post difference in blood pressure and fasting blood glucose suggests that short-term ADF does not benefit cardiovascular and diabetic health. Corroboratively, previous studies have demonstrated that three weeks ADF did not alter blood pressure [15], and two weeks ADF did not improve fasting blood glucose levels [16]. While it is possible that short-term ADF was simply insufficient in duration to improve cardiovascular and diabetic health, longer-term (8-48 weeks) ADF studies have also reported inconsistent findings in this regard [10,11]. The lack of significant changes in these indices may also be due to the fact that our participants were young, and that their average baseline SBP, DBP and FG were already within healthy ranges, limiting the potential for changes post-intervention. Nonetheless, other biomarkers of cardiovascular and diabetic health, including plasma triglycerides, adiponectin levels, and insulin sensitivity, were not assessed in this study. Future studies should explore these variables to further our understanding of the effects of ADF on cardiovascular and diabetic health.
4.5. Limitations
The main limitation of this study is that only young men were included, thus, findings may not be generalizable to women or the older population. Personal preferences in dietary habits could have confounded the effects of protein supplementation since food intake on feeding days were not controlled or monitored. Future studies could implement a controlled diet to ensure that total protein intake across the study duration is matched between groups.
5. Conclusions
Short-term ADF is effective in reducing body mass and fat mass in normal weight to obese young men. However, this is accompanied with significant muscle loss which cannot be attenuated with protein supplementation during fasting days. Future studies should investigate the effectiveness of other interventions, such as protein or leucine supplementation throughout the ADF (i.e., on both feeding and fasting days), to preserve or improve muscular outcomes during weight loss.
Author Contributions
BWJP: Data analysis and statistical analysis; Wrote paper; Primary responsibility for final content. YY: Designed research; Conducted research; Provided essential materials; Data analysis and statistical analysis; Wrote paper; Primary responsibility for final content. NRBT: Designed research; Conducted research; Data analysis and statistical analysis. CBQH: Conducted research; Data analysis and statistical analysis. DS: Conducted research; Data analysis and statistical analysis. All authors have read and approved the final manuscript.
Funding
This research received no external funding
Institutional Review Board Statement
Both studies 1 and 2 were conducted in accordance with the Declaration of Helsinki, and approved by the NTU IRB (IRB-2016-09-055 approved on 8 December 2016 and IRB-2017-08-010 approved on 23 October 2017, respectively).
Informed Consent Statement
Informed consent was obtained from all subjects involved in the study.
Data Availability Statement
Dataset available from the corresponding author upon request.
Acknowledgments
The first author (BWJP) would like to thank the National Institute of Education (NIE), Nanyang Technological University (NTU), for providing him with the prestigious Nanyang President’s Graduate Scholarship (NPGS) in support of his PhD journey. The authors graciously acknowledge all the participants for their time and effort in completing the 4-week ADF protocol.
Conflicts of Interest
The authors declare no conflicts of interest.
Abbreviations
The following abbreviations are used in this manuscript:
| ADF | Alternate-day fasting |
| AFFM | Appendicular fat-free mass |
| AFFMI | Appendicular fat-free mass index |
| BIA | Bioelectrical impedance analysis |
| BMI | Body mass index |
| BP | Blood pressure |
| C | Control group |
| CVD | Cardiovascular disease |
| DBP | Diastolic blood pressure |
| FFM | Fat-free mass |
| FFMI | Fat-free mass index |
| FG | Fasting blood glucose |
| FM | Fat mass |
| FMI | Fat mass index |
| GEE | Generalized estimating equation |
| GPAQ | Global physical activity questionnaire |
| ICW/ECW | Intracellular water/extracellular water |
| IF | Intermittent fasting |
| IRB | Institutional review board |
| MET | Metabolic Equivalent of Task |
| MPS | Muscle protein synthesis |
| NTU | Nanyang technological university |
| P | Protein group |
| PBF | Percentage body fat |
| rANOVA | repeated measures Analysis of Variance (ANOVA) |
| RCT | Randomized-controlled trial |
| S | Single-arm study |
| SBP | Systolic blood pressure |
| SMM | Skeletal muscle mass |
| SMMI | Skeletal muscle mass index |
| VFA | Visceral fat area |
| VLCD | Very low calorie dieting |
References
- WHO. Global Health Observatory (GHO) data – Overweight and obesity 2022. Available online: https://www.who.int/gho/ncd/risk_factors/overweight_obesity/obesity_adults/en/ (accessed on 30 Aug 2024).
- WHO. Appropriate body-mass index for Asian populations and its implications for policy and intervention strategies. Lancet 2004, 363, 157–163. [Google Scholar] [CrossRef]
- Chen, K.K.; Wee, S.-L.; Pang, B.; Lau, L.K.; Jabbar, K.A.; Seah, W.T.; Ng, T.P. Relationship between BMI with percentage body fat and obesity in Singaporean adults – The Yishun Study. BMC Public Health 2021. [Google Scholar] [CrossRef]
- Wang, Y.C.; McPherson, K.; Marsh, T.; Gortmaker, S.L.; Brown, M. Health and economic burden of the projected obesity trends in the USA and the UK. Lancet 2011, 378, 815–825. [Google Scholar] [CrossRef]
- Meng, H.; Zhu, L.; Kord-Varkaneh, H.; H, O.S.; Tinsley, G.M.; Fu, P. Effects of intermittent fasting and energy-restricted diets on lipid profile: A systematic review and meta-analysis. Nutr. 2020, 77, 110801. [Google Scholar] [CrossRef] [PubMed]
- Cho, Y.; Hong, N.; Kim, K.W.; Cho, S.J.; Lee, M.; Lee, Y.H.; Lee, Y.H.; Kang, E.S.; Cha, B.S.; Lee, B.W. The Effectiveness of Intermittent Fasting to Reduce Body Mass Index and Glucose Metabolism: A Systematic Review and Meta-Analysis. J. Clin. Med. 2019, 8. [Google Scholar] [CrossRef] [PubMed]
- Welton, S.; Minty, R.; O'Driscoll, T.; Willms, H.; Poirier, D.; Madden, S.; Kelly, L. Intermittent fasting and weight loss: Systematic review. Can. Fam. Physician 2020, 66, 117–125. [Google Scholar] [PubMed]
- Patterson, R.E.; Sears, D.D. Metabolic Effects of Intermittent Fasting. Annu. Rev. Nutr. 2017, 37, 371–393. [Google Scholar] [CrossRef]
- Varady, K.A.; Bhutani, S.; Klempel, M.C.; Kroeger, C.M.; Trepanowski, J.F.; Haus, J.M.; Hoddy, K.K.; Calvo, Y. Alternate day fasting for weight loss in normal weight and overweight subjects: a randomized controlled trial. Nutr. J. 2013, 12, 146. [Google Scholar] [CrossRef]
- Park, J.; Seo, Y.G.; Paek, Y.J.; Song, H.J.; Park, K.H.; Noh, H.M. Effect of alternate-day fasting on obesity and cardiometabolic risk: A systematic review and meta-analysis. Metab. 2020, 111, 154336. [Google Scholar] [CrossRef]
- Cui, Y.; Cai, T.; Zhou, Z.; Mu, Y.; Lu, Y.; Gao, Z.; Wu, J.; Zhang, Y. Health Effects of Alternate-Day Fasting in Adults: A Systematic Review and Meta-Analysis. Front. Nutr. 2020, 7, 586036. [Google Scholar] [CrossRef]
- Alhamdan, B.A.; Garcia-Alvarez, A.; Alzahrnai, A.H.; Karanxha, J.; Stretchberry, D.R.; Contrera, K.J.; Utria, A.F.; Cheskin, L.J. Alternate-day versus daily energy restriction diets: which is more effective for weight loss? A systematic review and meta-analysis. Obes. Sci. Pract. 2016, 2, 293–302. [Google Scholar] [CrossRef]
- Trepanowski, J.F.; Kroeger, C.M.; Barnosky, A.; Klempel, M.C.; Bhutani, S.; Hoddy, K.K.; Gabel, K.; Freels, S.; Rigdon, J.; Rood, J.; et al. Effect of Alternate-Day Fasting on Weight Loss, Weight Maintenance, and Cardioprotection Among Metabolically Healthy Obese Adults: A Randomized Clinical Trial. JAMA Intern. Med. 2017, 177, 930–938. [Google Scholar] [CrossRef]
- Stekovic, S.; Hofer, S.J.; Tripolt, N.; Aon, M.A.; Royer, P.; Pein, L.; Stadler, J.T.; Pendl, T.; Prietl, B.; Url, J.; et al. Alternate Day Fasting Improves Physiological and Molecular Markers of Aging in Healthy, Non-obese Humans. Cell. Metab. 2019, 30, 462–476.e466. [Google Scholar] [CrossRef]
- Heilbronn, L.K.; Smith, S.R.; Martin, C.K.; Anton, S.D.; Ravussin, E. Alternate-day fasting in nonobese subjects: effects on body weight, body composition, and energy metabolism. Am. J. Clin. Nutr. 2005, 81, 69–73. [Google Scholar] [CrossRef] [PubMed]
- Halberg, N.; Henriksen, M.; Soderhamn, N.; Stallknecht, B.; Ploug, T.; Schjerling, P.; Dela, F. Effect of intermittent fasting and refeeding on insulin action in healthy men. Journal of applied physiology (Bethesda, Md. : 1985) 2005, 99, 2128–2136. [Google Scholar] [CrossRef] [PubMed]
- Klempel, M.C.; Bhutani, S.; Fitzgibbon, M.; Freels, S.; Varady, K.A. Dietary and physical activity adaptations to alternate day modified fasting: implications for optimal weight loss. Nutr. J. 2010, 9, 35–35. [Google Scholar] [CrossRef]
- Templeman, I.; Smith, H.A.; Chowdhury, E.; Chen, Y.C.; Carroll, H.; Johnson-Bonson, D.; Hengist, A.; Smith, R.; Creighton, J.; Clayton, D.; et al. A randomized controlled trial to isolate the effects of fasting and energy restriction on weight loss and metabolic health in lean adults. Sci. Transl. Med. 2021, 13. [Google Scholar] [CrossRef] [PubMed]
- Varady, K.A.; Bhutani, S.; Church, E.C.; Klempel, M.C. Short-term modified alternate-day fasting: a novel dietary strategy for weight loss and cardioprotection in obese adults. The American Journal of Clinical Nutrition 2009, 90, 1138–1143. [Google Scholar] [CrossRef]
- Derron, N.; Güntner, A.T.; Weber, I.C.; Braun, J.; Koska, İ.Ö.; Othman, A.; Mönch, L.; von Eckardstein, A.; Puhan, M.A.; Beuschlein, F.; et al. Alternate-day fasting elicits larger changes in fat mass than time-restricted eating in adults without obesity – A randomized clinical trial. Clinical Nutrition 2025, 53, 212–221. [Google Scholar] [CrossRef]
- Aragon, A.A.; Schoenfeld, B.J.; Wildman, R.; Kleiner, S.; VanDusseldorp, T.; Taylor, L.; Earnest, C.P.; Arciero, P.J.; Wilborn, C.; Kalman, D.S.; et al. International society of sports nutrition position stand: diets and body composition. J. Int. Soc. Sports Nutr. 2017, 14, 16. [Google Scholar] [CrossRef]
- Westerterp-Plantenga, M.S.; Lemmens, S.G.; Westerterp, K.R. Dietary protein - its role in satiety, energetics, weight loss and health. Br. J. Nutr. 2012, 108 Suppl 2, S105–112. [Google Scholar] [CrossRef]
- Wycherley, T.P.; Moran, L.J.; Clifton, P.M.; Noakes, M.; Brinkworth, G.D. Effects of energy-restricted high-protein, low-fat compared with standard-protein, low-fat diets: a meta-analysis of randomized controlled trials. The American Journal of Clinical Nutrition 2012, 96, 1281–1298. [Google Scholar] [CrossRef]
- Soenen, S.; Bonomi, A.G.; Lemmens, S.G.; Scholte, J.; Thijssen, M.A.; van Berkum, F.; Westerterp-Plantenga, M.S. Relatively high-protein or 'low-carb' energy-restricted diets for body weight loss and body weight maintenance? Physiol. Behav. 2012, 107, 374–380. [Google Scholar] [CrossRef]
- Backx, E.M.P.; Tieland, M.; Borgonjen-van den Berg, K.J.; Claessen, P.R.; van Loon, L.J.C.; de Groot, L.C.P.G.M. Protein intake and lean body mass preservation during energy intake restriction in overweight older adults. Int. J. Obes. 2016, 40, 299–304. [Google Scholar] [CrossRef] [PubMed]
- Bhutani, S.; Klempel, M.C.; Kroeger, C.M.; Trepanowski, J.F.; Varady, K.A. Alternate day fasting and endurance exercise combine to reduce body weight and favorably alter plasma lipids in obese humans. Obesity (Silver Spring, Md.) 2013, 21, 1370–1379. [Google Scholar] [CrossRef] [PubMed]
- Faria, S.L.; Faria, O.P.; Cardeal, M.D.; Ito, M.K. Validation study of multi-frequency bioelectrical impedance with dual-energy X-ray absorptiometry among obese patients. Obes. Surg. 2014, 24, 1476–1480. [Google Scholar] [CrossRef] [PubMed]
- Ramírez-Vélez, R.; Tordecilla-Sanders, A.; Correa-Bautista, J.E.; González-Ruíz, K.; González-Jiménez, E.; Triana-Reina, H.R.; García-Hermoso, A.; Schmidt-RioValle, J. Validation of multi-frequency bioelectrical impedance analysis versus dual-energy X-ray absorptiometry to measure body fat percentage in overweight/obese Colombian adults. Am. J. Hum. Biol. 2018, 30. [Google Scholar] [CrossRef] [PubMed]
- Bosy-Westphal, A.; Later, W.; Hitze, B.; Sato, T.; Kossel, E.; Gluer, C.C.; Heller, M.; Muller, M.J. Accuracy of bioelectrical impedance consumer devices for measurement of body composition in comparison to whole body magnetic resonance imaging and dual X-ray absorptiometry. Obes. Facts 2008, 1, 319–324. [Google Scholar] [CrossRef] [PubMed]
- Bhutani, S.; Klempel, M.C.; Berger, R.A.; Varady, K.A. Improvements in coronary heart disease risk indicators by alternate-day fasting involve adipose tissue modulations. Obesity (Silver Spring, Md.) 2010, 18, 2152–2159. [Google Scholar] [CrossRef] [PubMed]
- Armstrong, T.; Bull, F. Development of the World Health Organization Global Physical Activity Questionnaire (GPAQ). J. Public Health 2006, 14, 66–70. [Google Scholar] [CrossRef]
- NHLBI Obesity Education Initiative Expert Panel on the Identification, E., and Treatment of Obesity in Adults (US). Clinical Guidelines on the Identification, Evaluation, and Treatment of Overweight and Obesity in Adults: The Evidence Report. Available online: https://www.ncbi.nlm.nih.gov/books/NBK2003/ (accessed on 2 Feb 2024).
- Volek, J.S.; Vanheest, J.L.; Forsythe, C.E. Diet and exercise for weight loss: a review of current issues. Sports Med. 2005, 35, 1–9. [Google Scholar] [CrossRef]
- Davis, C.S.; Clarke, R.E.; Coulter, S.N.; Rounsefell, K.N.; Walker, R.E.; Rauch, C.E.; Huggins, C.E.; Ryan, L. Intermittent energy restriction and weight loss: a systematic review. Eur. J. Clin. Nutr. 2016, 70, 292–299. [Google Scholar] [CrossRef]
- Cava, E.; Yeat, N.C.; Mittendorfer, B. Preserving Healthy Muscle during Weight Loss. Adv. Nutr. 2017, 8, 511–519. [Google Scholar] [CrossRef] [PubMed]
- Larsen, A.E.; Bibby, B.M.; Hansen, M. Effect of a Whey Protein Supplement on Preservation of Fat Free Mass in Overweight and Obese Individuals on an Energy Restricted Very Low Caloric Diet. Nutrients 2018, 10. [Google Scholar] [CrossRef]
- Wolfe, R.R.; Miller, S.L. The Recommended Dietary Allowance of Protein: A Misunderstood Concept. JAMA 2008, 299, 2891–2893. [Google Scholar] [CrossRef]
- Churchward-Venne, T.A.; Breen, L.; Di Donato, D.M.; Hector, A.J.; Mitchell, C.J.; Moore, D.R.; Stellingwerff, T.; Breuille, D.; Offord, E.A.; Baker, S.K.; et al. Leucine supplementation of a low-protein mixed macronutrient beverage enhances myofibrillar protein synthesis in young men: a double-blind, randomized trial. Am. J. Clin. Nutr. 2014, 99, 276–286. [Google Scholar] [CrossRef]
- Devries, M.C.; McGlory, C.; Bolster, D.R.; Kamil, A.; Rahn, M.; Harkness, L.; Baker, S.K.; Phillips, S.M. Leucine, Not Total Protein, Content of a Supplement Is the Primary Determinant of Muscle Protein Anabolic Responses in Healthy Older Women. The Journal of nutrition 2018, 148, 1088–1095. [Google Scholar] [CrossRef]
- Weigle, D.S.; Breen, P.A.; Matthys, C.C.; Callahan, H.S.; Meeuws, K.E.; Burden, V.R.; Purnell, J.Q. A high-protein diet induces sustained reductions in appetite, ad libitum caloric intake, and body weight despite compensatory changes in diurnal plasma leptin and ghrelin concentrations. The American Journal of Clinical Nutrition 2005, 82, 41–48. [Google Scholar] [CrossRef]
- Yang, Y.; Breen, L.; Burd, N.A.; Hector, A.J.; Churchward-Venne, T.A.; Josse, A.R.; Tarnopolsky, M.A.; Phillips, S.M. Resistance exercise enhances myofibrillar protein synthesis with graded intakes of whey protein in older men. Br. J. Nutr. 2012, 108, 1780–1788. [Google Scholar] [CrossRef] [PubMed]
- Frimel, T.N.; Sinacore, D.R.; Villareal, D.T. Exercise attenuates the weight-loss-induced reduction in muscle mass in frail obese older adults. Med. Sci. Sports Exerc. 2008, 40, 1213–1219. [Google Scholar] [CrossRef] [PubMed]
Figure 1.
CONSORT Participant Flow Diagram for Study 2.
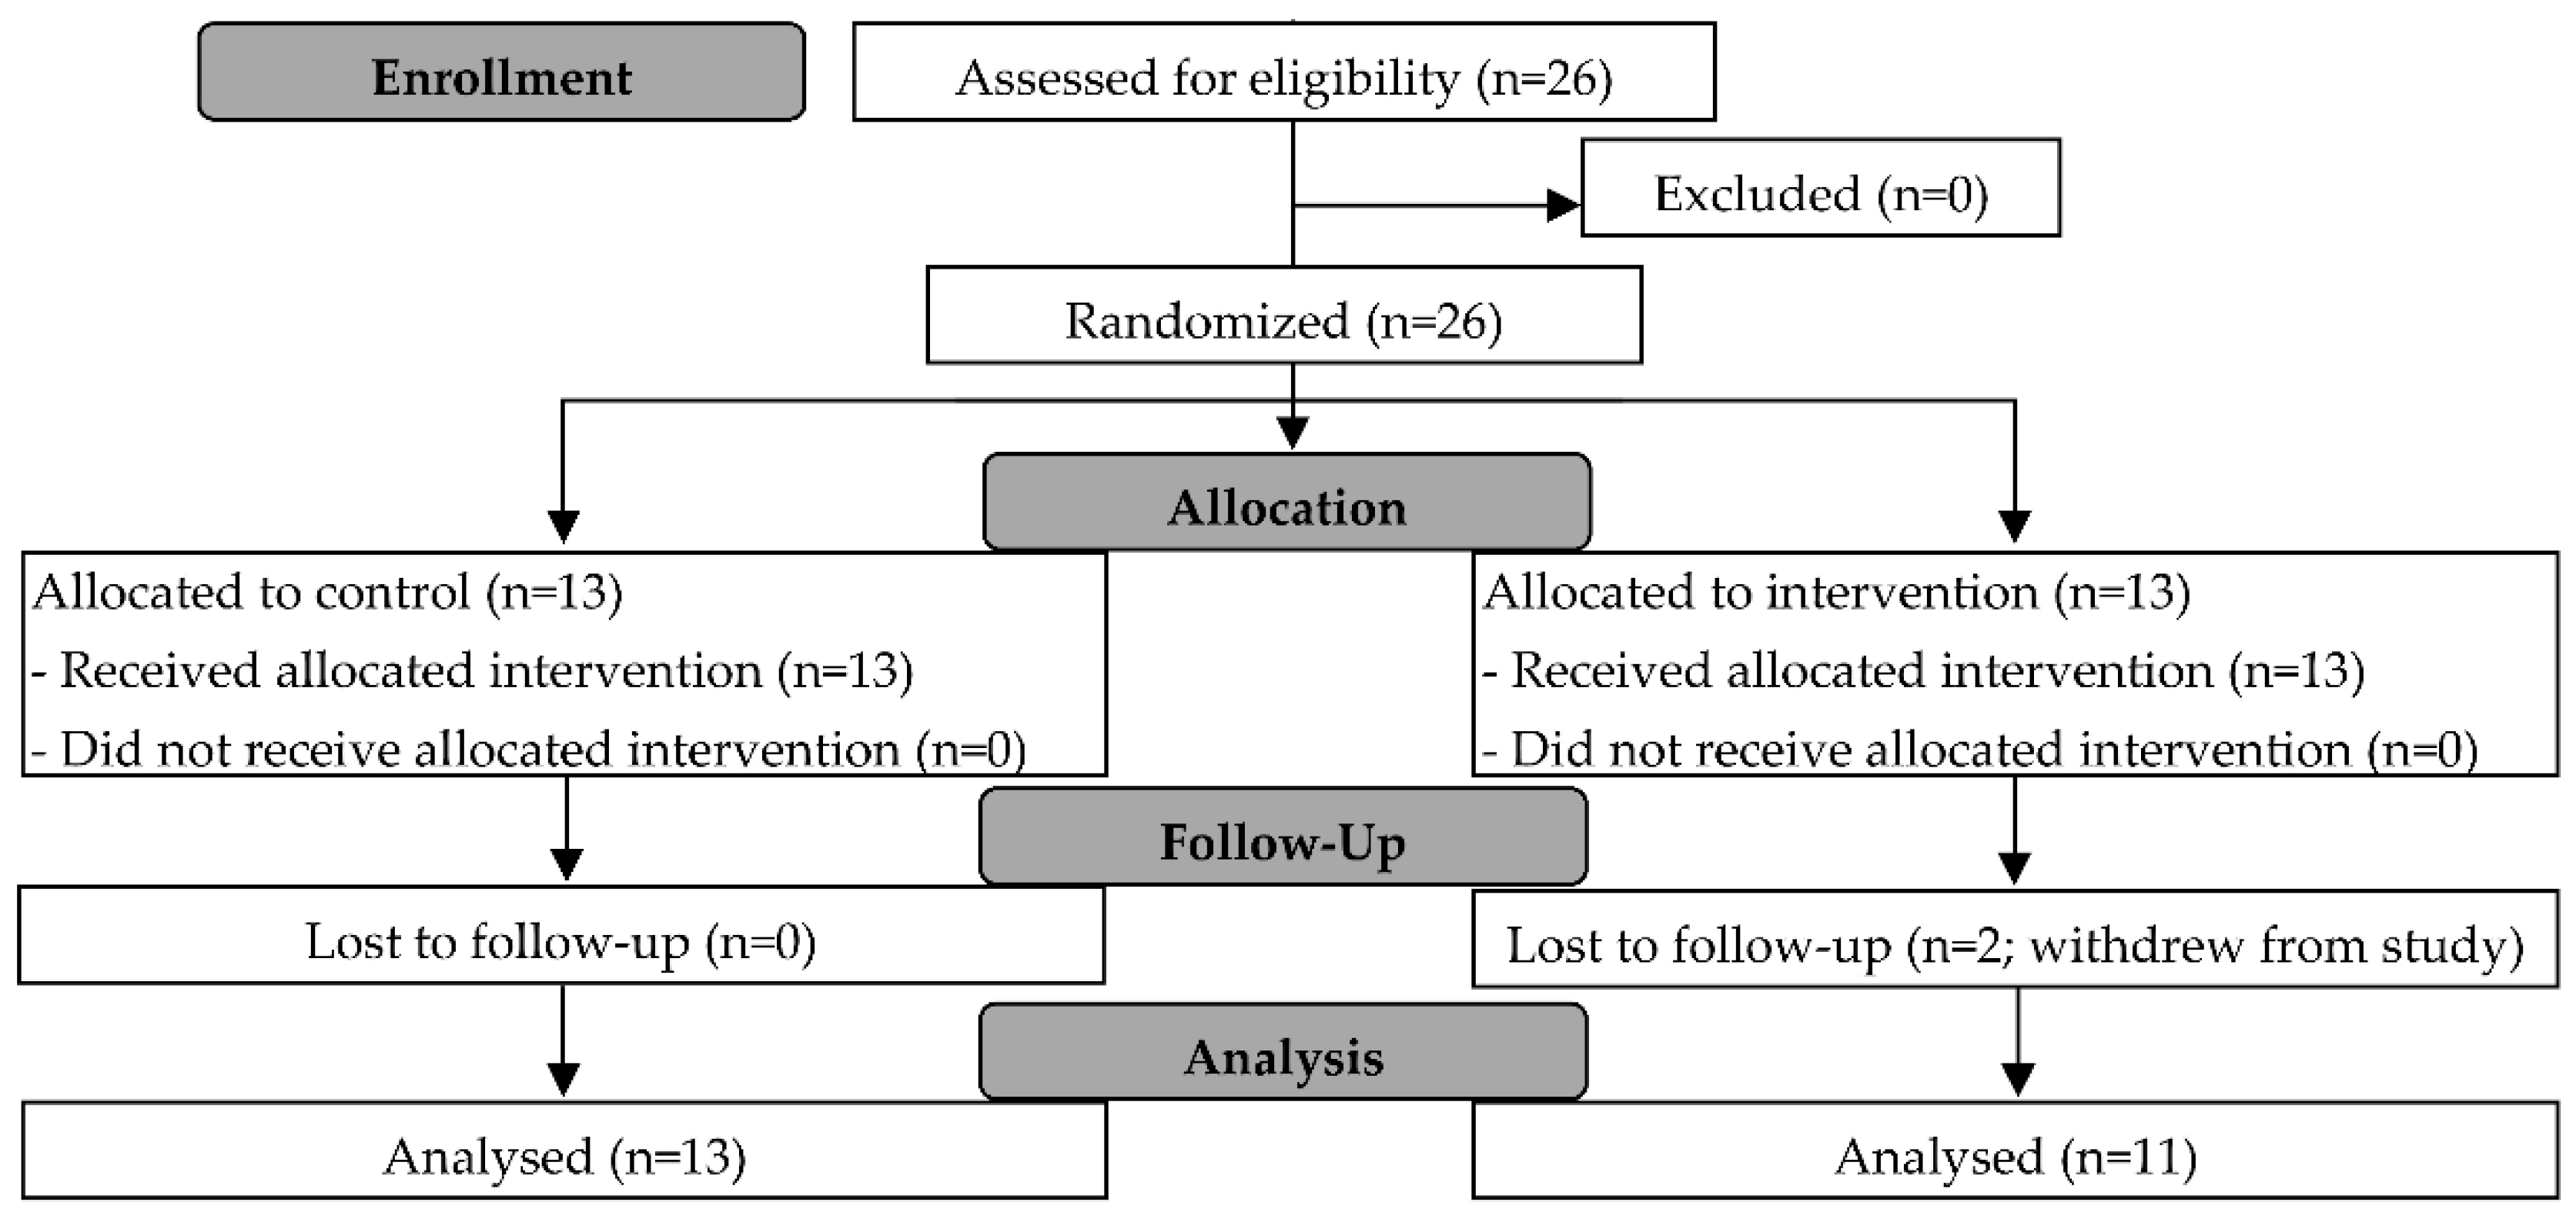
Figure 2.
Fasting meal energy (kcal) and protein (g) intake for study 1 – single-arm group (S), and study 2 – control (C) and protein (P) groups. Bar chart presented as mean and 95% CI, with scatterplot of individual data points. Independent samples t-test was conducted only for Study 2 to compare the differences between groups C and P.
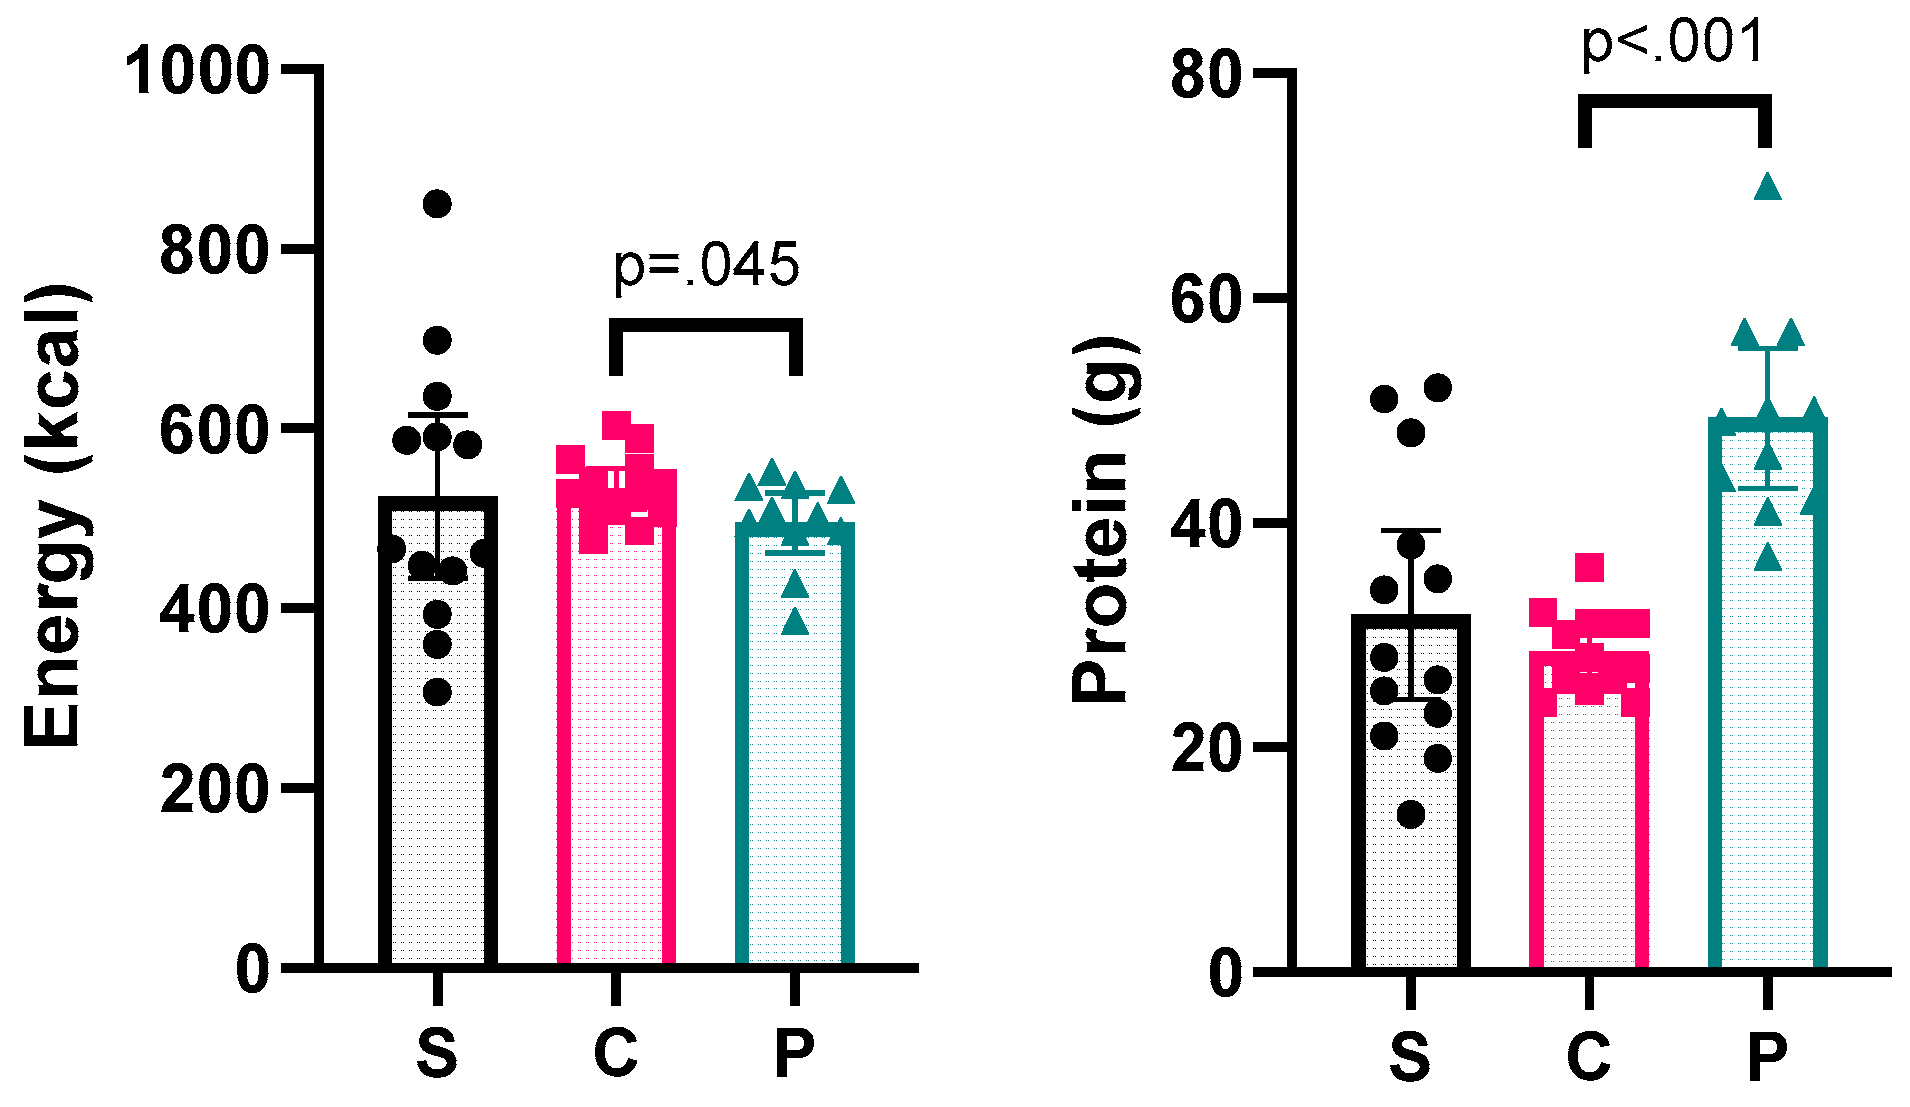
Figure 3.
Pre-post changes in body composition for study 1 – single-arm group (S), and study 2 – control (C) and protein (P) groups. Bar chart presented as mean and 95% CI, with scatterplot of individual data points. BM, body mass; FM, fat mass; FFM, fat-free mass; SMM, skeletal muscle mass; AFFM, appendicular fat-free mass; FFMI, fat-free mass index; SMMI, skeletal muscle mass index; AFFMI, appendicular fat-free mass index; BMI, body mass index; PBF, percentage body fat; FMI, fat mass index; VFA, visceral fat area. Separate statistical analyses were conducted for studies 1 and 2. * indicates a significant pre-post change for study 1 (p<.05). ^ indicates a significant time effect for study 2 (p<.05). All interaction effects for study 2 were not significant (p>.05).
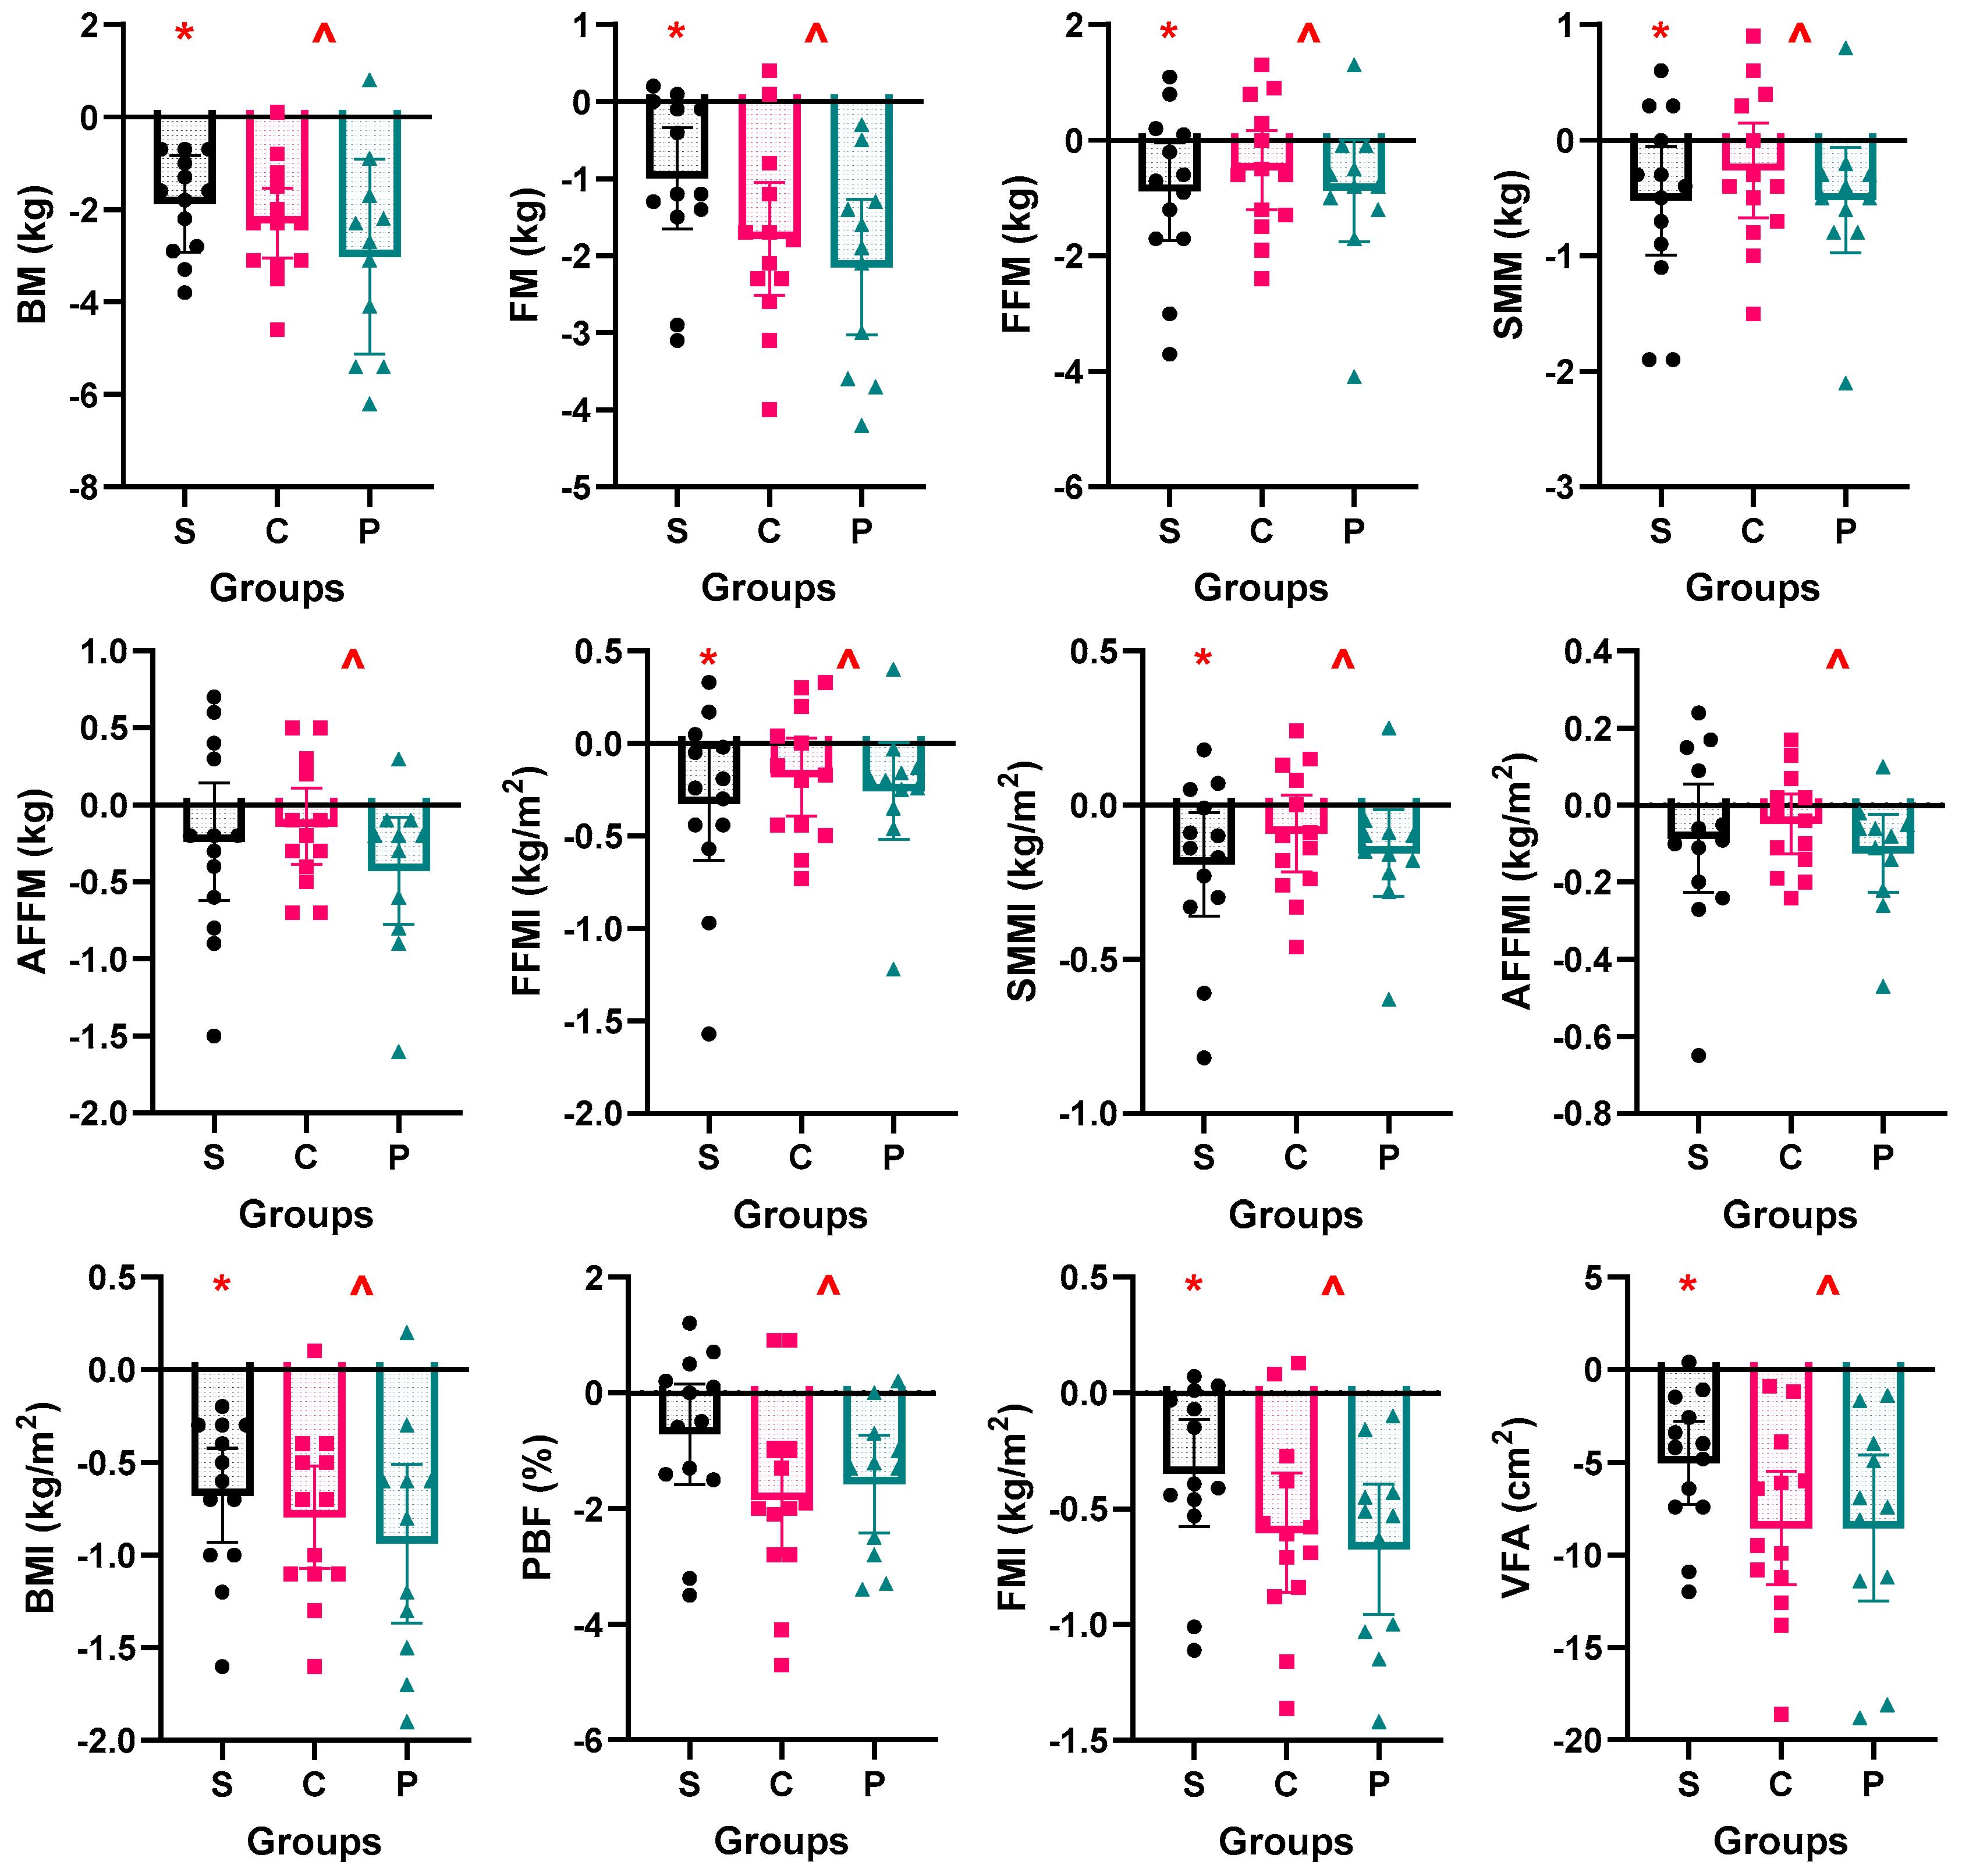
Figure 4.
Corresponding changes in body mass, fat mass, and fat-free mass (ranked by change in body mass) for all 37 participants.
Figure 4.
Corresponding changes in body mass, fat mass, and fat-free mass (ranked by change in body mass) for all 37 participants.
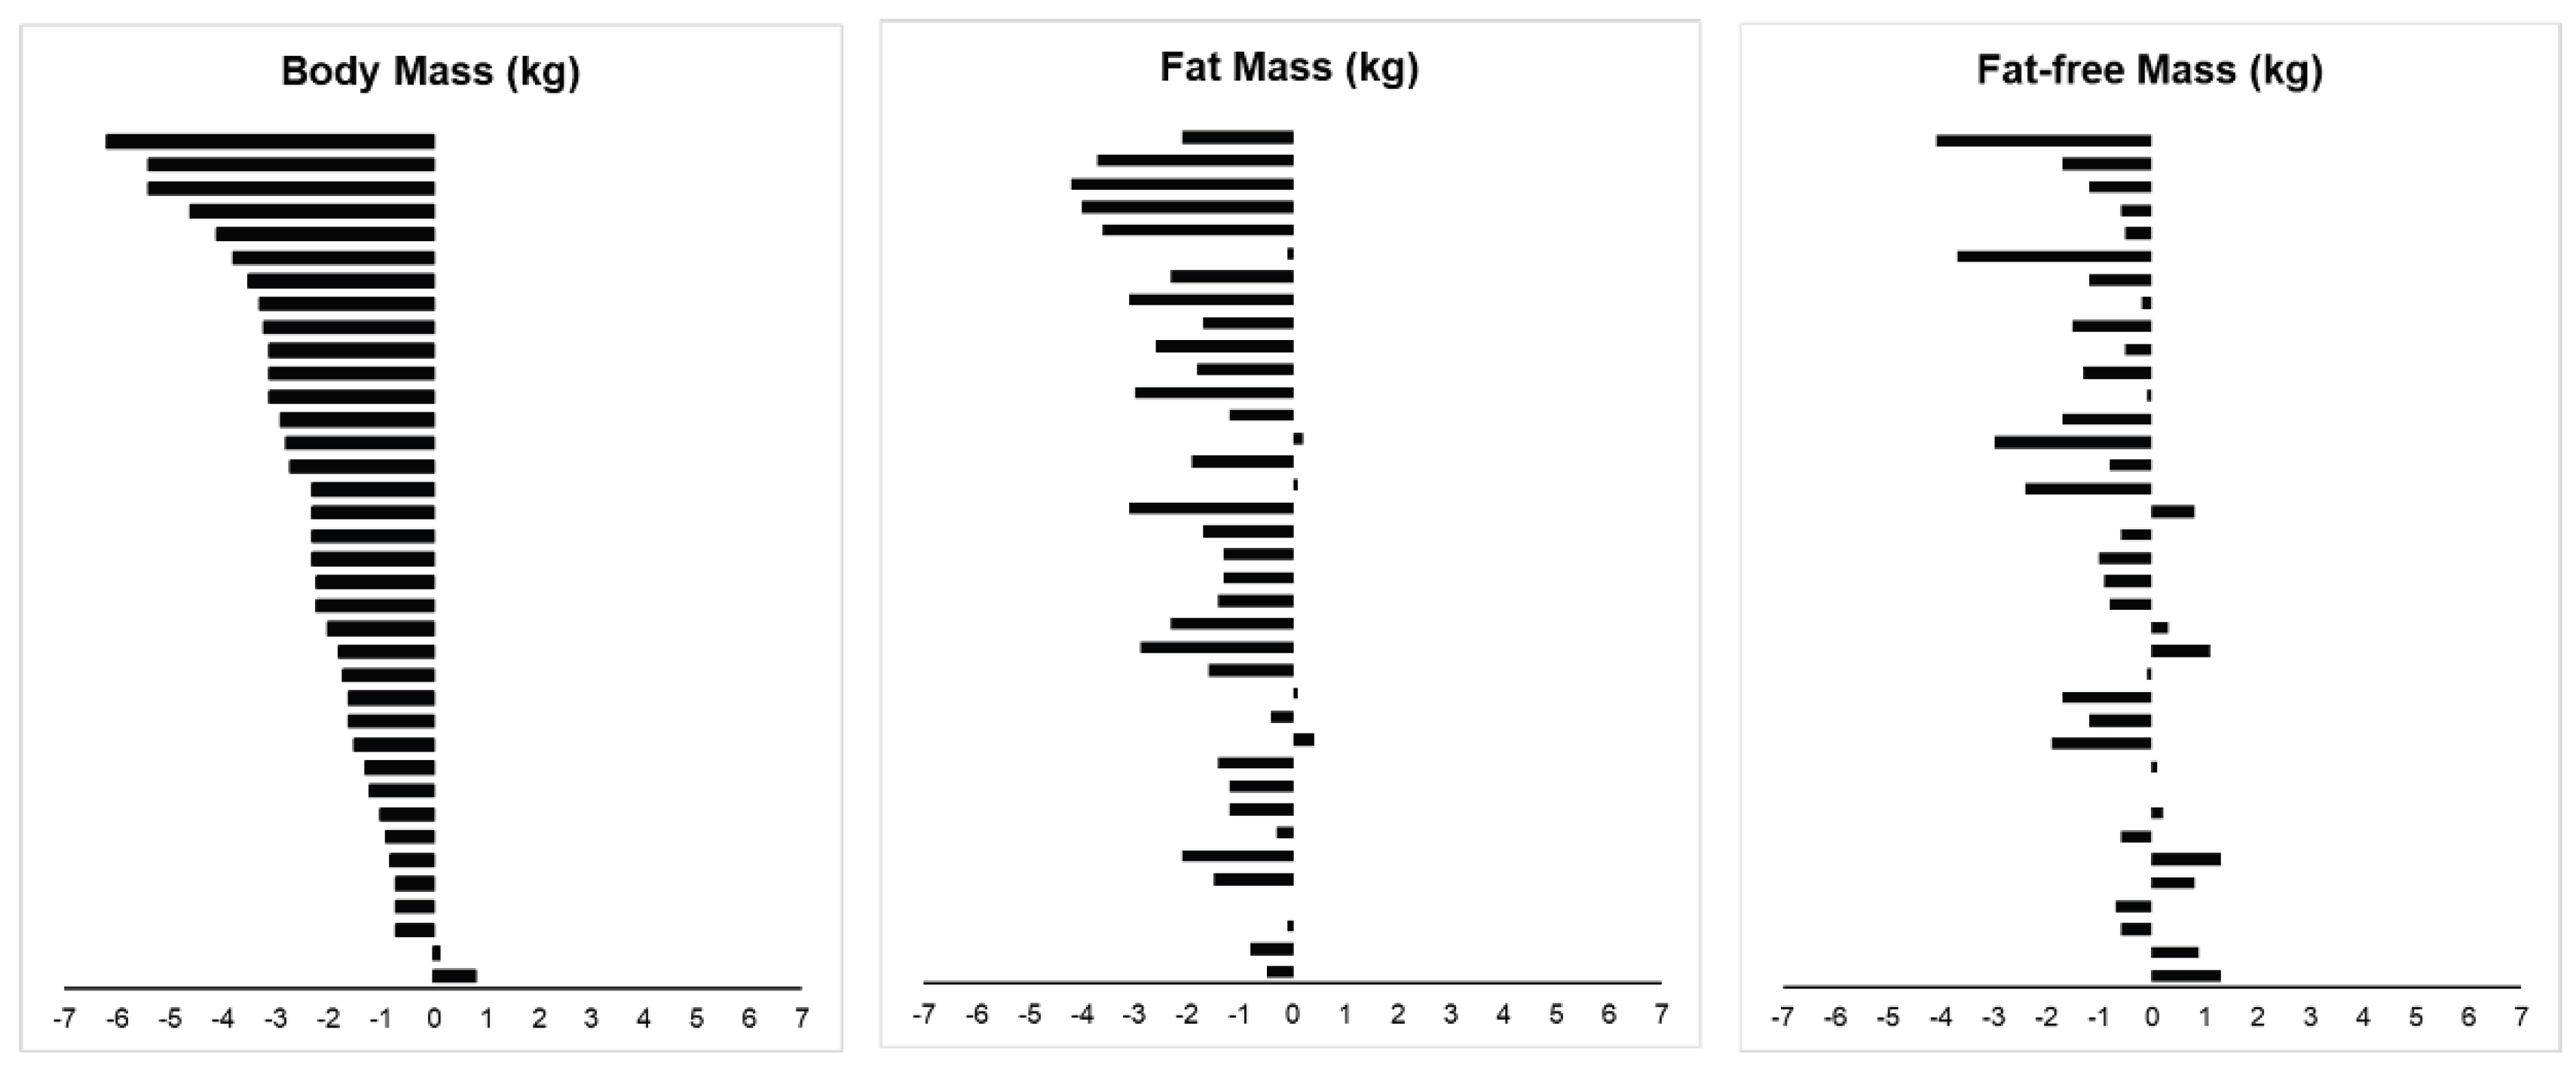

Table 1.
Participant characteristics for study 1 – single-arm group (S), study 2 – control (C) and protein (P) groups, and combined (All).
Table 1.
Participant characteristics for study 1 – single-arm group (S), study 2 – control (C) and protein (P) groups, and combined (All).
| Characteristics | S (n=13) | C (n=13) | P (n=11) | All (n=37) | |||||
|---|---|---|---|---|---|---|---|---|---|
| Mean | SD | Mean | SD | Mean | SD | Mean | SD | ||
| Age (y) | Pre | 26 | 4 | 24 | 2 | 26 | 1 | 25 | 3 |
| Post | 26 | 4 | 24 | 2 | 26 | 1 | 25 | 3 | |
| Height (m) | Pre | 1.72 | 0.07 | 1.72 | 0.04 | 1.78 | 0.07 | 1.74 | 0.07 |
| Post | 1.72 | 0.07 | 1.72 | 0.03 | 1.78 | 0.07 | 1.74 | 0.06 | |
| Body Mass (kg) | Pre | 80.1 | 12.8 | 74.5 | 7.8 | 89.4 | 18.8 | 80.9 | 14.5 |
| Post | 78.2 | 12.5 | 72.2 | 8.2 | 86.4 | 17.6 | 78.5 | 14.0 | |
| Fat Mass (kg) | Pre | 19.8 | 7.6 | 16.4 | 5.9 | 23.4 | 12.2 | 19.7 | 9.0 |
| Post | 18.8 | 7.6 | 14.6 | 6.2 | 21.3 | 12.0 | 18.1 | 8.9 | |
| FFM (kg) | Pre | 60.3 | 7.2 | 58.1 | 4.8 | 66.0 | 8.7 | 61.2 | 7.5 |
| Post | 59.4 | 6.7 | 57.6 | 5.2 | 65.1 | 8.0 | 60.5 | 7.2 | |
| SMM (kg) | Pre | 34.2 | 4.2 | 32.8 | 2.9 | 37.4 | 5.1 | 34.6 | 4.4 |
| Post | 33.6 | 4.0 | 32.6 | 3.2 | 36.8 | 4.7 | 34.2 | 4.3 | |
| AFFM (kg) | Pre | 24.9 | 3.2 | 24.1 | 2.2 | 28.1 | 4.5 | 25.6 | 3.7 |
| Post | 24.7 | 3.0 | 23.9 | 2.3 | 27.7 | 4.2 | 25.3 | 3.5 | |
| FFMI (kg/m2) | Pre | 20.4 | 1.8 | 19.6 | 1.3 | 20.7 | 1.9 | 20.2 | 1.7 |
| Post | 20.0 | 1.5 | 19.4 | 1.5 | 20.5 | 1.7 | 20.0 | 1.6 | |
| SMMI (kg/m2) | Pre | 11.5 | 1.0 | 11.1 | 0.8 | 11.7 | 1.1 | 11.4 | 1.0 |
| Post | 11.3 | 0.9 | 11.0 | 0.9 | 11.6 | 1.0 | 11.3 | 1.0 | |
| AFFMI (kg/m2) | Pre | 8.4 | 0.7 | 8.1 | 0.5 | 8.8 | 0.9 | 8.4 | 0.7 |
| Post | 8.3 | 0.5 | 8.1 | 0.6 | 8.7 | 0.8 | 8.3 | 0.7 | |
| BMI (kg/m2) | Pre | 26.9 | 2.3 | 25.2 | 2.5 | 28.1 | 5.2 | 26.7 | 3.6 |
| Post | 26.2 | 2.2 | 24.4 | 2.6 | 27.1 | 4.9 | 25.9 | 3.5 | |
| PBF (%) | Pre | 24.2 | 5.8 | 21.7 | 6.0 | 25.1 | 7.7 | 23.6 | 6.4 |
| Post | 23.4 | 5.8 | 19.8 | 6.6 | 23.6 | 8.0 | 22.2 | 6.8 | |
| FMI (kg/m2) | Pre | 6.6 | 2.0 | 5.5 | 2.0 | 7.4 | 3.7 | 6.4 | 2.6 |
| Post | 6.2 | 2.0 | 4.9 | 2.1 | 6.7 | 3.6 | 5.9 | 2.6 | |
| VFA (cm2) | Pre | 81.2 | 33.3 | 67.7 | 25.4 | 96.8 | 44.3 | 81.1 | 35.6 |
| Post | 76.1 | 33.2 | 59.1 | 26.7 | 88.3 | 44.2 | 73.8 | 35.9 | |
| ICW/ECW | Pre | 1.7 | 0.0 | 1.7 | 0.0 | 1.7 | 0.0 | 1.7 | 0.0 |
| Post | 1.7 | 0.0 | 1.7 | 0.0 | 1.7 | 0.0 | 1.7 | 0.0 | |
Data presented in mean and standard deviation (SD) with minimum and maximum values. FM, fat mass; FFM, fat-free mass; SMM, skeletal muscle mass; AFFM, appendicular fat-free mass; FFMI, fat-free mass index; SMMI, skeletal muscle mass index; AFFMI, appendicular fat-free mass index; BMI, body mass index; PBF, percentage body fat; FMI, fat mass index; VFA, visceral fat area; ICW, intracellular water; ECW, extracellular water.
Table 2.
Within-subjects Body Composition Analyses (Combined Data).
| SE | p- | Location | 95% CI | Effect | |||||
|---|---|---|---|---|---|---|---|---|---|
| Characteristics | Test | Statistic | df | Difference | value | Parametera | Lower | Upper | Sizeb |
| Body mass (kg) | T-test | -9.378 | 36 | 0.252 | <.001 | -2.4 | -2.9 | -1.9 | -1.5 |
| Fat Mass (kg) | T-test | -7.752 | 36 | 0.208 | <.001 | -1.6 | -2.0 | -1.2 | -1.3 |
| FFM (kg) | T-test | -3.622 | 36 | 0.207 | <.001 | -0.8 | -1.2 | -0.3 | -0.6 |
| SMM (kg) | T-test | -3.691 | 36 | 0.116 | <.001 | -0.4 | -0.7 | -0.2 | -0.6 |
| AFFM (kg) | T-test | -2.842 | 36 | 0.088 | 0.007 | -0.3 | -0.4 | -0.1 | -0.5 |
| FFMI (kg/m2) | Wilcoxon | 117 | 36 | 0.068 | <.001 | -0.2 | -0.3 | -0.1 | -0.6 |
| SMMI (kg/m2) | Wilcoxon | 114 | 36 | 0.038 | <.001 | -0.1 | -0.2 | -0.1 | -0.7 |
| AFFMI (kg/m2) | Wilcoxon | 173 | 36 | 0.029 | 0.006 | -0.1 | -0.1 | 0.0 | -0.5 |
| BMI (kg/m2) | T-test | -9.603 | 36 | 0.083 | <.001 | -0.8 | -1.0 | -0.6 | -1.6 |
| FMI (kg/m2) | T-test | -7.657 | 36 | 0.070 | <.001 | -0.5 | -0.7 | -0.4 | -1.3 |
| PBF (%) | T-test | -5.531 | 36 | 0.247 | <.001 | -1.4 | -1.9 | -0.9 | -0.9 |
| VFA (cm2) | T-test | -8.752 | 36 | 0.834 | <.001 | -7.3 | -9.0 | -5.6 | -1.4 |
a Mean difference for t-test, Hodges-Lehmann median difference for Wilcoxon. b Cohen’s d for t-test, matched rank biserial correlation for Wilcoxon. FFM, fat-free mass; SMM, skeletal muscle mass; AFFM, appendicular fat-free mass; FFMI, fat-free mass index; SMMI, skeletal muscle mass index; AFFMI, appendicular fat-free mass index; BMI, body mass index; PBF, percentage body fat; FMI, fat mass index; VFA, visceral fat area.
Table 3.
Weekly Physical Activity and Health Indices (Combined Data).
| Week | N | Mean | SD | |
|---|---|---|---|---|
| GPAQ (Met·min/week) | 0 | 37 | 1443 | 1053 |
| 1 | 37 | 1336 | 1051 | |
| 2 | 37 | 1089 | 823 | |
| 3 | 37 | 1139 | 800 | |
| 4 | 37 | 1189 | 1012 | |
| SBP (mmHg) | 0 | 37 | 118 | 10 |
| 1 | 37 | 118 | 9 | |
| 2 | 37 | 117 | 8 | |
| 3 | 37 | 116 | 8 | |
| 4 | 37 | 117 | 10 | |
| DBP (mgHg) | 0 | 37 | 69 | 9 |
| 1 | 37 | 68 | 8 | |
| 2 | 37 | 67 | 8 | |
| 3 | 37 | 67 | 9 | |
| 4 | 37 | 68 | 8 | |
| FG (mmol) | 0 | 36 | 5.3 | 0.4 |
| 1 | 37 | 5.1 | 0.3 | |
| 2 | 37 | 5.3 | 0.4 | |
| 3 | 36 | 5.1 | 0.4 | |
| 4 | 37 | 5.2 | 0.4 |
Data presented in mean and standard deviation (SD) with minimum and maximum values. GPAQ, global physical activity questionnaire; MET, metabolic equivalent of task; SBP, systolic blood pressure; DBP, diastolic blood pressure; FG, fasting blood glucose.
Disclaimer/Publisher’s Note: The statements, opinions and data contained in all publications are solely those of the individual author(s) and contributor(s) and not of MDPI and/or the editor(s). MDPI and/or the editor(s) disclaim responsibility for any injury to people or property resulting from any ideas, methods, instructions or products referred to in the content. |
© 2025 by the authors. Licensee MDPI, Basel, Switzerland. This article is an open access article distributed under the terms and conditions of the Creative Commons Attribution (CC BY) license (http://creativecommons.org/licenses/by/4.0/).
Copyright: This open access article is published under a Creative Commons CC BY 4.0 license, which permit the free download, distribution, and reuse, provided that the author and preprint are cited in any reuse.


