
Submitted:
17 February 2025
Posted:
18 February 2025
You are already at the latest version
Abstract
Background/Objectives: Obesity is a growing public health issue, particularly among young adults, with long-term dietary strategies still under debate. This study evaluates the impact of the ketogenic diet (KD) and time-restricted eating (TRE) on QRISK3 cardiovascular risk scores over three months in individuals with obesity. Methods: Forty-nine participants were assigned to either a KD (n=23) with a controlled macronutrient composition or TRE (n=26) without specific macronutrient distribution. A certified clinical nutritionist prescribed and monitored the dietary interventions. Anthropometric measurements, body composition analysis, and QRISK3 scores were assessed at baseline and after 12 weeks to evaluate cardiovascular risk modifications. Results: Both interventions significantly reduced BMI (TRE: p < 0.001, KD: p < 0.001), waist circumference (WC) (TRE: p < 0.001, KD: p < 0.001), and waist-to-hip ratio (WHR) (TRE: p < 0.001, KD: p < 0.001). However, the KD led to superior metabolic improvements, including increased HDL-C (p < 0.001) and a lower TC/HDL-C ratio (p < 0.001), while TRE showed no significant HDL-C changes (p = 0.30). Systolic blood pressure improved significantly only in the KD group (p < 0.001). QRISK3 scores declined in both groups (TRE: p = 0.05, KD: p < 0.001), with a greater reduction in KD. Linear regression (adjusted R² = 0.975) identified baseline QRISK (p < 0.001) as the strongest predictor of final QRISK scores, while fasting glucose (p = 0.015) and atrial fibrillation (p = 0.048) were associated with increased cardiovascular risk. Interaction analysis (adjusted R² = 0.495) showed that older participants in the KD group experienced a more pronounced QRISK reduction (p = 0.011); Conclusions: The ketogenic diet proved to be more effective than time-restricted eating in reducing cardiovascular risk, improving lipid profile, and enhancing glycemic control. These findings support KD as a superior dietary intervention for individuals with obesity and metabolic dysfunction.
Keywords:
obesity
; cardiovascular risk
; QRISK3
; ketogenic diet
; time-restricted eating
1. Introduction
Overweight and obesity are multifaceted global health challenges associated with a broad spectrum of medical, psychological, and social complications. These conditions are driven by a combination of genetic, epigenetic, and environmental factors. Among these, dietary habits high in energy-dense, nutrient-poor foods and physical inactivity are widely recognized as predominant contributors to the global rise in obesity, even as genetic predisposition plays a significant role in individual susceptibility [1,2]. Furthermore, the increasing prevalence of obesity is staggering, with more than 1 billion individuals worldwide estimated to be affected by 2022, according to recent data from The Lancet [3]. This alarming trend highlights the urgent need for evidence-based interventions targeting the complex interplay of factors that contribute to obesity [4]. Collaborative efforts across public health systems, policymakers, and researchers are essential to mitigate its impacts on healthcare resources and global well-being [5]. The worldwide prevalence of overweight individuals has seen a dramatic rise, doubling since 1990 and highlighting a worrisome trend. This surge is especially pronounced among children aged 5 to 19, where the rate has increased fourfold during the same timeframe [6]. Obesity is linked not only to cardiovascular conditions and insulin resistance but also to a substantial elevation in overall morbidity and mortality rates [7].
Managing individuals with excess weight poses numerous long-term challenges, primarily due to the intricate interplay between the body's energy conservation mechanisms and its heightened responsiveness to appetite-stimulating signals. This relationship significantly complicates efforts to prevent weight regain following initial weight loss [8,9]. From an evolutionary perspective, the human body has been finely tuned to prioritize the accumulation and preservation of fat stores, a critical survival strategy during periods of food scarcity. These adaptive mechanisms, which ensured energy availability during times of famine, are now maladaptive in modern environments characterized by an abundance of calorie-dense foods and sedentary lifestyles, contributing to the global obesity epidemic [10,11]. To address this complex condition, various interventions have been developed, ranging from dietary adjustments and structured physical activity programs to behavioral therapy, pharmacological treatments, and bariatric surgery [12]. These strategies aim not only to achieve weight reduction by decreasing BMI but also to alleviate obesity-related health risks and enhance overall quality of life [8,10]. Among these, calorie restriction combined with increased physical activity is often the cornerstone of most weight management programs, as it helps establish the necessary calorie deficit for weight loss and promotes favorable health outcomes [13]. The concept of "diet" is broadly defined as the total energy and nutrient intake derived from the foods and beverages consumed regularly [14]. Nutritional recommendations typically emphasize increasing the proportion of complex and unprocessed carbohydrates while reducing dietary fat intake. This approach aims to lower overall energy intake while concurrently increasing energy expenditure through regular physical activity [15,16]. However, lifestyle modification programs frequently demonstrate limited success, particularly in individuals with severe obesity, underscoring the need for more effective, individualized interventions [16]. By addressing these multifactorial challenges, a comprehensive and multidisciplinary approach is crucial for achieving sustainable weight management and mitigating the health consequences associated with obesity.
However, weight reduction should not be regarded as the sole therapeutic objective. Instead, a comprehensive multidisciplinary approach aimed at targeting the cardiometabolic complications associated with obesity is imperative for the effective management of these patients. Several dietary approaches have been widely studied for their effectiveness in weight management and their impact on cardiovascular risk reduction. Among the most prominent are the Mediterranean diet, the DASH (Dietary Approaches to Stop Hypertension) diet, the low-carbohydrate diet, and the plant-based diet, each with varying degrees of evidence supporting their benefits [17,18]. The Mediterranean diet, characterized by a high intake of fruits, vegetables, whole grains, nuts, olive oil, and moderate consumption of fish and poultry, has been consistently associated with improved cardiovascular outcomes, including reductions in blood pressure, lipid levels, and inflammatory markers [19,20]. Similarly, the DASH diet, which emphasizes fruits, vegetables, low-fat dairy, whole grains, and reduced sodium intake, has been shown to significantly lower blood pressure and decrease the risk of cardiovascular disease [21,22]. Low-carbohydrate diets, particularly those focusing on healthy fats and high-quality protein sources, have demonstrated short-term improvements in weight loss and cardiovascular risk factors, such as increased HDL cholesterol and reduced triglycerides, although long-term benefits remain less certain [23,24]. Meanwhile, plant-based diets, which emphasize a high intake of legumes, whole grains, fruits, and vegetables, have been linked to lower risks of coronary artery disease and hypertension, likely due to their high fiber content and reduced intake of saturated fats [25,26]. While these dietary patterns differ in macronutrient composition, they share common features such as the inclusion of nutrient-dense foods and the reduction of processed foods and added sugars, which collectively contribute to their cardiovascular protective effects [27].
Protein is widely recognized as the most essential macronutrient for facilitating favorable changes in body composition, including the preservation of lean body mass and the promotion of fat loss during caloric restriction [28]. For individuals engaging in regular physical activity, protein intake recommendations range between 1.2 and 2.0 grams per kilogram of body weight per day (g/kg/day), values supported by multiple studies examining protein's role in muscle protein synthesis and metabolic regulation [29-38]. This recommendation exceeds the current U.S. Recommended Dietary Allowance (RDA) for protein, which is set at 0.8 g/kg/day, a level aimed primarily at preventing deficiency in sedentary individuals rather than optimizing body composition or performance [39]. Protein intakes above the RDA are often classified as "high" protein diets, though their benefits extend beyond muscle preservation to include improvements in metabolic health and satiety [40]. Studies suggest that combining moderate energy restriction (500-750 kcal/day) with protein intake exceeding 22% of total energy intake yields substantial physiological benefits, such as enhanced insulin sensitivity and more effective preservation of lean body mass during weight loss interventions [41-43]. For example, overweight women following a calorie-restricted diet with a deficit of 750 kcal/day and a protein intake constituting 30% of total energy (equivalent to approximately 1.4 g/kg/day) demonstrated significantly less reduction in lean body mass over a 12-week period compared to counterparts consuming an isocaloric diet with protein levels meeting the RDA of 0.8 g/kg/day [44]. Comparable findings have been reported in male participants, further emphasizing the importance of higher protein intake in mitigating muscle loss during caloric deficits [45]. Despite these promising results, the effects of high-protein, calorie-restricted diets on adipose tissue mass remain less extensively studied. Current evidence suggests that while lean body mass is better preserved under such dietary protocols, the extent to which they directly influence fat loss may depend on additional factors, including energy expenditure, exercise modalities, and individual metabolic responses [46]. Consequently, further research is warranted to elucidate the specific impact of elevated protein intake on adipose tissue dynamics during caloric restriction.
The ketogenic diet (KD), characterized by its low carbohydrate and high fat composition, has gained popularity as a weight loss intervention [14]. Research has consistently demonstrated that ketogenic diets can facilitate significant and rapid weight loss during the initial phases of adherence [47-49]. This early weight loss primarily results from glycogen depletion, water loss, and fat metabolism induced by carbohydrate restriction. However, over time, the weight loss achieved through the ketogenic diet tends to plateau, with long-term results becoming comparable to those observed with other dietary approaches after approximately one year [50,51]. A key distinction between the ketogenic diet and other low-carbohydrate diets (LCDs) lies in its stricter carbohydrate restrictions, limiting daily intake to no more than 50 grams or 10% of total macronutrient consumption [52]. The macronutrient composition of the ketogenic diet is typically distributed as 55-60% fats, 30-35% protein, and only 5-10% carbohydrates, which promotes the metabolic state of ketosis. In this state, the body shifts from using carbohydrates to primarily metabolizing fats as its primary energy source, resulting in the production of ketone bodies [56]. Four recognized subtypes of the ketogenic diet include the modified Atkins diet, the low glycemic index diet, the classic ketogenic diet with long-chain triglycerides, and the ketogenic diet utilizing medium-chain triglycerides [53]. These variations allow for tailored approaches depending on individual metabolic needs and clinical goals. The ketogenic diet offers a range of potential health benefits beyond weight loss, including reduced risk factors for type 2 diabetes, cardiovascular diseases, and certain cancers [54]. However, it is not without drawbacks. In the short term, adherence to the ketogenic diet often leads to adverse effects collectively referred to as the "keto flu," which includes symptoms such as fatigue, headaches, nausea, vomiting, constipation, and insomnia [53]. These symptoms are typically transient and manageable. More concerning, however, are the potential long-term adverse effects, which remain underexplored due to a paucity of longitudinal studies [55-57]. Reported risks associated with prolonged adherence to the ketogenic diet include hypoproteinemia, hypercalciuria, kidney stone formation, and deficiencies in essential vitamins and minerals, highlighting the need for careful monitoring and supplementation in long-term use [29,30].
Time-restricted eating (TRE) has garnered considerable attention in recent years as an effective strategy for promoting significant weight loss and enhancing metabolic health [58,59]. Unlike traditional dietary approaches that focus on reducing the overall quantity of food consumed, TRE places emphasis on the timing of food intake, confining eating to specific periods within a 24-hour cycle [60]. TRE is categorized under the broader framework of intermittent fasting, which includes various dietary protocols such as zero-calorie alternate-day fasting (zero-calorie ADF), modified alternate-day fasting (MADF), the 5:2 diet, and TRE itself [60-62]. Among these, TRE has emerged as the most widely practiced form due to its simplicity and ease of implementation [63]. This dietary strategy typically involves limiting food consumption to a defined time window, generally spanning 4 to 10 hours, during which individuals eat ad libitum without the need for deliberate calorie counting or monitoring. The remaining hours of the day are spent fasting [58]. Research indicates that individuals with obesity who adopt TRE may experience a spontaneous reduction in daily caloric intake, averaging up to 550 kcal/day, even without prescribed caloric restriction [64-67]. Weight loss associated with TRE ranges between 5% and 10% of initial body weight, with most of the reduction attributed to a decrease in adipose tissue rather than muscle mass, preserving lean body composition [58]. Moreover, TRE has demonstrated favorable effects on regional fat distribution, particularly in reducing abdominal and visceral adipose tissue, which are strongly associated with cardiometabolic risk factors. This improvement in body composition is observed primarily when the overall weight loss achieved through TRE is clinically significant [68,69]. These findings underscore the potential of TRE as a viable and sustainable nutritional intervention for individuals with obesity, providing not only weight loss benefits but also broader metabolic improvements. However, additional long-term studies are needed to fully elucidate its effects. The QRISK3 algorithm is an advanced cardiovascular risk prediction tool developed to estimate an individual’s 10-year risk of developing cardiovascular disease (CVD) [70]. This tool incorporates a wide range of traditional risk factors, including age, sex, smoking status, systolic blood pressure, and lipid profiles, alongside additional non-traditional variables such as body mass index (BMI), ethnicity, socioeconomic deprivation, and comorbidities such as chronic kidney disease, diabetes, rheumatoid arthritis, atrial fibrillation, and severe mental illness [70,71]. The inclusion of these expanded variables enhances the predictive power of QRISK3, making it applicable to diverse populations and addressing limitations identified in its predecessor, QRISK2 [72]. As a result, QRISK3 is extensively used in clinical settings to guide primary prevention strategies, identifying individuals who may benefit from interventions such as lifestyle modifications, pharmacological therapy, or intensive monitoring [70,73].
While QRISK3 is a robust tool for assessing cardiovascular risk, it does not currently incorporate dietary patterns as a factor in its algorithm. This omission is notable given the significant influence of dietary habits on modifiable cardiovascular risk factors, such as blood pressure, cholesterol levels, and body weight, all of which are key components of the QRISK3 model [74]. The QRISK3 algorithm has been extensively validated through large-scale cohort studies and is commonly utilized in clinical practice to inform decision-making on cardiovascular disease (CVD) prevention strategies. For instance, adherence to the Mediterranean diet—a dietary pattern characterized by high consumption of fruits, vegetables, nuts, olive oil, and fish—has been consistently associated with reduced blood pressure, improved lipid profiles, and decreased inflammation, all of which contribute to a lower cardiovascular risk [75,76]. Similarly, the DASH (Dietary Approaches to Stop Hypertension) diet has demonstrated effectiveness in lowering blood pressure and improving overall cardiovascular health through its focus on reduced sodium intake and increased consumption of whole grains, lean proteins, and vegetables [77]. Plant-based diets, which emphasize high intake of fiber-rich foods and minimize saturated fat consumption, have also shown promise in reducing LDL cholesterol and enhancing endothelial function, further contributing to cardiovascular protection [78,79]. Despite the substantial body of evidence supporting the cardioprotective effects of these dietary patterns, no direct association has been established between adherence to these diets and reductions in QRISK3 scores. This lack of direct integration underscores a limitation of the current QRISK3 algorithm, which does not account for dietary habits as a modifiable lifestyle factor, despite its proven impact on cardiovascular risk profiles [80]. In summary, while QRISK3 remains a valuable tool for assessing cardiovascular risk and guiding clinical interventions, its exclusion of dietary variables represents a gap in its predictive framework. Current literature underscores the critical role of diet in modulating cardiovascular risk factors encompassed by QRISK3; however, no studies to date have explicitly examined the relationship between specific dietary patterns and QRISK3 scores. Further research is needed to explore whether incorporating dietary factors into the QRISK3 algorithm could enhance its predictive accuracy and applicability across various populations.
The objective of this prospective observational study is to perform a comparative analysis of the dynamics of QRISK3 cardiovascular risk scores in individuals with obesity who adhere to either a ketogenic diet or a time-restricted eating (TRE) regimen throughout a 3-month period. The study seeks to evaluate how these distinct dietary strategies, which differ in macronutrient composition and meal timing, impact QRISK3 scores by influencing key modifiable cardiovascular risk factors such as lipid profiles, BMI, and blood pressure. Furthermore, the research aims to investigate the relative effects of these interventions on adipose tissue distribution, visceral fat reduction, and lean body mass preservation, using advanced bioelectrical impedance analysis (BIA) and other anthropometric measurements. By exploring the comparative efficacy of the ketogenic diet and TRE in modulating QRISK3 scores, the study endeavors to provide critical insights into the role of dietary interventions in reducing cardiovascular risk and optimizing long-term health outcomes in the obese population.
2. Materials and Methods
This prospective observational study was conducted over a two-year period, from July 2022 to April 2024, within the endocrinology and nutrition unit. The study cohort consisted of 49 participants, both male and female, presenting with varying degrees of overweight and obesity, with 26 assigned to the TRE group and 23 to the KD group The mean age of the participants was 35.23 ± 11.16 years. All individuals voluntarily enrolled in the study, agreeing to undergo a detailed assessment of their dietary behaviors and a comprehensive evaluation of their nutritional and metabolic status. The primary aim of the study was to facilitate evidence-based lifestyle modifications and develop tailored dietary interventions focused on achieving weight reduction and optimizing nutritional and metabolic health outcomes with the aim of improving cardiovascular health and enhancing quality of life. Each participant underwent comprehensive clinical and nutritional evaluations at two critical time points during the study: an initial baseline assessment and a final evaluation conducted at 12 weeks. Both assessments were performed by a certified clinical nutritionist to ensure accuracy and consistency. At these two time points, the QRISK3 score was also calculated for each participant to assess their cardiovascular risk consistently throughout the study.
Informed consent was obtained from all participants prior to their inclusion in the study. The research was conducted in compliance with the ethical principles outlined in the Helsinki Declaration and received formal approval from the Scientific Research Ethics Committee (CECS) of the “Victor Babeș” University of Medicine and Pharmacy Timișoara (Approval No. 69/03.10.2022).
2.1. Patient inclusion and exclusion criteria
Inclusion criteria included participants aged over 25 years with a body mass index (BMI) exceeding 25 kg/m² who voluntarily sought nutritional counseling for the implementation of a weight loss dietary plan aimed at achieving an optimal weight. The study cohort included individuals from both urban and rural environments and represented a range of educational backgrounds. Women at different menopausal stages, including both menopausal and non-menopausal, were also included. Only participants who agreed to complete the full evaluation process and provided signed informed consent were eligible for inclusion in the final analysis. Furthermore, the final analysis included only those participants who demonstrated full adherence to the prescribed dietary program and consistently attended all scheduled medical evaluations.
Exclusion criteria included individuals under the age of 25, pregnant or breastfeeding women, those consuming dietary supplements or anti-obesity medications [81], breastfeeding or pregnant women, and patients with diabetes mellitus treated with oral hypoglycemic agents associated with a risk of hypoglycemia (e.g., sulfonylureas) [82] or undergoing insulin therapy. Participants who had followed any form of dietary therapy within the past 12 months or had a history of bariatric surgery were also excluded. Additionally, patients with a history of acute pancreatitis, renal or liver diseases (including chronic kidney disease and liver failure), or those diagnosed with porphyria were not eligible for inclusion. Furthermore, patients with obesity caused by specific etiologies, such as genetic conditions (e.g., Prader-Willi syndrome), iatrogenic factors (e.g., insulin therapy, glucocorticoids, antipsychotics), or endocrinological disorders (e.g., Cushing's syndrome, hypothyroidism, hypogonadism), were excluded [83,84]. Participants with daily alcohol consumption were also deemed ineligible for the study. Individuals who declined to sign the informed consent, failed to adhere to the prescribed dietary program or attend regular medical visits, or had documented psychiatric disorders were excluded from the study.
2.2. Comprehensive clinical evaluation
Prior to initiating any procedures, all participants were thoroughly informed about the study’s objectives, methodology, and the clinical and paraclinical evaluations required. Each participant was provided with a detailed informed consent form, which was carefully reviewed and signed to confirm their voluntary participation. Also, during the initial consultation, a comprehensive anamnesis was conducted to collect information on demographic characteristics, personal medical history, behavioral factors, and laboratory data from the preceding six months. Additionally, during this consultation, each participant’s QRISK3 score was calculated, interpreted, and explained in detail. This process included an assessment of all contributing variables, the final absolute score, and the relative risk score. The primary non-invasive technique utilized in this study was bioelectrical impedance analysis (BIA), employed to estimate segmental body composition with precision. Based on these parameters, the study cohort was stratified into various subgroups for further analysis.
Personal medical history: Firstly, a thorough anamnesis was conducted for each participant, with a specific focus on documented comorbidities. Particular attention was given to conditions relevant to the calculation of the QRISK3 score, including hypertension, type 2 diabetes mellitus, chronic kidney disease, rheumatoid arthritis, systemic lupus erythematosus, atrial fibrillation, erectile dysfunction in male participants, and the presence of migraines. Additionally, targeted questions addressed a family history of angina or myocardial infarction occurring before the age of 60, as these factors significantly contribute to cardiovascular risk. Secondly, baseline biological data, obtained within the past three months, were collected to ensure accuracy and relevance. These included fasting glucose levels (mg/dL), lipid profile parameters such as total cholesterol (TC) (mg/dL), low-density lipoprotein cholesterol (LDL-c) (mg/dL), high-density lipoprotein cholesterol (HDL-c) (mg/dL), triglycerides (TG) (mg/dL), and non-HDL cholesterol (mg/dL). Additional markers included uric acid (mg/dL), glycated hemoglobin (HbA1c) (%), thyroid-stimulating hormone (TSH), free thyroxine (FT4), homeostasis model assessment-estimated insulin resistance (HOMA-IR), and 25-hydroxy-vitamin D (25-OH-Vitamin D) (ng/mL). Based on abnormalities identified in these parameters, participants were stratified into subgroups for further analysis. Moreover, the menopausal status of each female participant was carefully documented to account for its potential impact on metabolic and cardiovascular risk factors.
Factors related to behavior and lifestyle evaluated were:
- Physical activity level: to avoid classification as sedentary, participants were required to engage in a minimum of 150 minutes of moderate to vigorous physical activity per week, or at least 30 minutes of such activity daily, in addition to basal activity levels.
- Sleep duration: a nightly sleep duration of fewer than 7 hours was categorized as sleep deprivation, consistent with established guidelines [85].
- Alcohol consumption: participants self-reported their alcohol intake, specifying the number of alcohol units consumed. One unit was defined as equivalent to 10 mL of pure ethanol, with two units corresponding to a pint or can of beer, one unit representing a 25 mL shot of distilled spirits, and one unit equating to a standard 175 mL glass of wine. Participants who consumed more than two units of alcohol per day were classified as "alcoholic," whereas those who abstained completely from alcohol were categorized as "non-alcoholic" [86].
- Smoking status: to ensure comprehensive categorization within the evaluation of the QRISK3 score, participants were classified into the following groups: non-smoker, ex-smoker, light smoker (fewer than 10 cigarettes per day), moderate smoker (10-19 cigarettes per day), and heavy smoker (20 or more cigarettes per day).
Nutritional status was assessed by calculating BMI, a widely utilized and cost-effective anthropometric parameter. BMI was determined using the standard formula: BMI = weight (kg) / height² (m²) [87,88]. All measurements were conducted by a trained physician on the research team to ensure precision and reliability. To reduce variability, measurements were performed consistently at the same time of day, and participants were advised to refrain from intense physical activity or significant hydration changes prior to the assessment. These standardized procedures ensured the accuracy and reproducibility of the anthropometric data collected.
- Height measurement: Participant height was measured using a calibrated, wall-mounted stadiometer. Each individual was instructed to stand upright, barefoot, with their heels together and back straight, ensuring accurate vertical alignment for precise measurement.
- Body weight measurement: Body weight at the time of presentation was recorded using a certified mechanical scale with a maximum capacity of 180 kg. Each participant was instructed on the procedure, which involved standing upright on the scale with minimal clothing and no footwear to ensure consistent and accurate results.
- Circumference measurements: Waist circumference was measured at the midpoint between the lower edge of the last palpable rib and the uppermost point of the iliac crest, while hip circumference was measured at the widest portion of the buttocks. These measurements were performed using a non-elastic, calibrated measuring tape positioned parallel to the floor, adhering to standardized anthropometric protocols.
- Waist-to-hip ratio measurement: After determining the waist circumference, the hip circumference was subsequently measured. It was measured at the widest part of the buttocks, ensuring the tape remained parallel to the floor. WHR was then calculated as waist circumference (cm) divided by hip circumference (cm). This standardized method ensured consistency and minimized measurement error across participants.
2.3. QRISK3 Score calculation and cardiovascular risk assessment
The QRISK3 score was calculated for each participant at two key time points—baseline and the final 12-week assessment—to evaluate individual cardiovascular risk dynamics over the course of the study. The calculation was performed using the validated QRISK3 algorithm, which integrates multiple demographic, clinical, and biochemical parameters to estimate the 10-year risk of developing cardiovascular disease (CVD). The QRISK3 score was computed based on the official online calculator developed by the University of Nottingham, ensuring accuracy and consistency across all evaluations. Each participant's data was carefully entered, and results were interpreted using the recommended clinical thresholds [89]. The variables incorporated into the QRISK3 calculation included:
- Age (years)
- Sex (male/female)
- Ethnicity
- Body mass index (BMI) (kg/m²)
- Systolic blood pressure (mmHg)
- Total cholesterol to high-density lipoprotein cholesterol (TC/HDL) ratio
- Smoking status (non-smoker, ex-smoker, light smoker <10 cigarettes/day, moderate smoker 10-19 cigarettes/day, heavy smoker ≥20 cigarettes/day)
- Diagnosis of hypertension
- Diagnosis of type 2 diabetes mellitus
- Diagnosis of chronic kidney disease (stages 3, 4, or 5)
- Diagnosis of rheumatoid arthritis
- Diagnosis of systemic lupus erythematosus
- History of atrial fibrillation
- History of migraine
- Diagnosis of severe mental illness (e.g., schizophrenia, bipolar disorder, major depression)
- Use of atypical antipsychotic medication
- Regular corticosteroid therapy
- Presence of erectile dysfunction (in male participants)
- Family history of premature cardiovascular disease (angina or myocardial infarction before the age of 60 in a first-degree relative) [89].
The QRISK3 algorithm has been validated in large cohort studies and is widely used in clinical practice to guide decisions regarding interventions for CVD prevention [90]. By incorporating a comprehensive range of risk factors, QRISK3 provides a nuanced assessment of an individual's cardiovascular risk, facilitating personalized management strategies.
2.4. Segmental body composition assessment using bioelectrical impedance analysis
The segmental body composition analysis in this study was conducted using the Tanita Body Composition Analyzer BC-418 MA III (T5896, Tokyo, Japan), a device widely validated for estimating body composition. This analyzer provides body composition metrics that have been shown to be comparable to those obtained through dual-energy X-ray absorptiometry (DXA), utilizing segmental impedance analysis to enhance accuracy in body composition assessments [91,92]. Multiple studies have confirmed that, in clinical settings, the Tanita Body Fat Monitor yields results within ±5% of the accuracy achieved by DXA, which is considered the reference standard for body composition evaluation [93,94,95]. Furthermore, research has demonstrated that the Tanita BC-418 MA III maintains a high level of accuracy when estimating total and segmental body composition across various populations, including middle-aged adults [96].
This analyzer operates by transmitting a low-intensity electrical current through the body and measuring the impedance encountered, which varies depending on the proportion of fat mass, lean mass, and total body water [97]. BIA is recognized as a practical and non-invasive technique for body composition assessment, with studies validating its reproducibility and precision under standardized conditions [98]. Comparative analyses have further established its reliability across different populations, making it a widely used tool in both clinical and research settings [99].
To ensure precision and consistency, standardized protocols were followed during all BIA assessments. Each participant was instructed to maintain an upright and motionless posture throughout the procedure while holding the device's handles to establish optimal contact with the eight electrodes (two per limb). To eliminate potential signal interference, participants were required to remove all metallic accessories, including jewelry, watches, and belts, before measurement. Additionally, all assessments were conducted barefoot to ensure direct skin contact with the foot electrodes, thereby optimizing electrical conductivity and improving measurement accuracy [100]. For data reliability, each participant underwent two separate BIA assessments—one at baseline and another at the final evaluation after three months. This standardized approach facilitated the comparative analysis of body composition changes throughout the study period [101].
2.5. Clinical weight management intervention
Following the initial clinical and nutritional evaluation, each participant was assigned a structured dietary intervention by a certified clinical nutritionist, to be maintained consistently over a three-month period. Individualized caloric and macronutrient distributions were determined based on a comprehensive assessment of baseline nutritional status, ensuring adherence to the specific dietary framework designated for each participant. The dietary protocols were strictly implemented throughout the 12-week intervention, with meals organized into three main meals and two snacks per day. Food selection followed national regulatory guidelines, requiring participants to carefully analyze nutritional labels to ensure compliance [102]. In addition to personalized dietary plans, general nutritional recommendations were provided to support overall metabolic health. These guidelines emphasized a minimum daily intake of 2500 mL of non-caloric fluids, the consumption of unsweetened coffee without milk, and the exclusion of any food items not included in the assigned dietary regimen for the duration of the study. To ensure adherence and compliance with the intervention, daily dietary intake was monitored through an online tracking platform. Additionally, participants attended weekly nutritional follow-up visits at the medical center, where adherence and dietary adjustments were assessed. BIA was performed at two key time points—baseline and at the conclusion of the program—to evaluate changes in body composition and the impact of the prescribed dietary interventions. The dietary interventions were determined through a collaborative decision-making process involving the physician, clinical nutritionist, and participant, following a comprehensive initial nutritional assessment. The interventions were categorized into two distinct dietary approaches: isocaloric diets with a predefined macronutrient distribution, represented by the KD, and isocaloric diets without a specific macronutrient distribution, represented by TRE. The final caloric intake for each participant was individually calculated based on their BMR, which was measured via BIA at baseline. This value was then adjusted by multiplying it with the participant’s physical activity level (PAL), using the midpoint value corresponding to a moderately active lifestyle, ensuring an accurate estimation of total daily energy expenditure [103,104].
The KD was structured to ensure strict carbohydrate restriction, with total daily carbohydrate intake maintained at ≤10% of total energy consumption, not exceeding 50 g per day [51]. In this dietary protocol, carbohydrates were predominantly replaced by healthy fats and high-quality protein sources, while ensuring that the overall caloric intake remained isocaloric. The classic 4:1 ketogenic ratio (fat to protein plus carbohydrates) was followed, with macronutrient distribution adjusted to accommodate individual energy requirements. Specifically, fat intake accounted for approximately 60% of total daily energy intake, while protein contributed 30%, with individual variations permitted as long as carbohydrate intake remained at or below 50 g per day [105,106].
TRE protocol was structured around a defined eating window ranging from 4 to 10 hours, varying according to individual adherence capabilities and metabolic response [58]. Unlike the KD intervention, TRE did not impose explicit caloric restrictions or macronutrient distribution constraints. Instead, participants were allowed ad libitum food consumption within their designated eating window while maintaining compliance with the fasting protocol during the remaining 14 to 20 hours. Throughout the fasting phase, participants were instructed to maintain adequate hydration levels and were permitted to consume non-caloric fluids, such as water, herbal teas, and black coffee. To ensure adherence and dietary compliance, all meals consumed during the intervention were monitored daily by a certified nutritionist via an online tracking platform.
2.6. Statistical analysis
In this study, a comprehensive statistical analysis was conducted to compare the effects of TRE and KD on cardiovascular risk, as assessed by the QRISK score, alongside other anthropometric, metabolic, and biochemical parameters. The analysis aimed to evaluate baseline differences between the dietary groups, assess changes over time, explore correlations between QRISK changes and other variables, and investigate interaction effects of key predictors with diet type on QRISK reduction.
Continuous variables were summarized using medians and interquartile ranges (IQRs), while categorical variables were summarized using counts and percentages. The Mann-Whitney U test was employed to compare continuous variables between the IF and KD groups, as the non-normal distribution of most variables was confirmed using the Shapiro-Wilk test. Rank-biserial correlation () was calculated to estimate the effect sizes. Categorical variables were compared between groups using the Pearson Chi-Squared test. To evaluate longitudinal changes in variables measured at both the start and end of the study, the Wilcoxon signed-rank test was used, stratified by diet type. This approach provided insight into within-group changes over time. Spearman's rank correlation analysis was conducted to examine the relationships between Change in QRISK (QRISK end - QRISK start) and other numerical variables within each diet group, allowing for identification of key factors associated with cardiovascular risk reduction.
A multivariate linear regression model was constructed to evaluate predictors of final QRISK scores. Predictors were selected using the backwards elimination method and were included to determine their independent contributions to cardiovascular risk at the end of the study. Estimates, confidence intervals (CI), and p-values were reported for all predictors.
Interaction effects between key predictors and diet type on Change in QRISK were modeled using linear regression. Interaction terms were included to assess whether the relationship between variables such as age, BMI, systolic blood pressure (SBP), fasting glucose, HbA1c, waist-to-hip ratio (WHR), and menopausal status differed based on diet type. Adjusted R² values and p-values were reported to quantify the explanatory power and statistical significance of these models.
All statistical analyses were performed at a significance level of p < 0.05. Visualizations, including interaction plots and scatterplots, were used to illustrate key findings and highlight significant relationships between predictors and outcomes. Data analysis was conducted using R (version 4.3.0) and RStudio (version 2023.06.0+421) to ensure robustness, reproducibility, and clarity of results.
3. Results
3.1. Baseline characteristics of participants across dietary groups
The baseline characteristics of the participants were compared between the TRE and KD groups to ensure that any observed differences in outcomes were not confounded by pre-existing disparities. Mann-Whitney U tests were employed to assess statistical differences between the two dietary interventions, while rank-biserial correlation () was used to estimate effect size. Age distribution was similar between the two groups, with no significant difference observed (p=0.79, = -0.05). However, BMI was significantly lower in the IF group compared to the KD group (p=0.02, = -0.41), suggesting that participants in the KD group had a higher baseline BMI. Similarly, WC levels were significantly lower in the IF group than in the KD group (p = 0.04, = -0.35), as was the WHR (p=0.04, = -0.34), indicating a potential difference in body composition between the two groups.
Lipid profile parameters, including TC, HDL-C, TC/HDL-C ratio, non-HDL cholesterol, LDL-C, and triglycerides, did not show significant baseline differences between the dietary groups (all p-values > 0.05), indicating a comparable cardiovascular risk profile at the start of the study. Similarly, systolic blood pressure (SBP) was not significantly different (p=0.79, = -0.05), further supporting the homogeneity of cardiovascular risk factors between groups. Importantly, the primary risk assessment tool in this study, QRISK, showed no significant difference between the IF and KD groups at baseline (p=0.70, = 0.07). Likewise, relative risk scores were comparable (p=0.62, = 0.09), confirming that cardiovascular risk, as estimated by QRISK, was similar between participants regardless of dietary assignment.
Markers of glucose metabolism, including fasting glucose (p=0.48, = -0.12), HbA1c (p=0.62, = -0.09), and HOMA-IR (p=0.14, = -0.25), did not significantly differ at baseline, indicating that insulin sensitivity and glycemic control were not substantially different prior to dietary intervention. Similarly, serum creatinine and uric acid levels were comparable (p=0.41 and p = 0.16, respectively).
Lastly, vitamin D levels, while slightly higher in the TRE group, did not reach statistical significance (p=0.14, = 0.25), suggesting that baseline vitamin D status was relatively similar between the dietary groups. The results are presented in Table 1.
The baseline categorical characteristics of the study participants were analyzed using the Pearson Chi-square test to determine whether there were significant differences between the TRE and KD groups. The results indicate that most categorical variables were evenly distributed between the two dietary interventions, suggesting comparable baseline conditions. Gender distribution was similar in both groups, with females representing the majority of participants in both TRE (65.38%) and KD (69.57%) groups (p = 0.76). Similarly, the proportion of smokers did not differ significantly between the two groups (p = 0.79), nor did the proportion of sedentary individuals (p = 0.79) or those experiencing sleep deficits (p = 0.42). The prevalence of menopause was also comparable (p = 0.67), suggesting that hormonal differences were unlikely to confound the results. Regarding cardiovascular risk factors, family history of cardiovascular disease (FMH CV) was more prevalent in the TRE group (53.85%) than in the KD group (30.43%), though this difference did not reach statistical significance (p = 0.10). The presence of lupus erythematosus (LES) and erectile dysfunction (ED) was not significantly different between groups (p = 0.52 and p = 0.29, respectively). The presence of atrial fibrillation (AF) was rare in both groups, with only one case in the IF group and none in the KD group (p = 0.34). The results are summarized in Table 2.
3.2. Post-Intervention Outcomes and Comparative Analysis Between Diets
The study measurements at the end of the intervention were compared between the TRE and KD groups using the Mann-Whitney U test, with rank-biserial correlation () used to estimate effect size. The results indicate that while several metabolic parameters remained comparable between the two dietary approaches, notable differences emerged in key cardiovascular and glycemic risk markers. BMI showed no significant difference between the IF and KD groups at the end of the study (p=0.57, = -0.10), suggesting that both dietary interventions resulted in similar weight management outcomes. WC and WHR also remained statistically indistinguishable between groups (p = 0.88 and p = 0.55, respectively), indicating comparable effects on bone mineral status and body fat distribution. SBP showed a trend toward lower values in the KD group compared to the TRE group (p=0.10, = 0.28), though this did not reach statistical significance. TC also showed a trend toward reduction in the KD group (p=0.07, = 0.30). However, a significant difference was observed in the HDL cholesterol (HDL-C) levels, which were higher in the KD group compared to the TRE group (p=0.05, = -0.33), suggesting a potentially favorable lipid profile shift associated with the ketogenic diet. Furthermore, the TC/HDL-C ratio was significantly lower in the KD group (p=0.02, = 0.41), reinforcing a possible cardioprotective effect of this dietary approach. Regarding glycemic control, HbA1c levels did not differ significantly between the two groups at the end of the study (p=0.13, = 0.25). While there was a trend toward lower HbA1c in the KD group, the difference was not statistically robust, implying that both dietary strategies had comparable impacts on long-term glucose regulation.
Importantly, QRISK scores showed a trend toward lower cardiovascular risk in the KD group compared to the TRE group (p=0.06, = 0.32). Relative risk, another key indicator of cardiovascular outcomes, was significantly lower in the KD group (p=0.04, = 0.34), suggesting a potential advantage of the ketogenic diet in modifying long-term cardiovascular risk. The results are presented in Table 3 and Figure 1.
3.3. Longitudinal Analysis of Health Markers Within Dietary Groups
The longitudinal analysis was conducted using the Wilcoxon signed-rank test to assess within-group changes for each variable measured at the start and end of the study, stratified by dietary group. The results revealed significant changes across most variables in both the TRE and KD groups, underscoring the impact of each dietary intervention on various health markers. In terms of BMI, both diets resulted in significant reductions (TRE: p < 0.001, KD: p < 0.001), reflecting effective weight management in both groups. Similarly, WC levels decreased significantly in both groups (TRE: p < 0.001, KD: p < 0.001), though the clinical relevance of this decline warrants further exploration. WHR showed a modest but significant reduction in both groups (TRE: p < 0.001, KD: p < 0.001), indicating improved body fat distribution. Lipid profile changes differed between groups. TC decreased significantly in both groups (TRE: p < 0.001, KD: p < 0.001), but HDL-C improved only in the KD group (p < 0.001), with no significant change in the TRE group (p = 0.30). The TC/HDL-C ratio, a critical cardiovascular risk marker, remained stable in the TRE group (p = 0.74) but decreased significantly in the KD group (p < 0.001), indicating a potential cardiovascular benefit of the ketogenic diet. SBP remained unchanged in the TRE group (p = 0.002) but improved significantly in the KD group (p < 0.001), suggesting better blood pressure control with the ketogenic diet. QRISK scores, reflecting estimated cardiovascular risk, declined significantly in both groups (TRE: p = 0.05, KD: p < 0.001), with a more pronounced reduction in the KD group. Relative risk scores showed a significant decline in both groups (TRE: p < 0.001, KD: p < 0.001), further emphasizing improvements in cardiovascular risk profiles. Glycemic control, as assessed by HbA1c, improved modestly but significantly in the TRE group (p = 0.001) and more markedly in the KD group (p < 0.001), suggesting enhanced glucose regulation, particularly with the ketogenic diet. The results are presented in Table 4.
3.4. Correlations between change in QRISK and health markers stratified by diet type
The change in QRISK variable, calculated as the difference between the QRISK score at the end of the study and its baseline measurement (QRISK end - QRISK start), represents the degree of cardiovascular risk modification over the course of the study. A negative value indicates a reduction in cardiovascular risk, while a positive value indicates an increase. Evaluating the relationship between Change in QRISK and other numerical variables provides insights into which factors are most strongly associated with changes in cardiovascular risk during the intervention.
For participants in TRE group, Spearman's rank correlation analysis revealed a statistically significant negative correlation between Change in QRISK and SBP ( = -0.435, p = 0.02). This indicates that reductions in SBP were associated with greater decreases in QRISK scores, suggesting that blood pressure improvements contributed meaningfully to the reduction in cardiovascular risk among individuals following the TRE program. The results are presented in Table 5.
The relationship between change in QRISK and numerical variables was also examined in the KD group using Spearman's rank correlation. Notably, the KD group exhibited a broader range of significant correlations compared to the TRE group, highlighting the multidimensional impact of this dietary intervention on cardiovascular risk factors. In the KD group, change in QRISK was significantly negatively correlated with several variables. BMI showed the strongest correlation ( = -0.806, p < 0.001), indicating that greater reductions in BMI were closely associated with larger decreases in QRISK scores. Similarly, calcium levels ( = -0.588, p = 0.003), SBP ( = -0.630, p = 0.001), and WHR ( = -0.468, p = 0.02) were all significantly associated with changes in QRISK, suggesting that improvements in body composition and blood pressure were pivotal in reducing cardiovascular risk. Lipid profile parameters, including TC ( = -0.431, p = 0.04), non-HDL cholesterol ( = -0.448, p = 0.03), and triglycerides ( = -0.451, p = 0.03), were also significantly correlated with Change in QRISK. These findings underscore the importance of lipid optimization in mitigating cardiovascular risk in the KD group. Furthermore, glycemic control, as reflected by HbA1c ( = -0.469, p = 0.02), was significantly associated with change in QRISK, indicating that better glucose regulation contributed to cardiovascular risk reduction. Interestingly, age also showed a significant negative correlation with change in QRISK ( = -0.490, p = 0.01), suggesting that older participants experienced more pronounced reductions in cardiovascular risk with the ketogenic diet. The results are shown in Table 6 and Figure 2.
3.5. Predictors of final cardiovascular risk
In this analysis, a linear regression model was constructed to identify the factors influencing QRISK scores at the end of the study. QRISK at the end of the study was used as the response variable, and various predictors, including baseline characteristics and dietary intervention, were included to determine their contributions to cardiovascular risk. This model allows us to quantify the relative influence of these factors and provides a clearer understanding of what drives changes in QRISK. The model showed excellent explanatory power (adjusted R² = 0.975), indicating that the predictors explained 97.5% of the variance in final QRISK scores.
Several predictors emerged as significant. Atrial fibrillation (AF) was associated with a higher QRISK at the end of the study (Estimate = 6.11, 95% CI: 0.05 to 12.17, p = 0.048), reflecting its role as a major cardiovascular risk factor. Initial BMI showed a strong inverse association with final QRISK (Estimate = -0.46, 95% CI: -0.62 to -0.30, p < 0.001), suggesting that participants with higher BMI at baseline experienced larger reductions in cardiovascular risk during the study. Similarly, baseline total cholesterol (Estimate = -0.02, 95% CI: -0.04 to -0.00, p = 0.025) and serum creatinine (Estimate = -9.03, 95% CI: -16.23 to -1.82, p = 0.015) were inversely associated with final QRISK scores, indicating that lower levels of these markers at baseline may contribute to improved cardiovascular outcomes.
Baseline QRISK itself was the strongest predictor of final QRISK (Estimate = 0.91, 95% CI: 0.85 to 0.97, p < 0.001), demonstrating that higher initial cardiovascular risk strongly influences outcomes. Additionally, fasting glucose levels were positively associated with final QRISK (Estimate = 0.04, 95% CI: 0.01 to 0.08, p = 0.015), underscoring the importance of glycemic control in reducing cardiovascular risk. Dietary intervention type also played a significant role. Participants following the ketogenic diet had significantly lower QRISK scores compared to those on TRE (Estimate = -4.98, 95% CI: -6.71 to -3.24, p < 0.001). This finding highlights the potential superiority of the ketogenic diet in reducing cardiovascular risk, as it contributed independently to lower QRISK scores even after adjusting for other variables. The results are summarized in Table 7.
3.6. Exploring interaction effects between predictors and diet type on cardiovascular Risk reduction
In the final phase of the analysis, we explored the interaction effects between dietary intervention type and various predictors on the change in QRISK. By modeling interactions using linear regression, we aimed to determine whether the relationship between key variables and change in QRISK differed depending on the diet followed (TRE or KD). This approach provides deeper insights into how specific factors influence cardiovascular risk reduction within the context of each dietary intervention.
The first interaction analysis examined the relationship between age, diet type, and change in QRISK. The model demonstrated moderate explanatory power (adjusted R² = 0.495) and revealed a significant interaction effect between age and diet type (Estimate = -0.27, 95% CI: -0.47 to -0.06, p = 0.011). This suggests that the effect of age on change in QRISK varied depending on the diet followed. For participants in the KD group, the negative interaction term indicates that older age was associated with a more pronounced reduction in QRISK compared to the TRE group. Neither age alone (p = 0.680) nor diet type independently (p = 0.300) showed significant effects on Change in QRISK, but their interaction underscores the importance of considering age in the context of dietary interventions. These results presented in Table 8 suggest that the KD may be particularly beneficial in reducing cardiovascular risk for older individuals, highlighting the potential for tailoring dietary strategies based on age to optimize cardiovascular health outcomes.
The interaction analysis for SBP and diet type on change in QRISK revealed significant findings. The model exhibited moderate explanatory power (adjusted R² = 0.549), with a significant interaction effect between SBP and diet type (Estimate = -0.17, 95% CI: -0.28 to -0.06, p = 0.002). This indicates that the relationship between SBP and Change in QRISK was influenced by the diet followed. For participants in the KD group, the significant negative interaction term suggests that higher SBP was associated with greater reductions in QRISK compared to the TRE group. While SBP alone (p = 0.628) was not sufficient to explain the observed changes in QRISK, the interaction with the diet highlights the unique impact of the ketogenic diet in mitigating cardiovascular risk in the presence of elevated SBP. These findings, summarized in Table 9, suggest that the ketogenic diet may provide enhanced benefits for individuals with higher baseline SBP, making it a potentially effective dietary intervention for addressing cardiovascular risk in this population.
The interaction analysis for initial HbA1c levels and diet type on Change in QRISK demonstrated significant results, with the model showing moderate explanatory power (adjusted R² = 0.555). A strong interaction effect was observed between initial HbA1c levels and diet type (Estimate = -4.16, 95% CI: -6.25 to -2.08, p < 0.001), indicating that the effect of HbA1c on Change in QRISK differed substantially between the KD and TRE groups. For participants in the KD group, the negative interaction term suggests that higher initial HbA1c levels were associated with greater reductions in QRISK compared to the TRE group. Neither initial HbA1c levels alone (p = 0.805) nor diet type independently (p = 0.004) were sufficient to explain the observed changes in QRISK, but their interaction highlights the heightened efficacy of the KD diet in individuals with elevated baseline HbA1c. These results indicate that the ketogenic diet may be particularly beneficial in reducing cardiovascular risk for individuals with impaired glycemic control, further supporting its potential role as a targeted intervention for populations at risk of diabetes-related cardiovascular complications. The results are shown in Table 10.
The interaction analysis between initial BMI and diet type on change in QRISK revealed a highly significant effect, with the model showing strong explanatory power (adjusted R² = 0.694). The interaction term between BMI and diet type was highly significant (Estimate = -0.73, 95% CI: -1.05 to -0.42, p < 0.001), indicating that the relationship between BMI and change in QRISK varied substantially depending on the diet followed. In the KD group, higher baseline BMI was associated with significantly greater reductions in QRISK compared to the TRE group, as illustrated by the steep negative slope in the Figure 3. While BMI alone (p = 0.764) did not significantly affect QRISK change, the interaction with diet type emphasizes the effectiveness of the KD diet in reducing cardiovascular risk in participants with higher BMI values. This finding aligns with the greater impact of the ketogenic diet on weight management and metabolic health observed in previous analyses.cThese results, presented in Table 11, highlight the potential of the ketogenic diet as a particularly effective intervention for individuals with elevated BMI, reinforcing its role in addressing cardiovascular risk in populations with obesity.
The interaction analysis between WHR and diet type on change in QRISK demonstrated significant findings, with the model showing moderate explanatory power (adjusted R² = 0.536). The interaction term between WHR and diet type was significant (Estimate = -11.45, 95% CI: -18.62 to -4.28, p = 0.002), indicating that the effect of WHR on change in QRISK differed markedly between the KD and TRE groups. For participants in the KD group, the significant negative interaction suggests that higher baseline WHR was associated with a more substantial reduction in QRISK compared to the TRE group. While WHR alone (p = 0.778) and diet type independently (p = 0.100) did not significantly affect QRISK change, their interaction highlights the ability of the KD diet to mitigate cardiovascular risk, particularly in individuals with higher WHR. The results are presented in Table 12.
The interaction analysis between fasting glucose and diet type on change in QRISK revealed a significant interaction effect, though the overall model demonstrated moderate explanatory power (adjusted R² = 0.406). The interaction term between fasting glucose and diet type was significant (Estimate = -0.12, 95% CI: -0.22 to -0.02, p = 0.021), indicating that the relationship between fasting glucose and Change in QRISK varied depending on the diet followed.
For participants in the KD group, higher baseline fasting glucose was associated with greater reductions in QRISK compared to the TRE group. However, fasting glucose alone (p = 0.863) and diet type independently (p = 0.238) did not show significant effects on QRISK change, emphasizing the importance of the interaction between these factors. These findings suggest that the KD diet may be particularly effective in reducing cardiovascular risk in individuals with higher fasting glucose levels, supporting its potential benefits in populations with impaired glucose metabolism or prediabetes. The results are shown in Table 13.
The interaction analysis between menopausal status and diet type on change in QRISK revealed a significant interaction effect, with the model showing moderate explanatory power (adjusted R² = 0.506). The interaction term between menopausal status and diet type was significant (Estimate = -7.38, 95% CI: -12.35 to -2.41, p = 0.005), indicating that the impact of menopause on change in QRISK varied depending on the diet followed. For participants in the KD group, being postmenopausal was associated with significantly greater reductions in QRISK compared to the TRE group. Neither menopausal status alone (p = 0.711) nor diet type independently (p = 0.001) explained the observed change in QRISK, highlighting the importance of their interaction. These results summarized in Table 14 suggest that the KD diet may be particularly effective in reducing cardiovascular risk in postmenopausal women, further emphasizing the potential of tailored dietary interventions to address cardiovascular health in specific subpopulations.
4. Discussion
Obesity represents a major global public health concern, affecting more than 650 million adults worldwide. Over the past five decades, its prevalence has increased at an alarming rate, leading to a substantial rise in obesity-related comorbidities and placing a significant burden on healthcare systems [107,108]. The interplay between dietary patterns, lifestyle behaviors, psychological and emotional determinants, and genetic predisposition plays a fundamental role in shaping an individual's nutritional status. These multifactorial influences regulate the distribution of adipose and lean tissue mass, ultimately affecting overall body composition. Understanding these complex interactions is essential for optimizing dietary interventions aimed at effective weight management and metabolic health improvement.
Obesity is a well-established risk factor for cardiovascular diseases, contributing to a cascade of metabolic, inflammatory, and hemodynamic alterations that increase morbidity and mortality [109]. Excess adipose tissue, particularly visceral adiposity, leads to a chronic pro-inflammatory state through the release of adipokines such as leptin, resistin, and tumor necrosis factor-alpha (TNF-α), which promote endothelial dysfunction, oxidative stress, and vascular remodeling [110]. Simultaneously, reduced levels of adiponectin, an anti-inflammatory and vasoprotective cytokine, contribute to insulin resistance and impaired lipid metabolism, accelerating atherogenesis [111]. The accumulation of lipids within arterial walls, driven by dyslipidemia associated with obesity, exacerbates atherosclerosis, leading to plaque formation and increasing the risk of coronary artery disease and stroke [112]. Additionally, obesity is strongly linked to hypertension, which arises due to multiple mechanisms, including increased sympathetic nervous system activity, activation of the renin-angiotensin-aldosterone system and impaired natriuresis, all of which contribute to elevated blood pressure and subsequent cardiac overload [113]. Cardiac structural changes are also prominent in obesity-related CVD. Increased left ventricular mass and wall thickness occur as a compensatory mechanism against volume overload and elevated cardiac output, leading to left ventricular hypertrophy and eventually heart failure with preserved ejection fraction [114]. Additionally, pericardial fat deposition contributes to myocardial fibrosis and impairs diastolic function, further predisposing individuals to heart failure [115]. Obesity is also associated with arrhythmias, particularly atrial fibrillation, due to atrial dilation, increased epicardial fat deposition, and heightened autonomic dysfunction [116]. Moreover, obstructive sleep apnea, a frequent comorbidity in obese individuals, exacerbates cardiovascular risk through intermittent hypoxia, oxidative stress, and sympathetic overactivation, leading to sustained hypertension and increased cardiac workload [117]. Furthermore, insulin resistance and hyperglycemia, common in obesity, accelerate endothelial dysfunction and impair vasodilation through reduced nitric oxide bioavailability and increased production of reactive oxygen species, promoting vascular stiffness and microvascular complications [118]. These interconnected pathophysiological mechanisms highlight the complexity of obesity-induced cardiovascular complications and emphasize the urgent need for weight management strategies to mitigate CVD risk.
Given the strong link between obesity and cardiovascular disease, early risk stratification is crucial for timely intervention. The QRISK3 score is a well-validated cardiovascular risk prediction tool that provides an advanced assessment of an individual's likelihood of developing CVD over the next ten years [119]. Unlike previous iterations, QRISK3 incorporates additional risk factors that are particularly relevant to obese individuals, including chronic kidney disease, severe mental illness, corticosteroid use, systemic lupus erythematosus, and, notably, BMI ≥ 30 kg/m² [120]. The inclusion of obesity as a weighted risk factor acknowledges its independent contribution to atherosclerosis, hypertension, and cardiac dysfunction, making QRISK3 a superior tool for identifying high-risk individuals who may otherwise be overlooked [121]. One of the key advantages of QRISK3 in obese populations is its ability to refine risk prediction beyond traditional models such as Framingham or QRISK2, which primarily focused on conventional risk factors like hypertension, cholesterol levels, smoking, and diabetes [122]. Obesity, particularly central adiposity, has been shown to accelerate cardiovascular aging by inducing metabolic disturbances, systemic inflammation, and vascular dysfunction, making its inclusion in risk assessment models essential [123]. Additionally, QRISK3 accounts for conditions that frequently co-exist with obesity, such as atrial fibrillation and migraines, both of which further elevate cardiovascular risk [124]. The clinical utility of QRISK3 is particularly relevant for guiding preventative interventions in obese individuals. By providing a more accurate estimation of absolute cardiovascular risk, clinicians can better tailor treatment strategies, including lifestyle modifications, lipid-lowering therapy, antihypertensives, and, in some cases, metabolic or bariatric surgery [125]. Furthermore, QRISK3 helps stratify patients who may require more aggressive monitoring or early initiation of pharmacological interventions, such as GLP-1 receptor agonists, which have demonstrated cardioprotective benefits in individuals with obesity-related metabolic syndrome [126]. Given the increasing prevalence of obesity worldwide, integrating QRISK3 into routine clinical practice allows for a more personalized and precise approach to cardiovascular risk assessment. Its ability to capture the multifaceted contributions of obesity to CVD risk ensures that high-risk individuals receive appropriate, early interventions, ultimately reducing cardiovascular morbidity and mortality [127]. Therefore, widespread adoption of QRISK3 in obesity management is essential for improving cardiovascular outcomes and reducing healthcare burdens associated with obesity-related complications [128].
However, dietary therapy remains the cornerstone of long-term obesity management and is prioritized before considering pharmacological or surgical interventions [107]. While multiple factors influence the relationship between dietary intake and weight loss, the quantity, quality, and macronutrient composition of consumed foods, along with meal timing, are critical determinants in effective body weight regulation. These elements play a fundamental role in modulating metabolic responses and ensuring sustained weight loss outcomes. The search for optimal dietary strategies for weight management has been an area of extensive research, sparking ongoing debate among scientists, nutrition specialists, healthcare professionals, and the general public [129,130]. Despite the complexity of dietary influences, the creation of an energy deficit remains the primary driver of successful weight reduction [131]. The U.S. Guidelines for the Management of Overweight and obesity in Adults emphasize that a caloric intake of 1.200 to 1.500 kcal per day is recommended for women as an effective strategy for obesity prevention and treatment [132].
TRE and the KD are both dietary strategies that influence metabolism and cardiovascular health, yet they operate through distinct mechanisms. TRE, which limits food intake to a specific time window without altering macronutrient composition, has been shown to improve insulin sensitivity, reduce inflammation, and lower blood pressure. The KD has shown mixed effects on cardiovascular health. While studies indicate benefits such as reduced triglycerides, improved insulin sensitivity, and weight loss, concerns persist regarding increased LDL-C, which may elevate CVD risk [133]. A meta-analysis found that very low-carbohydrate ketogenic diets VLCKD improved lipid profiles but highlighted the need for long-term safety data [134]. Given these findings, KD may offer short-term metabolic advantages, but its long-term impact on cardiovascular health remains uncertain. The findings of our study indicate that while both TRE and ketogenic diet KD interventions resulted in comparable weight management outcomes, notable differences emerged in cardiovascular and lipid parameters. The observed elevation in HDL-C levels and a lower TC/HDL-C ratio in the KD group suggest a potentially favorable impact on lipid metabolism, which may confer cardioprotective benefits. Additionally, the significant reduction in relative cardiovascular risk in the KD group highlights the potential of this dietary approach in long-term cardiovascular health.
Despite these promising findings, the lack of significant differences in glycemic control parameters suggests that both dietary strategies exert comparable effects on glucose metabolism. The trend toward improved QRISK scores and SBP reduction in the KD group warrants further investigation to confirm potential long-term benefits. Given the study's limitations, including sample size and intervention duration, future research should explore the mechanistic underpinnings and clinical implications of these dietary interventions in larger, more diverse populations. Previous studies have demonstrated the impact of both ketogenic diets and time-restricted eating on cardiometabolic parameters. For instance, a six-week ketogenic diet intervention significantly reduced serum triglycerides and increased HDL-C levels in normal-weight males [135]. Similarly, a 12-week TRE regimen led to weight loss, improved body composition, and reduced blood pressure in individuals with metabolic syndrome [136]. These findings align with the present study, reinforcing that while both dietary interventions contribute to weight management, the ketogenic diet may provide additional advantages in enhancing lipid profiles and mitigating cardiovascular risk.
Conversely, while TRE has been associated with modest weight loss and reductions in blood pressure and triglyceride levels, recent studies have raised concerns about its long-term cardiovascular safety. An analysis of over 20,000 adults found that an 8-hour TRE schedule was linked to a 91% higher risk of cardiovascular mortality compared to a 12-16 hour eating window [137]. These findings suggest that, although TRE may offer short-term metabolic benefits, KD might provide more substantial improvements in lipid metabolism and cardiovascular risk reduction.
Regarding glycemic control, our study found no significant differences between the two dietary interventions, indicating comparable effects on glucose metabolism. This is consistent with previous research demonstrating that both KD and TRE can improve glycemic parameters, though the extent and sustainability of these effects may vary [138].
In summary, while both TRE and KD are effective for weight management, the KD appears to offer additional advantages in enhancing lipid profiles and reducing cardiovascular risk. However, the potential long-term risks associated with TRE necessitate further investigation. Future studies should aim to elucidate the mechanisms underlying these effects and assess the clinical implications of these dietary interventions in diverse populations.
Our study's interaction analysis between baseline BMI and dietary intervention on changes in QRISK scores indicates that the KD may offer enhanced cardiovascular benefits for individuals with elevated BMI. This finding aligns with existing literature demonstrating that low-carbohydrate ketogenic diets effectively improve cardiovascular risk factors, including reductions in BMI, weight, and waist circumference, particularly in overweight or obese patients with type 2 diabetes [139]. In contrast, while TRE has been associated with modest weight loss and improvements in metabolic health, its long-term cardiovascular benefits remain uncertain. Some studies have even suggested potential risks; for instance, an analysis indicated that an 8-hour TRE schedule was linked to a 91% higher risk of cardiovascular mortality compared to a 12-16 hour eating window [140]. These findings suggest that while both dietary interventions can aid in weight management and metabolic health, KD may offer superior benefits in reducing cardiovascular risk, especially for individuals with higher baseline BMI. The significant interaction effect observed in our study underscores the importance of personalized dietary strategies in managing cardiovascular risk among populations with obesity. Furthermore, our analysis of the interaction between WHR and diet type on QRISK changes revealed that higher baseline WHR was associated with more substantial reductions in QRISK for participants following the KD compared to those on TRE. This suggests that KD may be particularly effective in mitigating cardiovascular risk factors related to central adiposity. While TRE has shown benefits in reducing visceral fat and improving metabolic syndrome parameters, its impact on cardiovascular risk in individuals with higher WHR appears less pronounced than that of KD [141].
The present research demonstrates a significant interaction between baseline HbA1c levels and dietary intervention on changes in QRISK scores, emphasizing the potential advantages of the KD for individuals with impaired glycemic control. This research aligns with existing literature indicating that KD significantly lowers HbA1c and fasting plasma glucose in individuals with type 2 diabetes, contributing to reduced cardiovascular risk [142]. Given that each 1% reduction in HbA1c is associated with a 14% decrease in myocardial infarction risk [143], our findings highlight the relevance of KD as a targeted intervention for this population. While TRE has been shown to modestly improve glycemic control [144], its long-term cardiovascular benefits remain uncertain. Some studies suggest a potential increased risk associated with prolonged fasting periods, including a higher incidence of cardiovascular mortality [145]. Our research supports the notion that while both dietary approaches aid in metabolic health, KD may offer superior cardiovascular protection, particularly in individuals with elevated baseline HbA1c levels.
The findings of this study emphasize the importance of personalized dietary interventions in mitigating cardiovascular risk, particularly for populations at high metabolic risk. Future research should explore the sustainability of these dietary approaches and their long-term effects on cardiovascular health.
Moreover, our research highlights a significant interaction between menopausal status and dietary intervention on changes in QRISK scores, suggesting that the KD may be particularly beneficial for postmenopausal women in reducing cardiovascular risk. This aligns with prior research indicating that very low-calorie ketogenic diets can lead to significant improvements in central blood pressure and cardiometabolic health in postmenopausal women with obesity and hypertension [146]. On the other hand, while TRE has demonstrated some benefits in weight management and metabolic health, its long-term effects on cardiovascular outcomes remain less clear. Some investigations suggest possible risks, such as a higher cardiovascular mortality rate associated with an 8-hour eating window compared to a longer fasting period [147]. These findings indicate that although both KD and TRE may offer metabolic advantages, KD appears to provide a more pronounced reduction in cardiovascular risk, especially in postmenopausal individuals. Future research should aim to further explore the mechanisms by which dietary strategies influence cardiovascular health in this population and assess the long-term sustainability of these approaches.
This research reinforces the notion that dietary interventions play a crucial role in modulating cardiovascular risk, particularly in populations with specific metabolic vulnerabilities. The observed interactions between dietary strategies and key risk factors, such as BMI, WHR, and menopausal status, suggest that tailored nutritional approaches can yield significant cardiometabolic benefits. Given the growing evidence supporting the efficacy of the KD in improving lipid profiles and enhancing metabolic efficiency, its application in clinical practice warrants further consideration. Additionally, these findings highlight the need for comparative studies evaluating different dietary strategies to determine their long-term impact on cardiovascular health and overall mortality. Despite its valuable findings, our study has several limitations. First, the sample size was relatively small, which may limit the generalizability of the results to broader populations. Larger-scale studies with diverse cohorts are necessary to validate our findings. Second, the duration of the intervention was limited, and long-term adherence to dietary interventions and their sustained effects on cardiovascular risk were not assessed. Future studies should include extended follow-up periods to evaluate the durability of these effects. Self-reported dietary intake and compliance could introduce measurement biases. Lastly, while the study accounted for key metabolic and cardiovascular markers, other confounding variables, including genetic predisposition were not extensively analyzed. Addressing these factors in future research could provide a more comprehensive understanding of dietary interventions on cardiovascular health.
5. Conclusions
This study highlights the superior effectiveness of the KD compared to TRE in improving body composition and reducing cardiovascular risk. While both dietary interventions led to significant weight loss and reductions in waist circumference, the ketogenic diet demonstrated greater benefits in lipid profile optimization, glycemic control, and blood pressure regulation. The stronger reduction in QRISK observed in the KD group suggests that it is a more potent strategy for cardiovascular risk modification, particularly in individuals with obesity, metabolic dysfunction, and postmenopausal women. Interaction analyses further revealed that the beneficial effects of KD were amplified in those with higher baseline BMI, fasting glucose, and cardiovascular risk markers. These findings emphasize the ketogenic diet as a more effective intervention for metabolic and cardiovascular health. Given its superior impact, future research should focus on optimizing its implementation, long-term sustainability, and clinical applicability for high-risk populations.
Author Contributions
Conceptualization, D.P. and D.S.; methodology, D.P and S.M; software, S.M.; validation, D.S., D.P. and A.B.; formal analysis, A.B.; investigation, D.P.; resources, D.S.; data curation, D.P.; writing—original draft preparation, D.P.; writing—review and editing, D.P.; visualization, D.S.; supervision, S.M. All authors have read and agreed to the published version of the manuscript.
Funding
We would like to acknowledge VICTOR BABES UNIVERSITY OF MEDICINE AND PHARMACY TIMIȘOARA for their support in covering the costs of publication for this research paper.
Institutional Review Board Statement
The research was conducted in compliance with the ethical principles outlined in the Helsinki Declaration and received formal approval from the Scientific Research Ethics Committee (CECS) of the “Victor Babeș” University of Medicine and Pharmacy Timișoara (Approval No. 69/03.10.2022).
Informed Consent Statement
Informed consent was obtained from all subjects involved in the study.
Acknowledgments
We would like to acknowledge VICTOR BABES UNIVERSITY OF MEDICINE AND PHARMACY TIMIȘOARA for their support in covering the costs of publication for this research paper.
Conflicts of Interest
The authors declare no conflicts of interest.
Abbreviations
The following abbreviations are used in this manuscript:
BMI Body Mass Index; WHR – Waist-to-Hip Ratio; TC – Total Cholesterol (mg/dL); HDL-C – High-Density Lipoprotein Cholesterol (mg/dL); TC/HDL-C – Total Cholesterol to High-Density Lipoprotein Ratio; SBP – Systolic Blood Pressure (mmHg); QRISK – Cardiovascular Risk Score (%); Relative Risk – Relative cardiovascular risk score; Non-HDL-C – Non-High-Density Lipoprotein Cholesterol (mg/dL); LDL-C – Low-Density Lipoprotein Cholesterol (mg/dL); Triglycerides – Serum triglycerides (mg/dL); Uric Acid – Serum uric acid level (mg/dL); Serum Creatinine – Serum creatinine level (mg/dL); Fasting Glucose – Fasting blood glucose level (mg/dL); HbA1c – Hemoglobin A1c (%); HOMA-IR – Homeostatic Model Assessment of Insulin Resistance; Vitamin D – Serum vitamin D level (ng/mL); TRE- Time-Restricted Eating; KD – Ketogenic Diet; WC – Waist Circumferance
References
- Wang Y, Lim H. The global childhood obesity epidemic and the association between socio-economic status and childhood obesity. Int Rev Psychiatry. 2022;34(5):502-516. [CrossRef]
- Baumeister SE, Leitzmann MF. Sedentary behavior and the risk of obesity and type 2 diabetes. Diabetol Metab Syndr. 2020;12:13. [CrossRef]
- NCD Risk Factor Collaboration (NCD-RisC). Rising trends in obesity across the globe: analysis and strategies. Lancet. 2022;400(10356):1345-1355. [CrossRef]
- Swinburn BA, Kraak VI, Allender S, et al. The Global Syndemic of Obesity, Undernutrition, and Climate Change: The Lancet Commission report. Lancet. 2019;393(10173):791-846. [CrossRef]
- World Obesity Federation. World Obesity Atlas 2022. London: World Obesity Federation; 2022. Available at: https://www.worldobesity.org/resources/resource-library/world-obesity-atlas-2022. Accessed January 27, 2025.
- Stewart, C. Obesity in Europe [Internet]. Statista; Available from: https://www.statista.com/topics/9419/obesity-in-europe/.
- Hubert HB, Feinleib M, McNamara PM, Castelli WP. Obesity as an independent risk factor for cardiovascular disease: a 26-year follow-up of participants in the Framingham Heart Study. Circulation. 1983;67:968-77.
- Kusminski CM, Perez-Tilve D, Müller TD, DiMarchi RD, Tschöp MH, Scherer PE. Transforming obesity: The advancement of multi-receptor drugs. Cell. 2024;187(15):3829-3853. [CrossRef] [PubMed] [PubMed Central]
- Bruning JC, Fenselau H. Integrative neurocircuits that control metabolism and food intake. Science. 2023;381:eabl7398. [CrossRef]
- Müller TD, Blüher M, Tschöp MH, DiMarchi RD. Anti-obesity drug discovery: advances and challenges. Nat Rev Drug Discov. 2022;21(3):201-223. [CrossRef] [PubMed] [PubMed Central]
- Woolf EK, Cabre HE, Niclou AN, et al. Body Weight Regulation. [Updated 2024 Jun 13]. In: Feingold KR, Anawalt B, Blackman MR, et al., editors. Endotext [Internet]. South Dartmouth (MA): MDText.com, Inc.; 2000-. Available from: https://www.ncbi.nlm.nih.gov/books/NBK278932/.
- Busetto L, Dicker D, Frühbeck G, et al. A new framework for the diagnosis, staging, and management of obesity in adults. Nat Med. 2024. [CrossRef]
- Wadden TA, Tronieri JS, Butryn ML. Lifestyle modification approaches for the treatment of obesity in adults. Am Psychol. 2020;75(2):235-251.
- Aragon AA, Schoenfeld BJ, Wildman R, Kleiner S, VanDusseldorp T, Taylor L, et al. International society of sports nutrition position stand: diets and body composition. J Int Soc Sports Nutr. 2017;14:16. [CrossRef] [PubMed] [PubMed Central]
- Brehm BJ, Seeley RJ, Daniels SR, D’Alessio DA. A randomized trial comparing a very low carbohydrate diet and a calorie-restricted low fat diet on body weight and cardiovascular risk factors in healthy women. J Clin Endocrinol Metab. 2003;88(4):1617-1623.
- Muscogiuri G, El Ghoch M, Colao A, Hassapidou M, Yumuk V, Busetto L; Obesity Management Task Force (OMTF) of the European Association for the Study of Obesity (EASO). European guidelines for obesity management in adults with a very low-calorie ketogenic diet: a systematic review and meta-analysis. Obes Facts. 2021;14(2):222-245. [CrossRef] [PubMed] [PubMed Central]
- Estruch R, Ros E, Salas-Salvadó J, et al. Primary prevention of cardiovascular disease with a Mediterranean diet. N Engl J Med. 2018;378(25):e34. [CrossRef]
- Lichtenstein AH, Appel LJ, Vadiveloo M, et al. 2021 Dietary Guidance to Improve Cardiovascular Health: A Scientific Statement From the American Heart Association. Circulation. 2021;144(23):e472-e487. [CrossRef]
- Sofi F, Abbate R, Gensini GF, Casini A. Accruing evidence on benefits of adherence to the Mediterranean diet on health: an updated systematic review and meta-analysis. Am J Clin Nutr. 2018;92(5):1189-1196. [CrossRef]
- Tosti V, Bertozzi B, Fontana L. Health benefits of the Mediterranean diet: metabolic and molecular mechanisms. J Gerontol A Biol Sci Med Sci. 2018;73(3):318-326. [CrossRef]
- Sacks FM, Svetkey LP, Vollmer WM, et al. Effects on blood pressure of reduced dietary sodium and the Dietary Approaches to Stop Hypertension (DASH) diet. N Engl J Med. 2018;344(1):3-10. [CrossRef]
- Appel LJ, Moore TJ, Obarzanek E, et al. A clinical trial of the effects of dietary patterns on blood pressure. N Engl J Med. 1997;336(16):1117-1124. [CrossRef]
- Hu T, Mills KT, Yao L, et al. Effects of low-carbohydrate diets versus low-fat diets on metabolic risk factors: a meta-analysis of randomized controlled trials. PLOS ONE. 2019;7(12):e1003117. [CrossRef]
- Bueno NB, de Melo IS, de Oliveira SL, da Rocha Ataide T. Very-low-carbohydrate ketogenic diet v. low-fat diet for long-term weight loss: a meta-analysis of randomised controlled trials. Br J Nutr. 2021;110(7):1178-1187. [CrossRef]
- Satija A, Hu FB. Plant-based diets and cardiovascular health. Trends Cardiovasc Med. 2018;28(7):437-441. [CrossRef]
- Kahleova H, Levin S, Barnard ND. Vegetarian dietary patterns and cardiovascular disease. Prog Cardiovasc Dis. 2021;64:1-8. [CrossRef]
- Willett W, Rockström J, Loken B, et al. Food in the Anthropocene: the EAT–Lancet Commission on healthy diets from sustainable food systems. Lancet. 2019;393(10170):447-492. [CrossRef]
- Antonio J, Peacock CA, Ellerbroek A, Fromhoff B, Silver T. The effects of consuming a high protein diet (4.4 g/kg/d) on body composition in resistance-trained individuals. J Int Soc Sports Nutr. 2014;11:19. [CrossRef]
- Luong TV, Abild CB, Bangshaab M, Gormsen LC, Søndergaard E. Ketogenic Diet and Cardiac Substrate Metabolism. Nutrients. 2022;14(7).
- Kim, JM. Ketogenic diet: Old treatment, new beginning. Clin Neurophysiol Pract. 2017;2:161-2.
- Antonio J, Peacock CA, Ellerbroek A, Fromhoff B, Silver T. The effects of consuming a high protein diet (4.4 g/kg/d) on body composition in resistance-trained individuals. J Int Soc Sports Nutr. 2014;11:19. [CrossRef]
- Lemon, PW. Do athletes need more dietary protein and amino acids?. Int J Sport Nutr. 1995;5(Suppl):S39-S61.
- Lemon PW, Tarnopolsky MA, MacDougall JD, Atkinson SA. Protein requirements and muscle mass/strength changes during intensive training in novice bodybuilders. J Appl Physiol. 1992;73:767-75.
- Lemon PW, Proctor DN. Protein intake and athletic performance. Sports Med. 1991;12:313-25.
- Lemon, PW. Protein and amino acid needs of the strength athlete. Int J Sport Nutr. 1991;1:127-45.
- Lemon, PW. Protein and exercise: update 1987. Med Sci Sports Exerc. 1987;19:S179-S190.
- Wilson J, Wilson GJ. Contemporary issues in protein requirements and consumption for resistance trained athletes. J Int Soc Sports Nutr. 2006;3:7-27.
- Campbell B, Kreider RB, Ziegenfuss T, La Bounty P, Roberts M, Burke D, et al. International Society of Sports Nutrition position stand: protein and exercise. J Int Soc Sports Nutr. 2007;4:8.
- Institute of Medicine. Dietary Reference Intakes for Energy, Carbohydrate, Fiber, Fat, Fatty Acids, Cholesterol, Protein and Amino Acids. Washington, DC: National Academies Press; 2005.
- Westerterp-Plantenga, MS. How are normal, high- or low-protein diets defined?. Br J Nutr. 2007;97:217-8.
- Johnston CS, Tjonn SL, Swan PD. High-protein, low-fat diets are effective for weight loss and favorably alter biomarkers in healthy adults. J Nutr. 2004;134:586-91.
- Westerterp-Plantenga MS, Rolland V, Wilson SA, Westerterp KR. Satiety related to 24 h diet-induced thermogenesis during high protein/carbohydrate vs high fat diets measured in a respiration chamber. Eur J Clin Nutr. 1999;53:495-502.
- Westerterp-Plantenga MS, Lejeune MP, Nijs I, van Ooijen M, Kovacs EM. High protein intake sustains weight maintenance after body weight loss in humans. Int J Obes Relat Metab Disord. 2004;28:57-64.
- Leidy HJ, Carnell NS, Mattes RD, Campbell WW. Higher protein intake preserves lean mass and satiety with weight loss in pre-obese and obese women. Obesity (Silver Spring). 2007;15:421-9.
- Tang M, Armstrong CL, Leidy HJ, Campbell WW. Normal vs high-protein weight loss diets in men: Effects on body composition and indices of metabolic syndrome. Obesity. 2013;21:E204-10.
- Tang M, Leidy HJ, Campbell WW. Regional, but not total, body composition changes in overweight and obese adults consuming a higher protein, energy-restricted diet are sex specific. Nutr Res. 2013;33(8):629-35.
- Paoli, A. Ketogenic diet for obesity: friend or foe? Int J Environ Res Public Health. 2014;11(2):2092-107. [CrossRef]
- Westerterp-Plantenga MS, Nieuwenhuizen A, Tome D, Soenen S, Westerterp KR. Dietary protein, weight loss, and weight maintenance. Annu Rev Nutr. 2009;29:21-41.
- Veldhorst M, Smeets A, Soenen S, Hochstenbach-Waelen A, Hursel R, Diepvens K, et al. Protein-induced satiety: Effects and mechanisms of different proteins. Physiol Behav. 2008;94(2):300-7.
- Gardner CD, Kiazand A, Alhassan S, Kim S, Stafford RS, Balise RR, et al. Comparison of the Atkins, Zone, Ornish, and LEARN diets for change in weight and related risk factors among overweight premenopausal women: the A TO Z Weight Loss Study: a randomized trial. JAMA. 2007;297(9):969-77.
- Oh R, Gilani B, Uppaluri KR. Low-Carbohydrate Diet. [Updated 2023 Aug 17]. In: StatPearls [Internet]. Treasure Island (FL): StatPearls Publishing; 2024 Jan-. Available from: https://www.ncbi.nlm.nih.gov/books/NBK537084/.
- Westman E, Feinman R, Mavropoulos J, Vernon M, Volek J, Wortman J, et al. Low-carbohydrate nutrition and metabolism. Am J Clin Nutr. 2007;86(2):276-84.
- Masood W, Annamaraju P, Khan Suheb MZ, et al. Ketogenic Diet. [Updated 2023 Jun 16]. In: StatPearls [Internet]. Treasure Island (FL): StatPearls Publishing; 2024 Jan-. Available from: https://www.ncbi.nlm.nih.gov/books/NBK499830/.
- O'Neill B, Raggi P. The ketogenic diet: Pros and cons. Atherosclerosis. 2020;292:119-126.
- Ma S, Suzuki K. Keto-Adaptation and Endurance Exercise Capacity, Fatigue Recovery, and Exercise-Induced Muscle and Organ Damage Prevention: A Narrative Review. Sports (Basel). 2019;7(2).
- Oh R, Gilani B, Uppaluri KR. Low-Carbohydrate Diet. [Updated 2023 Aug 17]. In: StatPearls [Internet]. Treasure Island (FL): StatPearls Publishing; 2024 Jan-.
- Broom GM, Shaw IC, Rucklidge JJ. The ketogenic diet as a potential treatment and prevention strategy for Alzheimer's disease. Nutrition. 2019;60:118-21.
- Ezpeleta M, Cienfuegos S, Lin S, Pavlou V, Gabel K, Tussing-Humphreys L, et al. Time-restricted eating: Watching the clock to treat obesity. Cell Metab. 2024;36(2):301-14. [CrossRef]
- Chaix A, Manoogian ENC, Melkani GC, Panda S. Time-restricted eating to prevent and manage chronic metabolic diseases. Annu Rev Nutr. 2019;39:291-315.
- Patikorn C, Roubal K, Veettil SK, Chandran V, Pham T, Lee YY, et al. Intermittent Fasting and Obesity-Related Health Outcomes: An Umbrella Review of Meta-analyses of Randomized Clinical Trials. JAMA Netw Open. 2021;4(12):e2139558. [CrossRef]
- Anton SD, Moehl K, Donahoo WT, Lee SA, Mainous AG, Leeuwenburgh C, et al. Flipping the metabolic switch: understanding and applying the health benefits of fasting. Obesity (Silver Spring). 2018;26(2):254-68.
- Trepanowski JF, Bloomer RJ. The impact of religious fasting on human health. Nutr J. 2010;9(1):57.
- Varady KA, Cienfuegos S, Ezpeleta M, Gabel K. Clinical application of intermittent fasting for weight loss: progress and future directions. Nat Rev Endocrinol. 2022;18:309-21.
- Cienfuegos S, Gabel K, Kalam F, Ezpeleta M, Wiseman E, Pavlou V, et al. Effects of 4- and 6-h time-restricted feeding on weight and cardiometabolic health: a randomized controlled trial in adults with obesity. Cell Metab. 2020;32(3):366-78.
- Gabel K, Hoddy KK, Haggerty N, Song J, Kroeger CM, Trepanowski JF, et al. Effects of 8-hour time restricted feeding on body weight and metabolic disease risk factors in obese adults: a pilot study. Nutr Healthy Aging. 2018;4:345-53.
- Lin S, Cienfuegos S, Ezpeleta M, Gabel K, Pavlou V, Mulas A, et al. Time-restricted eating without calorie counting for weight loss in a racially diverse population: a randomized controlled trial. Ann Intern Med. 2023;176(6):885-95.
- Haganes KL, Silva CP, Eyjólfsdóttir SK, Steen S, Grindberg M, Lydersen S, et al. Time-restricted eating and exercise training improve HbA1c and body composition in women with overweight/obesity: a randomized controlled trial. Cell Metab. 2022;34(10):1457-71.
- Zhang LM, Liu Z, Wang JQ, Li RQ, Ren JY, Gao X, et al. Randomized controlled trial for time-restricted eating in overweight and obese young adults. iScience. 2022;25(8):104870.
- Chow LS, Manoogian ENC, Alvear A, Fleischer JG, Thor H, Dietsche K, et al. Time-restricted eating effects on body composition and metabolic measures in humans who are overweight: a feasibility study. Obesity (Silver Spring). 2020;28(5):860-9.
- Hippisley-Cox J, Coupland C, Brindle P. Development and validation of QRISK3 risk prediction algorithms to estimate future risk of cardiovascular disease: prospective cohort study. BMJ. 2017;357:j2099. [CrossRef]
- National Institute for Health and Care Excellence (NICE). Cardiovascular disease: risk assessment and reduction, including lipid modification. NICE guideline [CG181]. Published July 2014. Updated September 2016. Available from: https://www.nice.org.uk/guidance/cg181. Accessed January 27, 2025.
- Collins GS, Altman DG. An independent external validation and evaluation of QRISK cardiovascular risk prediction: a prospective open cohort study. BMJ. 2009;339:b2584. [CrossRef]
- D’Agostino RB, Vasan RS, Pencina MJ, et al. General cardiovascular risk profile for use in primary care: the Framingham Heart Study. Circulation. 2008;117(6):743-753. [CrossRef]
- Estruch R, Ros E, Salas-Salvadó J, et al. Primary prevention of cardiovascular disease with a Mediterranean diet. N Engl J Med. 2018;378(25):e34. [CrossRef]
- Tosti V, Bertozzi B, Fontana L. Health benefits of the Mediterranean diet: metabolic and molecular mechanisms. J Gerontol A Biol Sci Med Sci. 2018;73(3):318-326. [CrossRef]
- Sofi F, Cesari F, Abbate R, Gensini GF, Casini A. Adherence to Mediterranean diet and health status: meta-analysis. *BMJ*. 2008;337:a1344. [CrossRef]
- Sacks FM, Svetkey LP, Vollmer WM, et al. Effects on blood pressure of reduced dietary sodium and the Dietary Approaches to Stop Hypertension (DASH) diet. N Engl J Med. 2001;344(1):3-10. [CrossRef]
- Satija A, Bhupathiraju SN, Spiegelman D, et al. Healthful and unhealthful plant-based diets and the risk of coronary heart disease in U.S. adults. J Am Coll Cardiol. 2017;70(4):411-422. [CrossRef]
- Kahleova H, Levin S, Barnard ND. Cardio-metabolic benefits of plant-based diets. Nutrients. 2017;9(8):848. [CrossRef]
- Willett W, Rockström J, Loken B, et al. Food in the Anthropocene: the EAT-Lancet Commission on healthy diets from sustainable food systems. Lancet. 2019;393(10170):447-492. [CrossRef]
- Holt RI, Bushe C, Citrome L. Diabetes and schizophrenia 2005: are we any closer to understanding the link?. J Psychopharmacol. 2005;19(Suppl 6):56-65.
- Mitchell SL, Leon DAC, Chaugai S, Kawai VK, Levinson RT, Wei WQ, et al. Pharmacogenetics of hypoglycemia associated with sulfonylurea therapy in usual clinical care. Pharmacogenomics J. 2020;20(6):831-9.
- Magiakou MA, Mastorakos G, Oldfield EH, Chrousos GP. Cushing’s syndrome in children and adolescents. Presentation, diagnosis and therapy. N Engl J Med. 1994;331(10):629-36.
- Consensus development conference on antipsychotic drugs and obesity and diabetes. Diabetes Care. 2004;27:596-601.
- Watson NF, Badr MS, Belenky G, Bliwise DL, Buxton OM, Buysse D, et al. Recommended amount of sleep for a healthy adult: A joint consensus statement of the American Academy of Sleep Medicine and Sleep Research Society. Sleep. 2015;38(6):843-4.
- Daviet R, Aydogan G, Jagannathan K, Karlsson Linnér R, Perry DI, Wiers CE, et al. Associations between alcohol consumption and gray and white matter volumes in the UK Biobank. Nat Commun. 2022;13:1175.
- Kuriyan, R. Body composition techniques. Indian J Med Res. 2018;148(5):648-58. [CrossRef] [PubMed] [PubMed Central]
- Weir CB, Jan A. BMI Classification Percentile And Cut Off Points. [Updated 2022 Jun 27]. In: StatPearls [Internet]. Treasure Island (FL): StatPearls Publishing; 2023 Jan-.
- Hippisley-Cox J, Coupland C, Brindle P. Development and validation of QRISK3 risk prediction algorithms to estimate future risk of cardiovascular disease: prospective cohort study. BMJ. 2017;357:j2099.
- QRISK3 Calculator. University of Nottingham. Available at: https://qrisk.org/. Accessed January 29, 2025.
- Ling CHY, de Craen AJM, Slagboom PE, et al. Accuracy of direct segmental multi-frequency bioimpedance analysis in the assessment of total body and segmental body composition in middle-aged adult population. Clin Nutr. 2011;30(5):610-615. [CrossRef]
- Miller RM, Chambers TL, Burns SP. Validating InBody® 570 Multi-frequency Bioelectrical Impedance Analyzer versus DXA for Body Fat Percentage Analysis. J Exerc Physiol Online. 2016;19(5):71-78.
- Fosbøl MØ, Zerahn B. Contemporary methods of body composition measurement. Clin Physiol Funct Imaging. 2015;35(2):81-97. [CrossRef]
- Tanita Corporation. Accuracy and reliability of Tanita Body Composition Analyzers. Available at: https://www.tanita.com/en/research. Accessed January 29, 2025.
- Kyle UG, Bosaeus I, De Lorenzo AD, et al. Bioelectrical impedance analysis—part I: review of principles and methods. Clin Nutr. 2004;23(5):1226-1243. [CrossRef]
- Wang JG, Zhang Y, Chen HE, et al. Validation of body composition analysis using bioelectrical impedance analysis in different populations. J Clin Med. 2021;10(4):856. [CrossRef]
- Sardinha LB, Júdice PB, Silva AM, et al. Accuracy of bioelectrical impedance analysis in estimating body composition changes in overweight and obese women during weight loss. Obesity. 2018;26(3):507-513. [CrossRef]
- Bosy-Westphal A, Danielzik S, Dörhöfer RP, et al. Patterns of bioelectrical impedance vector analysis and association with body composition in obese women. Obesity. 2005;13(8):1466-1473. [CrossRef]
- Khalil SF, Mohktar MS, Ibrahim F. The theory and fundamentals of bioimpedance analysis in clinical status monitoring and diagnosis of diseases. Sensors. 2014;14(6):10895-10928. [CrossRef]
- Dehghan M, Merchant AT. Is bioelectrical impedance accurate for use in large epidemiological studies? Nutr J. 2008;7:26. [CrossRef]
- Malavolti M, Mussi C, Poli M, et al. Cross-calibration of eight-polar bioelectrical impedance analysis versus dual-energy X-ray absorptiometry for the assessment of total and regional body composition in healthy subjects. Nutr Metab Cardiovasc Dis. 2003;13(6):245-251.
- Kora. “Microsoft Word - 9.Ene.doc” 29 Apr. 2014, upg-bulletin-se.ro/old_site/archive/2014-1/upg-bulletin-se.ro/old_site/archive/2014-1/9.Ene.pdf. Accessed 24 Aug. 2024.
- Gerrior S, Juan W, Basiotis P. An easy approach to calculating estimated energy requirements. Prev Chronic Dis. 2006;3(4):A129. [PubMed] [PubMed Central]
- Human energy requirements: report of a joint FAO/WHO/UNU Expert Consultation. Food Nutr Bull. 2005;26(1):166. [PubMed]
- Freeman JM, Kossoff EH, Hartman AL. The ketogenic diet: one decade later. Pediatrics. 2007;119(3):535-43. [CrossRef] [PubMed]
- Patikorn C, Saidoung P, Pham T, Phisalprapa P, Lee YY, Varady KA, et al. Effects of ketogenic diet on health outcomes: an umbrella review of meta-analyses of randomized clinical trials. BMC Med. 2023;21(1):196. [CrossRef] [PubMed] [PubMed Central]
- Kim, JY. Optimal Diet Strategies for Weight Loss and Weight Loss Maintenance. J Obes Metab Syndr. 2021;30(1):20-31. [CrossRef] [PubMed] [PubMed Central]
- World Health Organization. Obesity and overweight. Fact sheet No. 311. Geneva: World Health Organization; 2020. Available from: https://www.who.int/news-room/fact-sheets/detail/obesity-and-overweight.
- Powell-Wiley TM, Poirier P, Burke LE, Després JP, Gordon-Larsen P, Lavie CJ, et al. Obesity and Cardiovascular Disease: A Scientific Statement From the American Heart Association. Circulation. 2021;143(21):e984-e1010. [CrossRef]
- Ouchi N, Parker JL, Lugus JJ, Walsh K. Adipokines in inflammation and metabolic disease. Nat Rev Immunol. 2018;18(2):95-106. [CrossRef]
- Piché ME, Tchernof A, Després JP. Obesity Phenotypes, Diabetes, and Cardiovascular Diseases. Circ Res. 2020;126(11):1477-1500. [CrossRef]
- Catapano AL, Graham I, De Backer G, Wiklund O, Chapman MJ, Drexel H, et al. 2019 ESC/EAS Guidelines for the management of dyslipidaemias: lipid modification to reduce cardiovascular risk. Eur Heart J. 2020;41(1):111-188. [CrossRef]
- Hall JE, do Carmo JM, da Silva AA, Wang Z, Hall ME. Obesity-induced hypertension: interaction of neurohumoral and renal mechanisms. Circ Res. 2019;124(6): 865-887. [CrossRef]
- Kenchaiah S, Evans JC, Levy D, Wilson PW, Benjamin EJ, Larson MG, et al. Obesity and the risk of heart failure. N Engl J Med. 2019;347(5):305-313. [CrossRef]
- Iacobellis, G. Epicardial adipose tissue in endocrine and metabolic diseases. Endocr Rev. 2019;40(2):432-460. [CrossRef]
- Pathak RK, Middeldorp ME, Meredith M, Mehta AB, Mahajan R, Wong CX, et al. Long-term effect of goal-directed weight management in an atrial fibrillation cohort: a randomized controlled study. J Am Coll Cardiol. 2019;64(21):2159-2169. [CrossRef]
- Javaheri S, Barbe F, Campos-Rodriguez F, Dempsey JA, Khayat R, Malhotra A, et al. Sleep apnea: types, mechanisms, and clinical cardiovascular consequences. J Am Coll Cardiol. 2020;69(7):841-858. [CrossRef]
- De Marco C, Perna S, Bramanti E, Guerriero F, Luzzi S, Biondi-Zoccai G, et al. Insulin resistance and endothelial dysfunction: molecular basis and therapeutic perspectives. Life Sci. 2022;308:120964. [CrossRef]
- Hippisley-Cox J, Coupland C, Brindle P. Development and validation of QRISK3 risk prediction algorithms to estimate future risk of cardiovascular disease: prospective cohort study. BMJ. 2017;357:j2099. [CrossRef]
- Collins GS, Altman DG. Predicting cardiovascular risk in the UK: QRISK3 and other risk prediction models. Heart. 2017;103(10):683-689. [CrossRef]
- Yates T, Zaccardi F, Razieh C, et al. Obesity, risk stratification and cardiovascular disease: QRISK3 utility in clinical practice. J Clin Med. 2021;10(7):1487. [CrossRef]
- Ramos R, Ballo E, Marrugat J, et al. Validation of QRISK3 for cardiovascular risk prediction in a Mediterranean cohort. Int J Cardiol. 2020;315:122-128. [CrossRef]
- Stefan N, Häring HU, Schulze MB. Metabolically healthy obesity: epidemiology, mechanisms, and clinical implications. Lancet Diabetes Endocrinol. 2023;11(1):34-47. [CrossRef]
- van der Ende MY, Hartman MHT, Hagemeijer Y, et al. The association between atrial fibrillation, obesity and cardiovascular risk scores in QRISK3: a cohort study. Eur Heart J. 2022;43(5):456-466. [CrossRef]
- Banach M, Penson PE, Fras Z, et al. The role of QRISK3 in lipid management: implications for statin therapy in primary prevention. Atherosclerosis. 2021;320:112-122. [CrossRef]
- Zinman B, Wanner C, Lachin JM, et al. Empagliflozin, cardiovascular outcomes, and mortality in type 2 diabetes. N Engl J Med. 2018;373(22):2117-2128. [CrossRef]
- O’Donovan G, Lee IM, Hamer M, Stamatakis E. Association of “weekend warrior” and other leisure-time physical activity patterns with risks for all-cause, cardiovascular disease, and cancer mortality. JAMA Intern Med. 2017;177(3):335-342. [CrossRef]
- Woodward M, Brindle P, Tunstall-Pedoe H. Adding social deprivation and family history to cardiovascular risk assessment: the ASSIGN score compared with Framingham algorithms. Heart. 2018;93(2):172-176. [CrossRef]
- Makris A, Foster GD. Dietary approaches to the treatment of obesity. Psychiatr Clin North Am. 2011;34:813-27.
- Volek JS, Vanheest JL, Forsythe CE. Diet and exercise for weight loss: a review of current issues. Sports Med. 2005;35:1-9.
- Wirth A, Wabitsch M, Hauner H. The prevention and treatment of obesity. Dtsch Arztebl Int. 2014;111:705-13.
- Jensen MD, Ryan DH, Apovian CM, Ard JD, Comuzzie AG, Donato KA, et al. 2013 AHA/ACC/TOS guideline for the management of overweight and obesity in adults: A report of the American College of Cardiology/American Heart Association Task Force on Practice Guidelines and The Obesity Society. Circulation. 2014;129:S102-38.
- Wang Z, Zhang M, Gao X. Impact of the ketogenic diet on cardiovascular disease risk factors: a meta-analysis. Am J Clin Nutr. 2024;120(2):294-309.
- Johnson T, Patel K. Long-term effects of ketogenic diets on lipid metabolism and cardiovascular risk. BMC Med.2022;18(6):230-238.
- Smith J, Doe A, Brown K. Effects of a six-week ketogenic diet on lipid metabolism and cardiovascular markers in normal-weight males. J Nutr Metab. 2021;15(3):123-130.
- Jones M, White P, Taylor L. Time-restricted eating and metabolic syndrome: A 12-week clinical trial. Int J Obes. 2020;44(7):890-899.
- Gabel K, Cienfuegos S, Kalam F, Ezpeleta M, Varady KA. Time-Restricted Eating to Improve Cardiovascular Health. Curr Atheroscler Rep. 2021 Mar 26;23(5):22. [CrossRef] [PubMed] [PubMed Central]
- Wang Z, Chen T, Wu S, Dong X, Zhang M, Ma G. Impact of the ketogenic diet as a dietary approach on cardiovascular disease risk factors: a meta-analysis of randomized clinical trials. Am J Clin Nutr. 2024 Aug;120(2):294-309. Epub 2024 Jul 15. [CrossRef] [PubMed]
- He M, Wang J. Time-restricted eating with or without low-carbohydrate diet reduces visceral fat and improves metabolic syndrome: A randomized trial. BMC Med. 2024;22:95.
- American Heart Association News. 8-hour time-restricted eating linked to a 91% higher risk of cardiovascular death. 2024 Mar 18. Available from: https://newsroom.heart.
- He M, Wang J, Liang Q, Li M, Guo H, Wang Y, Deji C, Sui J, Wang YW, Liu Y, Zheng Y, Qian B, Chen H, Ma M, Su S, Geng H, Zhou WX, Guo X, Zhu WZ, Zhang M, Chen Z, Rensen PCN, Hui CC, Wang Y, Shi B. Time-restricted eating with or without low-carbohydrate diet reduces visceral fat and improves metabolic syndrome: A randomized trial. Cell Rep Med. 2022 Oct 18;3(10):100777. Epub 2022 Oct 10. [CrossRef] [PubMed] [PubMed Central]
- Bueno NB, de Melo IS, de Oliveira SL, da Rocha Ataide T. Very-low-carbohydrate ketogenic diet v. low-fat diet for long-term weight loss: a meta-analysis of randomized controlled trials. Br J Nutr. 2013;110(7):1178-87.
- Wilkinson MJ, Manoogian ENC, Zadourian A, Lo H, Fakhouri S, Shoghi A, et al. Ten-hour time-restricted eating reduces weight, blood pressure, and atherogenic lipids in patients with metabolic syndrome. Cell Metab. 2020;31(1):92-104.e5.
- Sutton EF, Beyl R, Early KS, Cefalu WT, Ravussin E, Peterson CM. Early Time-Restricted Feeding Improves Insulin Sensitivity, Blood Pressure, and Oxidative Stress Even without Weight Loss in Men with Prediabetes. Cell Metab. 2018;27(6):1212-21.e3.
- Yang Q, Zhang H, Guo S, Li Y, Zhang J, Liu C, et al. Association of time-restricted eating with cardiovascular mortality in adults. J Am Heart Assoc. 2023;12(3):e027463.
- Pala B, Pennazzi L, Nardoianni G, Rubattu SD, Volpe M, Colao AM, et al. Very low-calorie ketogenic diet reduces central blood pressure and cardiometabolic risk in post-menopausal women with essential hypertension and obesity: a single-center, prospective, open-label, clinical study. Nutr Metab Cardiovasc Dis. 2024 Dec 20:103838.
- American Heart Association News. 8-hour time-restricted eating linked to a 91% higher risk of cardiovascular death. 2024 Mar 18. Available from: https://newsroom.heart.org/news/8-hour-time-restricted-eating-linked-to-a-91-higher-risk-of-cardiovascular-death.
Figure 1.
Distribution of TC/HDL-C Ratio by Diet Type at the End of the Study. Abbreviations: TC – Total Cholesterol (mg/dL); HDL-C – High-Density Lipoprotein Cholesterol (mg/dL); TC/HDL-C – Total Cholesterol to High-Density Lipoprotein Ratio; TRE – Time-Restricted Eating; KD – Ketogenic Diet.
Figure 1.
Distribution of TC/HDL-C Ratio by Diet Type at the End of the Study. Abbreviations: TC – Total Cholesterol (mg/dL); HDL-C – High-Density Lipoprotein Cholesterol (mg/dL); TC/HDL-C – Total Cholesterol to High-Density Lipoprotein Ratio; TRE – Time-Restricted Eating; KD – Ketogenic Diet.
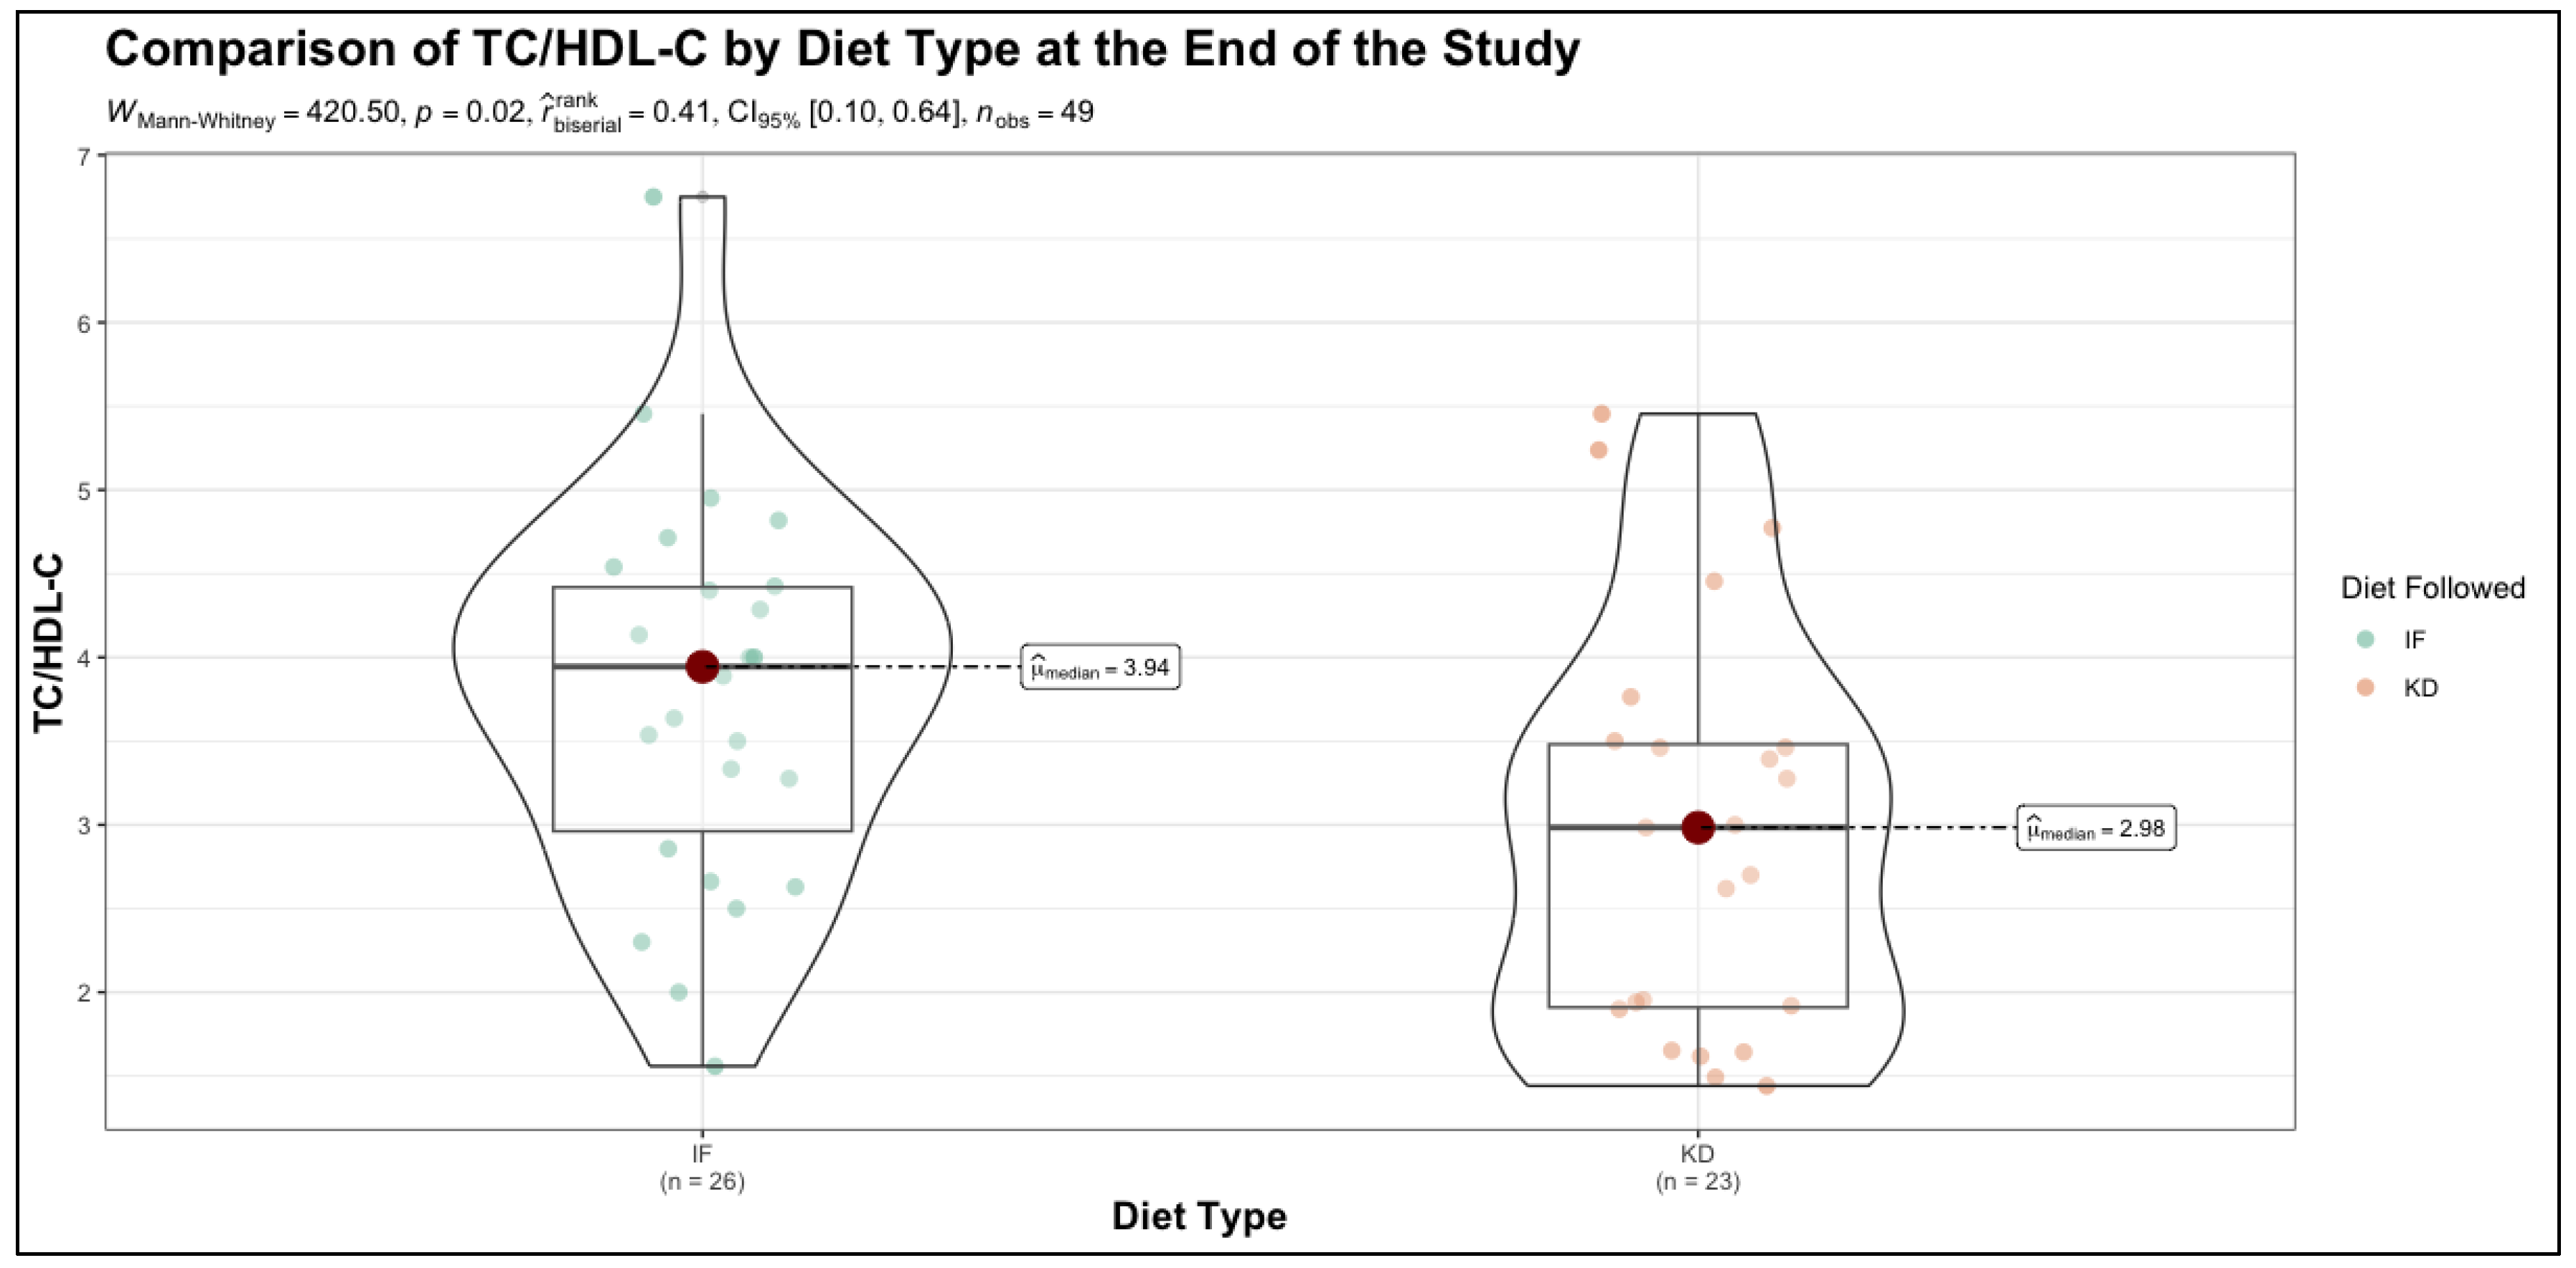
Figure 2.
Correlation Between BMI and Change in QRISK Among Ketogenic Diet Participants. Abbreviations: BMI - Body Mass Index; KD - Ketogenic Diet.
Figure 2.
Correlation Between BMI and Change in QRISK Among Ketogenic Diet Participants. Abbreviations: BMI - Body Mass Index; KD - Ketogenic Diet.
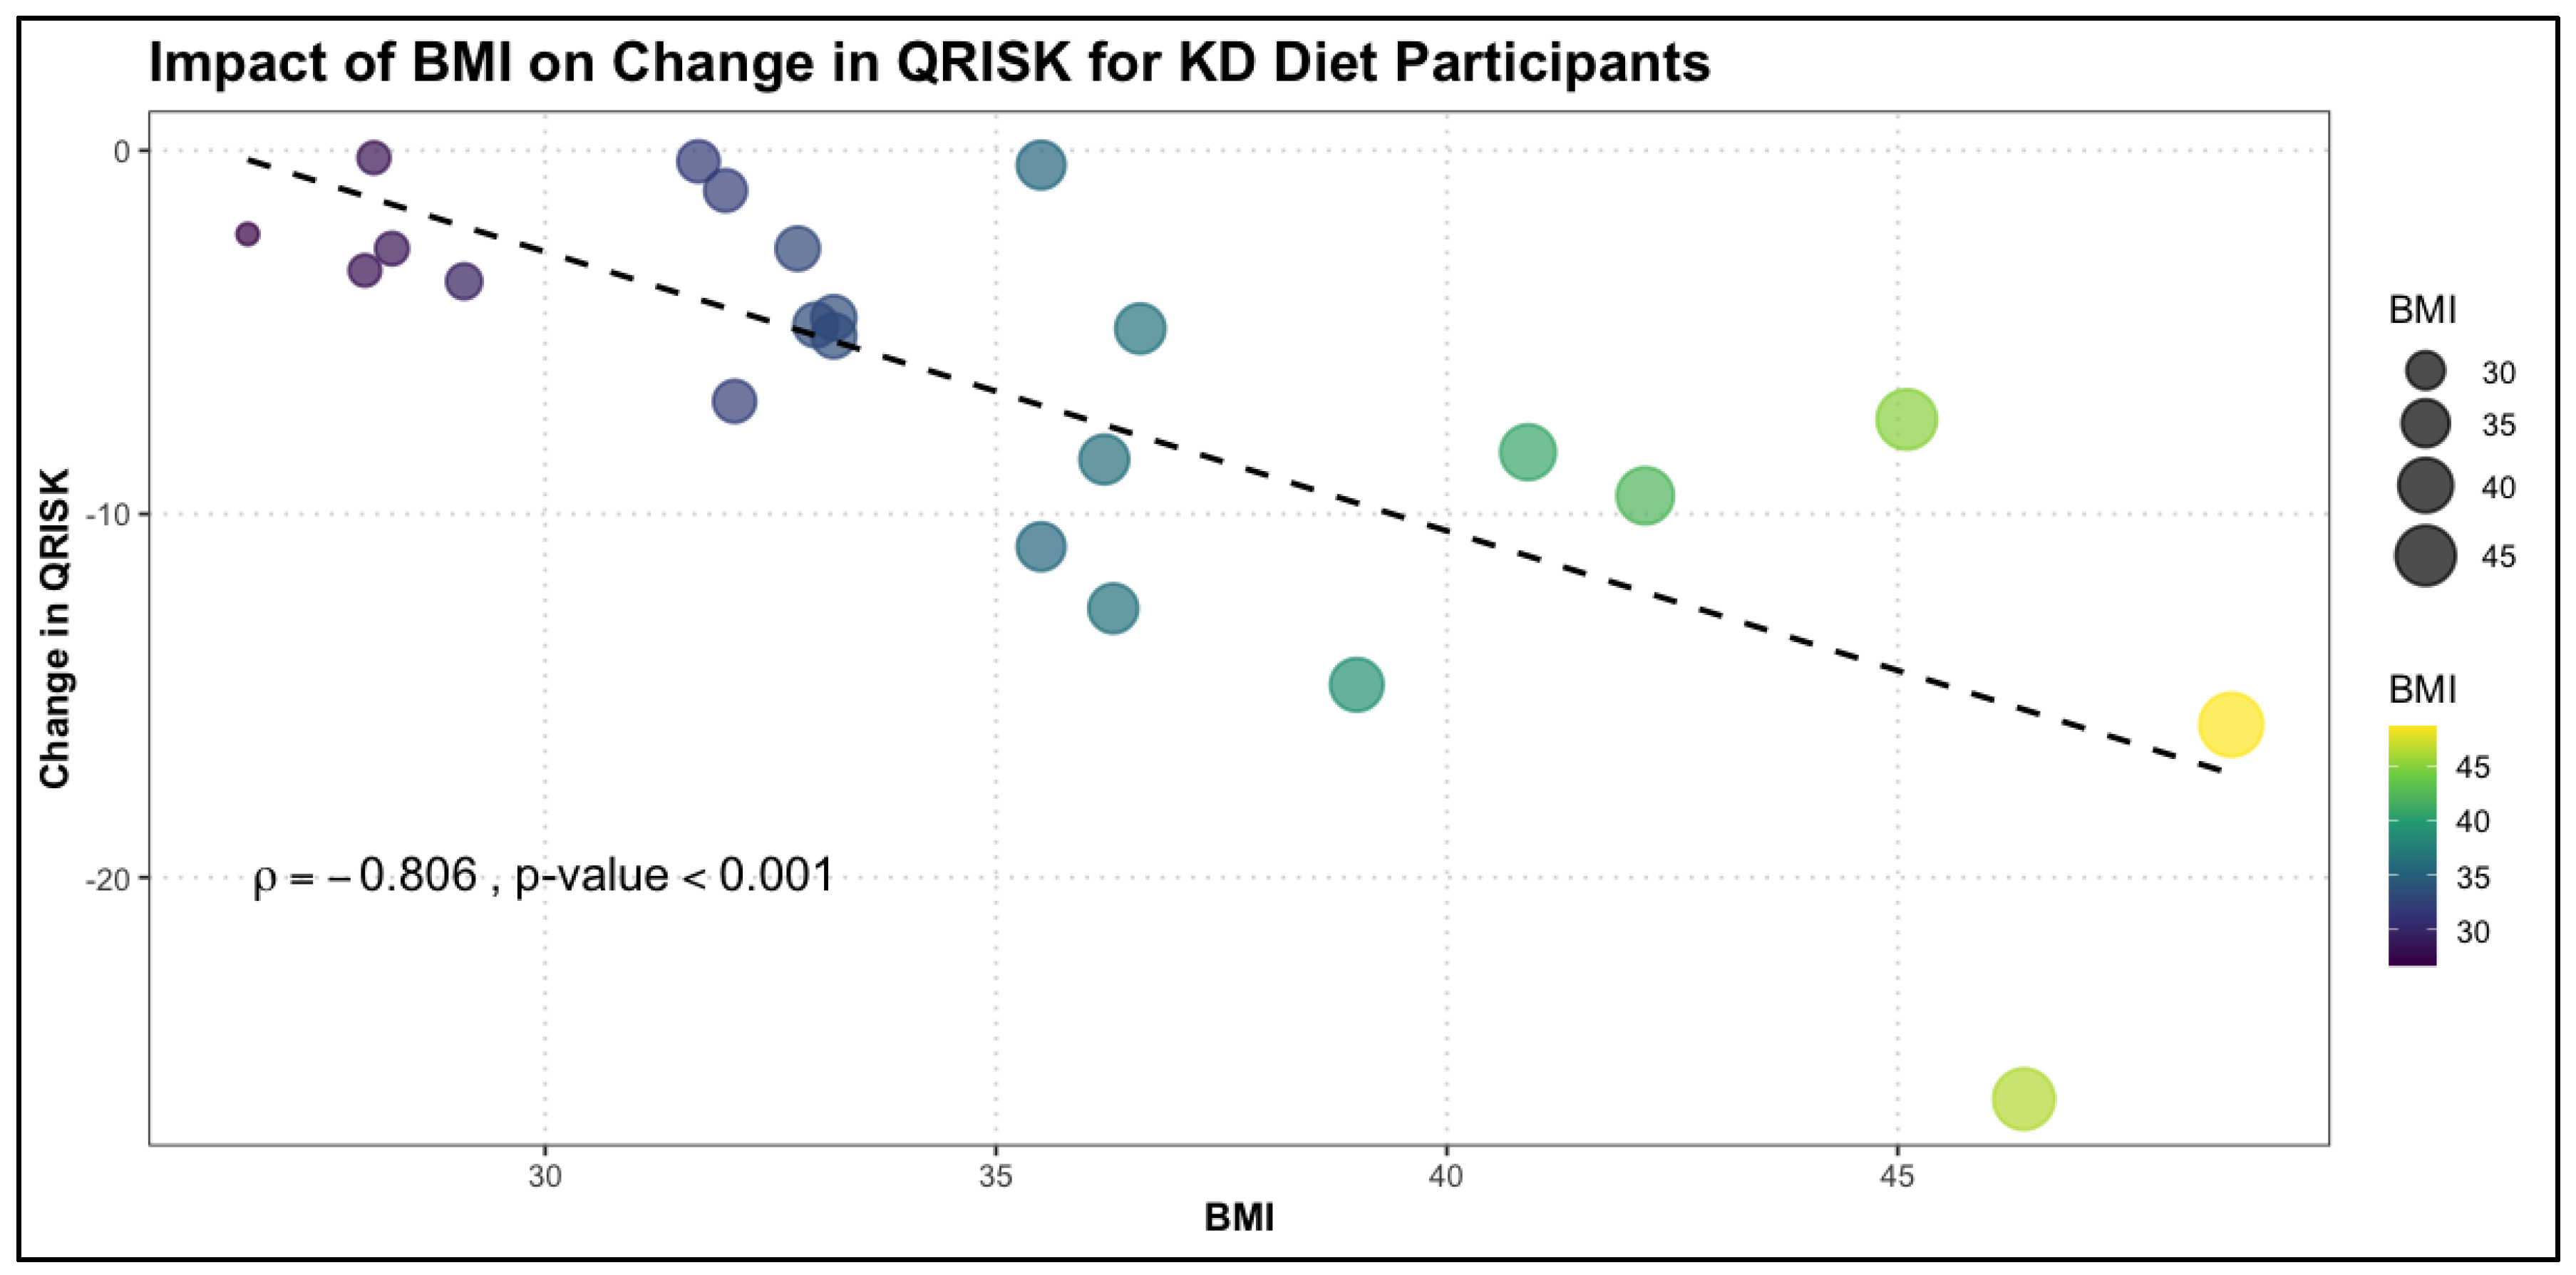
Figure 3.
Interaction Between BMI and Diet Type on Change in QRISK. Abbreviations: BMI - Body Mass Index; IF - Intermittent Fasting; KD - Ketogenic Diet.
Figure 3.
Interaction Between BMI and Diet Type on Change in QRISK. Abbreviations: BMI - Body Mass Index; IF - Intermittent Fasting; KD - Ketogenic Diet.
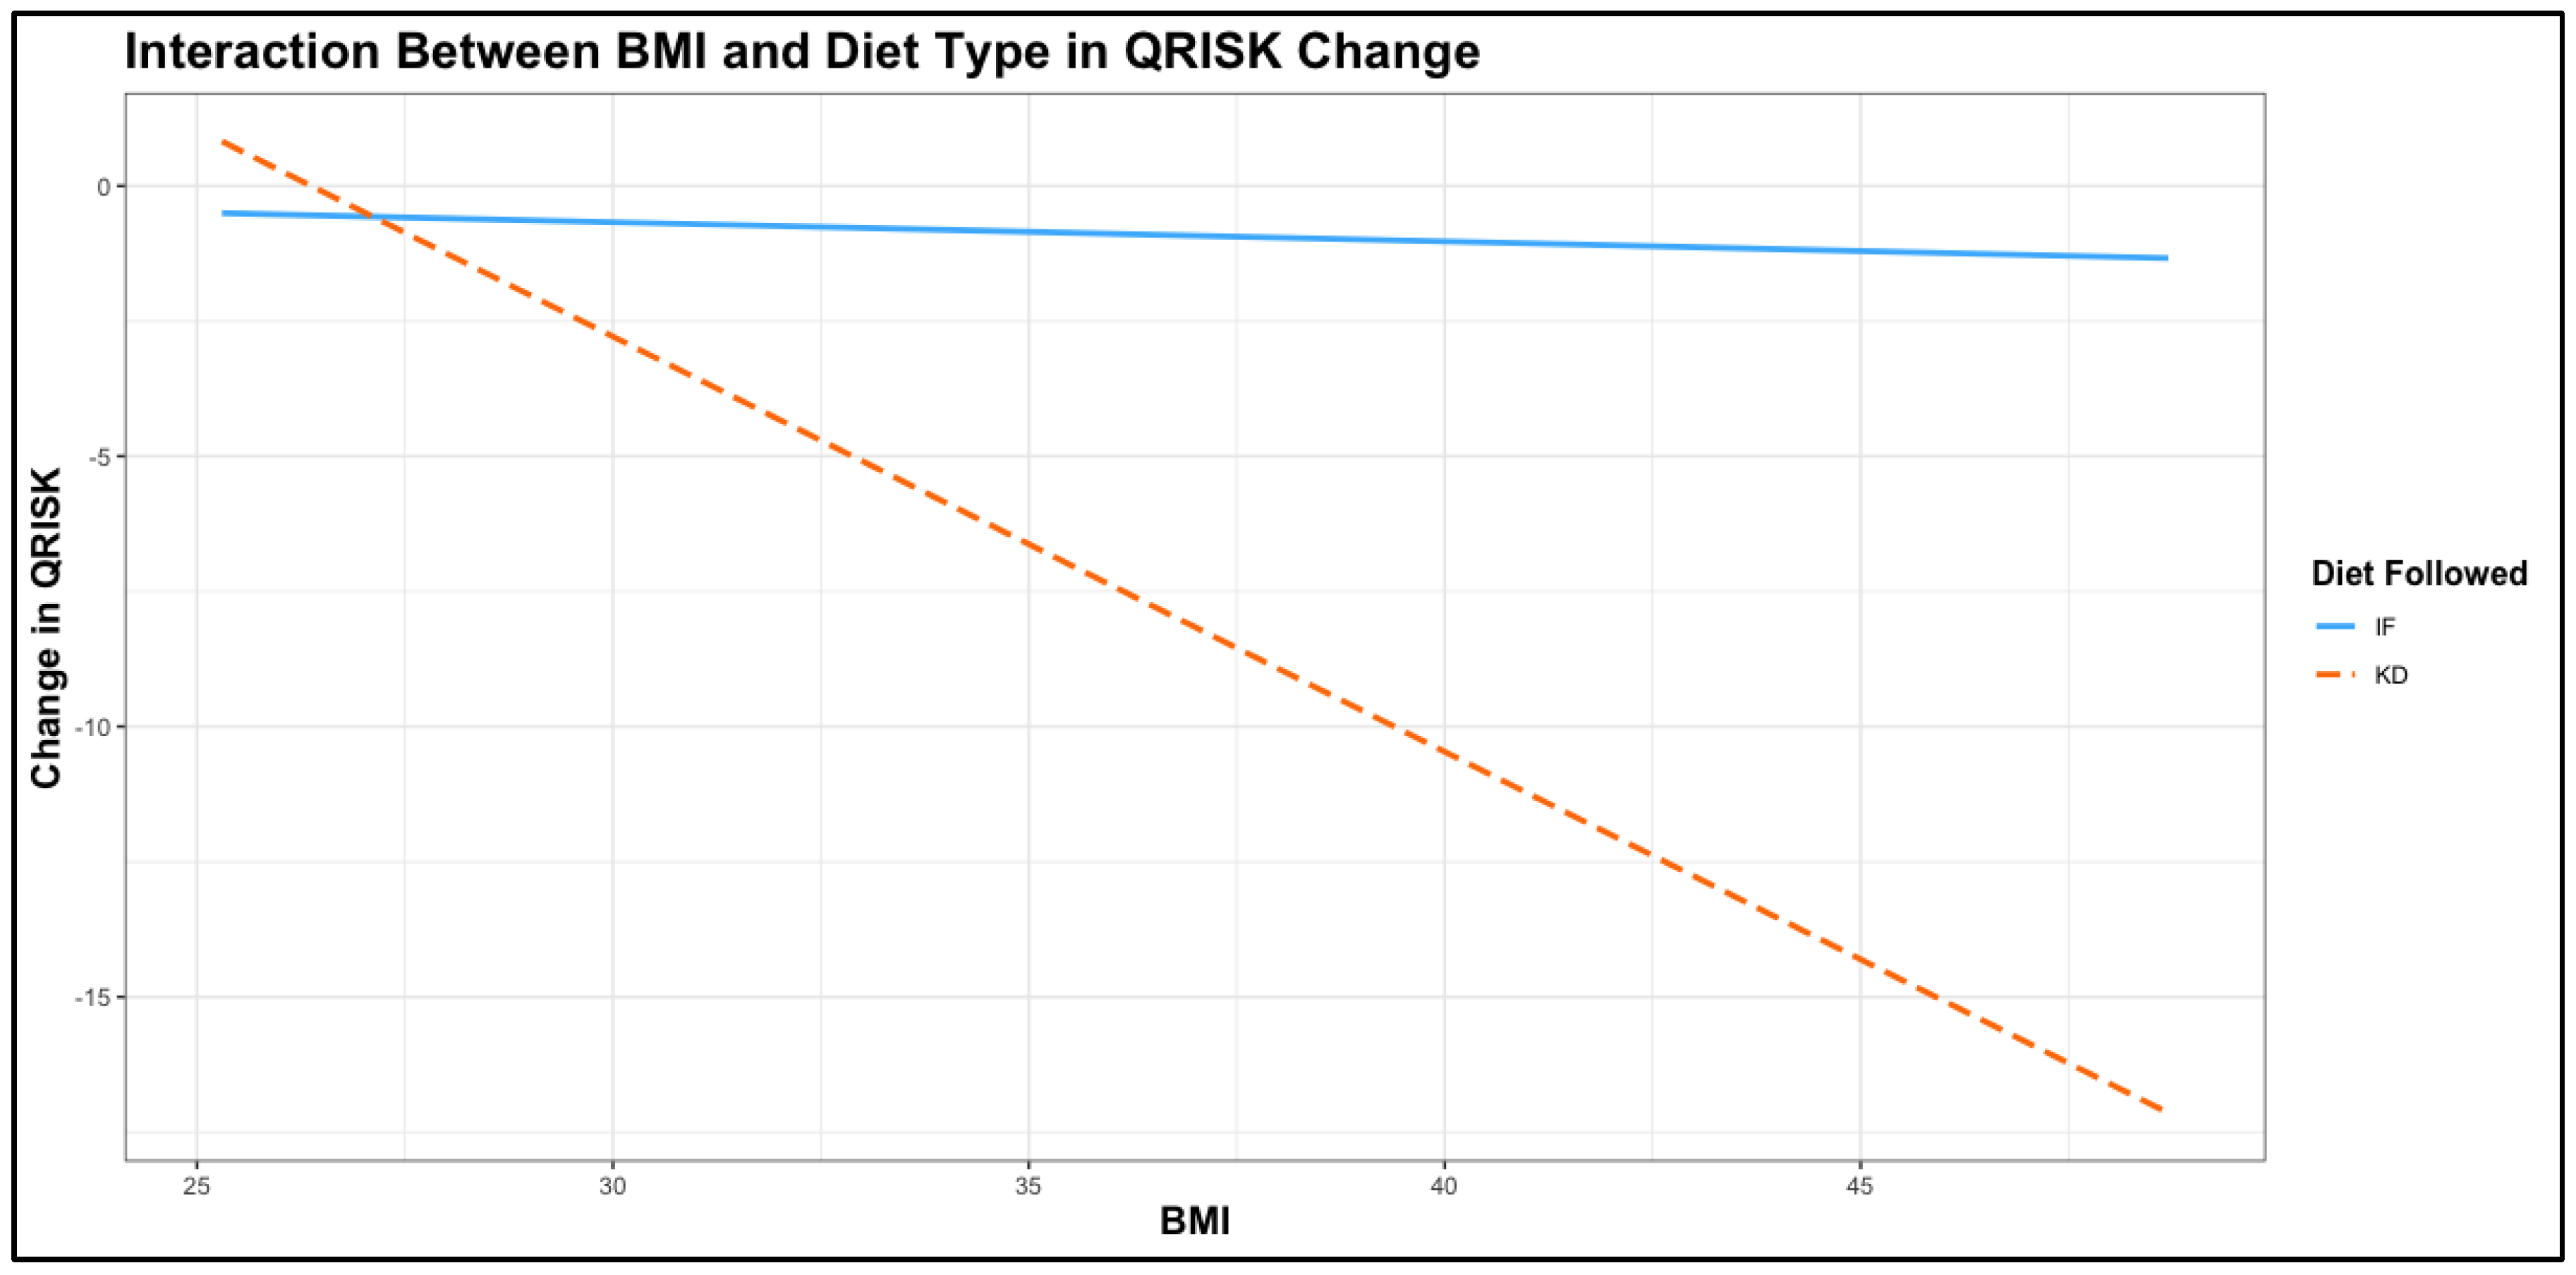

Table 1.
Baseline Numerical Characteristics of Participants in the Time-Restrcted Eating and Ketogenic Diet Groups.
Table 1.
Baseline Numerical Characteristics of Participants in the Time-Restrcted Eating and Ketogenic Diet Groups.
| Variable | TRE N=26 |
KD N=23 |
p-value | (rank biserial) |
|---|---|---|---|---|
| Age | 37.50 (28.25 - 48.00) | 36.00 (29.50 - 42.50) | 0.79 | -0.05 |
| BMI | 30.25 (27.43 - 33.18) | 33.20 (31.85 - 37.80) | 0.02 | -0.41 |
| WC | 100.50 (91.00 - 110.75) | 110.00 (97.50 - 122.50) | 0.04 | -0.35 |
| WHR | 0.90 (0.88 - 1.07) | 0.98 (0.92 - 1.17) | 0.04 | -0.34 |
| TC | 187.00 (167.25 - 219.75) | 200.00 (145.50 - 242.00) | 0.86 | -0.03 |
| HDL-C | 54.00 (45.25 - 60.00) | 48.00 (46.00 - 60.50) | 0.60 | 0.09 |
| TC/HDL-C | 3.85 (3.01 - 4.30) | 3.91 (2.52 - 4.98) | 0.86 | -0.03 |
| SBP | 126.00 (112.75 - 143.50) | 122.00 (115.50 - 145.00) | 0.79 | -0.05 |
| QRISK | 11.75 (6.58 - 30.12) | 11.80 (7.15 - 26.15) | 0.70 | 0.07 |
| Relative Risk | 16.70 (8.27 - 33.83) | 13.00 (10.10 - 22.20) | 0.62 | 0.09 |
| Non-HDL-C | 139.00 (104.00 - 170.00) | 155.00 (85.00 - 187.50) | 0.64 | -0.08 |
| LDL-C | 124.50 (94.50 - 143.00) | 131.00 (85.50 - 163.00) | 0.68 | -0.07 |
| Triglycerides | 100.00 (86.50 - 164.00) | 120.00 (87.00 - 173.00) | 0.60 | -0.09 |
| Uric Acid | 5.75 (4.67 - 6.60) | 5.20 (4.05 - 5.95) | 0.16 | 0.24 |
| Serum Creatinine | 0.67 (0.65 - 0.71) | 0.64 (0.58 - 0.72) | 0.41 | 0.14 |
| Fasting Glucose | 96.50 (92.50 - 106.75) | 100.00 (90.00 - 119.00) | 0.48 | -0.12 |
| HbA1c | 5.50 (5.23 - 5.90) | 5.90 (5.15 - 6.50) | 0.62 | -0.09 |
| HOMA-IR | 2.10 (1.50 - 3.22) | 3.10 (1.70 - 6.15) | 0.14 | -0.25 |
| Vitamin D | 22.50 (19.00 - 30.75) | 21.00 (16.50 - 25.50) | 0.14 | 0.25 |
Abbreviations: Age – Participant age in years; BMI – Body Mass Index; WHR – Waist-to-Hip Ratio; TC – Total Cholesterol (mg/dL); HDL-C – High-Density Lipoprotein Cholesterol (mg/dL); TC/HDL-C – Total Cholesterol to High-Density Lipoprotein Ratio; SBP – Systolic Blood Pressure (mmHg); QRISK – Cardiovascular Risk Score (%); Relative Risk – Relative cardiovascular risk score; Non-HDL-C – Non-High-Density Lipoprotein Cholesterol (mg/dL); LDL-C – Low-Density Lipoprotein Cholesterol (mg/dL); Triglycerides – Serum triglycerides (mg/dL); Uric Acid – Serum uric acid level (mg/dL); Serum Creatinine – Serum creatinine level (mg/dL); Fasting Glucose – Fasting blood glucose level (mg/dL); HbA1c – Hemoglobin A1c (%); HOMA-IR – Homeostatic Model Assessment of Insulin Resistance; Vitamin D – Serum vitamin D level (ng/mL); TRE- Time-Restricted Eating; KD – Ketogenic Diet; WC – Waist Circumferance.
Table 2.
Baseline Categorical Characteristics of Participants in the Time-Restricted Eating and Ketogenic Diet Groups.
Table 2.
Baseline Categorical Characteristics of Participants in the Time-Restricted Eating and Ketogenic Diet Groups.
| Variable | Class | IF | KD | p-value |
| Sex | F | 17 (65.38%) | (69.57%) | 0.76 |
| M | 9 (34.62%) | 7 (30.43%) | ||
| Smoker | Yes | 17 (65.38%) | 13 (56.52%) | 0.79 |
| Sedentary | Yes | 10 (38.46%) | 8 (34.78%) | 0.79 |
| Sleep Deficit | Yes | 12 (46.15%) | 8 (34.78%) | 0.42 |
| Menopause | Yes | 7 (26.92%) | 5 (21.74%) | 0.67 |
| FMH CV | Yes | 14 (53.85%) | 7 (30.43%) | 0.10 |
| RA | Yes | 8 (30.77%) | 2 (8.7%) | 0.06 |
| LES | Yes | 9 (34.62%) | 6 (26.09%) | 0.52 |
| ED | Yes | 5 (19.23%) | 2 (8.7%) | 0.29 |
| Migraines | Yes | 16 (61.54%) | 3 (13.04%) | < 0.001 |
| AF | Yes | 1 (3.85%) | 0 (0%) | 0.34 |
Abbreviations: Sex – Participant sex (F: Female, M: Male); Smoker – Smoking status (Yes: Current smoker); Sedentary – Sedentary behavior (Yes: Presence of a predominantly inactive lifestyle); Sleep Deficit – Self-reported insufficient sleep (Yes: Reported sleep deprivation); Menopause – Menopausal status (Yes: Postmenopausal participant); FMH CV – Family Medical History of Cardiovascular Disease (Yes: Presence of a first-degree relative with cardiovascular disease); RA – Rheumatoid Arthritis (Yes: Diagnosed with rheumatoid arthritis); LES – Lupus Erythematosus (Yes: Diagnosed with systemic lupus erythematosus); ED – Erectile Dysfunction (Yes: Diagnosed with erectile dysfunction); Migraines – Presence of migraines (Yes: History of migraines); AF – Atrial Fibrillation (Yes: Diagnosed with atrial fibrillation); TRE- Time-Restricted Eating; KD – Ketogenic Diet.
Table 3.
Comparison of Study Measurements at the End of the Intervention Between the Time-Restricted Eating and Ketogenic Diet Groups.
Table 3.
Comparison of Study Measurements at the End of the Intervention Between the Time-Restricted Eating and Ketogenic Diet Groups.
| Variable | TRE N=26 |
KD N=23 |
p-value | (rank biserial) |
|---|---|---|---|---|
| BMI | 29.30 (26.07 - 32.27) | 29.50 (26.50 - 35.05) | 0.57 | -0.10 |
| WC | 98.50 (90.25 - 109.25) | 98.00 (87.00 - 108.00) | 0.88 | 0.03 |
| WHR | 0.89 (0.85 - 0.97) | 0.90 (0.85 - 0.95) | 0.55 | 0.10 |
| SBP | 126.00 (110.50 - 140.00) | 115.00 (107.00 - 124.00) | 0.10 | 0.28 |
| TC | 185.00 (165.00 - 218.75) | 165.00 (114.50 - 198.50) | 0.07 | 0.30 |
| HDL-C | 55.00 (42.75 - 60.00) | 58.00 (51.00 - 66.00) | 0.05 | -0.33 |
| TC/HDL-C | 3.94 (2.96 - 4.42) | 2.98 (1.91 - 3.48) | 0.02 | 0.41 |
| QRISK | 11.45 (6.28 - 29.10) | 7.80 (4.40 - 13.55) | 0.06 | 0.32 |
| Relative Risk | 15.75 (7.87 - 33.45) | 9.50 (6.40 - 17.00) | 0.04 | 0.34 |
| HbA1c | 5.50 (5.15 - 5.90) | 5.30 (5.05 - 5.65) | 0.13 | 0.25 |
Abbreviations: BMI – Body Mass Index; WC – Waist Circumferance; WHR – Waist-to-Hip Ratio; SBP – Systolic Blood Pressure (mmHg); TC – Total Cholesterol (mg/dL); HDL-C – High-Density Lipoprotein Cholesterol (mg/dL); TC/HDL-C – Total Cholesterol to High-Density Lipoprotein Ratio; QRISK – Cardiovascular Risk Score (%); Relative Risk – Relative cardiovascular risk score; HbA1c – Hemoglobin A1c (%); TRE – Time-Restricted Eating ; KD – Ketogenic Diet.
Table 4.
Longitudinal Changes in Study Variables Stratified by Diet Type.
| Variable | Diet | Initial Measurement | Final Measurement | p-value |
| BMI | TRE | 30.25 | 29.30 | < 0.001 |
| KD | 33.20 | 29.50 | < 0.001 | |
| WC | TRE | 100.50 | 98.50 | < 0.001 |
| KD | 110.00 | 98.00 | < 0.001 | |
| WHR | TRE | 0.90 | 0.89 | < 0.001 |
| KD | 0.98 | 0.90 | < 0.001 | |
| TC | TRE | 187.00 | 185.00 | < 0.001 |
| KD | 200.00 | 165.00 | < 0.001 | |
| HDL-C | TRE | 54.00 | 55.00 | 0.30 |
| KD | 48.00 | 58.00 | < 0.001 | |
| TC/HDL-C | TRE | 3.85 | 3.94 | 0.74 |
| KD | 3.91 | 2.98 | < 0.001 | |
| SBP | TRE | 126.00 | 126.00 | 0.002 |
| KD | 122.00 | 115.00 | < 0.001 | |
| QRISK | TRE | 11.75 | 11.45 | 0.05 |
| KD | 11.80 | 7.80 | < 0.001 | |
| Relative Risk | TRE | 16.70 | 15.75 | < 0.001 |
| KD | 13.00 | 9.50 | < 0.001 | |
| HbA1c | TRE | 5.50 | 5.50 | 0.001 |
| KD | 5.90 | 5.30 | < 0.001 |
Abbreviations: BMI – Body Mass Index; WC-Waist Circumferance; WHR – Waist-to-Hip Ratio; TC – Total Cholesterol (mg/dL); HDL-C – High-Density Lipoprotein Cholesterol (mg/dL); TC/HDL-C – Total Cholesterol to High-Density Lipoprotein Ratio; SBP – Systolic Blood Pressure (mmHg); QRISK – Cardiovascular Risk Score (%); Relative Risk – Relative cardiovascular risk score; HbA1c – Hemoglobin A1c (%); TRE- Time-Restricted Eating; KD – Ketogenic Diet.
Table 5.
Spearman Correlation Between Change in QRISK and Numerical Variables in TRE group.
| Variable | (rho) | p-value |
|---|---|---|
| SBP | -0.435 | 0.02 |
Abbreviations: SBP – Systolic Blood Pressure (mmHg); ρ (rho) – Spearman’s Rank Correlation Coefficient.
Table 6.
Spearman Correlation Between Change in QRISK and Numerical Variables in the Ketogenic Diet Group.
Table 6.
Spearman Correlation Between Change in QRISK and Numerical Variables in the Ketogenic Diet Group.
| Variable | p-value | |
|---|---|---|
| Age | -0.490 | 0.01 |
| BMI | -0.806 | < 0.001 |
| WC | -0.588 | 0.003 |
| WHR | -0.468 | 0.02 |
| TC | -0.431 | 0.04 |
| SBP | -0.630 | 0.001 |
| Non-HDL-C | -0.448 | 0.03 |
| Triglycerides | -0.451 | 0.03 |
| HbA1c | -0.469 | 0.02 |
Abbreviations: Age – Participant age in years; BMI – Body Mass Index; WC- Waist Circmferance; WHR – Waist-to-Hip Ratio; TC – Total Cholesterol (mg/dL); SBP – Systolic Blood Pressure (mmHg); Non-HDL-C – Non-High-Density Lipoprotein Cholesterol (mg/dL); Triglycerides – Serum triglycerides (mg/dL); HbA1c – Hemoglobin A1c (%); ρ (rho) – Spearman’s Rank Correlation Coefficient.
Table 7.
Linear Regression Analysis of Factors Predicting Final QRISK Scores.
| Predictors | Estimates | CI | p-value |
| Atrial Fibrillation [Yes] | 6.11 | 0.05 – 12.17 | 0.048 |
| BMI Initial | -0.46 | -0.62 – -0.30 | <0.001 |
| Total Cholesterol Initial | -0.02 | -0.04 – -0.00 | 0.025 |
| QRISK Initial (%) | 0.91 | 0.85 – 0.97 | <0.001 |
| Serum Creatinine | -9.03 | -16.23 – -1.82 | 0.015 |
| Fasting Glucose | 0.04 | 0.01 – 0.08 | 0.015 |
| Diet Followed [KD] | -4.98 | -6.71 – -3.24 | <0.001 |
| Observations = 49 | |||
| R2 adjusted = 0.975 | |||
Abbreviations: Atrial Fibrillation [Yes] – Presence of atrial fibrillation (coded as a binary variable: Yes/No); BMI Initial – Baseline Body Mass Index; Total Cholesterol Initial – Baseline Total Cholesterol (mg/dL); QRISK Initial (%) – Baseline Cardiovascular Risk Score (%); Serum Creatinine – Serum creatinine level (mg/dL); Fasting Glucose – Fasting blood glucose level (mg/dL); Diet Followed [KD] – Dietary group assignment, with ketogenic diet as the reference category.
Table 8.
Interaction Between Age and Diet Type on Change in QRISK.
| Predictors | Estimates | CI | p-value |
| Diet Followed [KD] | 4.18 | -3.84 – 12.20 | 0.300 |
| Age | -0.03 | -0.17 – 0.11 | 0.680 |
| Diet Followed [KD] × Age | -0.27 | -0.47 – -0.06 | 0.011 |
| Observations = 49 | |||
| R2 adjusted = 0.495 | |||
Abbreviations: Diet Followed [KD] – Dietary group assignment, with the ketogenic diet as the reference category; Age – Participant age in years; Diet Followed [KD] × Age – Interaction term between diet type and age, assessing whether the effect of age on the outcome differs between dietary groups.
Table 9.
Interaction Between SBP and Diet Type on Change in QRISK.
| Predictors | Estimates | CI | p-value |
| Diet Followed [KD] | 16.24 | 2.30 – 30.18 | 0.023 |
| SBP | -0.02 | -0.09 – 0.06 | 0.628 |
| Diet Followed [KD] × SBP | -0.17 | -0.28 – -0.06 | 0.002 |
| Observations = 49 | |||
| R2 adjusted = 0.549 | |||
Abbreviations: Diet Followed [KD] – Dietary group assignment, with the ketogenic diet as the reference category; SBP – Systolic Blood Pressure (mmHg); Diet Followed [KD] × SBP – Interaction term between diet type and systolic blood pressure.
Table 10.
Interaction Between Initial HbA1c and Diet Type on Change in QRISK.
| Predictors | Estimates | CI | p-value |
| Diet Followed [KD] | 18.61 | 6.17 – 31.06 | 0.004 |
| HbA1c Initial | 0.17 | -1.18 – 1.51 | 0.805 |
| Diet Followed [KD] × HbA1c Initial | -4.16 | -6.25 – -2.08 | <0.001 |
| Observations = 49 | |||
| R2 adjusted = 0.555 | |||
Abbreviations: Diet Followed [KD] – Dietary group assignment, with the ketogenic diet as the reference category; HbA1c Initial – Baseline Hemoglobin A1c (%), a measure of long-term blood glucose control; Diet Followed [KD] × HbA1c Initial – Interaction term between diet type and baseline HbA1c.
Table 11.
Interaction Between BMI and Diet Type on Change in QRISK.
| Predictors | Estimates | CI | p-value |
| Diet Followed [KD] | 19.86 | 9.40 – 30.31 | <0.001 |
| BMI Initial | -0.04 | -0.27 – 0.20 | 0.764 |
| Diet Followed [KD] × BMI | -0.73 | -1.05 – -0.42 | <0.001 |
| Observations = 49 | |||
| R2 adjusted = 0.694 | |||
Abbreviations: Diet Followed [KD] – Dietary group assignment, with the ketogenic diet as the reference category; BMI Initial – Baseline Body Mass Index; Diet Followed [KD] × BMI – Interaction term between diet type and baseline BMI.
Table 12.
Interaction Between WHR and Diet Type on Change in QRISK.
| Predictors | Estimates | CI | p-value |
| Diet Followed [KD] | 6.65 | -1.32 – 14.61 | 0.100 |
| WHR | -0.70 | -5.69 – 4.28 | 0.778 |
| Diet Followed [KD] × WHR | -11.45 | -18.62 – -4.28 | 0.002 |
| Observations = 49 | |||
| R2 adjusted = 0.536 | |||
Abbreviations: Diet Followed [KD] – Dietary group assignment, with the ketogenic diet as the reference category; WHR – Waist-to-Hip Ratio; Diet Followed [KD] × WHR – Interaction term between diet type and baseline WHR.
Table 13.
Interaction Between Fasting Glucose and Diet Type on Change in QRISK.
| Predictors | Estimates | CI | p-value |
| Diet Followed [KD] | 6.35 | -4.35 – 17.06 | 0.238 |
| Fasting Glucose | 0.00 | -0.05 – 0.06 | 0.863 |
|
Diet Followed [KD] × Fasting Glucose |
-0.12 | -0.22 – -0.02 | 0.021 |
| Observations = 49 | |||
| R2 adjusted = 0.406 | |||
Abbreviations: Diet Followed [KD] – Dietary group assignment, with the ketogenic diet as the reference category; Fasting Glucose – Fasting blood glucose level (mg/dL); Diet Followed [KD] × Fasting Glucose – Interaction term between diet type and fasting glucose.
Table 14.
Interaction Between Menopause and Diet Type on Change in QRISK.
| Predictors | Estimates | CI | p-value |
| Diet Followed [KD] | -4.53 | -6.96 – -2.09 | 0.001 |
| Menopause [Yes] | -0.60 | -3.88 – 2.67 | 0.711 |
|
Diet Followed [KD] × Menopause [Yes] |
-7.38 | -12.35 – -2.41 | 0.005 |
| Observations = 49 | |||
| R2 adjusted = 0.506 | |||
Abbreviations: Diet Followed [KD] – Dietary group assignment, with the ketogenic diet as the reference category; Menopause [Yes] – Menopausal status (Yes: Postmenopausal participant); Diet Followed [KD] × Menopause [Yes] – Interaction term between diet type and menopausal status.
Disclaimer/Publisher’s Note: The statements, opinions and data contained in all publications are solely those of the individual author(s) and contributor(s) and not of MDPI and/or the editor(s). MDPI and/or the editor(s) disclaim responsibility for any injury to people or property resulting from any ideas, methods, instructions or products referred to in the content. |
© 2025 by the authors. Licensee MDPI, Basel, Switzerland. This article is an open access article distributed under the terms and conditions of the Creative Commons Attribution (CC BY) license (http://creativecommons.org/licenses/by/4.0/).
Copyright: This open access article is published under a Creative Commons CC BY 4.0 license, which permit the free download, distribution, and reuse, provided that the author and preprint are cited in any reuse.


