
Submitted:
03 November 2025
Posted:
04 November 2025
You are already at the latest version
Abstract
This study investigates how virtual communication differs from in-person interaction across physiological and behavioral domains, with the goal of informing future interface design. Using a naturalistic setup, we recorded multimodal biosignals, including eye tracking, head and hand movement, heart rate, respiratory rate, and EEG during both in-person and video-based dialogues. Our results show that virtual communication significantly reduces movement and gaze dynamics, particularly in horizontal eye movements and lateral head motion, reflecting both sender- and receiver-side constraints. These physical limitations likely stem from the need to remain within the camera frame and the restricted access to nonverbal cues. Pupil dilation was significantly greater during in-person conversations, consistent with increased arousal during natural communication. Heart rate and EEG trends similarly suggested heightened engagement in face-to-face settings, though interpretation of EEG was limited by movement artifacts. Together, the findings highlight how virtual platforms alter embodied interaction, underscoring the need to address both mobility and visual access in future communication technologies to better support co-presence.
Keywords:
video mediated communication
; biomedical sensors
; human computer interaction
1. Introduction
The growth of virtual communication has led to a sharp increase in the use of virtual meetings in both professional and personal settings [1,2,3]. The COVID-19 pandemic played a major role in this shift [4,5], accelerating development of improved virtual meeting tools, faster and more reliable internet [6], lower travel costs and in some contexts, evidence of increased productivity when travel has been replaced by online meetings [7,8,9], increasing opportunities to collaborate remotely with international teams [3]. Many employees also prefer remote work, partly due to a stronger focus on work-life balance (2025 was the first year this was rated more important than job security [10]) and partly due to a growing concern for the environment in terms of reducing carbon emissions from transportation [11]. In addition to its workplace benefits, virtual communication promotes accessibility and inclusion, especially for individuals with disabilities or neurodivergent conditions [12]. It also offers greater flexibility and convenience compared to in-person meetings [13]. Moreover, certain features are unique to virtual platforms, such as the ability to record conversations for later review.
Despite its benefits, virtual communication also presents challenges that have also been shown to limit its effectiveness compared to in-person interaction. Evidence suggests there are several disadvantages of virtual meetings including: lower group cohesion and reduced satisfaction with how interactions unfold [14,15]; a weaker sense of social presence and increased feelings of isolation due to reduced contact with colleagues [15,16,17]; and greater emotional fatigue caused by longer working hours, plus the expectation to be constantly available [18]. Trust between participants can also be harder to establish virtually, as research repeatedly has shown trust often develops more naturally in face-to-face settings [14,15]. Some users also report increased anxiety from seeing their own face presented during calls [19,20] or struggle with information overload [21]. These experiences are often referred to collectively as "Zoom fatigue", a form of exhaustion specific to video conferencing [22,23]. Technical issues can further contribute to this phenomenon, particularly in non-professional or everyday environments where users may lack specialized support. Common problems include unstable internet connections, poor audio or video quality, and persistent concerns about privacy and data security [24]. Importantly, these effects are not uniformly experienced across users, complicating the design of universally effective interfaces. While average patterns can be identified, individual responses to remote communication vary widely. For instance, employees with negative perceptions of workplace relationships may be more likely to prefer remote interaction [25].
Although improvements in video and audio technology have addressed some of these issues, current approaches still fall short of replicating the experiences of in-person communication.
1.1. Differences Between In-Person and Virtual Conversation
When two persons engage in a conversation, they do more than simply exchange words. People coordinate on multiple levels, forming a dynamic, self-organizing system influenced by interpersonal synergy, where meaning arises through complementary and context-sensitive interactions tailored to the situation [26]. During dialogues, participants often synchronize (or mirror) physical behaviors such as body and head motions [27], eye movements [28], and breathing patterns [29]. This coordination signals affiliation and rapport, and additionally enhances communication effectiveness, learning, and social connection [30]. Comparable forms of interpersonal synchrony have also been observed in physiological signals such as heart rate (HR) [31] and galvanic skin response (GSR) [32], as well as in neural activity measured through techniques like electroencephalography (EEG) [33] and functional near-infrared spectroscopy (fNIRS) [34], using a method known as hyperscanning, where brain activity from multiple individuals is recorded simultaneously.
From this overview, we can readily see that current predominantly video-mediated, virtual communication lacks several key components of in-person interaction. Perhaps the most widely explored is that, in face-to-face settings, individuals shift their gaze across the face, hands, and body of their conversation partner [35], using a wide range of non-verbal signals, such as gestures and eye contact, to enrich and guide communication [36,37]. Video calls, in contrast, narrow the visual field of view and disrupt natural eye contact due to camera placement. This narrowing reduces gesture visibility and impairs turn-taking and expression clarity. This has been shown to contribute to lower movement synchrony online [38]. Facial expressiveness is also affected, though this varies across individuals [39]. Physical constraints during virtual meetings can also reduce mobility, which may negatively affect cognitive functioning and communication quality [22,40]. Subjective reports also show that arousal levels are significantly lower during virtual communication [41]. Additionally, a recent study found that making hand gestures visible during online meetings led to more positive participant feedback [42], suggesting that enhancing nonverbal cues may help compensate for some of the limitations of virtual interaction. While both the sender and receiver are affected by the aforementioned factors, the primary burden appears to lie with the receiver, who faces reduced access to essential communicative cues [43,44,45,46].
These issues also seem to be reflected in physiological differences between in person and online communication. Such physiological studies comparing in-person and virtual communication, however, remain limited. One reason for this limitation may be that the technologies available to detect biological signals, not least brain signals, are subject to motion artifacts, the unwanted signals caused by movement and muscle activity induced during natural conversation, from change in facial expression to head nodding, or body repositioning. These artifacts distort measurements making it difficult to isolate clean physiological signals particularly in naturalistic experimental settings. Nonetheless, existing evidence suggests that virtual interactions are associated with reduced brain synchrony between participants [22,33] and diminished physiological responses such as less pupil dilation when viewing faces [47]. In studies that use listening to mitigate head / muscular movement, where in person and video lectures are compared, research has shown an increase in frontal theta activity during virtual meetings that indicated fatigue and decreased levels of alpha activity in the parietal and occipital region that indicated lower levels of engagement. In addition, there is a decrease in heart rate variability (HRV), which again indicates stress or fatigue[48]. Higher HRV has been linked to better subjective conversation quality in face-to-face settings [49]. In contrast, a separate study that used text-based communication to avoid movement-related artifacts found no statistically significant differences in HR or GSR between in-person and virtual conditions, although both measures showed a trend toward higher values in the face-to-face setting [41]. Similarly, GSR responses to eye contact were found to be reduced during virtual meetings [50].
Overall, in-person communication tends to evoke stronger physiological and behavioral responses and greater interpersonal synchrony. In contrast, virtual settings tend to reduce these effects, likely due to limited access to spatial and nonverbal cues, leading to lower emotional engagement, arousal, connection, and trust.
1.2. Contributions of This Study
Despite widespread reports of qualitative differences between virtual and face-to-face interaction—such as reduced connection, awkward turn-taking, and increased fatigue, the underlying behavioral and physiological mechanisms remain poorly understood. Existing studies have examined isolated aspects of conversation, including face viewing [47,50], text-based chat [41], or lecture-based video conferencing [48]. However, these approaches typically use artificial or constrained tasks and focus on a single signal type, limiting their relevance to natural social interaction. To move beyond these limitations, we investigated how both behavioral and physiological signals differ across communication modalities during unscripted, face-to-face style conversations.
Our motivating hypothesis is that by better understanding the physiological and behavioural differences between in person and digitally mediated communication, we can design better digitally mediated interactions informed by those models to enhance the sense of co-presence—the feeling of being physically together. We anticipate that such models that can be translated into interaction designs will help virtual meetings better support natural dynamics, with potential benefits for user experience, trust, collaboration, and sustainability. Because interaction is shaped by complex and interdependent behavioral and physiological processes, we argue that modifying a single variable (e.g., heart rate) is unlikely to meaningfully improve co-presence. Instead, we hypothesise that mapping multiple biosignals can reveal patterns shaped by latent interaction constraints, offering more effective targets for future design interventions.
The key contributions of this work are:
- Integrated behavioral and physiological analysis: We simultaneously recorded diverse physiological and behavioral signals—including eye tracking, head and body movement, heart rate, respiratory rate, and EEG—enabling a comprehensive analysis of how communication modality influences embodied and neural responses.
- Unscripted, high-validity interaction: Unlike prior studies our design involved unstructured, dyadic conversation to more closely approximate real social encounters.
- Sender vs. receiver-side differentiation: We interpret physiological and behavioral changes through the lens of both sender and receiver constraints, identifying which limitations of virtual platforms most affect interaction quality—and where design interventions could be most impactful.
2. Materials and Methods
Participants were recruited from staff and students at the University of Southampton and provided written informed consent in accordance with the University of Southampton’s ethical guidelines and the Declaration of Helsinki. Ethical approval was granted by the University’s ethics committee in December 2023 (ERGO Application ID: 89571). Recruitment took place between 1.4.2024 and 1.7.2024. Each experimental session lasted roughly 90 minutes including preparation time. Eighteen participants (14 Male, Mean Age 34.8 STD 9.9) enrolled in this study and each received 20 GBP in compensation.
2.1. Experimental Task
The experimental protocol was an adapted version of a study by McFarland et al. [29] where respiratory markers during conversation were investigated. All stimuli (Texts, Videos) were selected so that they did not illicit any strong emotion to avoid contamination of unintended biomedical signals. For our version we defined the following tasks:
-
Baselines, each 2 minutes: These trials were used to familiarize the participant with the new laboratory environment and the experimental task. It was also used to record signals without interaction with another person.
- –
- Passive Baseline: The participant sat still and focused on the fixation cross on the screen.
- –
- Watch and Listen Baseline: The participant watched a video. We used the first 2 minutes from Huberman Lab Clip’s youtube channel with the title “How to Properly Hydrate & How Much Water to Drink Each Day | Dr. Andrew Huberman". We picked this video because the creator talks directly to the listener, imitating a one-sided conversation.
- –
- Read Baseline: The participant read a text aloud after familiarizing themselves with it. We have used the text “Kombat Kate" from the Cambridge English Assessment Example.
- –
- Free Talk Baseline: The participant talked about a topic of their choice without any restrictions.
-
Dialogue, 5 minutes each: The dialogues took place between an experimenter and the participant, either in-person or virtually. The order of these two conditions alternated for each participant to avoid any temporal effects and always started with the reading task followed by free talk.
- –
- In-person Dialogue Reading: For this condition, we used ChatGPT to generate a simple dialogue between two people. While the text had sections of varying lengths for each speaker, the overall length was approximately the same for both, aiming to simulate a realistic conversation with balanced talking and listening parts. For this condition the participant read the dialogue off their smart phone while trying to maintain eye contact with the experimenter when listening.
- –
- In-person Dialogue Free Talk: For this condition, participants were asked to choose a topic they are familiar with, one that is common enough for the experimenter to ask questions and share their own opinions. The goal for the conversation was again to have approximately equal speaking time for both the participant and the experimenter.
- –
- Virtual Dialogue Reading: For this condition we have used the same text from above but switched the roles in the dialogue. For this task the experimenter left the room and the talk was performed online using Zoom. For this condition the participant read the dialogue off their smart phone as above.
- –
- Virtual Dialogue Free Talk: Same as In-person Dialogue Free Talk with a different topic and using Zoom.
- Anxiety, 5 minutes: The final task was an adapted version of the InterneT-based Stress Test for Social Anxiety Disorder (ITSSAD) by Huneke et al. [51]. Participants were told they would have five minutes to prepare for an online social interaction in which they would have to introduce themselves to a group of researchers. Simply informing participants about the upcoming interview has been shown to increase anxiety, so we did not conduct the full protocol for this pilot. After the five minutes had passed, participants were debriefed and informed that the task was designed to induce elevated levels of social anxiety without the actual interview. Then the experiment was finished.
The whole task is also visualized in Figure 1.
2.2. Experimental Procedure
Participants were sat comfortably while connected to 27-electrode EEG, 2-electrode electrocardiogram (ECG), 2-electrode galvanic skin response (GSR) and 4-electrode electrooculogram (EOG) using BrainProducts’ “actiChamp plus" system. We used a MindMedia’s “Nexus" respiration sensor with a custom connector to record respiratory rate, Pupil Lab’s “Neon" to track eye movements, pupil size, head acceleration, angular velocity and orientation, Blue Microphones’ “Blue Yeti" to record audio and used an ELP webcam model USBFHD01M-SFV to record video. EEG, ECG, EOG, GSR and respiratory rate were sampled at 500 Hz, eye tracking and pupil size at 200 Hz, head acceleration, angular velocity and orientation at 110 Hz, audio at 48 kHz, and video at 30 Hz. All signals were synchronized using LabStreamingLayer [52]. We do not describe video and audio further in the present paper since this analysis focuses on biosignals.
As part of the “ActiChamp" system, “ActiCap" slim wet electrodes were placed at positions FP1, F7, Fz, F3, FC5, T7, C3, Cz, TP9, CP1, P7, CP5, P3, O1, FP2, F8, F4, FC6, T8, C4, CP2, TP10, P8, CP6, P4, Pz and O2 according to the International 10-20 system [53]. Two EOG electrodes were placed above (FP2) and below the right eye to capture the vertical eye movement signal as well as two near the canthus of each eye for the horizontal signal. Two electrodes were placed at the insides of the elbow to get the ECG signal. Two GSR electrodes were placed on index and middle finger of the participants’ non-dominant hand to get the GSR signal.
2.2.1. Data Recording Adjustments
Data analyses were adjusted based on signal quality and participant behavior as noted below.
- Exclusion of GSR: GSR data were discarded due to participant interference. Some individuals unintentionally interacted with the sensors during dialogue conditions, contaminating the data.
- Exclusion of EEG: EEG data were excluded due to motion artifacts caused by head movements, facial expressions, and muscle activity, which compromised signal integrity. However, minor power variations in the motor cortex suggested potential hand movements. To address this, video recordings were reviewed, and hand movements were documented. The EEG analysis is included in the Appendix A.
- Exclusion of Head Orientation: Head orientation was not analyzed because participant positioning differed between the virtual and in-person conditions.
- Inclusion of Hand Movements: Observed brain activity suggested the need to track hand movements as demonstrated in the Appendix A. Only complete hand or arm movements were considered to avoid confounds from sensor interference. Hand movements were manually annotated from video recordings at a 1 Hz resolution.
- Exclusion of Audio and Video: Audio and video data were not analyzed, as the focus remained on biosignal and behavioral processing.
2.2.2. Pre-Processing
A large dataset of physiological signals was recorded. Therefore, preprocessing and feature extraction focused on measures that either demonstrated statistical differences or were previously associated with human interaction in the literature. Given the study’s emphasis on interaction, analysis was limited to the dialogue conditions “Reading" and “Free Talk", and baselines were excluded. Results from the anxiety condition are presented in a different publication [54]. The following section describes the pre-processing steps for each of the selected signals. All filtering procedures utilized zero-phase filters to preserve temporal relationships.
- ECG: The ECG signal was derived by subtracting both ECG electrodes and applying a band-pass filter (2–30 Hz). This was used to compute HR and HRV.
- Pupil Size: The pupil size signal was low-pass filtered at 50 Hz.
- Head Movements: Data from the 9-degree of freedom (DOF) inertial measurement unit (IMU), angular velocity and acceleration in three axes each, were low-pass filtered at 50 Hz.
- Eye Tracking: Gaze position signals were low-pass filtered at 50 Hz.
- Hand Movements: The manually recorded hand movements were used without any pre-processing.
- Respiratory Signal: A band-pass filter (0.1–0.5 Hz) was applied to the respiratory signal.
Since electrophysiological, hand motion and gyroscope signals were recorded using different devices, precise synchronization had to be ensured. Instead of relying on the native timestamps from each device, we used the timestamps provided by LSL and resampled each of the signals to 100 Hz. The data were then segmented into windows based on the task. Each window had a duration of 30 seconds, updated every 5 seconds, resulting in a total of 55 windows for each of the dialogue conditions.
2.2.3. Feature Extraction
- HR: HR was extracted using a peak detection algorithm applied to the normalized negative derivative of the ECG signal of each window.
- HRV: HRV was extracted by calculating the standard deviation of all HR peak-to-peak intervals and dividing it by the root mean square of the peak-to-peak intervals.
- Pupil Size: The trace of the pupil size is corrected that the first window starts at zero. This was done to ensure that the distance between participant and experimenter for each condition was not influencing the outcome of the analysis. Each window was then featured by its mean.
- Respiratory Rate: A peak detection algorithm was used to extract the respiratory rate from the normalized respiratory signal.
- Head Movements: The power spectral density (PSD) of each signal was computed using Welch’s method with 1 Hz frequency bins.
- Gaze Position: The Gaze Position was featured by it’s variance.
- Hand Movements: The hand movements were featured by it’s percentage of time the hands were in motion.
The reading condition required participants to alternate between reading from their phones and maintaining eye contact with their conversation partners. This task-driven behavior introduces movement patterns that do not reflect natural social interaction. As a result, all movement-related measures (hand, eye, and head movements) and pupil size were excluded from analysis in this condition.
3. Results
Below, we report results for physiological and behavioral measures recorded during the two conversational tasks, "read aloud" and "free talk," under both face-to-face and virtual conditions, as described in the Experimental Task section. The recorded measures included HR, HRV, respiratory rate, pupil size, hand movements, horizontal and vertical eye gaze variance, and the PSD of head movements. While HR, HRV, and respiratory rate were analyzed across both tasks, movement-related metrics (hand, eye, and head movements) and pupil size were only assessed during the free talk condition, as the reading task involved alternating gaze between reading of their phone and watching the conversation partner. EEG and GSR data were excluded due to muscle-related artifacts and unintentional interaction with the GSR sensor. However, minor power variations over the motor cortex indicated potential hand movement, which was further examined using video recordings. A detailed discussion of the EEG analysis and exclusion rationale is provided in the Appendix A.
Each biosignal modality was analyzed separately. The figures in the results section that display the biosignals follow a consistent format. The left panel shows the time course of the relevant physiological measure from 30 to 300 seconds. Yellow shaded areas indicate time intervals where statistically significant differences between the two groups were identified using a Wilcoxon rank-sum test. Due to the limited sample size in this pilot study, no correction for multiple comparisons was applied to the time series data. These results are intended to indicate where differences may occur and should be interpreted as exploratory, serving to identify potential time windows of interest for future, larger-scale studies. The right panel of each figure presents a boxplot summarizing the average of the analyzed measure across the full time window. It also includes the p-value for the difference between the groups over this interval, calculated using the same Wilcoxon rank-sum test. For the PSD analysis, significant frequency band differences were found for head movements. P-values were displayed corrected using the Benjamini-Hochberg procedure.
Figure 2 presents HR data for the reading and free talk tasks in both the virtual and in-person conditions. On average, HR was higher in the in-person condition compared to the virtual condition for both tasks. The difference was more pronounced during the free talk task but did not reach statistical significance in either case. At the start of both tasks, HR initially declined, a common effect observed in physiological studies. This decrease is likely due to the orienting response [55], which occurs when individuals react to a change in their environment with an initial state of heightened arousal before adaptation.
Figure 3 shows HRV which remained relatively stable throughout both tasks. Only at the end of the reading task a difference can be seen where the HRV for the virtual condition increases and for the in-person decreases. However, this variation did not meaningfully impact the overall measure, and no statistically significant differences were found.
Figure 4 depicts respiratory rate during both tasks. No significant differences were observed between the conditions. Unlike HR, respiratory rate initially increased, likely due to a transient elevation in breathing rate as participants began speaking. This suggests that participants did not start conversing immediately but required a brief adjustment period before engaging in speech.
The following measures will only present results for the free talk condition because of the interference of the reading task with the signal acquisition as mentioned above.
Figure 5 shows pupil size during the free talk task. After an initial rise from the zero baseline, pupil size remained larger in the in-person condition compared to the virtual condition. A brief drop for the in-person average occurred around 180 seconds, but overall, the increase was statistically significant.
Figure 6 displays the counted hand movements of participants during the free talk task based upon the detected brain activity. It can be seen that the hand movement during the in-person condition hand movements were happening more often especially at the beginning and the end of the task. However, these results do not show any statistical significance.
Figure 7 shows the variance of horizontal and vertical eye gaze positions during the free talk task. The horizontal gaze variance was significantly higher in the in-person condition throughout the task, indicating greater eye movement variability. In contrast, vertical gaze variance remained similar across conditions, with no significant differences. This pattern is further illustrated in Figure 8, which shows a scatter plot of average eye gaze positions for each window and participant. The ellipses represent the 95% confidence interval for each condition. The in-person condition shows a wider spread in average gaze position along the horizontal axis.
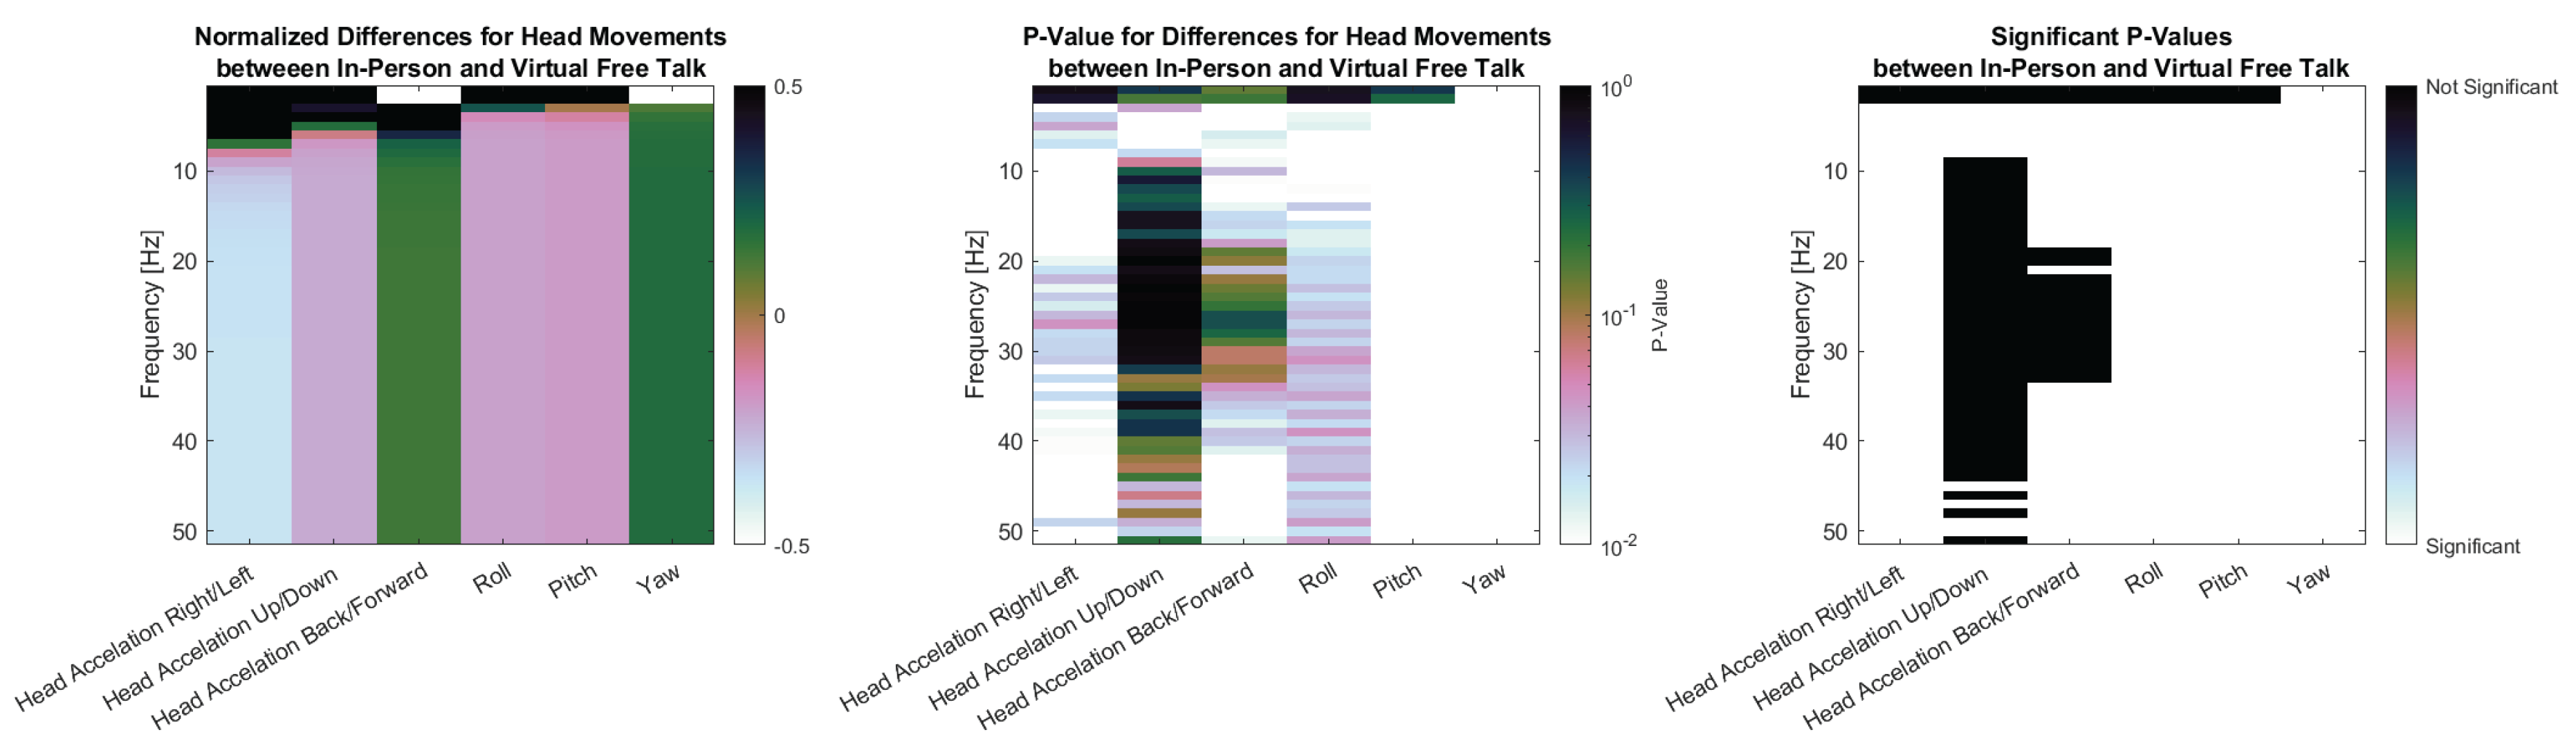
Finally, Figure 9 presents the PSD results for head movements in three subplots. The first plot shows the normalized difference in PSD between the in-person and virtual conditions during the free talk task.
Head acceleration in the right/left and up/down directions, look similar as they show larger power for the in-person condition for low frequency areas (up to 7 Hz and 5 Hz respectively) and then a lower power for higher frequencies. Head Acceleration Back/Forward shows the reverse with lower Power for 0-2 Hz and higher Power for higher Frequencies. The angular velocities show a similar pattern. Roll and Pitch show higher power for the in-person condition up to 2 Hz and lower power above, while Yaw show lower the exact opposite. The second plot displays the p-values for these differences, calculated using the Wilcoxon signed-rank test with Benjamini-Hochberg correction. The third plot highlights the significant p-values for easier identification. Nearly all signals showed significant differences, except for very low-frequency components of back/forward and Yaw (0 Hz), head acceleration in the up/down direction above 10 Hz, and head acceleration in the back/forward direction between 20 and 30 Hz.
Head acceleration in the right/left and up/down directions showed higher power in the in-person condition at lower frequencies (up to 7 Hz and 5 Hz, respectively), but lower power at higher frequencies. In contrast, back/forward acceleration displays the opposite pattern, with reduced power below 2 Hz and increased power at higher frequencies. A similar trend was observed in angular velocities. Roll and pitch showed greater power during in-person interaction up to 2 Hz, while yaw displays the reverse. The second plot presents the p-values from Wilcoxon signed-rank tests with Benjamini-Hochberg correction, and the third highlights statistically significant differences. Most frequency components revealed significant differences, with exceptions primarily at very low frequencies at 0 Hz, as well as high-frequency components above 10 Hz (up/down) and 20–30 Hz (back/forward).
4. Discussion
We found significantly larger pupil dilation and greater horizontal eye movement variance during in-person interactions. Head movements also differed significantly in PSDs for acceleration and angular velocity across all three axes. Head acceleration in right/left and up/down, as well as angular movement in roll and pitch, showed higher power in low-frequency components and lower power in high-frequency components for the face-to-face condition. Most of these components showed significant differences, except up/down acceleration at frequencies above 10 Hz and very low frequencies (0-1 Hz). Meanwhile, head acceleration in back/forward and angular velocity in yaw showed the opposite with lower non-significant power for very low frequencies (0–1 Hz) and higher power for frequencies above that. Although heart rate and hand movement levels were higher in-person, these differences were not statistically significant, and no effects were observed for heart rate variability or respiratory rate. Galvanic skin response and EEG spectral power data were excluded due to muscle and movement artifacts.
The physical constraints of virtual communication, such as reduced mobility and limited gesture visibility, likely contributed to the significantly lower eye movement levels observed [22,40], and may also explain the non-significant reduction in hand movements. The lack of significant vertical movement differences above 10 Hz is expected, as participants remained seated allowing only limited variation in body height. Participants in virtual settings also likely limited all larger movement to stay within the camera frame, which may have led them to compensate with smaller movements that produced more higher frequency changes.
In our study we found increased pupil dilation for the in-person condition, which aligns with prior research showing that arousal is higher during face-to-face interactions [41], and that increased arousal is associated with greater pupil size [56]. This also agrees with a study that showed increased pupil dilation when viewing faces in-person versus on screen [47]. That same study reported broader brain activation and larger event-related neural responses in the in-person condition, consistent with trends observed in our supplementary EEG data. However, due to our minimally restrictive, naturalistic setup, we cannot confidently attribute the observed effects solely to neural activity. Movements and facial expressions during conversation introduce electromyographic (EMG) artifacts: high amplitude, broadband signals that overlap with EEG frequencies and are difficult to fully remove without distorting the underlying brain signals [57]. Given that participants moved more during face-to-face interactions in our study and previous research has shown increased coordination in such settings, the resulting muscle-related artifacts, especially when movements are synchronized, could partly explain the higher EEG synchrony observed in previous studies on in-person communication [22,33]. We also observed a non-significant increase in heart rate in the in-person condition, which is consistent with previous findings [41], and might reflect both greater physical activity and heightened engagement and arousal typically associated with face-to-face interactions.
In contrast to previous findings, we did not observe significant HRV differences between in-person and virtual communication, possibly due to the short duration of our five-minute trials, compared to longer exposures in other studies (e.g., 50-minute lectures or multi-day recordings) [48,49]. Nevertheless, this result is consistent with our respiratory data, which also showed no differences between conditions, aligning with the known relationship between HRV and respiratory rate [58].
5. Conclusions
In summary, our results show mostly significant differences in the behavioral measures between in-person and virtual communication, indicating clear modality-dependent changes in how people interact. These differences cannot be primarily attributed to receiver-side limitations [43,44,45,46], such as reduced access to non-verbal cues due to restricted visual fields, limited gesture visibility, or disrupted eye contact caused by camera positioning. Instead, our findings also point to sender-side constraints: participants in virtual settings showed markedly reduced horizontal eye movement variance, head and body motion, particularly in lateral acceleration and angular momentum and a non-significant decrease in hand gestures. These patterns likely arise from the physical restrictions imposed by the virtual setup, such as the need to stay centered in the camera frame. Overall, virtual communication appears to constrain both the expression and perception of non-verbal behavior, potentially leading to a diminished sense of social connection.
Our findings emphasize that both sender and receiver constraints impact virtual communication, and addressing both is crucial for improving system interaction design. While virtual communication technologies are relatively new, these limitations—restricted sender movement and reduced receiver access to nonverbal cues—have been recognized since early telemedicine research [59]. Various strategies exist to mitigate these effects, such as removing or hiding the camera feedback to prevent distractions for the sender[39], or improving field of view to enhance gesture visibility for the receiver [60]. Revisiting and adapting these established approaches in light of current findings could help improve the quality and naturalness of virtual interactions.
Author Contributions
Conceptualization, C.T., N.H. and M.C.; methodology, C.T. and N.H.; software, C.T.; validation, C.T. and N.H.; formal analysis, C.T.; investigation, C.T. and D.H.; resources, C.T. and M.C.; data curation, C.T..; writing—original draft preparation, C.T. and M.C..; writing—review and editing, C.T., N.H., D.H. and M.C.; visualization, C.T. and N.H..; supervision, C.T. and M.C.; project administration, M.C.; funding acquisition, C.T., N.H. and M.C.
Funding
The authors would like to acknowledge the University of Southampton’s Researcher Development Concordat team for funding consumables in support of this study. The authors would also like to acknowledge the Web Science Institute Southampton that provided the funds for the experiment and equipment as part of an interdisciplinary pilot project scheme. This research is supported by UKRI/EPSRC Grants EP/T007656/1: Health Resilience Interactive Technologies and EP/R029563/1: AutoTrust.
Institutional Review Board Statement
The study was conducted in accordance with the Declaration of Helsinki, and approved by the Ethics Committee of the University of Southampton (December 2023, ERGO Application ID: 89571).
Informed Consent Statement
Informed consent was obtained from all subjects involved in the study.
Data Availability Statement
The original data presented in the study are openly available at https://eprints.soton.ac.uk/503817/.
Conflicts of Interest
The authors declare no conflicts of interest.
Abbreviations
The following abbreviations are used in this manuscript:
| HR | Heart Rate |
| GSR | Galvanic Skin Response |
| EEG | Electroencephalography |
| fNIRS | Functional Near-Infrared Spectroscopy |
| DOF | degree of freedom |
| IMU | Inertial Measurement Unit |
| HRV | Heart Rate Variablity |
| ITSSAD | InterneT-based Stress Test for Social Anxiety Disorder |
| ECG | Electrocardiogram |
| EOG | Electrooculogram |
| PSD | Power Spectral Density |
| EMG | Electromyography |
| STFT | Short-Time Fourier Transform |
Appendix A
This section outlines the preprocessing, feature extraction, and analysis steps for EEG data and explains why the observed results are likely driven by movement and muscle artifacts. Additionally, we justify the inclusion of hand movements as an additional measure.
EEG signals were recorded from 27 channels, referenced to the average of electrodes TP9 and TP10, resulting in a total of 25 channels. EOG signals were used for artifact removal. Vertical and horizontal EOG channels were derived by subtracting pairs of vertical and horizontal EOG electrodes, respectively. EEG data were filtered between 0.5 and 50 Hz, with an additional 50 Hz notch filter applied to remove power-line interference. Eye movement artifacts were mitigated using a linear regression model, where vertical and horizontal EOG signals were predicted from each EEG channel and subtracted [61]. This step was necessary to isolate brain activity from ocular artifacts. A common average reference filter [62] was then applied before computing the PSD using Welch’s method with 1 Hz frequency bins.
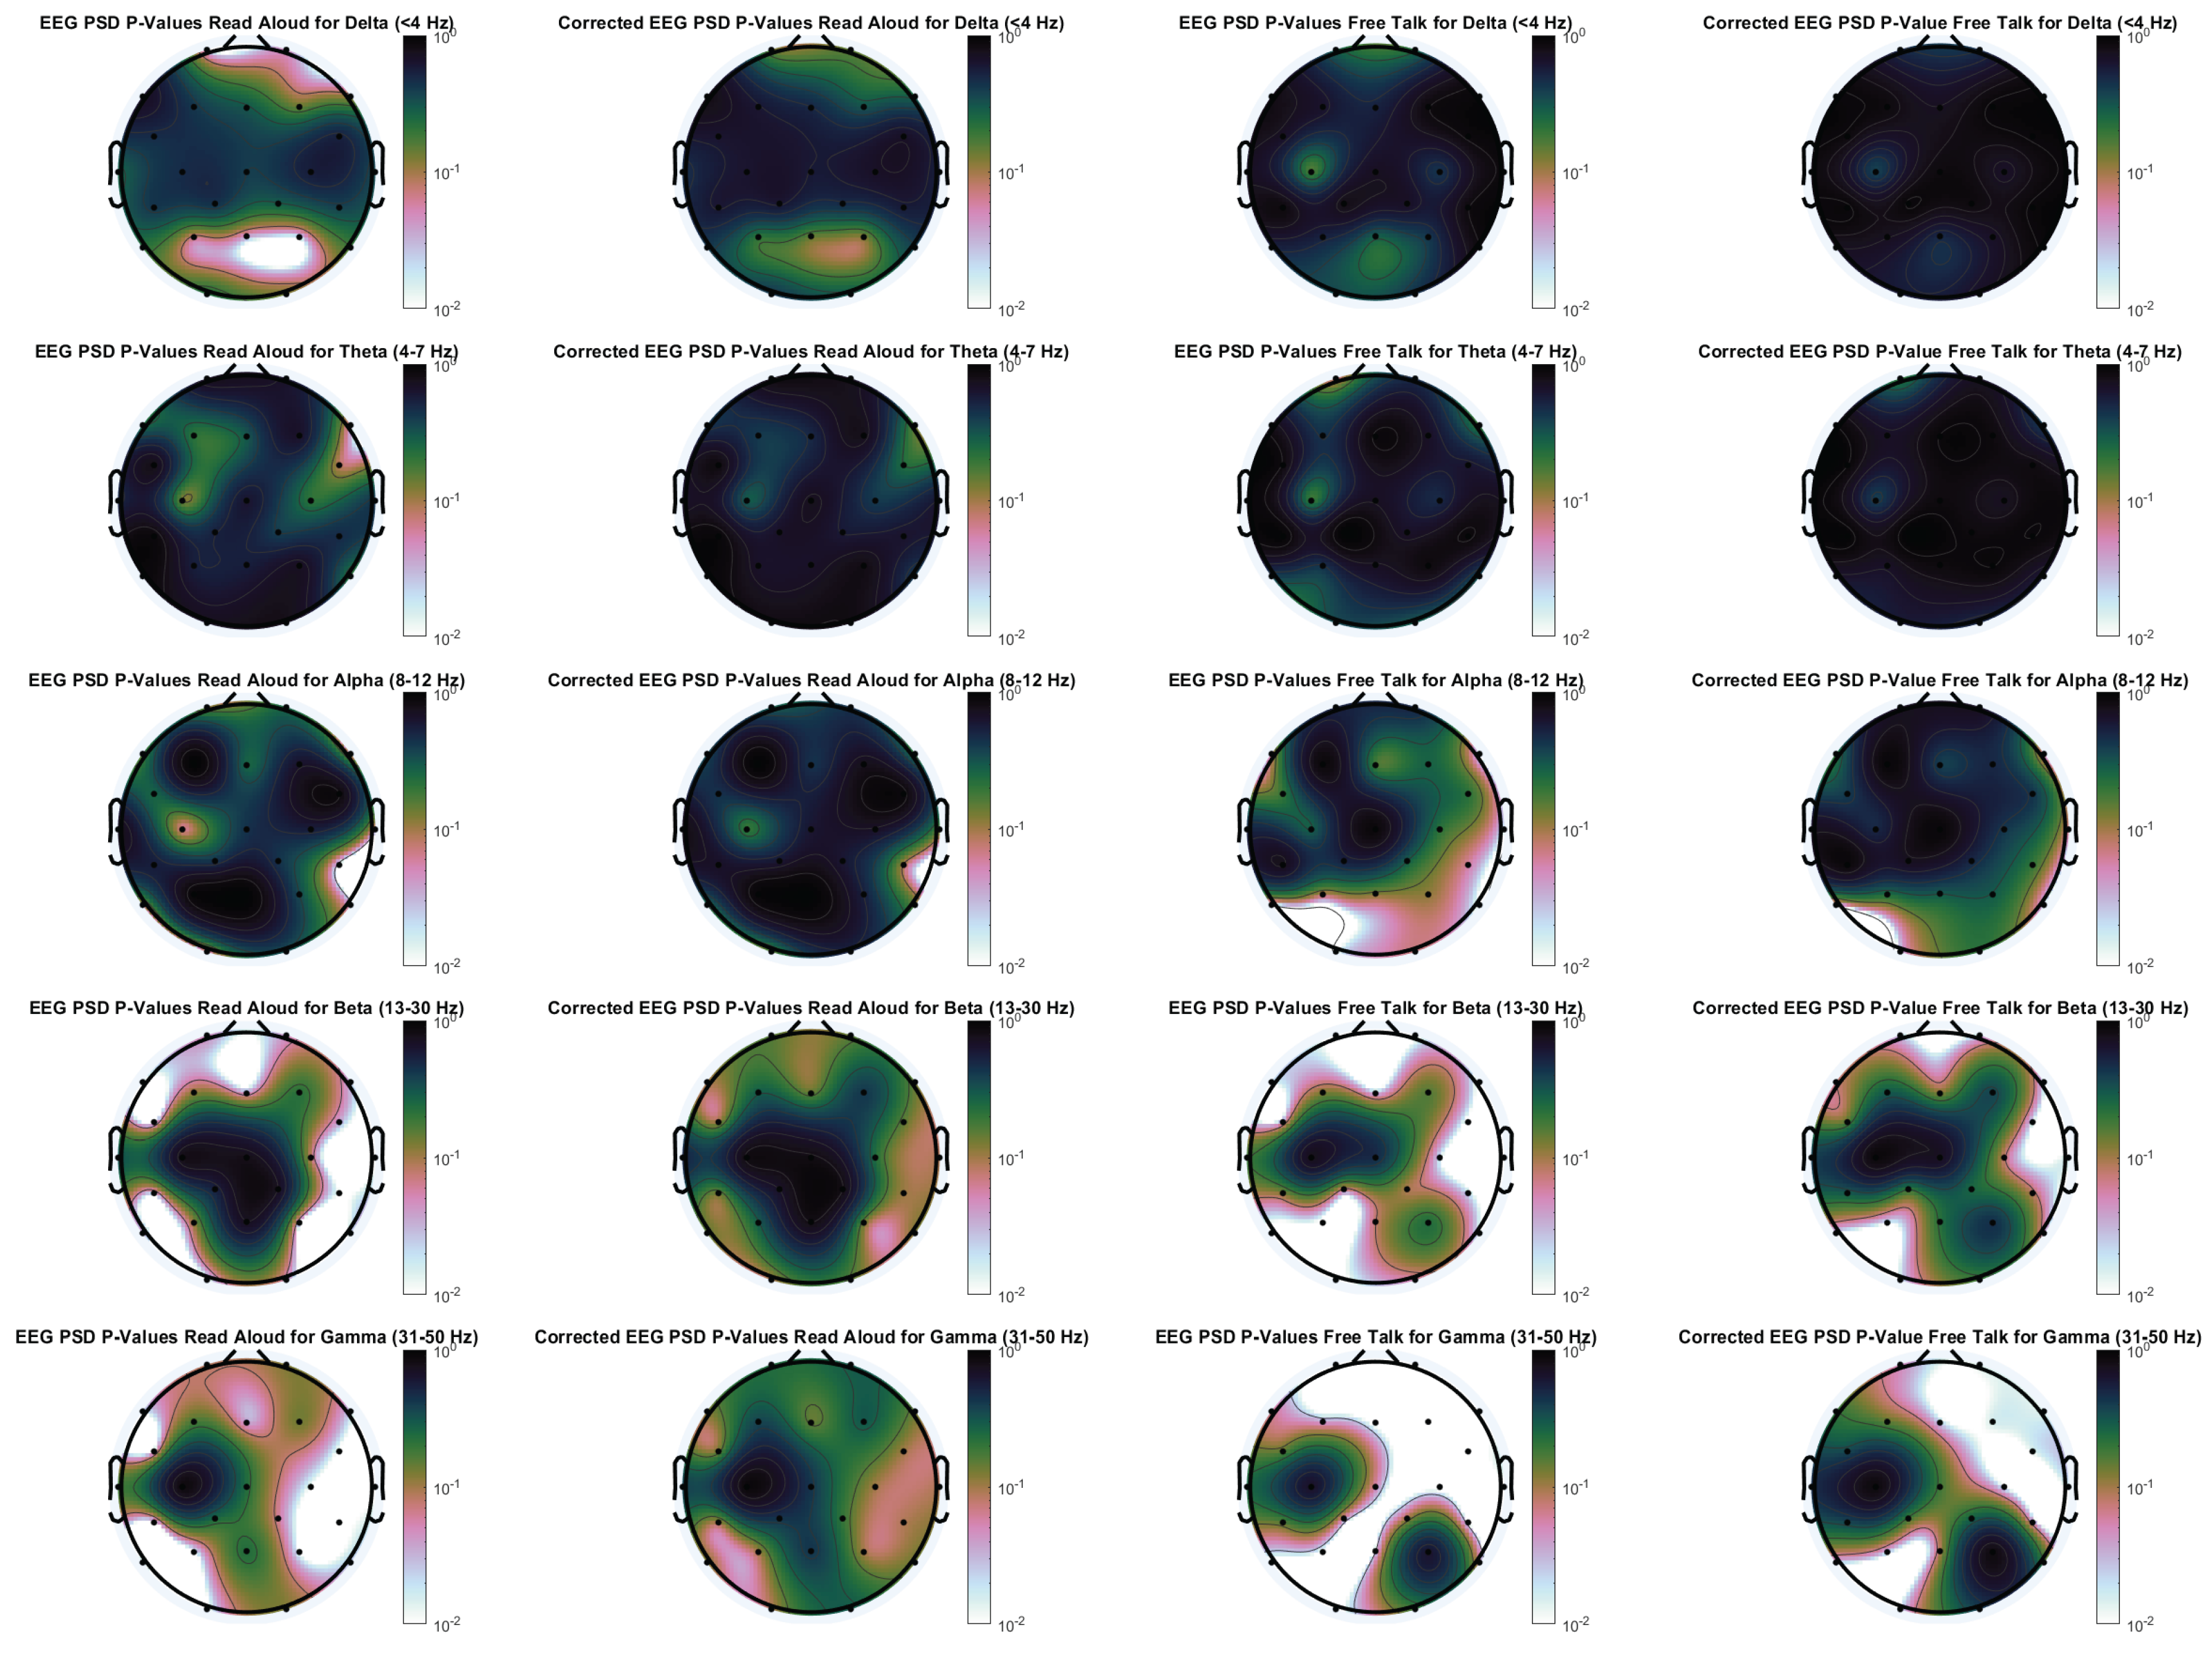
Figure A1 presents p-values for differences in EEG activity between the in-person and virtual conditions across both tasks, computed using a Wilcoxon signed-rank test with and without Benjamini-Hochberg correction. Using standard EEG processing as described above, significant differences were primarily observed in the beta and gamma frequency ranges, with some uncorrected significance in the delta range for the read aloud condition. Notably, after correction, the free talk task still showed significant differences, whereas the read aloud task no longer exhibited meaningful significance. However, these results should be interpreted with caution. Above 20 Hz, EMG activity tends to overwrite EEG recordings, making it likely that these differences reflect muscle rather than brain activity [63]. This interpretation aligns with our head and eye movement analysis (Figure 9 and Figure 8), which shows greater involuntary movement during the free talk task. Therefore, the observed EEG differences are more likely driven by muscle activity than by meaningful neural responses.
To assess the influence of muscle activity during the free talk and reading task, a denoising procedure analogous to the one used for EOG artifact correction was applied. Since the EEG analysis focused on PSD features, the time-domain EEG signals were first transformed into the frequency domain using a Short-Time Fourier Transform (STFT). Phase information was preserved, while the power spectrum was adjusted using a method similar to the time-domain EOG correction. Movement-related noise was predicted using data from the 9-DOF IMU-specifically, acceleration and angular velocity along three axes. These signals were segmented using the same window length and overlap as the EEG data. From each segment, the mean, variance, and PSD in 1 Hz frequency bins were computed. A linear regression model was then constructed to predict EEG power at each frequency band using all extracted movement features—mean, variance, and full-spectrum PSD—from the IMU signals. The predicted components were subtracted from the EEG power spectra to suppress contributions from muscle and movement artifacts. All movement signal frequencies were used to predict each EEG frequency, rather than matching frequencies directly. This approach was chosen to account for non-linear and cross-frequency relationships between movement and EEG activity, particularly in the higher frequency range where EMG contamination is most pronounced. Finally, the denoised power spectra, along with the preserved phase information, were used to reconstruct the cleaned EEG signal via inverse STFT.
Figure A1.
EEG power spectral density p-values for differences between in-person and virtual condition for the frequency bands delta, theta, alpha, beta and gamma for both tasks. The left side for each task is without false positive correction, while the right side uses a Benjamini-Hochberg correction.
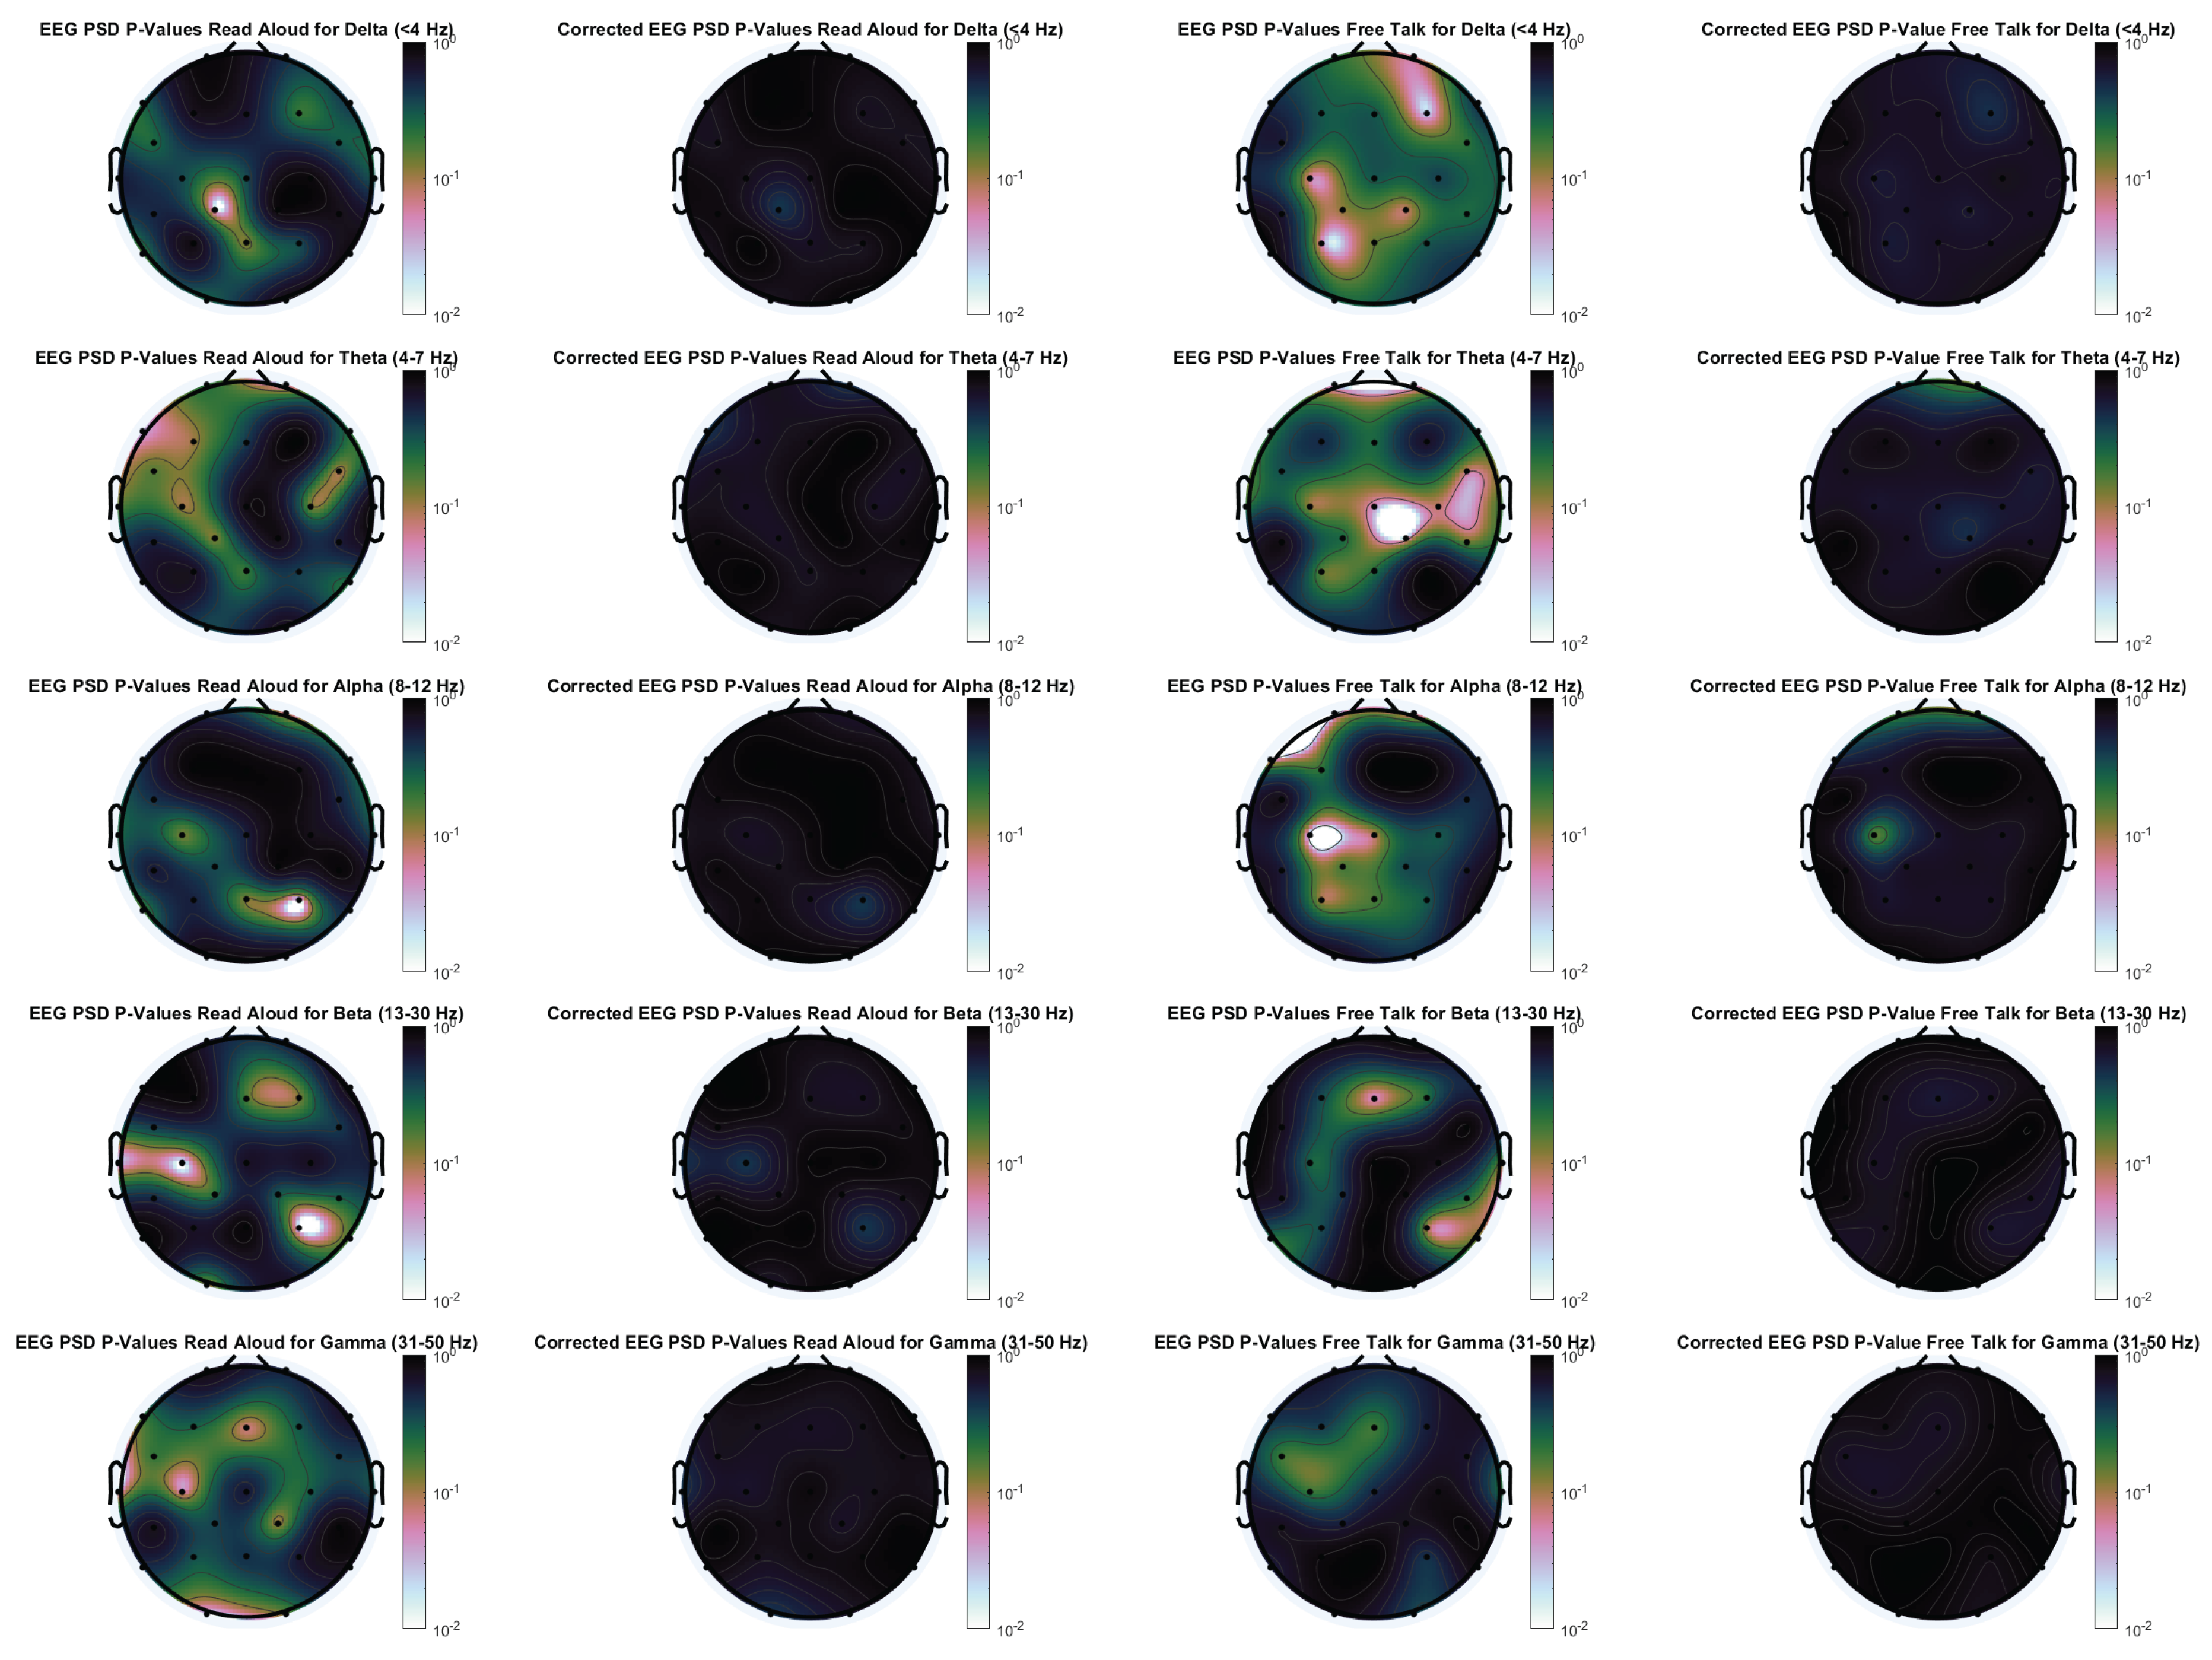
The results of the denoised PSDs are presented in Figure A2. After applying correction for multiple comparisons, no significant differences were observed across any channel or frequency band, highlighting the substantial influence of movement-related artifacts on the original EEG signals. Before correction, several channel-frequency combinations showed significant p-values; however, it remains unclear whether these reflect genuine neural activity or residual artifacts not fully eliminated by the denoising procedure. The only neural signal that could be reliably verified was increased alpha-band activity at electrode C3 for the free talk task. This corresponds to the left sensorimotor cortex and aligns with mu rhythm (9-11 Hz) activity, which is typically associated with motor processes such as right-hand movement. Given that the majority of participants were right-handed, hand movements were included as an additional behavioral measure in this study.
Figure A2.
Denoised EEG power spectral density p-values for differences between in-person and virtual condition for the frequency bands delta, theta, alpha, beta and gamma for both tasks. The left side for each task is without false positive correction, while the right side uses a Benjamini-Hochberg correction.
References
- Hill, N.S.; Axtell, C.; Raghuram, S.; Nurmi, N. Unpacking virtual work’s dual effects on employee well-being: An integrative review and future research agenda. Journal of Management 2024, 50, 752–792. [CrossRef]
- Raghuram, S.; Hill, N.S.; Gibbs, J.L.; Maruping, L.M. Virtual work: Bridging research clusters. Academy of Management Annals 2019, 13, 308–341. [CrossRef]
- Adamovic, M.; Gahan, P.; Olsen, J.; Gulyas, A.; Shallcross, D.; Mendoza, A. Exploring the Adoption of Virtual Work: The Role of Virtual Work Self-Efficacy and Virtual Work Climate. The International Journal of Human Resource Management 2022, 33, 3492–3525. [CrossRef]
- DeFilippis, E.; Impink, S.M.; Singell, M.; Polzer, J.T.; Sadun, R. The impact of COVID-19 on digital communication patterns. Humanities and Social Sciences Communications 2022, 9. [CrossRef]
- Wong, A.; Ho, S.; Olusanya, O.; Antonini, M.V.; Lyness, D. The use of social media and online communications in times of pandemic COVID-19. Journal of the Intensive Care Society 2021, 22, 255–260. [CrossRef]
- Jnr, B.A.; Noel, S. Examining the Adoption of Emergency Remote Teaching and Virtual Learning during and after COVID-19 Pandemic. International Journal of Educational Management 2021, 35, 1136–1150. [CrossRef]
- Hensher, D.A.; Wei, E.; Beck, MatthewJ.; Balbontin, C. The Impact of COVID-19 on Cost Outlays for Car and Public Transport Commuting - The Case of the Greater Sydney Metropolitan Area after Three Months of Restrictions. Transport Policy 2021, 101, 71–80. [CrossRef]
- Maritan, F.B.; Soliani, R.D.; Drumond, T.D.R.; Satrapa, H.F.D.M.; de Souza Oliveira, P.R.; de Lima Júnior, F.B.; da Silva Nora, L.A.R.; de Oliveira, G.C. Cost analysis in the transition of projects to remote work during the COVID-19 Pandemic. Revista de Gestão Social e Ambiental 2024, 18, 1–16.
- Pabilonia, S.W.; Vernon, V. Remote work, wages, and hours worked in the United States. Journal of Population Economics 2025, 38, 1–49. [CrossRef]
- randstad. workmonitor 2025 report. Randstad 2025. Accessed: 2025-06-05.
- Dabbous, A.; Horn, M.; Croutzet, A. Measuring environmental awareness: An analysis using google search data. Journal of Environmental Management 2023, 346, 118984. [CrossRef]
- Hersh, M.; Leporini, B.; Buzzi, M. A comparative study of disabled people’s experiences with the video conferencing tools Zoom, MS Teams, Google Meet and Skype. Behaviour & Information Technology 2024, 43, 3777–3796. [CrossRef]
- Brubaker, J.R.; Venolia, G.; Tang, J.C. Focusing on shared experiences: moving beyond the camera in video communication. In Proceedings of the Proceedings of the Designing Interactive Systems Conference, 2012, pp. 96–105. [CrossRef]
- Warkentin, M.E.; Sayeed, L.; Hightower, R. Virtual teams versus face-to-face teams: an exploratory study of a web-based conference system. Decision sciences 1997, 28, 975–996. [CrossRef]
- Tautz, D.C.; Schübbe, K.; Felfe, J. Working from home and its challenges for transformational and health-oriented leadership. Frontiers in psychology 2022, 13, 1017316. [CrossRef]
- Bentley, T.A.; Teo, S.T.; McLeod, L.; Tan, F.; Bosua, R.; Gloet, M. The role of organisational support in teleworker wellbeing: A socio-technical systems approach. Applied ergonomics 2016, 52, 207–215. [CrossRef]
- Kurland, N.B.; Cooper, C.D. Manager control and employee isolation in telecommuting environments. The Journal of High Technology Management Research 2002, 13, 107–126. [CrossRef]
- Lanaj, K.; Johnson, R.E.; Barnes, C.M. Beginning the workday yet already depleted? Consequences of late-night smartphone use and sleep. Organizational Behavior and Human Decision Processes 2014, 124, 11–23. [CrossRef]
- Lim, C.; Ratan, R.; Foxman, M.; Beyea, D.; Jeong, D.; Leith, A.P. Examining attitudes about the virtual workplace: Associations between zoom fatigue, impression management, and virtual meeting adoption intent. PloS one 2025, 20, e0312354. [CrossRef]
- Shin, S.Y.; Ulusoy, E.; Earle, K.; Bente, G.; Van Der Heide, B. The effects of self-viewing in video chat during interpersonal work conversations. Journal of Computer-Mediated Communication 2023, 28, zmac028. [CrossRef]
- Riedl, R. On the stress potential of videoconferencing: definition and root causes of Zoom fatigue. Electronic Markets 2022, 32, 153–177. [CrossRef]
- Bailenson, J.N. Nonverbal overload: A theoretical argument for the causes of Zoom fatigue. Technology, Mind and Behavior 2021. [CrossRef]
- Fauville, G.; Luo, M.; Queiroz, A.C.M.; Bailenson, J.N.; Hancock, J. Zoom exhaustion & fatigue scale. Computers in Human Behavior Reports 2021, 4, 100119. [CrossRef]
- Williams, D.; Ursu, M.F.; Meenowa, J.; Cesar, P.; Kegel, I.; Bergström, K. Video mediated social interaction between groups: System requirements and technology challenges. Telematics and Informatics 2011, 28, 251–270. [CrossRef]
- Collins, A.M.; Hislop, D.; Cartwright, S. Social support in the workplace between teleworkers, office-based colleagues and supervisors. New Technology, Work and Employment 2016, 31, 161–175. [CrossRef]
- Fusaroli, R.; Rączaszek-Leonardi, J.; Tylén, K. Dialog as interpersonal synergy. New Ideas in Psychology 2014, 32, 147–157. [CrossRef]
- Latif, N.; Barbosa, A.V.; Vatiokiotis-Bateson, E.; Castelhano, M.S.; Munhall, K. Movement coordination during conversation. PLoS one 2014, 9, e105036. [CrossRef]
- Richardson, D.C.; Dale, R.; Kirkham, N.Z. The art of conversation is coordination. Psychological science 2007, 18, 407–413. [CrossRef]
- McFarland, D.H. Respiratory markers of conversational interaction. Journal of speech, language, and hearing research 2001, 44, 128–143. [CrossRef]
- Bernieri, F.J. Coordinated movement and rapport in teacher-student interactions. Journal of Nonverbal behavior 1988, 12, 120–138. [CrossRef]
- Jensen, T.W. Emotion in languaging: languaging as affective, adaptive, and flexible behavior in social interaction. Frontiers in psychology 2014, 5, 720. [CrossRef]
- Slovák, P.; Tennent, P.; Reeves, S.; Fitzpatrick, G. Exploring skin conductance synchronisation in everyday interactions. In Proceedings of the Proceedings of the 8th nordic conference on human-computer interaction: Fun, fast, foundational, 2014, pp. 511–520. [CrossRef]
- Schwartz, L.; Levy, J.; Endevelt-Shapira, Y.; Djalovski, A.; Hayut, O.; Dumas, G.; Feldman, R. Technologically-assisted communication attenuates inter-brain synchrony. Neuroimage 2022, 264, 119677. [CrossRef]
- Wu, X.; Hao, Y.; Zhang, S.; Zhang, H.; Jiang, Y.; Chen, Y.; Zhang, Z. Love in the Time of Zoom: How Intimacy Modulates Brain and Behavior Synchrony in Face-to-Face vs. Video Communication. Social Cognitive And Affective Neuroscience 2025, p. nsaf070. [CrossRef]
- Hessels, R.S. How does gaze to faces support face-to-face interaction? A review and perspective. Psychonomic bulletin & review 2020, 27, 856–881. [CrossRef]
- Wagner, P.; Malisz, Z.; Kopp, S. Gesture and speech in interaction: An overview, 2014. [CrossRef]
- Knapp, M.L.; Hall, J.A.; Horgan, T.G. Nonverbal communication in human interaction; Vol. 1, Holt, Rinehart and Winston New York, 1978.
- Zubek, J.; Nagórska, E.; Komorowska-Mach, J.; Skowrońska, K.; Zieliński, K.; Rączaszek-Leonardi, J. Dynamics of remote communication: Movement coordination in video-mediated and face-to-face conversations. Entropy 2022, 24, 559. [CrossRef]
- Rollings, J.; Kavanagh, E.; Balabanova, A.; Keane, O.; Waller, B.M. Facial behaviour and first impressions in computer mediated communication. Computers in Human Behavior 2024, 161, 108391. [CrossRef]
- Oppezzo, M.; Schwartz, D.L. Give your ideas some legs: the positive effect of walking on creative thinking. Journal of experimental psychology: learning, memory, and cognition 2014, 40, 1142. [CrossRef]
- Shalom, J.G.; Israeli, H.; Markovitzky, O.; Lipsitz, J.D. Social anxiety and physiological arousal during computer mediated vs. face to face communication. Computers in Human Behavior 2015, 44, 202–208. [CrossRef]
- Hills, P.D.; Clavin, M.V.; Tufft, M.R.; Gobel, M.S.; Richardson, D.C. Video meeting signals: Experimental evidence for a technique to improve the experience of video conferencing. PloS one 2022, 17, e0270399. [CrossRef]
- Walther, J.B. Computer-mediated communication: Impersonal, interpersonal, and hyperpersonal interaction. Communication research 1996, 23, 3–43. [CrossRef]
- Kock, N. Media richness or media naturalness? The evolution of our biological communication apparatus and its influence on our behavior toward e-communication tools. IEEE transactions on professional communication 2005, 48, 117–130. [CrossRef]
- Derks, D.; Fischer, A.H.; Bos, A.E. The role of emotion in computer-mediated communication: A review. Computers in human behavior 2008, 24, 766–785. [CrossRef]
- Venter, E. Challenges for meaningful interpersonal communication in a digital era. HTS: Theological studies 2019, 75, 1–6.
- Zhao, N.; Zhang, X.; Noah, J.A.; Tiede, M.; Hirsch, J. Separable processes for live “in-person” and live “zoom-like” faces. Imaging Neuroscience 2023, 1, 1–17. [CrossRef]
- Riedl, R.; Kostoglou, K.; Wriessnegger, S.C.; Müller-Putz, G.R. Videoconference fatigue from a neurophysiological perspective: Experimental evidence based on electroencephalography (EEG) and electrocardiography (ECG). Scientific reports 2023, 13, 18371. [CrossRef]
- Mauersberger, H.; Tune, J.L.; Kastendieck, T.; Czarna, A.Z.; Hess, U. Higher heart rate variability predicts better affective interaction quality in non-intimate social interactions. Psychophysiology 2022, 59, e14084. [CrossRef]
- Hietanen, J.O.; Peltola, M.J.; Hietanen, J.K. Psychophysiological responses to eye contact in a live interaction and in video call. Psychophysiology 2020, 57, e13587. [CrossRef]
- Huneke, N.T.; Rowlatt, H.; Hyde, J.; McEwan, A.; Maryan, L.; Baldwin, D.S.; Garner, M. A novel procedure to investigate social anxiety using videoconferencing software: A proof-of-concept study. Psychiatry Research 2022, 316, 114770. [CrossRef]
- LabStreamingLayer. https://github.com/sccn/labstreaminglayer. Accessed: 2024-02-12.
- Sharbrough, F. American Electroencephalographic Society guidelines for standard electrode position nomenclature. Clin Neurophysiol 1991, 8, 200–202.
- Tremmel, C.; Huneke, N.; Hobson, D.; et al. Detection of Social Anxiety Using Multiple Simultaneous Biosignals: A Pilot Study. OSF Preprint 2025. [CrossRef]
- Bradley, M.M. Natural selective attention: Orienting and emotion. Psychophysiology 2009, 46, 1–11. [CrossRef]
- Wang, C.A.; Baird, T.; Huang, J.; Coutinho, J.D.; Brien, D.C.; Munoz, D.P. Arousal effects on pupil size, heart rate, and skin conductance in an emotional face task. Frontiers in neurology 2018, 9, 1029. [CrossRef]
- Chen, X.; Xu, X.; Liu, A.; Lee, S.; Chen, X.; Zhang, X.; McKeown, M.J.; Wang, Z.J. Removal of muscle artifacts from the EEG: A review and recommendations. IEEE Sensors Journal 2019, 19, 5353–5368. [CrossRef]
- Gąsior, J.S.; Sacha, J.; Jeleń, P.J.; Zieliński, J.; Przybylski, J. Heart rate and respiratory rate influence on heart rate variability repeatability: effects of the correction for the prevailing heart rate. Frontiers in physiology 2016, 7, 356. [CrossRef]
- Kiesler, S.; Siegel, J.; McGuire, T.W. Social psychological aspects of computer-mediated communication. American psychologist 1984, 39, 1123. [CrossRef]
- Du, H.; Chhatre, K.; Peters, C.; Keegan, B.; McDonnell, R.; Ennis, C. Synthetically Expressive: Evaluating gesture and voice for emotion and empathy in VR and 2D scenarios. arXiv preprint arXiv:2506.23777 2025. [CrossRef]
- Croft, R.J.; Barry, R.J. Removal of ocular artifact from the EEG: a review. Neurophysiologie Clinique/Clinical Neurophysiology 2000, 30, 5–19. [CrossRef]
- McFarland, D.J.; McCane, L.M.; David, S.V.; Wolpaw, J.R. Spatial filter selection for EEG-based communication. Electroencephalography and clinical Neurophysiology 1997, 103, 386–394. [CrossRef]
- Whitham, E.M.; Pope, K.J.; Fitzgibbon, S.P.; Lewis, T.; Clark, C.R.; Loveless, S.; Broberg, M.; Wallace, A.; DeLosAngeles, D.; Lillie, P.; et al. Scalp electrical recording during paralysis: quantitative evidence that EEG frequencies above 20 Hz are contaminated by EMG. Clinical neurophysiology 2007, 118, 1877–1888. [CrossRef]
Figure 1.
Flowchart of the experimental task.
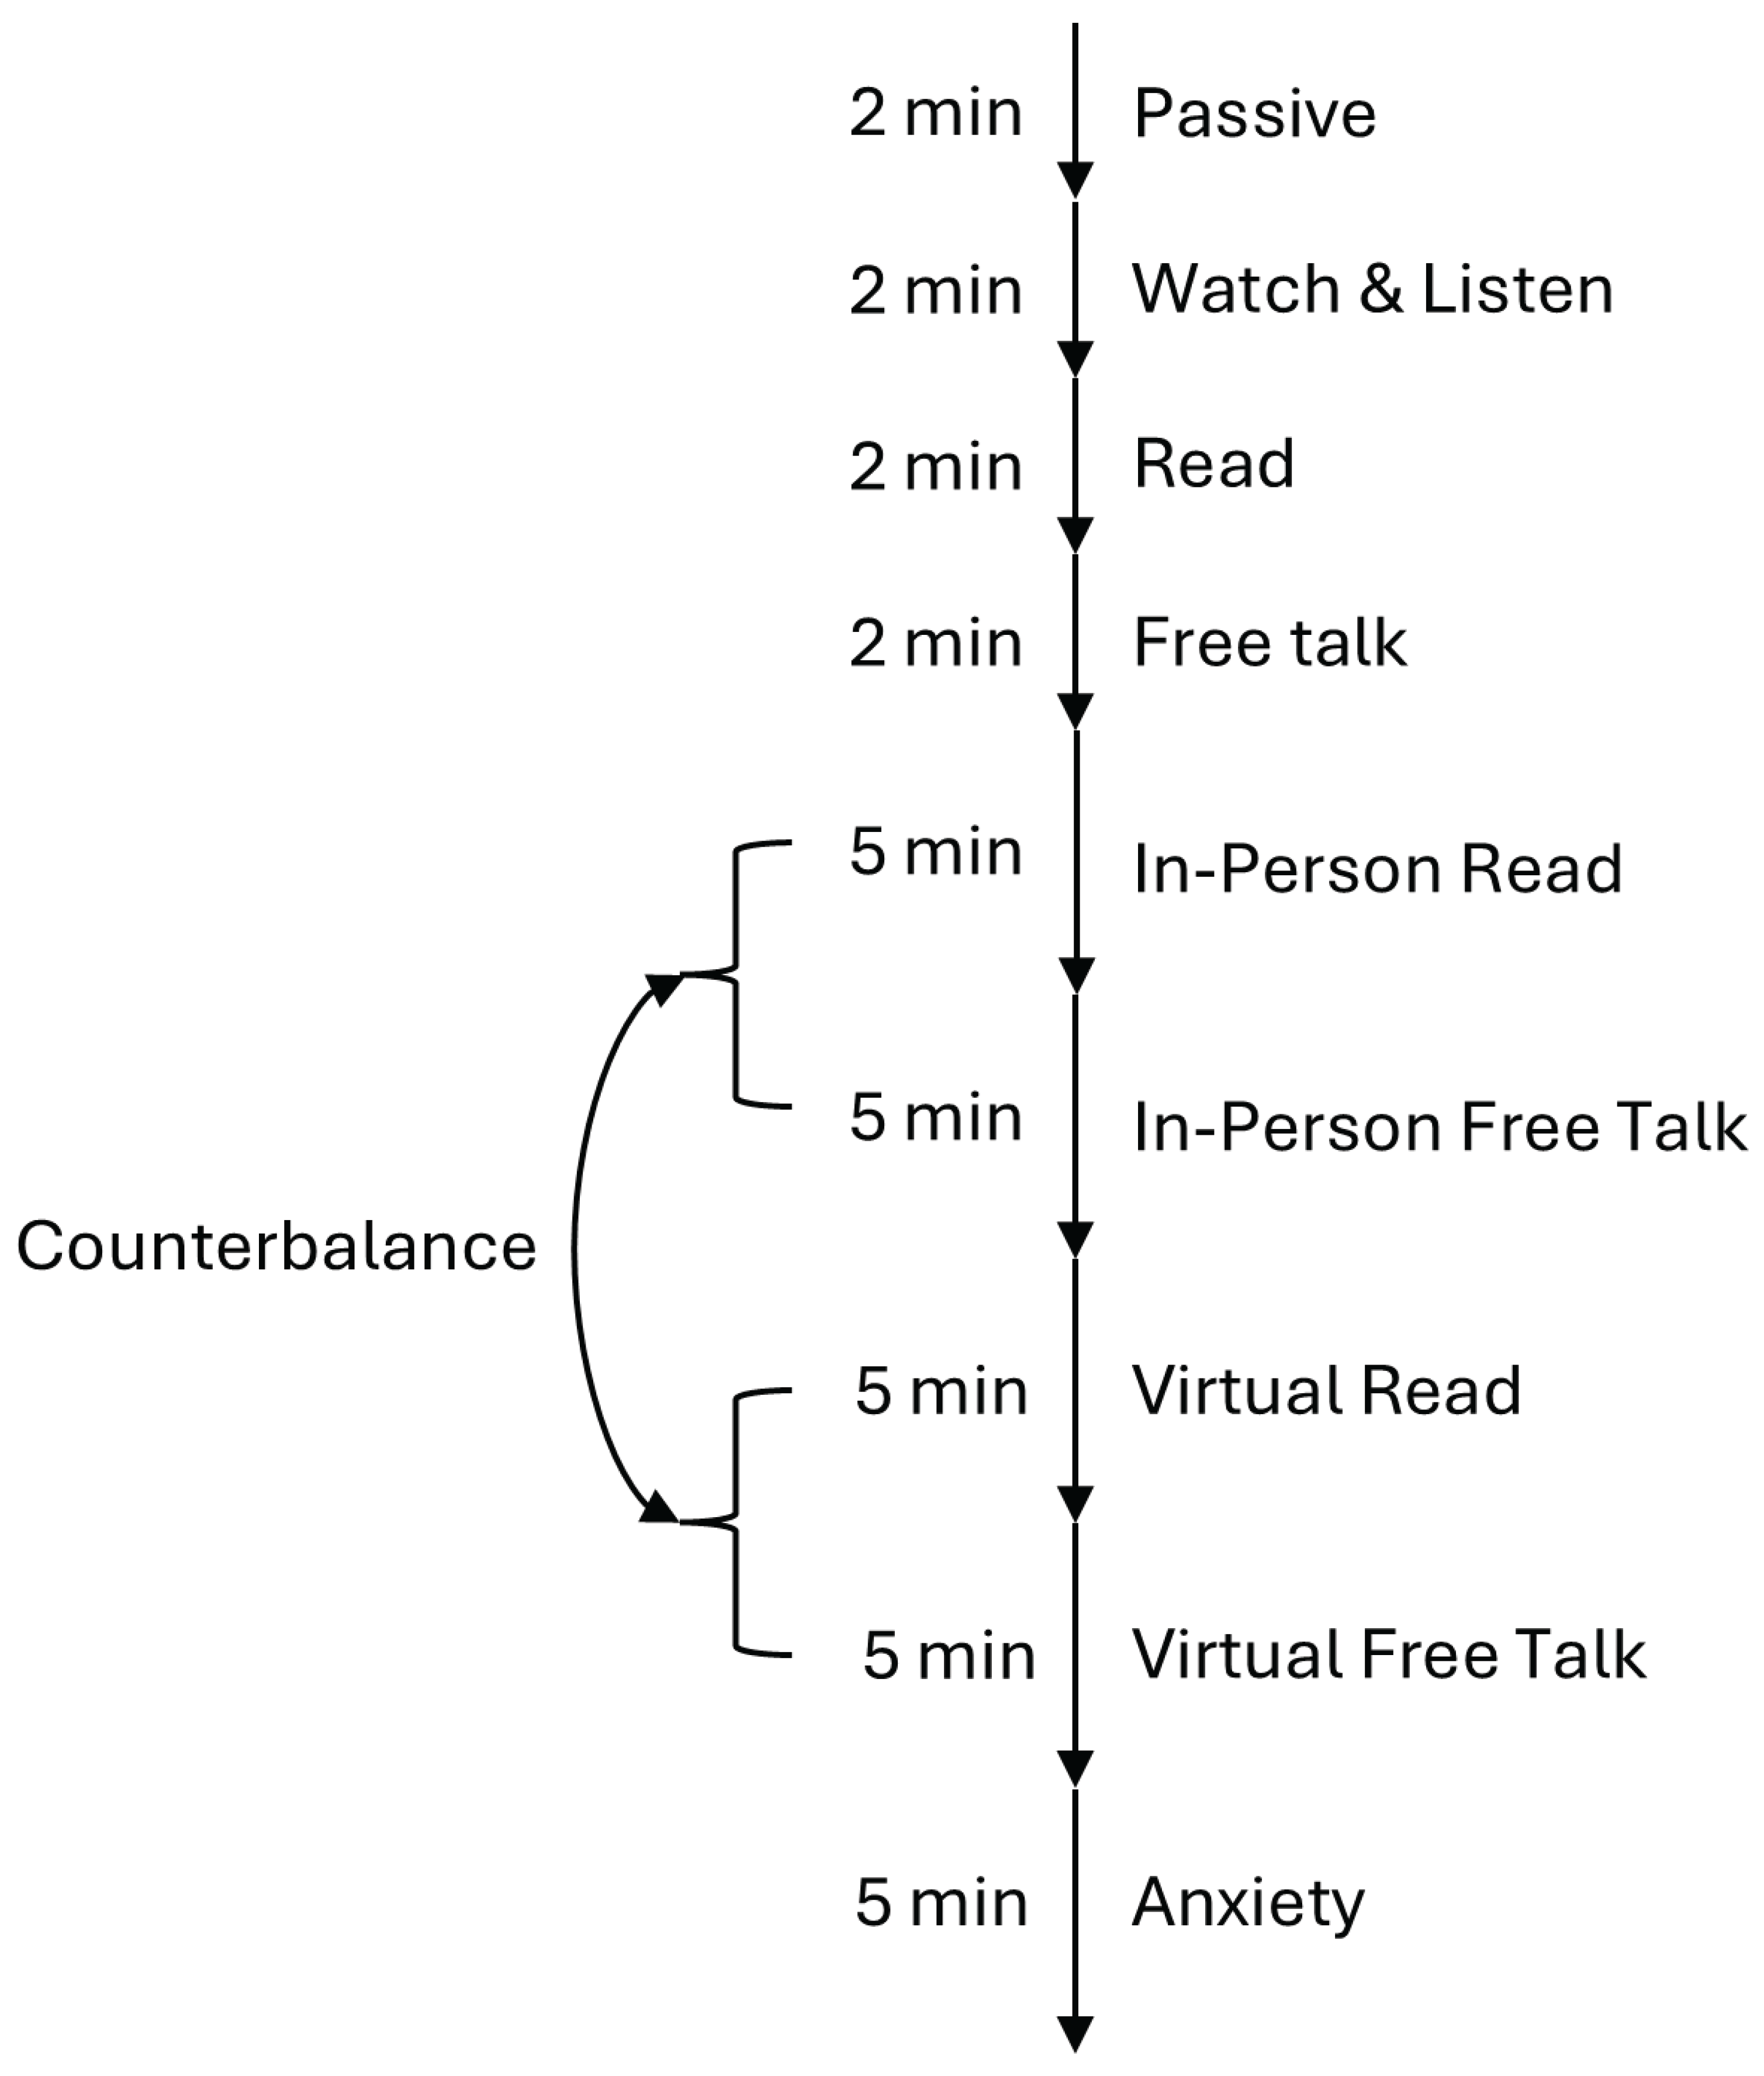
Figure 2.
Left side: Average Trace and standard deviation of heart rate during the reading and the free talk task. Right side: Box plot for heart rate averaged over each task for virtual and in-person condition with a p-value for a Wilcoxon sign-rank test.
Figure 2.
Left side: Average Trace and standard deviation of heart rate during the reading and the free talk task. Right side: Box plot for heart rate averaged over each task for virtual and in-person condition with a p-value for a Wilcoxon sign-rank test.
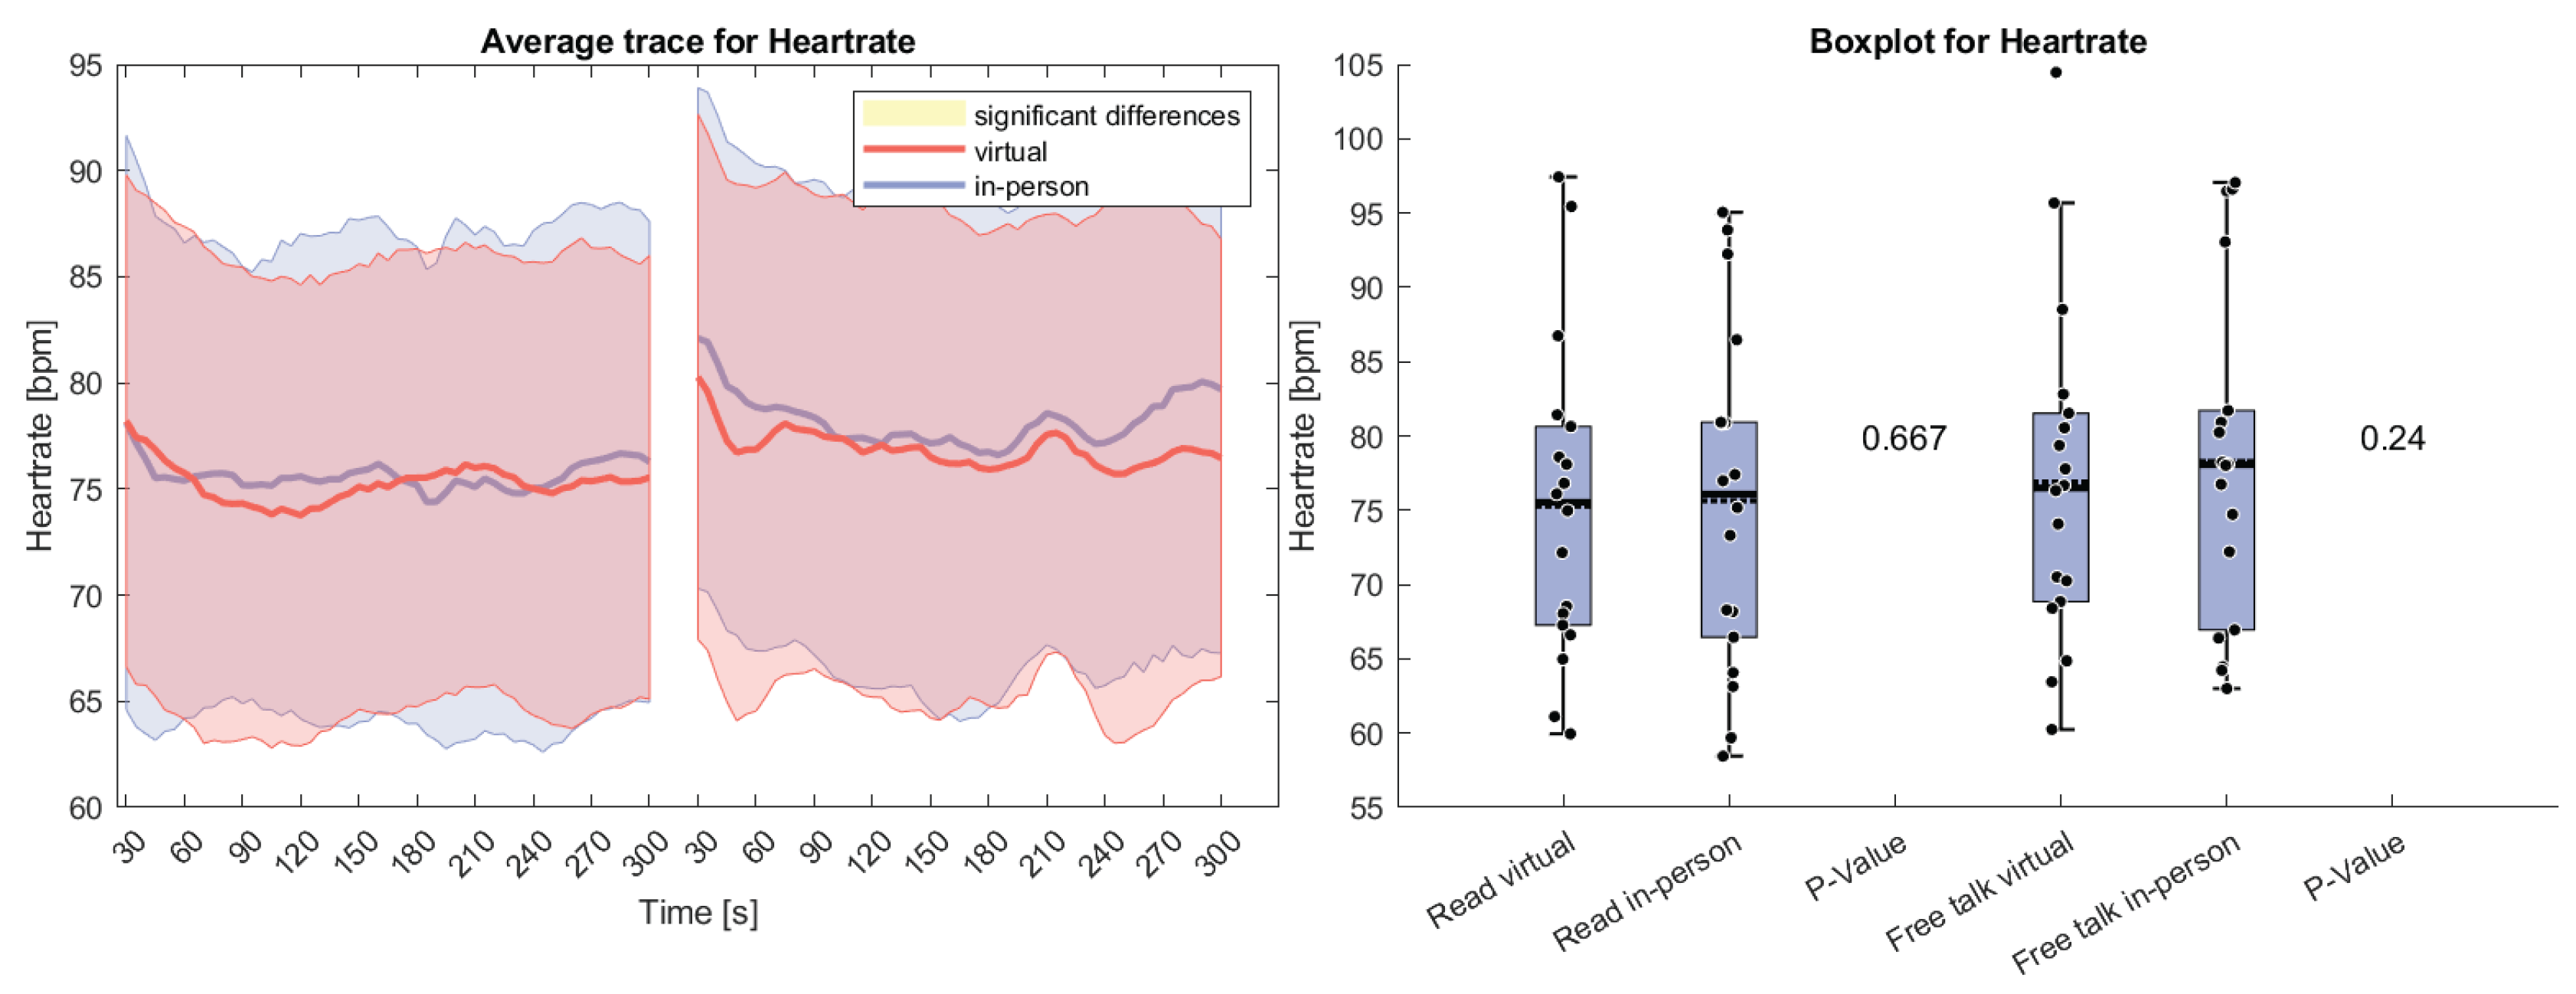
Figure 3.
Left side: Average Trace and standard deviation of heart rate variability during the reading and the free talk task. Right side: Box plot for heart rate variability averaged over each task for virtual and in-person condition with a p-value for a Wilcoxon sign-rank test.
Figure 3.
Left side: Average Trace and standard deviation of heart rate variability during the reading and the free talk task. Right side: Box plot for heart rate variability averaged over each task for virtual and in-person condition with a p-value for a Wilcoxon sign-rank test.
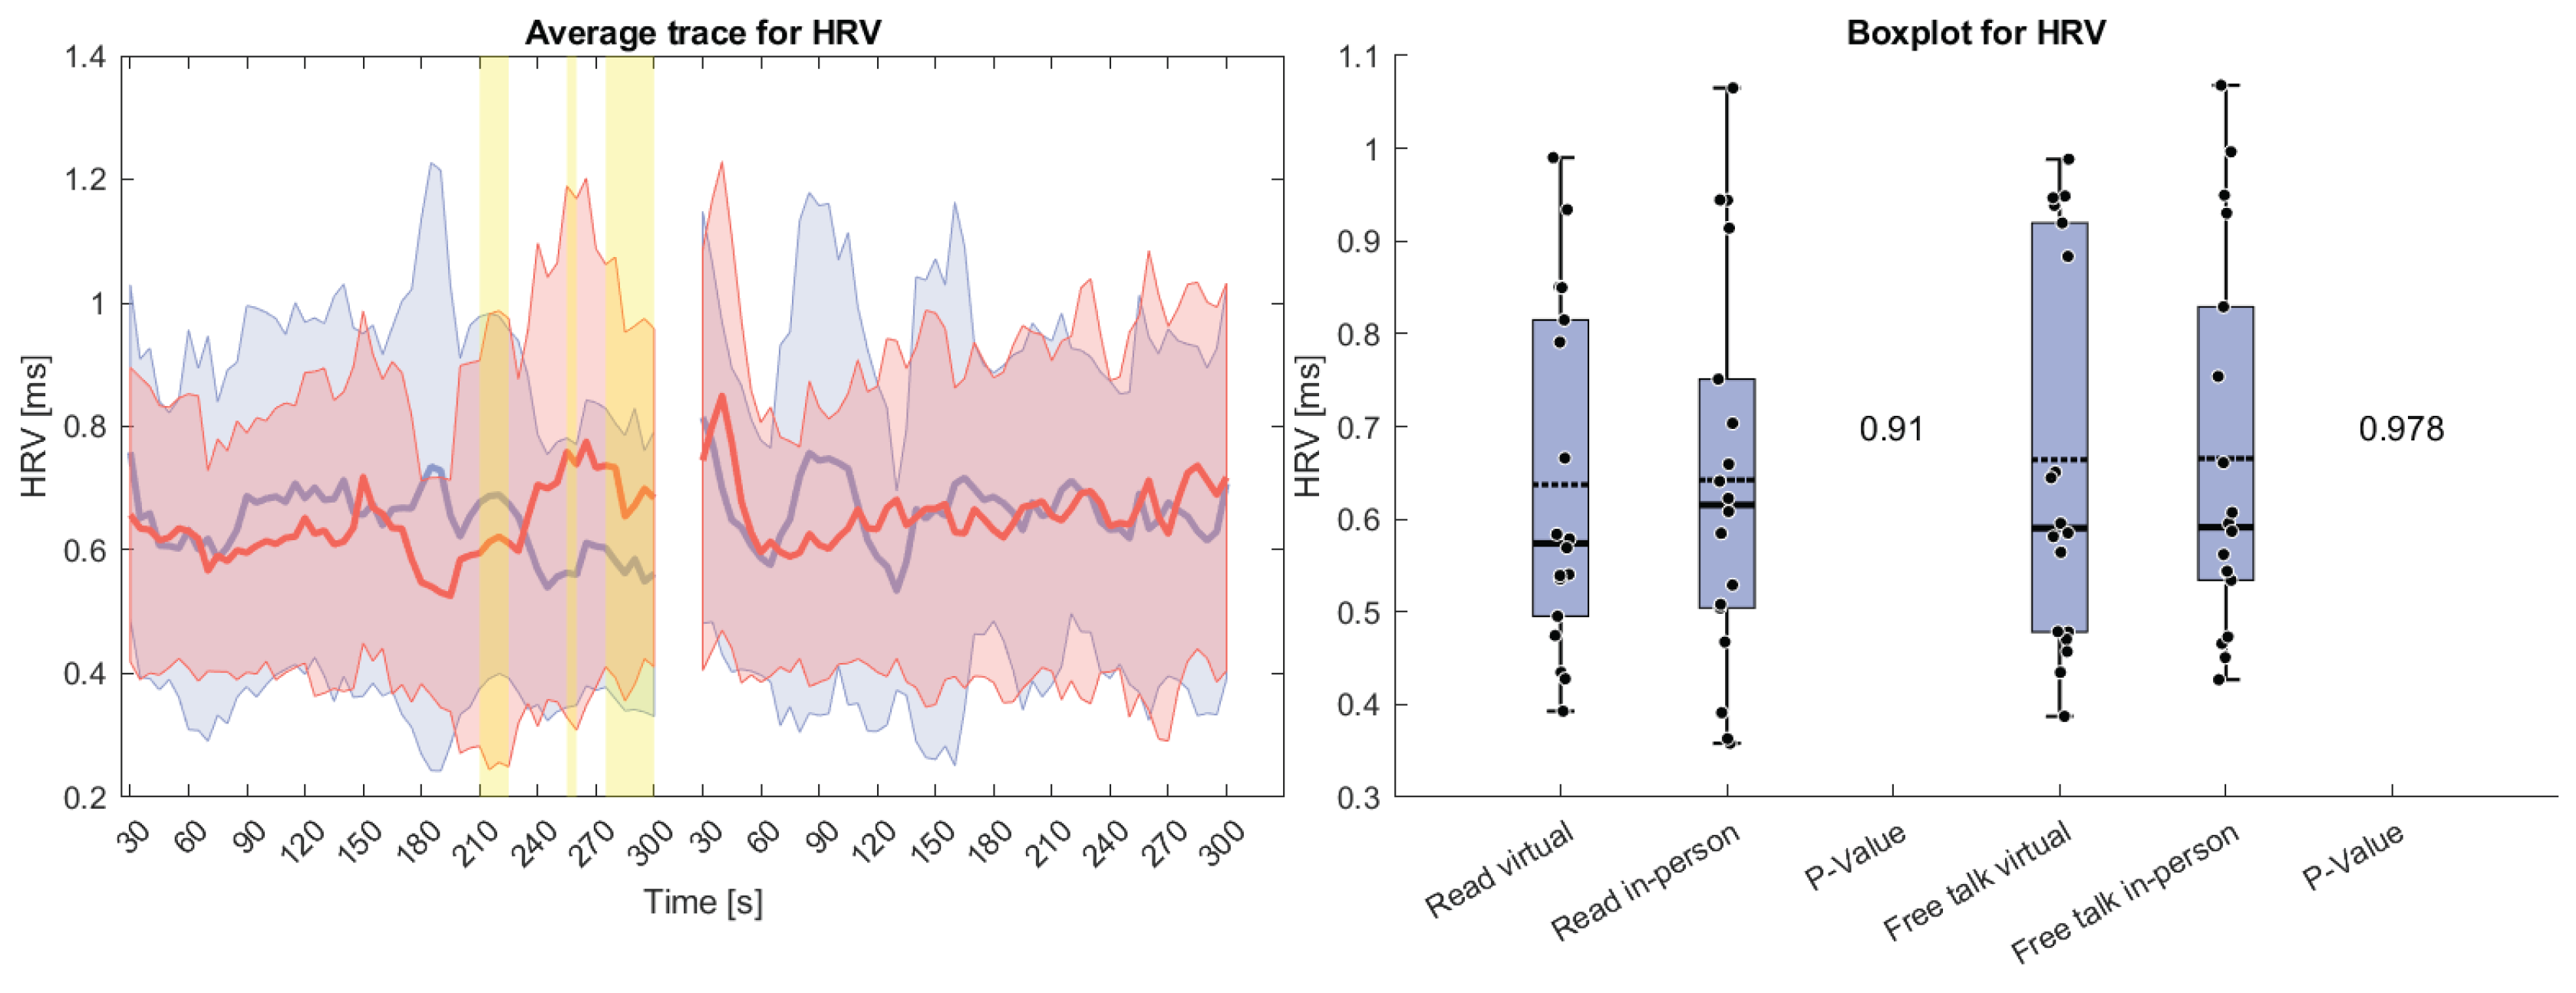
Figure 4.
Left side: Average Trace and standard deviation of the respiratory rate during the reading and the free talk task. Right side: Box plot for the respiratory rate averaged over each task for virtual and in-person condition with a p-value for a Wilcoxon sign-rank test.
Figure 4.
Left side: Average Trace and standard deviation of the respiratory rate during the reading and the free talk task. Right side: Box plot for the respiratory rate averaged over each task for virtual and in-person condition with a p-value for a Wilcoxon sign-rank test.
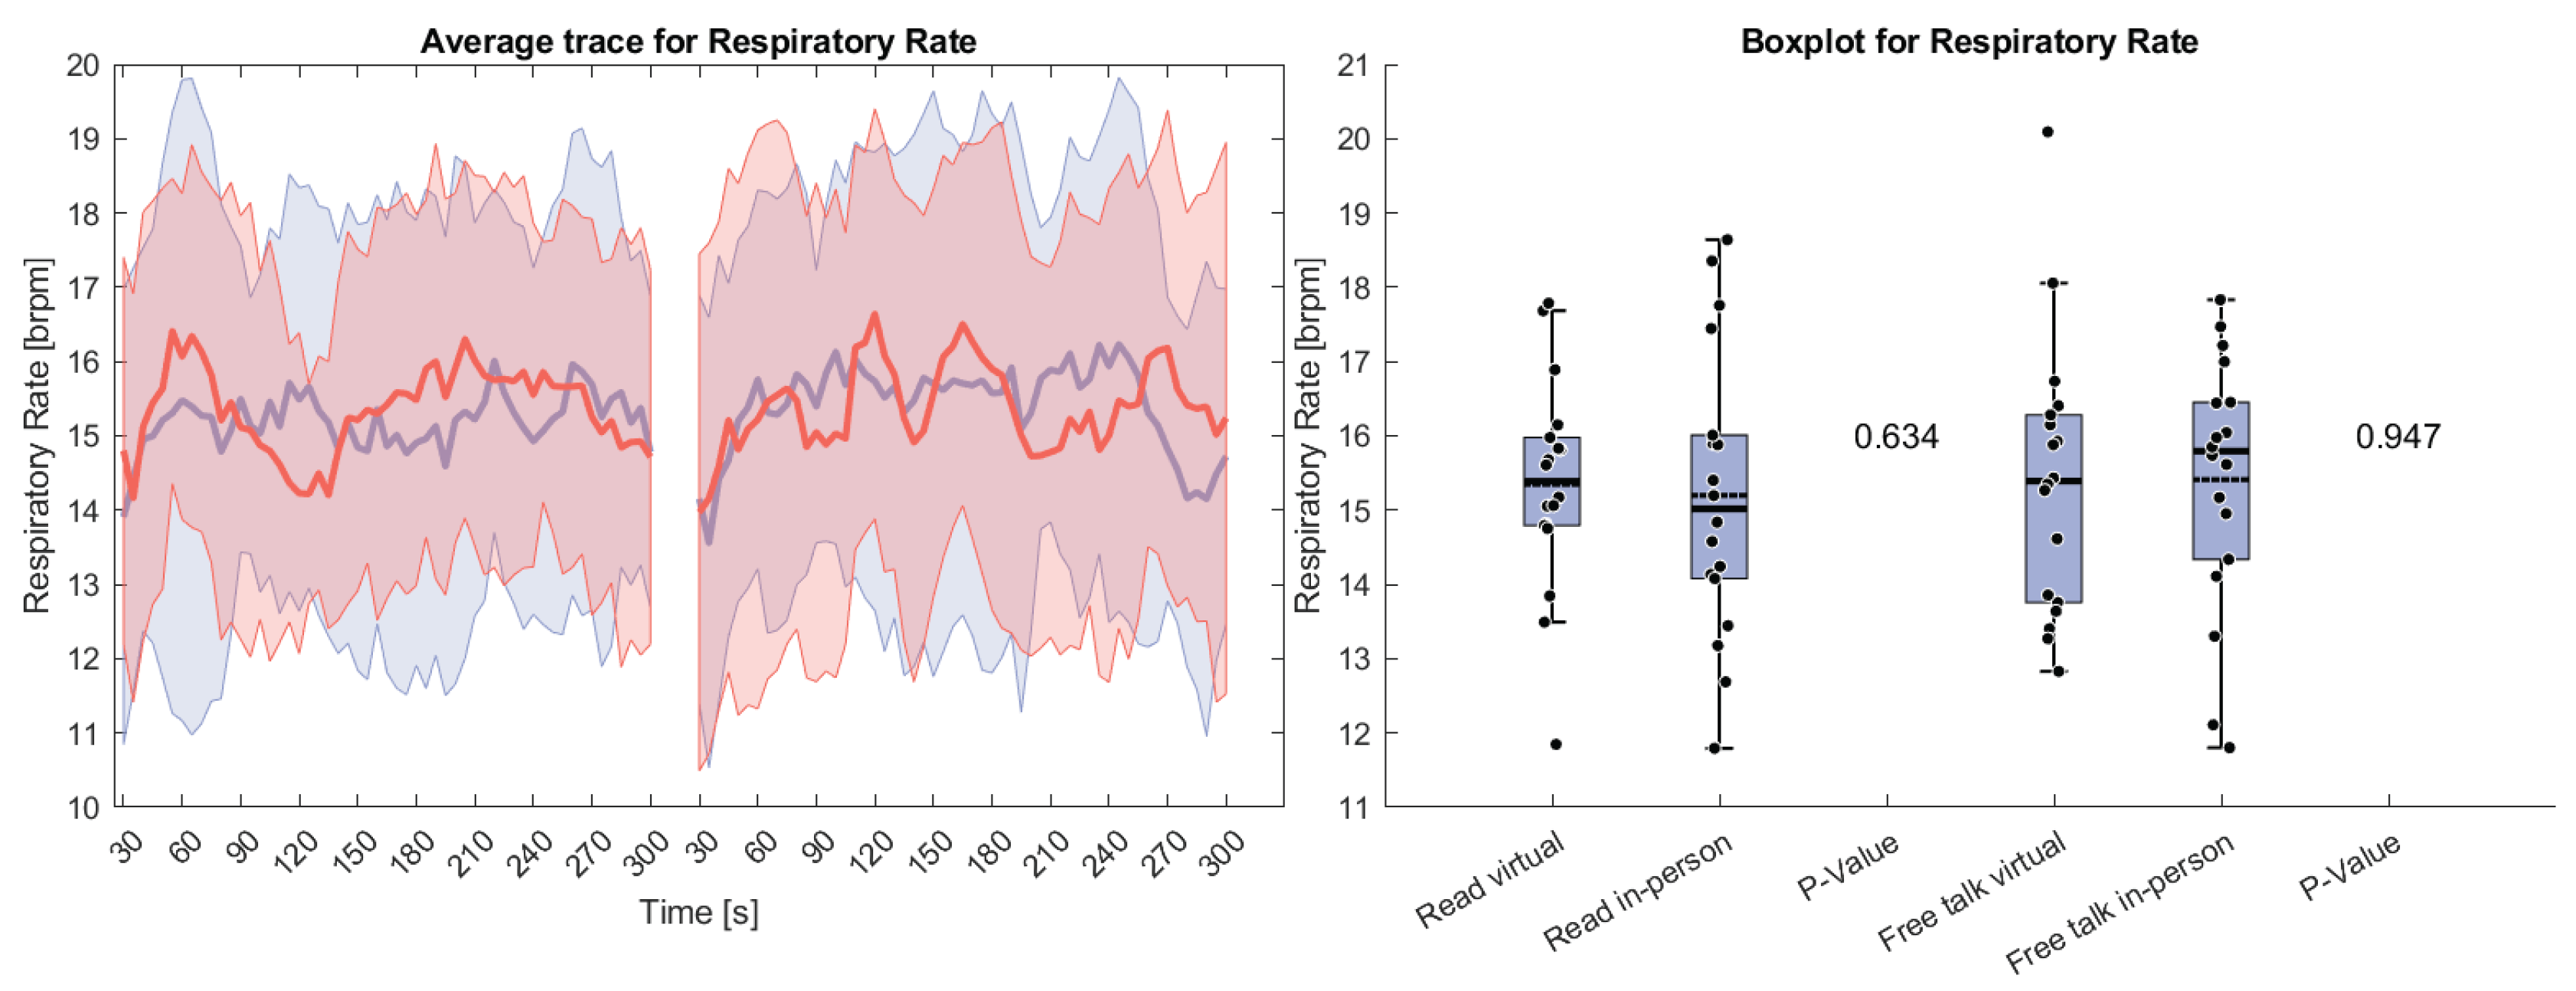
Figure 5.
Left side: Average Trace and standard deviation of the averaged pupil size for the left and right eye during the free talk task. Right side: Box plot for pupil size averaged over the free talk task for virtual and in-person condition with a p-value for a Wilcoxon sign-rank test.
Figure 5.
Left side: Average Trace and standard deviation of the averaged pupil size for the left and right eye during the free talk task. Right side: Box plot for pupil size averaged over the free talk task for virtual and in-person condition with a p-value for a Wilcoxon sign-rank test.
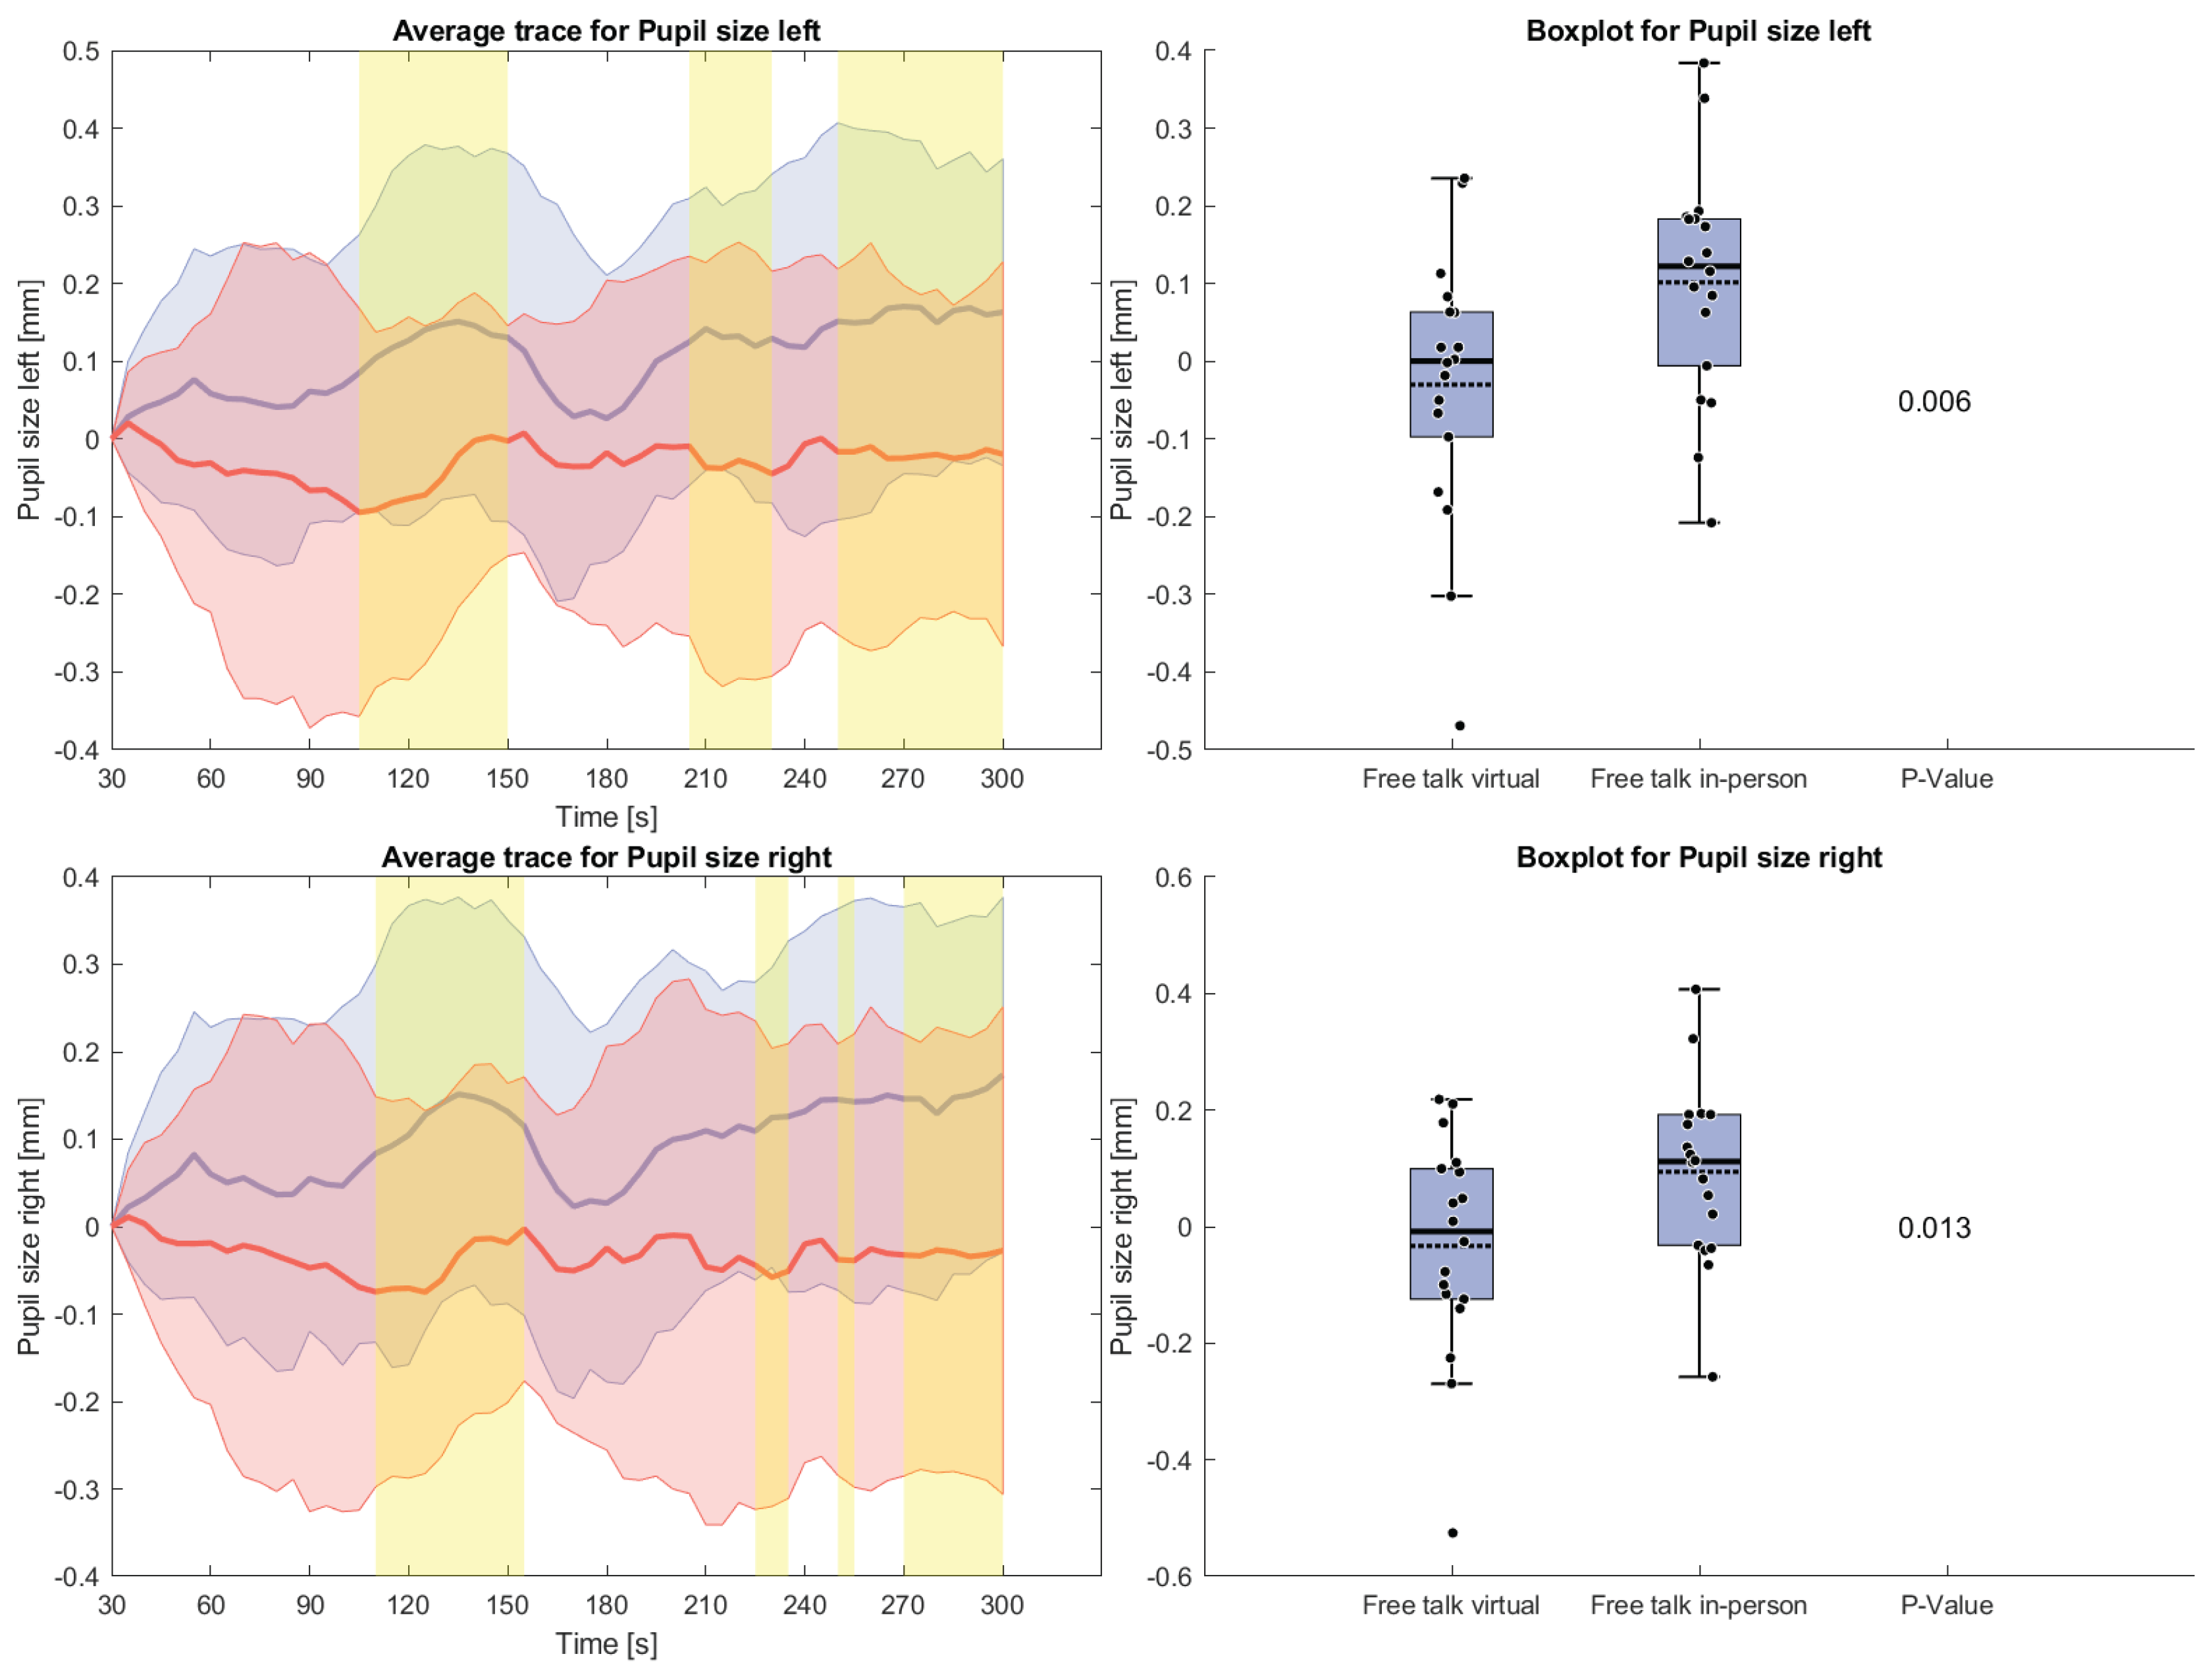
Figure 6.
Left side: Average Trace and standard deviation of counted hand and arm movements during the reading and the free talk task. Right side: Box plot for counted hand and arm movements averaged over each task for virtual and in-person condition with a p-value for a Wilcoxon sign-rank test.
Figure 6.
Left side: Average Trace and standard deviation of counted hand and arm movements during the reading and the free talk task. Right side: Box plot for counted hand and arm movements averaged over each task for virtual and in-person condition with a p-value for a Wilcoxon sign-rank test.
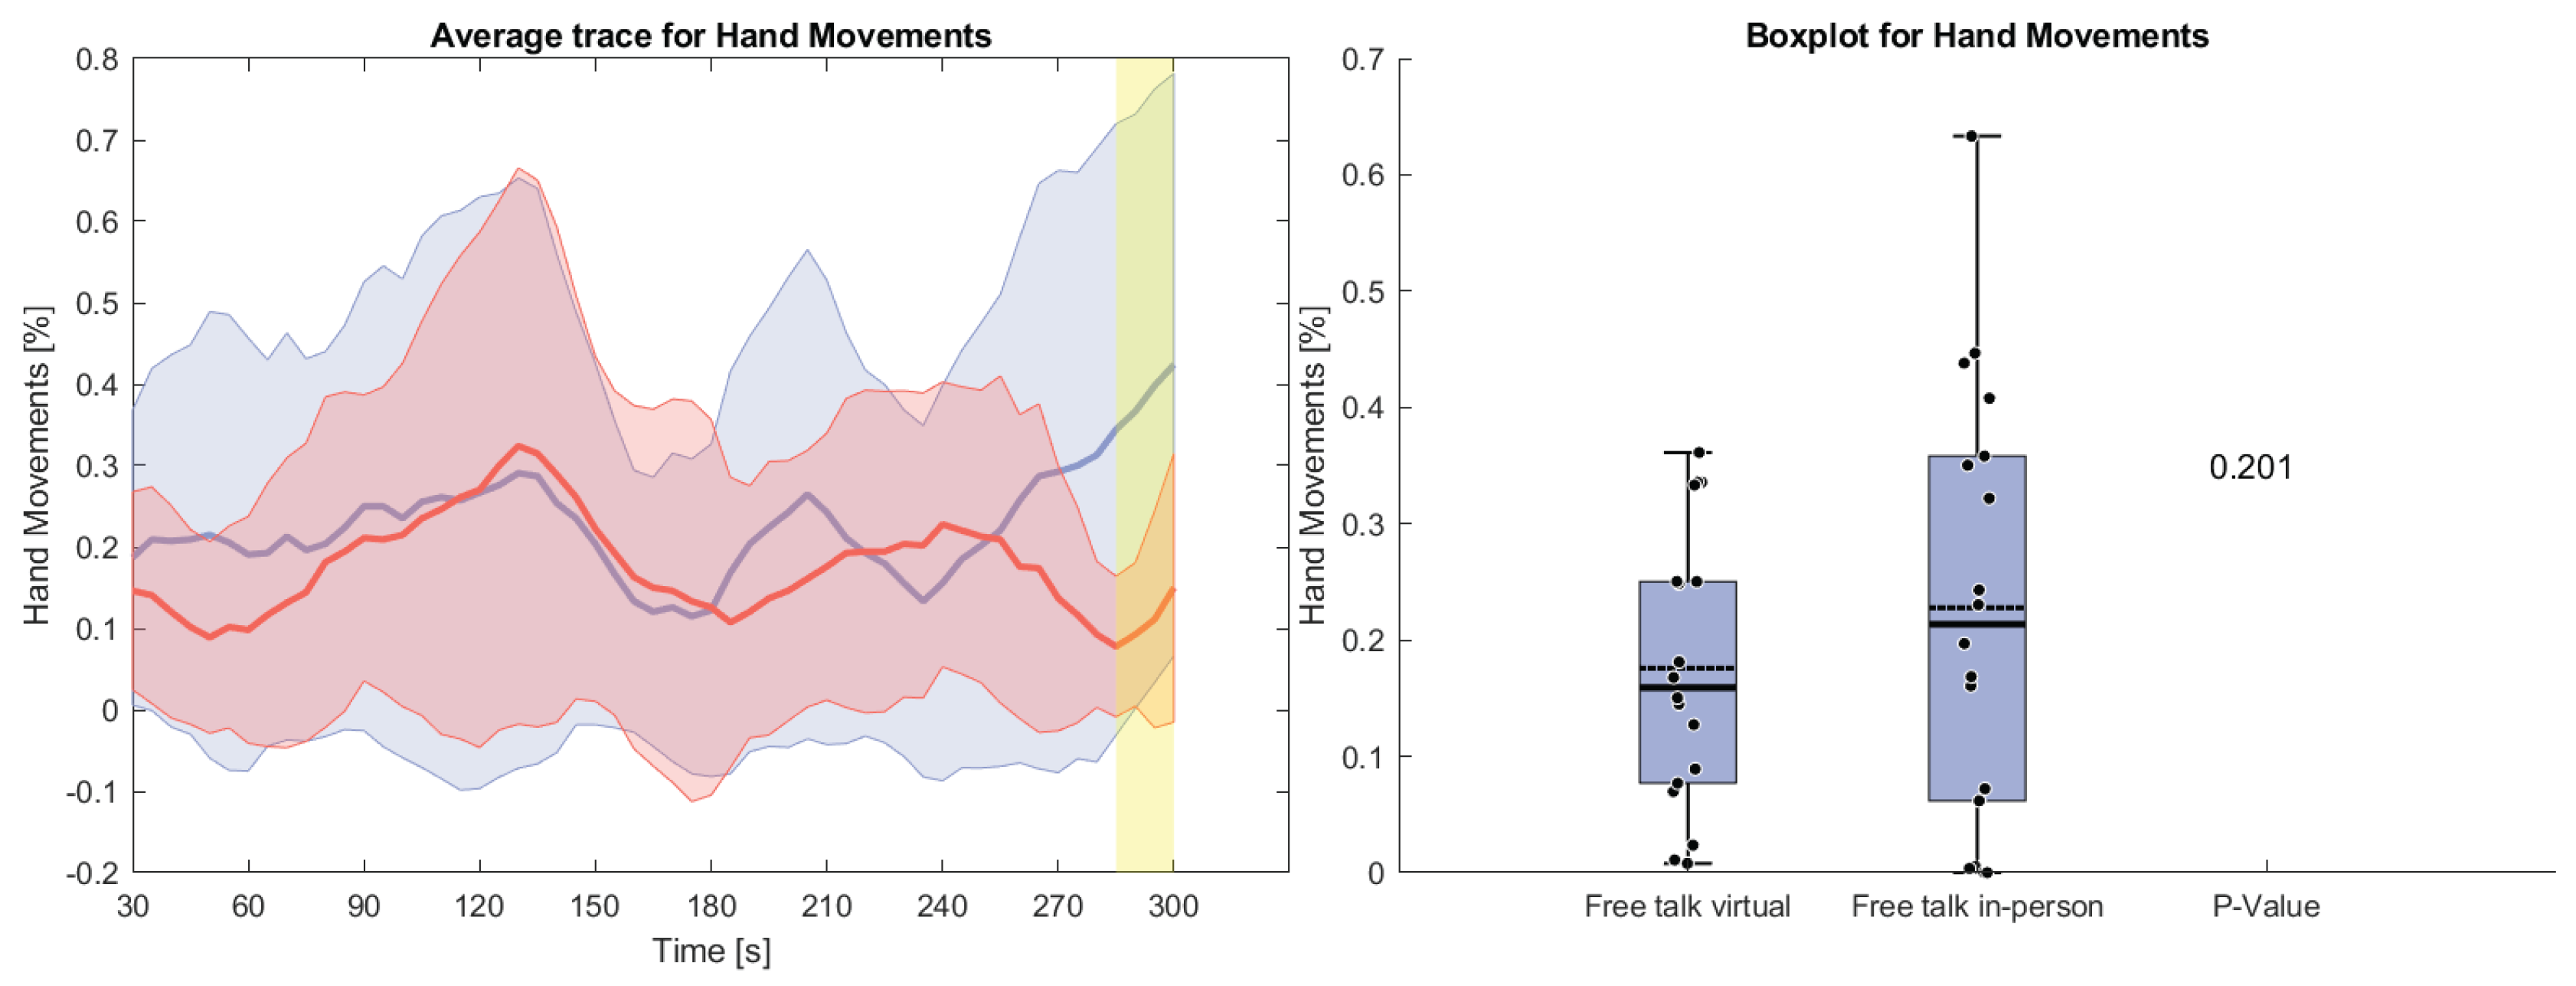
Figure 7.
Left side: Average Trace and standard deviation of the horizontal and vertical eye gaze variance size during the free talk task. Right side: Box plot for the horizontal and vertical eye gaze variance averaged over the free talk task for virtual and in-person condition with a p-value for a Wilcoxon sign-rank test.
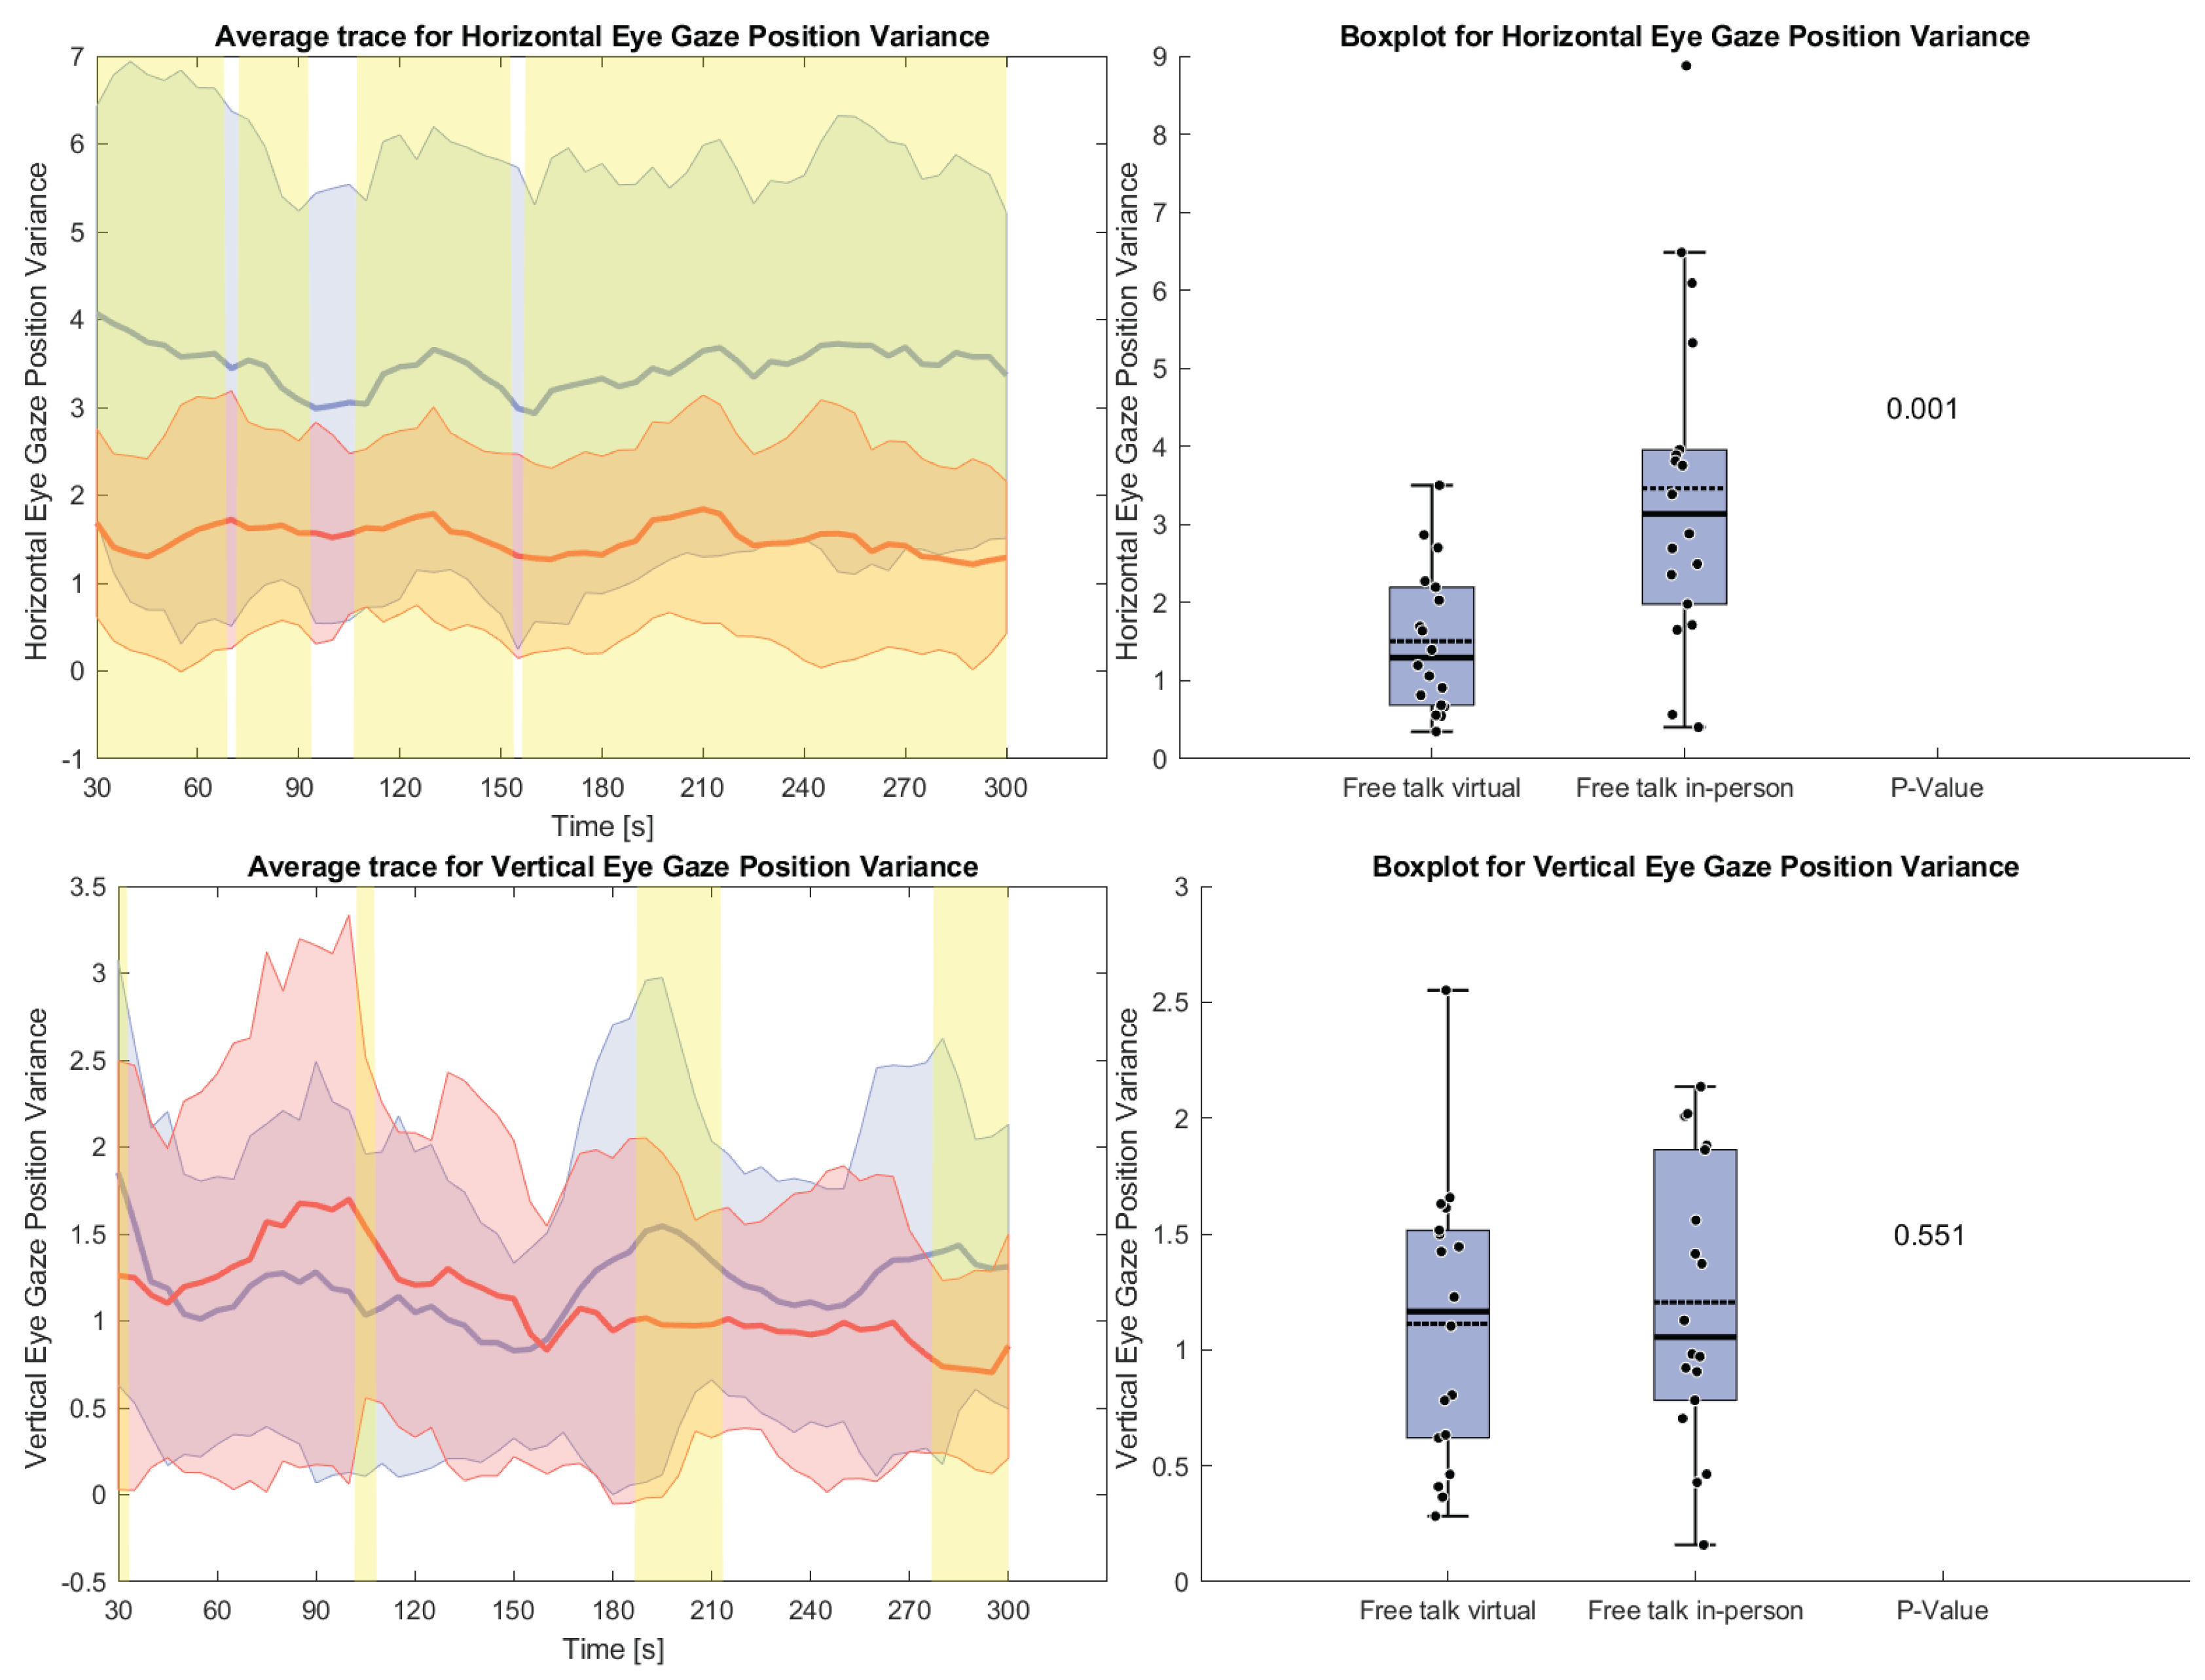
Figure 8.
Scatter plot of the average eye gaze position across participants for each time window during the free talk task. The ellipses indicate the 95% confidence interval for each condition.
Figure 8.
Scatter plot of the average eye gaze position across participants for each time window during the free talk task. The ellipses indicate the 95% confidence interval for each condition.
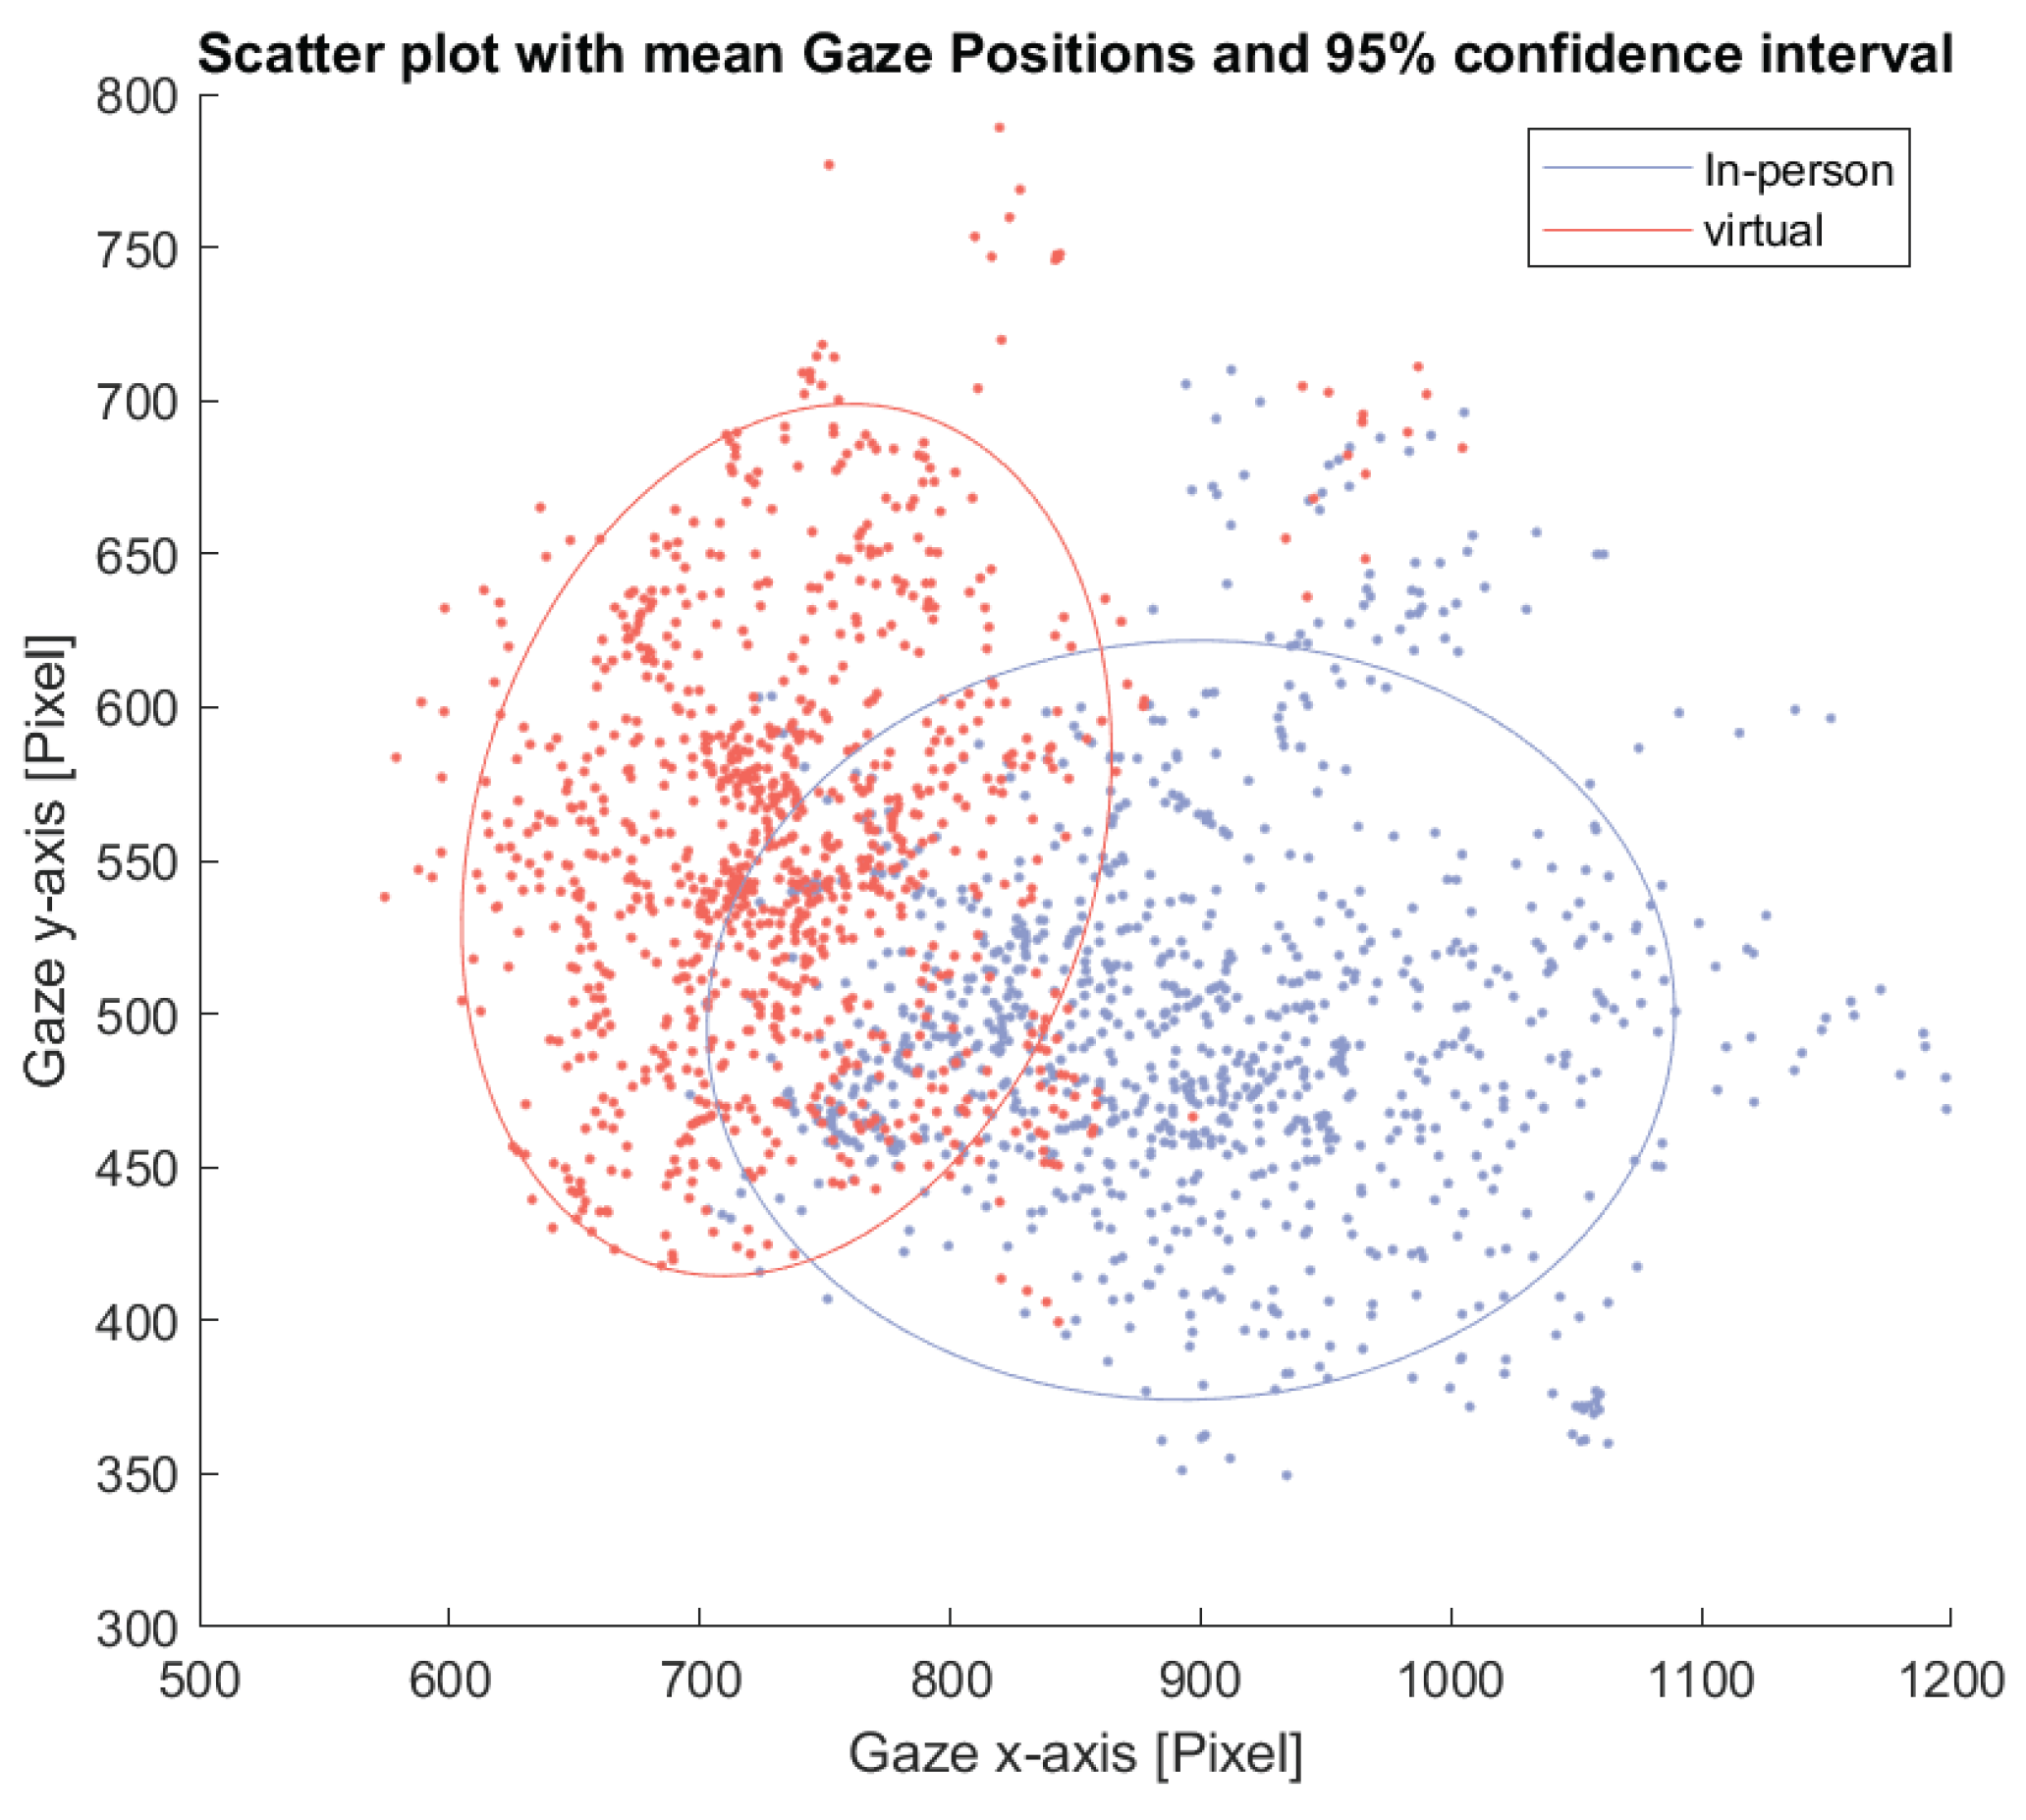
Figure 9.
Left side: Normalized Differences between Head movement PSD signals in-person and virtual for the free talk task. Middle: P-values for Differences between Head movement PSD signals in-person and virtual for the free talk task. Right: Significance for Head movement PSD signals comparing in-person and virtual for the free talk task.
Disclaimer/Publisher’s Note: The statements, opinions and data contained in all publications are solely those of the individual author(s) and contributor(s) and not of MDPI and/or the editor(s). MDPI and/or the editor(s) disclaim responsibility for any injury to people or property resulting from any ideas, methods, instructions or products referred to in the content. |
© 2025 by the authors. Licensee MDPI, Basel, Switzerland. This article is an open access article distributed under the terms and conditions of the Creative Commons Attribution (CC BY) license (http://creativecommons.org/licenses/by/4.0/).
Copyright: This open access article is published under a Creative Commons CC BY 4.0 license, which permit the free download, distribution, and reuse, provided that the author and preprint are cited in any reuse.


