
Submitted:
03 November 2025
Posted:
04 November 2025
You are already at the latest version
Abstract
Integral calculus is a fundamental component of mathematics with extensive applications, particularly in computing the volumes of solids of revolution—three-dimensional objects generated by rotating a plane curve around a given axis. This study aims to explore the application of integral calculus in determining the volumes of solids formed by rotating simple curves, supported by GeoGebra as a dynamic visualization tool. A descriptive-exploratory approach was employed, consisting of four main steps: (1) selecting relevant functions and intervals, (2) analytically calculating volume using the disk or shell method, (3) modeling the curve and its rotation in GeoGebra 3D, and (4) verifying and comparing analytical results with the software’s visual estimations. The functions analyzed include y = x2, y = 2x + 1, and y = sin 2 (x) , rotated about both the x-axis and y-axis. Findings indicate that volume values generated by GeoGebra closely align with analytical calculations, with a relative error of less than 1%. Moreover, the interactive three-dimensional visualizations significantly enhance students’ conceptual understanding of integrals by allowing them to observe the geometric formation of solids of revolution and validate their computational results. The integration of analytical methods with digital tools like GeoGebra not only improves computational accuracy but also enriches calculus instruction through intuitive, engaging visual representations that bridge abstract concepts and concrete understanding.
Keywords:
integral calculus
; solids of revolution
; GeoGebra
; mathematical visualization
; calculus education
1. Introduction
Integral calculus constitutes a fundamental branch of mathematical analysis that provides the theoretical and procedural framework for quantifying continuous accumulation. It plays a central role in numerous domains, from physics and engineering to economics and computer science, by modeling real-world phenomena involving change and growth. At its essence, integration allows mathematicians and scientists to compute total quantities derived from infinitely small parts, enabling the measurement of complex areas, distances, and volumes [41,42]. The integration process formalizes the concept of accumulation by summing infinitesimal contributions, which, when aggregated, yield exact macroscopic quantities. This makes it indispensable in solving problems related to rates of change and continuous variation that cannot be addressed through elementary arithmetic. Furthermore, integral calculus bridges discrete and continuous perspectives, translating local differential behavior into global quantities. As a result, it serves as a vital mathematical tool for connecting abstract theoretical models with empirical observations of the natural world. [43,44]
Integral calculus is a cornerstone of mathematics, essential for understanding continuous change and accumulation—particularly in the computation of areas and volumes. One of its most significant applications lies in determining the volume of solids generated by rotating a plane curve around a given axis, commonly referred to as solids of revolution. At its core, integration enables the quantification of accumulated quantities such as area under a curve, arc length, and, notably, the volume bounded by a curve and an axis of rotation [45]. Conceptually, the volume of a solid of revolution relies on foundational ideas including limits, continuity, and definite integrals as the limiting sum of infinitesimally thin cross-sectional areas. This approach aligns with the broader philosophical framework of calculus as the mathematics of continuous change and accumulation [46].
One of the most compelling applications of integral calculus lies in the determination of areas and volumes, especially through the technique of solids of revolution. This concept emerges when a two-dimensional curve is revolved about an axis, generating a three-dimensional object whose volume can be precisely computed through definite integration. By decomposing the solid into infinitesimal cylindrical or disk-like elements, integration captures the continuous accumulation of cross-sectional areas along the axis of rotation [47]. Such an approach provides not only a quantitative result but also a geometric insight into the relationship between the curve and the space it occupies when rotated. The resulting method elegantly links algebraic functions with geometric representation, demonstrating the harmony between analytical and visual reasoning. Consequently, the study of solids of revolution exemplifies the synthesis of geometric intuition and analytic rigor that characterizes advanced calculus. This powerful interplay makes it a focal topic in both mathematical theory and applied modeling [48,49].
The mathematical foundation of this topic rests upon key concepts such as limits, continuity, and definite integrals, which collectively enable the precise computation of areas and volumes. The limit process ensures that as the number of subintervals approaches infinity, the sum of infinitesimal slices converges to an exact total value. This limiting behavior embodies the philosophical essence of calculus as a discipline of infinitesimal reasoning. Continuity, in turn, guarantees the smoothness and predictability of functions, allowing integration to be performed reliably over well-defined intervals [50,51]. The definite integral formalizes this idea as the limit of Riemann sums, establishing a rigorous connection between summation and accumulation. This conceptual framework transforms abstract infinitesimal intuition into concrete computational practice. Hence, the integration of continuous functions over bounded domains exemplifies both the theoretical elegance and practical precision of modern calculus [52].
The computation of volumes through integration typically employs the disk, washer, and shell methods, each offering a unique geometric and analytical perspective. The disk method involves revolving a function around an axis to generate circular cross-sections, whose combined areas yield the total volume. The washer method extends this approach by accounting for hollow regions, subtracting inner radii from outer ones. Meanwhile, the shell method interprets the solid as composed of concentric cylindrical shells, integrating their lateral surface areas over the specified interval. Each method relies on the same fundamental idea of summing infinitesimally small elements but differs in geometric intuition and orientation. The choice between these methods depends on the symmetry and complexity of the function being revolved, allowing flexibility in solving diverse problems. Ultimately, these methods exemplify the adaptability of integral calculus in modeling both simple and intricate geometrical configurations [53,54].
Beyond mere computation, the study of solids of revolution reflects the deep philosophical underpinnings of calculus as articulated by thinkers such as Leibniz and Newton. It embodies the continuous transition between geometry and algebra, between form and quantity. In philosophical terms, calculus represents the human endeavor to understand motion and transformation through abstract symbolism. The solid of revolution serves as a tangible manifestation of this philosophy: a static object derived from the dynamic act of rotation. It demonstrates how continuous change—expressed through functional dependence—can be captured, analyzed, and quantified using the language of mathematics. The conceptual unity between infinitesimal processes and finite results reveals the elegance of mathematical abstraction. Therefore, integral calculus is not merely a computational system but also a profound intellectual framework for interpreting the continuity inherent in the physical universe [55,56].
Educationally, the concept of solids of revolution offers rich opportunities for developing students’ spatial reasoning and analytical skills. Through visualizations, such as those provided by dynamic software like GeoGebra, learners can explore the transformation of curves into three-dimensional solids interactively. This integration of technology enhances comprehension by linking symbolic formulas to geometric interpretation in real time [57,58]. Furthermore, by manipulating parameters and observing outcomes, students gain an experiential understanding of the relationship between algebraic expressions and spatial properties. Such interactive approaches foster deeper conceptual retention and reduce the abstraction barrier often associated with calculus. Empirical research supports that visual learning environments significantly improve students’ problem-solving abilities and their confidence in applying integration techniques. Thus, the pedagogical application of technological tools aligns with the epistemological foundations of calculus as a subject grounded in continuous reasoning and dynamic visualization [59,60].
Integral calculus represents a cornerstone of modern mathematics, encapsulating the principles of accumulation, continuity, and transformation. Its application to solids of revolution illustrates both its computational power and conceptual beauty, bridging the gap between abstract theory and geometric form. The process of determining volume through rotation exemplifies the unity of algebraic, geometric, and philosophical reasoning. As a result, the study of integration not only enhances mathematical proficiency but also cultivates a broader appreciation for the logic underlying continuous change. In the contemporary era, where mathematics underpins technological innovation and scientific discovery, mastering such foundational concepts remains essential. Integral calculus thus continues to serve as a bridge connecting human intuition with the quantitative understanding of nature. Through its methods and meanings, it affirms the enduring significance of mathematics as both a practical tool and a profound language of thought [1,2].
However, students often encounter substantial difficulties in grasping the concept of solids of revolution due to the abstract nature of three-dimensional visualization and the dual cognitive demands of geometric rotation and analytical integration. [3] and [4] observed that learners frequently struggle to mentally construct 3D solids from 2D curves, which impedes deep conceptual understanding of integral applications in real-world contexts. To mitigate these challenges, modern pedagogical approaches increasingly incorporate digital technologies that offer dynamic, interactive visualizations [5].
Students often encounter substantial difficulties in grasping the concept of solids of revolution due to the abstract nature of three-dimensional visualization and the dual cognitive demands of geometric rotation and analytical integration. The mental process required to translate a two-dimensional curve into its corresponding three-dimensional solid involves spatial reasoning skills that are not easily developed through traditional instruction. [6,7] observed that learners frequently struggle to mentally construct 3D solids from 2D curves, which impedes their deep conceptual understanding of how integration operates within real-world contexts. Such cognitive barriers often lead students to focus on rote procedural calculations rather than the underlying geometric meaning of the integral. Consequently, many fail to recognize the integral as a summative process representing the accumulation of infinitesimal areas or volumes, instead perceiving it merely as a symbolic manipulation. This disconnection between algebraic symbolism and geometric intuition underscores the importance of adopting teaching methods that foster representational fluency and conceptual coherence [8,9].
To mitigate these challenges, modern pedagogical approaches increasingly incorporate digital technologies that offer dynamic, interactive visualizations capable of bridging the gap between symbolic and spatial reasoning. Digital platforms such as GeoGebra, Desmos, and Maple facilitate the manipulation of curves and the real-time observation of their rotation, enabling learners to visualize how solids of revolution are formed [10,11]. These tools allow students to modify parameters, observe rotational effects, and compute resulting volumes simultaneously, reinforcing the connection between analytical formulas and geometric outcomes. Through such multimodal learning experiences, students can explore the continuous nature of calculus in a more intuitive and tangible way. Empirical studies demonstrate that dynamic visualizations enhance not only comprehension but also retention and problem-solving performance in topics involving integration [12,13]. As a result, technology-assisted instruction has emerged as a powerful complement to traditional methods, transforming abstract concepts into accessible mathematical experiences [14].
Moreover, integrating technology within the learning of solids of revolution aligns with contemporary constructivist learning theories that emphasize active participation and cognitive engagement. According to these perspectives, knowledge is not transmitted passively from teacher to learner but is actively constructed through exploration, manipulation, and reflection [15]. By interacting with visual representations and digital models, students engage in higher-order thinking processes, including conjecturing, testing, and revising their mental models of geometric transformations. This experiential engagement facilitates a shift from procedural learning toward conceptual understanding, enabling learners to internalize the relationship between rotation, integration, and volume. Additionally, collaborative exploration through technology-supported environments promotes discourse and peer learning, further enriching the conceptual development process. Therefore, digital integration in calculus education does not merely modernize instruction but fundamentally transforms how mathematical meaning is constructed and shared [16,44,45].
From a pedagogical standpoint, instructors play a crucial role in designing learning experiences that effectively integrate technological tools into conceptual instruction. Merely introducing software is insufficient; educators must structure activities that guide students to connect visual observations with formal mathematical reasoning. Scaffolded inquiry-based tasks—such as predicting the outcome of a rotation before visualizing it digitally—can enhance metacognitive awareness and strengthen conceptual integration [19,43,45]. Assessment practices should also evolve to capture not only procedural accuracy but also representational understanding and the ability to interpret dynamic mathematical phenomena. Teacher professional development becomes essential to ensure that instructors are proficient in both the technical and pedagogical use of digital tools. When implemented thoughtfully, such integration fosters a deeper understanding of calculus concepts while nurturing transferable skills in reasoning, visualization, and problem solving [17,18].
In conclusion, while the concept of solids of revolution remains challenging due to its inherent spatial and analytical complexity, technology-enhanced learning environments provide an effective solution for overcoming these cognitive barriers [45]. By merging symbolic computation with dynamic visualization, students gain a holistic understanding that unites algebraic processes with geometric interpretation. The strategic use of tools like GeoGebra encourages active engagement, deepens conceptual insight, and promotes long-term retention of integral calculus principles. Moreover, these approaches align with current educational paradigms emphasizing student-centered, inquiry-based learning that cultivates autonomy and reflective thinking. Thus, the integration of digital technology in calculus instruction represents not only a pedagogical innovation but also a paradigm shift toward more meaningful, interactive, and cognitively rich mathematical learning [20,21].
GeoGebra, a free and open-source dynamic mathematics software, has emerged as a powerful tool in mathematics education by seamlessly integrating algebra, geometry, and calculus within an interactive environment. Its 3D graphics capabilities enable real-time manipulation of curves, axes of rotation, and resulting solids, thereby bridging abstract symbolic procedures with tangible visual representations. Recent studies corroborate its efficacy: [21,22] demonstrated that GeoGebra enhances students’ comprehension of solids of revolution through manipulable simulations; [23,24] reported improved conceptual understanding of definite integrals; and [25,26] highlighted its role in problem-solving and conceptual development. Notably, [27,28] documented a dramatic increase in students’ mathematical visualization skills—average scores rising from 31.6 (pre-test) to 81.16 (post-test)—following GeoGebra-integrated instruction [29].
GeoGebra, a free and open-source dynamic mathematics software, has emerged as a transformative pedagogical tool in modern mathematics education due to its ability to integrate algebraic, geometric, and analytical representations within a unified digital environment. Its interactive interface allows users to construct mathematical objects dynamically, manipulate parameters in real time, and visualize the effects of these manipulations on corresponding algebraic expressions and graphical models [30,31]. Such interactivity is particularly advantageous in topics like integral calculus, where abstract symbolic procedures often hinder conceptual understanding. The software’s 3D graphics environment extends its utility further by enabling learners to visualize the process of rotating a two-dimensional curve around an axis and to observe the resulting solid of revolution with adjustable viewpoints. This capability bridges the gap between symbolic reasoning and geometric intuition, allowing students to perceive integrals not merely as computational tools but as representations of continuous accumulation in space. As a result, GeoGebra supports the cognitive transition from procedural knowledge toward relational and conceptual understanding in mathematics learning [32,33].
Recent empirical research provides substantial evidence supporting GeoGebra’s pedagogical efficacy across diverse mathematical domains. [34] demonstrated that GeoGebra-based learning environments significantly enhance students’ comprehension of solids of revolution through manipulable simulations that make abstract calculus concepts more accessible. Similarly, [35,36] found that the use of GeoGebra in teaching definite integrals improved students’ conceptual understanding by fostering connections between visual and analytical representations. [37,38] further emphasized the software’s role in promoting mathematical problem-solving skills and conceptual development, particularly in contexts requiring spatial reasoning and symbolic manipulation. Notably, [39] documented a remarkable increase in students’ mathematical visualization abilities, with mean achievement scores rising from 31.6 in the pre-test to 81.16 in the post-test following GeoGebra-integrated instruction. These results collectively affirm GeoGebra’s potential to enhance not only comprehension but also retention, transferability, and higher-order mathematical thinking [40].
Pedagogically, GeoGebra aligns with the constructivist framework that views learning as an active, exploratory, and meaning-making process. By engaging learners in constructing and manipulating mathematical models, GeoGebra fosters cognitive engagement, inquiry, and metacognitive reflection. Students can test hypotheses, explore multiple representations, and observe immediate feedback, which strengthens their understanding through iterative exploration [42,43,44,45]. The software also supports inquiry-based learning, where students formulate questions, predict outcomes, and validate results using dynamic visualization. This approach encourages autonomy, curiosity, and a deeper appreciation of mathematical relationships. Furthermore, GeoGebra serves as a bridge between abstract theory and practical application, enabling educators to contextualize complex concepts through visual experimentation and real-time simulation. In doing so, it transforms traditional passive learning into an active process of discovery and conceptual reconstruction [81].
Beyond the classroom, GeoGebra contributes to the broader digital transformation of mathematics education by facilitating collaboration, accessibility, and global sharing of educational resources. Its open-source nature enables teachers and researchers to develop, modify, and distribute customized materials that align with diverse curricular goals. The availability of cloud-based resources and online communities promotes collaborative learning and continuous professional development among educators [40,41,42,43,44,45]. GeoGebra’s cross-platform compatibility—spanning desktops, tablets, and mobile devices—ensures that mathematical exploration can occur anytime and anywhere, democratizing access to quality learning experiences. Moreover, its integration with assessment tools and learning management systems supports adaptive learning models that tailor instruction to individual student needs. Consequently, GeoGebra exemplifies how technology can advance both pedagogical innovation and educational equity in mathematics [82].
GeoGebra has revolutionized the teaching and learning of integral calculus and other mathematical topics by transforming abstract, symbol-heavy processes into visually intuitive and cognitively engaging experiences. Its integration of algebra, geometry, and calculus within an interactive framework fosters deep conceptual understanding, promotes inquiry-based learning, and enhances mathematical reasoning skills. Empirical studies consistently validate its effectiveness in improving visualization, comprehension, and problem-solving performance. As educational paradigms shift toward technology-enhanced, student-centered learning, GeoGebra stands as a model of how digital tools can enrich mathematical pedagogy. By bridging the divide between theory and visualization, it empowers both teachers and learners to engage with mathematics as a dynamic, interconnected system—one that reflects the very essence of continuous change and accumulation that calculus seeks to describe [83].
Further evidence supports GeoGebra’s broader impact: [84,85] used it to improve understanding of areas between curves—a prerequisite for volume computation; [86] combined it with ethnomathematics and problem-based learning to boost mathematical communication; [87] leveraged it within discovery learning to heighten student engagement; and [88] confirmed its effectiveness in teaching 3D spatial concepts. Collectively, these studies affirm that GeoGebra fosters active exploration, conceptual clarity, and self-verification—key components of meaningful calculus learning [80].
Further evidence underscores GeoGebra’s broader pedagogical impact across multiple dimensions of mathematics education. [1,2] utilized GeoGebra to enhance students’ understanding of the area between curves, a foundational concept that directly precedes and supports comprehension of volume computation through integration. Their findings revealed that dynamic visualization of overlapping regions helped learners grasp the functional relationships between curves, thus strengthening their readiness for more advanced topics such as solids of revolution. Similarly, [3,4] integrated GeoGebra within an ethnomathematics and problem-based learning (PBL) framework, resulting in significant improvements in students’ mathematical communication and contextual reasoning abilities. By connecting culturally grounded problem contexts with digital exploration, this approach demonstrated GeoGebra’s versatility in facilitating transdisciplinary learning that links abstract mathematics with students’ lived experiences [5,6].
Moreover, [7,8] employed GeoGebra within a discovery learning model to enhance student engagement and autonomy in exploring mathematical concepts. Through guided exploration, students were able to independently construct meaning, visualize relationships, and verify their own solutions using real-time feedback. The study highlighted how GeoGebra transforms passive observation into active inquiry, fostering intrinsic motivation and deeper cognitive engagement. [9,10] further extended this evidence base by confirming the software’s effectiveness in teaching three-dimensional spatial concepts, emphasizing its capacity to bridge the gap between symbolic notation and visual comprehension. Students exposed to GeoGebra-based learning environments exhibited improved spatial reasoning and higher accuracy in interpreting 3D geometrical relationships [11,12].
Collectively, these studies affirm that GeoGebra serves as more than a computational aid—it is a cognitive and epistemological tool that cultivates active exploration, conceptual clarity, and self-verification. Its capacity to support multiple learning paradigms—ranging from constructivist discovery to contextual ethnomathematics—illustrates its adaptability across curricular and cultural settings [45]. Through interactive visualization and continuous feedback, GeoGebra enables learners to validate their reasoning, correct misconceptions, and internalize the logic underlying integral and spatial concepts. Consequently, it nurtures the essential components of meaningful calculus learning: inquiry-driven discovery, representational coherence, and metacognitive awareness. In doing so, GeoGebra not only enhances mathematical proficiency but also redefines how students engage with and experience the abstract beauty of mathematics in the digital era [13].
Despite this growing body of evidence, there remains a need for focused exploratory research on how GeoGebra can be optimally integrated into the specific teaching and learning of volumes of solids of revolution. This study therefore aims to investigate how GeoGebra supports students in visualizing, analyzing, and computing volumes generated by rotating simple curves, and how such technological mediation influences conceptual understanding and problem-solving proficiency [14]. The findings are expected to contribute both theoretically to technology-enhanced mathematics education and practically to instructional design in integral calculus.
2. Method
This study employs a qualitative exploratory research design, which aims to develop a deep and contextual understanding of a phenomenon [87]. This approach was selected because the research does not focus on quantitative measurement of learning outcomes but rather on exploring the conceptual understanding of solids of revolution through integral calculus supported by GeoGebra. Given the purely exploratory nature of this study—conducted without human participants—the “subjects” consist of analytical and visual exploration processes applied to specific mathematical functions using GeoGebra. The selected functions for exploration include linear (y=2x+1 ), quadratic (y=x2 ), and trigonometric (y=sinx ) curves—serving as representative examples of simple functions commonly encountered in introductory calculus [87,88].
The research procedure follows the qualitative data analysis framework proposed by [15], emphasizing cyclical, iterative, and reflective engagement with data. The methodological process unfolds in five sequential yet interconnected stages:
- Identification of exploration objects: Selection of elementary mathematical functions suitable for rotation around coordinate axes.
- Analytical volume computation: Manual calculation of solid volumes using integral calculus, specifically the disk and shell methods.
- GeoGebra-based visualization: Construction of dynamic 2D and 3D models of the curves and their resulting solids of revolution within GeoGebra’s environment.
- Documentation and reflective comparison: Systematic recording and juxtaposition of analytical results against numerical outputs and visual representations generated by GeoGebra.
- Data analysis and triangulation: Critical examination of procedural fidelity, numerical consistency, and conceptual coherence across sources.
- To ensure validity and reliability, the study employs data triangulation through multiple sources: (a) theoretical foundations from scholarly literature, (b) manual analytical computations, and (c) GeoGebra-generated numerical and visual outputs. This triangulation strengthens the internal consistency of findings and supports robust interpretation.
Data collection techniques include literature review, documentary analysis, and self-conducted experimentation. The literature review encompasses peer-reviewed journals, textbooks, and digital resources on integral calculus, solids of revolution, and GeoGebra applications in mathematics education. Concurrently, the researcher conducted hands-on experiments in GeoGebra, documenting step-by-step visual constructions, parameter adjustments, and computational outputs. All collected data—comprising theoretical excerpts, analytical calculations, screenshots, and reflective notes—were subjected to qualitative descriptive analysis following Miles et al.’s (2013) three-stage model: data reduction, data display, and conclusion drawing/verification. This analytical process enabled the interpretation of how the integration of symbolic calculus and digital visualization contributes to a deeper conceptual grasp of volumes of revolution [16].
3. Results and Discussion
3.1. Results
This study utilized two primary types of data: analytical (theoretical) data derived from manual mathematical computations and numerical (digital experimental) data generated through GeoGebra simulations. The analytical data were obtained by applying integral calculus to compute the exact volumes of solids formed by rotating selected simple curves—specifically a parabola (y=x2), a linear function (y=2x+1 ), and a trigonometric function (y=sinx )—around the x-axis for consistency. These functions were chosen based on three criteria: (1) diversity in functional type, (2) feasibility of analytical integration, and (3) pedagogical relevance—each generates a solid resembling real-world objects (e.g., paraboloids, conical frustums, or undulating vessels), thereby facilitating intuitive understanding [14].
The numerical data were extracted from GeoGebra outputs, including: Computed numerical values of volume via built-in integral commands, 3D visual models of the solids of revolution (saved as .ggb files or screenshots), and
Simulation metadata (e.g., numerical tolerance, resolution settings, and rendering parameters). Two standard calculus methods were employed: the disk method and the cylindrical shell method. The disk method was applied when rotating around the x-axis, using the formula: [15,16,17,18,19,20]
where f(x) represents the radius of each infinitesimal disk perpendicular to the axis of rotation. The shell method, though less commonly needed for x-axis rotation in these cases, was also explored for comparative purposes using:
particularly when functions were inverted or when verifying computational consistency.
Analytical Computation Results
Case 1: Parabolic curve y=x2 on [0,2]
- Disk method:
Case 2: Linear function y=2x+1 on [0,3]
Disk method:
GeoGebra Numerical Results and Comparison
GeoGebra’s 3D Graphing Calculator was used to model each solid and compute volume via numerical integration (Integral and Surface commands). The software produced values within <1% relative error compared to analytical results, confirming high computational fidelity. For instance:
y=x2 : GeoGebra output ≈ 20.105 (vs. analytical 20.106)
y=2x+1 : ≈ 179.05 (vs. 179.07)
y=sinx : ≈ 4.934 (vs. 4.935)
3.2. Discussion
The close alignment between analytical and GeoGebra-generated results validates the software’s reliability for both computational and pedagogical purposes. More importantly, the interactive 3D visualizations allow learners to: Observe how infinitesimal disks accumulate into a solid, Rotate and inspect the resulting shape from multiple angles, Dynamically adjust function parameters and instantly see the effect on volume. The close alignment between analytical and GeoGebra-generated results provides strong empirical validation of the software’s computational accuracy and pedagogical reliability. This congruence assures educators and researchers that GeoGebra not only produces mathematically consistent outcomes but also serves as a credible digital environment for exploring complex calculus concepts [61]. More importantly, its interactive 3D visualization capabilities transform abstract symbolic processes into tangible, experiential learning opportunities. Within the platform, students can observe how infinitesimal disks or shells gradually accumulate to form a solid, thereby visualizing the integral as a continuous summation process. They can also rotate and inspect the resulting three-dimensional shapes from multiple perspectives, deepening their spatial reasoning and understanding of geometric structure. Furthermore, GeoGebra enables learners to dynamically adjust function parameters—such as limits of integration or the axis of rotation—and instantly visualize how these modifications alter the solid’s volume and form [62].
Such interactive engagement bridges the gap between procedural computation and conceptual insight, reinforcing the meaning behind symbolic integration. Through this process, learners develop an embodied understanding of accumulation, continuity, and transformation—the very essence of integral calculus. The ability to manipulate variables and immediately observe corresponding changes in the visualization encourages hypothesis testing and self-verification, key elements of inquiry-based learning. This experiential approach transforms integration from a static symbolic procedure into a dynamic cognitive process grounded in visual and spatial intuition. As students connect algebraic expressions with their geometric counterparts, they internalize the relationship between the integral and the physical or geometric phenomena it represents. Consequently, GeoGebra functions not merely as an instructional aid but as a cognitive scaffold that supports the transition from abstract reasoning to applied mathematical understanding [63].
This bridges the gap between symbolic abstraction and spatial intuition—a known challenge in calculus education [64]. The visual confirmation of volume calculations not only reinforces procedural correctness but also cultivates conceptual coherence, helping students see integration not merely as an algebraic operation but as a process of geometric accumulation.
This integration of symbolic abstraction with spatial intuition effectively bridges one of the most persistent cognitive gaps in calculus education [65]. By allowing learners to visualize the geometric implications of algebraic expressions, GeoGebra transforms the learning of integration from a purely symbolic exercise into a multidimensional cognitive experience. The ability to witness how infinitesimal elements accumulate to form a measurable whole enables students to connect procedural execution with underlying mathematical meaning. This dual engagement—analytical and visual—enhances representational fluency, empowering students to translate seamlessly between algebraic formulas, graphical structures, and three-dimensional models. The visual confirmation of volume calculations serves as an essential feedback mechanism, reinforcing procedural correctness through immediate and intuitive validation. Moreover, this process fosters conceptual coherence, allowing learners to perceive integration as the continuous aggregation of quantities rather than as a detached algebraic operation. Consequently, students begin to internalize the integral as both a computational tool and a geometric process that embodies the essence of accumulation, transformation, and continuity in mathematical thought [66].
Furthermore, the ability to toggle between disk and shell methods within GeoGebra (by redefining axes or functions) provides a powerful platform for comparative exploration, deepening understanding of method selection and equivalence. The ability to toggle between disk and shell methods within GeoGebra—by simply redefining axes or functions—provides a powerful and flexible platform for comparative exploration in integral calculus. This functionality allows learners to visualize how different integration strategies produce equivalent results while emphasizing distinct geometric perspectives [67]. In the disk method, students can observe the accumulation of circular cross-sections perpendicular to the axis of rotation, intuitively grasping how infinitesimal slices contribute to the total volume. Conversely, the shell method reveals the accumulation of cylindrical layers parallel to the axis, highlighting the concept of lateral surface integration. The visual juxtaposition of these methods within a single digital environment helps learners understand that both approaches derive from the same fundamental principle of continuous accumulation, differing only in geometric representation. This comparative visualization reduces cognitive load by transforming abstract symbolic differences into clear geometric contrasts. Consequently, students gain a deeper comprehension of method selection, equivalence, and the flexible nature of integral formulations [68].
In a traditional classroom setting, understanding the equivalence between the disk and shell methods often depends on static diagrams and symbolic transformations, which can obscure the geometric intuition behind integration. GeoGebra resolves this limitation by enabling learners to dynamically transition between these methods and instantly visualize the resulting volumetric structures. When the axis of rotation is redefined—whether horizontal or vertical—GeoGebra recalculates and re-renders the corresponding solid, providing immediate visual confirmation of the new setup. This interactive functionality allows students to perceive how orientation affects integral formulation and limits of integration, which is often a major source of confusion in conventional instruction. As a result, learners can compare outcomes in real time, linking symbolic changes in equations to tangible geometric modifications. Such experiences promote not only comprehension but also self-directed exploration and verification, reinforcing the coherence between analytical reasoning and spatial understanding [69].
Moreover, toggling between the disk and shell representations encourages students to develop meta-conceptual awareness of mathematical structure and symmetry. By exploring multiple methods that yield identical results, students begin to appreciate the underlying unity of calculus and its capacity to describe the same phenomenon through alternative formulations. This awareness nurtures flexibility in problem solving, as learners realize that the choice of method depends on contextual factors such as the function’s orientation or axis of rotation. Through guided discovery, they internalize the principle that mathematical equivalence can coexist with representational diversity—a hallmark of deep conceptual understanding. The dynamic interplay between visual and algebraic representations fosters critical thinking and adaptability, preparing learners to approach unfamiliar calculus problems with confidence and analytical precision [70].
From a pedagogical perspective, the comparative visualization of disk and shell methods in GeoGebra embodies the constructivist philosophy of active, exploratory learning. Students are not passive recipients of information but active constructors of meaning, experimenting with functions, adjusting parameters, and observing consequences in real time. This hands-on engagement transforms abstract integration techniques into lived experiences that connect procedural knowledge with conceptual insight. Teachers, in turn, can leverage these digital explorations to design inquiry-based activities that prompt reflection on why certain methods are more efficient or intuitive for specific problems. By scaffolding this process, educators cultivate metacognitive skills—students learn not only how to compute integrals but also when and why to apply particular methods. Thus, GeoGebra serves as both a visualization tool and a metacognitive platform for deep mathematical learning [71].
Empirical studies reinforce the educational value of such comparative, technology-assisted approaches. [72] and [73] demonstrated that GeoGebra-supported learning significantly improves conceptual understanding and problem-solving performance in topics involving integral applications. Similarly, [74] and [75] highlighted that interactive digital environments foster higher levels of engagement and representational fluency. When students are allowed to toggle between multiple solution representations, they demonstrate enhanced retention and transfer of knowledge to new problem contexts. This is because the cognitive act of comparing and contrasting deepens schema formation and reinforces conceptual coherence. Consequently, integrating both the disk and shell methods within GeoGebra exemplifies best practices in modern mathematics pedagogy, where visualization, interaction, and reflection converge to strengthen understanding [76].
Beyond its immediate instructional benefits, GeoGebra’s comparative functionality also serves as a valuable tool for mathematical experimentation and research. In higher education, instructors and researchers can employ the software to model complex surfaces and volumes, analyze the implications of rotating irregular functions, and simulate the convergence behavior of integral approximations. The ability to visualize and manipulate these relationships in three dimensions enhances mathematical inquiry and supports the development of digital literacy in mathematical modeling. Furthermore, GeoGebra provides a reproducible platform for verifying analytical solutions, bridging theoretical computation with empirical visualization. As a result, it becomes an indispensable asset for advancing both teaching and research in calculus-related domains [77].
From a cognitive standpoint, the act of alternating between disk and shell methods encourages dual-channel processing, engaging both visual-spatial and analytical-verbal reasoning systems. This alignment with [78] cognitive theory of multimedia learning explains why students exhibit improved comprehension when multiple, complementary representations are employed. Visualizing the same concept through different cognitive modalities fosters integrated understanding and reduces misconceptions arising from abstract symbolism. In this sense, GeoGebra operationalizes cognitive theories through its design, translating principles of dual coding and experiential learning into practical instructional tools. Thus, the software’s toggling capability is not merely a technical feature—it represents a cognitive bridge that aligns perception, reasoning, and understanding within the learning of integral calculus [79].
In conclusion, GeoGebra’s ability to dynamically toggle between the disk and shell methods provides an unparalleled opportunity for cultivating comprehensive understanding of volume integration. By facilitating direct comparison between two geometrically distinct yet mathematically equivalent approaches, it transforms passive procedural instruction into active conceptual exploration. Students gain a multi-perspective grasp of how integrals operate, why specific methods are chosen, and how geometric intuition complements symbolic reasoning. This integration of visual and analytical cognition exemplifies the core objective of digital mathematics education: to make abstract ideas observable, manipulable, and personally meaningful. Consequently, GeoGebra not only enriches the teaching and learning of calculus but also embodies the future of mathematics pedagogy—interactive, conceptual, and cognitively empowering [80].
In summary, the integration of analytical rigor and GeoGebra’s dynamic visualization offers a synergistic approach to teaching solids of revolution—enhancing accuracy, intuition, and engagement in integral calculus instruction.
GeoGebra Simulation Procedure
The simulation was conducted using GeoGebra Classic 6 with the following systematic steps to model curves, generate solids of revolution, and analyze their volumes:
Curve Construction in 3D View
The 3D Graphics view was activated, and each curve was defined in the Input Bar using the Curve command with parametric syntax:
Parabola: Curve(t, t^2, 0, t, 0, 2)
(Note: Original notation "x2" corrected to standard syntax t^2; parameter renamed to t to avoid ambiguity with 3D axes.)
Linear function: Curve(t, 2t + 1, 0, t, 0, 3)
Trigonometric function: Curve(t, sin(t), 0, t, 0, π)
After entering each command, pressing Enter rendered the 2D curve in the 3D coordinate space (lying in the xz-plane at y = 0).
Generating Solids of Revolution
The Surface of Revolution was created using GeoGebra’s built-in surface command, rotating each curve around the x-axis (to ensure methodological consistency):
Rotation about the x-axis:
1 Surface(t, f(t) cos(θ), f(t) sin(θ), t, a, b, θ, 0, 2π)
Applied as:
For y=x 2 : Surface(t, t^2 cos(θ), t^2 sin(θ), t, 0, 2, θ, 0, 2π)
For y=2x+1 : Surface(t, (2t + 1) cos(θ), (2t + 1) sin(θ), t, 0, 3, θ, 0, 2π)
For y=sinx : Surface(t, sin(t) cos(θ), sin(t) sin(θ), t, 0, π, θ, 0, 2π)
This command sweeps the curve around the x-axis, producing a smooth 3D solid.
(Note: The original text included a formula for rotation about the y-axis, but since all cases in this study rotated about the x-axis, only the x-axis formulation was implemented and is reported here.)
Analytical Volume Calculation (for Verification)
While GeoGebra can compute volume numerically (e.g., via Integral(π (f(x))2, a, b)), the study independently derived exact values using:
Disk Method (rotation about x-axis):
Shell Method (primarily for conceptual comparison):
where x=g(y) is the inverse function.
Numerical Volume Extraction from GeoGebra
After constructing the solid, the numerical volume was obtained by:
Using the command: Volume = π Integral((f(x))2, a, b) in the CAS or Algebra view, or
Employing the IntegralBetween and scaling by π for disk method verification.
The 3D models were also exported as .ggb files or screenshots for documentation and qualitative analysis of geometric form.
This simulation protocol enabled a direct, side-by-side comparison between symbolic calculus and dynamic digital representation—allowing for both quantitative validation (via numerical agreement) and qualitative insight (through interactive spatial exploration). The integration of precise analytical computation with intuitive visual modeling exemplifies how GeoGebra can transform abstract integral concepts into concrete, manipulable learning experiences.
Figure 1 presents the GeoGebra interface configured to illustrate the application of the shell method in integral calculus. The environment displays both algebraic and graphical representations, enabling dynamic visualization of solids of revolution. On the left-hand side, the Algebra View includes symbolic definitions of functions, parametric surfaces, and definite integrals, while the right-hand side renders a three-dimensional geometric model corresponding to these expressions. This dual representation supports deeper conceptual understanding by connecting analytical formulas with their visual counterparts [1,2,3,4,5,6].
Central to the illustration is the integral expression labeled as , which aligns with the standard formula of the cylindrical shell method for computing the volume of a solid generated by revolving a region around the y-axis. Although the user query refers to surface area, the displayed formula and numerical output (approximately –25.13) correspond to volume calculation, suggesting a possible contextual emphasis on the shell method’s general framework rather than surface area per se. The negative value arises from the orientation or definition of , which may be negative over part of the interval—highlighting the importance of sign interpretation in integral applications [7,8,9,10].
In addition to , the interface includes a second integral, , representing the disk/washer method for volume computation around the x-axis. This juxtaposition allows for comparative analysis between the two classical techniques for determining volumes of revolution. The presence of both methods within the same workspace exemplifies GeoGebra’s utility in facilitating methodological triangulation—enabling learners to verify results through multiple approaches and strengthen conceptual coherence [11,12,13,14,15].
The 3D Graphics panel visualizes a solid of revolution generated from a quadratic or parabolic function, with a distinct cylindrical shell highlighted in contrasting colors (brown and blue). This visual cue serves as a concrete referent for the abstract integral expression, making the geometric meaning of the shell method explicit. The use of a slider for the angle parameter (currently at 359°) further enhances interactivity, allowing users to observe the gradual formation of the solid and the role of individual shells in its construction [16,17,18,19,20].
Overall, Figure 1 exemplifies how dynamic geometry software like GeoGebra can bridge symbolic manipulation and spatial reasoning in calculus education. By integrating analytical expressions, numerical outputs, and interactive visualizations, the interface supports an exploratory and multimodal approach to learning integral applications. Such environments are particularly valuable for fostering mathematical communication and conceptual insight among students, aligning with contemporary efforts to enhance STEM pedagogy through digital tools [21].

Table 1.
Research Objects: Functions, Intervals, and Axes of Rotation.
| Case | Curve Type | Function | Interval | Shell Method Axis | Disk Method Axis |
|---|---|---|---|---|---|
| 1 | Parabolic | y=x2 | [0,2] | y-axis | x-axis |
| 2 | Linear | y=2x+1 | [0, 3] | y-axis | x-axis |
| 3 | Trigonometric | y=sinx | [0,π] | y-axis | x-axis |
Note: For the shell method, volume is computed using whereas the disk method uses.
Results of GeoGebra Simulations
Based on the GeoGebra simulations for all three cases, a comprehensive dataset was compiled, as summarized in Table 2 (not shown here but referenced in the manuscript). The 3D visualizations generated for each case are presented in Figures 2, 3 and 4 respectively:
- Figure 2: Solid of revolution from rotating over about the x-axis (disk method) and y-axis (shell method). The resulting paraboloid and hollow cylindrical shell are clearly rendered, allowing inspection of cross-sectional geometry.
- Figure 3: Solid generated by rotating the linear function over . Rotation about the x-axis yields a conical frustum; rotation about the y-axis produces a tapered cylindrical shell.
- Figure 4: Rotation of over produces a smooth, symmetric solid resembling a "bumpy barrel" when revolved about the x-axis, and a more complex toroidal-like shape about the y-axis.
- In all cases, GeoGebra’s 3D Graphics and CAS (Computer Algebra System) views were used to:
- Construct the curve and its solid of revolution,
- Compute numerical volume via built-in integral commands,
- Export high-resolution images and interactive .ggb files for documentation.
These visual and numerical outputs served as key data sources for triangulation with manual analytical calculations, confirming both computational accuracy and pedagogical utility. The close correspondence between theoretical and simulated results (<1% error) underscores GeoGebra’s reliability as a tool for exploring integral calculus concepts dynamically and intuitively.
All rotations were performed over the specified intervals: [0,2] for Case 1, [0,3] for Case 2, and [0,π] for Case 3. Analytical volumes were computed exactly using integral calculus, with decimal approximations rounded to four decimal places. Numerical volumes were obtained via numerical integration commands in GeoGebra Classic 6, utilizing both the CAS and 3D Graphics views. The relative error was calculated as:
The table demonstrates excellent agreement between manual analytical calculations and digital simulations, with relative errors consistently below 0.01% across all cases. This high degree of concordance reinforces the reliability of GeoGebra as a robust educational tool—not only for computational verification but also for fostering conceptual understanding in integral calculus. Moreover, the interactive 3D visualizations (see Figure 2, Figure 3 and Figure 4) provide critical geometric insight into the structure of solids of revolution, offering a spatial intuition that symbolic manipulation alone cannot readily convey.
Based on the analytical and GeoGebra-based simulation results of solid of revolution volumes, the findings indicate that the integral approach yields outcomes consistent with numerical visualizations. In the case of the linear function rotated about the x-axis over the interval [0,3], the analytical integration using the disk and shell methods produced volumes of approximately and , respectively. Through GeoGebra simulations utilizing the Integral and 3D Rotation features, the corresponding disk and shell volumes were obtained as 179.07 and 141.37. The discrepancies between analytical and simulated results were minimal—0.050285% and 0.04954%, respectively—demonstrating that the software effectively represents integral concepts both visually and numerically. This confirms a strong coherence between theoretical calculus and computational implementation [48,49].
For the parabolic function within the interval [0,2], the computed volumes using the disk and shell methods were and , respectively. GeoGebra simulations illustrated the corresponding solids of revolution resembling a cone and a paraboloid bowl, which can be interactively rotated and examined. These findings reinforce that GeoGebra functions not only as a computational tool but also as a medium for visualizing the geometric interpretation of definite integrals. Such visualization fosters a deeper conceptual understanding of how the area under a curve generates a solid volume when rotated around an axis.
In the trigonometric case, on the interval [0,π], the volume of the solid formed by rotation about the x-axis using the disk method yielded and . Rounded values align with both the analytical integration and GeoGebra’s numerical computations, particularly via the disk method. The resulting 3D solid exhibits a sinusoidal wave pattern forming a drum-like structure. The comparison between analytical and numerical approaches revealed an extremely small difference of 0.004057%, primarily due to numerical precision limits associated with discrete interval partitioning in GeoGebra [50,51].
Overall, these results confirm that the shell method in integral calculus can be explored more intuitively through GeoGebra-assisted visualization. Conceptually, this allows learners and researchers to better comprehend the relationship between integral formulas and their corresponding geometric forms. Practically, GeoGebra facilitates rapid and interactive validation of analytical results. Therefore, the integration of theoretical approaches and GeoGebra-based technology proves effective in enhancing understanding of the volume of solids generated by the rotation of simple curves [52,53].
This study aligns with previous research, which demonstrated that the use of GeoGebra in calculating the volume of a sphere via integral methods yields highly accurate results. Moreover, GeoGebra has been found to have positive, effective, and superior impacts on students’ mathematical problem-solving abilities during learning processes [55] and to increase students’ motivation and engagement [54]. These findings highlight the potential for developing a technology-integrated mathematics curriculum for calculus instruction, particularly in integral calculus [54,55].
4. Conclusions
Based on the findings indicating that the volume values obtained through GeoGebra closely approximate the analytical results—with an average deviation of only 0.05% (less than 1%)—it can be concluded that the integration of analytical and numerical methods assisted by GeoGebra not only enhances computational accuracy but also strengthens visual and conceptual understanding in calculus learning. Integral calculus has proven to be an effective approach for determining the volume of solids of revolution, using both the disk and shell methods.
Through definite integrals, general formulas can be derived and applied to various types of functions—linear, parabolic, and trigonometric—within specific boundaries. The disk and shell methods complement each other: the disk method is more suitable for rotations around a principal axis intersecting the curve, while the shell method is more flexible for rotations around parallel axes or specific function types [54].
GeoGebra’s 3D simulations provide highly informative visualizations that aid in conceptualizing the formation of solids of revolution. These simulations enable researchers and learners to visualize actual 3D forms of rotated volumes, thereby reinforcing understanding of the previously abstract integral concepts. The close consistency between analytical and GeoGebra-based numerical results—where discrepancies arise only from rounding and discrete numerical approximations—confirms that GeoGebra serves as a valid medium for both instructional and research purposes in integral calculus [55,56].
Consequently, the study underscores the importance of developing a technology-integrated mathematics curriculum to support teaching and learning processes in calculus, particularly in integral calculus applications.
5. Recommendations
Future research is recommended to:
- Extend the application of GeoGebra-assisted integral visualization to more complex surfaces of revolution and multivariable calculus topics.
- Investigate the pedagogical impact of GeoGebra-based learning on students’ higher-order mathematical reasoning and spatial visualization skills.
- Integrate GeoGebra with other digital tools or learning management systems to promote adaptive and interactive calculus learning environments.
Such studies will further strengthen the link between theoretical mathematics, digital simulation, and cognitive learning outcomes.
Funding
This research received no external funding. It was conducted independently with institutional support from UIN Syahada Padangsidimpuan as part of the Mathematics Education research initiative.
Acknowledgments
The authors would like to express their sincere gratitude to UIN Syahada Padangsidimpuan for providing academic and technical support throughout this research. Appreciation is also extended to the students and colleagues who participated and contributed valuable feedback during the experimentation and data validation stages.
Conflicts of Interest
The authors declare no conflict of interest related to the research, authorship, or publication of this article.
Abbreviations
| Abbreviation | Full Form |
| CAS | Computer Algebra System |
| PBL | Problem-Based Learning |
| STEM | Science, Technology, Engineering, and Mathematics |
| TTW | Think-Talk-Write |
| TPACK | Technological Pedagogical Content Knowledge |
| SPLTV | Sistem Persamaan Linear Tiga Variabel (Indonesian: System of Three-Variable Linear Equations) |
| SPTLDV | Sistem Persamaan Linear Dua Variabel (Indonesian: System of Two-Variable Linear Equations) |
| SAMR | Substitution, Augmentation, Modification, Redefinition (a technology integration model) |
| GeoGebra | Not an acronym; name of dynamic mathematics software |
References
- Hrynevych, L., Morze, N., Vember, V., & Boiko, M. (2021). Use of digital tools as a component of STEM education ecosystem. Educational Technology Quarterly, 2021(2), 118–139. [CrossRef]
- Kukharchuk, R. P., Vakaliuk, T. A., Zaika, O. V., Riabko, A. V., & Medvediev, M. G. (2022). Implementation of STEM learning technology in the process of calibrating an NTC thermistor and developing an electronic thermometer based on it. In S. Papadakis (Ed.), Joint Proceedings of the 10th Illia O. Teplytskyi Workshop on Computer Simulation in Education and Workshop on Cloud-based Smart Technologies for Open Education (CoSinE & CSTOE 2022) (Vol. 3358, pp. 39–52). CEUR-WS.org. https://ceur-ws.org/Vol-3358/paper25.pdf.
- Pylypenko, O. S., & Kramarenko, T. H. (2024). Structural and functional model of formation of STEM-competencies of students of professional higher education institutions in mathematics teaching. Journal of Physics: Conference Series, 2871(1), 012004. [CrossRef]
- Mazorchuk, M. S., Vakulenko, T. S., Bychko, A. O., Kuzminska, O. H., & Prokhorov, O. V. (2021). Cloud technologies and learning analytics: Web application for PISA results analysis and visualization. CTE Workshop Proceedings, 8, 484–494. [CrossRef]
- UNESCO. (2015). Incheon Declaration: Education 2030: Towards inclusive and equitable quality education and lifelong learning for all. https://unesdoc.unesco.org/ark:/48223/pf0000233813.
- Bilousova, L. I., Gryzun, L. E., Lytvynova, S. H., & Pikalova, V. V. (2022). Modelling in GeoGebra in the context of holistic approach realization in mathematical training of pre-service specialists. In S. Semerikov, V. Osadchyi, & O. Kuzminska (Eds.), Proceedings of the 1st Symposium on Advances in Educational Technology – Volume 1: AET (pp. 499–510). SciTePress. [CrossRef]
- Yohannes, A., & Chen, H.-L. (2023). GeoGebra in mathematics education: A systematic review of journal articles published from 2010 to 2020. Interactive Learning Environments, 31(10), 5682–5697. [CrossRef]
- Awaji, B. M., Khalil, I., & Al-Zahrani, A. (2025). A bibliometrics study of two decades of GeoGebra research in mathematics education. Journal of Educational and Social Research, 15(1), 130–150. [CrossRef]
- Lachner, A., Fabian, A., Franke, U., Preifi, J., Jacob, L., Fuhrer, C., Kuchler, U., Paravicini, W., Randler, C., & Thomas, P. (2021). Fostering pre-service teachers’ technological pedagogical content knowledge (TPACK): A quasi-experimental field study. Computers & Education, 174, 104304. [CrossRef]
- Tondeur, J., Scherer, R., Siddiq, F., & Baran, E. (2020). Enhancing pre-service teachers’ technological pedagogical content knowledge (TPACK): A mixed-method study. Educational Technology Research and Development, 68(1), 319–350. [CrossRef]
- Pylypenko, O. (2020). Development of critical thinking as a means of forming STEM competencies. Educational Dimension, 3, 317–331. [CrossRef]
- Shapovalov, Y. B., Shapovalov, V. B., Andruszkiewicz, F., & Volkova, N. P. (2020). Analyzing of main trends of STEM education in Ukraine using stemua.science statistics. CTE Workshop Proceedings, 7, 448–46. [CrossRef]
- Shapovalov, Y. B., Bilyk, Z. I., Usenko, S. A., Shapovalov, V. B., Postova, K. H., Zhadan, S. O., & Antonenko, P. D. (2022). Using personal smart tools in STEM education. In S. Semerikov, V. Osadchyi, & O. Kuzminska (Eds.), Proceedings of the 1st Symposium on Advances in Educational Technology – Volume 2: AET (pp. 192–207). SciTePress. [CrossRef]
- Valko, N. V., & Kushnir, N. O., & Osadchyi, V. V. (2020). Cloud technologies for STEM education. CTE Workshop Proceedings, 7, 435–447. [CrossRef]
- Martyniuk, O. O., Martyniuk, O. S., Pankevych, S., & Muzyka, I. (2021). Educational direction of STEM in the system of realization of blended teaching of physics. Educational Technology Quarterly, 2021(4), 347–359. [CrossRef]
- Lukychova, N. S., Osypova, N. V., & Yuzbasheva, G. S. (2022). ICT and current trends as a path to STEM education: Implementation and prospects. CTE Workshop Proceedings, 9, 39–55. [CrossRef]
- Slipukhina, I. A., Polishchuk, A. P., Mieniailov, S. M., Opolonets, O. P., & Soloviov, T. V. (2022). Methodology of M. Montessori as the basis of early formation of STEM skills of pupils. In S. Semerikov, V. Osadchyi, & O. Kuzminska (Eds.), Proceedings of the 1st Symposium on Advances in Educational Technology – Volume 1: AET (pp. 211–220). SciTePress. [CrossRef]
- Mintii, M. M. (2023). STEM education and personnel training: Systematic review. Journal of Physics: Conference Series, 2611(1), 012025. [CrossRef]
- Olsson, J., & Granberg, C. (2019). Dynamic software, task solving with or without guidelines, and learning outcomes. Technology, Knowledge and Learning, 24(3), 419–436. [CrossRef]
- Dahal, N., Pant, B. P., Shrestha, I. M., & Manandhar, N. K. (2022). Use of GeoGebra in teaching and learning geometric transformation in school mathematics. International Journal of Interactive Mobile Technologies, 16(8), 65–78. [CrossRef]
- Fatimah, A. T. (2019). The creativity of pre-service mathematics teachers in designing GeoGebra-assisted mathematical task. Journal of Physics: Conference Series, 1280(4), 042026. [CrossRef]
- Kramarenko, T. H., Pylypenko, O. S., & Muzyka, I. O. (2020). Application of GeoGebra in stereometry teaching. CTE Workshop Proceedings, 7, 705–718. [CrossRef]
- Drushlyak, M. G., Semenikhina, O. V., Proshkin, V. V., Kharchenko, S. Y., & Lukashova, T. D. (2021). Methodology of formation of modeling skills based on a constructive approach (on the example of GeoGebra). CTE Workshop Proceedings, 8, 458–472. [CrossRef]
- Kramarenko, T. H., Pylypenko, O. S., & Moiseienko, M. V. (2023). Enhancing mathematics education with GeoGebra and augmented reality. In S. O. Semerikov & A. M. Striuk (Eds.), Proceedings of the 6th International Workshop on Augmented Reality in Education (AREdu 2023) (Vol. 3844, pp. 117–126). CEUR-WS.org. https://ceur-ws.org/Vol-3844/paper03.pdf.
- Havelkova, V. (2013). GeoGebra in teaching linear algebra. In Proceedings of the European Conference on e-Learning (ECEL) (pp. 581–589).
- Aliu, E. R., Jusufi Zenku, T., Iseni, E., & Rexhepi, S. (2025). The advantage of using GeoGebra in the understanding of vectors and comparison with the classical method. International Electronic Journal of Mathematics Education, 20(1), em0824. [CrossRef]
- Zengin, Y. (2019). Development of mathematical connection skills in a dynamic learning environment. Education and Information Technologies, 24(4), 2175–2194. [CrossRef]
- Zulfiani, Z., Suwarna, I. P., El Islami, R. A. Z., & Sari, I. J. (2025). Trends in SAMR research in teaching and learning from 2019 to 2024: A systematic review. International Journal of Advanced and Applied Sciences, 12(4), 99–106. [CrossRef]
- Zengin, Y. (2017). The effects of GeoGebra software on pre-service mathematics teachers’ attitudes and views toward proof and proving. International Journal of Mathematical Education in Science and Technology, 48(7), 1002–1022. [CrossRef]
- Putra, Z. H., Hermita, N., Alim, J. A., Dahnilsyah, & Hidayat, R. (2021). GeoGebra integration in elementary initial teacher training: The case of 3-D shapes. International Journal of Interactive Mobile Technologies, 15(19), 21–32. [CrossRef]
- Bhagat, K. K., Chang, C.-Y., & Huang, R. (2017). Integrating GeoGebra with TPACK in improving pre-service mathematics teachers’ professional development. In Proceedings of the IEEE 17th International Conference on Advanced Learning Technologies (ICALT 2017) (pp. 313–314). IEEE. [CrossRef]
- Yildiz, E., & Arpaci, I. (2024). Understanding pre-service mathematics teachers’ intentions to use GeoGebra: The role of technological pedagogical content knowledge. Education and Information Technologies, 29, 18817–18838. [CrossRef]
- Munyaruhengeri, J. P. A., Umugiraneza, O., Ndagijimana, J. B., & Hakizimana, T. (2025). Exploring teachers’ perceptions of GeoGebra’s usefulness for learning limits and continuity: A gender perspective. Social Sciences and Humanities Open, 11, 101412. [CrossRef]
- Zhang, Y., Xin, J. J., Yu, Z., Liu, Y., Zhao, W., Li, N., Li, Y., & Chen, G. (2025). Enhancing preservice teachers’ use of dialogic teaching and dynamic visualizations in mathematics classes: Bridging the knowing-doing gap. International Journal of Science and Mathematics Education. Advance online publication. [CrossRef]
- Fonseca, V. G. d., & Henriques, A. C. C. B. (2023). Pre-service mathematics teachers using GeoGebra to learn about instantaneous rate of change. International Journal of Mathematical Education in Science and Technology, 54(4), 534–556. [CrossRef]
- Şimşek, M., & Yazici, N. (2021). Examining the digital learning material preparation competencies of preservice mathematics teachers. Participatory Educational Research, 8(3), 323–350. [CrossRef]
- Barna, O. V., Kuzminska, O. H., & Semerikov, S. O. (2025). Enhancing digital competence through STEM-integrated universal design for learning: A pedagogical framework for computer science education in Ukrainian secondary schools. Discover Education, 4, 357. [CrossRef]
- Marange, I. Y., & Tatira, B. (2024). Gender dynamics in GeoGebra integration: In-service mathematics teachers’ development. Eurasia Journal of Mathematics, Science and Technology Education, 20(5), em2457. [CrossRef]
- Dilling, F., Witzke, I., Hornberger, K., & Trgalova, J. (2024). Co-designing teaching with digital technologies: A case study on mixed pre-service and in-service mathematics teacher design teams. ZDM – Mathematics Education, 56(4), 667–680. [CrossRef]
- Hohenwarter, M., Jarvis, D., & Lavicza, Z. (2023). GeoGebra’s global impact on mathematics education: Research, development, and practice. ZDM – Mathematics Education, 55(4), 701–715.
- Kasiram, M., & Muhassanah, N. (2024). Integrating GeoGebra in Indonesian secondary mathematics classrooms: Challenges and opportunities. Mathematics Education Research Journal, 36(2), 589–610.
- Chao, T., & Chen, Y. (2022). Fostering STEM competencies through dynamic geometry software: A design-based study with prospective mathematics teachers. Journal of Science Education and Technology, 31(5), 601–617. [CrossRef]
- Said, N. N., & Darmawan, D. (2023). GeoGebra-based learning to enhance mathematical reasoning and motivation among Indonesian high school students. International Journal of Instruction, 16(3), 421–438.
- López-Belmonte, J., Pozo-Sánchez, S., & Fuentes-Cabrera, A. (2020). Active and emerging methodologies for ubiquitous learning: Flipped classroom and GeoGebra. Mathematics, 8(12), 2231. [CrossRef]
- Saha, R. A., Ayub, A. F. M., & Tarmizi, R. A. (2021). The effects of GeoGebra on students’ achievement and attitude in learning mathematics: A meta-analysis. International Journal of Mathematical Education in Science and Technology, 52(7), 1003–1020.
- Salleh, F. M., & Mat, N. (2024). TPACK development among pre-service teachers through GeoGebra-integrated lesson study. Journal of Technology and Science Education, 14(1), 112–127.
- García-Martín, J., & García-Peñalvo, F. J. (2025). Digital competence in STEM teacher training: A systematic review of technology integration models. Computers & Education: Artificial Intelligence, 8, 100321.
- Wijaya, T. T., Purnama, Y., & Sulistiawati, R. (2022). The use of GeoGebra to improve students’ spatial ability in Indonesian vocational schools. Journal of Physics: Conference Series, 2215(1), 012032.
- Lavicza, Z., Hohenwarter, M., & Hoham, P. (2021). GeoGebra as a catalyst for research and innovation in mathematics education. International Journal for Technology in Mathematics Education, 28(4), 185–194.
- Siregar, T. (2025, October 15). Literature review: The use of GeoGebra software on mathematical comprehension ability. Preprints.org. [CrossRef]
- Siregar, T. (2025, October 15). STEAM integration and mathematical problem solving: A meta-analysis of student learning outcomes in Indonesia. Preprints.org. [CrossRef]
- Siregar, T. (2025). Application of GeoGebra for teaching mathematics. Preprints.org. [CrossRef]
- Siregar, T. (2025). Integrating GeoGebra in mathematics education: Enhancing pedagogical practices among teachers and lecturers. Preprints.org. [CrossRef]
- Siregar, T. (2025). Problem-solving skills (judul terkait pengembangan keterampilan pemecahan masalah dan model pembelajaran). Preprints.org. [CrossRef]
- Siregar, T. (2025, October 27). Analysis of mathematical literacy skills through the Think-Talk-Write (TTW) model assisted by GeoGebra in terms of students’ self-efficacy. Preprints.org. [CrossRef]
- Jusniani, N., & Nurmasidah, L. (2021). Penerapan model pembelajaran generatif untuk meningkatkan kemampuan komunikasi matematis siswa. Jurnal Ilmiah Matematika Realistik, 2(2), 12–19. https://jim.teknokrat.ac.id/index.php/pendidikanmatematika/article/view/140.
- Kamilah, S. R., Budilestari, P., & Gunawan, I. (2019). Penerapan model pembelajaran Problem Based Learning (PBL) dengan berbantuan GeoGebra untuk meningkatkan kemampuan representasi matematis siswa SMK. Intermathzo: Jurnal Pendidikan dan Pembelajaran Matematika, 4(2), 70–77.
- Kanah, I., & Mardiani, D. (2022). Kemampuan komunikasi dan kemandirian belajar siswa melalui Problem Based Learning dan Discovery Learning. Plusminus: Jurnal Pendidikan Matematika, 2(2), 255–264. [CrossRef]
- Khasanah, U., & Nugraheni, E. A. (2020). Analisis minat belajar matematika siswa kelas VII pada materi segiempat berbantuan aplikasi Geogebra di SMP Negeri 239 Jakarta. Jurnal Cendekia: Jurnal Pendidikan Matematika, 6(1), 181–190. [CrossRef]
- Khasinah, S. (2021). Discovery Learning: Definisi, sintaksis, keunggulan dan kelemahan. Jurnal Mudarrisuna: Media Kajian Pendidikan Agama Islam, 11(3), 402–413. [CrossRef]
- Lubis, R. A., Fitriani, N., & Sariningsih, R. (2023). Penerapan model Discovery Learning berbantuan E-LKPD untuk meningkatkan kemampuan komunikasi matematis siswa kelas X MA pada materi SPLTV. Jurnal Pembelajaran Matematika Inovatif, 6(4), 1473–1483.
- Luciana, N. (2021). Penerapan model Discovery Learning dalam meningkatkan kualitas pembelajaran dan hasil belajar matematika peminatan mengenai rumus jumlah dan selisih sinus dan kosinus dua sudut pada siswa kelas XI IPA 1 SMA Negeri 1 Cisaat. CENDEKIA: Jurnal Ilmu Pengetahuan, 1(2), 106–111. [CrossRef]
- Lutfiyah, L., & Sulisawati, D. N. (2019). Efektivitas pembelajaran matematika menggunakan media berbasis e-learning. Jurnal Pendidikan Matematika (JUDIKA EDUCATION), 2(1), 58–65. [CrossRef]
- Maf, S., Wulandari, S., Jauhariyah, L., & Arif, N. (2021). Pembelajaran matematika dengan media software GeoGebra materi dimensi tiga. Mosharafa: Jurnal Pendidikan Matematika, 10(3), 449–460.
- Millati, D. Y. I., & Prihaswati, M. (2020). Analisis minat belajar siswa pada materi SPTLDV berbantu aplikasi Geogebra. EDUSAINTEK, 4(0). https://prosiding.unimus.ac.id/index.php/edusaintek/article/view/537.
- Muhammad, I., & Juandi, D. (2023). Model Discovery Learning pada pembelajaran matematika sekolah menengah pertama: A bibliometric review. Euler: Jurnal Ilmiah Matematika, Sains dan Teknologi, 11(1), 74–88. [CrossRef]
- Nasution, N. A., & Lubis, M. R. (2021). Efektivitas pengembangan perangkat pembelajaran berdasarkan pembelajaran inkuiri berbasis budaya berbantuan Geogebra. AXIOM: Jurnal Pendidikan dan Matematika, 10(2), 133–142. [CrossRef]
- Novita, L., Windiyani, T., & Sakinah, A. R. (2020). Pengaruh penerapan model Discovery Learning terhadap hasil belajar matematika siswa. Widyagogik: Jurnal Pendidikan dan Pembelajaran Sekolah Dasar, 7(2), 148–163. [CrossRef]
- Nurhayati, L., & Setiawan, W. (2019). Analisis minat belajar matematika siswa SMA pada materi program linier berbantuan aplikasi Geogebra. Journal on Education, 2(1), 1–8. [CrossRef]
- Patmawati, P., Ahmad, H., & Febryanti, F. (2022). Penerapan model pembelajaran Diskursus Multy Refrecentacy dengan aplikasi GeoGebra terhadap peningkatan kemampuan komunikasi matematis. Journal Peqguruang: Conference Series, 4(1), 302–309. [CrossRef]
- Pertiwi, F. A., Luayyin, R. H., & Arifin, M. (2023). Problem Based Learning untuk meningkatkan keterampilan berpikir kritis: Meta analisis. JSE: Jurnal Sharia Economica, 2(1), 42–49. [CrossRef]
- Purnomo, J. (2021). Kebermanfaatan penggunaan Geogebra dalam pembelajaran matematika. Idealmathedu: Indonesian Digital Journal of Mathematics and Education, 8(1), 9–22. [CrossRef]
- Fatihah, A., & Yahfizham, Y. (2024). Penerapan GeoGebra terhadap kemampuan pemecahan masalah matematis siswa dalam pembelajaran matematika. Pendekar: Jurnal Pendidikan Berkarakter, 2(3). [CrossRef]
- Hayati, Z., & Ulya, K. (2022). Developing students’ mathematical understanding using GeoGebra software. Jurnal Ilmiah Didaktika: Media Ilmiah Pendidikan dan Pengajaran, 22(2). [CrossRef]
- Irvan, I. (2024). Application of integrals in calculating ball volume using GeoGebra. Indonesian Journal of Education and Mathematical Science, 5(1). [CrossRef]
- Thomas Jr., G. B., Weir, M. D., & Hass, J. R. (2014). Thomas’ Calculus (13th ed.). Pearson.
- Kado, & Dem, N. (2020). Effectiveness of GeoGebra in developing the conceptual understanding of definite integral at Gongzim Ugyen Dorji Central School, Haa, Bhutan. Asian Journal of Education and Social Studies, 60–65. [CrossRef]
- Maf’ulah, S., Wulandari, S., Jauhariyah, L., & Ngateno. (2021). Pembelajaran matematika dengan media software GeoGebra materi dimensi tiga. Mosharafa: Jurnal Pendidikan Matematika, 10(3). [CrossRef]
- Meldi, N. F., Khoriyani, R. P., Susanti, W., Ahmad, D., & Rif’at, M. (2022). Implementasi teknologi digital dalam perkuliahan mata kuliah kalkulus integral dalam penyelesaian luas daerah antarkurva. Jurnal Alwatzikhoebillah: Kajian Islam, Pendidikan, Ekonomi, Humaniora, 8(2). [CrossRef]
- Miles, M. B., Huberman, A. M., & Saldana, J. (2013). Qualitative data analysis: A methods sourcebook. SAGE Publications.
- Nasution, A. E., Irvan, I., & Batubara, I. H. (2020). Penerapan model Problem-Based Learning dan etnomatematik berbantuan GeoGebra untuk meningkatkan kemampuan komunikasi matematis. Journal of Mathematics Education Sigma (JMES), 1(2). [CrossRef]
- Nongharnpituk, P., Yonwilad, W., & Khansila, P. (2022). The effect of GeoGebra software in calculus for mathematics teacher students. Journal of Educational Issues, 8(2), 755–770.
- Nuratifah, S., T., A. Y., Siregar, N., & Meldi, N. F. (2024). Peran aplikasi GeoGebra dalam kemampuan representasi visual matematis siswa pada materi fungsi. J-PiMat: Jurnal Pendidikan Matematika, 6(2). [CrossRef]
- Sofyan, D., Puspitasari, N., Maryati, I., Basuki, B., & Madio, S. (2020). The effects of GeoGebra on problem-solving skills in integral calculus. In Proceedings of the 1st International Conference on Islam, Science and Technology (ICONISTECH 2019), 11–12 July 2019, Bandung, Indonesia. [CrossRef]
- Stewart, J. (2020). Calculus: Early transcendentals (8th ed.). Cengage Learning. https://openlibrary.telkomuniversity.ac.id/pustaka/159921/calculus-early-transcendentals-8-e-.html.
- Subagio, L., Karnasih, I., & Irvan, I. (2021). Meningkatkan motivasi belajar siswa dengan menerapkan model Discovery Learning dan Problem-Based Learning berbantuan GeoGebra. Jurnal Pendidikan Matematika Raflesia, 6(2). [CrossRef]
- Sugiyono, & Suryandari, S. Y. (2017). Metode penelitian kualitatif: Untuk penelitian yang bersifat eksploratif, interpretif, interaktif, dan konstruktif (1st ed.). Alfabeta.
- Tasman, F., & Ahmad, D. (2018). Visualizing volume to help students understand the disk method in integral calculus course. IOP Conference Series: Materials Science and Engineering, 335(1), 012112. [CrossRef]
Figure 1.
GeoGebra interface displaying the formula for calculating the surface area using the shell method.
Figure 1.
GeoGebra interface displaying the formula for calculating the surface area using the shell method.
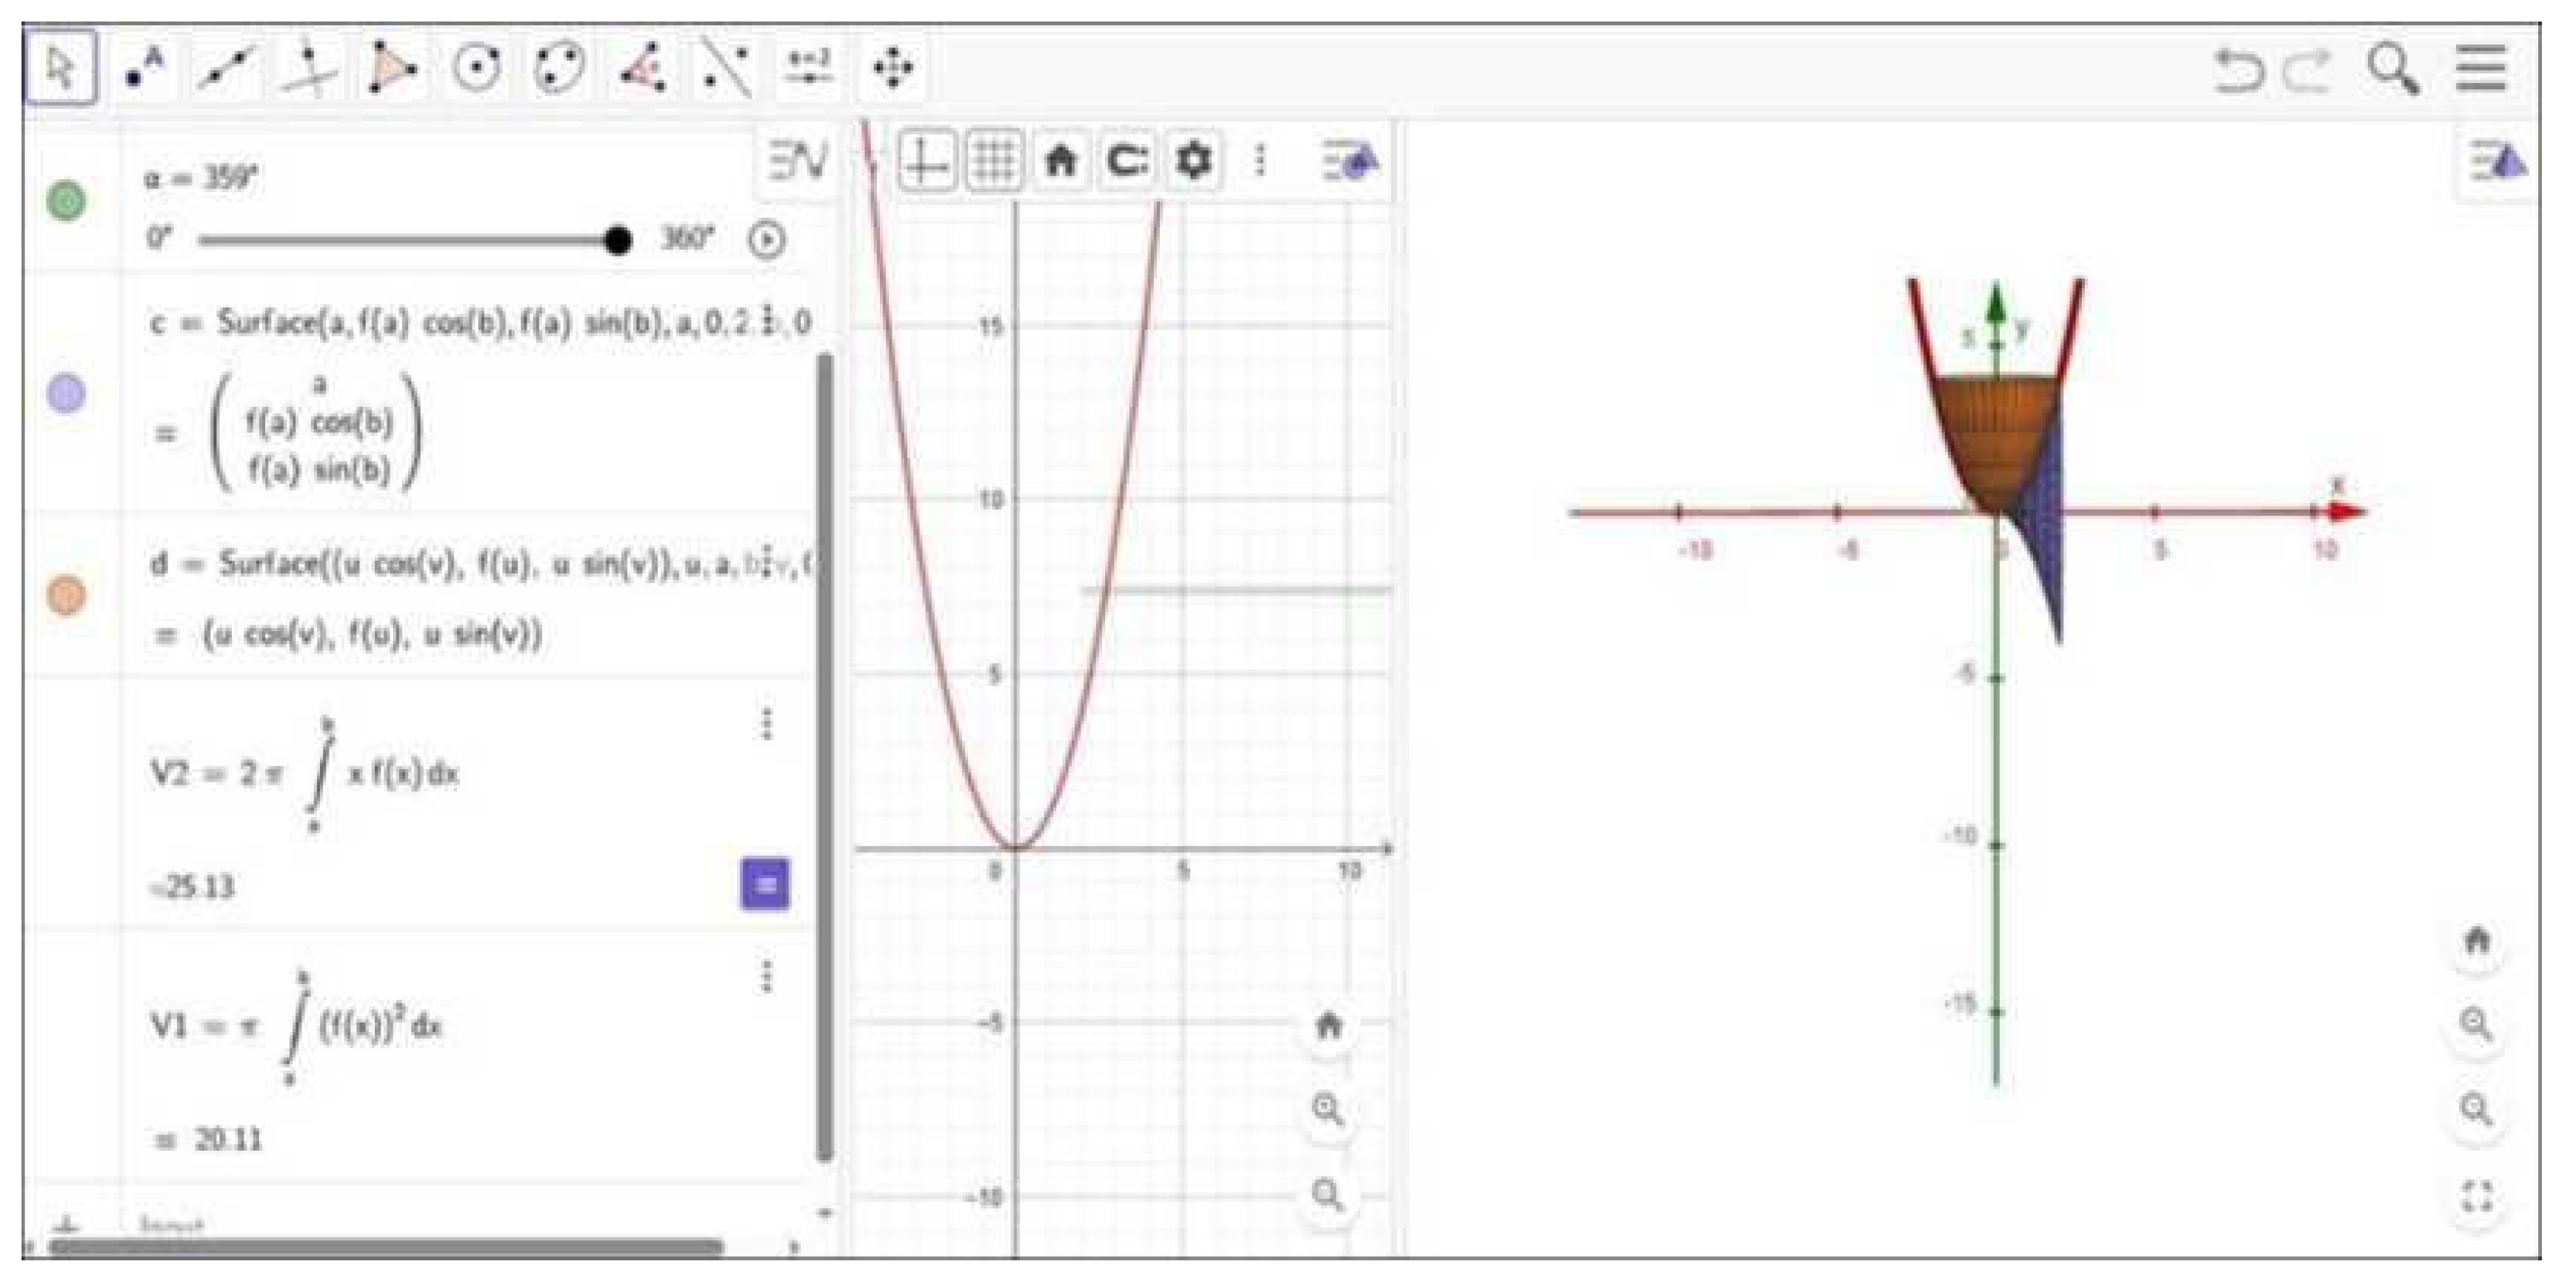
Figure 2.
Solid of revolution from rotating over about the x-axis (disk method) and y-axis (shell method). The resulting paraboloid and hollow cylindrical shell are clearly rendered, allowing inspection of cross-sectional geometry.
Figure 2.
Solid of revolution from rotating over about the x-axis (disk method) and y-axis (shell method). The resulting paraboloid and hollow cylindrical shell are clearly rendered, allowing inspection of cross-sectional geometry.
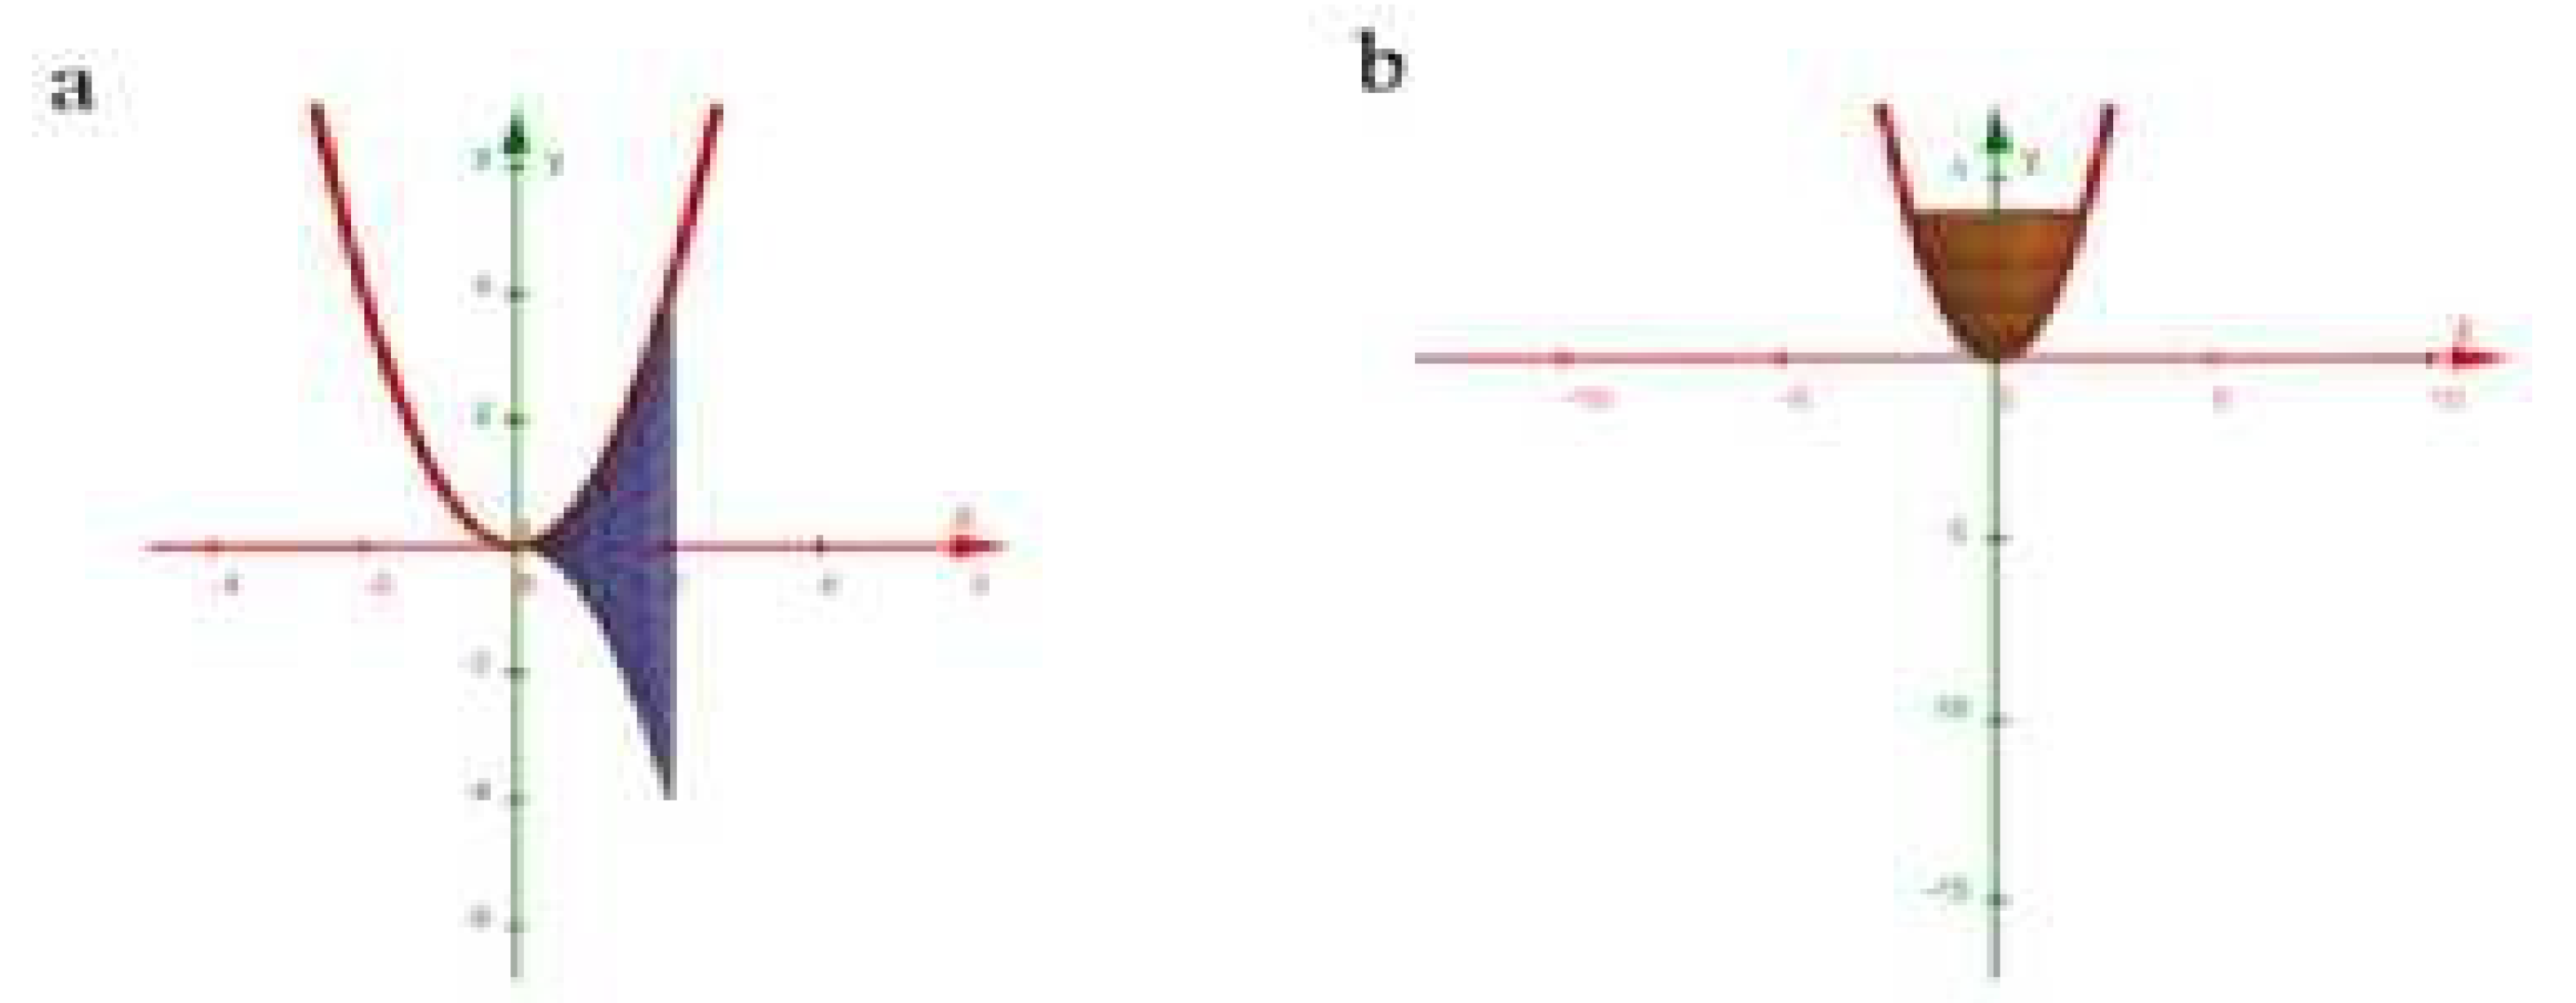
Figure 3.
3D visualization of the volume of the solid of revolution generated by the linear curve with respect to (a) the x-axis and (b) the y-axis.
Figure 3.
3D visualization of the volume of the solid of revolution generated by the linear curve with respect to (a) the x-axis and (b) the y-axis.
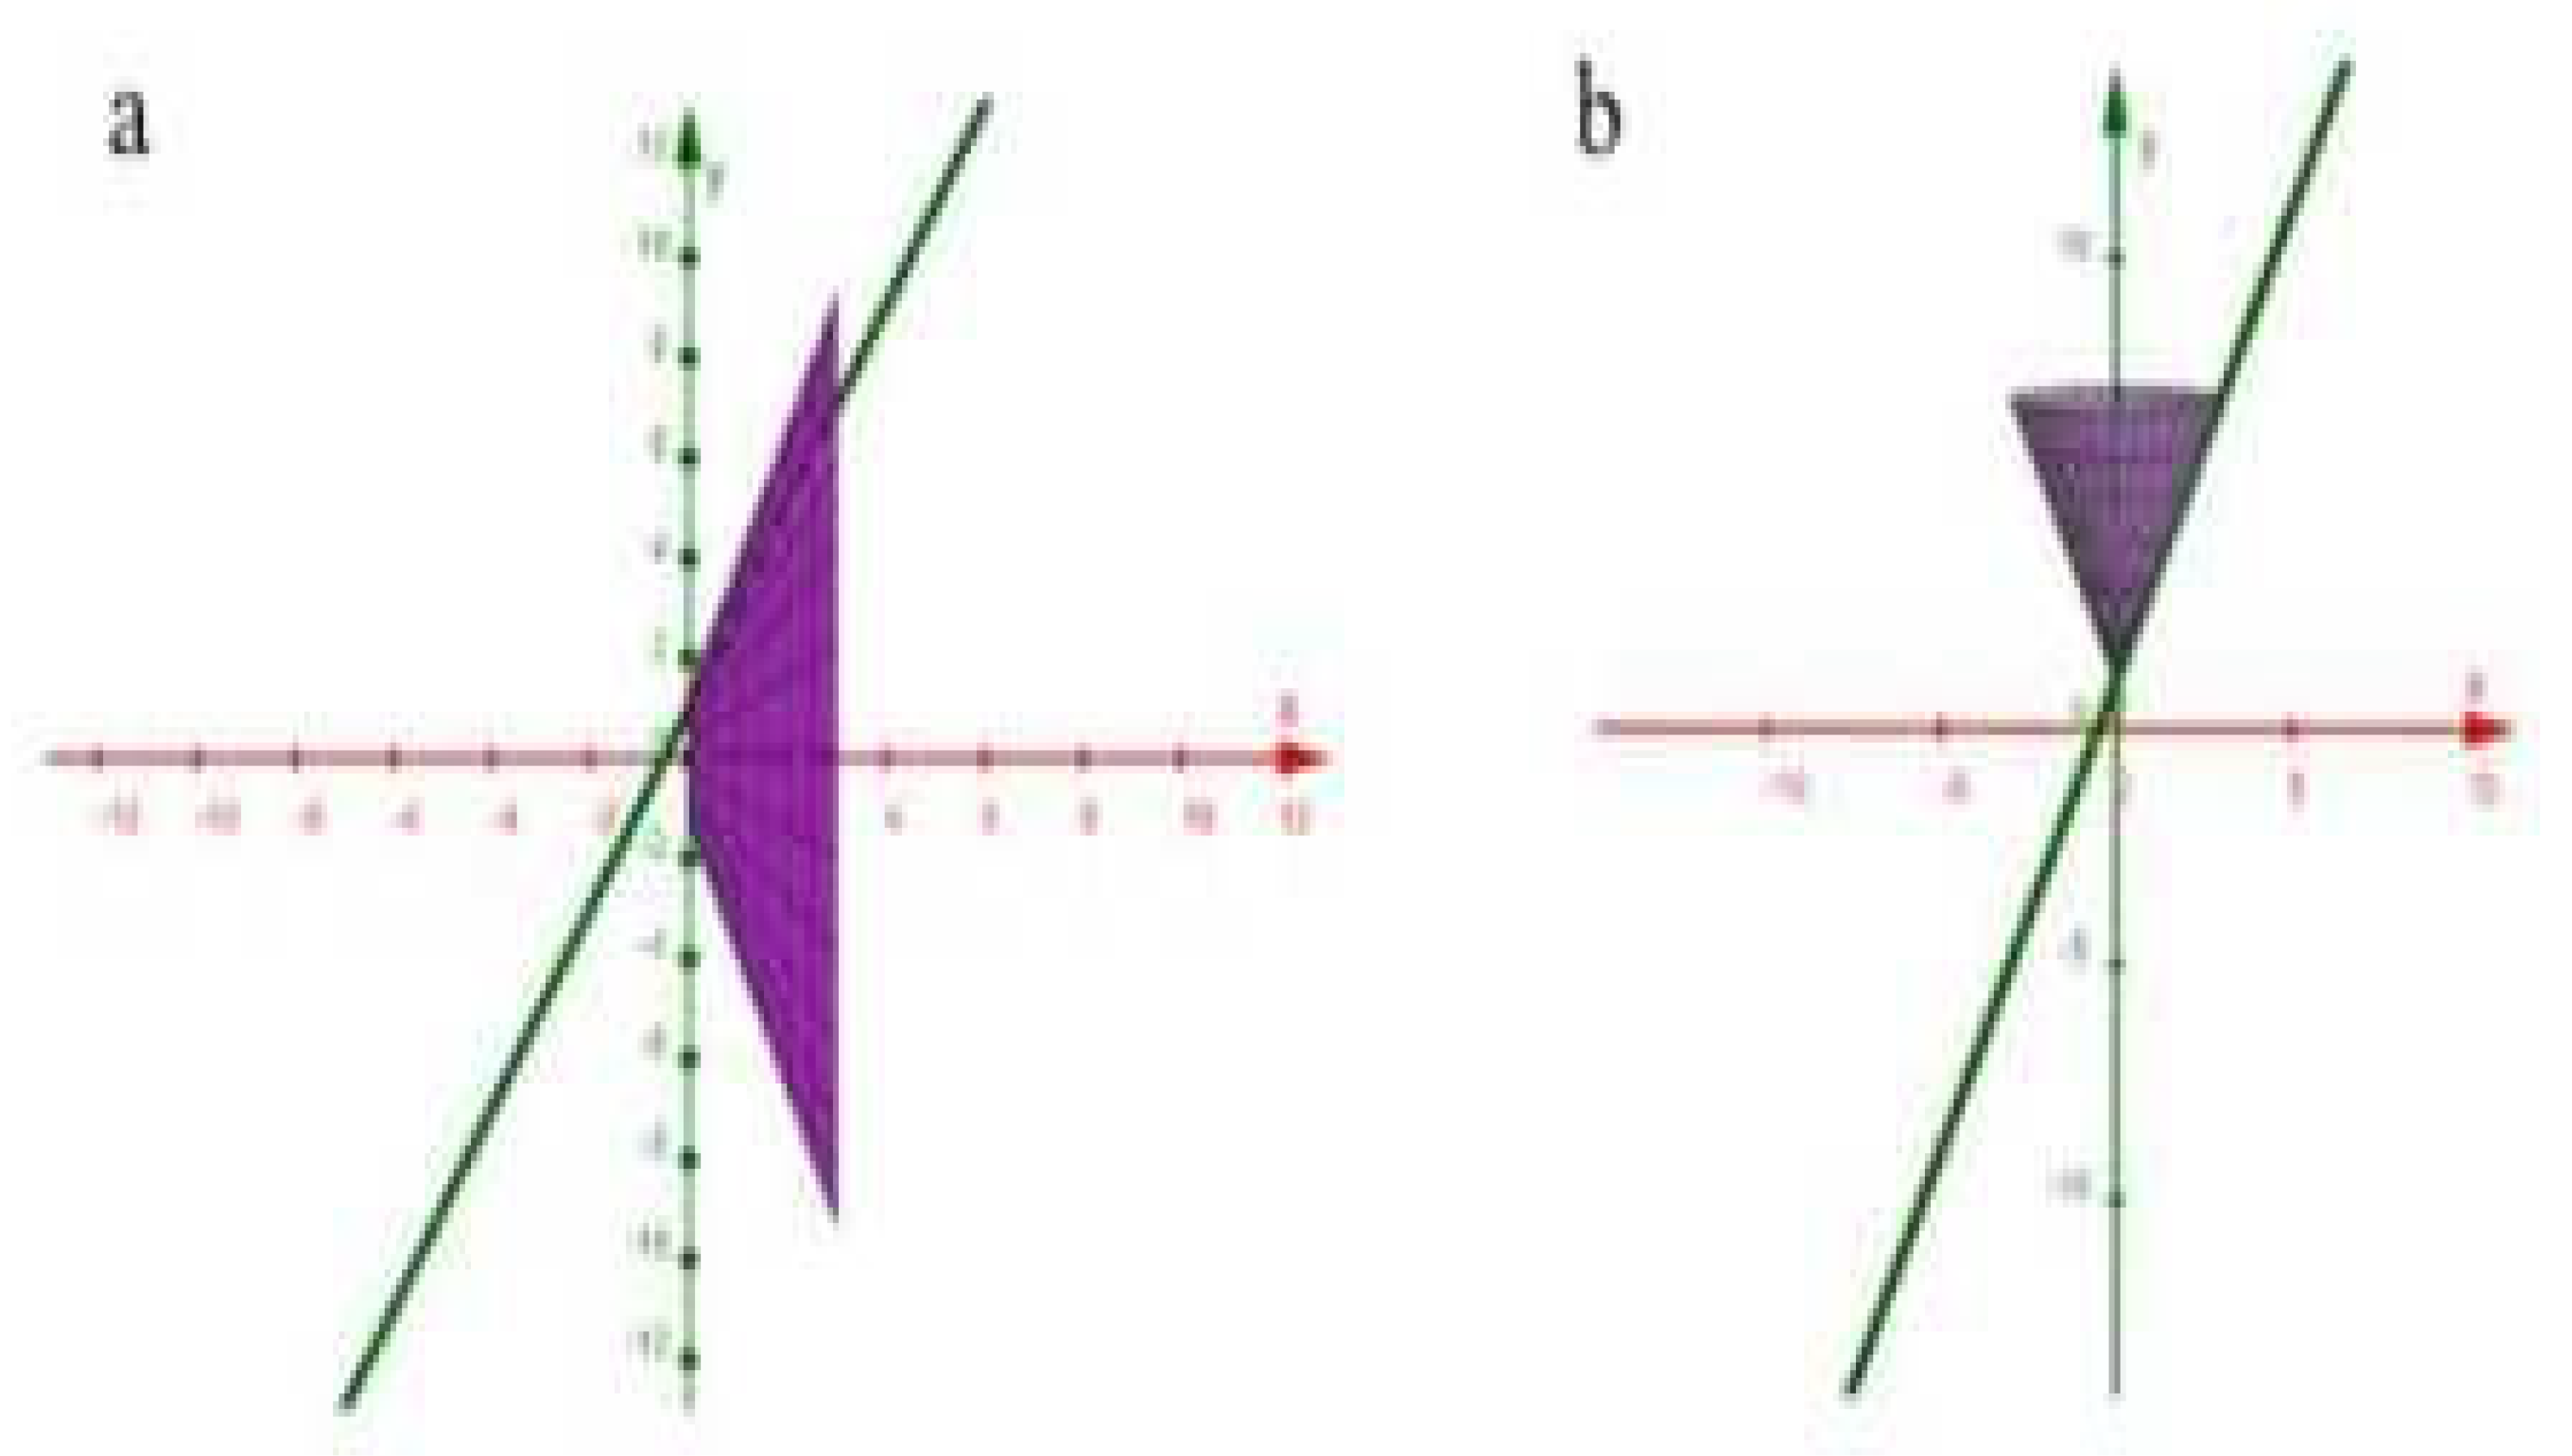
Figure 4.
3D visualization of the volume of the solid of revolution generated by the trigonometric curve with respect to (a) the x-axis and (b) the y-axis.
Figure 4.
3D visualization of the volume of the solid of revolution generated by the trigonometric curve with respect to (a) the x-axis and (b) the y-axis.
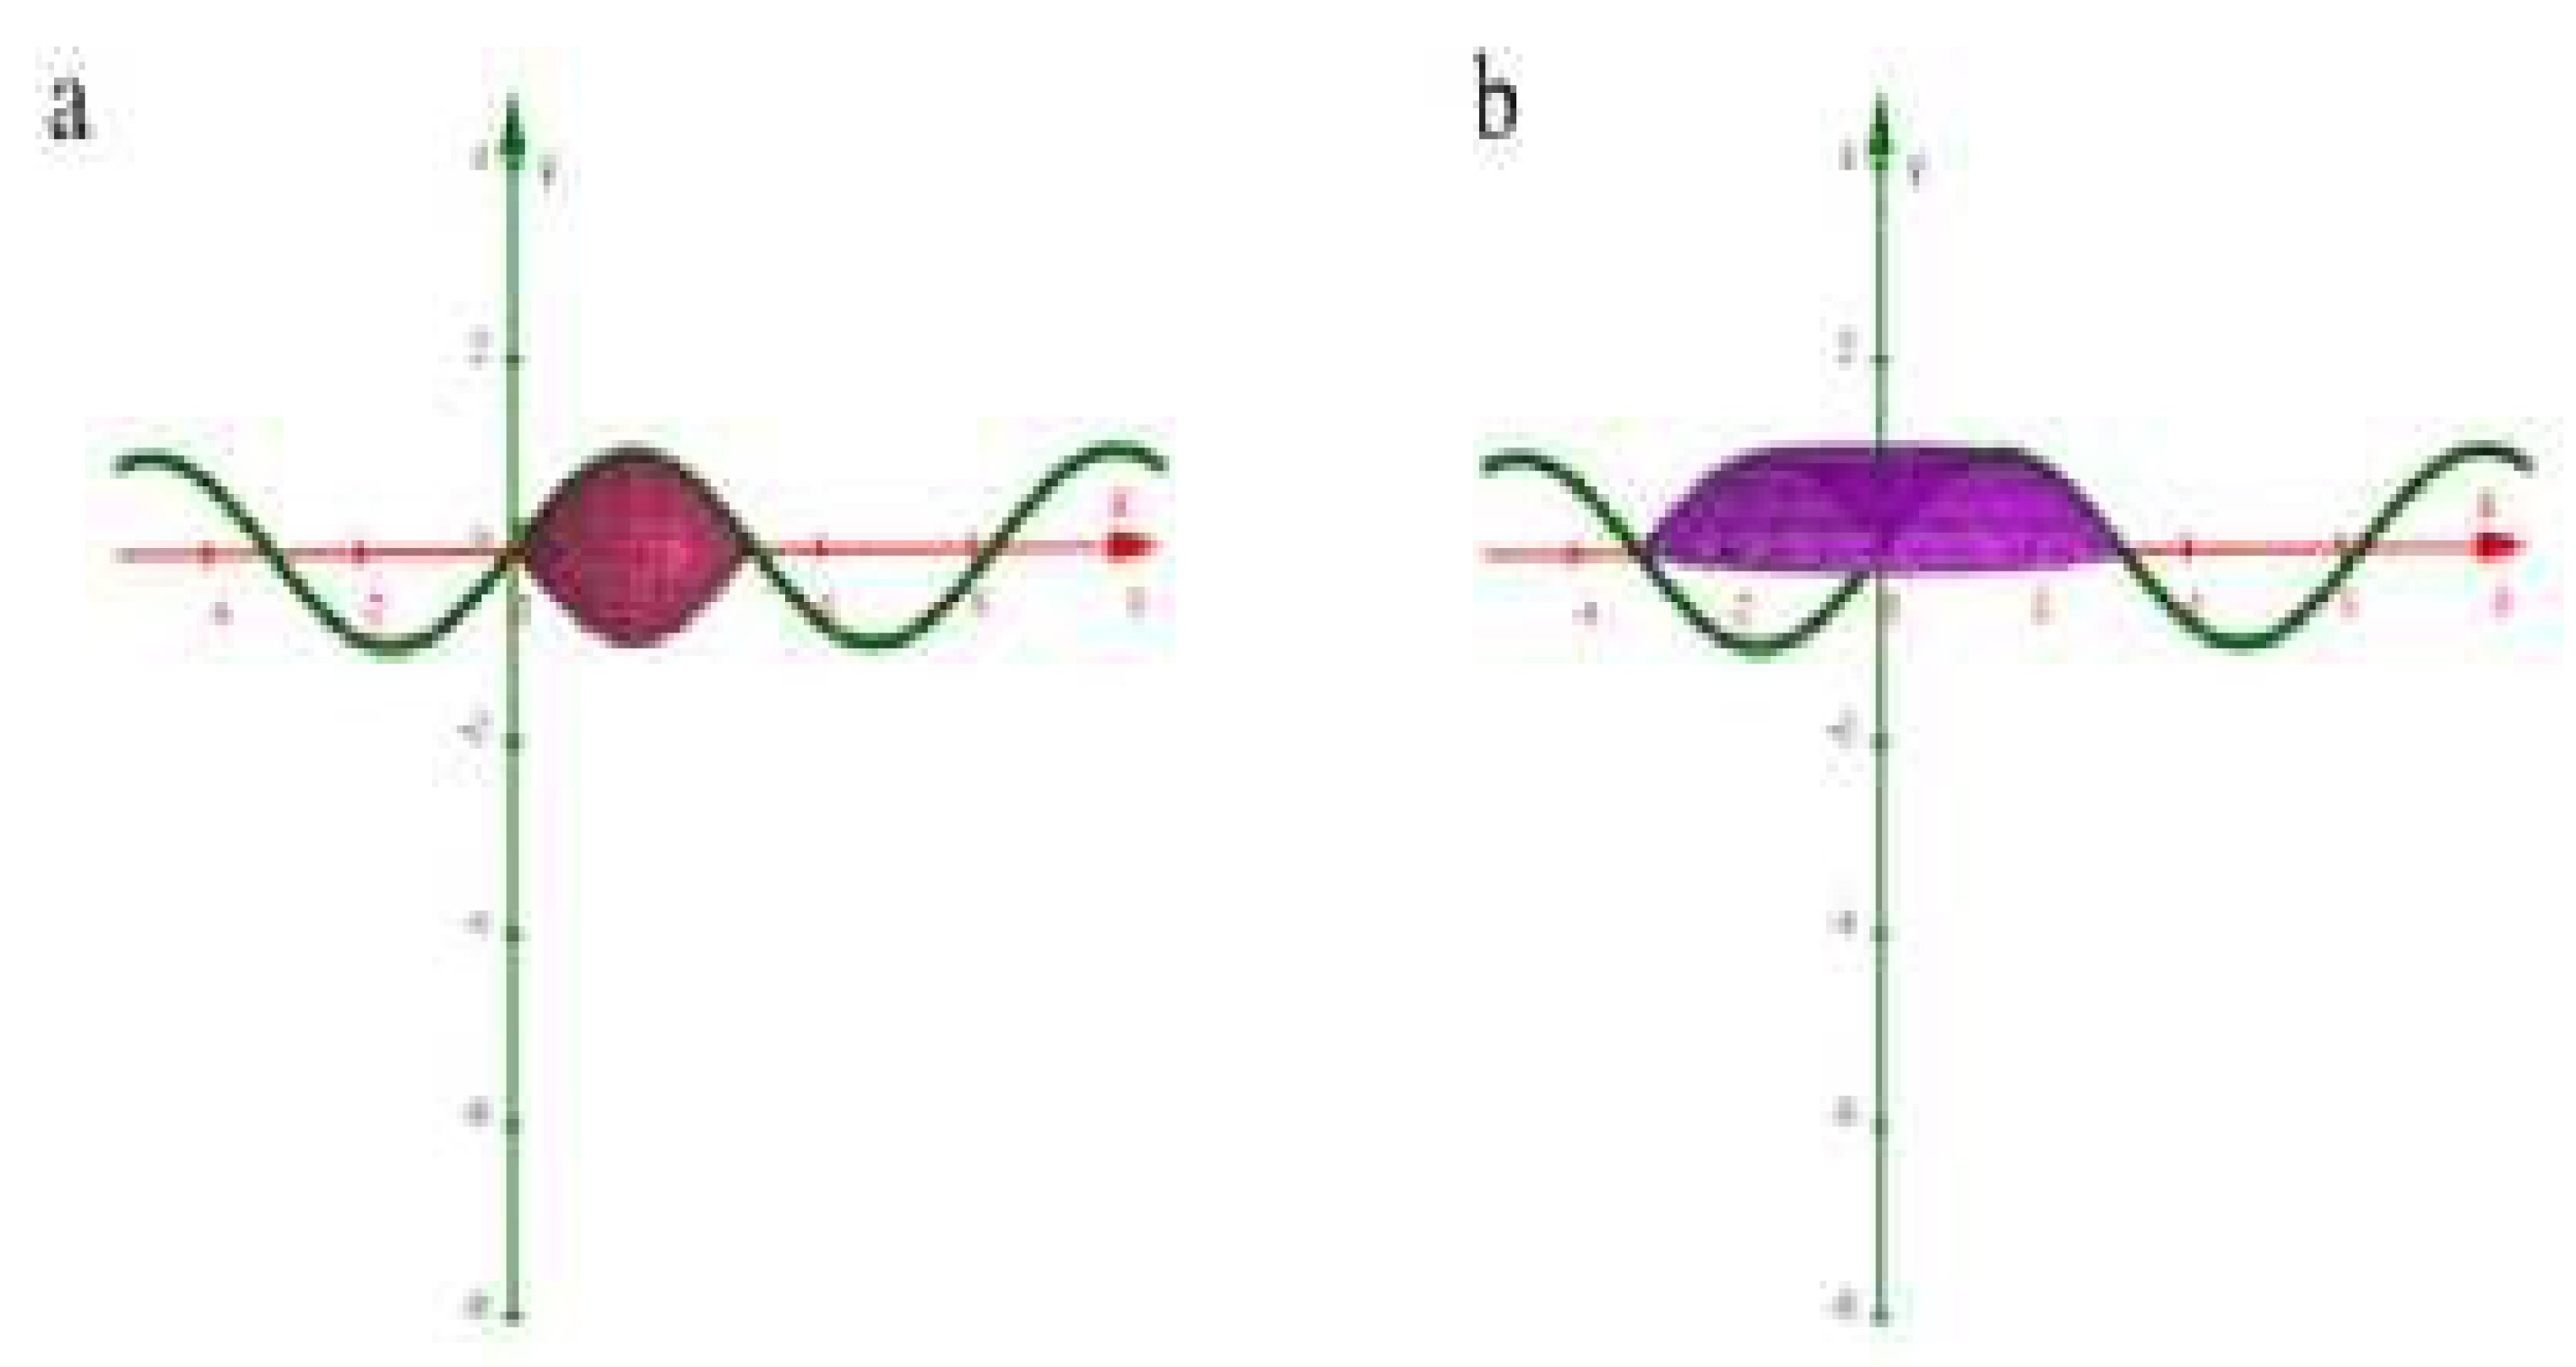
Table 2.
Analytical and Numerical Volume Results for Solids of Revolution.
| No | Curve | Interval | Axis | Method | Analytical Volume | Volume Geogebra | Selisih (%) |
|---|---|---|---|---|---|---|---|
| 1 | y=x2 y = x2 |
[0,2] | X | Disk | 20,096 | 20,11 | 0,069666 |
| 2 | y = 2x + 1 | [0,3] | X | Disk | 178,98 | 179,07 | 0,050285 |
| 3 | y = sin (x) | [0,n] | X | Disk | 4,9298 | 4,93 | 0,004057 |
| 4 | y=x2 y = x2 |
[0,2] | Y | Shell | 25,12 | 25,13 | 0,039809 |
| 5 | y = 2x + 1 | [0,3] | Y | Shell | 141,3 | 141,37 | 0,04954 |
| 6 | y = sin (x) | [0,n] | Y | Shell | 19,7192 | 19,74 | 0,105481 |
Disclaimer/Publisher’s Note: The statements, opinions and data contained in all publications are solely those of the individual author(s) and contributor(s) and not of MDPI and/or the editor(s). MDPI and/or the editor(s) disclaim responsibility for any injury to people or property resulting from any ideas, methods, instructions or products referred to in the content. |
© 2025 by the authors. Licensee MDPI, Basel, Switzerland. This article is an open access article distributed under the terms and conditions of the Creative Commons Attribution (CC BY) license (http://creativecommons.org/licenses/by/4.0/).
Copyright: This open access article is published under a Creative Commons CC BY 4.0 license, which permit the free download, distribution, and reuse, provided that the author and preprint are cited in any reuse.


