Preprint
Article

This version is not peer-reviewed.

Prominin-1 Regulates Retinal Pigment Epithelium Homeostasis: Transcriptomic Insights into Degenerative Mechanisms

Submitted:

03 November 2025

Posted:

04 November 2025

You are already at the latest version

Abstract

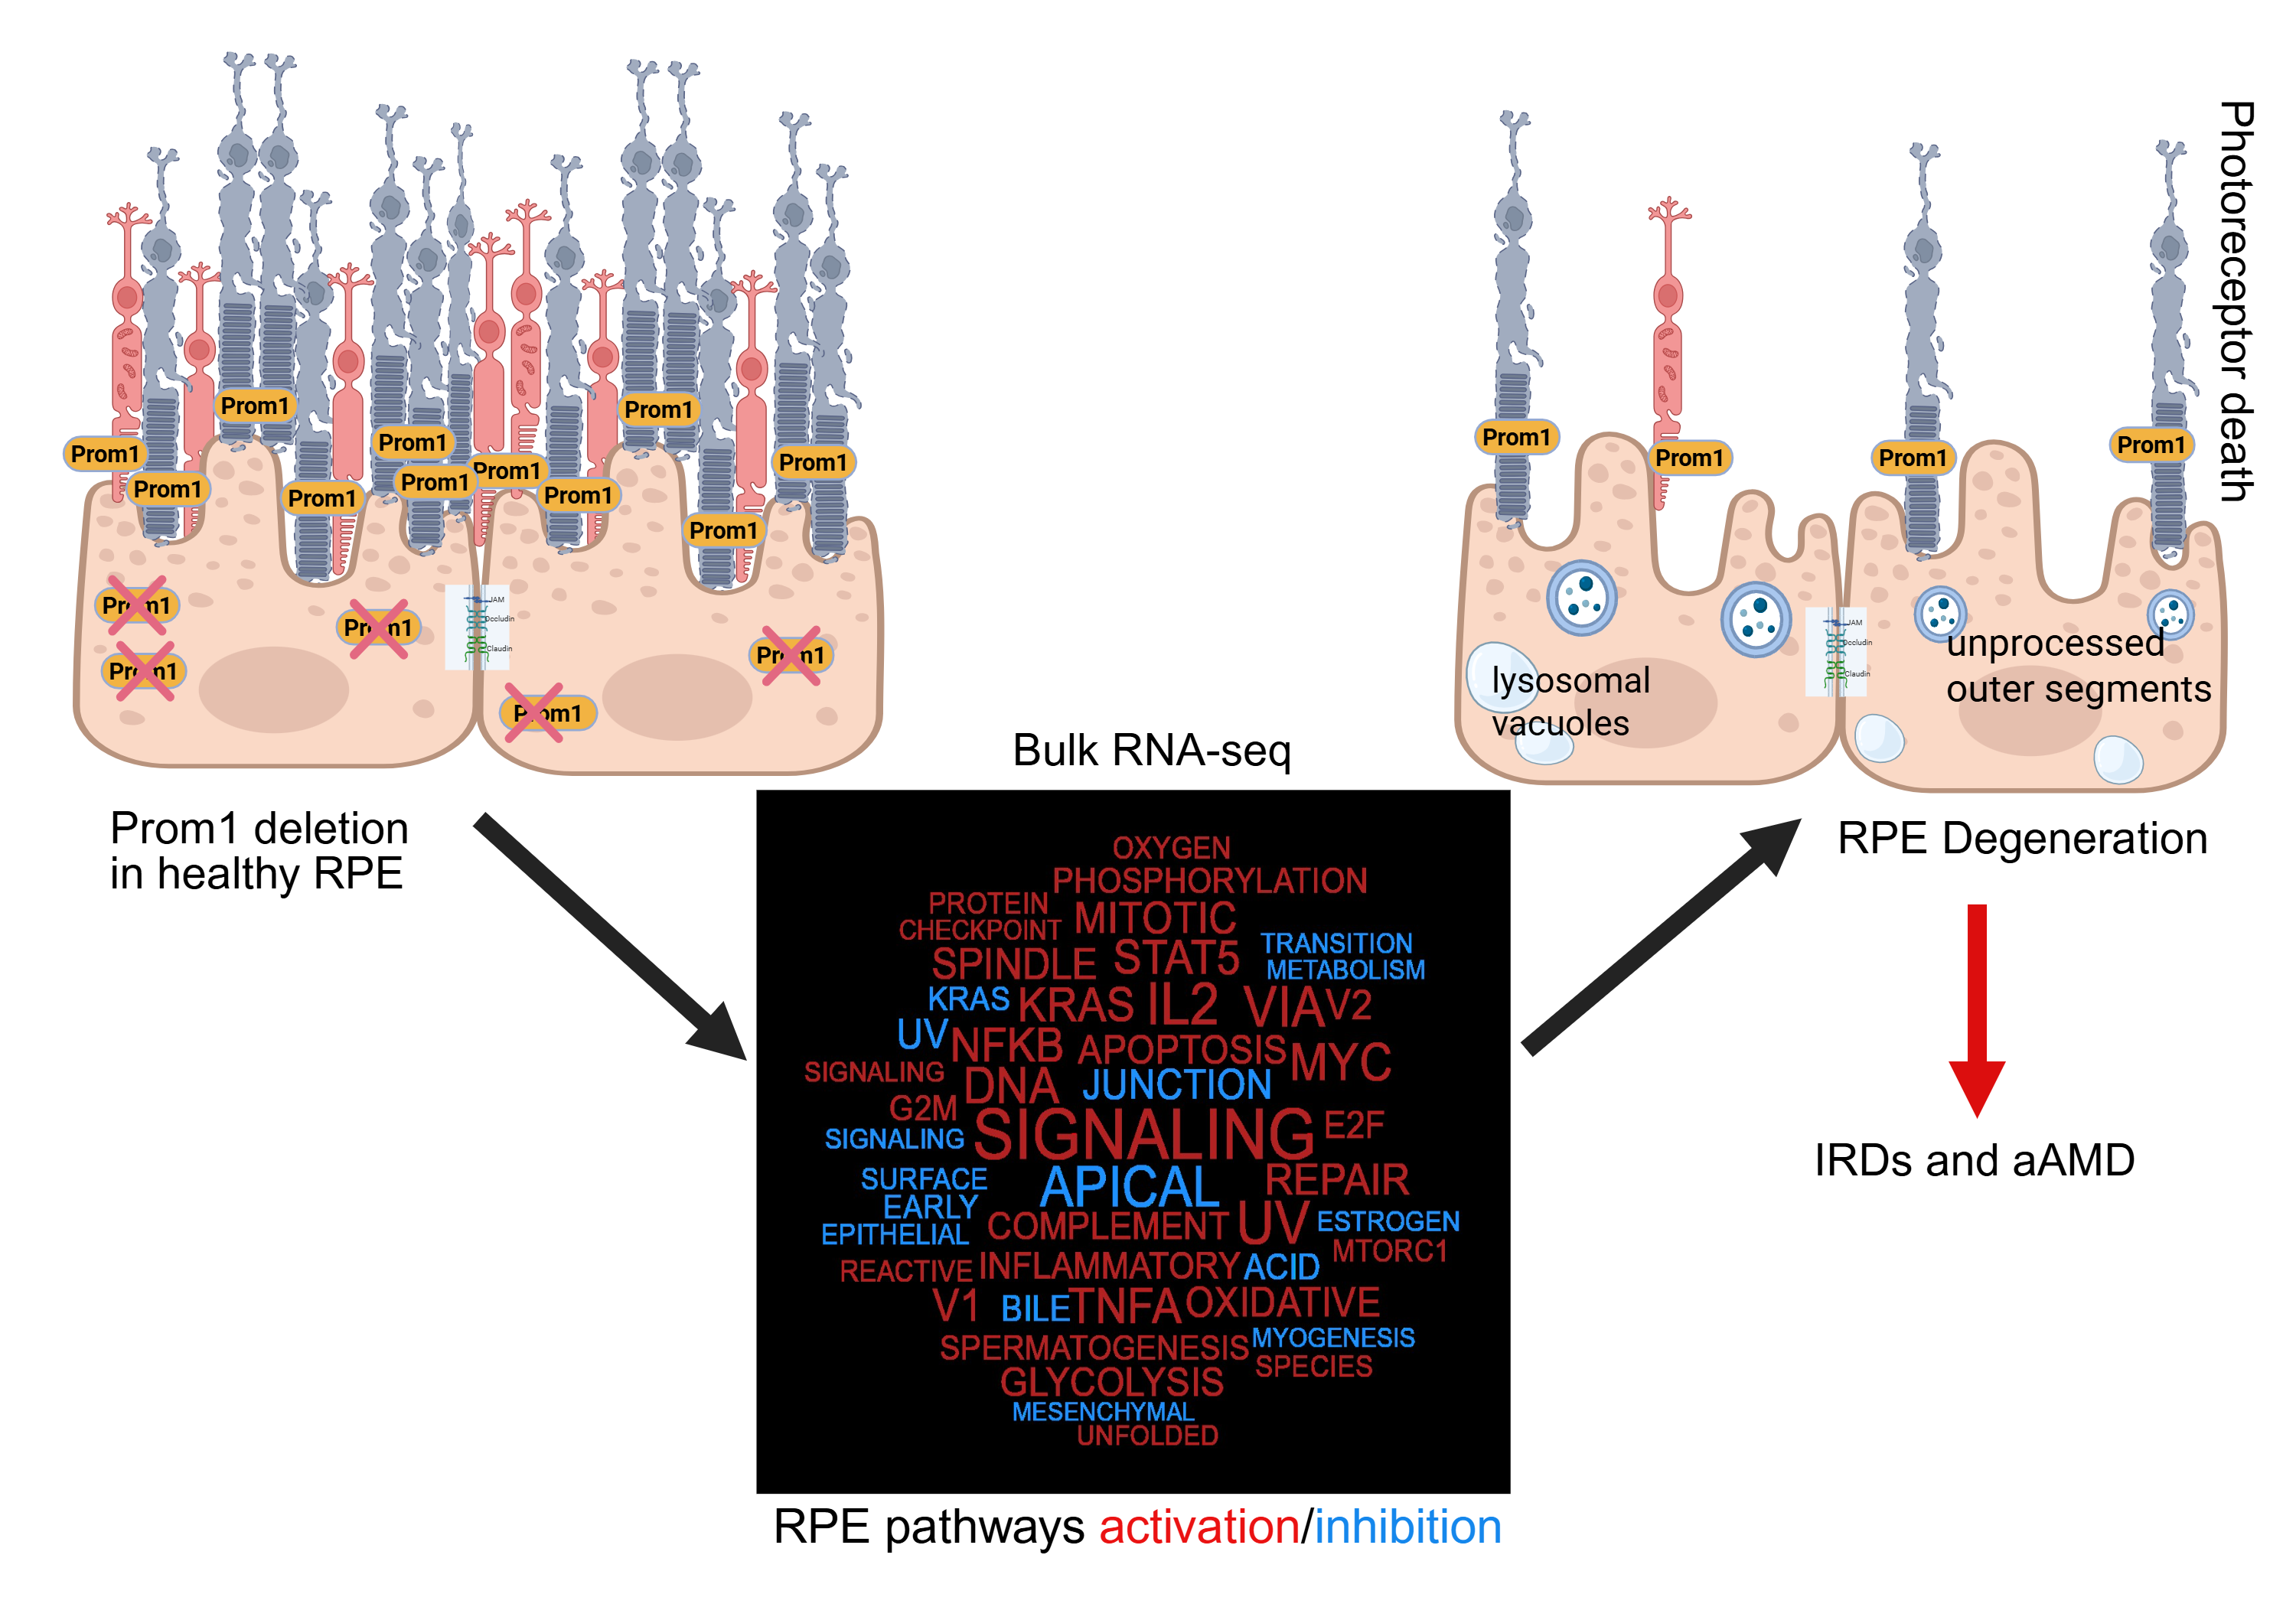
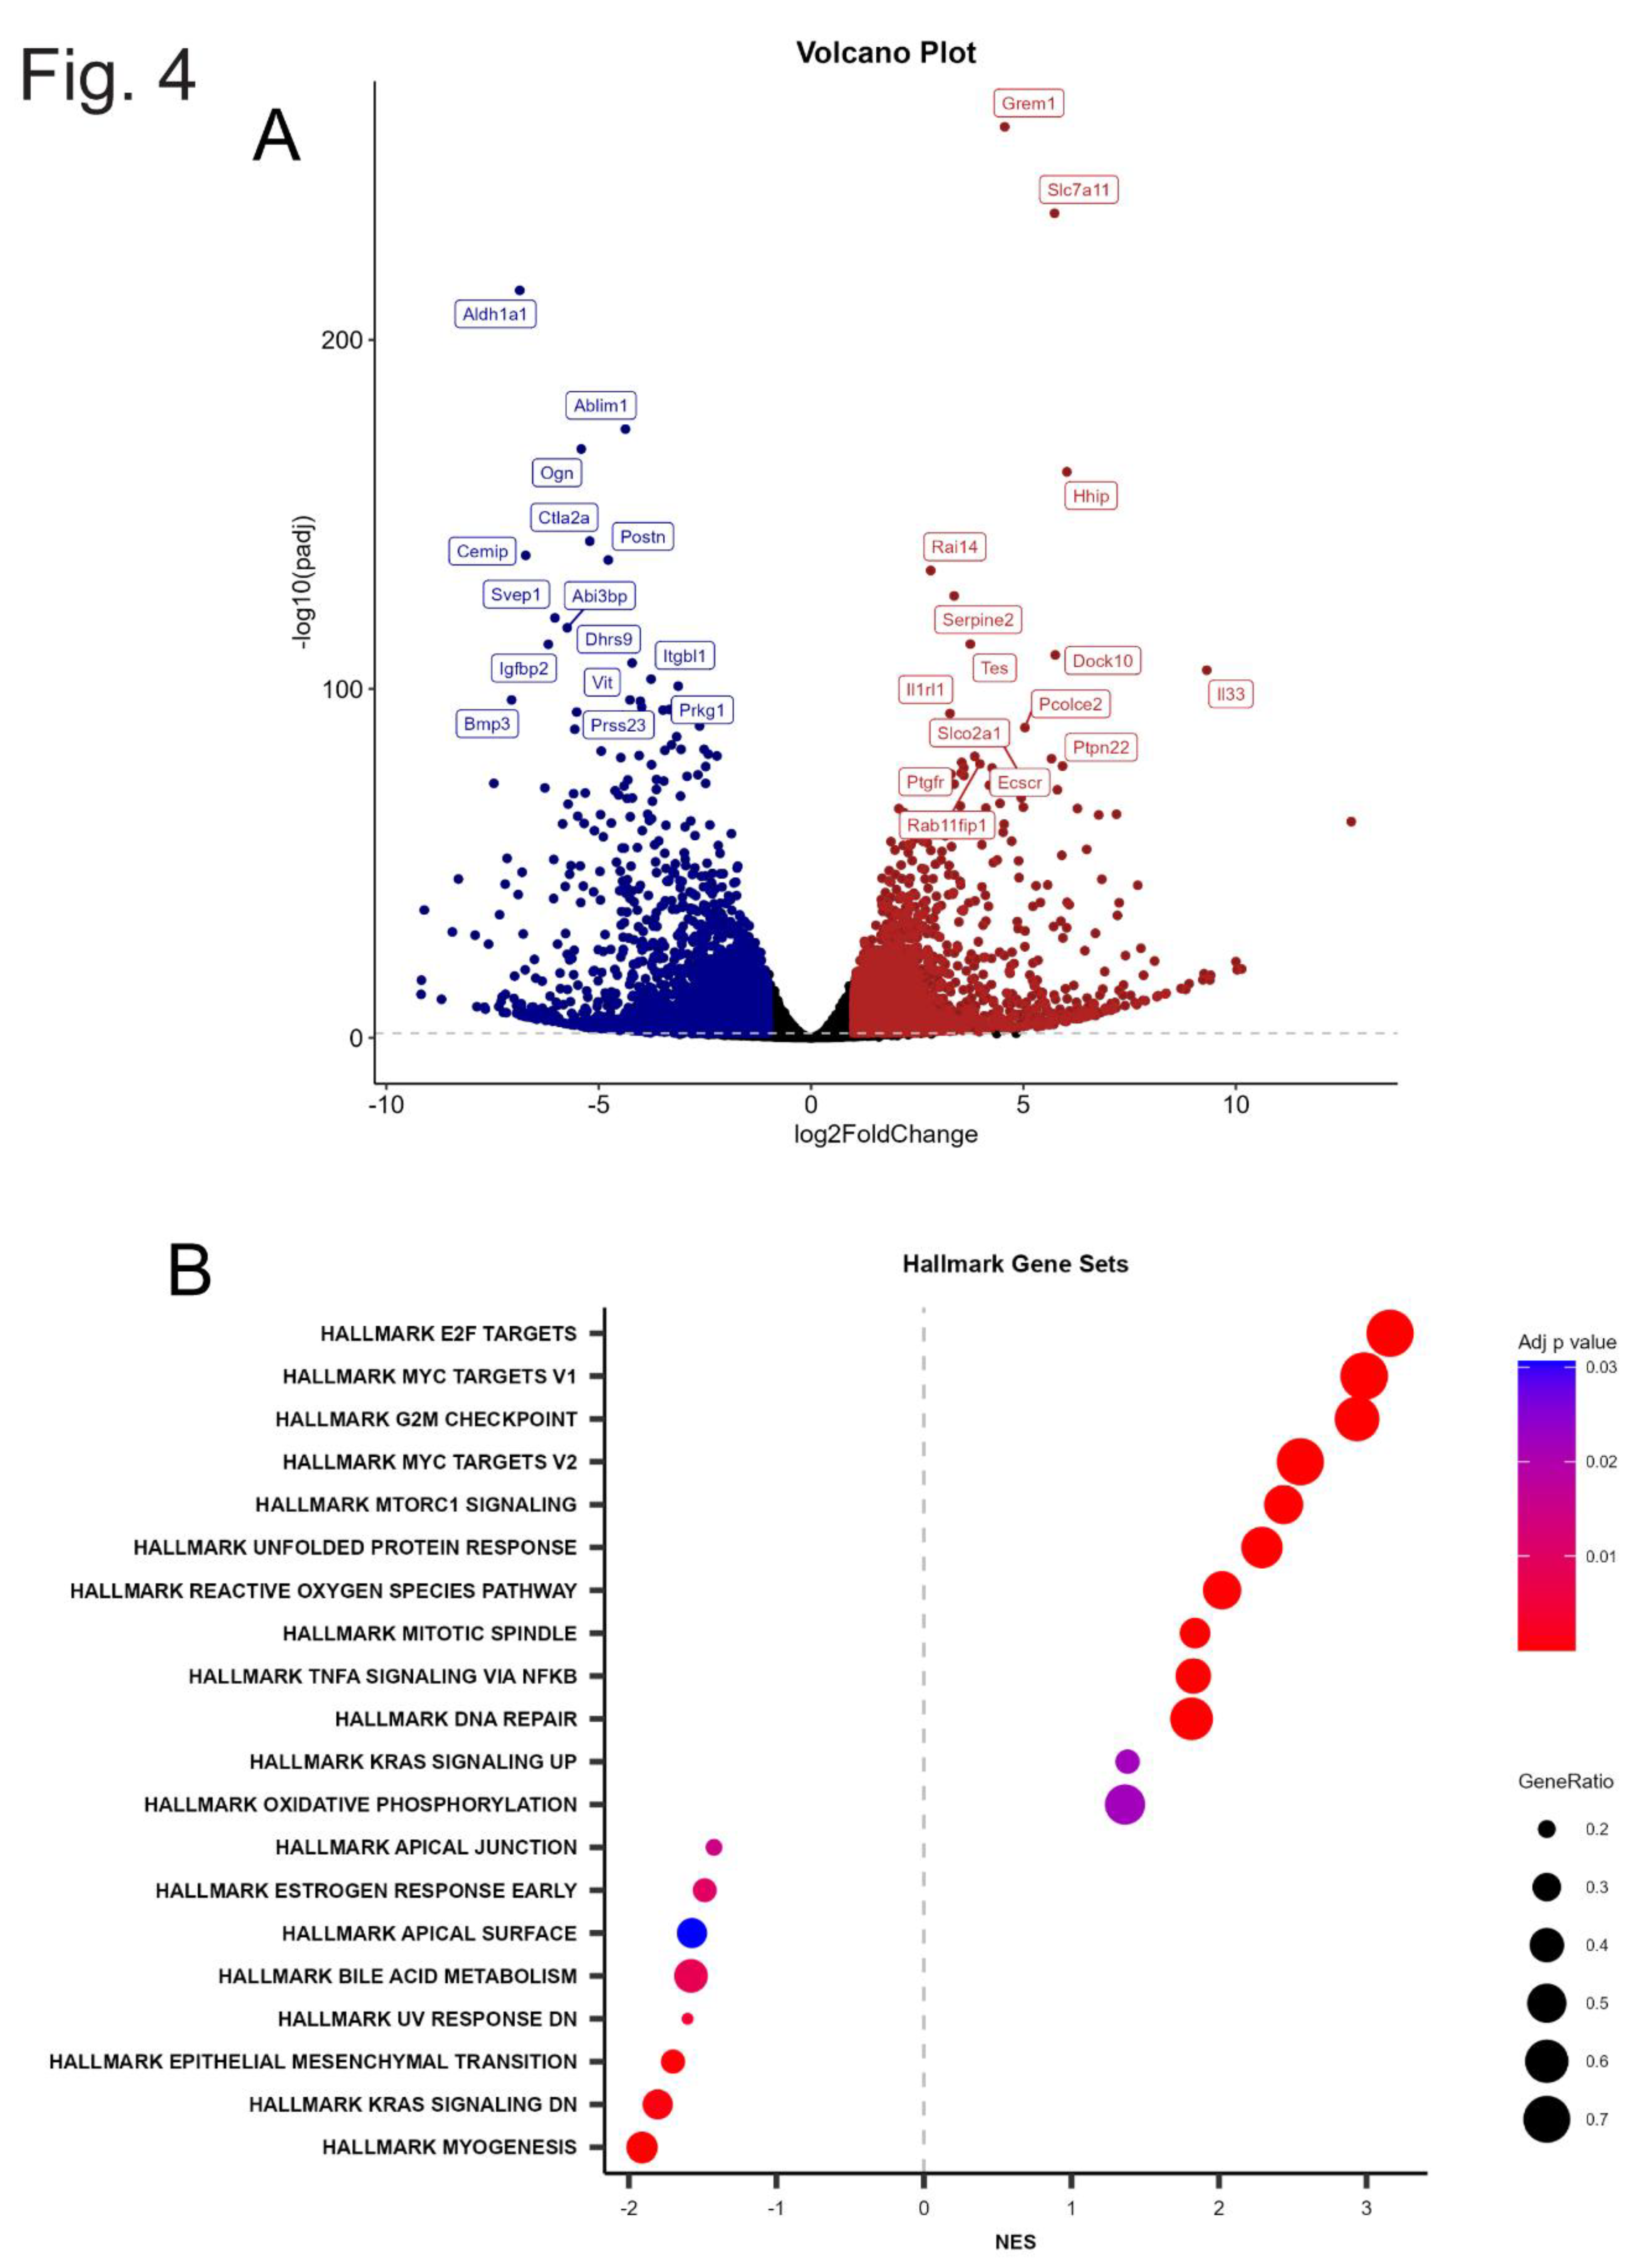
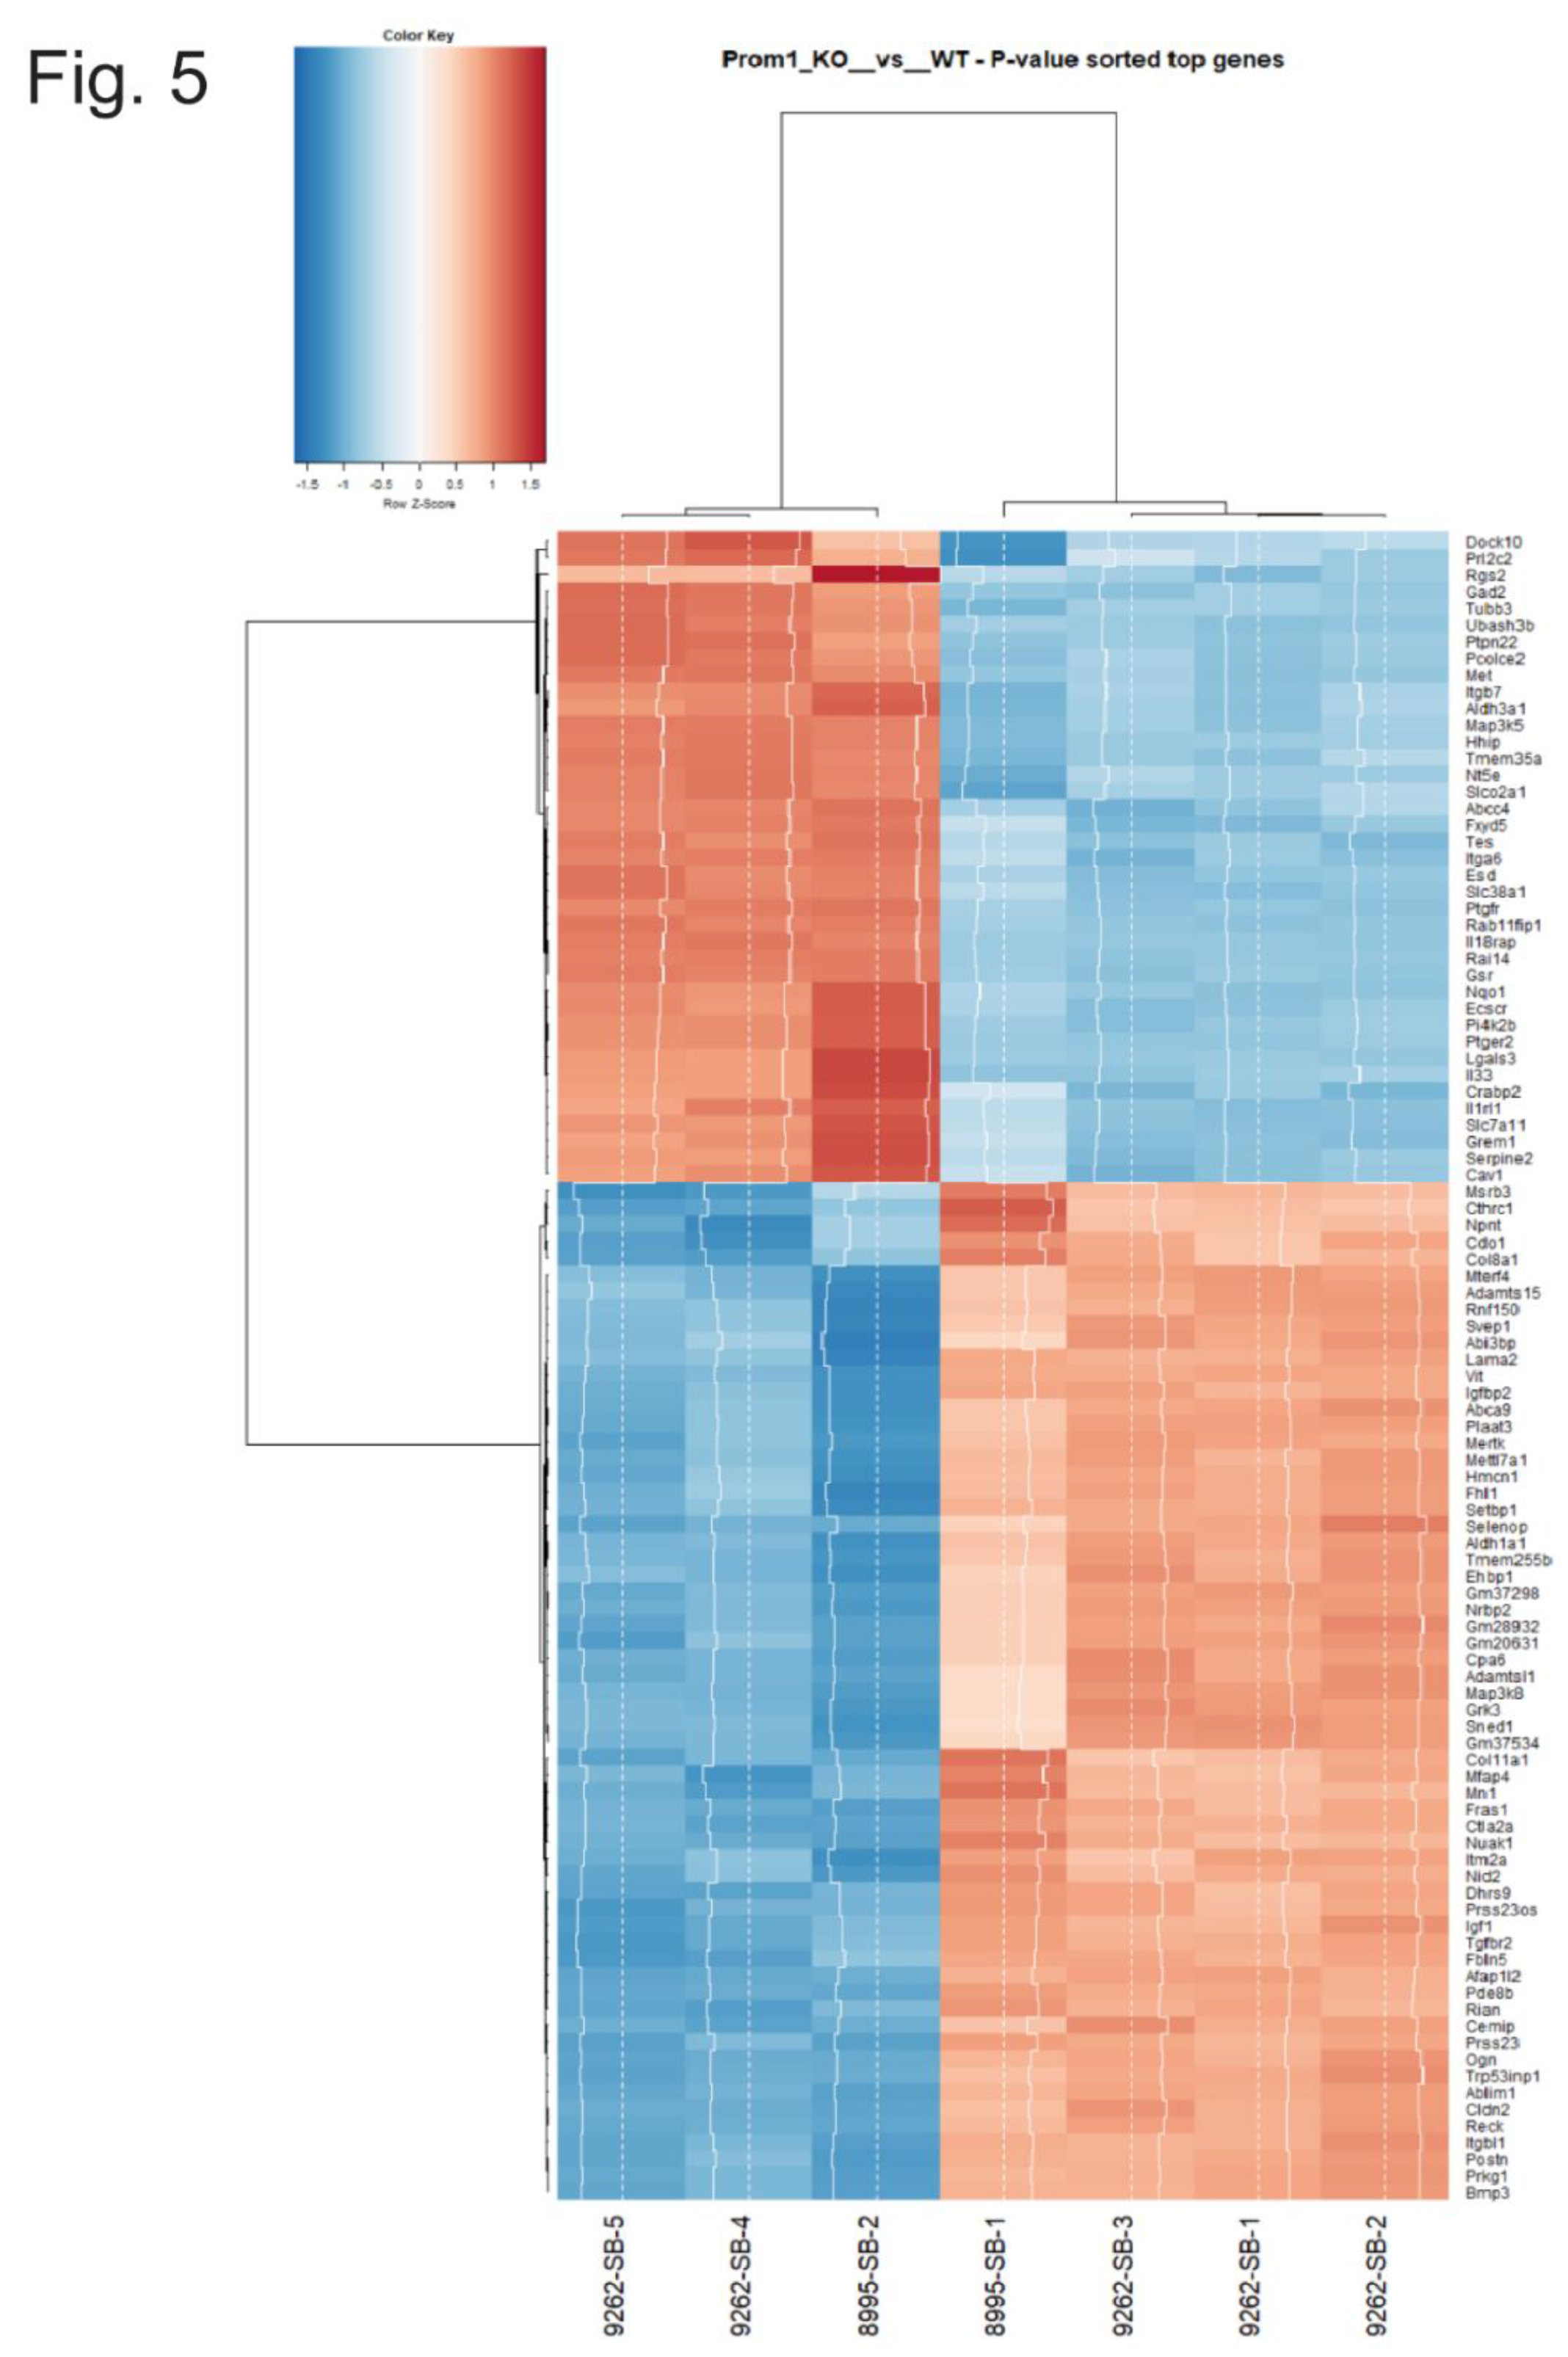
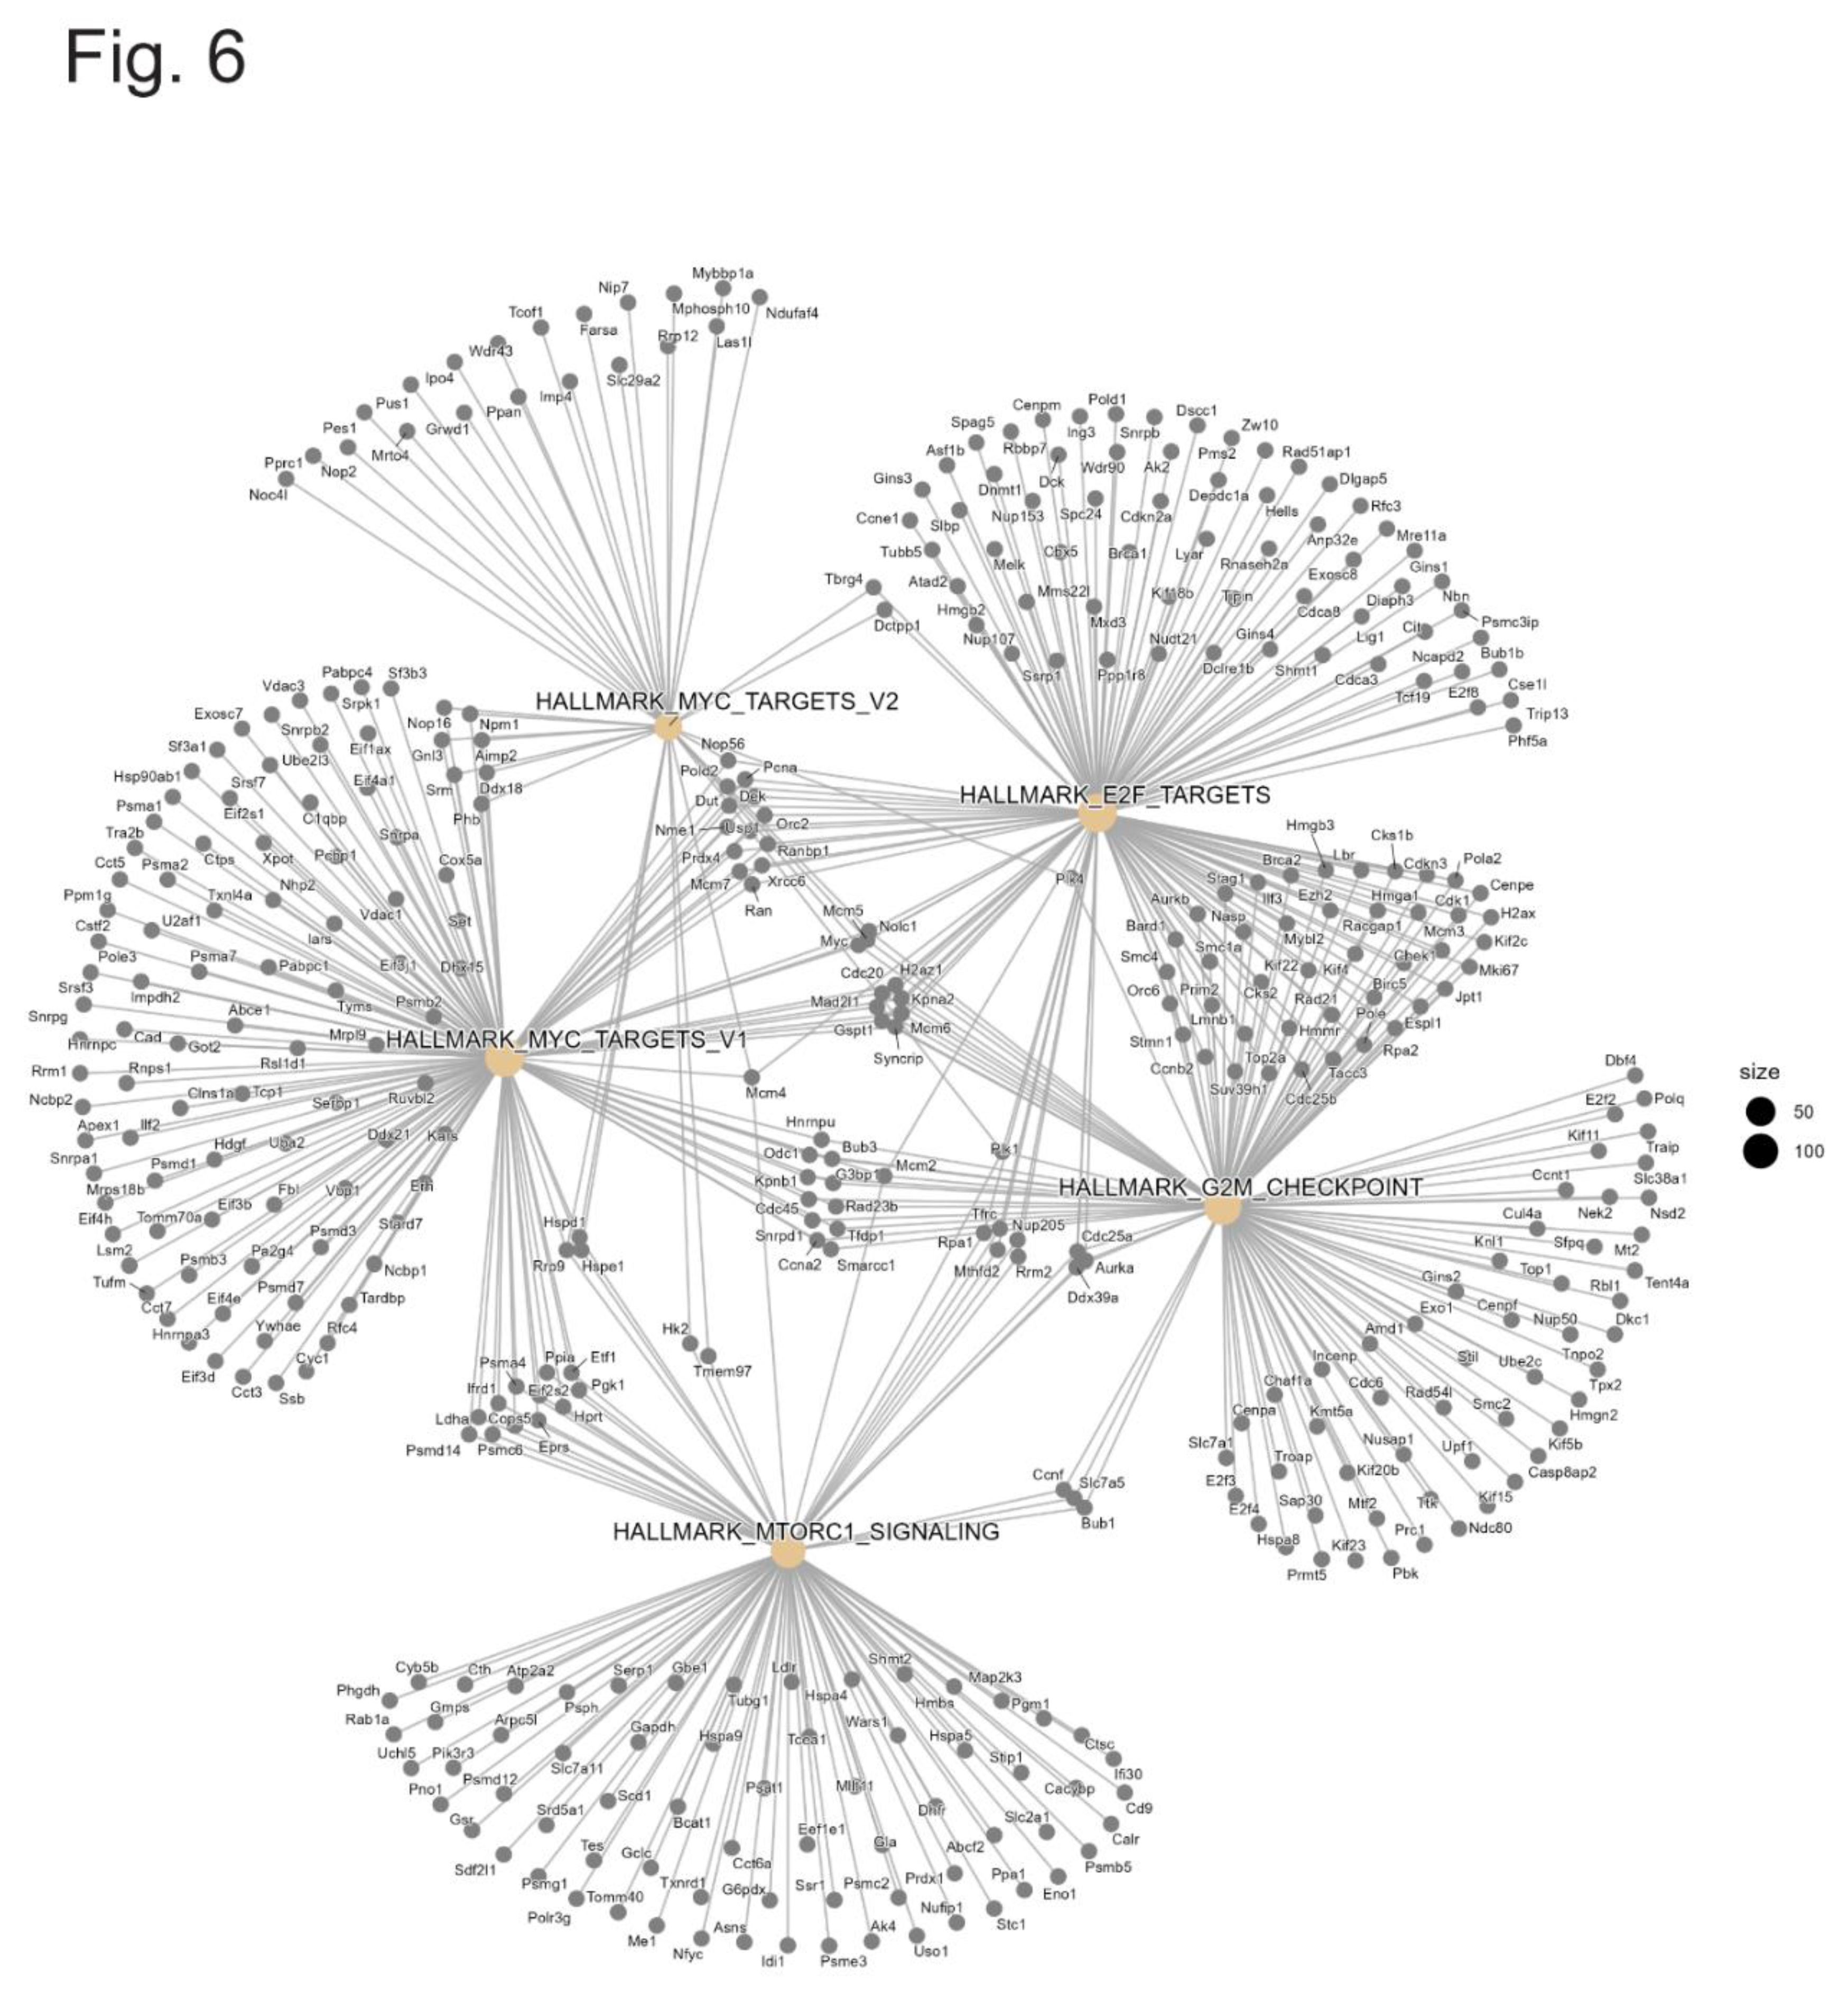
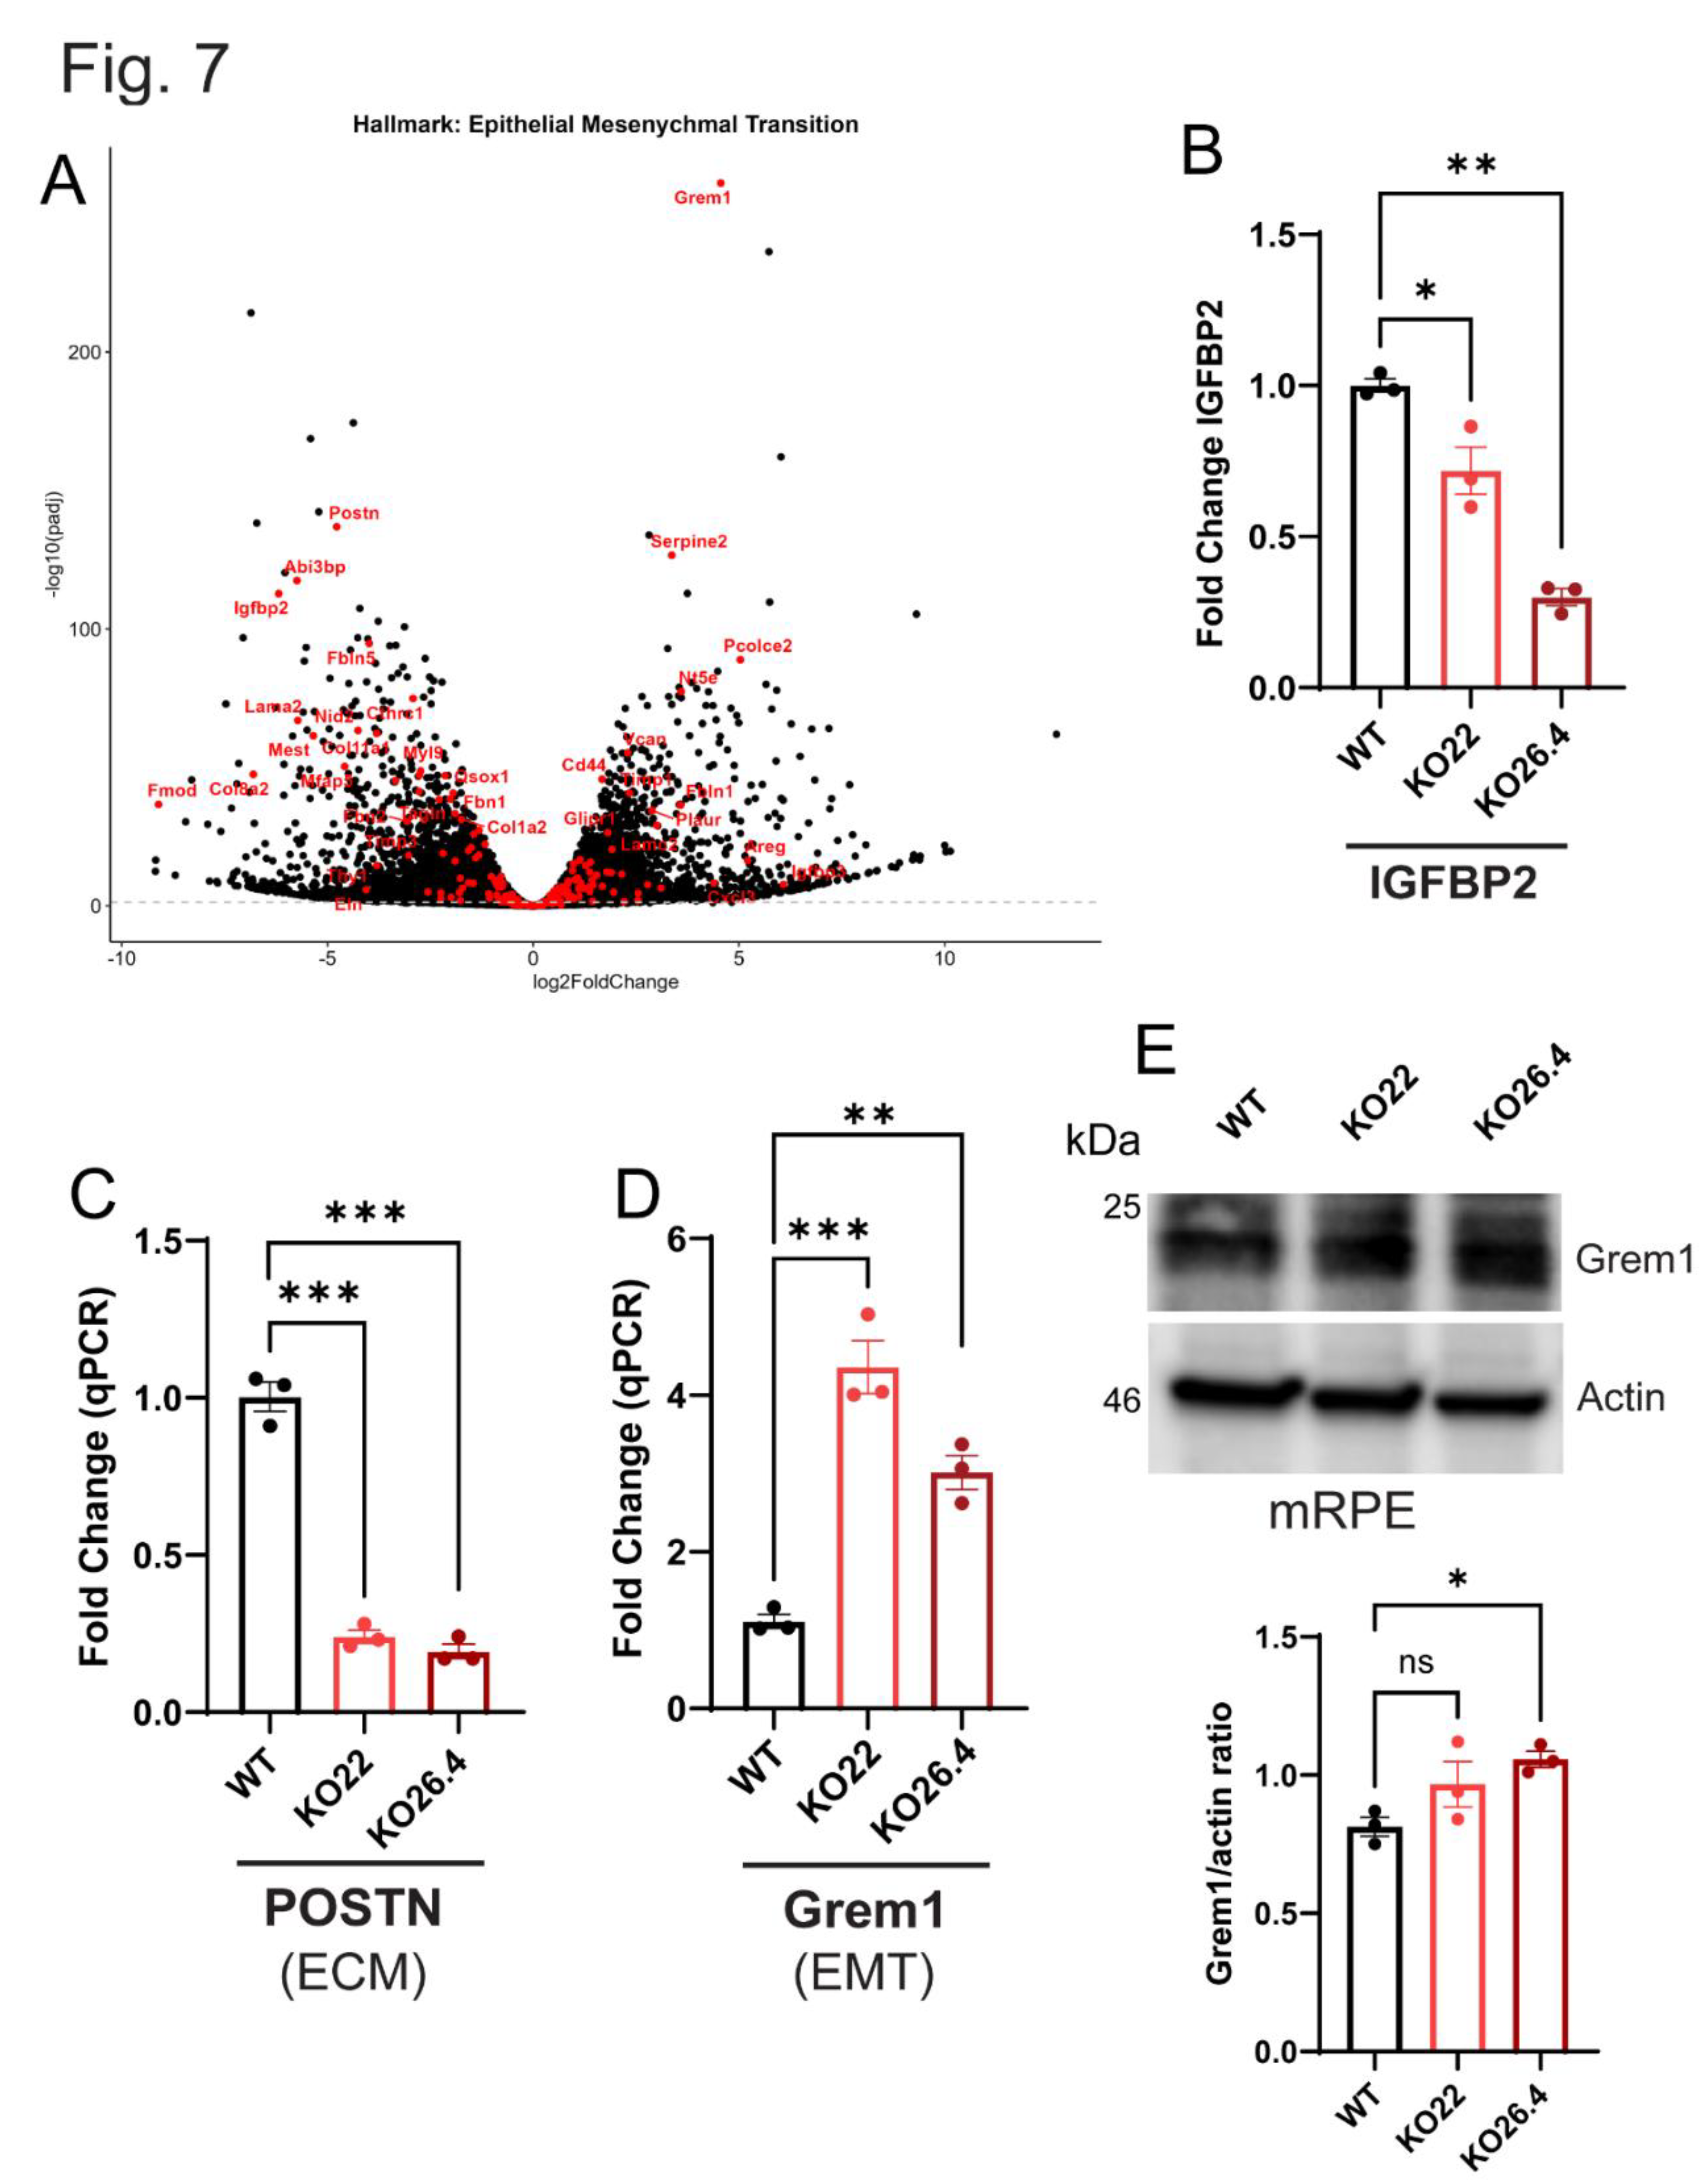
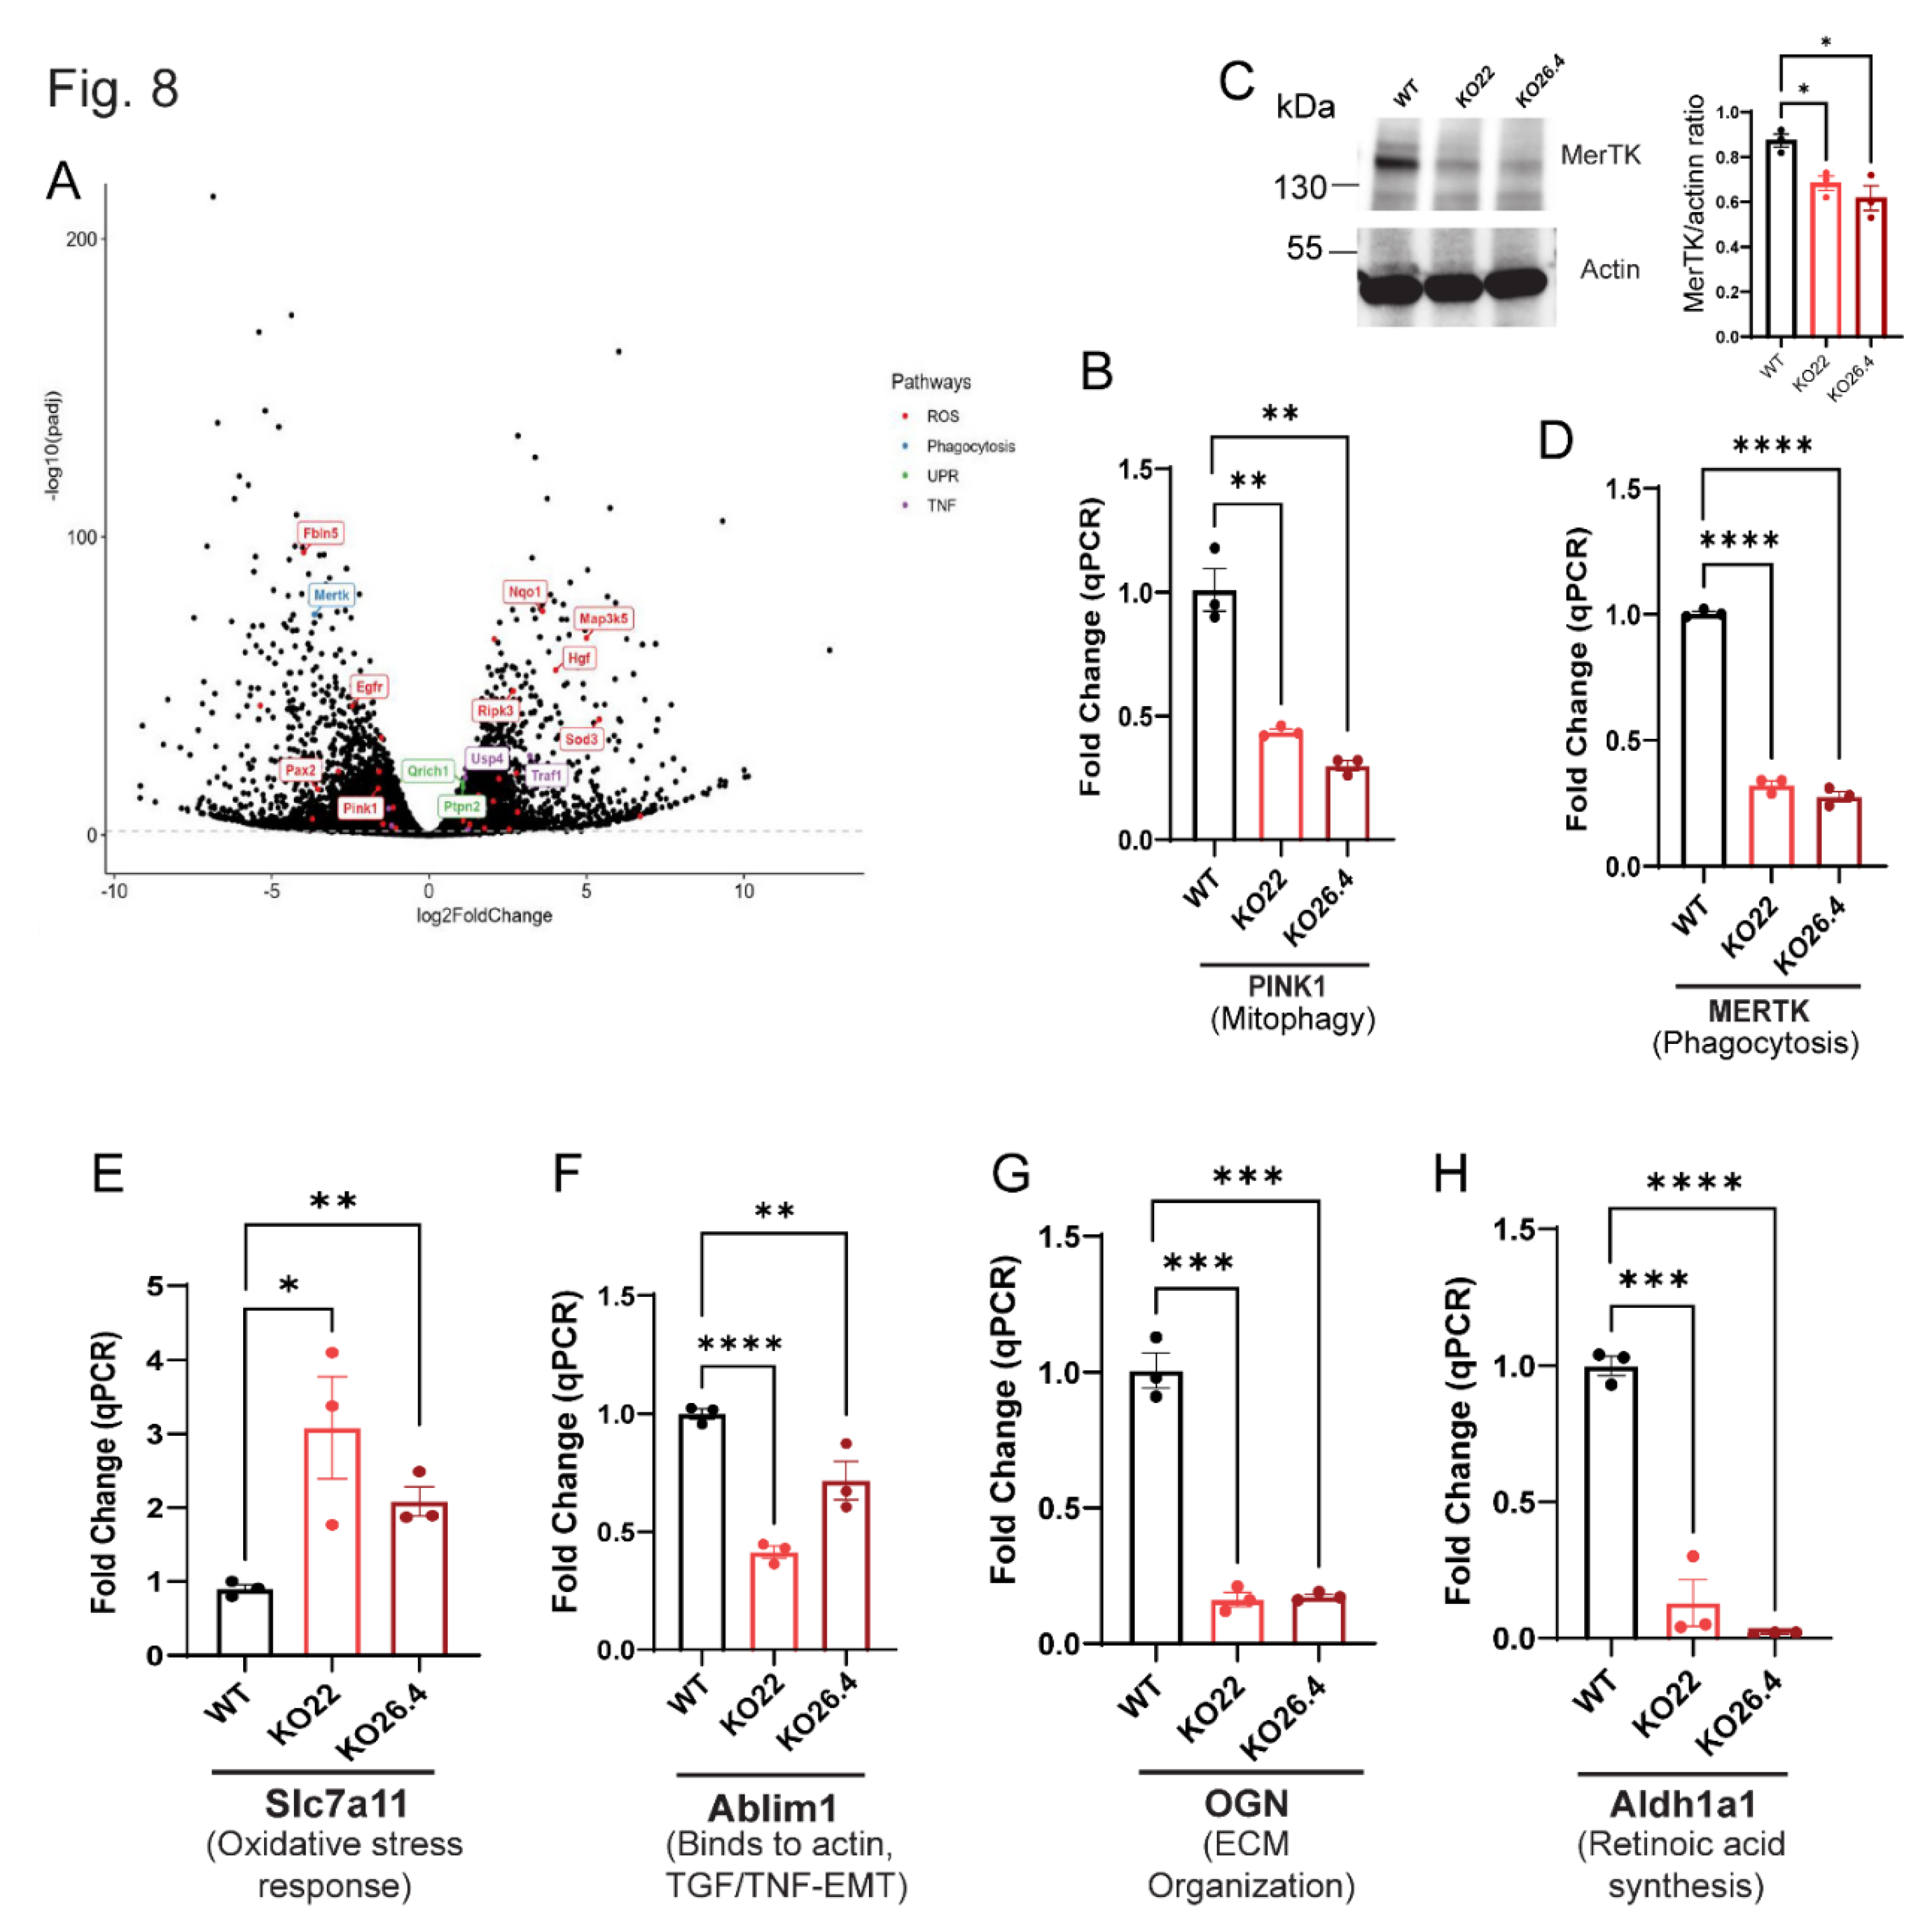
Inherited retinal degenerations (IRDs), driven by pathogenic mutations, often involve primary dysfunction of the retinal pigment epithelium (RPE) — a pathogenic feature shared with atrophic age-related macular degeneration (aAMD), despite aAMD’s multifactorial etiology. Prominin-1 (Prom1), traditionally linked to photoreceptor pathology, has an unclear role in RPE homeostasis. We assessed Prom1 expression in C57BL/6J mouse retina sections and RPE flat mounts using immunohistochemistry and generated Prom1-knockout (KO) mouse RPE cells via CRISPR/Cas9. Bulk RNA sequencing with DESeq2 and gene set enrichment analysis (GSEA) revealed Prom1-regulated pathways. Prom1-KO cells exhibited upregulation of Grem1, Slc7a11, Serpine2, Il1r1, and IL33, and downregulation of Ablim1, Cldn2, IGFBP-2, BMP3, and OGN. Hallmark pathway interrogation identified reduced expression of PINK1 (mitophagy) and MerTK (phagocytosis), implicating defects in mitochondrial quality control and outer segment clearance. Enrichment analysis indicated activation of E2F/MYC targets, mTORC1 signaling, oxidative phosphorylation, and TNFα/NF-κB signaling, alongside suppression of apical junction, bile acid metabolism, and EMT pathways. These findings suggest Prom1 safeguards RPE integrity by modulating stress responses, mitochondrial turnover, phagocytosis, metabolism, and junctional stability. Our study uncovers Prom1-dependent signaling networks, providing mechanistic insights into RPE degeneration relevant to both IRD and aAMD, and highlights potential therapeutic targets for preserving retinal health.

Keywords: 
;  ;  ;  ;  ;  ;  ;  ;  ;  ;  

1. Introduction

Inherited retinal dystrophies (IRDs) are a genetically heterogeneous group of disorders that cause progressive vision loss and, in many cases, irreversible blindness [1,2]. While many IRDs have been traditionally viewed as photoreceptor-centric diseases, increasing evidence suggests that retinal pigment epithelium (RPE) dysfunction plays a critical and possibly primary role in disease progression, particularly in IRDs where the mutated gene is present in both RPE and photoreceptors [3,4]. This distinction is particularly relevant for IRDs associated with Prominin-1 (Prom1, also known as CD133), where clinical features such as RPE atrophy and photoreceptor degeneration closely resemble those seen in atrophic age-related macular degeneration (AMD) [5,6]. Despite this phenotypic overlap, the mechanisms by which Prom1 regulates RPE homeostasis remain poorly understood, representing a significant gap in our understanding of macular disease pathogenesis.
Prom1 is a pentaspan transmembrane glycoprotein widely recognized as a stem cell and cancer stem cell marker [7,8]. Beyond its role in stemness, Prom1 is expressed in differentiated epithelial and non-epithelial cells [9], glial cells [9], and the adult retina [10], suggesting broader physiological functions. In photoreceptors, Prom1 localizes to the base of the outer segments, where it regulates disk morphogenesis and membrane architecture [11,12]. Loss-of-function mutations in Prom1 cause a spectrum of retinal diseases, including autosomal dominant and recessive retinitis pigmentosa [11,13], cone-rod dystrophies [14,15,16], and macular dystrophies such as Stargardt disease type 4 (STGD4) [12,17].
While Prom1-related retinal dystrophies have traditionally been viewed as photoreceptor-centric, emerging evidence suggests a complex pathophysiology involving RPE. In a Prom1-null Xenopus laevis model, CRISPR/Cas9-mediated Prom1 loss led to age-dependent RPE degeneration and subretinal drusenoid-like deposits that preceded photoreceptor loss, challenging the paradigm that Prom1 dysfunction primarily affects photoreceptors [18]. These deposits resembled human drusenoid material, suggesting that RPE pathology is an initiating event in Prom1-associated degeneration.
Stargardt disease 4 (STGD4) shares clinical and pathological features with ABCA4-related Stargardt disease type 1 (STGD1) and the atrophic form of AMD, including central photoreceptor degeneration and RPE atrophy [19,20,21]. Although STGD1 is driven by bisretinoid lipofuscin accumulation due to ABCA4 dysfunction, STGD4 may involve overlapping or distinct mechanisms. Notably, Prom1 mutations such as p.R373C and c.869delG have been associated with parafoveal RPE atrophy, granular mottling, and thinning of the outer retina in patients [5,22,23]. In younger individuals, spectral-domain OCT reveals early RPE/Bruch’s membrane thinning and progression to geographic atrophy (GA) [24]. Longitudinal studies confirm the expansion of GA, profound outer retinal degeneration, and phenotypic variability in patients with the Prom1 R373C mutation [25]. These findings suggest that Prom1 dysfunction may directly impair RPE integrity, contributing to macular degeneration independent of bisretinoid accumulation.
The relationship between Prom1 and ABCA4 is further supported by studies showing additive effects of Prom1 and Abca4 mutations on RPE pathology, including granular mottling and lipofuscin-like deposits [19,22]. Despite these clinical observations, the mechanistic role of Prom1 in RPE biology remains poorly defined. Our own studies have shown that Prom1 is expressed in human RPE and localizes predominantly to the cytoplasm, where it regulates autophagy by modulating mTORC1/2 signaling and autophagosome trafficking [26]. Additionally, we confirmed Prom1 expression in mouse RPE (mRPE) in situ by immunogold electron microscopy and RNAscope assays [27]. We showed that targeted Prom1 knockdown in situ using AAV2/1 vectors induces RPE cell death and photoreceptor degeneration, recapitulating the features of dry AMD [27].
We recently demonstrated that Prom1 loss in mRPE activates mTORC1, suppresses TFEB activity, and induces epithelial-mesenchymal transition (EMT), implicating Prom1-mTORC1-TFEB signaling as a central regulator of RPE homeostasis [28]. Although Prom1-related IRDs have long been considered photoreceptor cell-autonomous pathologies, emerging evidence suggests that Prom1 is a major driver of RPE integrity and function. To address this knowledge gap, we performed transcriptomic profiling of Prom1-deficient mRPE cells to identify molecular pathways disrupted by Prom1 loss. Using bulk RNA sequencing and gene set enrichment analysis (GSEA), we identified dysregulated genes and pathways involved in stress signaling, autophagy, lysosomal function, and epithelial identity—molecular signatures that mirror RPE dysfunction in IRDs and atrophic AMD. These findings support a model in which Prom1 maintains RPE homeostasis in a cell-autonomous manner, suggesting that its loss contributes to retinal degeneration through mechanisms beyond photoreceptor disk morphogenesis.

2. Materials and Methods

2.1. Reagents

Materials purchased include the following: Fetal bovine serum (FBS, Atlanta Biologicals); Enhanced chemiluminescence (ECL) western blot detection system (Perkin Elmer, Inc); Protease/Phosphatase Inhibitor Cocktail (Thermo Fisher Scientific, Waltham, MA); Prom1/CD1330 rabbit polyclonal antibody (OAA100379, Aviva), Prom1 rabbit polyclonal (abcam, ab19898); MertK (Invitrogen, 14-5751-82), ZO-1 monoclonal antibody (Invitrogen, ZO1-1A12, 33-9100) and GREM1 polyclonal antibody (catalog# PA5-119163, Invitrogen), goat amti-rabbit Alexa Fluor 488 (Thermo Fisher, cat#A-11008), donkey anti-mouse Alexa Fluor 647 (Thermo Fisher, cat#A-31571) and Prom1 gRNA (Thermo Fisher Scientific, Waltham, MA).

2.2. Mice and Colony Management

C57/BL6J mice were obtained from the Jackson Laboratory (Bar Harbor, ME, USA) (JAX, stock #000664). Mice were housed, maintained on a 12h light-dark cycle, and provided food and water ad libitum. The Institutional Animal Care and Use Committee of Vanderbilt University Medical Center (VUMC) approved all experiments. All animal procedures followed the guidelines of the Association for Research in Vision and Ophthalmology Statement on the Use of Animals in Ophthalmic and Vision Research. Both male and female mice (6-8 weeks old) were used for this project.

2.3. Cell Culture

Mouse RPE (mRPE) cells were obtained from Rosario Fernandez-Godino (Harvard, MA, USA), as described earlier [29]. Briefly, isolated mRPE cells from 8–12-week-old C57/BL6J mice were pooled and plated on a 24-well plate coated with laminin (10mg/ml). After 72h, cells were allowed to reach 50% confluence and then transduced overnight with Lenti-HPV E6/E7 (106 TU/ml) (ABM cat #G268) with 4mg/ml polybrene. Cells were selected in RPE media containing 5% FBS and puromycin (1mg/ml) for 12 days to generate immortalized mRPE cells. These cells were cultured in culturing medium containing N1 medium supplement (1/100 vol/vol), glutamine (1/100 vol/vol), penicillin-streptomycin (1/100 vol/vol), non-essential amino acid (1/100 vol/vol), hydrocortisone (20mg/ml), taurine (250 mg/l), triiodo-thyronin (0.013mg/l), 5% FBS in alpha-MEM at 370C in 5% CO2 and media replaced three times a week. The cells were subcultured using trypsin (0.25%) and frozen in 10% FBS with 10% DMSO.

2.4. Generation of Prom1-Deficient mRPE Cells via CRISPR/Cas9

Prom1 was knocked out in mRPE cells by CRISPR/Cas9-mediated gene editing, as described earlier [28]. mRPE cells were cultured in 6-well plates. The cells were allowed to reach 70% confluency, then transduced with 10 μL of the lentiviral Cas9 construct and 2 μL of polybrene. After 24h, the infected cells were subcultured into media containing 1.5mg/ml puromycin and grown to 90% confluency. The cells were selected in media containing 0.5mg/ml puromycin for an additional week. After puromycin selection, the stably expressing Cas9-mRPE cells were transfected with Prom1 (chromosome 5) synthetic guide RNA (gRNA) sequence (5’-CGTTGCTGCAACAAATGCGG-3’) (ThermoFisher Scientific, catalog # A35533) using Lipofectamine CRISPRMAX transfection reagent (ThermoFisher, Cat # CMAX00008) to target the mouse Prom1 gene at exon 5, following the manufacturer’s protocol. Prom1-KO was verified by genomic DNA analysis. Cas9-expressing mRPE cells were transfected with either scrambled or Prom1 gRNA, and these cells were then used to extract genomic DNA using the QIAamp DNA Micro Kit. PCR was performed using the forward primer: 5’-GTGCATACTGGGGTCCTCAC-3’ and reverse primer: 5’-ATCTCCCTGCAACACCCTAA-3’ and Qiagen Taq PCR master mix kit. Genomic sequences were analyzed using BLAST to confirm the WT and different Prom1-KO sequences. We introduced two deletions at separate genomic sites within Prom1, generating two independent Prom1-KO lines, as described earlier [28].

2.5. Mouse RPE Flat Mount Preparation and Immunohistochemistry

After euthanasia, the mouse eyes were enucleated and fixed in neutral buffered formalin for 15 min at room temperature. They were washed twice in PBS, and the anterior segment (cornea and lens) was removed to expose the posterior eyecup. The neural retina was carefully detached, leaving the RPE–choroid–sclera intact. Four radial cuts were made from the periphery toward the optic nerve to flatten the eyecup, as described earlier [30]. The tissue was placed RPE-side up in a dish or on a slide. Samples were permeabilized and blocked in PBS containing 0.5% Triton X-100 and 5% normal donkey serum (Abcam, ab7475) for 1h. Primary antibody diluted in blocking buffer was applied and incubated overnight at 4 °C, followed by PBS washes and secondary antibody incubation for 2h at room temperature. Finally, tissues were mounted in Fluoromount-G medium containing DAPI (Thermo Fisher, 00-4959-52) and imaged using confocal microscopy.

2.6. Mouse Retina Sections and Confocal Imaging

The enucleated mouse eyes were immersed in 4% PFA overnight at 4 °C and rinsed 3 times in PBS. The eyes were immersed in 10% sucrose in PBS for 2-4 h, transferred to 20% sucrose, and finally to 30% sucrose overnight at 4 °C. The eyes were embedded in cryomold, sectioned at 10 μm with a cryostat, mounted on slides, and stored at -80 °C. The cryo slides were taken out of the freezer, warmed for 10 mins at room temperature, washed twice in PBS with 0.5% Triton X-100 for 15 mins, blocked for 2 h at room temperature in 1x PBST with 5% normal donkey serum, incubated with primary antibody overnight in 1X PBS, followed by three washes in 1X PBS for 10 mins, and incubation with secondary antibody in 1X PBST with 5% NDS for 1h at room temperature. Slides were washed in 0.5% TritonX-100 in PBS and coverslipped with Fluoromount-G with DAPI. Confocal images of retina sections and RPE flatmount samples were captured using a Zeiss LSM880 confocal microscope with Zeiss ZEN (black) 2.3 software, applying the following parameters: For retina section images at 20x magnification: Plan-Apochromat 20x/0.8 objective; 405 nm excitation at 1.5% and 488 nm excitation at 1.0%; detection wavelengths from 410-495 nm and 495-630 nm; gain set to 800; offset at 0; pixel dwell time of 1.02 microseconds per pixel; averaged twice; Z-stack of 12 slices covering approximately 25 microns at Nyquist sampling; scale = 0.42x0.42x0.29 microns per pixel. For retina section images at 40x: Plan-Apochromat 40x/1.3 Oil DIC UV-IR objective; 405 nm excitation at 1.5% and 488 nm excitation at 1.5%; detection wavelengths from 410-495 nm and 495-630 nm; gain = 800; offset = 0; pixel dwell time of 1.02 microseconds per pixel; averaged twice; Z-stack of 18 slices over approximately 18 microns at Nyquist sampling; scale = 0.21x0.21x1.07 microns per pixel. For retina section images at 63x: Plan-Apochromat 63x/1.4 Oil DIC objective; 405 nm excitation at 2.2% and 488 nm excitation at 2.4%; detection wavelengths from 410-495 nm and 495-630 nm; gain = 800; offset = 0; pixel dwell time of 1.02 microseconds per pixel; averaged twice; Z-stack of 25 slices over approximately 12 microns at Nyquist sampling; scale = 0.13x0.13x0.53 microns per pixel. For RPE flatmount images at 40x: Plan-Apochromat 40x/1.3 Oil DIC UV-IR objective; 488 nm excitation at 0.7% and 633 nm excitation at 6.5%; detection wavelengths from 493-628 nm and 638-755 nm; gain = 800; offset = 0; pixel dwell time of 2.05 microseconds per pixel; averaged twice; Z-stack of 11 slices over roughly 8 microns at Nyquist sampling; scale = 0.21x0.21x0.82 microns per pixel. Maximum Intensity Projections and orthogonal projections were generated using Zeiss ZEN (blue) 3.8.

2.7. Western Blotting

Cell lysates were prepared using mammalian protein extraction buffer (Cell Signaling Technology, Beverly, MA, USA) and a Halt protease/phosphatase inhibitor cocktail (Thermo Fisher Scientific, Waltham, MA, USA), followed by SDS-PAGE, as described previously [26,31]. Proteins were transferred to Immobilon-PVDF membranes with 0.45μm pore size (Millipore, Bedford, MA, USA) and incubated overnight with primary antibodies at 4 °C in Tris-buffered saline containing 0.1% Tween-20 and 5% nonfat dry milk (Biorad, Hercules, CA, USA). Membranes were subsequently incubated with horseradish peroxidase-conjugated secondary antibodies at room temperature for 1 hour, and the immune complexes were visualized using the ECL detection system (PerkinElmer, Waltham, MA) and the Azure c500 Imaging Biosystem (Dublin, CA, USA). Membranes were stripped and re-probed for actin as a loading control. Representative Western blots for three experiments are shown. Densitometric analysis of all Western blots was performed using ImageJ software (developed by Wayne Rasband, National Institutes of Health, Bethesda, MD, USA; available at http://rsb.info.nih.gov/ij/index.html), as described earlier [26]. Blots used in the figures comply with the digital image and integrity policies. The uncropped full-length blots are available as a Supplementary File.

2.8. Real-Time Quantitative PCR

TRIzol reagent (Thermo Fisher Scientific, Waltham, MA, USA) was used to extract total RNA from WT and Prom1-KO mRPE cells, as described earlier [28]. Total RNA concentrations were quantified by measuring the A260 and A280 absorbance using a NanoDrop spectrophotometer, as described previously [26]. Total RNA (1mg) was reverse-transcribed to cDNA using a kit from Promega (Madison, WI, USA) and following the manufacturer’s instructions. The cDNA was diluted 1:5 with DNase-free water. Real-time qPCR was performed using an Ariamx Real-Time PCR system (Agilent Technologies, Santa Clara, CA, USA) with 2.5ml of the cDNA product in a 25ml reaction mixture containing 1X SYBR® Green Master Mix (Applied Biosystems, Foster City, CA, USA) and 120nM forward and reverse primers. A list of forward and reverse primers used for qPCR analyses of genes in WT vs. Prom1-KO mRPE cells is provided in Table 1.

2.9. Bulk RNA Sequencing and Data Analysis

Total RNA was isolated from retinal pigment epithelium (RPE) cells dissected from wild-type (WT) and Prom1-knockout (KO) mouse RPE using the RNeasy Mini Kit (Qiagen) according to the manufacturer’s protocol. RNA integrity was assessed using the Agilent 2100 Bioanalyzer, and samples with an RNA Integrity Number (RIN) of 8.0 or higher were selected for sequencing to ensure high-quality input. Bulk RNA sequencing was performed by the Vanderbilt Technologies for Advanced Genomics (VANTAGE) core facility at Vanderbilt University Medical Center. Libraries were prepared using the Illumina TruSeq Stranded mRNA Library Prep Kit, and paired-end sequencing (150 bp reads) was conducted on the Illumina NovaSeq 6000 platform. Raw sequencing reads were trimmed for adapter sequences and filtered for quality using TrimGalore v0.6.7 (https://zenodo.org/records/5127899) by Creative Data Solutions, Vanderbilt University. High-quality reads were aligned to the Mus musculus reference genome (mm39) using STAR v2.7.9a [32] with the --quantMode GeneCounts parameter enabled to generate gene-level count matrices. Gene-level counts were normalized and analyzed for differential gene expression (DEG) using DESeq2 v1.36.0 [33]. Genes with fewer than five counts across at least three samples were excluded to reduce background noise. Differentially expressed genes were identified using an adjusted p-value threshold of 0.05 and a log2 fold change >1.2. Gene set enrichment analysis (GSEA) was performed using Hallmark Gene sets from the Molecular Signatures Database (MSigDB v7.5) (https://www.gsea-msigdb.org/gsea/msigdb/). Enriched gene sets were visualized and clustered in Cytoscape (v3.9.1) using the EnrichmentMap and AutoAnnotate plug-ins to generate functional network representations.

2.10. Statistical Analysis

All data were analyzed using GraphPad Prism 9 (GraphPad Software, Inc., San Diego, CA). Data are expressed as mean ± SE. Experiments were repeated three times, with triplicate samples for each. An unpaired 2-tailed Student’s t-test and Bonferroni post-hoc testing were used to assess statistical significance. Unless otherwise stated, *P<0.05, **P<0.01, ***P<0.001, and ****P<0.0001 values were considered significant; ns, not significant.

3. Results

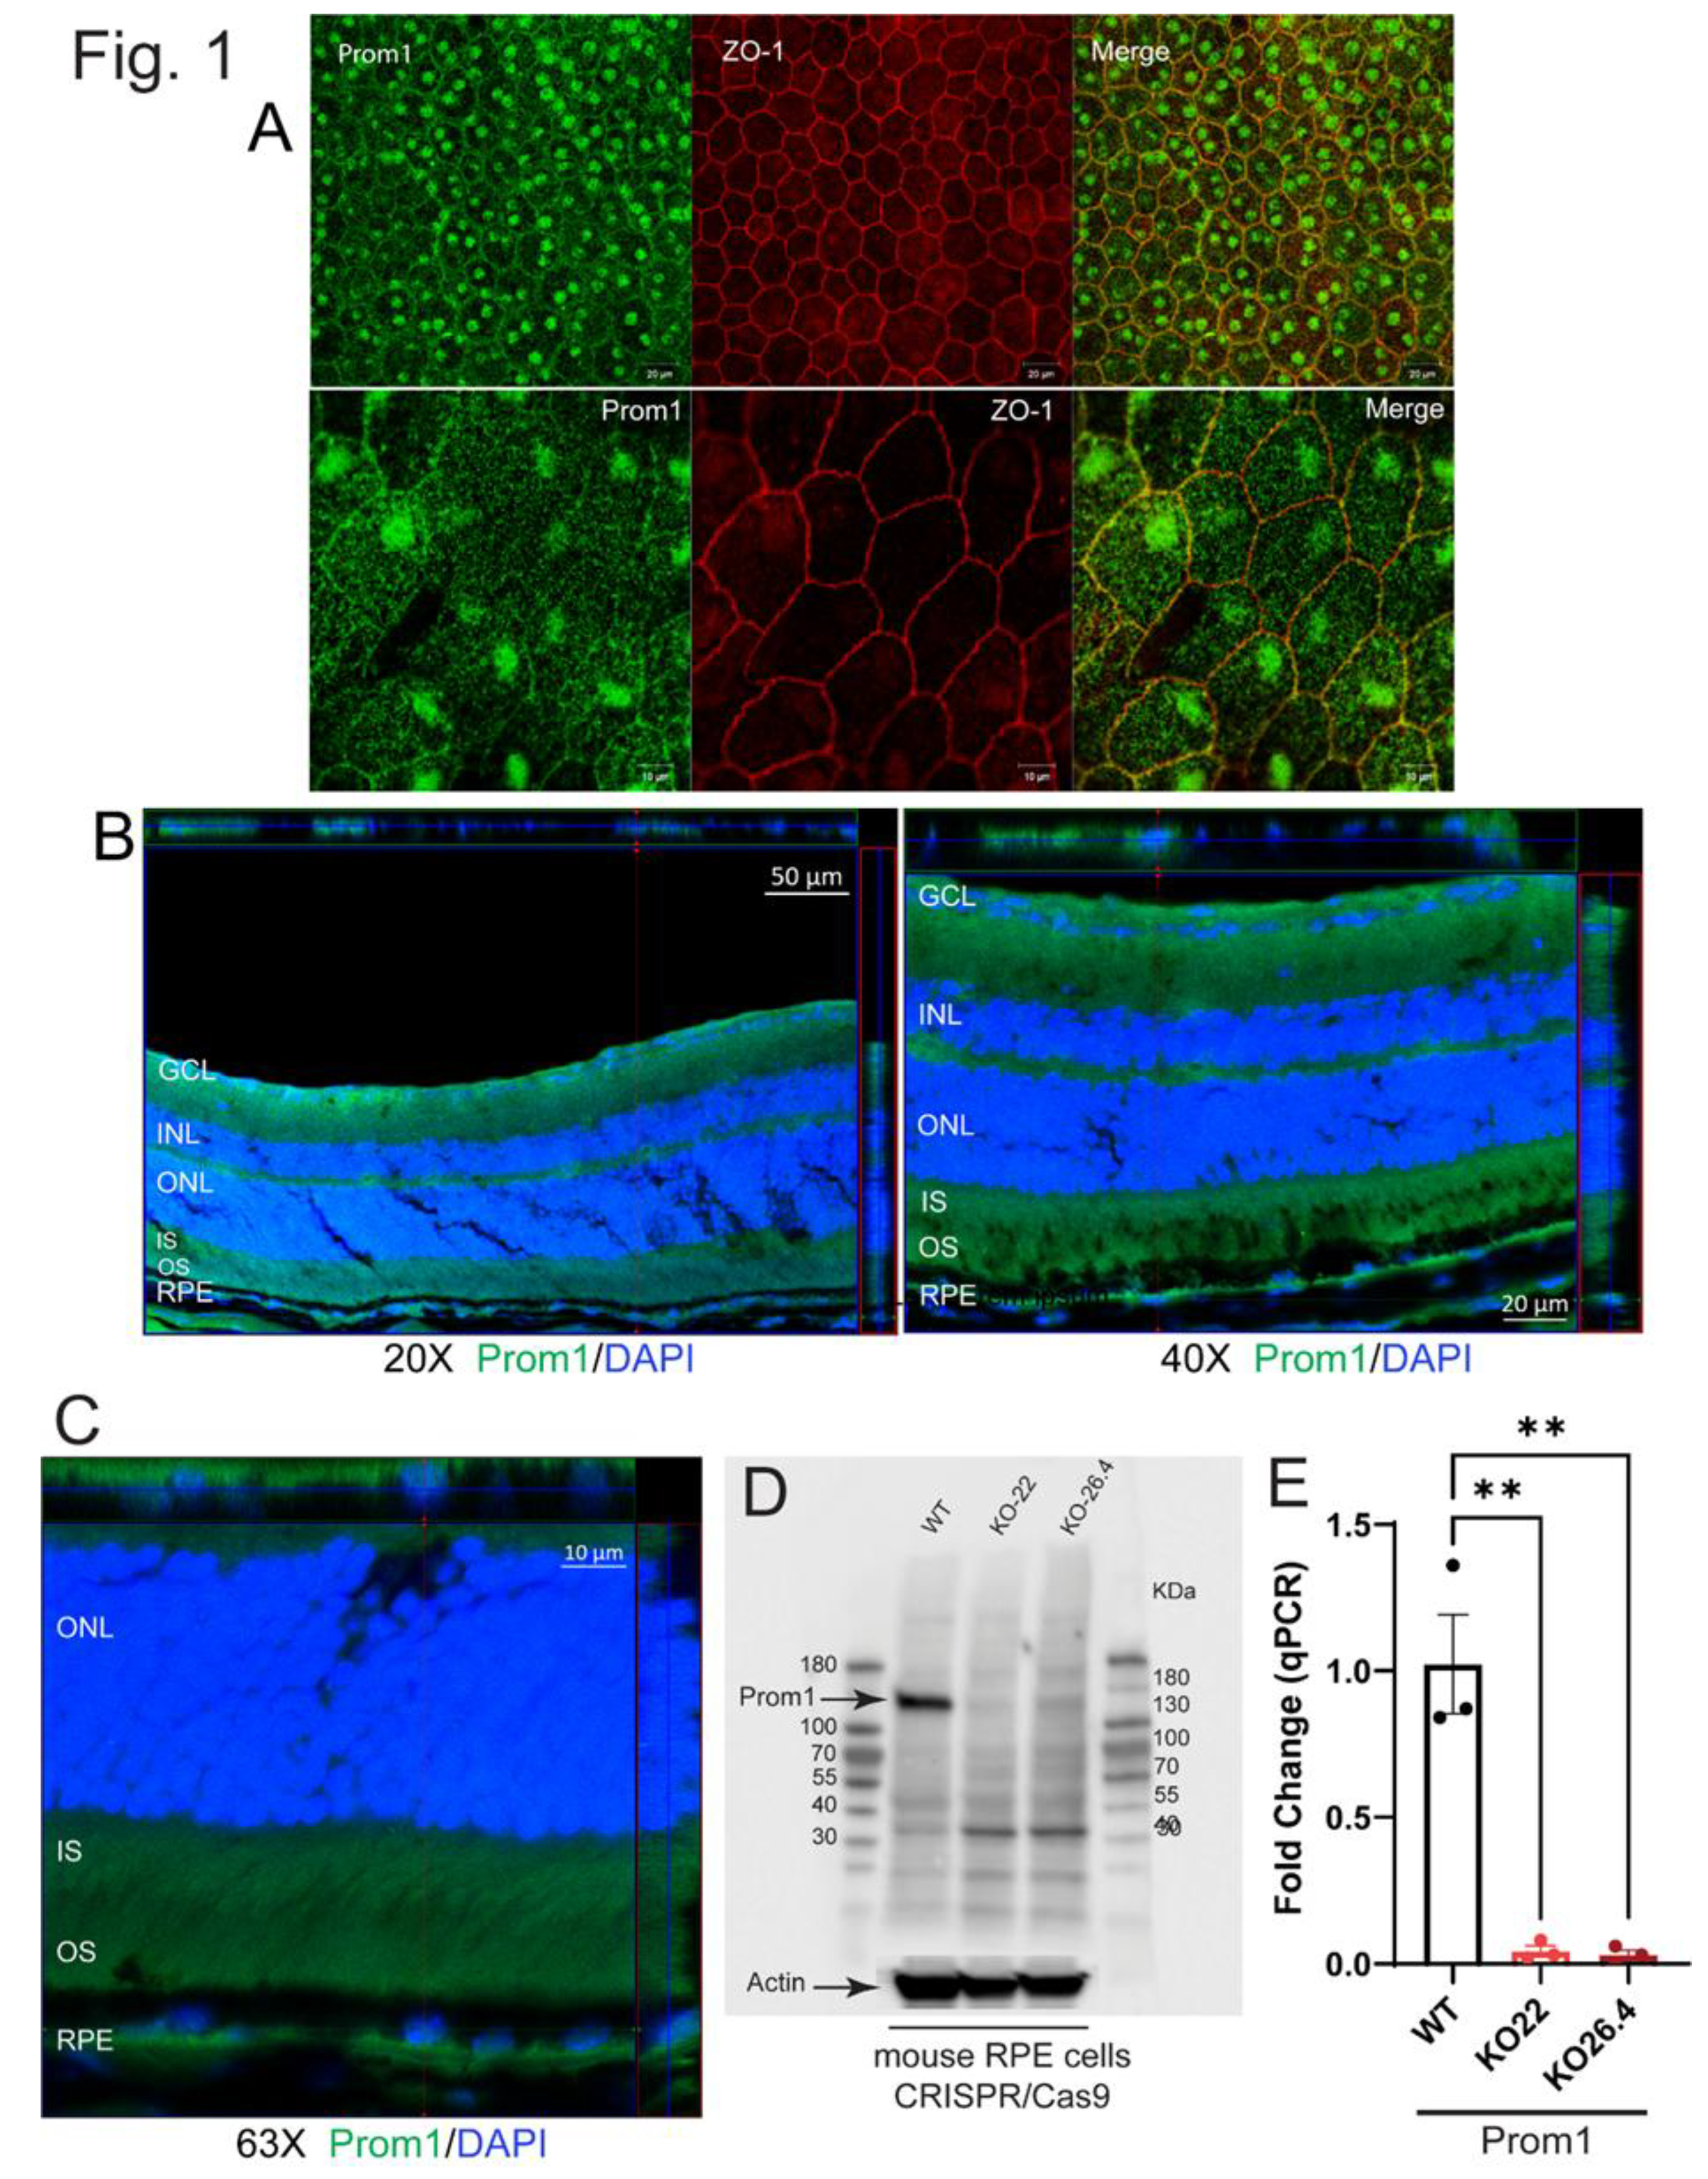
3.1. Prom1 is Expressed in Mouse RPE In Situ

We recently showed Prom1 mRNA localization in mouse RPE in situ using RNAscope and Prom1 protein localization by immunogold electron microscopy [27]. To confirm Prom1 protein expression in mRPE, we performed Immunohistochemistry (IHC) on mouse RPE flat mounts. Our studies show Prom1 staining (green) alongside ZO-1 (red), a tight junction marker in mouse RPE flat mounts. At 40X magnification, Prom1 was predominantly localized in the RPE cytoplasm, with enrichment in nuclear and perinuclear regions and partial association with apical junctions marked by ZO-1 (Figure 1A). At 40X zoom, this pattern was more pronounced, with Prom1 puncta evident near cell borders, cytoplasm, and concentrated around nuclei. The merged images show partial co-localization of Prom1 with ZO-1, which supports its weak association with apical domains (Figure 1A). The presence of Prom1 signal in mRPE cytoplasmic and nuclear compartments suggests potential roles in trafficking or signaling beyond membrane organization. Consistent with these observations, Prom1 was detected (green) in the RPE layer in situ in mouse retinal sections, evidenced by 20X, 40X, and 63X confocal images, confirming its expression outside photoreceptors and providing protein-level evidence of its presence and subcellular organization (Figure 1B-C). The 3D orthogonal reconstruction shows that the Prom1 protein is present within the RPE monolayer, spatially distinct from photoreceptor outer segments. The labeling pattern in the XZ/YZ plane appears punctate cytoplasmic with apical enrichment, consistent with intracellular localization in RPE rather than a junctional or membrane-restricted signal (Figure 1B-C). Western blotting analysis of mRPE cells cultured in vitro confirmed robust Prom1 expression in wild-type mRPE and its absence in Prom1-knockout (KO) samples (using CRISPR/Cas9) (Figure 1D). At the same time, qPCR demonstrated significant Prom1 transcript reduction in Prom1-KO cells (Figure 1E). Together, these results establish Prom1 as a cytoplasmic and junction-associated protein in mRPE, supporting its potential role in maintaining RPE homeostasis.

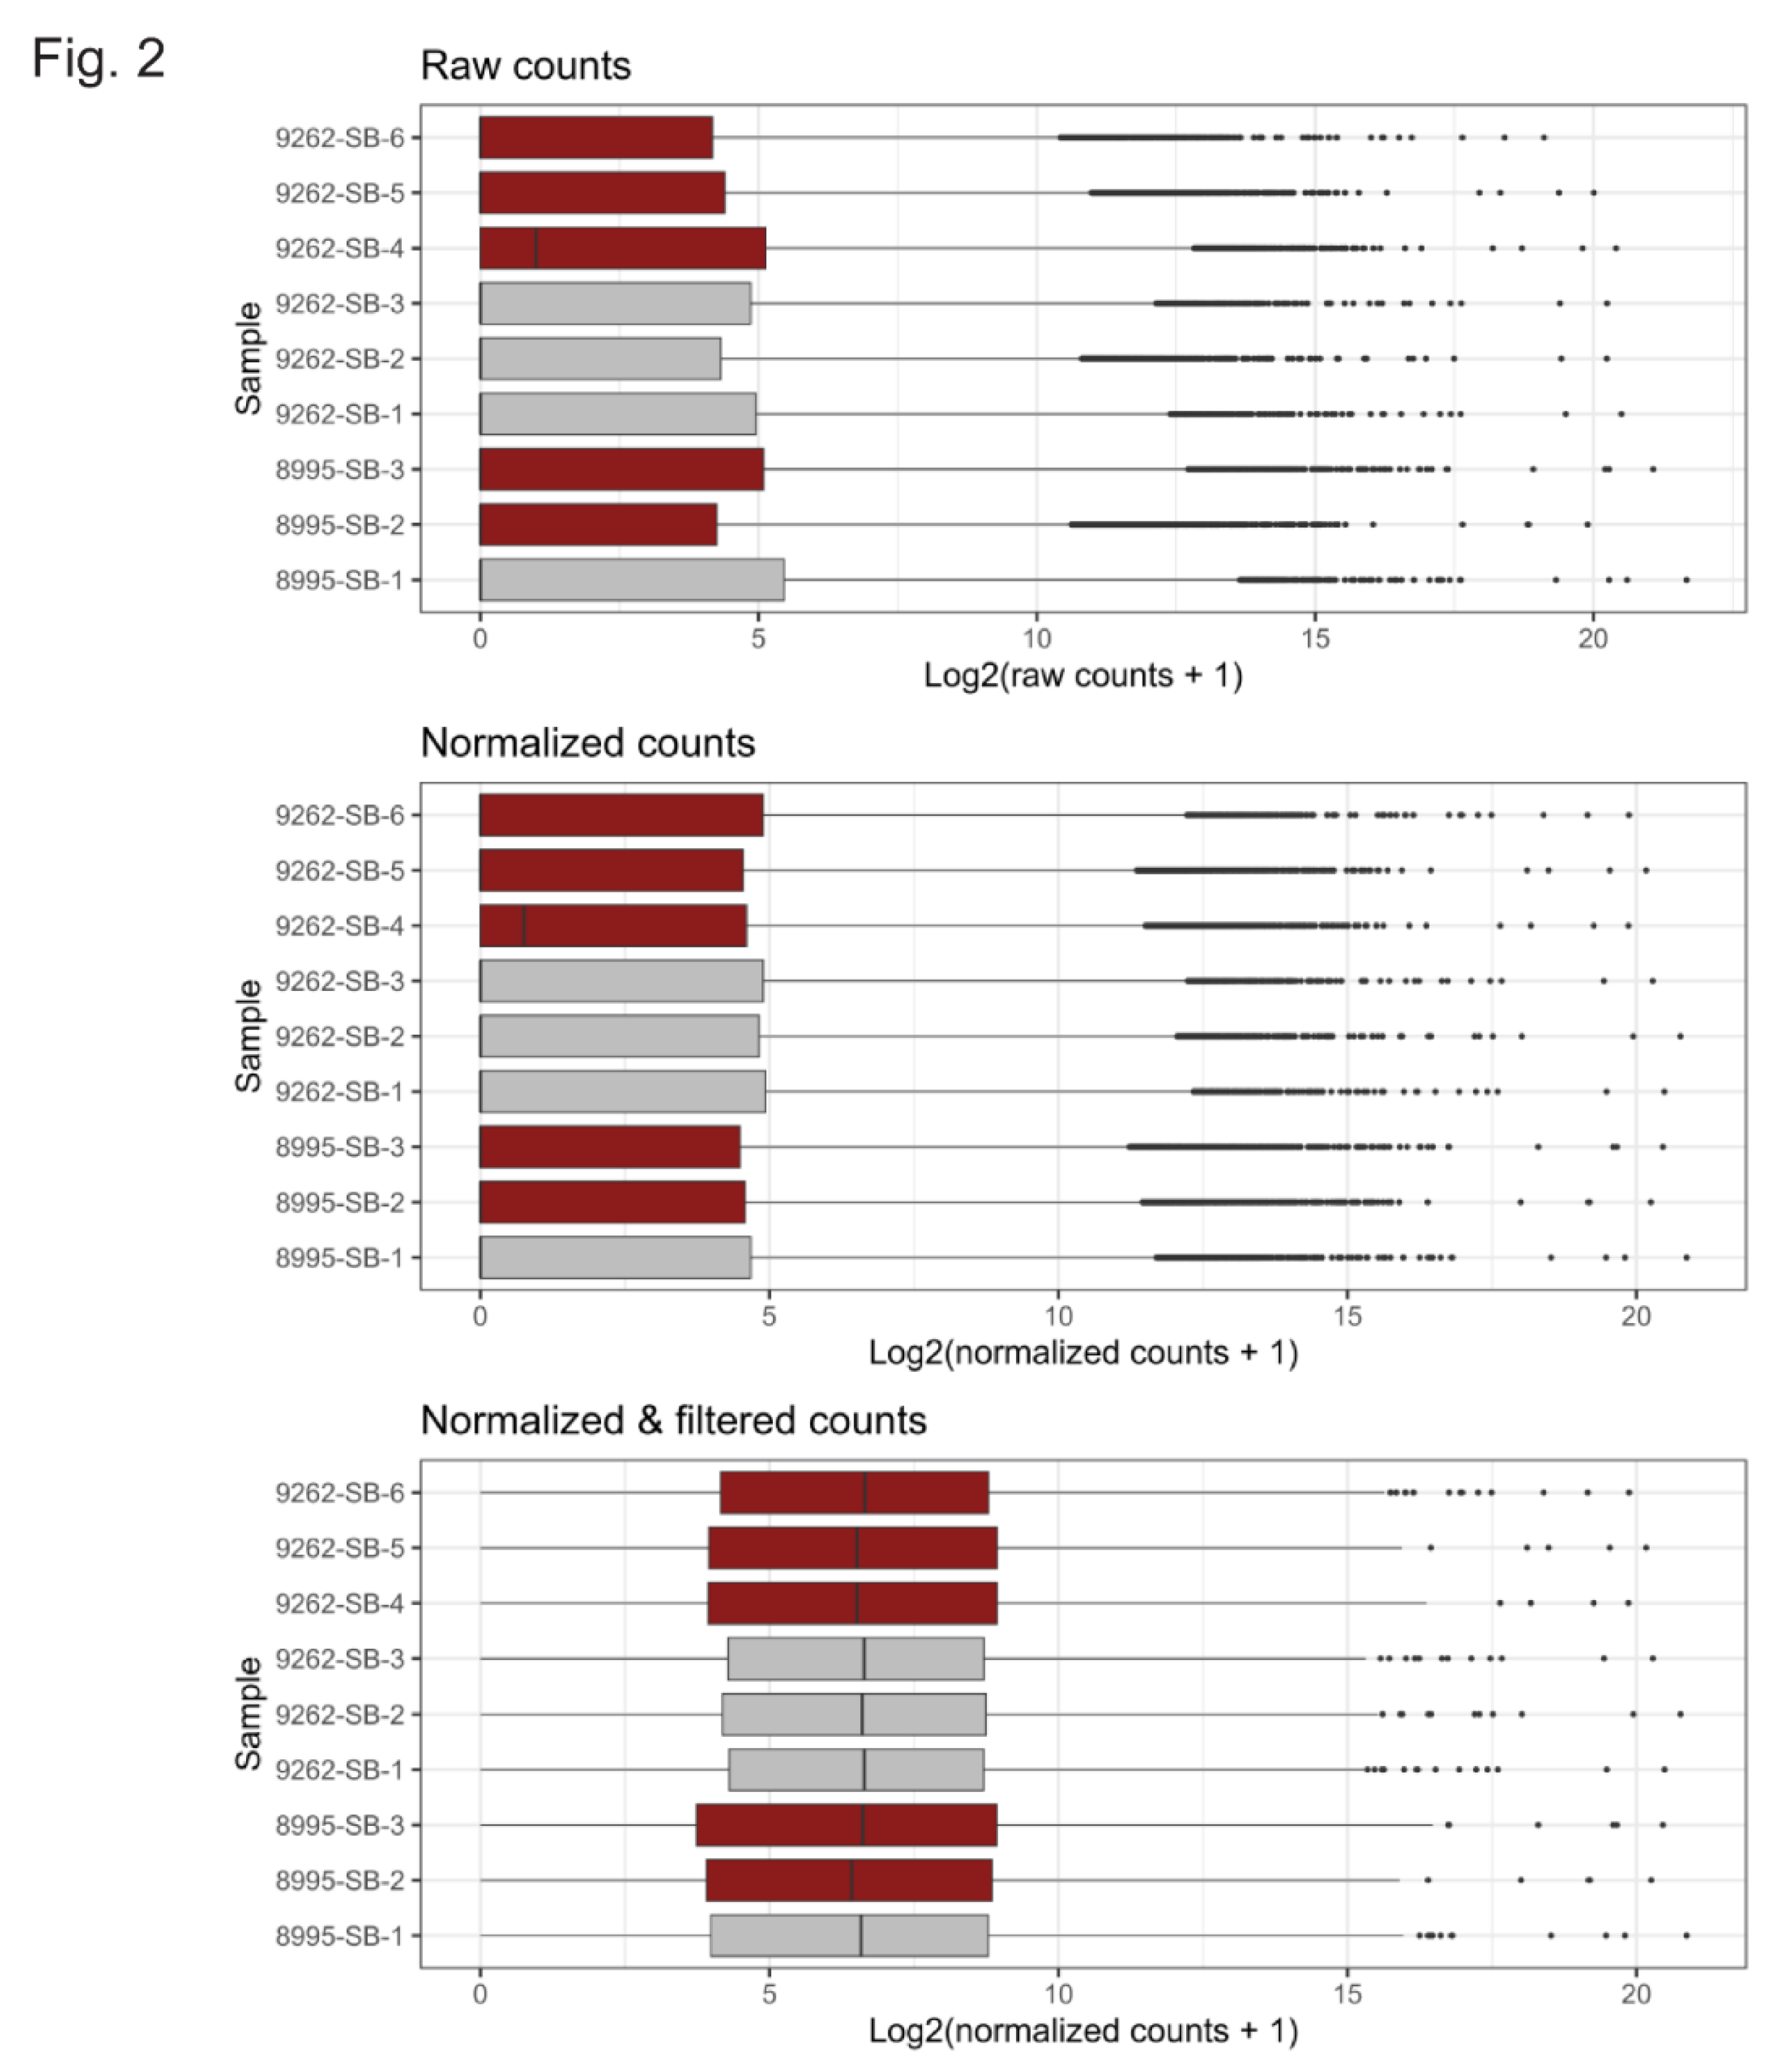
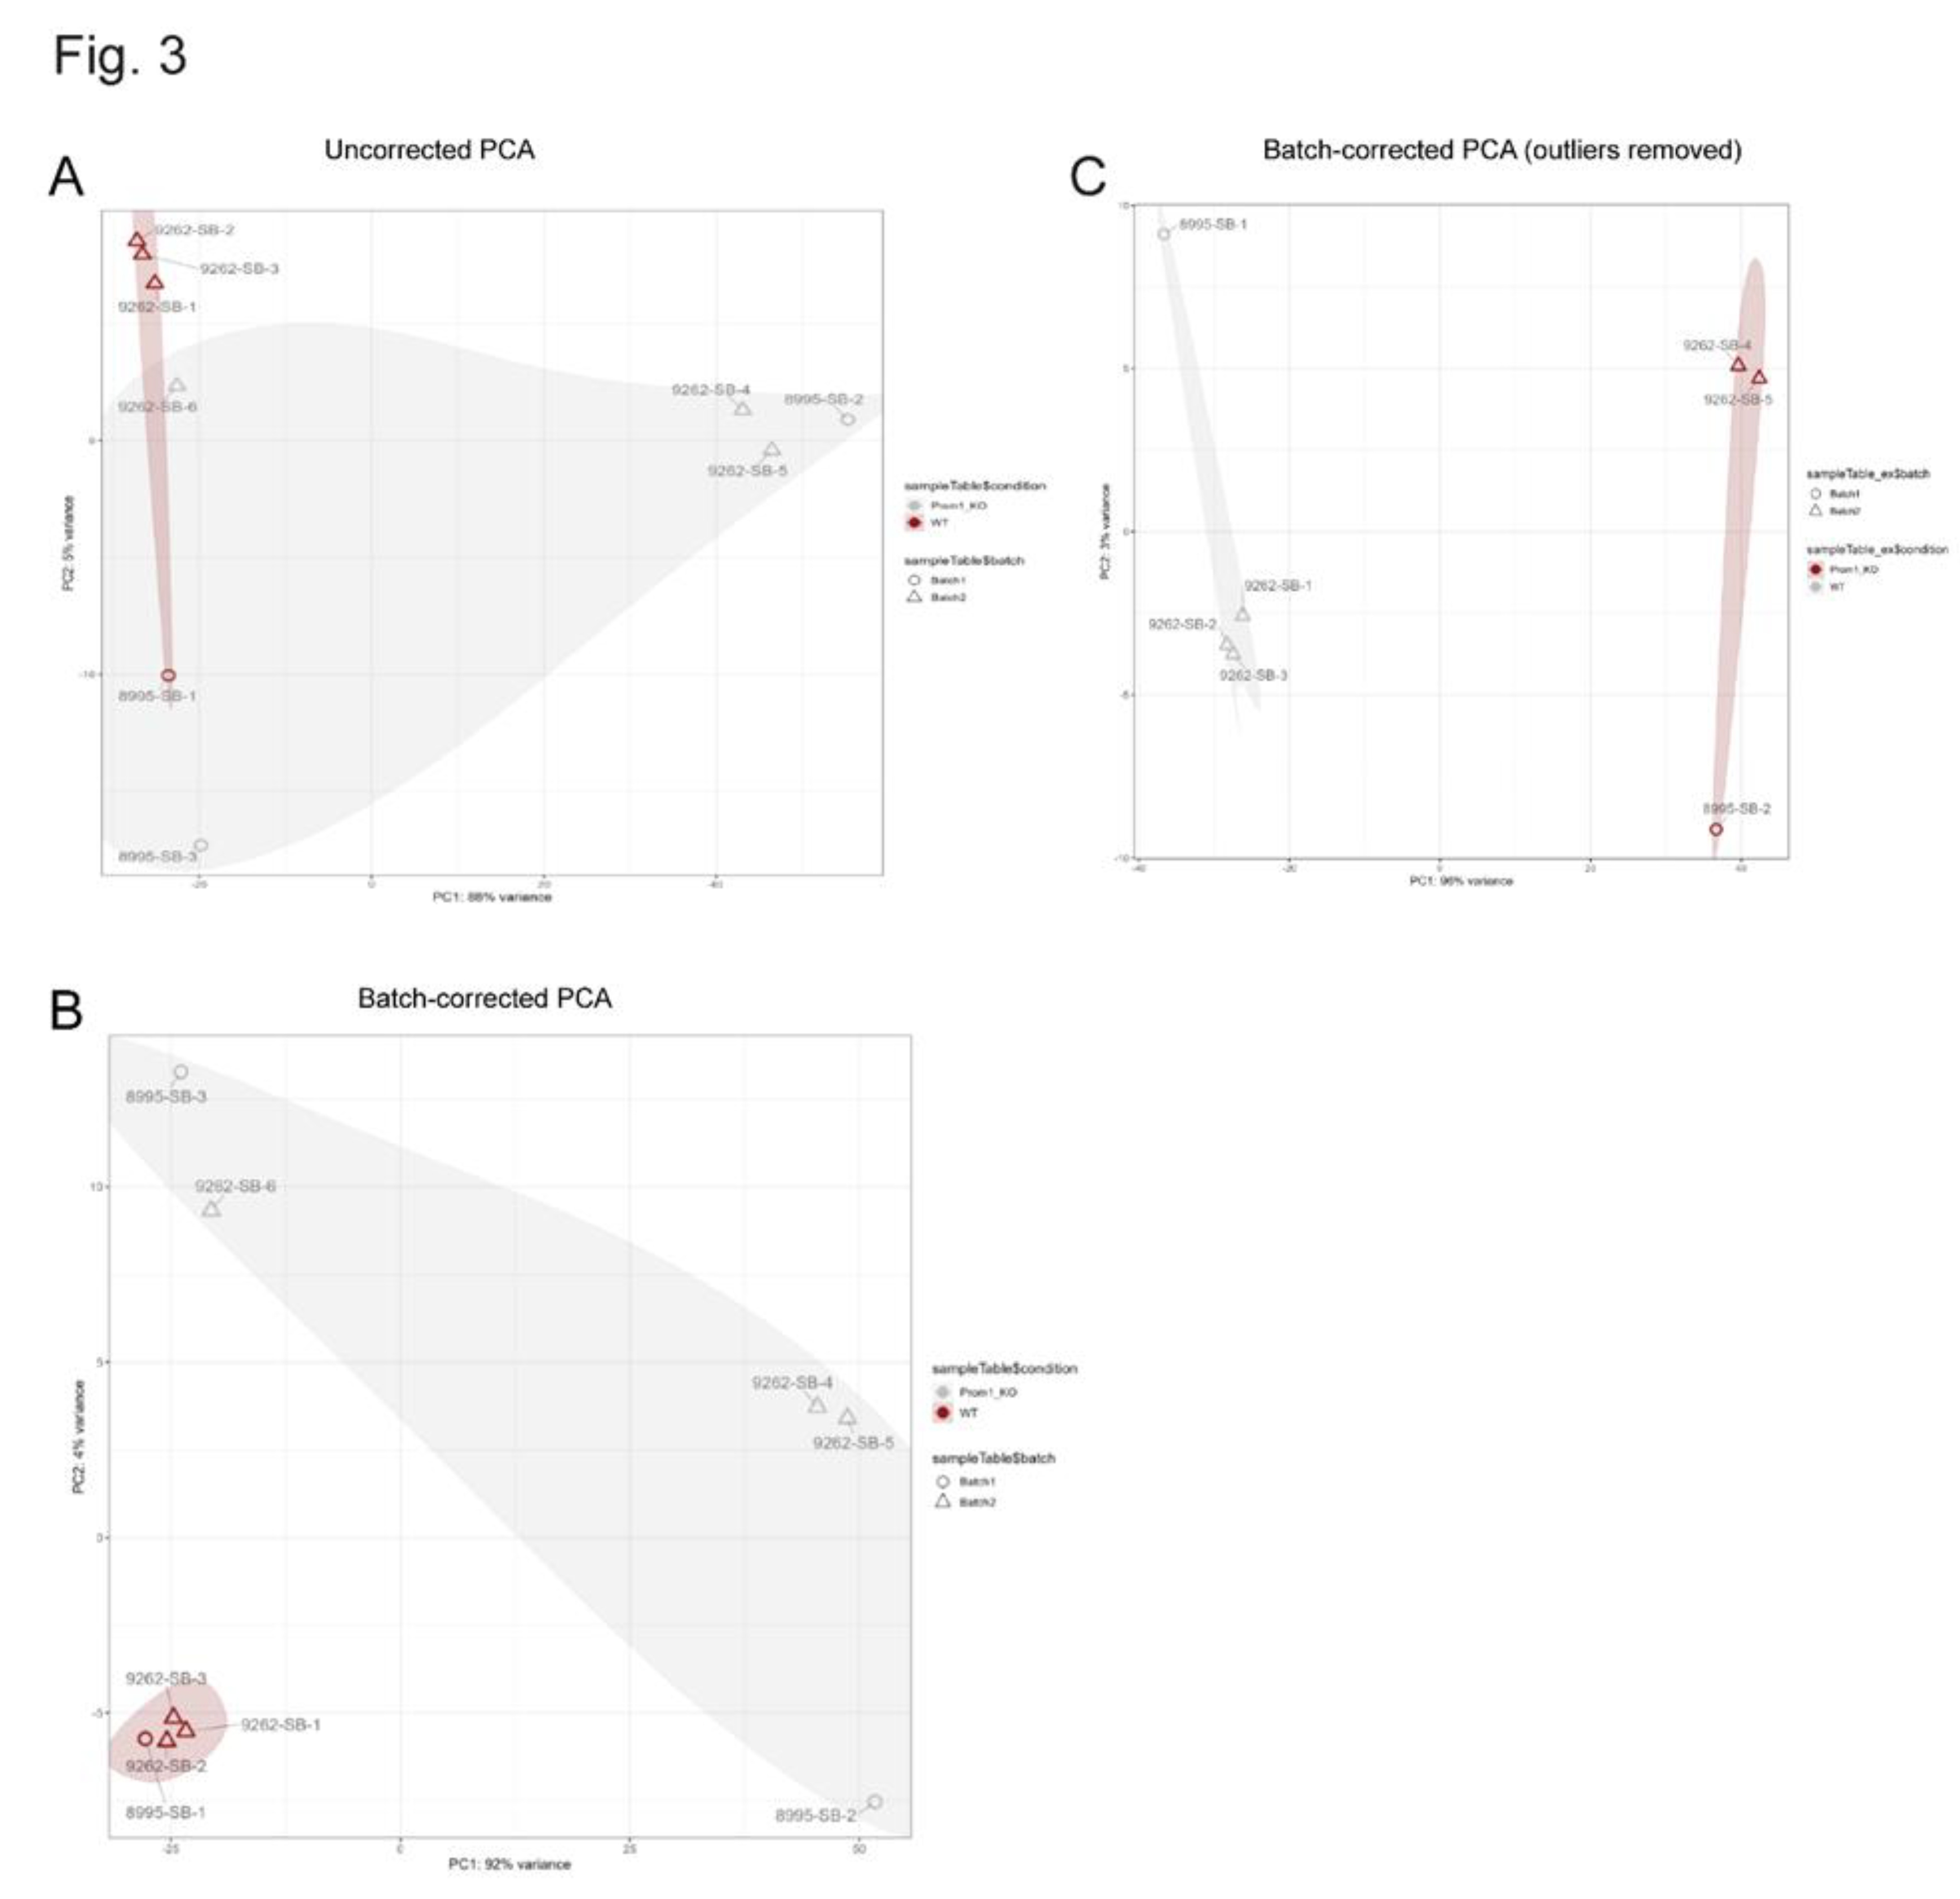
3.2. Bulk RNA-Sequencing of WT and Prom1-KO mRPE Cells

To investigate the molecular consequences of Prom1 loss in retinal pigment epithelium (RPE), we performed bulk RNA sequencing on wild-type (WT) and Prom1-knockout (KO) mouse RPE cells. Sequencing reads were normalized for differences in sequencing depth and filtered to remove lowly or non-expressed genes, ensuring that downstream analyses focused on biologically relevant transcripts. Genes with fewer than five counts in at least three samples were excluded to minimize noise from sporadically expressed features. Raw counts, normalized counts, and post-filtering values were visualized on a log2 + 1 scale to include zero-count features (Figure 2). As expected, increasing sequencing depth improved feature capture, consistent with coverage principles for bulk RNA-seq. After normalization and filtering, WT and KO samples exhibited comparable distributions, confirming effective correction for sequencing depth and removal of low-abundance genes (Figure 2). This approach provided a robust dataset for differential expression analysis and pathway enrichment, enabling the identification of Prom1-dependent signaling networks.
Principal component analysis (PCA) was performed to visualize variance across WT and Prom1-KO mRPE transcriptomes. Uncorrected PCA revealed clustering by sequencing batch, indicating a strong batch effect (Figure 3A). After applying batch correction with limma, PC1 accounted for 92% of the variance, while PC2 accounted for the residual variability of unknown origin. Importantly, batch correction improved sample clustering by genotype, confirming that biological differences rather than technical artifacts drive the major variance component (Figure 3B). Two Prom1-KO samples (8995-SB-3 and 9262-SB-6) remained outliers after correction, suggesting intrinsic biological heterogeneity or technical anomalies (Figure 3B). These findings validate the need for batch adjustment and confirm that genotype is the dominant source of variance in the dataset. Following the removal of two outlier Prom1-KO samples (8995-SB-3 and 9262-SB-6), PCA demonstrated improved clustering by genotype (Figure 3C). PC1 accounted for 96% of the total variance, indicating that the primary source of variability was the experimental condition rather than technical factors. WT and Prom1-KO samples separated clearly along PC1, confirming robust transcriptional differences between groups. PC2 explained only 3% of the variance, and did not correspond to batch or condition, suggesting minimal residual confounding (Figure 3C). These findings validate the dataset’s data quality and support its suitability for downstream differential expression and pathway analyses.

3.3. Differential Expression and Gene Set Enrichment Analyses

Differential expression analysis revealed a pronounced transcriptional shift, including 15 upregulated and downregulated genes (Figure 4A). The volcano plot summarizing DESeq2 data for WT and Prom1-KO mRPE cells shows a cluster of high-magnitude, high-significance hits on both tails, with prominent upregulated genes with a positive log2 fold change (red), including Gremlin-1 (Grem1), an endogenous BMP antagonist that induces EMT in fetal RPE cells [34]; Serpine 2, a serpin with neurotropic and anti-angiogenic activities secreted by the RPE into the interphotoreceptor matrix toward the neural retina [35]; Interleukin-receptor-like 1(Il1r1), an activator of the complement alternative pathway in RPE cells in macular degeneration [36]; Interleukin 33 (IL33), a key regulator of inflammation and RPE atrophy in AMD [37]; and retinoic acid-induced 14 (Rai14), which is expressed in the RPE and has been shown to promote mTOR-mediated inflammation [38,39] (Figure 4A). The down-regulated genes with a negative log2 fold change (blue) include actin-binding LIM protein family member 1 (Ablim1), which directly binds F-actin to serve as a scaffold for signaling modules of the actin cytoskeleton and governs the formation of dense cortical actin meshwork to prevent mechanical tension-induced blebbing during hTERT-RPE1 migration [40,41]; IGF binding protein 2 (IGFBP2), which plays a significant role in modulating IGF-1 activity in the RPE and its loss induces an early reactive RPE phenotype [42,43]; Bone morphogenetic protein-3 (BMP3), its reduced expression leads to fibrosis; and Osteoglycin (OGN), a proteoglycan with strong expression in the Bruch’s membrane and choroid [44] (Figure 4A). We used gene set enrichment analysis (GSEA) to rank gene lists and identify enriched pathways (Figure 4B). Enrichment scores were calculated by hypergeometric tests and normalized to the size of the gene set. A positive normalized gene enrichment score (NES) indicates that the gene set is upregulated in the experimental group. Preliminary analysis of hallmark gene sets from the Molecular Signature Database shows significant upregulation of hallmark signatures for cell cycle transcription factors (E2F and MYC targets, G2M checkpoint), mTORC1 signaling, unfolded protein response (UPR), reactive oxygen species (ROS) pathway, TNFA signaling via NF-kappaB, DNA repair, and oxidative phosphorylation (Figure 4B). Downregulated pathways of interest include apical junction, bile acid metabolism, and EMT pathways (Figure 4B). Together, the DEG landscape and Hallmark Pathway analysis indicate a shift toward RPE innate immune/stress-response remodeling accompanied by dampening of mitochondrial energy metabolism and cell-cycle progression, providing pathway-level context for the gene-wise changes observed due to the loss of Prom1.

3.4. Heatmap Analysis and Biological Context

The heatmap of the top differentially expressed 100 genes (P-value sorted) shows strong clustering of biological replicates, confirming data reproducibility and condition-specific transcriptional signatures (Figure 5). Prom1-KO samples (9262-SB-5, 9262-SB-4, and 8995-SB-2) cluster distinctly from WT samples, reflecting robust genotype-driven expression differences (Figure 5). Several genes with known or emerging roles in RPE physiology and stress response are prominently represented. For example, MertK, essential for photoreceptor outer segment phagocytosis, is reduced in Prom1-KO mRPE compared to WT, suggesting impaired RPE clearance and homeostasis [45]. Cldn2, involved in tight junction integrity in murine RPE, is downregulated in Prom1-KO mRPE, indicating potential disruption of barrier properties [46]. Tgf-beta receptor 2 (Tgfbr2) maintains RPE barrier integrity, and its reduction suggests loss of homeostatic signaling [47]. Caveolin-1 (Cav1), a scaffolding protein in RPE caveolae that regulates vesicular trafficking and endocytosis, is upregulated, suggesting altered lipid raft dynamics that amplify stress signaling [48]. Map3k5 activates JNK and MAPK pathways under oxidative stress, and its upregulation in Prom1-KO mRPE suggests heightened stress signaling and apoptosis susceptibility [49]. Metabolic regulators such as SLC38A1 and SLC7A11 (cysteine/glutamate transporter) are upregulated in Prom1-KO mRPE, reflecting shifts in energy and redox balance, aligning with suppression of oxidative phosphorylation and lipid metabolism [50]. Upregulation of Il33 and downregulation of Igfbp2 further support activation of innate immunity/inflammatory and downregulation of metabolic signaling, echoing TNFα/NF-κB and IL6–JAK–STAT3 pathway enrichment. Collectively, these gene-level changes support the interpretation that Prom1 loss drives a transition from homeostatic RPE function toward a stress- and inflammatory-related phenotype with metabolic compromise.

3.5. Gene Network Map in Prom1-KO versus WT mRPE

Network mapping of Prom1-KO versus WT mouse RPE transcriptomes identified five highly connected hallmark clusters—MYC targets, E2F targets, G2M checkpoint, and mTORC1 signaling —each reflecting coordinated programs of RPE stress, metabolic reprogramming, and degeneration (Figure 6). The mTORC1 cluster, including Serp1, Map2k3, Slc2a1, and Slc7a11, indicates enhanced nutrient-sensing and stress signaling consistent with mTORC1 hyperactivation and impaired autophagic flux. Within the G2M checkpoint cluster, Aurka, Ccnb2, Plk1, and Slc38a1 are included, indicating altered amino acid transport and mitotic checkpoint activation. The MYC and E2F target cluster includes Bub1b, Cdk1, Npm1, Mcm5, Mcm7, Hmgb3, and Hmgb2, which are associated with glycolytic shift, chromatin remodeling, and proliferative stress (Figure 6). Collectively, these cluster-specific changes reinforce a model where Prom1 loss drives inflammatory signaling, metabolic stress, and impaired autophagy, converging on pathways implicated in RPE dysfunction and retinal disease.

3.6. Validation of Transcriptomic Data

We showed earlier that the loss of Prom1 in mRPE cells leads to EMT [28]. In contrast, our transcriptomic data in this study suggest reduced activation of the Hallmark EMT pathway in Prom1-KO mRPE cells (Figure 4B). To validate mRPE EMT dynamics, we performed gene-level interrogation as a biologically relevant approach. A volcano plot of the Hallmark EMT pathway revealed significant upregulation of EMT-associated genes, including Grem1, Pcolce2, Cxcl2, CD44, and Serpine2, while IGFBP2 and POSTN were notably downregulated (Figure 7A). qPCR confirmed IGFBP2 and POSTN gene downregulation (Figure 7B-C) and elevated expression of Grem1 gene in Prom1-deficient RPE cells (KO22 and KO26.4) (Figure D). Western blot confirmed increased Grem1 protein in Prom1-KO cells; however, densitometric analysis showed a statistically significant increase only in KO26.4, while KO22 exhibited a non-significant (ns) trend (Figure 7E). These findings suggest that Prom1 loss upregulates Grem1 transcription, but protein levels may be influenced by post-transcriptional regulation or by the specific genome region disrupted within the Prom1 gene in each CRISPR-edited Prom1-KO clone (Figure 7E). Although GSEA did not reveal clear enrichment for EMT-related pathways, targeted analysis of individual gene expression changes provides evidence for EMT-like alterations, which is consistent with our earlier observations showing EMT in Prom1-KO mRPE cells [28]. The downregulation of extracellular matrix remodeling (POSTN) and the upregulation of an EMT-promoting gene (Grem1), coupled with the suppression of epithelial-supporting factors (IGFBP2), suggest that Prom1 deficiency may initiate a partial or context-specific EMT program that is not fully captured by canonical pathway-level analyses.
To define how Prom1 loss perturbs RPE function, we examined the DEGs highlighted in the volcano plot across oxidative stress/reactive oxygen species (ROS), unfolded protein response (UPR), phagocytosis, and TNF/NF-kappaB pathways (Figure 8A). Among ROS-related genes, Egfr was significantly downregulated, consistent with prior work showing that oxidative stress reduces Egfr/Erk-Akt signaling and impairs RPE viability; conversely, Egfr-mediated antioxidant rescue restores RPE survival [51,52]. Fibulin-5 (Fbln5) was also decreased; Fbln5 is an ECM protein that limits integrin-driven ROS generation and modulates redox tone – its loss is linked to heightened oxidative stress in vivo, suggesting reduced ECM-based ROS control in the RPE microenvironment [53]. Pax2 downregulation is noteworthy given its established role as redundant with Pax6 in specifying RPE fate during development; reduced Pax2 is therefore compatible with impaired RPE identity/homeostasis under stress [54]. Finally, PINK1 gene expression was significantly reduced, suggesting defective mitophagy in RPE; PINK1 loss drives mitochondrial ROS-Nrf2 signaling, EMT-like changes, and structural abnormalities, all of which can cause RPE degeneration [55]. qPCR confirmed PINK1 was significantly reduced in Prom1-KO mRPE groups, indicating impaired mitochondrial quality control due to loss of Prom1 (Figure 8B).
In contrast, several oxidative-response genes were upregulated (Figure 8A). Nqo1, a canonical Nrf2 target that blunts redox cycling, was increased, consistent with a compensatory antioxidant response to elevated ROS [56]. Map3k5 (ASK1), a redox-sensitive Map3k that activates JNK/p38 under oxidative stress, was elevated, aligning with pro-apoptotic and pro-inflammatory stress signaling in stressed epithelia [57]. Hgf was increased; Hgf signaling in RPE promotes proliferation/motility and disrupts tight/adherens junctions via MET/Akt, indicating junctional remodeling and RPE barrier compromise under stress [58,59]. Ripk3 was also upregulated; RIPK1/3 activity has been implicated in RPE injury by promoting mitochondrial DNA release, AIM2 inflammasome activation, and inflammatory cell death, supporting a necroptosis-prone state in diseased RPE [60]. Sod3 gene levels increased as well; SOD3 protects the ECM from superoxide, and its modulation strongly influences retinal function in vivo, consistent with an extracellular antioxidant countermeasure to oxidative burden [61]. UPR-markers such as Qrich1, a transcriptional effector driving proteostasis under ER-stress, and Ptpn2, which protect epithelia from ER-stress-induced death, were upregulated, suggesting activation of UPR signaling in stressed mRPE [62,63]. Finally, the TNF/NF-kB pathway component was increased in Prom1-KO mRPE. Traf1 is an NF-kB-inducible adapter that modulates inflammatory and pro-survival signaling and is a classic footprint of active TNF/NF-kB circuits [64]. Together, these changes map a coordinated phenotype in Prom1-deficient mRPE – elevated oxidative and ER stress, impaired mitochondrial quality control, junctional/ECM remodeling, and TNF-driven inflammation.
The volcano plot revealed downregulation of the PINK1 gene in Prom1-KO cells (Figure 8A). qPCR confirmed a significant reduction in PINK1 gene expression, indicating impaired mitochondrial quality control and mitophagy signaling in Prom1-deficient mRPE cells (Figure 8B). Of note, the MerTk gene was downregulated (Figure 8A). Consistent with transcriptomic findings, western blotting showed a significant reduction of the MerTK protein in both Prom1-KO22 and -KO26.4 mRPE cells, and qPCR confirmed reduced MerTK gene expression in these cells (Figure 8C-D). Because MerTk is indispensable for daily outer-segment clearance by RPE, reduced MerTK expression provides a mechanistic link to impaired phagocytic flux and secondary photoreceptor stress [65].
qPCR studies confirmed the upregulation of the Slc7a11 gene, involved in RPE oxidative stress response (Figure 8E) [66]; and downregulation of genes, including cytoskeletal remodeling, Ablim1 (Figure 8F) [40]; extracellular matrix organization, OGN (Figure 8G); and retinoic acid synthesis, Aldh1a1 (Figure 8H) [67], in Prom1-KO mRPE cells. These findings show that Prom1 deficiency disrupts multiple pathways critical for RPE homeostasis, including mitochondrial turnover, phagocytosis, oxidative stress regulation, and ECM integrity—mechanisms that may underlie retinal degeneration in Prom1-associated disease.

4. Discussion

Prom1 has long been recognized as a primary driver of cell-autonomous photoreceptor pathology, yet its role in the retinal pigment epithelium (RPE) has largely remained unexplored. Building on our prior observations of Prom1 transcripts in mRPE, this study provides definitive evidence of Prom1 protein expression in mRPE both in situ and in cultured cells, confirming its presence beyond photoreceptors [27]. Although Prom1 expression in the RPE monolayer is quantitatively lower than in the photoreceptor-rich retina, our data demonstrate that Prom1 is not merely incidental; instead, it functions as a major regulator of RPE homeostasis in a cell-autonomous manner [27,28]. Through transcriptomic analysis, we show that Prom1 loss initiates a cascade of stress, metabolic, and structural disruptions that converge on pathways central to RPE integrity. These findings reposition Prom1 from a photoreceptor-centric protein to a critical node in RPE biology, with implications for both inherited retinal dystrophies and atrophic age-related macular degeneration. Loss of Prom1 reprograms mouse RPE cells toward a degenerative state marked by activation of stress and inflammatory molecules (TNF/NF-kB; Map3k5, RIPK3), failure of mitochondrial quality control (reduced PINK1); reduced phagocytic capacity (reduced MerTk), junctional/ECM remodeling compatible with HGF signaling; and broader metabolic rewiring (including mTORC1 activation, Slc7a11 induction, and suppression of bile acid metabolism) together with transcriptional features of incomplete EMT – an array of changes that closely mirror mechanisms implicated in both IRDs and aAMD [68,69].
Loss of Prom1 disrupts multiple RPE survival programs through interconnected mechanisms. Increased mTORC1 signaling in Prom1-KO RPE correlates with impaired RPE autophagy and lysosomal activity, which drive EMT and result in AMD-like pathology [28,70]. Reduced PINK1 compromises mitophagy, allowing damaged mitochondria to accumulate, which elevates ROS and activates retrograde stress signaling that promotes EMT-like changes [71]. In parallel, downregulation of MERTK impairs phagocytosis of photoreceptor outer segments, a process essential for retinal homeostasis; its failure accelerates photoreceptor stress and degeneration [65]. These vulnerabilities are compounded by upregulation of ASK1/MAP3K5 and RIPK3, which amplify oxidative and ER stress responses, driving JNK/p38-mediated apoptosis and necroptosis [60]. Junctional instability observed in Prom1-KO cells is consistent with HGF/MET signaling, which is known to dismantle tight junctions, increase RPE motility, and activate AKT survival pathways [59]. Finally, induction of SLC7A11 reflects an adaptive antioxidant response to counter ferroptosis, underscoring a shift toward stress tolerance rather than restoration of homeostasis [72]. Together, these changes form a coherent degenerative program linking mitochondrial failure, impaired clearance, inflammatory signaling, and barrier breakdown -- hallmarks of RPE dysfunction in AMD and IRDs.
Notably, the Hallmark pathway suppression of bile acid metabolism has important implications: beyond lipid emulsification, bile acids and their receptors FXR and TGR5 act as hormone-like immunometabolic cues that constrain inflammation, support epithelial barrier integrity, and tune energy metabolism across tissues [73]. In the eye, TUDCA/UDCA mitigate oxidative and ER stress, dampen pro-inflammatory cytokines, stabilize barrier properties, and in RPE promote autophagy-mediated cytoprotection, suggesting that loss of bile acid signaling removes an endogenous pro-homeostatic brake in Prom1-deficient RPE and offers an actionable therapeutic axis [74,75]. These metabolite-signaling considerations are consistent with broader lipid metabolic dysfunction observed in multi-omic RPE models and AMD patient serum, reinforcing the clinical relevance of our metabolic signatures [76].
The global architecture of the Prom1-KO transcriptome aligns with previous RPE transcriptomics in human AMD [68,69]. Combined meta-analyses and single-cell atlases highlight inflammatory and proteostatic remodeling, as well as metabolic rewiring (including TNFα/NF-κB activation, UPR/proteostasis engagement, and changes in oxidative metabolism) in AMD regions, paralleling the pathway enrichments observed in Prom1-KO mRPE cells. Longitudinal RNA-seq of RPE during outer-segment processing documents coordinated autophagy, lysosome, and proteostasis programs, aligning with our UPR signatures and supporting a central role for proteostasis failure in disease progression [77]. Genetic activation of mTOR in mouse RPE drives EMT, disruption of autophagy, metabolic imbalance, and aAMD-like pathology [70]. This mirrors the mTORC1/EMT transcriptomic changes in Prom1-KO mRPE, supporting the idea that metabolism and cell-state transitions are closely linked in degenerating RPE [70]. Furthermore, our combination of EMT-effector induction with overall suppression of the EMT hallmark aligns with the emerging concept of incomplete or partial EMT in AMD and RPE injury—loss of epithelial features with partial mesenchymal acquisition rather than full transdifferentiation—reconciling transcriptomic complexity with pathology [78].

5. Conclusions

In summary, our study places RPE-localized Prom1 at a central point connecting vesicular dynamics, mitochondrial quality control, phagocytic and barrier functions, and immunometabolism. The Prom1-dependent network we identify not only aligns with human RPE transcriptomics in AMD and IRDs but also provides a targeted set of mechanistic, actionable entry points for maintaining RPE health across genetic and age-related retinal degeneration.

Funding

This work was supported by the International Retina Research Foundation (GF02527), the Potocsnak family gift to the Vanderbilt Eye Institute, an unrestricted departmental research grant from Research to Prevent Blindness, Inc. (New York, NY), and the Vision Core Grant P30 EY08126 for histology. Confocal microscopy and image analysis were performed through the use of the Vanderbilt Cell Imaging Shared Resource (supported by NIH grants CA68485, DK58404, and EY08126). The Zeiss LSM880 confocal microscope with Airyscan was purchased through NIH equipment grant S10OD021630.

Institutional Review Board Statement

The Institutional Review Board at Vanderbilt University Medical Center approved the animal study protocol (protocol number M2100026-01, approved on April 01, 2025).

Informed Consent Statement

Not applicable.

Data Availability Statement

The data supporting this study’s findings are available from the corresponding author upon reasonable request. The RNA sequence files have been deposited in NCBI under GEO accession ID GSE298665 (embargoed until publication).

Acknowledgments

We thank Jean-Philippe Cartailler and Shristi Shrestha at Creative Data Solutions at Vanderbilt University for transcriptomic data analysis. The Graphical Abstract was created in BioRender. Bhattacharya, S. (2025) https://BioRender.com/vzfjiom. Part of this work was presented as a poster (abstract) at the ARVO meeting, held in Seattle, WA, May 5-9, 2024.

Conflicts of Interest

The authors declare no conflicts of interest.:.

Abbreviations

IRDs Inherited Retinal Dystrophies
aAMD Atrophic Age-related Macular Degeneration
RPE Retinal Pigment Epithelium
mTORC1 Mammalian Target of Rapamycin Complex 1
Prom1 Prominin-1 (CD133)
STGD4 Stargardt disease 4
EMT Epithelial-Mesenchymal Transitio
GSEA Gene Set Enrichment Analysis
DEG Differential Gene Expression
qPCR Quantitative Polymerase Chain Reaction
PCA Principal Component Analysis
ECM Extracellular Matrix
UPR Unfolded Protein Response

References

  1. Corradetti, G.; Verma, A.; Tojjar, J.; Almidani, L.; Oncel, D.; Emamverdi, M.; Bradley, A.; Lindenberg, S.; Nittala, M.G.; Sadda, S.R. Retinal Imaging Findings in Inherited Retinal Diseases. J Clin Med 2024, 13. [Google Scholar] [CrossRef]
  2. Samelska, K.; Szaflik, J.P.; Guszkowska, M.; Kurowska, A.K.; Zaleska-Zmijewska, A. Characteristics of Rare Inherited Retinal Dystrophies in Adaptive Optics-A Study on 53 Eyes. Diagnostics (Basel) 2023, 13. [Google Scholar] [CrossRef]
  3. Sanie-Jahromi, F.; Nowroozzadeh, M.H. RPE based gene and cell therapy for inherited retinal diseases: A review. Exp Eye Res 2022, 217, 108961. [Google Scholar] [CrossRef]
  4. Tebbe, L.; Sakthivel, H.; Makia, M.S.; Kakakhel, M.; Conley, S.M.; Al-Ubaidi, M.R.; Naash, M.I. Prph2 disease mutations lead to structural and functional defects in the RPE. FASEB J 2022, 36, e22284. [Google Scholar] [CrossRef]
  5. Hwang, S.; Kang, S.W.; Jang, J.H.; Kim, S.J. Genetic and clinical characteristics of PROM1-related retinal degeneration in Korean. Sci Rep 2023, 13, 21877. [Google Scholar] [CrossRef] [PubMed]
  6. Puertas-Neyra, K.; Coco-Martin, R.M.; Hernandez-Rodriguez, L.A.; Gobelli, D.; Garcia-Ferrer, Y.; Palma-Vecino, R.; Telleria, J.J.; Simarro, M.; de la Fuente, M.A.; Fernandez-Bueno, I. Clinical exome analysis and targeted gene repair of the c.1354dupT variant in iPSC lines from patients with PROM1-related retinopathies exhibiting diverse phenotypes. Stem Cell Res Ther 2024, 15, 192. [Google Scholar] [CrossRef] [PubMed]
  7. Miraglia, S.; Godfrey, W.; Yin, A.H.; Atkins, K.; Warnke, R.; Holden, J.T.; Bray, R.A.; Waller, E.K.; Buck, D.W. A novel five-transmembrane hematopoietic stem cell antigen: isolation, characterization, and molecular cloning. Blood 1997, 90, 5013–5021. [Google Scholar] [CrossRef]
  8. Weigmann, A.; Corbeil, D.; Hellwig, A.; Huttner, W.B. Prominin, a novel microvilli-specific polytopic membrane protein of the apical surface of epithelial cells, is targeted to plasmalemmal protrusions of non-epithelial cells. Proc Natl Acad Sci U S A 1997, 94, 12425–12430. [Google Scholar] [CrossRef] [PubMed]
  9. Pleskac, P.; Fargeas, C.A.; Veselska, R.; Corbeil, D.; Skoda, J. Emerging roles of prominin-1 (CD133) in the dynamics of plasma membrane architecture and cell signaling pathways in health and disease. Cell Mol Biol Lett 2024, 29, 41. [Google Scholar] [CrossRef]
  10. Ragi, S.D.; Lima de Carvalho, J.R., Jr.; Tanaka, A.J.; Park, K.S.; Mahajan, V.B.; Maumenee, I.H.; Tsang, S.H. Compound heterozygous novel frameshift variants in the PROM1 gene result in Leber congenital amaurosis. Cold Spring Harb Mol Case Stud 2019, 5. [Google Scholar] [CrossRef]
  11. Maw, M.A.; Corbeil, D.; Koch, J.; Hellwig, A.; Wilson-Wheeler, J.C.; Bridges, R.J.; Kumaramanickavel, G.; John, S.; Nancarrow, D.; Roper, K.; et al. A frameshift mutation in prominin (mouse)-like 1 causes human retinal degeneration. Hum Mol Genet 2000, 9, 27–34. [Google Scholar] [CrossRef]
  12. Yang, Z.; Chen, Y.; Lillo, C.; Chien, J.; Yu, Z.; Michaelides, M.; Klein, M.; Howes, K.A.; Li, Y.; Kaminoh, Y.; et al. Mutant prominin 1 found in patients with macular degeneration disrupts photoreceptor disk morphogenesis in mice. J Clin Invest 2008, 118, 2908–2916. [Google Scholar] [CrossRef]
  13. Zhang, Q.; Zulfiqar, F.; Xiao, X.; Riazuddin, S.A.; Ahmad, Z.; Caruso, R.; MacDonald, I.; Sieving, P.; Riazuddin, S.; Hejtmancik, J.F. Severe retinitis pigmentosa mapped to 4p15 and associated with a novel mutation in the PROM1 gene. Hum Genet 2007, 122, 293–299. [Google Scholar] [CrossRef]
  14. Pras, E.; Abu, A.; Rotenstreich, Y.; Avni, I.; Reish, O.; Morad, Y.; Reznik-Wolf, H.; Pras, E. Cone-rod dystrophy and a frameshift mutation in the PROM1 gene. Mol Vis 2009, 15, 1709–1716. [Google Scholar]
  15. Eidinger, O.; Leibu, R.; Newman, H.; Rizel, L.; Perlman, I.; Ben-Yosef, T. An intronic deletion in the PROM1 gene leads to autosomal recessive cone-rod dystrophy. Mol Vis 2015, 21, 1295–1306. [Google Scholar]
  16. Khan, A.O.; Bolz, H.J. Pediatric Cone-Rod Dystrophy with High Myopia and Nystagmus Suggests Recessive PROM1 Mutations. Ophthalmic Genet 2015, 36, 349–352. [Google Scholar] [CrossRef] [PubMed]
  17. Imani, S.; Cheng, J.; Shasaltaneh, M.D.; Wei, C.; Yang, L.; Fu, S.; Zou, H.; Khan, M.A.; Zhang, X.; Chen, H.; et al. Genetic identification and molecular modeling characterization reveal a novel PROM1 mutation in Stargardt4-like macular dystrophy. Oncotarget 2018, 9, 122–141. [Google Scholar] [CrossRef]
  18. Carr, B.J.; Skitsko, D.; Kriese, L.M.; Song, J.; Li, Z.; Ju, M.J.; Moritz, O.L. Prominin-1 null Xenopus laevis develop subretinal drusenoid-like deposits, cone-rod dystrophy, and RPE atrophy. J Cell Sci 2024. [Google Scholar] [CrossRef] [PubMed]
  19. Strauss, R.W.; Munoz, B.; Ahmed, M.I.; Bittencourt, M.; Schonbach, E.M.; Michaelides, M.; Birch, D.; Zrenner, E.; Ervin, A.M.; Charbel Issa, P.; et al. The Progression of the Stargardt Disease Type 4 (ProgStar-4) Study: Design and Baseline Characteristics (ProgStar-4 Report No. 1). Ophthalmic Res 2018, 60, 185–194. [Google Scholar] [CrossRef] [PubMed]
  20. Kniazeva, M.; Chiang, M.F.; Morgan, B.; Anduze, A.L.; Zack, D.J.; Han, M.; Zhang, K. A new locus for autosomal dominant stargardt-like disease maps to chromosome 4. Am J Hum Genet 1999, 64, 1394–1399. [Google Scholar] [CrossRef]
  21. Abalem, M.F.; Omari, A.A.; Schlegel, D.; Khan, N.W.; Jayasundera, T. Macular hyperpigmentary changes in ABCA4-Stargardt disease. Int J Retina Vitreous 2019, 5, 9. [Google Scholar] [CrossRef]
  22. Lee, W.; Paavo, M.; Zernant, J.; Stong, N.; Laurente, Z.; Bearelly, S.; Nagasaki, T.; Tsang, S.H.; Goldstein, D.B.; Allikmets, R. Modification of the PROM1 disease phenotype by a mutation in ABCA4. Ophthalmic Genet 2019, 40, 369–375. [Google Scholar] [CrossRef]
  23. Permanyer, J.; Navarro, R.; Friedman, J.; Pomares, E.; Castro-Navarro, J.; Marfany, G.; Swaroop, A.; Gonzalez-Duarte, R. Autosomal recessive retinitis pigmentosa with early macular affectation caused by premature truncation in PROM1. Invest Ophthalmol Vis Sci 2010, 51, 2656–2663. [Google Scholar] [CrossRef]
  24. Paavo, M.; Lee, W.; Parmann, R.; Lima de Carvalho, J.R., Jr.; Zernant, J.; Tsang, S.H.; Allikmets, R.; Sparrow, J.R. Insights Into PROM1-Macular Disease Using Multimodal Imaging. Invest Ophthalmol Vis Sci 2023, 64, 27. [Google Scholar] [CrossRef]
  25. Ricca, A.M.; Han, I.C.; Hoffmann, J.; Stone, E.M.; Sohn, E.H. Macular Atrophy and Phenotypic Variability in Autosomal Dominant Stargardt-Like Macular Dystrophy Due to Prom1 Mutation. Retina 2023, 43, 1165–1173. [Google Scholar] [CrossRef] [PubMed]
  26. Bhattacharya, S.; Yin, J.; Winborn, C.S.; Zhang, Q.; Yue, J.; Chaum, E. Prominin-1 Is a Novel Regulator of Autophagy in the Human Retinal Pigment Epithelium. Invest Ophthalmol Vis Sci 2017, 58, 2366–2387. [Google Scholar] [CrossRef] [PubMed]
  27. Bhattacharya, S.; Yang, T.S.; Nabit, B.P.; Krystofiak, E.S.; Rex, T.S.; Chaum, E. Prominin-1 Knockdown Causes RPE Degeneration in a Mouse Model. Cells 2024, 13. [Google Scholar] [CrossRef] [PubMed]
  28. Bhattacharya, S.; Yin, J.; Huo, W.; Chaum, E. Loss of Prom1 impairs autophagy and promotes epithelial-mesenchymal transition in mouse retinal pigment epithelial cells. J Cell Physiol 2023. [Google Scholar] [CrossRef]
  29. Fernandez-Godino, R.; Garland, D.L.; Pierce, E.A. Isolation, culture and characterization of primary mouse RPE cells. Nat Protoc 2016, 11, 1206–1218. [Google Scholar] [CrossRef]
  30. Boatright, J.H.; Dalal, N.; Chrenek, M.A.; Gardner, C.; Ziesel, A.; Jiang, Y.; Grossniklaus, H.E.; Nickerson, J.M. Methodologies for analysis of patterning in the mouse RPE sheet. Mol Vis 2015, 21, 40–60. [Google Scholar]
  31. Bhattacharya, S.; Chaum, E.; Johnson, D.A.; Johnson, L.R. Age-related susceptibility to apoptosis in human retinal pigment epithelial cells is triggered by disruption of p53-Mdm2 association. Invest Ophthalmol Vis Sci 2012, 53, 8350–8366. [Google Scholar] [CrossRef]
  32. Dobin, A.; Davis, C.A.; Schlesinger, F.; Drenkow, J.; Zaleski, C.; Jha, S.; Batut, P.; Chaisson, M.; Gingeras, T.R. STAR: ultrafast universal RNA-seq aligner. Bioinformatics 2013, 29, 15–21. [Google Scholar] [CrossRef] [PubMed]
  33. Love, M.I.; Huber, W.; Anders, S. Moderated estimation of fold change and dispersion for RNA-seq data with DESeq2. Genome Biol 2014, 15, 550. [Google Scholar] [CrossRef] [PubMed]
  34. Li, D.; Yuan, D.; Shen, H.; Mao, X.; Yuan, S.; Liu, Q. Gremlin-1: An endogenous BMP antagonist induces epithelial-mesenchymal transition and interferes with redifferentiation in fetal RPE cells with repeated wounds. Mol Vis 2019, 25, 625–635. [Google Scholar]
  35. Winokur, P.N.; Subramanian, P.; Bullock, J.L.; Arocas, V.; Becerra, S.P. Comparison of two neurotrophic serpins reveals a small fragment with cell survival activity. Mol Vis 2017, 23, 372–384. [Google Scholar]
  36. Cheng, X.; He, D.; Liao, C.; Lin, S.; Tang, L.; Wang, Y.L.; Hu, J.; Li, W.; Liu, Z.; Wu, Y.; et al. IL-1/IL-1R signaling induced by all-trans-retinal contributes to complement alternative pathway activation in retinal pigment epithelium. J Cell Physiol 2021, 236, 3660–3674. [Google Scholar] [CrossRef] [PubMed]
  37. Xi, H.; Katschke, K.J., Jr.; Li, Y.; Truong, T.; Lee, W.P.; Diehl, L.; Rangell, L.; Tao, J.; Arceo, R.; Eastham-Anderson, J.; et al. IL-33 amplifies an innate immune response in the degenerating retina. J Exp Med 2016, 213, 189–207. [Google Scholar] [CrossRef]
  38. Kutty, R.K.; Samuel, W.; Chen, S.; Vijayasarathy, C.; Dun, Y.; Mysona, B.; Wiggert, B.; Smith, S.B. Immunofluorescence analysis of the expression of Norpeg (Rai14) in retinal Muller and ganglion cells. Neurosci Lett 2006, 404, 294–298. [Google Scholar] [CrossRef]
  39. Shen, X.; Zhang, J.; Zhang, X.; Wang, Y.; Hu, Y.; Guo, J. Retinoic Acid-Induced Protein 14 (RAI14) Promotes mTOR-Mediated Inflammation Under Inflammatory Stress and Chemical Hypoxia in a U87 Glioblastoma Cell Line. Cell Mol Neurobiol 2019, 39, 241–254. [Google Scholar] [CrossRef]
  40. Barrientos, T.; Frank, D.; Kuwahara, K.; Bezprozvannaya, S.; Pipes, G.C.; Bassel-Duby, R.; Richardson, J.A.; Katus, H.A.; Olson, E.N.; Frey, N. Two novel members of the ABLIM protein family, ABLIM-2 and -3, associate with STARS and directly bind F-actin. J Biol Chem 2007, 282, 8393–8403. [Google Scholar] [CrossRef]
  41. Li, G.; Huang, S.; Yang, S.; Wang, J.; Cao, J.; Czajkowsky, D.M.; Shao, Z.; Zhu, X. abLIM1 constructs non-erythroid cortical actin networks to prevent mechanical tension-induced blebbing. Cell Discov 2018, 4, 42. [Google Scholar] [CrossRef] [PubMed]
  42. Yang, H.; Chaum, E. A reassessment of insulin-like growth factor binding protein gene expression in the human retinal pigment epithelium. J Cell Biochem 2003, 89, 933–943. [Google Scholar] [CrossRef]
  43. Mukherjee, S.; King, J.L.; Guidry, C. Phenotype-associated changes in retinal pigment epithelial cell expression of insulin-like growth factor binding proteins. Invest Ophthalmol Vis Sci 2009, 50, 5449–5455. [Google Scholar] [CrossRef]
  44. Low, S.W.Y.; Connor, T.B.; Kassem, I.S.; Costakos, D.M.; Chaurasia, S.S. Small Leucine-Rich Proteoglycans (SLRPs) in the Retina. Int J Mol Sci 2021, 22. [Google Scholar] [CrossRef]
  45. Mercau, M.E.; Akalu, Y.T.; Mazzoni, F.; Gyimesi, G.; Alberto, E.J.; Kong, Y.; Hafler, B.P.; Finnemann, S.C.; Rothlin, C.V.; Ghosh, S. Inflammation of the retinal pigment epithelium drives early-onset photoreceptor degeneration in Mertk-associated retinitis pigmentosa. Sci Adv 2023, 9, eade9459. [Google Scholar] [CrossRef] [PubMed]
  46. Louer, E.M.M.; Gunzel, D.; Rosenthal, R.; Carmone, C.; Yi, G.; Stunnenberg, H.G.; den Hollander, A.I.; Deen, P.M.T. Differential day-night expression of tight junction components in murine retinal pigment epithelium. Exp Eye Res 2020, 193, 107985. [Google Scholar] [CrossRef] [PubMed]
  47. Schlecht, A.; Leimbeck, S.V.; Jagle, H.; Feuchtinger, A.; Tamm, E.R.; Braunger, B.M. Deletion of Endothelial Transforming Growth Factor-beta Signaling Leads to Choroidal Neovascularization. Am J Pathol 2017, 187, 2570–2589. [Google Scholar] [CrossRef]
  48. Shimizu, H.; Yamada, K.; Suzumura, A.; Kataoka, K.; Takayama, K.; Sugimoto, M.; Terasaki, H.; Kaneko, H. Caveolin-1 Promotes Cellular Senescence in Exchange for Blocking Subretinal Fibrosis in Age-Related Macular Degeneration. Invest Ophthalmol Vis Sci 2020, 61, 21. [Google Scholar] [CrossRef]
  49. Matsuzawa, A.; Saegusa, K.; Noguchi, T.; Sadamitsu, C.; Nishitoh, H.; Nagai, S.; Koyasu, S.; Matsumoto, K.; Takeda, K.; Ichijo, H. ROS-dependent activation of the TRAF6-ASK1-p38 pathway is selectively required for TLR4-mediated innate immunity. Nat Immunol 2005, 6, 587–592. [Google Scholar] [CrossRef]
  50. Sun, Y.; Hu, Y.; Luo, S. Complement C5a promotes human retinal pigment epithelial cell viability and migration through SLC38A1-mediated glutamine metabolism. Med Microbiol Immunol 2025, 214, 22. [Google Scholar] [CrossRef]
  51. Chen, X.; Tzekov, R.; Su, M.; Zhu, Y.; Han, A.; Li, W. Hydrogen peroxide-induced oxidative damage and protective role of peroxiredoxin 6 protein via EGFR/ERK signaling pathway in RPE cells. Front Aging Neurosci 2023, 15, 1169211. [Google Scholar] [CrossRef]
  52. Chen, X.D.; Su, M.Y.; Chen, T.T.; Hong, H.Y.; Han, A.D.; Li, W.S. Oxidative stress affects retinal pigment epithelial cell survival through epidermal growth factor receptor/AKT signaling pathway. Int J Ophthalmol 2017, 10, 507–514. [Google Scholar] [CrossRef]
  53. Wang, M.; Topalovski, M.; Toombs, J.E.; Wright, C.M.; Moore, Z.R.; Boothman, D.A.; Yanagisawa, H.; Wang, H.; Witkiewicz, A.; Castrillon, D.H.; et al. Fibulin-5 Blocks Microenvironmental ROS in Pancreatic Cancer. Cancer Res 2015, 75, 5058–5069. [Google Scholar] [CrossRef]
  54. Bosze, B.; Suarez-Navarro, J.; Soofi, A.; Lauderdale, J.D.; Dressler, G.R.; Brown, N.L. Multiple roles for Pax2 in the embryonic mouse eye. Dev Biol 2021, 472, 18–29. [Google Scholar] [CrossRef]
  55. Zhang, S.M.; Fan, B.; Li, Y.L.; Zuo, Z.Y.; Li, G.Y. Oxidative Stress-Involved Mitophagy of Retinal Pigment Epithelium and Retinal Degenerative Diseases. Cell Mol Neurobiol 2023, 43, 3265–3276. [Google Scholar] [CrossRef]
  56. Ross, D.; Siegel, D. Functions of NQO1 in Cellular Protection and CoQ(10) Metabolism and its Potential Role as a Redox Sensitive Molecular Switch. Front Physiol 2017, 8, 595. [Google Scholar] [CrossRef] [PubMed]
  57. Kojima, K.; Ichijo, H.; Naguro, I. Molecular functions of ASK family in diseases caused by stress-induced inflammation and apoptosis. J Biochem 2021, 169, 395–407. [Google Scholar] [CrossRef] [PubMed]
  58. Jin, M.; Barron, E.; He, S.; Ryan, S.J.; Hinton, D.R. Regulation of RPE intercellular junction integrity and function by hepatocyte growth factor. Invest Ophthalmol Vis Sci 2002, 43, 2782–2790. [Google Scholar] [PubMed]
  59. Zhou, S.R.; Zhu, Y.S.; Yuan, W.T.; Pan, X.Y.; Wang, T.; Chen, X.D. Hepatocyte growth factor promotes retinal pigment epithelium cell activity through MET/AKT signaling pathway. Int J Ophthalmol 2024, 17, 806–814. [Google Scholar] [CrossRef]
  60. Huang, X.; Li, T.; Zhang, G.; Chen, J.; Li, T.; Yang, S.; Bo, Q.; Zhao, X.; Wan, X.; Zhu, X.; et al. AIM2 activation mediated by RIPK1/3-dependent mitochondrial DNA release drives Abeta(1-40)-Induced retinal pigment epithelium injury. Cell Commun Signal 2025, 23, 301. [Google Scholar] [CrossRef]
  61. Wert, K.J.; Velez, G.; Cross, M.R.; Wagner, B.A.; Teoh-Fitzgerald, M.L.; Buettner, G.R.; McAnany, J.J.; Olivier, A.; Tsang, S.H.; Harper, M.M.; et al. Extracellular superoxide dismutase (SOD3) regulates oxidative stress at the vitreoretinal interface. Free Radic Biol Med 2018, 124, 408–419. [Google Scholar] [CrossRef]
  62. You, K.; Wang, L.; Chou, C.H.; Liu, K.; Nakata, T.; Jaiswal, A.; Yao, J.; Lefkovith, A.; Omar, A.; Perrigoue, J.G.; et al. QRICH1 dictates the outcome of ER stress through transcriptional control of proteostasis. Science 2021, 371. [Google Scholar] [CrossRef]
  63. Elvira, B.; Vandenbempt, V.; Bauza-Martinez, J.; Crutzen, R.; Negueruela, J.; Ibrahim, H.; Winder, M.L.; Brahma, M.K.; Vekeriotaite, B.; Martens, P.J.; et al. PTPN2 Regulates the Interferon Signaling and Endoplasmic Reticulum Stress Response in Pancreatic beta-Cells in Autoimmune Diabetes. Diabetes 2022, 71, 653–668. [Google Scholar] [CrossRef] [PubMed]
  64. Edilova, M.I.; Abdul-Sater, A.A.; Watts, T.H. TRAF1 Signaling in Human Health and Disease. Front Immunol 2018, 9, 2969. [Google Scholar] [CrossRef]
  65. Strick, D.J.; Vollrath, D. Focus on molecules: MERTK. Exp Eye Res 2010, 91, 786–787. [Google Scholar] [CrossRef] [PubMed]
  66. Ho, T.C.; Tsai, S.H.; Yeh, S.I.; Sun, M.H.; Tsao, Y.P. A PEDF-Derived Short Peptide Prevents Sodium Iodate-Induced Retinal Degeneration in Rats by Activating the SLC7A11/GSH/GPX4 Pathway in the RPE Cells. J Cell Mol Med 2025, 29, e70693. [Google Scholar] [CrossRef] [PubMed]
  67. Goto, S.; Onishi, A.; Misaki, K.; Yonemura, S.; Sugita, S.; Ito, H.; Ohigashi, Y.; Ema, M.; Sakaguchi, H.; Nishida, K.; et al. Neural retina-specific Aldh1a1 controls dorsal choroidal vascular development via Sox9 expression in retinal pigment epithelial cells. Elife 2018, 7. [Google Scholar] [CrossRef]
  68. Voigt, A.P.; Mulfaul, K.; Mullin, N.K.; Flamme-Wiese, M.J.; Giacalone, J.C.; Stone, E.M.; Tucker, B.A.; Scheetz, T.E.; Mullins, R.F. Single-cell transcriptomics of the human retinal pigment epithelium and choroid in health and macular degeneration. Proc Natl Acad Sci U S A 2019, 116, 24100–24107. [Google Scholar] [CrossRef]
  69. Dhirachaikulpanich, D.; Li, X.; Porter, L.F.; Paraoan, L. Integrated Microarray and RNAseq Transcriptomic Analysis of Retinal Pigment Epithelium/Choroid in Age-Related Macular Degeneration. Front Cell Dev Biol 2020, 8, 808. [Google Scholar] [CrossRef]
  70. Chowdhury, O.; Bammidi, S.; Gautam, P.; Babu, V.S.; Liu, H.; Shang, P.; Xin, Y.; Mahally, E.; Nemani, M.; Koontz, V.; et al. Activated mTOR Signaling in the RPE Drives EMT, Autophagy, and Metabolic Disruption, Resulting in AMD-Like Pathology in Mice. Aging Cell 2025, e70018. [Google Scholar] [CrossRef]
  71. Datta, S.; Cano, M.; Satyanarayana, G.; Liu, T.; Wang, L.; Wang, J.; Cheng, J.; Itoh, K.; Sharma, A.; Bhutto, I.; et al. Mitophagy initiates retrograde mitochondrial-nuclear signaling to guide retinal pigment cell heterogeneity. Autophagy 2023, 19, 966–983. [Google Scholar] [CrossRef]
  72. Zhao, X.; Gao, M.; Liang, J.; Chen, Y.; Wang, Y.; Wang, Y.; Xiao, Y.; Zhao, Z.; Wan, X.; Jiang, M.; et al. SLC7A11 Reduces Laser-Induced Choroidal Neovascularization by Inhibiting RPE Ferroptosis and VEGF Production. Front Cell Dev Biol 2021, 9, 639851. [Google Scholar] [CrossRef]
  73. Perino, A.; Demagny, H.; Velazquez-Villegas, L.; Schoonjans, K. Molecular Physiology of Bile Acid Signaling in Health, Disease, and Aging. Physiol Rev 2021, 101, 683–731. [Google Scholar] [CrossRef] [PubMed]
  74. Zubieta, D.; Warden, C.; Bhattacharya, S.; Brantley, M.A., Jr. Tauroursodeoxycholic Acid Confers Protection Against Oxidative Stress via Autophagy Induction in Retinal Pigment Epithelial Cells. Curr Issues Mol Biol 2025, 47. [Google Scholar] [CrossRef] [PubMed]
  75. Win, A.; Delgado, A.; Jadeja, R.N.; Martin, P.M.; Bartoli, M.; Thounaojam, M.C. Pharmacological and Metabolic Significance of Bile Acids in Retinal Diseases. Biomolecules 2021, 11. [Google Scholar] [CrossRef]
  76. Alvarez-Barrios, A.; Alvarez, L.; Saenz de Santa Maria, P.; Garcia, M.; Alvarez-Buylla, J.R.; Pereiro, R.; Gonzalez-Iglesias, H. Dysregulated lipid metabolism in a retinal pigment epithelial cell model and serum of patients with age-related macular degeneration. BMC Biol 2025, 23, 96. [Google Scholar] [CrossRef] [PubMed]
  77. Miller, R.D.; Mondon, I.; Ellis, C.; Muir, A.M.; Turner, S.; Keeling, E.; Wai, H.A.; Chatelet, D.S.; Johnson, D.A.; Tumbarello, D.A.; et al. Whole RNA-Seq Analysis Reveals Longitudinal Proteostasis Network Responses to Photoreceptor Outer Segment Trafficking and Degradation in RPE Cells. Cells 2025, 14. [Google Scholar] [CrossRef] [PubMed]
  78. Zhou, M.; Geathers, J.S.; Grillo, S.L.; Weber, S.R.; Wang, W.; Zhao, Y.; Sundstrom, J.M. Role of Epithelial-Mesenchymal Transition in Retinal Pigment Epithelium Dysfunction. Front Cell Dev Biol 2020, 8, 501. [Google Scholar] [CrossRef]
Figure 1. Prom1 is expressed in both mRPE in situ and cultured cells. Immunohistochemistry of WT mouse RPE flatmounts with Prom1 (green) and ZO-1 (red) antibodies. Confocal images with 40X objective and 40X zoom. (B) WT mouse retina sections were stained for Prom1 (green) and DAPI (blue) at 20X, 40X objectives with 3D orthogonal views, and (C) 63X objective with a 3D-orthogonal view. (D) Western blot analysis showing Prom1 protein levels in WT and Prom1-KO (KO-22 and KO-26.4) cells. (E) Relative Prom1 gene expression in WT, Prom1-KO22, and KO26.4 cells.
Preprints 183601 g001
Figure 2. RNA sequencing counts, normalized, and filtered. The number of raw sequencing counts before normalization, post-normalization, and post-filtering on a Log2+1 scale to visualize features with 0 counts. Counts for each gene were normalized to the sequencing depth for each sample. Genes were filtered out if they were counted fewer than 5 times across at least three samples.
Preprints 183601 g002
Figure 3. Sample-level quality control by principal component analysis (PCA) of WT and Prom1-KO mRPE transcriptomes. (A) A dot plot with each sample shown with PC1 on the x-axis and PC2 on the y-axis. Uncorrected PCA shows that PC1 accounts for the majority of the variance (88%), while PC2 accounts for only 5%. (B) Batch-corrected PCA shows that PC1 accounts for 92% of the variance and PC2 for 4%. (C) Batch-corrected PCA, after removing outliers, shows good separation between conditions, with 96% of the variance in PC1.
Preprints 183601 g003
Figure 4. Differential expression of genes and gene enrichment analysis in WT vs. Prom1-KO mRPE cells. (A)Volcano plot illustrating the top 15 differentially expressed genes (DEGs) in Prom1-KO vs. WT mRPE cells by bulk RNA-sequencing. Significantly upregulated (in red) and down-regulated (in blue) are labeled, n=3/group. Selected notable genes are labeled for reference. (B). The normalized gene enrichment score (NES) of Hallmark gene sets from the Molecular Signature Database shows up- and down-regulated pathways in Prom1-KO vs. WT mRPE cells (n=3/group). Dot size corresponds to the number of genes in each set, while color reflects adjusted p-value with a gradient from blue (less significant) to red (highly significant).
Preprints 183601 g004
Figure 5. Heatmap of top DEGs between Prom1-KO and WT groups. Hierarchical clustering heatmap showing the top 100 DEGs ranked by P-value. Color intensity indicates relative expression levels, with red representing upregulation and blue representing downregulation. The clustering of samples is based on similarity in expression profiles. The color key (top left) shows the scale of normalized expression values.
Preprints 183601 g005
Figure 6. Network analysis of Hallmark gene sets reveals central regulatory pathways in RPE dysfunction. The network representation of hallmark gene sets illustrates the interconnections and relationships among key gene targets implicated in RPE pathology. Each node represents a gene set, and edges denote functional associations or co-regulation. Prominent nodes such as MYC_targets, E2F_targets, G2M_checkpoint, and MTORC1_signaling reflect central hubs in cell-cycle regulation, proliferation, and stress signaling. Node size corresponds to connectivity, with larger nodes indicating higher degrees of interaction.
Preprints 183601 g006
Figure 7. Prom1 deficiency induces EMT-associated gene expression in mRPE cells. A) Volcano plot of RNA-seq data highlighting differentially expressed genes associated with the hallmark EMT pathway. Genes with significant upregulation include Grem1, Serpine 2, and Pcolce2. Downregulated genes are Postn, Abi3bp, and Igfbp2. (B) Validation of IGFBP2 gene expression by qPCR in KO22 and KO26.4 compared to WT (*p<0.05, **p<0.01). (C) POSTN gene expression in KO lines relative to WT (***p<0.001). (D) Grem1 gene expression in KO22 and KO26.4 compared to WT (**p<0.01, ***p<0.001). (E) Western blot analysis showing Grem1 protein levels in WT and Prom1-KO RPE cells, with Actin used as a loading control. Quantification of Grem1 and actin ratio (ns = not significant, *p<0.05).
Preprints 183601 g007
Figure 8. Transcriptomic and molecular validation of dysregulated pathways in Prom1-KO mRPE cells. Multi-panel analysis of gene expression and protein changes in Prom1-KO mRPE cells. (A) Volcano plot of bulk RNA-seq data showing significantly dysregulated genes in Prom1-KO mRPE cells. Pathways of interest are color-coded: general dysregulated genes (red), ROS (red), phagocytosis (blue), UPR (green), and TNF signaling (purple). (B) qPCR validation of PINK1 in KO22 and KO26.4, compared to WT mRPE. (C) Western blot analysis of MerTk protein with actin as a loading control, quantification of MerTK and actin ratio (*p<0.05), and (D) qPCR of MerTK gene, in WT and Prom1- O samples (****p<0.0001. (E-H) qPCR validation of additional dysregulated genes: Slc7a11, Ablim1, OGN, and Aldh1a1 fold changes with statistical significance (*p<0.05, **p<0.01, ***p<0.001, ****p<0.0001).
Preprints 183601 g008
Table 1. Primer sequences for qPCR of mouse genes.
Gene (Mouse) Forward Primer Reverse Primer
Beta-actin CCTGGATAGCAACGTAGATGC ACCTTCTACAATGACCTGGC
Prom1 AACATATGCGCGGGAGAG CAGTTTCTGGGTCCCTTTGA
Pink1 CTGATCGAGGAGAAGCAGGC GCCAATGGCTTGCCCTATGA
Ogn CGCAGCTGGACTCACATGTT TCTTTCTTGGTTGGTAATGATGCT
Mertk TGGATACGTGCATCTGTCCG GAGGAGCAGAGAATGGGCTG
Grem1 CTTCGCAGACCTGGAGACG CAGGTTGTGGTGGGGACTG
Slc7a11 CAGGCATCTTCATCTCCCCC GAGCAGTTCCACCCAGACTC
Ablim1 GAGGCCATCGGTCTGCTTC GAAATGCTTGGTCTGCACCC
Igfbp2 CACAGGTGACACTGCAGACG GAACACAGCCAGCTCCTTCA
Aldh1a1 TGAGCCTGTCACCTGTGTTC CCTTCTTCCACGTGGCAGAT
Postn ATGACAAGGTCCTGGCTCAC CCCGCAGATAGCACCTTGAT
Disclaimer/Publisher’s Note: The statements, opinions and data contained in all publications are solely those of the individual author(s) and contributor(s) and not of MDPI and/or the editor(s). MDPI and/or the editor(s) disclaim responsibility for any injury to people or property resulting from any ideas, methods, instructions or products referred to in the content.
Copyright: This open access article is published under a Creative Commons CC BY 4.0 license, which permit the free download, distribution, and reuse, provided that the author and preprint are cited in any reuse.
Prerpints.org logo

Preprints.org is a free preprint server supported by MDPI in Basel, Switzerland.

Subscribe

Disclaimer

Terms of Use

Privacy Policy

Privacy Settings

© 2025 MDPI (Basel, Switzerland) unless otherwise stated