
Submitted:
03 November 2025
Posted:
04 November 2025
You are already at the latest version
Abstract
Privacy is one of the bottlenecks that hinder the applications (e.g. vehicle navigation) of blockchain-UCAN. A sharded blockchain protects the privacy of vehicle data to a certain extent. However, the unbalanced shard loads leads to low throughput, and the feature extraction in blockchain-UCAN is still poor. In this paper, an optimal image binarisation method OTSU-GK is proposed to enhance image features while reducing the amount of uploaded data to further improve the throughput. Specifically, OTSU-GK employs a Gaussian kernel method, where the parameters are optimized through grid search, to optimize the calculation of the threshold. In addition, we design a Node Load Score-based (NLS) sharding blockchain, which considers the number of historical transactions, transaction types, transaction frequency and other metrics, to balance the sharding loads and further improve the throughput. The experimental results show that OTSU-GK pproximately a 50% improvement in metrics and 83% improvement in throughput compared to other methods.
Keywords:
UCAN
; OTSU
; gaussian kernel
; Sharding blockchain
1. Introduction
UCAN (User-centric Access Network) is a de-cellular network with a universal architecture for unified management and flexible organization of diverse APs on various platforms to provide on-demand and consistent services for users. UCAN is fit for the 6G scenarios to provide user-centric services by integrating UCAN architecture into a wide-area network. For example, the satellite-based base-stations in UCAN provide backhaul services to moving-based stations, e.g. vehicles. Unfortunately, the privacy of vehicle data (e.g., track information) is undermined since all data is placed on one public blockchain, which is accessible to all nodes on the chain. To solve this problem, a sharding blockchain divides the entire blockchain into multiple shards so that nodes can only access the data of the shard they are on. Thus, data privacy is protected to some extent. However, the image feature extraction in navigation system and the throughput problem of the sharding blockchain, in turn, reduces the efficiency of the whole navigation system.
In navigation system, images collected from cameras are embedded images. While there are lots of challenges in the embedded image processing from increasing resolution, increasing frame rates, and the need to operate at low power. As a fundamental technique, image binarization simplifies images to two colors, serving to reduce data complexity, highlight image features, and enhance processing efficiency. Currently, researchers have proposed a variety of binarization methods.
However, these methods fails in the scenario of blockchain-UCAN due to the computational limitations and resource constraints. Therefore, a new UCAN framework is needed to satisfy the requirements of both feature extraction and sharding blockchain. In this paper, we propose a OTSU-UCAN (ref. Figure 1) by combining two novel OTSU-GK and NLS-chain techniques. Specifically, color figures collected from the vehicles is binaries by OTSU-GK, where a Gaussian Kernel is used to enhance the feature extraction. Then the grey images are uploaded to APs (Access Points) to save storage space. On the other hand, AP data are evaluated by Node Load Score including their historical transactions, transaction types and transaction frequency. Finally, the nodes are assigned to different shards according to the targets. The main contributions of this paper are summarized as follows:
- OTSU-GK: The OTSU-GK is a new adaptive thresholding approach, which integrates a Gaussian kernel. The parameters of Gaussian kernel are optimized through grid search to enhance threshold calculation. OTSU-GK provides a new solution in the field of image binarization.
- Node Load Score-based (NLS) sharding blockchain: We propose a blockchain segmentation method based on node load scoring to segment blockchain nodes by predicting the number of transactions of each node in the next epoch and calculating the corresponding transaction load scoring, which reflects the node’s transaction load, with the aim of achieving load balancing between segments.
- Significant Performance Improvement: Compared to the traditional OTSU method, the OTSU-GK shows approximately 50% improvement in SSIM (Structural Similarity), RMSE (root mean square error), and IL (information loss). It indicates that OTSU-GK performs better in image processing, thereby supporting the advancement of embedded image processing.
- Effectiveness of Parameter Optimization: Ablation experiments confirm the effectiveness of parameter optimization through grid search. When compared to methods with non-optimized parameters, OTSU-GK demonstrates a 14.3% increase in the SSIM metric and a 13% reduction in the IL metric on the KITTI dataset, which indicates that the process of optimizing parameters significantly enhances the performance of the OTSU-GK.
2. Related Work
2.1. Image Binarization
Currently, image binarization methods include fixed threshold methods, adaptive threshold methods, and deep learning approaches. The fixed threshold method [3] involves setting a fixed threshold to categorize image pixels into foreground and background. This method relies on a fixed threshold for binarization, which requires manual intervention for threshold selection and exhibits limited adaptability.
Adaptive thresholding methods are proposed to dynamically calculate the threshold by considering local image characteristics. Yang et al. [4] optimized the OTSU method by utilizing the relationship between pixel grayscale values and cumulative pixel count changes, which further enhanced the performance of the OTSU method. Zhang et al. [5] proposed a new adaptive threshold segmentation method based on image sharpness evaluation, which aims to accurately find a reasonable threshold for improving image segmentation performance. Lin et al. [6] introduced an improved decision-based adaptive threshold median filter (IDBATMF) for denoising salt-and-pepper noise in fingerprint images. Pan et al. [7] proposed a method for single image dehazing and segmentation based on dark channel prior (DCP) and adaptive thresholding, which improved target recognition efficiency. Rehman et al. [8] developed a new image enhancement method by combining adaptive thresholding methods.
Kim et al. [9] applied Gaussian weighting to Transformers, which was intended to enhance their performance. Chen et al. [10] proposed a Gaussian mixture model, which was designed to fully exploit point cloud information. Suryowati et al. [11] employed fixed and adaptive Gaussian kernel weighting functions for geographic weighted regression modeling, which was used to analyze maternal mortality rates. Basteri & Trevisan [12] initialized neural networks with random Gaussian parameters, which aimed to investigate how the sizes of hidden and output layers affect the Gaussian behavior of the network.
2.2. Optimization Methods of Hyperparameter
Hyperparameter optimization holds significant importance in the field of computer image processing, with its primary aim being the enhancement of model performance through the adjustment of model hyperparameters. Indeed, the configuration of hyperparameters directly influences the performance of the model [13], making it an essential step in the training process. Common methods for hyperparameter optimization include Bayesian optimization, genetic algorithms and grid search. In short, Bayesian optimization [14] employs probabilistic models to guide the selection of hyperparameters, continuously updating the model to identify the optimal hyperparameters, which demonstrates notable efficiency and accuracy. Conversely, genetic algorithms [15] simulate the process of natural selection, incorporating operations such as crossover and mutation to interactively improve parameter configurations, thereby achieving hyperparameter optimization. Each of these methods has distinct characteristics, which can be chosen based on specific needs to attain the ultimate model performance.
Furthermore, grid search provides significant advantages due to its systematic and comprehensive nature, allowing it to explore all possible parameter combinations and thereby ensure the identification of a global optimum. Consequently, for embedded image processing, employing grid search to determine the optimal parameters for fitting Gaussian kernel parameters in the training set represents a highly effective approach.
2.3. Sharding Blockchain
Elastico [16] is proposed to divide the blockchain into different shards, each with an independent consensus mechanism to process part of the transactions separately. However, since Elastico adopts the PBFT (Practical Byzantine Fault Tolerance) consensus mechanism, it suffers from the problem of slow transaction validation when processing transactions. Omniledger [17] adopts the ByzCoin consensus mechanism as an improved version of PBFT, but still faces the problem of performance limitation when processing large-scale transactions. Pyramid [18] proposes a hierarchical sharding blockchain system that can complete the verification of cross-shard transactions within one round of consensus, which improves the speed of the system in processing large-scale transactions. However, Pyramid uses random sharding and does not consider load balancing among nodes. LB-Chain [19] proposes a sharding method with shard load balancing, which migrates accounts from a high-load shard to a low-load shard through an account migration algorithm; however, LB-Chain does not consider the security of the system.
3. Method
3.1. Framework of OTSU-GK
The framework of OTSU-GK is illustrated in Figure 1, which consists of three core modules: Grid Search, Cut Images, and Gaussian Kernel Average.
- Grid Search: We employ grid search for hyperparameter tuning, specifically to optimize the two hyperparameters of the Gaussian kernel: sigma () and size, which determine the number of cut images (see Section 3.2 for details).
- Cut Images: We select original images from the dataset and perform proportional slicing from left to right. OTSU thresholding is then applied to each sliced image, resulting in a corresponding threshold matrix .(see Section 3.3 for details).
- Gaussian Kernel Average: The Gaussian kernel performs matrix multiplication with the threshold matrices generated from the cut images. The resulting matrix is summed to determine the final threshold value for the original image, which is then used for binarization (see Section 3.4 for details).
3.2. Grid Search
Grid search ensures the identification of the optimal model configuration by systematically exploring all possible hyperparameter combinations. In this work, it is used to optimize the Gaussian kernel parameters: sigma () and size.
The algorithm defines a set of predefined ranges and steps for each hyperparameter, evaluates each combination using a scoring function, and selects the one with the best performance. This exhaustive search guarantees that the most suitable parameter set is identified within the given range.
The pseudocode of the grid search algorithm for OTSU-GK is presented in Algorithm 1.
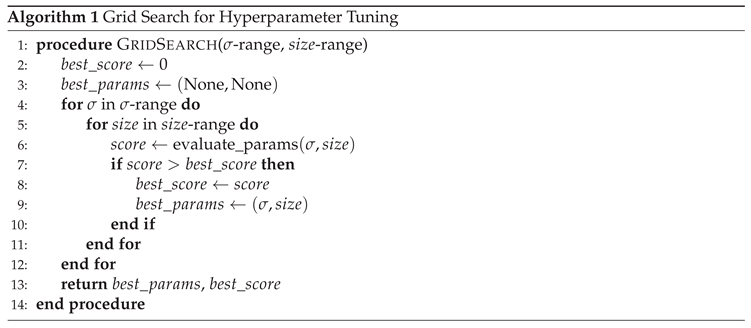
During the experiment, we randomly select 300 images from the dataset for testing, and 20% of them are used for parameter evaluation. The range of sigma is set from 0.5 to 6.0, divided into 10 equal intervals. The size of the Gaussian kernel ranges from 3 to 7, considering only odd values (i.e., 3, 5, 7) to maintain symmetry.
In the evaluate_params function, we normalize the evaluation metrics including SSIM, MAE, and Information Loss (IL). For metrics where higher values indicate better performance (e.g., SSIM), we directly aggregate their scores. For those where lower values are better (e.g., MAE, IL), we subtract their normalized scores. The final score is flexibly adjusted based on experimental objectives to ensure optimal Gaussian kernel parameter selection.
3.3. Cut-Image Generation
Once the Gaussian-kernel hyper-parameters have been obtained by grid search (Algorithm 1), OTSU-GK segments the original image into equal-width (or equal-height) tiles starting from the left-most column. Each tile is processed independently by classical Otsu thresholding, yielding one threshold per tile. The resulting thresholds are then laid out row-wise to form a threshold matrix that will later be convolved with the Gaussian kernel.
Figure 2 illustrates the cutting procedure for ; the original image is partitioned into nine non-overlapping sub-images, and the corresponding threshold matrix is
3.4. Gaussian Kernel Average
3.4.1. Cut images
After obtaining the Gaussian kernel hyperparameters () through grid search, the OTSU-GK segments the original image based on the value of . Specifically, the image is segmented with equal-width or equal-height cuts starting from the left side of the original image, resulting in cut images. Subsequently, each cut image is processed individually using the OTSU to generate thresholds. These thresholds are then arranged sequentially to form a matrix of thresholds. For example, with , the process of generating cut images is illustrated in Figure 3.
3.4.2. Gaussian kernel average
Gaussian weighted average is a method that assigns weights to data points based on their distance from a central point, with closer points receiving higher weights. This technique is commonly used in signal processing, image processing, and data analysis to smooth out noise and emphasize important features. The Gaussian weighted average algorithm first defines a Gaussian function of the form. The formula for a Gaussian function is as follows, where represents the mean of the Gaussian function and represents the standard deviation, which controls the center point of the function and the width of the function:
When using the Gaussian function, it is necessary to input the parameters and into the function. To better understand the distribution of the Gaussian kernel, we set different values for and , and illustrated the characteristics of the Gaussian kernel through heatmaps, as shown in Figure 3
In the OTSU-GK, the threshold matrix generated from Cut images is combined with the Gaussian kernel matrix, which is used for matrix multiplication. This operation, which performs the smoothing and adjustment of the threshold values, ultimately yields the threshold of the original image.
4. NLS-Chain: NLS Sharding Blockchain
We construct a high-TPS sharding blockchain system named NLS-Chain to address the low throughput of traditional sharded blockchain systems. NLS-Chain predicts the number of transactions for each node in the upcoming epoch and computes a Node Load Score (NLS) based on this prediction. By sharding nodes according to their NLS, the system achieves inter-shard load balance and significantly improves overall TPS. The framework of NLS-Chain is illustrated in Figure 4.
4.1. Prediction of the Number of Node Transactions
In the transaction prediction phase, we construct a GRU-based sequence prediction method [20] to forecast the number of transactions for each node in the next epoch. The prediction result is used as the basis for calculating the NLS. The model consists of one input layer, one hidden layer, and one output layer. The hidden layer contains five sequentially connected GRU layers for processing time-series data, where each unit controls the flow of information through a gating mechanism. The output layer is a fully connected layer that outputs the final prediction.
We first convert the raw transaction data into sequence format using a create_sequence function. This function splits the data into fixed-length input sequences and corresponding target values. The process is controlled by a loop to avoid out-of-bounds access, and the resulting sequences are stored in lists for model input.
The converted data is then fed into the GRU model, which is trained using the Adam optimizer. Adam calculates both the first-order moment (mean) and the second-order moment (uncentered variance) of the gradients, and applies bias correction to prevent small initial updates. After training, the model is evaluated using Mean Squared Error (MSE), which measures the average squared difference between predicted and actual values. A lower MSE indicates better model fitting. We train the model for 30 epochs and validate its performance on both training and validation datasets.
4.2. Sharding Method Based on NLS
We propose a Node Load Score (NLS)-based sharding method to achieve transaction load balancing across shards. At the beginning of each epoch, nodes are reassigned to shards based on their NLS. A higher NLS indicates stronger transaction processing capability and better resource configuration, while a lower NLS suggests limited capacity. Our method considers both the NLS and its volatility to determine the optimal shard assignment for each node.
4.2.1. NLS Calculation
We use a weighted scoring method to calculate the NLS for each node. The score is derived from three main factors: predicted transaction volume, node stability, and historical performance. The formula is given in Equation (2):
where:
- : Quantized predicted transaction volume (0–1), output from the GRU model.
- : Quantized node stability, including online time, response time, sync status, error rate, and resource availability.
- : Quantized historical performance, including success rate, transaction efficiency, verification accuracy, participation, and violation records.
- : Weight coefficients balancing the contribution of each factor.
Each factor is computed as a weighted average of its sub-indicators, as shown in Equation (3):
where is the normalized value of the k-th sub-indicator and is its corresponding weight. All sub-indicators are normalized to the range [0, 1] to ensure consistency and comparability.
4.3. NLS-Chain: Load-Balanced Sharding via NLS
To guarantee high throughput and low latency across epochs, nodes are periodically re-sharded according to their freshly computed Node Load Score (NLS). The sharding problem is cast as the minimisation of the sum of squared deviations between each shard’s aggregated NLS and the global average NLS. The quadratic term penalises large imbalances more severely than a linear criterion, thus encouraging tight load distribution.
4.3.1. Optimisation Objective
Let
- be the set of shards,
- be the set of nodes,
- indicate whether node i is assigned to shard j at epoch t.
The total NLS of shard j is
and the ideal average NLS per shard is
The optimisation target for epoch t reads
Equation (6) is a convex quadratic assignment problem; an exact solution is NP-hard for large N. NLS-Chain therefore employs a fast greedy heuristic:
- sort nodes by descending ;
- round-robin assignment to obtain equal-sized shards;
- iteratively migrate the node that yields the largest marginal reduction in (6) until no improvement is possible.
The heuristic converges within 5–10 iterations and scales linearly with N.
4.3.2. Throughput Evaluation
5. Experiment
We conduct experiments on three public datasets: Set12, KITTI, and DOTA [21]. Set12 is a standard benchmark for image denoising and restoration; KITTI is widely used in autonomous driving and robotics; DOTA provides richly annotated aerial images suitable for binarisation tasks. Five metrics are adopted to quantify similarity and discrepancy: SSIM, RMSE, MAE, AER, and IL.
5.1. Results of OTSU-GK
To justify the optimisation of OTSU in OTSU-UCAN, we first compare three adaptive thresholding strategies on Set12. Table 2 shows that plain OTSU obtains the highest SSIM and the lowest RMSE, MAE, AER, and IL; it is therefore selected as the baseline for subsequent Gaussian-kernel enhancement.
We next randomly sample 300 images from KITTI and DOTA to evaluate OTSU-GK. KITTI: SSIM improves by 74.3%, RMSE/MAE/AER by 58.7%, and IL is reduced by 70.3% (Figure 5 and Figure 6). DOTA: SSIM improves by 61.3%, RMSE/MAE/AER by 43.3%, and IL is reduced by 52.3% (Figure 7 and Figure 8). The consistent gains demonstrate that the Gaussian-kernel average preserves structural details while suppressing noise.
5.2. Ablation Study
We further verify the contribution of each component on KITTI. OTSU-GK denotes the basic Gaussian-kernel enhancement; OTSU-GK* denotes the version whose kernel parameters (, size) are optimised by grid search. From Table 3, grid search brings an extra 14.3% SSIM boost and 13% IL reduction, confirming the necessity of systematic hyper-parameter tuning.
5.3. Throughput of NLS-Chain
We implement a prototype of NLS-Chain in Python 3.9 under PyCharm. The simulation comprises 500 geographically distributed nodes that communicate via the Gossip protocol; transaction generation and block validation are driven by SimPy. The test-bed is an Intel i7-8550U machine with 8 GB RAM; inter-node bandwidth is set to 35 Mbps with full-mesh connectivity.
We measure steady-state TPS over 50 epochs while varying the number of shards . Figure 9 reports both average TPS and 95th-percentile TPS (after discarding the top/bottom 5% outliers). NLS-Chain consistently surpasses the two baselines:
- Random: nodes and transactions are randomly assigned to shards.
- LB-Chain: predicts node traffic via LSTM and re-shards through account migration.
As summarised in Table 4, NLS-Chain delivers up to 83% higher average TPS than LB-Chain when , while maintaining linear scalability with the number of shards.
6. Conclusions
We present OTSU-UCAN, a unified framework for secure and efficient vehicle navigation in 6G satellite-terrestrial networks. OTSU-GK enhances embedded image binarisation via a Gaussian-kernel weighted threshold, while NLS-Chain guarantees privacy-preserving, load-balanced sharding with up to 83% TPS gain. Future work will explore adaptive kernel selection and dynamic re-sharding intervals to further boost performance.
References
- Chen, S., Chen, L., Hu, B., Sun, S., Wang, Y., Wang, H. W., & Gao, W. (2024). User-centric access network (UCAN) for 6G: Motivation, concept, challenges and key technologies. IEEE Wireless Communications, 22, 146–153.
- Bailey, D. G. (2023). Design for Embedded Image Processing on FPGAs. John Wiley & Sons.
- Miller, J. (1991). Threshold variability in subliminal perception experiments: Fixed threshold estimates reduce power to detect subliminal effects. Journal of Experimental Psychology: Human Perception and Performance, 17(4), 841.
- Yang, P., Song, W., Zhao, X., Zheng, R., & Qingge, L. (2020). An improved Otsu threshold segmentation algorithm. International Journal of Computational Science and Engineering, 22, 146–153.
- Zhang, T., Tian, Y., Wang, Z., & Wang, Z.-d. (2020). Adaptive threshold image segmentation based on definition evaluation. Journal of Northeastern University (Natural Science), 41(9), 1231.
- Lin, X., Tian, L., Du, Q., & Qin, C. (2022). Improved decision based adaptive threshold median filter for fingerprint image salt and pepper noise denoising. In 2022 21st International Symposium on Communications and Information Technologies (ISCIT) (pp. 233–237). IEEE.
- Pan, Y., Chen, Z., Li, X., & He, W. (2021). Single-image dehazing via dark channel prior and adaptive threshold. International Journal of Image and Graphics, 21(2), 2150053.
- Rehman, S. A., Jeffrey, Z., Sun, Y., & Simpson, O. (2024). Image enhancement using modified Laplacian filter, CLAHE and adaptive thresholding. In 2024 International Conference on Intelligent Systems and Computer Vision (ISCV) (pp. 1–7). IEEE.
- Kim, J., El-Khamy, M., & Lee, J. (2020). T-GSA: Transformer with Gaussian-weighted self-attention for speech enhancement. In ICASSP 2020-2020 IEEE International Conference on Acoustics, Speech and Signal Processing (ICASSP) (pp. 6649–6653). IEEE.
- Chen, H., Chen, B., Zhao, Z., & Song, B. (2023). Point cloud registration based on learning Gaussian mixture models with global-weighted local representations. IEEE Geoscience and Remote Sensing Letters, 20, 1–5.
- Suryowati, K., Ranggo, M. O., Bekti, R. D., Sutanta, E., & Riswanto, E. (2021). Geographically weighted regression modeling using fixed and adaptive Gaussian kernel weighting functions in the analysis of maternal mortality (MMR). In 2021 3rd International Conference on Electronics Representation and Algorithm (ICERA) (pp. 115–120). IEEE.
- Basteri, A., & Trevisan, D. (2024). Quantitative Gaussian approximation of randomly initialized deep neural networks. Machine Learning, 1–21.
- Yang, L., & Shami, A. (2020). On hyperparameter optimization of machine learning algorithms: Theory and practice. Neurocomputing, 415, 295–316.
- Turner, R., Eriksson, D., McCourt, M., Kiili, J., Laaksonen, E., Xu, Z., & Guyon, I. (2021). Bayesian optimization is superior to random search for machine learning hyperparameter tuning: Analysis of the black-box optimization challenge 2020. In NeurIPS 2020 Competition and Demonstration Track (pp. 3–26). PMLR.
- Alhijawi, B., & Awajan, A. (2024). Genetic algorithms: Theory, genetic operators, solutions, and applications. Evolutionary Intelligence, 17, 1245–1256.
- Luu, L., Narayanan, V., Zheng, C., Baweja, K., & Saxena, P. (2016). A secure sharding protocol for open blockchains. In the 2016 ACM SIGSAC Conference.
- Kokoris-Kogias, E., Jovanovic, P., Gasser, L., Gailly, N., Syta, E., & Ford, B. (2018). OmniLedger: A secure, scale-out, decentralized ledger via sharding. In 2018 IEEE Symposium on Security and Privacy (SP) (pp. 583–598). IEEE.
- Hong, Z., Guo, S., Li, P., & Chen, W. (2021). Pyramid: A layered sharding blockchain system. In 40th IEEE Conference on Computer Communications (INFOCOM) (pp. 1–10). IEEE.
- Li, M., Wang, W., & Zhang, J. (2023). LB-chain: Load-balanced and low-latency blockchain sharding via account migration. IEEE Transactions on Parallel and Distributed Systems, 34, 2797–2810.
- Dey, R., & Salem, F. M. (2017). Gate-variants of gated recurrent unit (GRU) neural networks. In IEEE 60th International Midwest Symposium on Circuits and Systems (MWSCAS) (pp. 1597–1600). IEEE.
- Xia, G. S., Bai, X., Ding, J., Zhu, Z., Belongie, S., Luo, J., Datcu, M., Pelillo, M., & Zhang, L. (2018). DOTA: A large-scale dataset for object detection in aerial images. In IEEE.
Figure 1.
Framework of the proposed OTSU-GK method.

Figure 2.
Cut-image generation when .
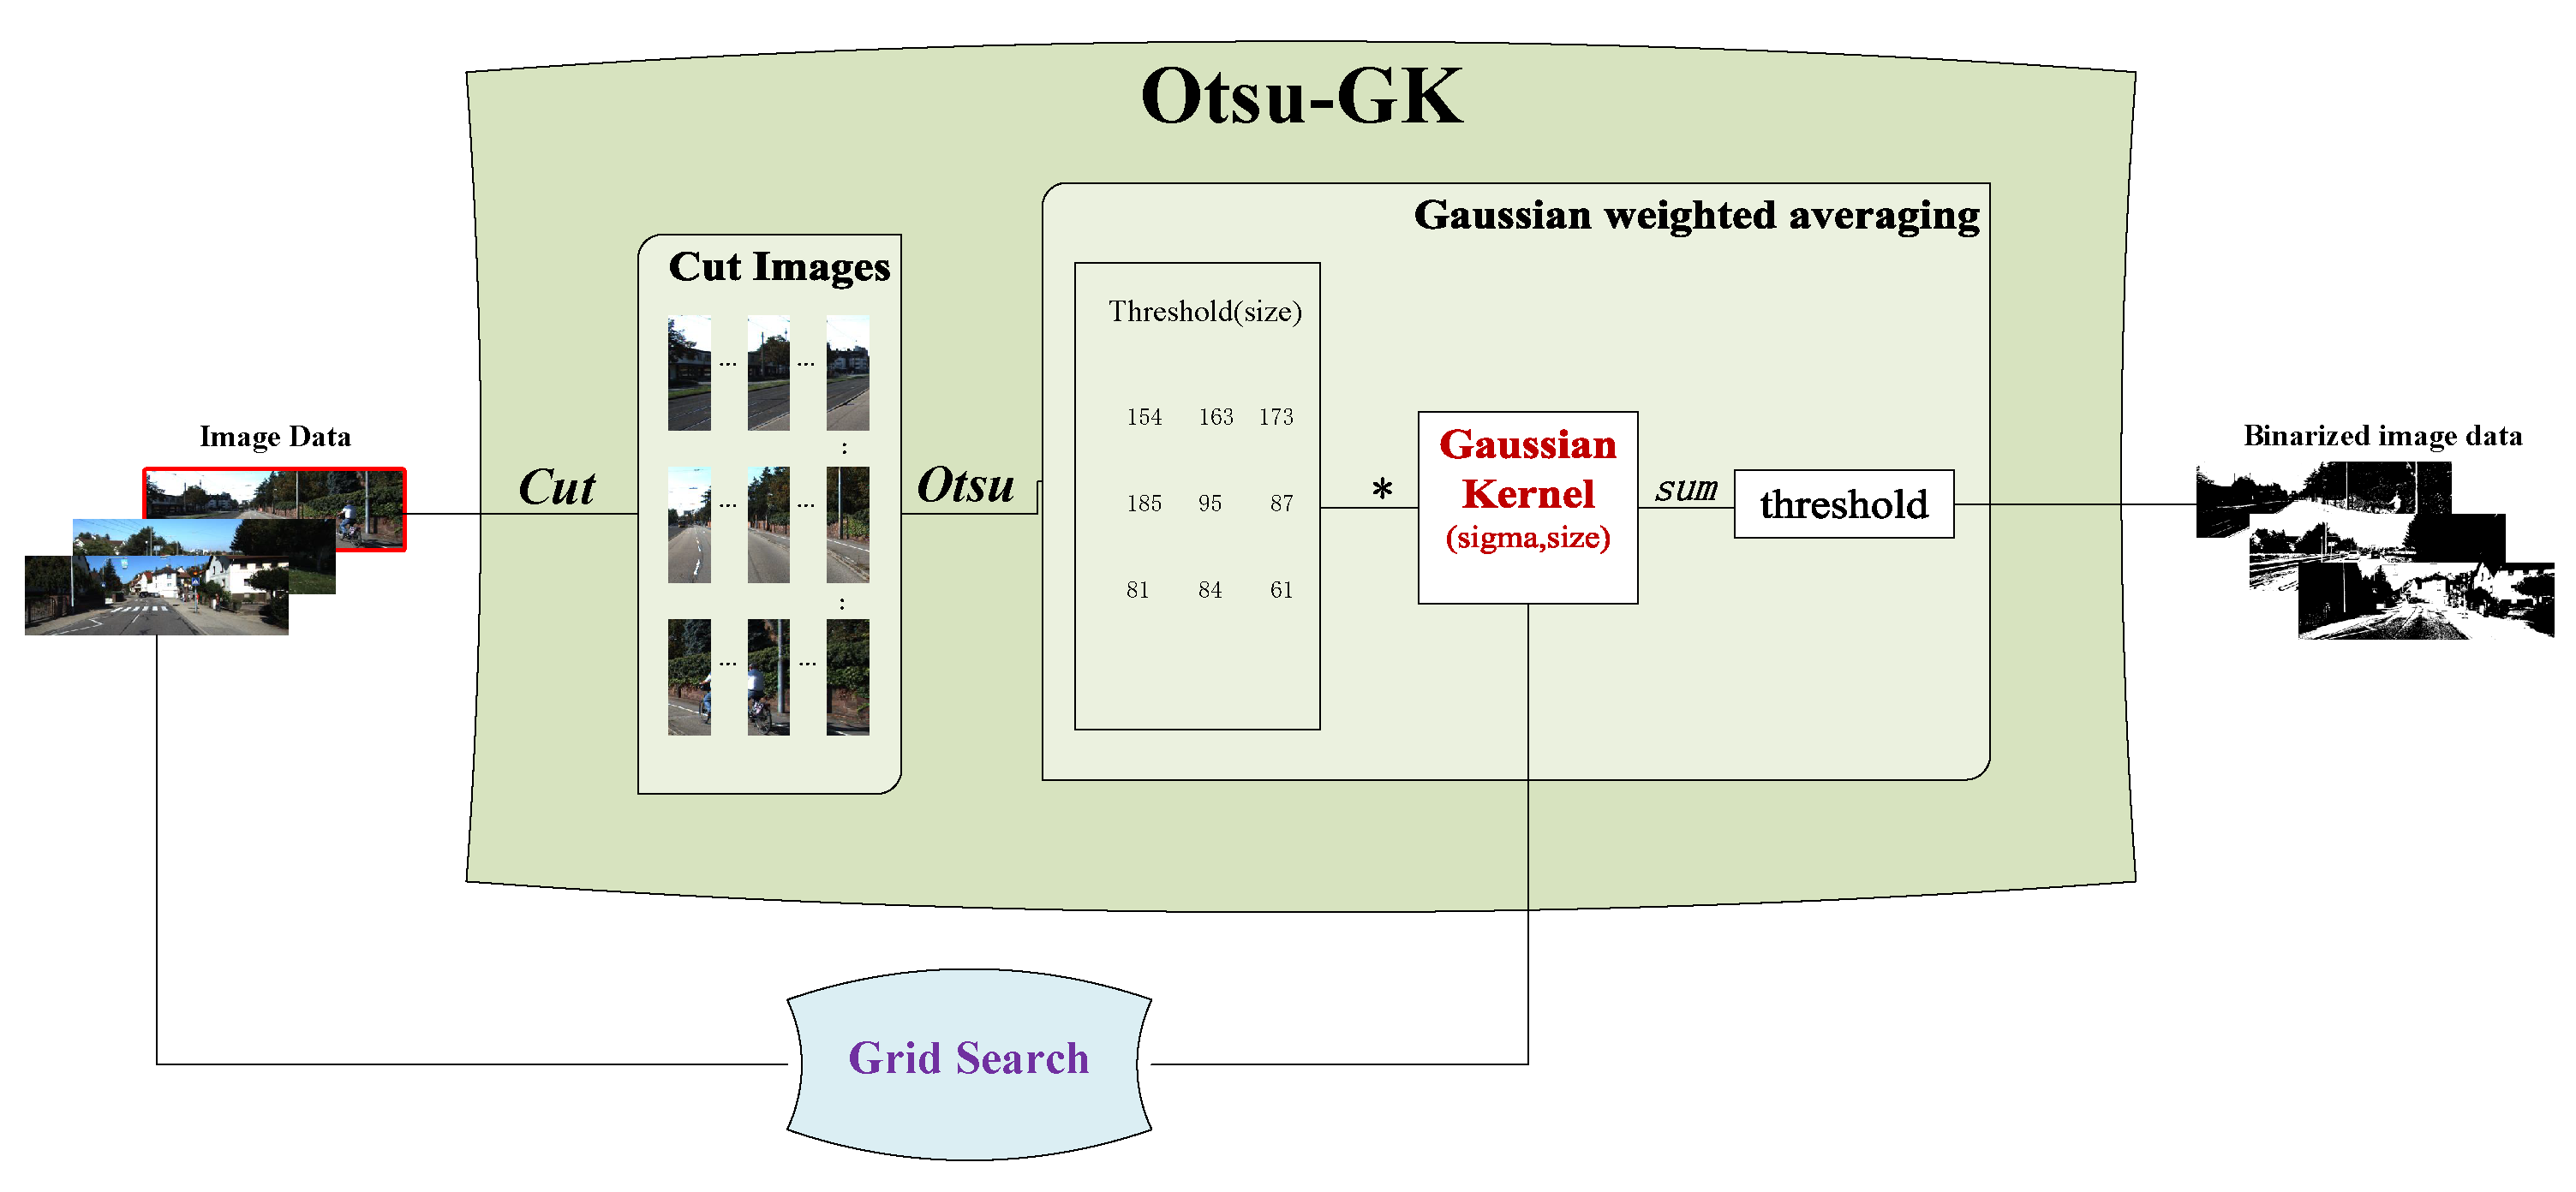
Figure 3.
Relative improvement on DOTA.
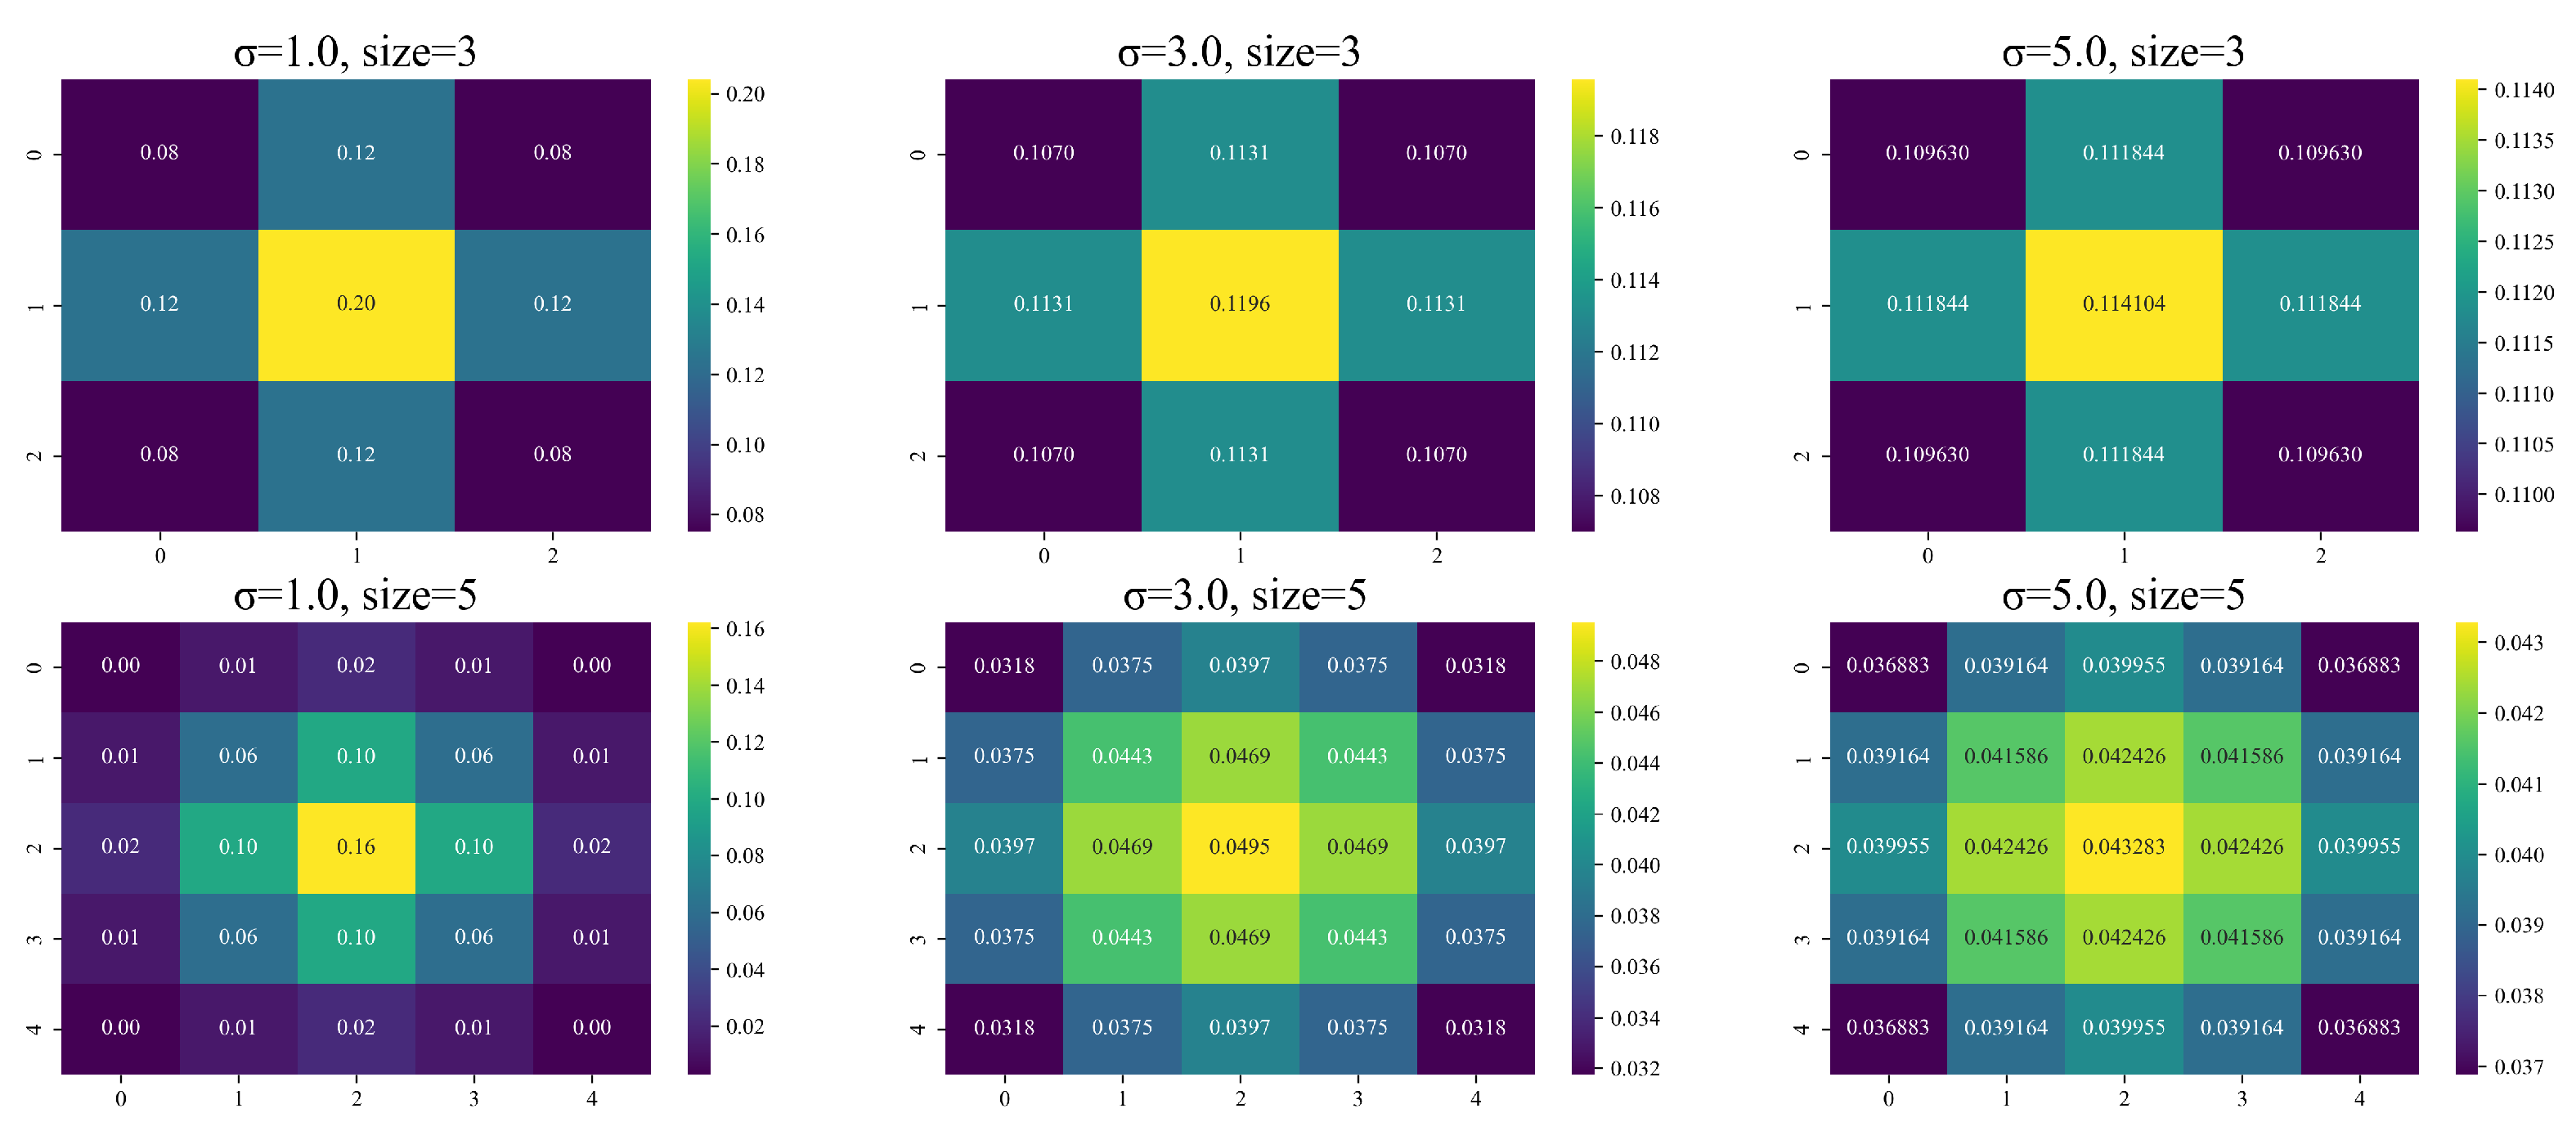
Figure 4.
Process of generating cut images.
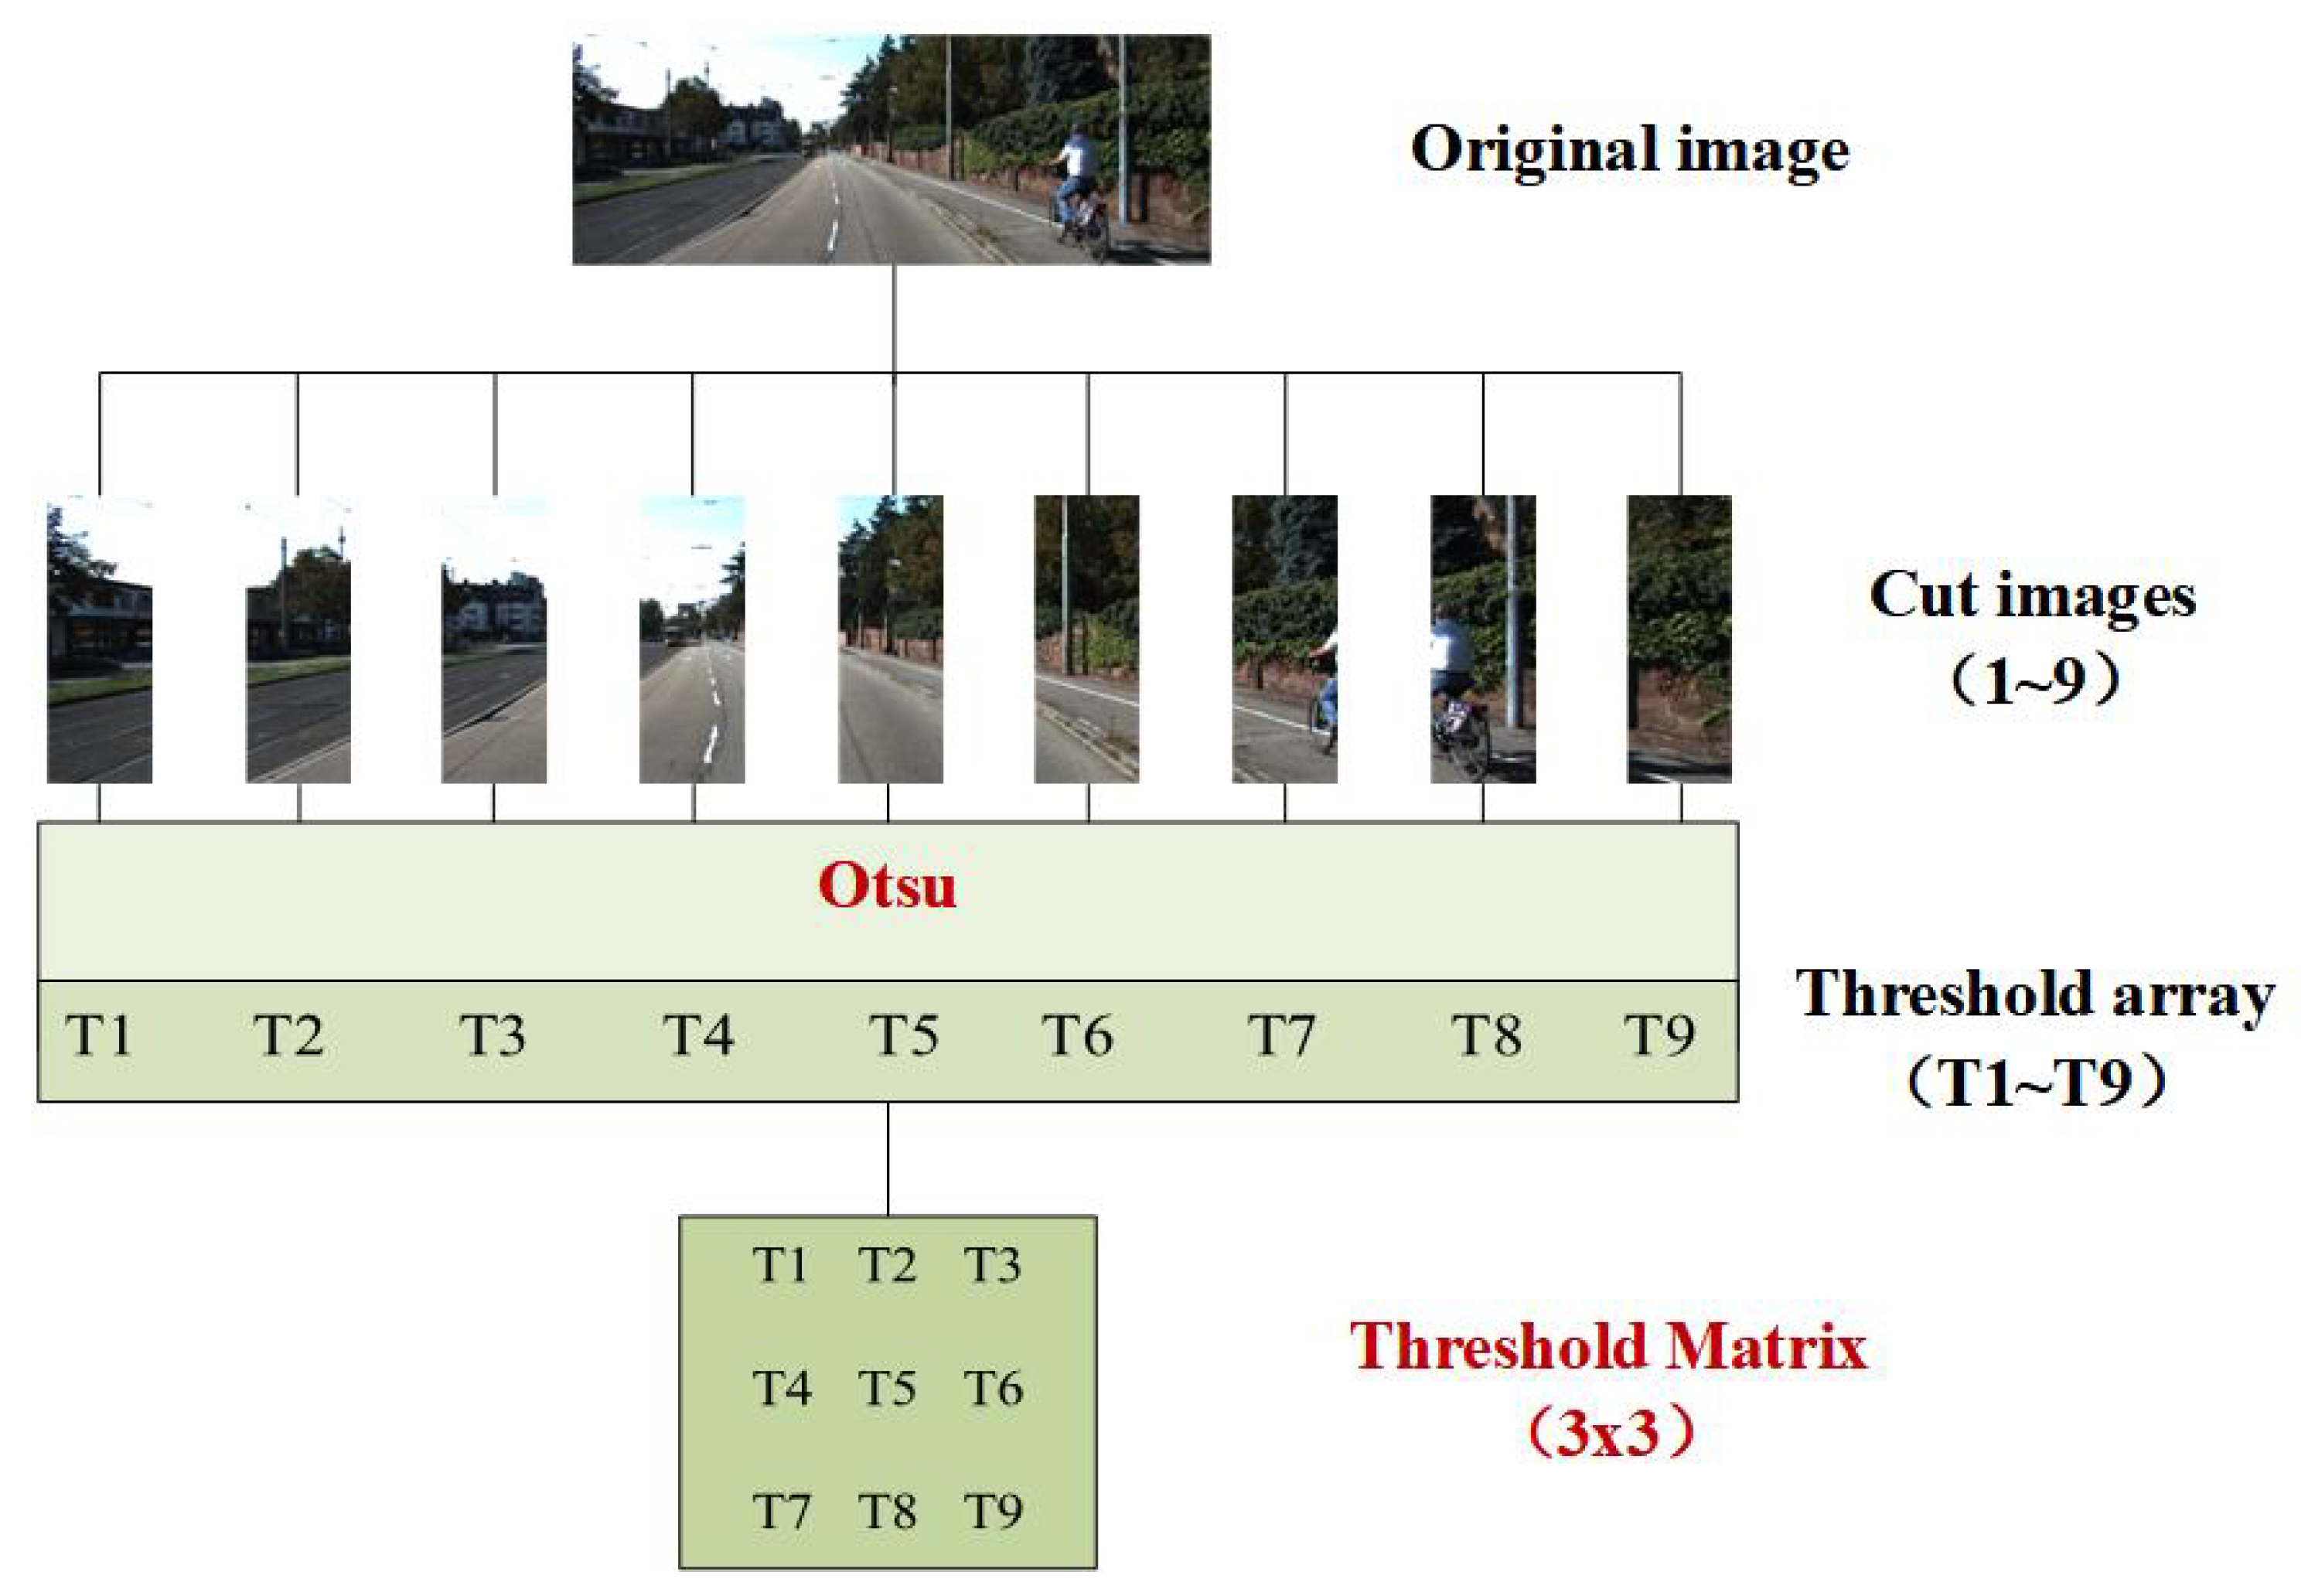
Figure 5.
Heatmap of Gaussian Kernel.
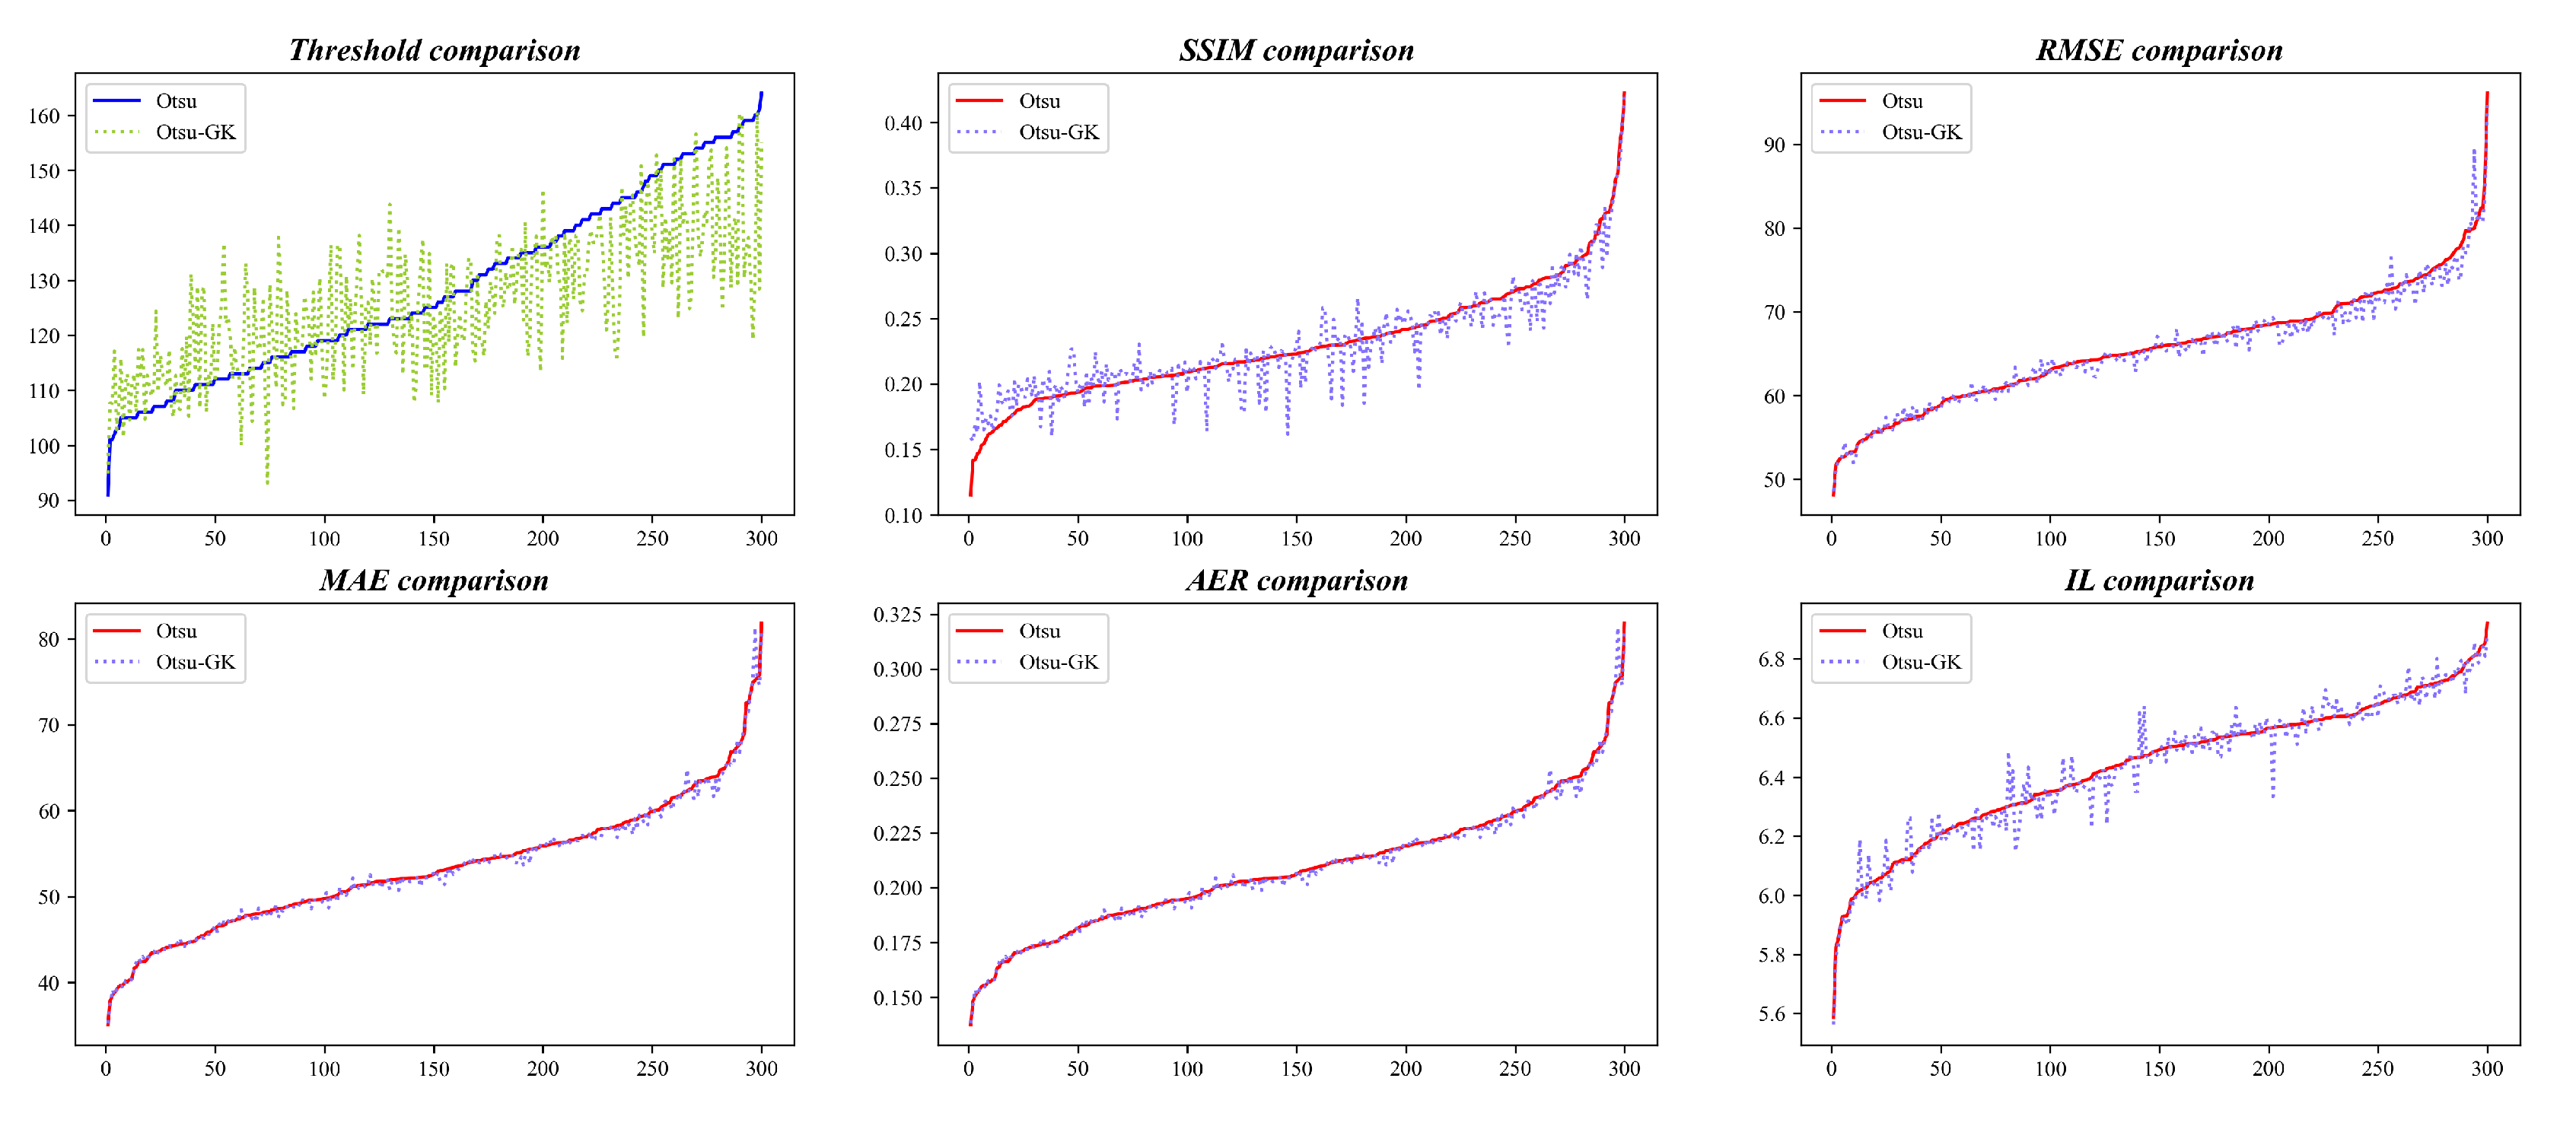
Figure 6.
Relative improvement on KITTI.
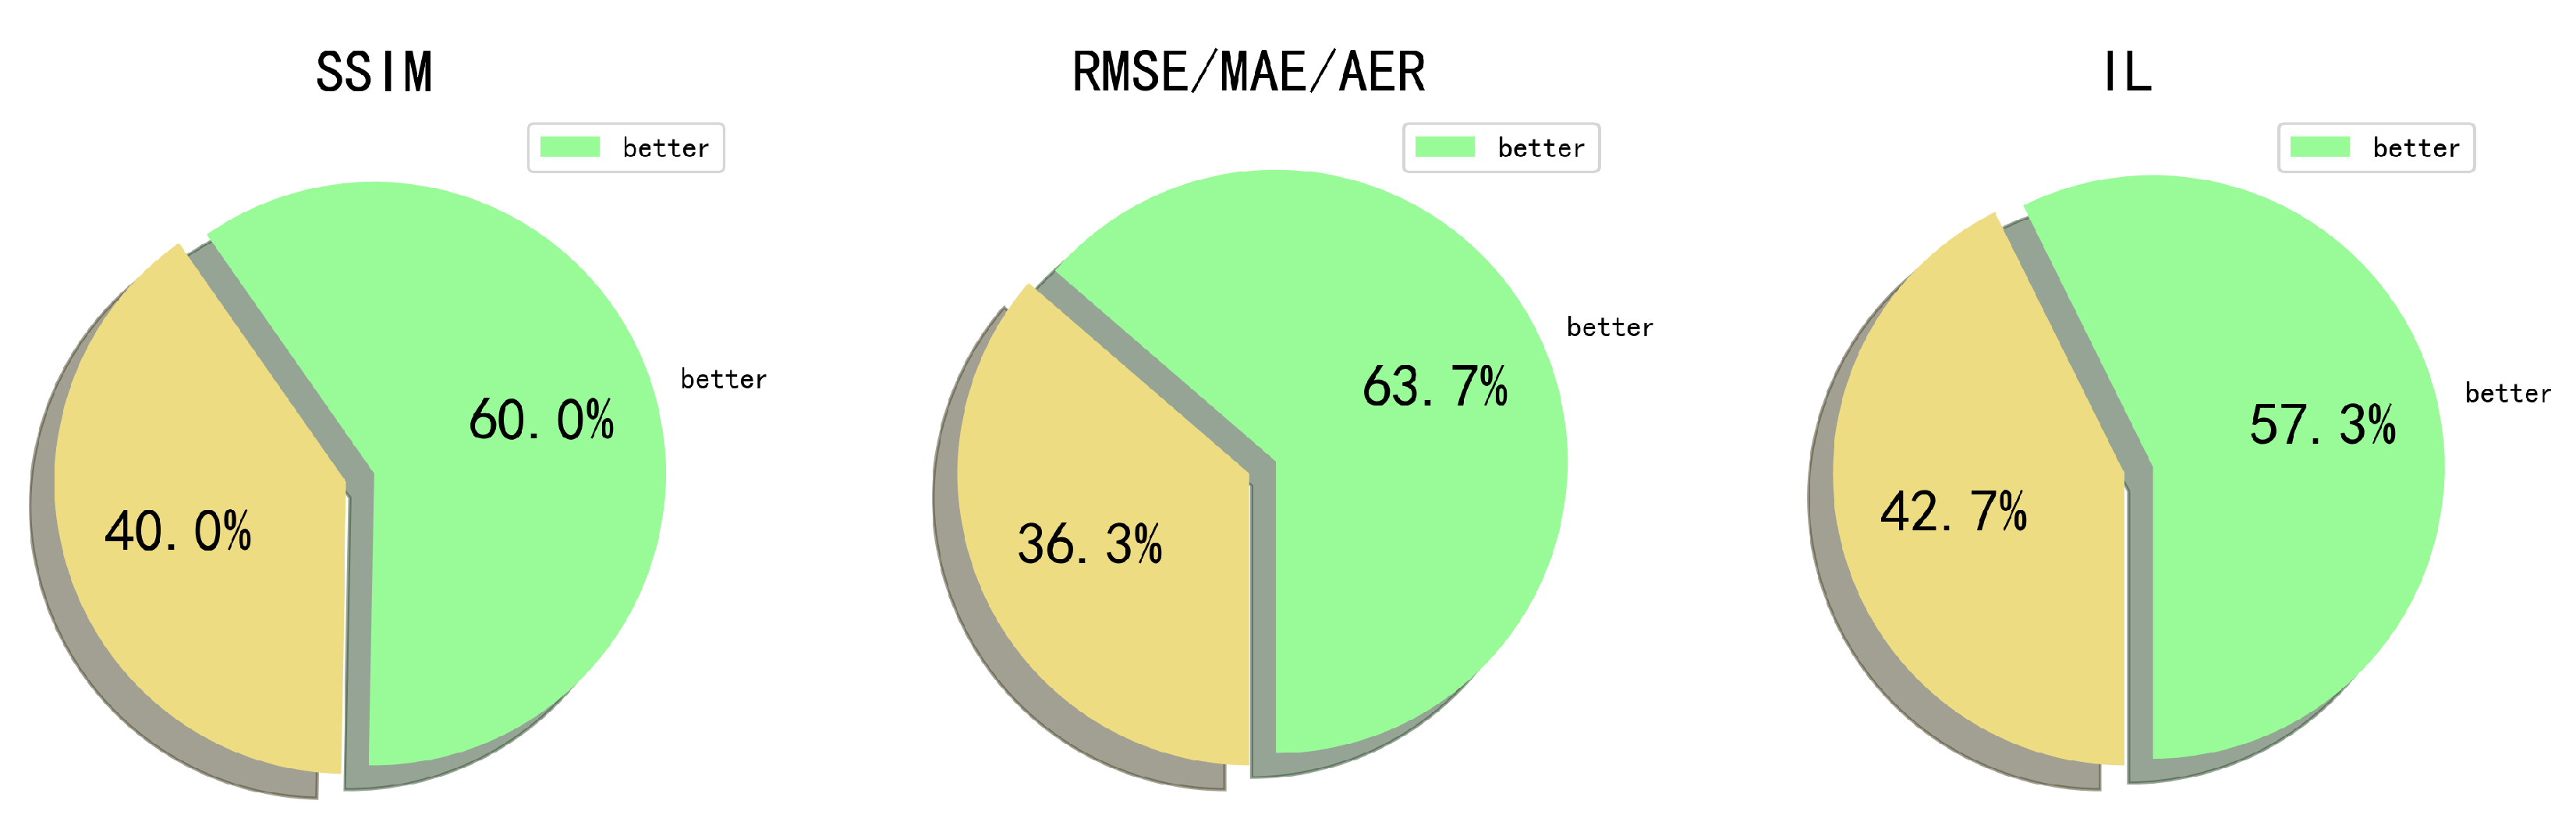
Figure 7.
Metric trends on DOTA.
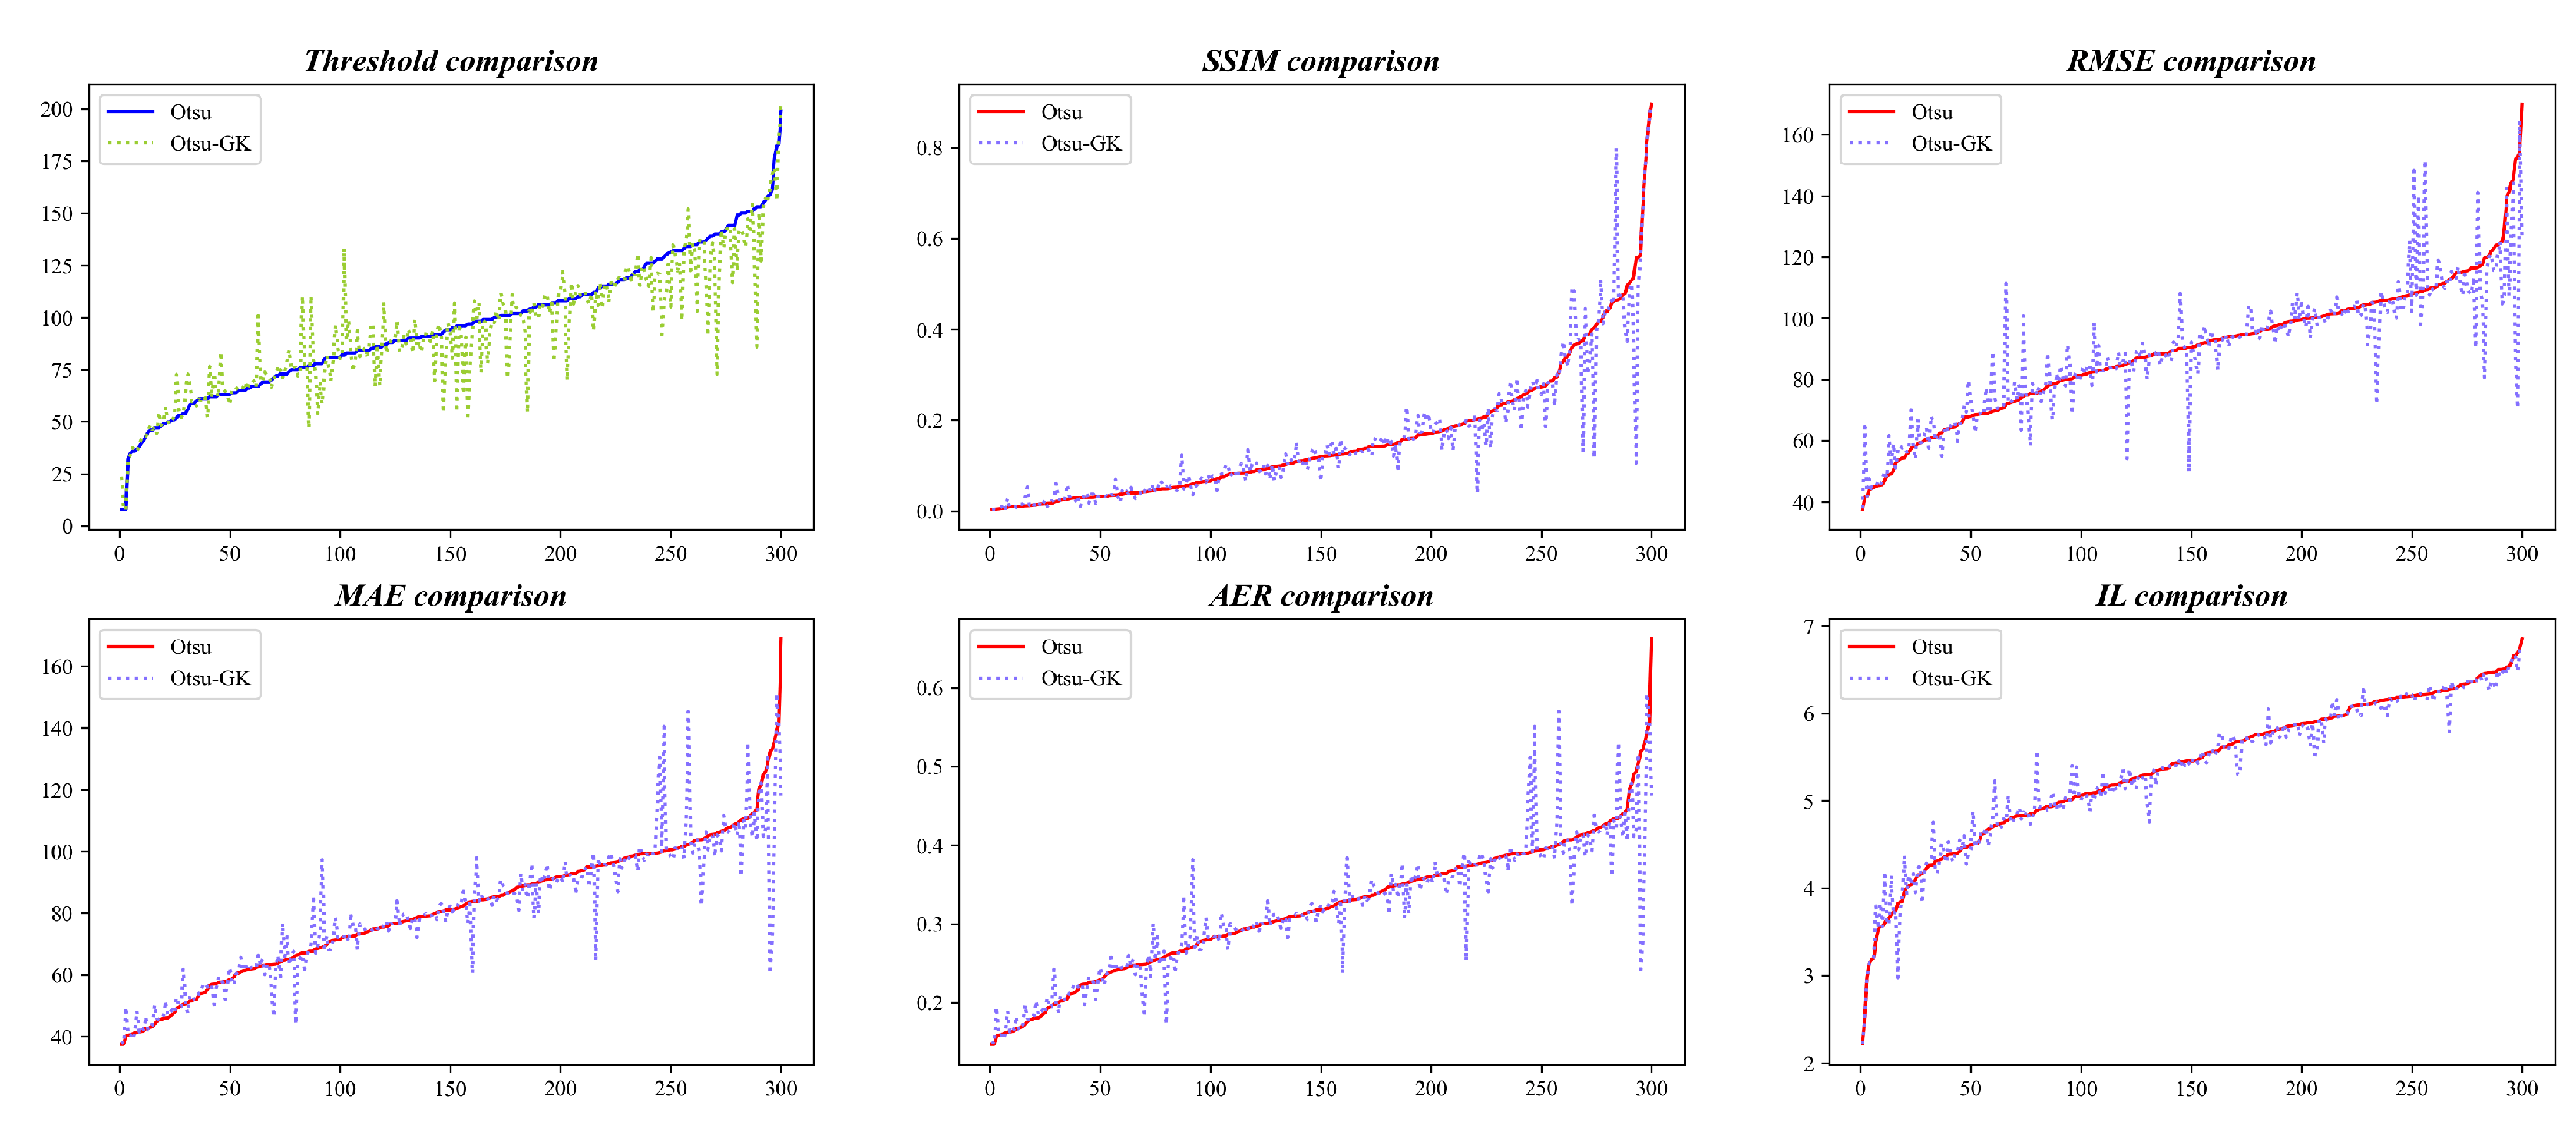
Figure 8.
Relative improvement on DOTA.
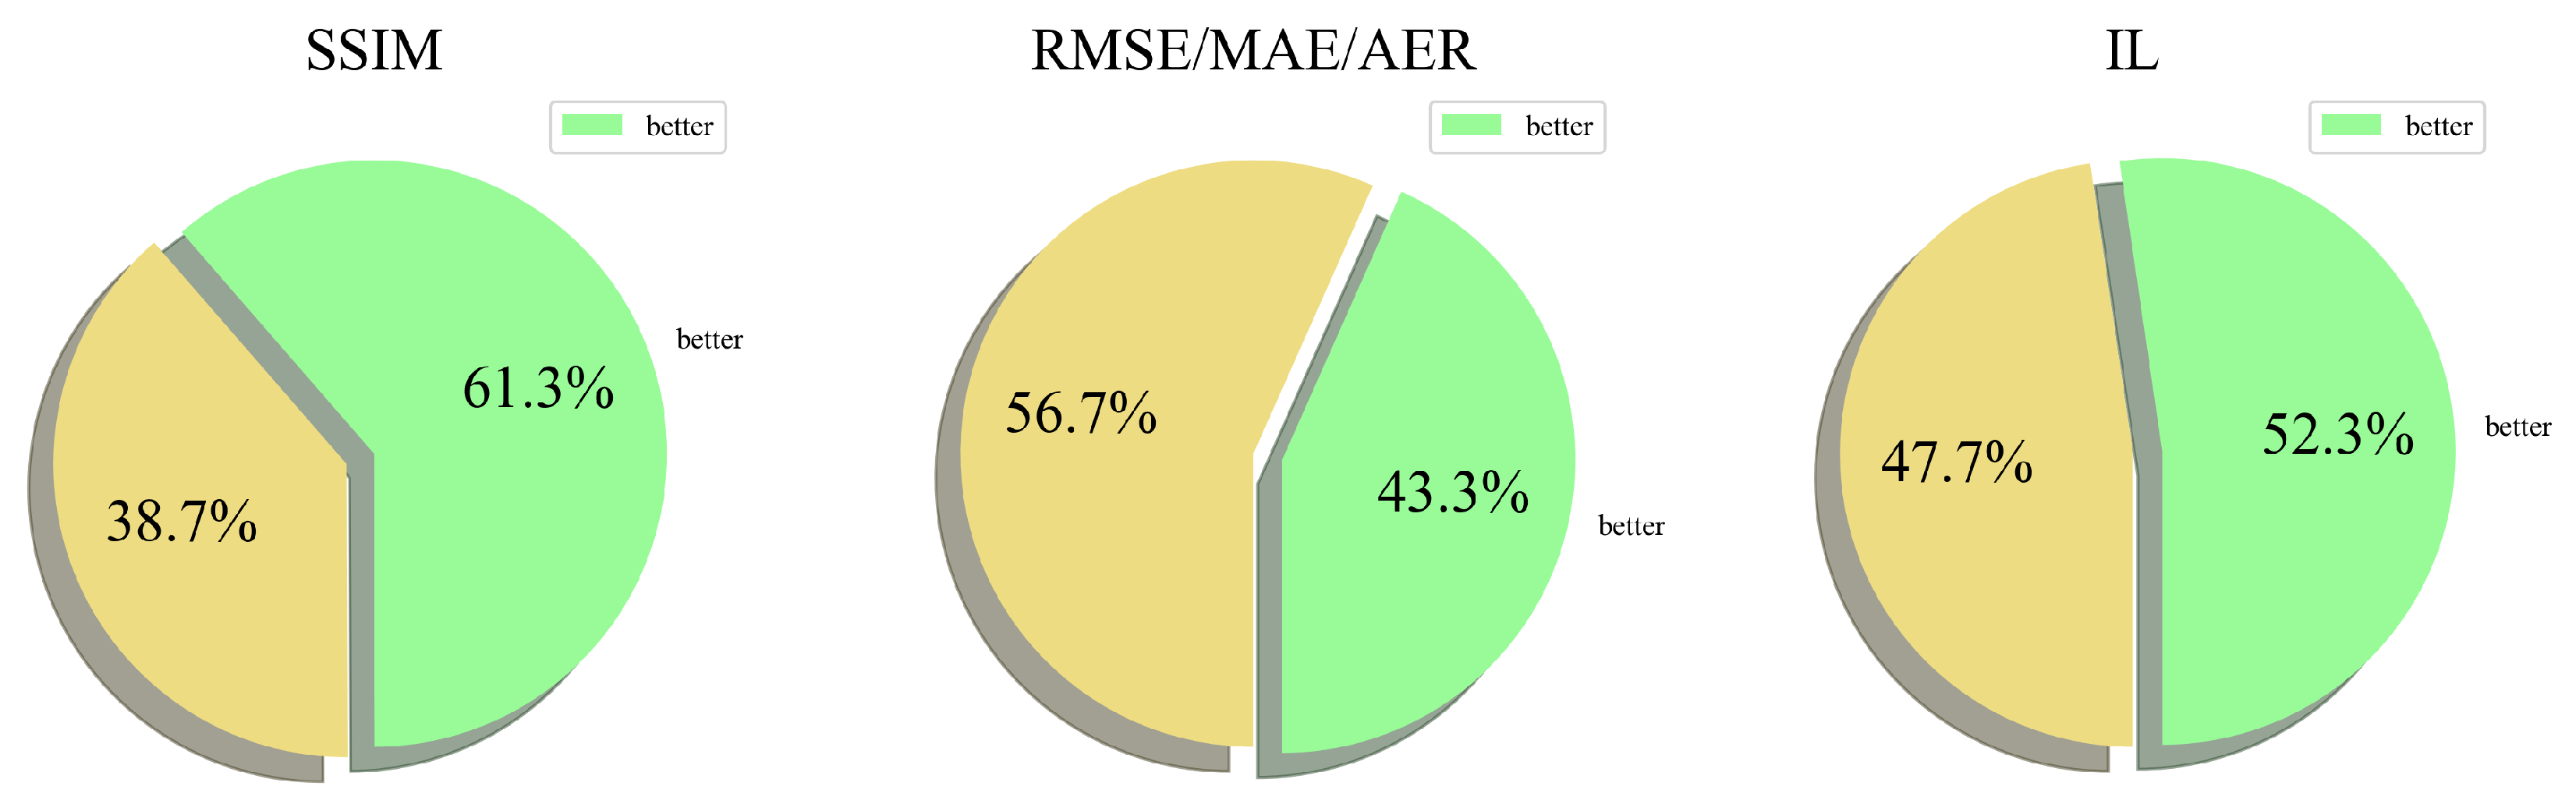
Figure 9.
TPS comparison among Random, LB-Chain and NLS-Chain.
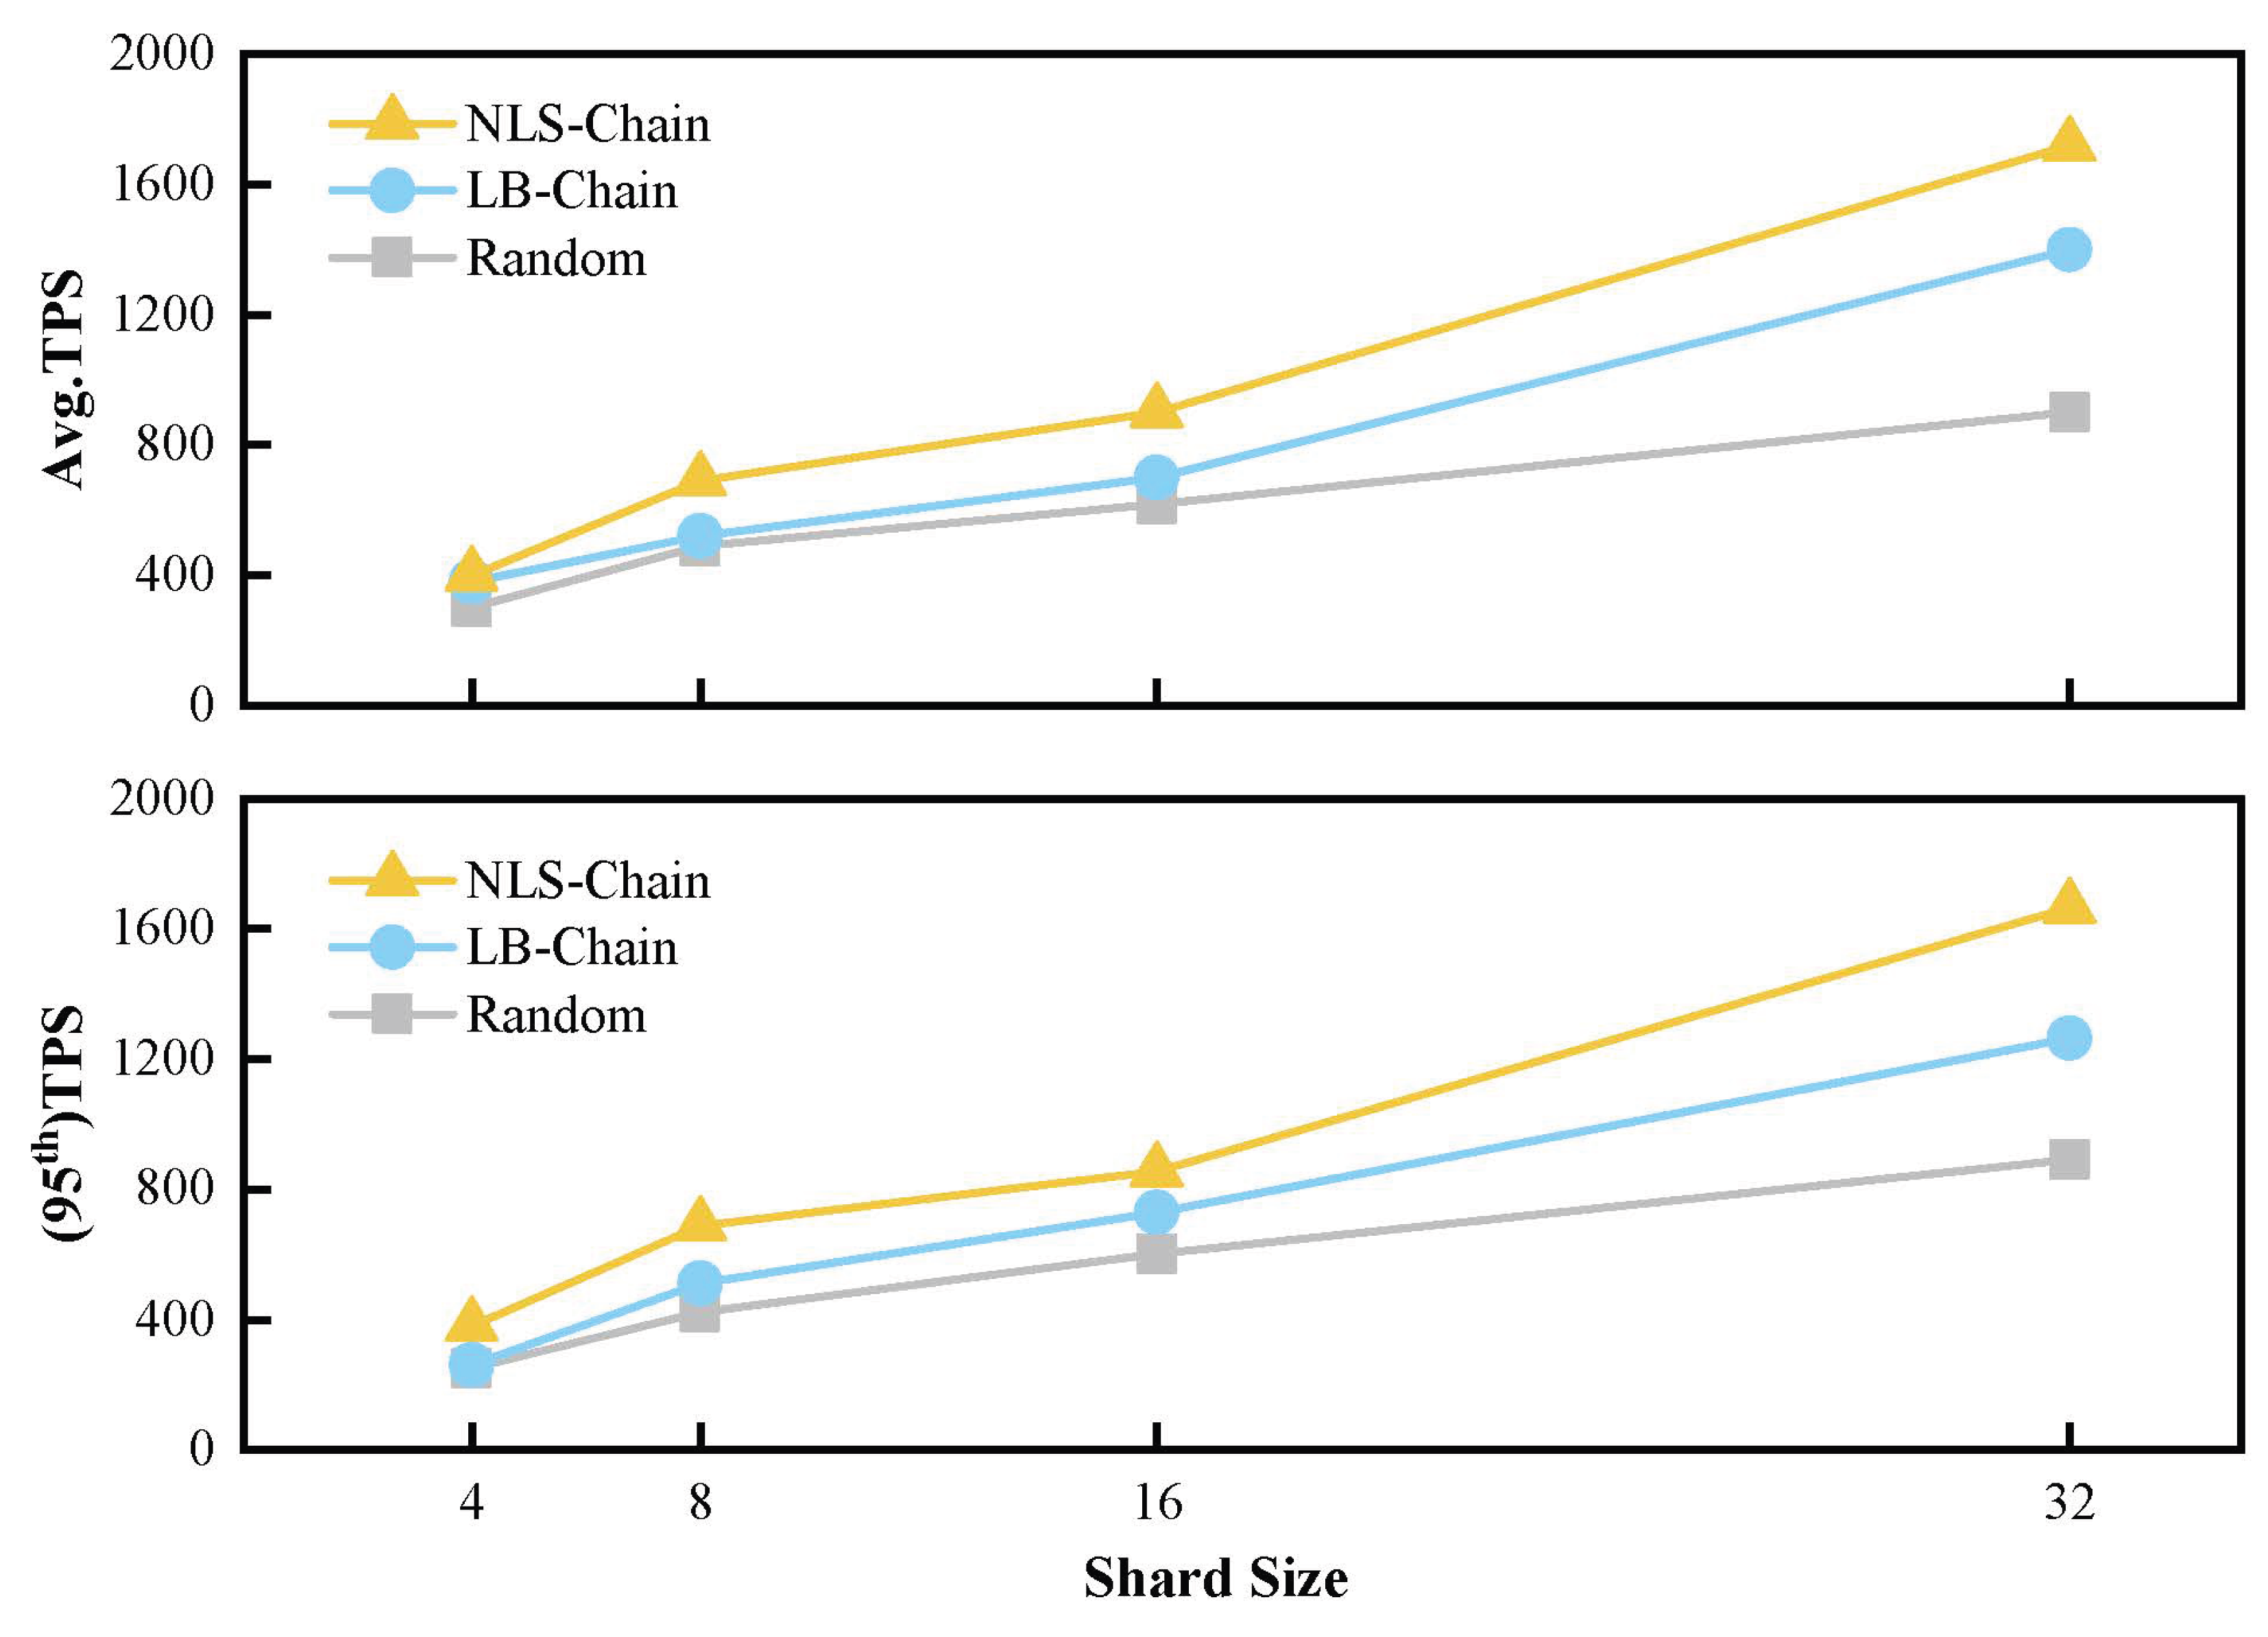

Table 1.
Comparison of average TPS.
| Shard Size | Random | LB-Chain | NLS-Chain |
|---|---|---|---|
| 4 | 276 | 323 | 392 |
| 8 | 477 | 512 | 670 |
| 16 | 612 | 713 | 873 |
| 32 | 895 | 1362 | 1955 |
Table 2.
Adaptive thresholding results on Set12. *Higher is better; all others prefer lower values.
| Method | SSIM* | RMSE | MAE | AER | IL |
|---|---|---|---|---|---|
| OTSU | 0.5230 | 90.10 | 80.04 | 0.314 | 6.156 |
| MEAN | 0.1903 | 123.53 | 108.05 | 0.424 | 6.066 |
| GAUSSIAN | 0.1748 | 127.91 | 112.37 | 0.441 | 6.092 |
Table 3.
Ablation results on KITTI.
| Method | SSIM ↑ | RMSE ↓ | IL ↓ |
|---|---|---|---|
| OTSU | — | — | — |
| OTSU-GK | +60.0% | +63.7% | +57.3% |
| OTSU-GK* | +74.3% | +58.7% | +70.3% |
Table 4.
Average TPS vs. shard count (500 nodes).
| Shards | Random | LB-Chain | NLS-Chain |
|---|---|---|---|
| 4 | 276 | 323 | 392 |
| 8 | 477 | 512 | 670 |
| 16 | 612 | 713 | 873 |
| 32 | 895 | 1362 | 1955 |
Disclaimer/Publisher’s Note: The statements, opinions and data contained in all publications are solely those of the individual author(s) and contributor(s) and not of MDPI and/or the editor(s). MDPI and/or the editor(s) disclaim responsibility for any injury to people or property resulting from any ideas, methods, instructions or products referred to in the content. |
© 2025 by the authors. Licensee MDPI, Basel, Switzerland. This article is an open access article distributed under the terms and conditions of the Creative Commons Attribution (CC BY) license (http://creativecommons.org/licenses/by/4.0/).
Copyright: This open access article is published under a Creative Commons CC BY 4.0 license, which permit the free download, distribution, and reuse, provided that the author and preprint are cited in any reuse.


