
Submitted:
01 November 2025
Posted:
03 November 2025
You are already at the latest version
Abstract
Tertiary oil recovery (TOR) is also called enhanced oil recovery. It is an industrial process used to extract additional crude oil that is difficult to extract using normal lifting techniques. Our study focuses on the use of solar thermal systems in Oman for sustainable oil recovery in Oman. In the presented solar thermal steam generation systems, arrays of parabolic troughs that are protected within glass houses are used to produce process steam for thermal oil recovery. The covered solar thermal systems in enhanced oil recovery are (1) Amal I, (2) Amal II, and (3) Miraah. Amal is the name of the oil field, which, when pronounced in Arabic, gives the meaning “hope”. Miraah is the name of the oil field, which, when pronounced in Arabic, gives the meaning “mirror”. These solar thermal steam generation systems can generate more than 2000 tonnes of steam per day, leading to a large reduction in the consumption of natural gas for fossil-based steam generation. We apply first principles and verify the heat demands and the carbon dioxide avoidance.
Keywords:
oil recovery
; industrial
; sustainability
; thermal systems
1. Nomenclature
| temperature rise | |
| density of crude oil | |
| density (bulk) of crude oil reservoir | |
| AHU | air handling unit |
| AL | artificial lift |
| AOR | assisted oil recovery |
| °API | American Petroleum Institute gravity degree |
| Bcf | billion standard cubic feet of natural gas (approximately equivalent to 1,000,000 MMBtu lower heating value “LHV”) |
| CaCO3 | calcium carbonate |
| CF | capacity factor |
| representative specific heat capacity of a crude oil reservoir | |
| DNI | direct normal irradiance |
| EOR | enhanced oil recovery (same as tertiary oil recovery, TOR) |
| ESEOR | enclosed solar enhanced oil recovery |
| GCR | ground coverage ratio |
| GHG | greenhouse gas |
| GWh | gigawatt-hour (equivalent to 3.6 TJ or 3.6 × 10⁶ MJ) |
| HAPP | hydraulically activated pipeline pigging |
| IEA | International Energy Agency |
| reference length of a reservoir zone to be heated | |
| LFR | linear Fresnel reflectors |
| LHV | lower heating value |
| MJ | megajoule (106 J) |
| MMBtu | million British thermal unit (equivalent to 1,055.1 MJ or 10 therms) [1,2] |
| MNm3 | million normal cubic meters of natural gas (approximately 35,000 MMBtu or 36,930 GJ lower heating value “LHV”) 3 |
| MWth | megawatt of thermal power |
| number of moles | |
| NG | natural gas |
| NL | normal liter |
| Nm3 | normal cubic meter of natural gas (approximately 35,000 Btu or 36,930 kJ lower heating value “LHV”) |
| OIIP | oil-initially-in-place |
| OOIP | original oil-in-place |
| OTSG | once-through steam generator [4,5,6] |
| absolute pressure | |
| PDC | parabolic dish collector |
| PDO | Petroleum Development Oman |
| PJ | petajoule (quadrillion joules, 1015 J or 1,000 TJ) |
| ppb | part per billion |
| ppm | part per million |
| PTC | parabolic trough collector |
| heat needed to increase the temperature of a reservoir zone | |
| universal (molar) gas constant, 8.3145 J/mol.K [7] | |
| SCC | stress corrosion cracking |
| SEOR | solar enhanced oil recovery |
| specific gravity | |
| SHIP | solar heat for industrial processes |
| SOR | steam-oil ratio |
| absolute temperature | |
| TDS | total dissolved solids |
| TEOR | thermal enhanced oil recovery |
| TES | total energy supply |
| TFC | total final consumption of energy |
| therm | 105 Btu (equivalent to 0.1 MMBtu) [8,9] |
| TJ | terajoule (1012 J) |
| volume |
2. Introduction
2.1. Importance of Sustainability for Oman
Recent studies show that the Sultanate of Oman is witnessing a verified trend of climate change, expressed as a steady increase in temperature at a rate of approximately 0.03 °C/year [10,11,12]. Hotter air can carry more moisture content, in accordance with the thermodynamic Clausius-Clapeyron relationship when applied to two-phase systems [13,14,15]. Therefore, this thermal anomaly can lead to interruptions in the natural hydrological cycle, reflected in heavy rainfalls and more frequent floods in Oman [16,17,18]. An example of the precipitation anomaly can be the exceptional April 2024 rainstorm accompanied by hail showers, heavy precipitation, and flash flooding that occurred in Oman and its neighboring country United Arab Emirates (UAE) [19,20].
Limiting the climate anomalies stems from curbing greenhouse gas (GHG) emissions [21], particularly carbon dioxide (CO2) [22,23,24] through shifting from traditional practices in engineering and businesses to sustainable ones. Examples of such sustainability shifts [25] include phasing out systems and processes that rely heavily on burning fossil fuels [26,27], using electric propulsion (e-mobility) [28] in transportation [29,30,31], deploying green buildings that consume a small amount of energy [32,33], investing in green (zero-emissions) hydrogen and its derivatives [34,35,36], investing in blue (low-emissions) hydrogen and its derivatives [37,38,39], exploring new high-performance power generation technologies [40,41,42], and encouraging the adoption of carbon capture technologies [43,44].
According to the International Energy Agency (IEA), the domestic energy production in Oman in 2022 was distributed as 59.3% crude oil (2,230,003 TJ), 40.6% natural gas (1,525,393 TJ), and 0.1% wind and solar energy (3,863 TJ) [45,46,47,48]. The term “domestic energy production” or (DEP) refers to all energy production (such as extracted fossil fuels), which can be used as fuels or burned to generate electricity [49], as well as energy produced by local nuclear reactors (not applicable in Oman) and renewable energy sources such as wind [50] and solar photovoltaic systems [51]. In terms of the Omani total energy supply (TES) profile in 2022; natural gas contributed the dominant share of 88.1% (1,023,964 TJ), while crude oil contributed a small share of 11.5% (134,165 TJ), and wind/solar energy contributed a marginal share of only 0.3% (3,863 TJ). The term “total energy supply” or (TES) refers to the result of subtracting all the energy that is exported outside a country or stored without immediate usage in that country from all the energy produced in that country or imported to it. In other words, the total energy supply (TES) represents the sum of all forms of energy that are needed to supply end users in the country [52,53]. Some of the energy sources involved in computing TES are used directly, whereas most of them are transformed into fuels or electricity for final consumption [54]. For the same year of 2022, electricity production in Oman depended on natural gas with a percentage of 94.7% (40,508 GWh), on crude oil with a percentage of 2.8% (1,190 GWh), and on the wind and solar photovoltaic systems with a percentage of 2.5% (1,073 GWh). In terms of the total final energy consumption (TFC) in Oman for 2022, natural gas represented 56.6% (600,340 TJ), oil products represented 31.1% (330,230 TJ), and electricity represented 12.3% (130,243 TJ). These energy mix figures are summarized in Table 1. They show the heavy penetration of fossil fuels in the Omani economy despite the abundance of clean energy resources [55,56,57]. This is a practice that the country aims to bring to a halt by 2050 [58]. This progress in sustainability and energy transition in Oman is aligned with progress in other domains [59,60,61], such as education [62,63,64] and urbanization [65], according to the Oman Vision 2040 [66,67,68].
2.2. Enclosed Solar Enhanced Oil Recovery (ESEOR)
One of the practices that is in need of sustainable transitioning in Oman is thermal enhanced oil recovery (TEOR), which is based on using steam. It is of special importance in Oman and similar oil-producing countries. In the current study, we present a case study of sustainable transitioning of the EOR in an oil field in Oman called “Amal” or “Amal West” [69,70]. In the original EOR process, natural gas was burned as the single source of heat energy to boil liquid water and convert it into hot steam suitable for underground injection to heat the crude oil and its surrounding rock layers, rendering this crude oil less viscous and thus possible to extract. The modified EOR process utilizes collected solar radiation for clean steam generation, while still using natural gas for night operation. The current study provides an informative description of this hybrid EOR process, which is established by the company GlassPoint (or GlassPoint Solar) [71,72] for the company Petroleum Development Oman (PDO), which owns and operates that oil field [73,74,75].
GlassPoint is a private start-up business that started in 2009. It was funded by venture capital. The company specializes in designing and manufacturing solar steam generation units. The company went bankrupt and was liquidated in May 2020 in light of a challenging business environment related to low and unpredictable prices of oil and gas. However, the company restarted in June 2022 with a contract to build a gigawatt-scale solar steam project in Saudi Arabia for green aluminum production, where the solar steam is to be used this time for refining bauxite ore into alumina rather than thermal enhanced oil recovery [76].
Thermal steam-injection enhanced oil recovery (TEOR) requires supplying a large amount of heat to generate the hot steam. For example, recent computer modeling considered injecting superheated steam at 800 °F (426.67 °C) into the reservoir of heavy crude oil [77]. That modeling work reported that heating the reservoir from 100 °F (37.78 °C) [78,79] to 823.5 °F (439.72 °C) results in a big drop in the heavy oil viscosity from 9.940 Pa.s to 2.697 Pa.s, which improves the fluidity of the oil. To help realize the huge heat consumed in, we consider as an example a cubic foundation zone with a side length () of 100 m, which is to be heated by a reasonable temperature rise () of 250 °C [80]. If the reservoir bulk (apparent) density () [81] is taken as 2,400 kg/m3 [82], and its specific heat capacity () is taken as 800 J/kg.K [83], and the volume is estimated as the cube of a reference characteristic length (); then the thermal energy () needed to raise the temperature of this reservoir zone is
The above equation gives 480 × 1012 J or 480 TJ. This is equivalent to 133.3 GWh, which is enormous. It is equivalent to the electricity consumed if a large load of 15.22 MW; roughly as if 6,000 big residential air conditioning units are working simultaneously [84,85,86,87,88]; is kept running continuously over one full year (365 days or 8,760 hours).
In the solar enhanced oil recovery (SEOR) technique for the three Omani projects, parabolic trough mirror concentrators are used to collect and focus the incoming solar radiation for industrial heating, rather than for electricity generation [89,90,91]. Liquid water is heated and partly boiled to produce a two-phase liquid-vapor mixture “wet steam” with a quality of 80% [92] (a mixture of 80% water vapor and 20% liquid droplets) [93,94], at an absolute pressure [95] of about 100 bar (1,450 psi or 10 MPa) [96,97] and a saturation temperature of about 310 °C (583.15 K) [98]. This solar-generated steam is used to operate SEOR. The thermodynamic properties of steam at 100 bar absolute pressure are shown in Table 2 [99,100,101].
For the three Omani projects covered here, the solar troughs are rotatable with one degree of freedom (DOF) to track the solar radiation [105,106], and they are placed in a greenhouse-like structure for protection from environmental disturbances and aerodynamic wakes [107,108,109], as well as to ease automated daily cleaning. This design leads to an enclosed solar enhanced oil recovery (ESEOR).
In enhanced oil recovery (EOR), unexploited crude oil (petroleum) in underground wells is pumped up with the aid of special oil production methods to reduce the flowing resistance of this oil and improve its extraction from the underground formation [110]. These special production methods for enhanced oil recovery (EOR) include injecting hot steam into the reservoir [111,112,113,114], thereby lowering the viscosity of the heavy viscous oil [115] (thermal thinning process), thus improving its ability to flow through the reservoir, or injecting a compressible miscible gas (such as carbon dioxide, CO2) [116] through an injection well [117], and this external gas dissolves in the underground oil, thereby reducing its viscosity (miscible displacement process) [118] and improving its mobility [119,120].
The oil recovery stage that precedes EOR is called (secondary recovery) [121,122], which is, in turn, preceded by the initial stage of production that is called (primary recovery) [123,124]. In the first stage of crude oil recovery (namely, the primary recovery stage), the crude oil is naturally extracted under the initially high well pressure. During the primary recovery stage, it is possible to utilize mechanical pumping (mechanical lift process) using beam pumps (pump jacks) [125] or electric submersible pumps (ESP) [126], or inject an immiscible gas into the production tubing (gas lift process) [127] to artificially increase the well pressure [128]. This technique and system to boost the well pressure (head) for oil production during the primary recovery stage, if necessary, is referred to as (artificial lift) [129,130] or (AL) [131,132]. In the second stage of oil recovery (namely, the secondary recovery stage, taking place after the primary recovery stage, when the well pressure declines despite the artificial lift), the well is either flooded with incompressible liquid water (waterflooding process), such as by pumping seawater or brackish water, or a gas is injected (gas injection process) [133] into the gas cap [134], which is the accumulated gaseous zone at the upper part of the reservoir [135]. Either of these processes has the primary goal of maintaining the reservoir pressure [136,137], such that the oil production level remains high enough to render it economical.
A newly introduced term (assisted oil recovery) or (AOR) [138]can be used to refer to a condition where artificial lift is used during the primary oil recovery.
The amount of oil that can be recovered during each of the three production stages depends on the properties of the crude oil itself. For heavy oils, EOR is responsible for a large portion of the oil that can be produced from an oil field, as high as 90% of the original oil-in-place (OOIP) or oil-initially-in-place (OIIP), while only about 5% can be produced in either the first stage or the second stage [139]. On the other hand, for light oils, about 25% of the produced oil can be accomplished during either the first or second stage, with the remaining 50% accomplished during the third stage, which is the EOR stage [140].
Heavy oils can be defined as those having an American Petroleum Institute gravity degree (°API) below 22.3° [141,142], which corresponds to a specific gravity (SG) above 0.92 or a density () above 920 kg/m3. Heavy crude oils not only have relatively high densities, but also have high sulfur contents (an undesirable property) and high viscosities, causing resistance to flow (another undesirable property). Light oils can be defined as those having an °API > 31.1° [143,144] (SG < 0.87 or < 870 kg/m3), and they are commercially desirable, due to the low sulfur content (making them easier to refine) and the low viscosities (making them easy to extract from the underground well) [145,146].
The API gravity degree is related to the specific gravity (SG) and the density () by the following nonlinear relationship [147]:
Figure 1 illustrates graphically the relationship between either density () or the specific gravity (SG) and the American Petroleum Institute gravity degree (°API) over a range of °API between 10 and 50. This is wide enough to cover a large number of possible crude oils [148,149]. A quadratic regression model is also shown in the figure, which approximates the exact expression in the above equation well.
The enclosed solar enhanced oil recovery (ESEOR) concept was implemented at either a pilot scale or a commercial scale for the first time in Oman at the Amal oil field. It is worth mentioning that a smaller test-scale or proof-of-concept (POC) unit was installed earlier in February 2011 in McKittrick, California, USA [150] (with a peak thermal capacity of 0.3 MWth or 300 kWth). Technically speaking, the McKittrick project of the GlassPoint company in California was the world’s first enclosed solar enhanced oil recovery (ESEOR) project. However, the Miraah project in Oman is the world’s first commercial-scale ESEOR project. Also, small scale, experimental scope, and limited monitoring records of the McKittrick project in California make it of secondary importance compared to the three subsequent ESEOR projects in Oman. Therefore, the current study can be of interest to readers and researchers working in the areas of enhanced oil recovery (EOR) and seeking information about this novel technology. The current study can attract the general interest of those working in solar thermal systems, solar heat for industrial processes (SHIP), and sustainability in the oil industry.
3. Research Methodology
3.1. Objectives and Contributions
The contributions of the current study to the literature of enhanced oil recovery, steam applications, solar heat for industrial processes (SHIP), and sustainable engineering practices include:
- Providing an example (a case study) of sustainable business operation in the oil industry. The current study is considered unique in terms of the provided independent technical and performance analysis of successful and flagship projects of enclosed solar enhanced oil recovery (ESEOR).
- Contrasting the three enclosed solar enhanced oil recovery (ESEOR) project designs in Oman, to derive best practices.
- Validating public data against first-principles models in a simple and reproducible way. Such validated data include avoided emissions of carbon dioxide (CO2).
- Discussing general aspects and challenges of solar enhanced oil recovery (SEOR).
3.2. Approach and Data Sources
The research framework adopted in the current study is a case study analysis method, guided by qualitative and quantitative processing of secondary data. Supporting information was selected, cross-validated, organized, and presented such that it facilitates achieving the stated objectives of the current study.
Most of the data accessed about the three presented enclosed solar enhanced oil recovery (ESEOR) projects in Oman were made publicly available. The sources of these data can be categorized into three types as follows [151,152]:
- (1)
- The GlassPoint website.
- (2)
- Research publications by GlassPoint staff.
- (3)
- Personal communications with GlassPoint staff, through which further proprietary information was obtained.
4. Results and Discussions
The current section is dedicated to presenting our summary of the geometric and operational configurations for the three GlassPoint enclosed solar enhanced oil recovery (ESEOR) projects in Oman. All of them are geographically located in the same zone of the Amal oil field, which is an offshore petroleum reservoir in the southern part of Oman. These three projects are: Amal I (pilot scale), Amal II (pilot scale), and Miraah (commercial scale). The current section is divided into three subsections. In the first subsection, we provide a tabular comparison between the three ESEOR projects. In the second subsection, we provide graphical illustrations related to the ESEOR concept of GlassPoint. In the third subsection, we present photographs that help in depicting the real view of the three ESEOR projects in the field. In the fourth subsection, we discuss some aspects of operating the ESEOR projects. The attribution is properly made in the caption of each figure.
4.1. The Choice of Parabolic Trough Collectors
We start the results section by justifying the choice of parabolic trough collectors (PTC) as the solar heat collection design for all three GlassPoint enclosed solar enhanced oil recovery (ESEOR) projects in Oman. There are other options for solar heat collection, such as the linear Fresnel reflectors (LFR), the parabolic dish collector (PDC), and the solar tower. However, the parabolic trough collector (PTC) design has multiple attractive features, which are:
- Maturity: Parabolic trough collectors are a very reliable technology that has been proven to be successful for many years, including large commercial-scale plants operating with stable conditions and low technological risks. A good example is the Mojave Solar project is a 250-megawatt solar electric generating facility (280 MW gross) in California, USA [158,159]. This commercial-scale PTC power plant has been operational for more than a decade (commissioned at the beginning of December 2014) [160].
- Modularity: Parabolic trough collectors are very scalable. They can be installed under a wide range of thermal capacities, ranging from a few kilowatts to hundreds of megawatts [161]. This makes them attractive for a diverse spectrum of industrial applications, including solar enhanced oil recovery.
- Simple construction: Parabolic trough collectors can be viewed as composed primarily of repetitive components (mirrors and receiver tube) and common materials (steel and glass) [162]. No large construction is needed (as in the case of the solar towers or the linear Fresnel reflectors). Also, the one-dimensional solar tracking in the case of parabolic trough collectors [163] tends to be easier to maintain and install than the two-dimensional (two-angles) solar tracking in the case of parabolic dish collectors or the heliostats of a solar tower.
- Low cost: The structural simplicity and the maturity of parabolic trough collectors make them one of the lowest-cost solar options [164].
- Effective land use: Compared to linear Fresnel reflectors (LFR) and solar towers, parabolic trough collectors (PTC) can permit better utilization of the available land area for the same power capacity.
It is useful to add here that in 2024, the largest investment for solar heat for industrial processes (SHIP) systems globally was for parabolic trough collectors (PTC), with a share of 66% in terms of the collector area or the equivalent thermal capacity [170].
Also, the superiority and dependability of the parabolic trough collectors (PTC) design is evidenced in selecting that design for building the world’s largest solar steam generation project (1,500 MWth peak capacity and a solar field area of 6 km2) [171]. It is under construction in Saudi Arabia. The application sector is mining (aluminum production) [172,173] rather than the oil sector.
4.2. Contrasting the Three Enclosed Solar EOR Projects
In Table 3, we compare 15 characteristics for the three Omani ESEOR projects by GlassPoint Solar, and we also provide external references for additional information.
In addition, the receiver tube of the parabolic troughs is made of carbon steel, with all-welded construction and long-radius (less pressure loss) bends. It has an internal diameter of 48 mm and an external diameter of 60 mm. Also, solar steam is produced using a once-through steam generator (OTSG) system.
Computer ray trace modeling was used to inspect the optical behavior of the closely-packed parabolic trough collector mirrors in response to the changing sun position [174,175,176].
It can be noticed that the large scale Miraah project was built closer to the earlier Amal I project rather than the subsequent Amal II project (for example; by having gable roofs in both cases, adopting the same aperture size, and using unevacuated receiver tubes). The adopted flat roof glass in Amal I and Miraah is favored due to simplicity and lower cost compared to the curved glass roof in Amal II [177,178]. Similarly, the attempted evacuated tube (vacuum tube) design in Amal II is not repeated in the Miraah project (and was not implemented in Amal I). Such tube evacuation improves the performance through vacuum insulation that suppresses heat loss [179,180], but it implies a cost and installation penalty due to the incurred complexity.
The above results of the reduced natural gas consumption are aligned with a reduction of about 25% of the original system. Thus, the capacity factor (CF), or the ratio of actual output heat compared to the theoretical output heat assuming continuous operation at the peak rated power [187,188], of the enclosed solar enhanced oil recovery (ESEOR) design is about 25%. This can be justified by the absence of solar radiation at night, and the weakened absorbed radiation outside the solar noon time, partly due to self-shading [189,190] and partly due to gradually weakened direct normal irradiance (DNI) [191,192]. It is useful to add here that such a low capacity factor is usual for solar systems [193,194,195].
Summing the amount of annually avoided natural gas consumption gives the following figures in Table 4.
Similarly, the summed annual avoided carbon dioxide emissions from the three ESEOR projects are 105,593 tonnes/year.
4.3. Thermal and Emissions Validation Model
To validate the heat and CO2 emissions values reported in the previous subsection (as reported by third-party sources), we provide here a simple thermal and emissions validation model [196]to verify these values in terms of their magnitude. We found that these values are acceptable as explained below.
The latent heat of vaporization or enthalpy of vaporization (the energy needed to convert 1 kg of saturated liquid water to saturated water vapor) at this pressure is 1,317.1 kJ/kg(water) or 0.36586 kWh/kg(water). Sensibly heating water from ambient temperatures to 310 °C requires an additional specific heat of about 1,425.4 kJ/kg(water) or 0.39594 kWh/kg(water). Summing both types of heats gives 2,742.5 kJ/kg, 0.76180 kWh/kg(water), or 2.5993 MMBtu/tonne(water).
Therefore, producing 1 tonne of steam daily during one year (365 days) requires a heat of about 948.7445 MMBtu or 1,000.98 GJ. Producing 50 tonnes of steam daily during one year (365 days) requires a heat of about 47,437 MMBtu or 50,049 GJ. This estimated quantity is identical to the GlassPoint-reported value of 47,437 MMBtu/year for either the Amal I pilot project or the Amal II pilot project, as shown in Table 3. Producing 2,000 tonnes of steam daily during one year (365 days) requires a heat of about 1,897,489 MMBtu or 2,001,960 GJ. This estimated quantity is very close to the GlassPoint-reported value of 1,897,461 MMBtu/year for the Miraah full-scale project, as shown in Table 3.
Because natural gas has a lower heating value (LHV) of approximately 0.035 MMBtu/Nm3 (0.03693 GJ/Nm3 or 106 MMBtu/Bcf), producing 1 tonne of steam daily during one year (365 days) requires burning about 27,106 Nm3 (0.027106 MNm3 or 0.0009487445 Bcf) of natural gas. Producing 50 tonnes of steam daily during one year (365 days) requires a heat of about 1.3553 million Nm3 (1,355,300 Nm3 or 0.047437 Bcf) of natural gas. Producing 2,000 tonnes of steam daily during one year (365 days) requires a heat of about 54.212 million Nm3 (54,212,000 Nm3 or 1.897 Bcf) of natural gas.
The reasonable and equivalent carbon dioxide emission factors for natural gas [197] of 52.9996 kg(CO2)/MMBtu, 185,253 kg(CO2)/GWh, 185.253 kg(CO2)/MWh, 0.185253 kg(CO2)/kWh, 51.4591 kg(CO2)/GJ, 0.0514591 kg(CO2)/MJ, 52,999,621 kg(CO2)/Bcf(NG), 1,854,989 kg(CO2)/MNm3(NG), and 1.854989 kg(CO2)/Nm3(NG); it can be computed that producing 1 tonne of steam daily during one year (365 days) by burning natural gas results in CO2 emissions of 50,283.1 kg. Producing 50 tonnes of steam daily during one year (365 days) by burning natural gas results in CO2 emissions of 2,514,155 kg. This estimated quantity is identical (when the same number of significant digits is compared) to the GlassPoint-reported value of 2,514 tonnes(CO2)/year for either the Amal I pilot project or the Amal II pilot project, as shown in Table 3. Producing 2,000 tonnes of steam daily during one year (365 days) by burning natural gas results in CO2 emissions of 100,566,200 kg. This estimated quantity is close to the GlassPoint-reported value of 100,565 tonnes(CO2)/year for the Miraah full-scale project, as shown in Table 3.
With regard to the above-quoted carbon intensity, the following theatrical justification can be made. Natural gas consists mainly of methane (CH4) [198], with a molar fraction of around 95% [199]. The ideal stoichiometric reaction of methane [200] with oxygen is
Thus, in terms of moles, the perfect combustion of one mole of methane leads to the emission of one mole of carbon dioxide (CO2). The molecular weight of methane is approximately 16 kg/kmol [201], and the molecular weight of carbon dioxide is approximately 44 kg/kmol [202]. Therefore, the perfect combustion of 1 kg of methane leads to the emission of 2.75 kg(CO2), or 44/16 kg(CO2). The volumetric lower heating value (LHV) of natural gas is approximately 35,000 Btu/Nm3 or 36,930 kJ/Nm3 [203]. Treated as an ideal gas [204], one mole (kmol) of methane or natural gas at 15 °C and 1 atm or 101,325 Pa [205] occupies about 23.645 normal liters (NL) and has a mass of approximately 16 g. This can be derived using the following ideal gas law:
In the above equation, setting the number of moles () to 1, the universal (molar) gas constant () to 8.3145 J/mol.K [206], the absolute temperature (288.15 K) that corresponds to 15 °C, and the absolute pressure () to 101,325 Pa, gives the standard volume of 0.023645 normal cubic meters (Nm3) or 23.645 normal liters (NL).
Therefore, one kilomole (kmol) of methane or natural gas occupies about 23.645 Nm3 and has a mass of approximately 16 kg at normal conditions. Thus, one normal cubic meter of methane (or natural gas) has an LHV energy content of 35,000 Btu/Nm3 (or 36,930 kJ/Nm3) × 23.645 Nm3/kmol, which results in 827,575 Btu/kmol(CH4) or 873,209.85 kJ/kmol(CH4). Given the 1:1 molar ratio between methane and carbon dioxide, these energy intensities can be converted into reciprocal carbon intensities as 0.827575 MMBtu/kmol(CO2) or 0.87320985 GJ/kmol(CO2). Converting these molar reciprocal carbon intensities into mass-based (gravimetric) reciprocal carbon intensities via dividing by the molecular weight of carbon dioxide (44 kg/kmol) gives 0.0188085 MMBtu/kg(CO2) or 0.0198457 GJ/kg(CO2). Taking the reciprocal of these values gives estimated ideal carbon intensities for natural gas combustion as 53.1674 kg(CO2)/MMBtu or 50.3888 kg(CO2)/GJ. Given that 1 MWh = 3.6 GJ = 3,600 kWh, our estimated carbon intensity is also equivalent to 181.400 kg(CO2)/MWh and 0.181400 kg(CO2)/kWh. These estimates are very close to the reported third-party value.
4.4. Illustrative Sketches
To explain the geographical location of the Amal field (and thus the three ESEOR projects covered here), Figure 2 has a useful map that demonstrates this [207]. The oil field is located in the southern part of Oman. The Amal oil field is in the north of the Dhofar governorate (the southern governorate of Oman), near its north border with the neighboring “Al Wusta” governorate (the central governorate of Oman). The field is located about 50 km north of the Arabian Sea coast.
The Amal oil field is located at the geographic coordinates of 18.3333989° North, 55.6684729° East [208].
The Miraah enclosed solar enhanced oil recovery (ESEOR) project is located at a latitude of 18.349281° North and a longitude of 55.684590° East [209,210].
Figure 3 illustrates the layout of the parabolic trough rows within an enclosing glasshouse [211]; the curved roof in the sketch corresponds to the Amal II pilot project. The looping of the heated water is noticeable in the sketch, where the heat addition process is cascaded through multiple passes along a sequence of trough rows.
Figure 4 further emphasizes the structural advantage behind the enclosure concept [212], where the fluid-structure interaction [213,214], as well as other environmental harsh influences such as dust and soiling effects, are prevented from affecting the parabolic reflector mirrors.
Figure 5 visualizes the compactness advantage of the ESEOR concept as a source of energy [215] compared to the solar updraft tower (SUT) solar thermal technology [216,217], and the photovoltaic (PV) modules technology (the produced PV electricity should then be converted into heat using electric heaters) [218]. The close proximity of the trough rows in the ESEOR and the decreased soiling loss as a result of better automated daily cleaning make the design very efficient in terms of area utilization. In particular, the footprint demands of an SUT (solar tower) system are about 3 times those of the ESEOR system, while the footprint demands of a PV system are about 6 times those of the ESEOR system.
4.5. Selected Photos
It can be a valuable addition to the current study to show selected real photos that effectively describe the appearance of the three constructed ESEOR projects. This aim is fulfilled in the current subsection.
Figure 6 and Figure 7 are two photos taken for the Amal I pilot project [219,220]. The gable roof design is visible. The trough rows within the greenhouse-like enclosure show small spacing between rows as well as small tolerances at the two side tips of each row. Therefore, the ground coverage ratio (GCR) is close to one (around 0.93), which indicates a very compact design [221,222]. The ground coverage ratio (GCR) is the total mirror aperture surface area divided by the occupied ground area. This high GCR contributes to the effective utilization of the land area. However, self-shading losses become high in the morning and the evening. It can also be noticed that the Amal I project has a single enclosure structure.
Figure 8 is a photo taken for the Amal II pilot project [223]. The high ground coverage ratio (GCR) is apparent from this photo, as a result of small inter-row spacing and small tolerances between the rows and the adjacent enclosure walls. Like Amal I, the Amal II project consists of a single enclosure structure. The curved roof of Amal II is one of its main differences from Amal I.
Figure 9 is another photo of the Amal II pilot project during night installation, and it shows effectively one of the reflector mirrors and its supporting frame [224].
We visually illustrate the structure of the commercial-scale Miraah project. Given its larger scale compared to the pilot-scale Amal I and Amal II projects (the solar field area of Miraah is 36 times the solar field area of either Amal I or Amal II), the Miraah project is not constructed as a single enclosure. Instead, it is split over six enclosures and three modules. This is shown in Figure 10 [225].
Figure 11 is an on-site drone photo for one of the six enclosures of the Miraah project. A small portion of the adjacent enclosure can also be noticed [226]. The water/steam pipelines can be recognized well in this view.
Figure 12 is a front photo of one of the six enclosures of the Miraah project, showing the gable roof and outside pipelines [227]. The photo was taken near the solar noon (the sun is at its highest elevation), and therefore, the trough apertures are nearly pointing straight up. This particular view emphasizes the small clearance between the parabolic reflector mirrors. This maximizes the land utilization but at the expense of reduced capacity factor (CF) due to accentuated self-shading losses before and after the solar noon.
4.6. Challenges
In this subsection, we discuss six challenges faced by the pioneering enclosed solar enhanced oil recovery (ESEOR) projects in Oman.
We compiled these challenges and the attempted mitigation actions and solutions from a variety of published works by GlassPoint staff as well as supplementary relevant external sources, as demonstrated by the cited reference(s) for each discussed challenge.
First, before even the installation phase, the large land area needed for an ESEOR project can be a challenge by itself. As in solar systems in general, the incoming solar radiation has relatively low density (around 1 kW/m2 at its peak), and thus requires a large area to collect sufficiently useful heating rates [229,230,231]. A single receiver loop in the 54-loop Miraah project produces about 1.54 tonnes of steam per hour (about 13,500 tonnes of steam per annum), which requires heating freshwater at an intense rate of about 3.38 GJ/hour or 0.940 MWth. This is the bare minimum theoretical heating rate, without any losses. At peak operation, the realistic single-loop load jumps to 6.11 MWth or 22.0 GJ/hour. While this particular challenge was not problematic in the case of the Omani Amal oil field (due to the availability of unoccupied land), it might be a concern in another site.
Second, soiling in the open desert area of the Amal oil field can cause rapid loss of performance. While the transparent enclosure of the ESEOR protects the solar collector mirrors from dust and other soiling factors, the glass enclosure itself is subject to such soiling effects. This problem was addressed by daily night cleaning using a fast automatic roof washing (cleaning) system. The average soiling losses are kept at a maximum of 2% only between two consecutive daily washing processes. Due to dust infiltration, some internal soiling (inside the glasshouses) also occurs, but at a slow rate of about 0.2% per week. Due to the absence of condensation at the reflector mirrors, which is a condition attained by an air handling unit (AHU), dry, infrequent cloth-based cleaning is enough to restore the performance of the parabolic troughs and receiver tubes. A reverse osmosis (RO) plant is used to produce clean water for washing (cleaning) purposes that counteract soiling [185].
Third, due to having two sources of steam (the solar steam and the gas-firing steam) in the hybrid ESEOR projects in Oman, such hybrid steam generation systems require attention in terms of combining these two streams of steam. This was addressed by installing a production steam header, into which solar steam or gas-firing steam is injected directly. This header is charged at 88 bar to 100 bar [232].
Fourth, the weather at the Amal desert field can be very harsh, especially in the summer, when the ambient temperature approaches 50 °C at noon. This harmfully affects labor productivity as well as health and safety. This issue was mitigated by shifting the work from daytime to nighttime, where a drop of about 10 °C occurs [185].
Fifth, maintaining the receiver tube clear for the fluid flow requires special treatments. The water used at the Amal field is produced water (saline water separated from the extracted oil) [233], with about 8,000 ppm total dissolved solids (TDS) [234]. Such produced water is contaminated with dissolved minerals and probably with small solid particles. Therefore, it is important to prevent corrosion, erosion, and the deposition of solid matter on the internal walls of the receiver tube. These targets were achieved through multiple actions. Instead of the expensive demineralization treatment, water softening (as a limited but less expensive form of water treatment) was adopted, and water hardness was removed to less than 1 mg(CaCO3)/L, which is very small [235,236]. Also, dissolved oxygen content is kept below 10 ppb using oxygen scavengers [237,238]. Accumulation of solid deposits is reduced by limiting the steam quality (steam dryness fraction) [239] at the boiler exit to 80%, which means that 20% (by mass) of this two-phase liquid-vapor water mixture is sufficient to dissolve soluble impurities. It should be noted that due to the variation of the solar irradiance during the day and the nonlinear heat transfer phenomena for solar heat generation [240,241], a control system [242] is installed to adjust the feedwater flow rate accordingly to maintain the target output steam quality [243,244,245]. Despite these preventive procedures, a small quantity of solids still inevitably accumulates in the receiver tubes. This is periodically removed through cleaning by hydraulically activated pipeline pigging (HAPP) [246]. The selection of carbon steel for the receiver tube was carefully made because of the high salt concentration of the feedwater. Alternative austenitic stainless alloys are not suitable here because they are susceptible to stress corrosion cracking (SCC) [247] upon exposure to chloride concentrations above 100 ppm [248,249].
Sixth, the limited capacity factor of an ESEOR project affects its economic feasibility. However, this low capacity factor can be increased if the rate of steam injection into the oil reservoir does not have to be at a constant rate during the 24-hour day. Instead, if more steam injection during the sunshine hours and less steam injection during the night are adopted, then the consumption of natural gas can be reduced further, to about 80%. This idea is possible because the heating and pressurization of the subsurface reservoir are not sensitive to the daily profile of steam injection. However, this idea implies elevated capital costs, increased operational maintenance costs, and added system complexity due to the oversized solar steam generation system. It also means that the oversized solar steam generation is more underutilized when the overall daily cycle is considered.
4.7. Steam-Oil Ratio (SOR)
In this subsection, we broadly discuss one of the key aspects of thermal enhanced oil recovery, which is the steam-oil ratio (SOR) [250], also called steam-to-oil ratio [251,252] and steam/oil ratio. This non-dimensional number is defined as the volume of water (converted into injected steam) to produce one volume of oil. The value of SOR can vary between two and eight [253]. In the case of the Omani solar enhanced oil recovery projects, a value of about three was reported. This is a favorable low value, reflecting an efficient use of steam. It is the same as the average steam-oil ratio (SOR) reported for the thermal enhanced oil recovery projects in Alberta, Canada [254]. The implication of the SOR is the water consumption for the thermal enhanced oil recovery. This consumption is aimed at being minimized for environmental and economic reasons. The profitability of steam-based EOR depends largely on the steam-oil ratio (SOR), due to affecting the operational cost [255]. It is worth mentioning that the steam-oil ratio might be reported in terms of the mass (kg steam/kg oil) [256] rather than the volume (m3 steam/m3 oil).
5. Conclusions
We provided an overview of three novel sustainable enhanced oil recovery projects in Oman, in which clean steam produced by concentrated solar radiation partially replaces conventional steam produced by natural gas combustion, for the purpose of thermal enhanced oil recovery at the Amal oil field. Various design parameters, visualized structures, and challenges were discussed. This work is a case study that primarily aims to demonstrate and promote these successful examples for broader adoption in other geographic locations, which have large environmental gains.
We applied a thermal and emissions model to validate public data about the annual energy needs, annual natural gas consumption, and annual avoided carbon dioxide emissions. We found that the independently reported values are reasonably acceptable.
The current work did not cover the economic aspects of solar steam generation [257]. Also, some technological details were not mentioned here (such as the control system for steam injection, water storage, and automatic cleaning devices). Although these can be viewed as limitations, they help make the study focused and concise. These additional elements are valuable additions for coverage in a separate work.
The current work can be extended by examining thermal energy storage [258,259] as an added aspect in the Miraah solar enhanced oil recovery system. The technical gains from this idea can be assessed in terms of its ability to further reduce, or even eliminate, the demand for natural gas as a heating source at the Miraah project. This extension may require proper sizing of the storage capacity and exploring possible profiles of supplying steam to the reservoir (fixed rate versus variable rate).
For policymakers, the current study recommends expanded deployment of hybrid solar-steam generation systems for thermal enhanced oil recovery. The successful and endured operation of the Omani projects, as presented here, encourages governments and businesses to adopt this concept. The use of hybrid solar steam generation is not recommended only in enhanced oil recovery, but also in other processes that involve large heating demands. These include district heating [260,261], power generation [262,263,264], industrial drying [265], and food processing [266,267]. Governments can provide financial incentives [268,269,270] as well as technical awareness programs to motivate the transition toward this more sustainable heating alternative.
Funding
Not applicable (this research received no funding).
Data Availability Statement
The data that support the findings of this study are available within the article itself.
Declaration of Competing Interests Statement
The author declares that they have no known competing financial interests or personal relationships that could have appeared to influence the work reported in this paper.
References
- Williams, A. E. Industrial Energy Systems Handbook, 1st ed.; River Publishers: New York, USA, 2023. [CrossRef]
- Lorenzini, G.; Moretti, S.; Conti, A. Units and Conversion Factors. In Fin Shape Thermal Optimization Using Bejan’s Constructal Theory; Synthesis Lectures on Engineering; Springer International Publishing: Cham, Switzerland, 2011; pp 41–46. [CrossRef]
- NewMed Energy. NewMed Energy │ Energy Calculator. https://newmedenergy.com/energy-calculator/ (accessed 2025-08-02).
- Fanaritis, J. P.; Warren, Pa.; Kimmel, J. D. Review of Once-Through Steam Generators. J Pet Technol 1965, 17 (04), 409–416. [CrossRef]
- Tzanos, C. P. A Movable Boundary Model for Once-Through Steam Generator Analysis. Nuclear Technology 1988, 82 (1), 5–17. [CrossRef]
- YOON, J.; KIM, J.-P.; KIM, H.-Y.; LEE, D. J.; CHANG, M. H. Development of a Computer Code, ONCESG, for the Thermal-Hydraulic Design of a Once-Through Steam Generator. Journal of Nuclear Science and Technology 2000, 37 (5), 445–454. [CrossRef]
- Lee, K. O.; Williams, W. C.; McFarlane, J.; Kropaczek, D.; de Wet, D. Semi-Empirical Model for Henry’s Law Constant of Noble Gases in Molten Salts. Sci Rep 2024, 14 (1), 12847. [CrossRef]
- Brown, N. L. Renewable Energy Resources And Rural Applications In The Developing World, 1st ed.; Routledge: New York, USA, 2019. [CrossRef]
- EIA, [United States Energy Information Administration]. EIA │Frequently Asked Questions (FAQs) = What are Ccf, Mcf, Btu, and therms? https://www.eia.gov/tools/faqs/faq.php?id=45&t=8 (accessed 2025-08-02).
- Khaledi, C. K. A.; Khosravi, M.; Tavousi, T.; Hamidianpour, M.; Moghadam, M. K. Future Warming of the Gulf of Oman: SST Trends under Contrasting Climate Scenarios by 2050. Regional Studies in Marine Science 2024, 77, 103682. [CrossRef]
- World Bank. CCKP │ Climate Change Knowledge Portal - Oman (Historical Trends). https://climateknowledgeportal.worldbank.org/country/oman/trends-variability-historical (accessed 2025-06-07).
- Dreyfus, G. B.; Xu, Y.; Shindell, D. T.; Zaelke, D.; Ramanathan, V. Mitigating Climate Disruption in Time: A Self-Consistent Approach for Avoiding Both near-Term and Long-Term Global Warming. Proceedings of the National Academy of Sciences 2022, 119 (22), e2123536119. [CrossRef]
- Marzouk, O. A.; Huckaby, E. D. Simulation of a Swirling Gas-Particle Flow Using Different k-Epsilon Models and Particle-Parcel Relationships. Engineering Letters 2010, 18 (1).
- Pall, P.; Allen, M. R.; Stone, D. A. Testing the Clausius–Clapeyron Constraint on Changes in Extreme Precipitation under CO2 Warming. Clim Dyn 2007, 28 (4), 351–363. [CrossRef]
- Yamada, T. J.; Farukh, Murad. A.; Fukushima, T.; Inatsu, M.; Sato, T.; Pokhrel, Y. N.; Oki, T. Extreme Precipitation Intensity in Future Climates Associated with the Clausius-Clapeyron-like Relationship. Hydrological Research Letters 2014, 8 (4), 108–113. [CrossRef]
- Fowler, A. M.; Hennessy, K. J. Potential Impacts of Global Warming on the Frequency and Magnitude of Heavy Precipitation. Nat Hazards 1995, 11 (3), 283–303. [CrossRef]
- Huang, P.; Xie, S.-P.; Hu, K.; Huang, G.; Huang, R. Patterns of the Seasonal Response of Tropical Rainfall to Global Warming. Nature Geosci 2013, 6 (5), 357–361. [CrossRef]
- Radwan, N.; Halder, B.; Ahmed, M. F.; Refadah, S. S.; Khan, M. Y. A.; Scholz, M.; Sammen, S. S.; Pande, C. B. Seasonal Precipitation and Anomaly Analysis in Middle East Asian Countries Using Google Earth Engine. Water 2025, 17 (10), 1475. [CrossRef]
- Francis, D.; Fonseca, R.; Nelli, N.; Cherif, C.; Yarragunta, Y.; Zittis, G.; Jan de Vries, A. From Cause to Consequence: Examining the Historic April 2024 Rainstorm in the United Arab Emirates through the Lens of Climate Change. npj Clim Atmos Sci 2025, 8 (1), 1–14. [CrossRef]
- GDACS, [Global Disaster Alert and Coordination System]. Overall Green Alert Flood in Oman (GDACS ID: FL 1102566). https://www.gdacs.org/report.aspx?eventtype=FL&eventid=1102566 (accessed 2025-05-25).
- Marzouk, O. A. Assessment of Global Warming in Al Buraimi, Sultanate of Oman Based on Statistical Analysis of NASA POWER Data over 39 Years, and Testing the Reliability of NASA POWER against Meteorological Measurements. Heliyon 2021, 7 (3), e06625. [CrossRef]
- Bruhwiler, L.; Basu, S.; Butler, J. H.; Chatterjee, A.; Dlugokencky, E.; Kenney, M. A.; McComiskey, A.; Montzka, S. A.; Stanitski, D. Observations of Greenhouse Gases as Climate Indicators. Climatic Change 2021, 165 (1), 12. [CrossRef]
- Marzouk, O. A. Temperature-Dependent Functions of the Electron–Neutral Momentum Transfer Collision Cross Sections of Selected Combustion Plasma Species. Applied Sciences 2023, 13 (20), 11282. [CrossRef]
- Szulejko, J. E.; Kumar, P.; Deep, A.; Kim, K.-H. Global Warming Projections to 2100 Using Simple CO2 Greenhouse Gas Modeling and Comments on CO2 Climate Sensitivity Factor. Atmospheric Pollution Research 2017, 8 (1), 136–140. [CrossRef]
- Marzouk, O. A. Combined Oxy-Fuel Magnetohydrodynamic Power Cycle. In Conference on Energy Challenges in Oman (ECO’2015); DU [Dhofar University]: Salalah, Dhofar, Oman, 2015.
- Lindholt, L.; Glomsrød, S. Phasing out Coal and Phasing in Renewables – Good or Bad News for Arctic Gas Producers? Energy Economics 2018, 70, 1–11. [CrossRef]
- Shindell, D.; Smith, C. J. Climate and Air-Quality Benefits of a Realistic Phase-out of Fossil Fuels. Nature 2019, 573 (7774), 408–411. [CrossRef]
- Marzouk, O. A. Recommended LEED-Compliant Cars, SUVs, Vans, Pickup Trucks, Station Wagons, and Two Seaters for Smart Cities Based on the Environmental Damage Index (EDX) and Green Score. In Innovations in Smart Cities Applications Volume 7; Ben Ahmed, M., Boudhir, A. A., El Meouche, R., Karaș, İ. R., Eds.; Lecture Notes in Networks and Systems; Springer Nature Switzerland: Cham, Switzerland, 2024; Vol. 906, pp 123–135. [CrossRef]
- Nadimuthu, L. P. R.; Victor, K. Socio-Techno-Economic-Environmental Analysis of Vehicle-to-Grid-Integrated E-Mobility in Achieving Sustainable Development Goals: A Case Study. In Handbook on New Paradigms in Smart Charging for E-Mobility; Kumar, A., Bansal, R. C., Kumar, P., He, X., Eds.; Elsevier, 2025; pp 447–480. [CrossRef]
- Marzouk, O. A. Urban Air Mobility and Flying Cars: Overview, Examples, Prospects, Drawbacks, and Solutions. Open Engineering 2022, 12 (1), 662–679. [CrossRef]
- Huang, A.; Dai, L.; Ali, S.; Nazar, R.; Anser, M. K. Zero-Emission Vision: The Role of E-Mobility Technology Budgets in Carbon Mitigation. Transport Policy 2025, 164, 265–280. [CrossRef]
- Vavouris, A.; Guasselli, F.; Stankovic, L.; Stankovic, V.; Gram-Hanssen, K.; Didierjean, S. A Complex Mixed-Methods Data-Driven Energy-Centric Evaluation of Net-Positive Households. Applied Energy 2024, 367, 123404. [CrossRef]
- Zhu, Y.; Xu, W.; Luo, W.; Yang, M.; Chen, H.; Liu, Y. Application of Hybrid Machine Learning Algorithm in Multi-Objective Optimization of Green Building Energy Efficiency. Energy 2025, 316, 133581. [CrossRef]
- Barhoumi, E. M.; Okonkwo, P. C.; Ben Belgacem, I.; Zghaibeh, M.; Tlili, I. Optimal Sizing of Photovoltaic Systems Based Green Hydrogen Refueling Stations Case Study Oman. International Journal of Hydrogen Energy 2022, 47 (75), 31964–31973. [CrossRef]
- Elkelawy, M.; Draz, A. M.; Antar, A. M.; Seleem, H. E. Enhancing Diesel Generator Efficiency and Emissions with CNG and Green Hydrogen: A Sustainable Solution for Power Plants. Pharos Engineering Science Journal 2025. [CrossRef]
- Squadrito, G.; Maggio, G.; Nicita, A. The Green Hydrogen Revolution. Renewable Energy 2023, 216, 119041. [CrossRef]
- Marzouk, O. A. Levelized Cost of Green Hydrogen (LCOH) in the Sultanate of Oman Using H2A-Lite with Polymer Electrolyte Membrane (PEM) Electrolyzers Powered by Solar Photovoltaic (PV) Electricity. E3S Web of Conferences 2023, 469, 00101. [CrossRef]
- Mio, A.; Barbera, E.; Massi Pavan, A.; Bertucco, A.; Fermeglia, M. Sustainability Analysis of Hydrogen Production Processes. International Journal of Hydrogen Energy 2024, 54, 540–553. [CrossRef]
- Bauer, C.; Treyer, K.; Antonini, C.; Bergerson, J.; Gazzani, M.; Gencer, E.; Gibbins, J.; Mazzotti, M.; T. McCoy, S.; McKenna, R.; Pietzcker, R.; P. Ravikumar, A.; C. Romano, M.; Ueckerdt, F.; Vente, J.; Spek, M. van der. On the Climate Impacts of Blue Hydrogen Production. Sustainable Energy & Fuels 2022, 6 (1), 66–75. [CrossRef]
- Marzouk, O. A. Detailed and Simplified Plasma Models in Combined-Cycle Magnetohydrodynamic Power Systems. International Journal of Advanced and Applied Sciences 2023, 10 (11), 96–108. [CrossRef]
- Zhu, Q. High-Efficiency Power Generation – Review of Alternative Systems; IEA Clean Coal Centr: London, UK, 2015; pp 1–120. https://usea.org/sites/default/files/032015_High-efficiency%20power%20generation%20-%20review%20of%20alternative%20systems_ccc247.pdf (accessed 2025-05-26).
- Marzouk, O. A. Detailed Derivation of the Scalar Explicit Expressions Governing the Electric Field, Current Density, and Volumetric Power Density in the Four Types of Linear Divergent MHD Channels Under a Unidirectional Applied Magnetic Field. Contemporary Mathematics 2025, 6 (4), 4060–4100. [CrossRef]
- Marzouk, O. A.; Huckaby, E. D. New Weighted Sum of Gray Gases (WSGG) Models for Radiation Calculation in Carbon Capture Simulations: Evaluation and Different Implementation Techniques. In 7th U.S. National Technical Meeting of the Combustion Institute; Atlanta, Georgia, USA, 2011; Vol. 4, pp 2483–2496.
- Marzouk, O. A. Reduced-Order Modeling (ROM) of a Segmented Plug-Flow Reactor (PFR) for Hydrogen Separation in Integrated Gasification Combined Cycles (IGCC). Processes 2025, 13 (5), 1455. [CrossRef]
- IEA, [International Energy Agency]. IEA │ World Energy Statistics and Balances. IEA. https://www.iea.org/data-and-statistics/data-product/world-energy-statistics-and-balances (accessed 2025-07-31).
- GEM, [Global Energy Monitor]. Dhofar II Wind Farm - Global Energy Monitor Profile. https://www.gem.wiki/Dhofar_II_wind_farm (accessed 2024-08-08).
- MEM, [Minister of Energy and Minerals in the Sultanate of Oman]. MEM │ Dhofar wind farm. https://mem.gov.om/en-us/Our-Business/Renewable-Energy-and-Hydrogen/Renewable-Energy-and-Hydrogen-Projects/ArtMID/732/ArticleID/1325/Dhofar-wind-farm (accessed 2024-10-28).
- Masdar. Dhofar Wind Power Project; Public Announcement; 2022. https://masdar.ae/-/media/corporate/projects/downloads/dhofar-wind-power/dhofar-wind-power-project_eng.pdf (accessed 2023-10-30).
- Marzouk, O. A. OpenFOAM Computational Fluid Dynamics (CFD) Solver for Magnetohydrodynamic Open Cycles, Applied to the Sakhalin Pulsed Magnetohydrodynamic Generator (PMHDG). Discover Applied Sciences 2025, 7 (10), 1108. [CrossRef]
- Marzouk, O. A. Changes in Fluctuation Waves in Coherent Airflow Structures with Input Perturbation. WSEAS Transactions on Signal Processing 2008, 4 (10), 604–614.
- York, R. How Much Can We Expect the Rise in U.S. Domestic Energy Production to Suppress Net Energy Imports? Social Currents 2015. [CrossRef]
- Rokicki, T.; Bórawski, P.; Szeberényi, A. The Impact of the 2020–2022 Crises on EU Countries’ Independence from Energy Imports, Particularly from Russia. Energies 2023, 16 (18), 6629. [CrossRef]
- Yufenyuy, M.; Addai, K.; Kirikkaleli, D. Assessing the Effect of Transport Infrastructure Investments and Total Energy Supply on Material Footprint: Insights from France. Energy & Environment 2025, 0958305X251326183. [CrossRef]
- Marzouk, O. A.; Huckaby, E. D. Assessment of Syngas Kinetic Models for the Prediction of a Turbulent Nonpremixed Flame. In Fall Meeting of the Eastern States Section of the Combustion Institute; College Park, Maryland, USA, 2009; pp 726–751.
- Kazem, H. A. Renewable Energy in Oman: Status and Future Prospects. Renewable and Sustainable Energy Reviews 2011, 15 (8), 3465–3469. [CrossRef]
- GEM, [Global Energy Monitor]. GEM │ Ibri 2 Solar - Profile. https://www.gem.wiki/Ibri_2_Solar (accessed 2024-08-07).
- MEM, [Sultanate of Oman Minister of Energy and Minerals]. MEM │ Ibri 2 Solar IPP. https://mem.gov.om/en-us/Our-Business/Renewable-Energy-and-Hydrogen/Renewable-Energy-and-Hydrogen-Projects/ArtMID/732/ArticleID/1324/Ibri-2-Solar-IPP (accessed 2025-06-09).
- MEM, [Ministry of Energy and Minerals in the Sultanate of Oman]. MEM │ The Sultanate of Oman’s National Strategy for an Orderly Transition to Net Zero; MEM [Ministry of Energy and Minerals in the Sultanate of Oman]]: Muscat, Sultanate of Oman, 2022; pp 1–42. https://www.ea.gov.om/media/xdvpdu1w/oman-net-zero-report-2022_screen.pdf (accessed 2024-05-13).
- Marzouk, O. A. University Role in Promoting Leadership and Commitment to the Community. In Inaugural International Forum on World Universities; Davos, Switzerland, 2008.
- Al. Shibli, S. ICAO │ Oman Vision 2040: A National Blueprint for Sustainable Environment and Clean Energy. In ICAO 2025 Environmental Report - Skyward Action - Realizing Aviation’s Sustainable Future; ICAO [International Civil Aviation Organization]: Montreal, Canada, 2025; pp 257–259.
- Marzouk, O. A. Benchmarking Retention, Progression, and Graduation Rates in Undergraduate Higher Education Across Different Time Windows. Cogent Education 2025, 12 (1), 2498170. [CrossRef]
- OAAAQA, [Oman Authority for Academic Accreditation and Quality Assurance of Education]. Institutional Standards Assessment Manual (ISAM) - Institutional Accreditation: Stage 2, Version 1; Muscat, Sultanate of Oman, 2016. https://oaaaqa.gov.om/getattachment/c63fde93-150b-430d-a58f-9f68e6dc2390/Institutional%20Standards%20Assessment%20Manual.aspx (accessed 2024-10-08).
- Marzouk, O. A. English Programs for Non-English Speaking College Students. In 1st Knowledge Globalization Conference 2008 (KGLOBAL 2008); Sawyer Business School, Suffolk University: Boston, Massachusetts, USA, 2008; pp 1–8.
- OAAAQA, [Oman Authority for Academic Accreditation and Quality Assurance of Education]. Programme Standards Assessment Manual (PSAM) - Programme Accreditation, Version 1; Muscat, Sultanate of Oman, 2023. https://oaaaqa.gov.om/getattachment/4359b83e-5ab9-4147-8e73-1ff0f9adcfae/Programme%20Standards%20Assessment%20Manual.aspx (accessed 2024-10-08).
- Marzouk, O. A. Benchmarking the Trends of Urbanization in the Gulf Cooperation Council: Outlook to 2050. In 1st National Symposium on Emerging Trends in Engineering and Management (NSETEM’2017); WCAS [Waljat College of Applied Sciences], Muscat, Oman, 2017; pp 1–9.
- Om2040U, [Oman Vision 2040 Implementation Follow-up Unit]. Oman Vision 2040 │ Follow-up System. https://www.oman2040.om/organization?lang=en (accessed 2024-07-30).
- Om2040U, [Oman Vision 2040 Implementation Follow-up Unit]. Oman 2040 Vision Document; Om2040U [Oman Vision 2040 Implementation Follow-up Unit]: Muscat, Sultanate of Oman, 2020. https://www.oman2040.om/VisionDocument?lang=en (accessed 2023-10-06).
- Om2040U, [Oman Vision 2040 Implementation Follow-up Unit]. Oman Vision 2040 Implementation Follow-up Unit Website A Platform Promoting Transparency, Participation and Direct Communication. https://www.oman2040.om/news/6?lang=en (accessed 2025-06-29).
- Denney, D. EOR Potential in the Middle East: Current and Future Trends. J Pet Technol 2012, 64 (01), 70–73. [CrossRef]
- Oxford Analytica. Oman Will Innovate to Meet Growing Energy Needs. Expert Briefings 2017. [CrossRef]
- Nellist, M. D. Integration of Solar Steam Facilities with Existing Steam Generation Systems; OnePetro, 2018. [CrossRef]
- MacGregor, R. Q&A with Rod MacGregor, Chief Executive Officer and President, GlassPoint Solar. J Pet Technol 2013, 65 (10), 62–63. [CrossRef]
- Shell. Shell │ Petroleum Development Oman (PDO). https://www.shell.com.om/about-us/what-we-do/qalhat-lng-saoc.html (accessed 2025-06-28).
- PDO, [Petroleum Development Oman]. PDO │ A Shining Beacon: Miraah Solar Project. https://www.pdo.co.om/en/Pages/Sustainability/EnvironmentalProjects.aspx?proID=3 (accessed 2025-08-02).
- PDO, [Petroleum Development Oman]. PDO │ EcOman Centre. https://www.pdo.co.om/knowledgeworld/Pages/ecoman.aspx (accessed 2025-08-02).
- .
- Sammy, T. D.; Ehirim, E. O.; Ugi, F. B. Modeling the Effect of Temperature for Enhanced Oil Recovery (EOR) Using Steam Injection Technique. Journal of Newviews in Engineering and Technology 2023, 5 (1), 22–31.
- Lee, K. S. The Effects of Temperature-Dependent Fluids’ Viscosity on the Performance of a Polymer Flood in Reservoir Systems with an Elevated Temperature. Energy Sources, Part A: Recovery, Utilization, and Environmental Effects 2011, 33 (18), 1706–1714. [CrossRef]
- Lee, K. S. Nonisothermal Assessment on the Performance of Polymer Flood in the Reservoir with Elevated Temperature; OnePetro, 2010. [CrossRef]
- Askarova, A.; Turakhanov, A.; Markovic, S.; Popov, E.; Maksakov, K.; Usachev, G.; Karpov, V.; Cheremisin, A. Thermal Enhanced Oil Recovery in Deep Heavy Oil Carbonates: Experimental and Numerical Study on a Hot Water Injection Performance. Journal of Petroleum Science and Engineering 2020, 194, 107456. [CrossRef]
- Zhang, J. J. Chapter 2 - Rock Physical and Mechanical Properties. In Applied Petroleum Geomechanics; Zhang, J. J., Ed.; Gulf Professional Publishing, 2019; pp 29–83. [CrossRef]
- Beyer, L. A.; Clutsom, F. G. USGS │ Density and Porosity of Oil Reservoirs and Overlying Formations from Borehole Gravity Measurements, Gebo Oil Field, Hot Springs County, Wyoming; USGS [United States Geological Survey], United States Department of the Interior: Reston, Virginia, USA, 1978; pp 1–24. https://pubs.usgs.gov/oc/088/report.pdf (accessed 2025-08-02).
- Sun, J.; Wang, B.; Shu, Y.; Wang, Y.; Pan, Y.; Tian, C. The Numerical Simulation Study on the Heat Transfer Mechanism in Heavy Oil Reservoirs During In-Situ Combustion. Processes 2025, 13 (1), 56. [CrossRef]
- Sumeru, K.; Pramudantoro, T. P.; Setyawan, A. Experimental Investigation on the Performance of Residential Air Conditioning System Using Water Condensate for Subcooling. MATEC Web Conf. 2018, 197, 08002. [CrossRef]
- Tamainot-Telto, Z.; Metcalf, S. J.; Yande, N. N. Adsorption Solar Air Conditioning System for Singapore Climate. Energies 2022, 15 (18), 6537. [CrossRef]
- Kuma, Y.; Ozaki, A. Development of Central Air Conditioning Circulation System for Condominium Unit and Evaluation of the Indoor Environment in Summer. In Advances in Computer Science and Ubiquitous Computing; Park, J. S., Yang, L. T., Pan, Y., Park, J. J., Eds.; Springer Nature: Singapore, 2024; pp 49–55. [CrossRef]
- Negara, I. G. A.; Temaja, I. W.; Midiani, L. P. I.; Santosa, I. D. M. C.; Wirajati, I. G. A. B.; Arsana, M. E. Experimental Analysis of Thermodynamic Performance for 2.5 kW Split Inverter Air Conditioning Unit with R-410A. International Journal of Automotive and Mechanical Engineering 2025, 22 (2), 12388–12403. [CrossRef]
- Ross, S. A.; Cheah, L. Uncertainty Quantification in Life Cycle Assessments: Interindividual Variability and Sensitivity Analysis in LCA of Air-Conditioning Systems. Journal of Industrial Ecology 2017, 21 (5), 1103–1114. [CrossRef]
- Ahmad, A.; Prakash, O.; Kausher, R.; Kumar, G.; Pandey, S.; Hasnain, S. M. M. Parabolic Trough Solar Collectors: A Sustainable and Efficient Energy Source. Materials Science for Energy Technologies 2024, 7, 99–106. [CrossRef]
- Bees Group. Solar Heat for Industrial Process - SHIP. https://www.beesgroup.energy/en/services/solar-heat-for-industrial-process-ship (accessed 2025-04-20).
- EPA, [United States Environmental Protection Agency]. Solar Heating and Cooling Technologies. https://19january2017snapshot.epa.gov/rhc/solar-heating-and-cooling-technologies (accessed 2025-04-19).
- Marzouk, O. A.; Al Kamzari, A. A.; Al-Hatmi, T. K.; Al Alawi, O. S.; Al-Zadjali, H. A.; Al Haseed, M. A.; Al Daqaq, K. H.; Al-Aliyani, A. R.; Al-Aliyani, A. N.; Al Balushi, A. A.; Al Shamsi, M. H. Energy Analyses for a Steam Power Plant Operating under the Rankine Cycle. In First International Conference on Engineering, Applied Sciences and Management (UoB-IEASMA 2021); Al Kalbani, A. S., Kanna, R., EP Rabai, L. B., Ahmad, S., Valsala, S., Eds.; IEASMA Consultants LLP: Virtual, 2021; pp 11–22.
- Perez Cordoba, J. H.; Gonzalez Sanchez, E. D.; Martinez Vertel, J. J.; Muñoz Navarro, S. F. Surface Facilities Development for Steam Flue Gas Injection in a Colombian Heavy Oil Reservoir; OnePetro, 2020. [CrossRef]
- Rodríguez, J. R.; Naranjo, P. A. L.; Molina, J. W.; Molina, J. D.; Molina, F.; Matute, A. K. Unveiling Success From Cyclic Steam Injections for Heavy Oil Recovery in India and the Orinoco Oil Belt; OnePetro, 2024. [CrossRef]
- Marzouk, O. A.; Jul, W. A. M. H. R.; Al Jabri, A. M. K.; Al-ghaithi, H. A. M. A. Construction of a Small-Scale Vacuum Generation System and Using It as an Educational Device to Demonstrate Features of the Vacuum. International Journal of Contemporary Education 2018, 1 (2), 1–11. [CrossRef]
- Chien, S.-F. Empirical Correlations of Saturated Steam Properties. SPE Res Eng 1992, 7 (02), 295–303. [CrossRef]
- Marzouk, O. A. A Two-Step Computational Aeroacoustics Method Applied to High-Speed Flows. Noise Control Engineering Journal 2008, 56 (5), 396. [CrossRef]
- Egerton, A. C.; Callendar, G. S. On the Saturation Pressures of Steam (170° to 374° C.). Philosophical Transactions of the Royal Society of London. Series A, Containing Papers of a Mathematical or Physical Character 1997, 231 (694–706), 147–205. [CrossRef]
- Struchtrup, H. Thermodynamics and Energy Conversion, 1st ed.; Springer-Verlag: Berlin, Germany, 2014.
- ASME, [American Society of Mechanical Engineers]. ASME Steam Tables, Compact Edition; ASME [American Society of Mechanical Engineers]: New York City, New York, USA, 2007. [CrossRef]
- Verma, M. P. Steam Tables for Pure Water as an ActiveX Component in Visual Basic 6.0. Computers & Geosciences 2003, 29 (9), 1155–1163. [CrossRef]
- Marzouk, O. A. Thermo Physical Chemical Properties of Fluids Using the Free NIST Chemistry WebBook Database. Fluid Mechanics Research International Journal 2017, 1 (1). [CrossRef]
- Babita; Pant, U.; Meena, H.; Gupta, G.; Bapna, K.; Shivagan, D. D. Improved Realization of Ensemble of Triple Point of Water Cells at CSIR-NPL. MAPAN 2021, 36 (3), 615–628. [CrossRef]
- Wang, X.; Meijer, H. A. J. Ice–Liquid Isotope Fractionation Factors for 18O and 2H Deduced from the Isotopic Correction Constants for the Triple Point of Water. Isotopes in Environmental and Health Studies 2018, 54 (3), 304–311. [CrossRef]
- Hopwood, D. The New Hot Ticket [Concentrating Solar Thermal Power]. Engineering & Technology 2009, 4 (15), 48–51. [CrossRef]
- Marzouk, O. A. A Flight-Mechanics Solver for Aircraft Inverse Simulations and Application to 3D Mirage-III Maneuver. Global Journal of Control Engineering and Technology 2015, 1, 14–26.
- Núnez Bootello, J. P.; Mier-Torrecilla, M.; Doblaré, M.; Silva Pérez, M. Aerodynamics of New Solar Parametric Troughs: Two Dimensional and Three Dimensional Single Module Numerical Analysis. Solar Energy 2016, 135, 742–749. [CrossRef]
- Roschke, E. J. Wind Loading on Solar Concentrators: Some General Considerations; Contractor Report (CR) JPL-PUB-83-101; JPL [Jet Propulsion Laboratory]: Pasadena, California, USA, 1984; pp 1–174. https://ntrs.nasa.gov/api/citations/19840024844/downloads/19840024844.pdf (accessed 2025-08-02).
- Marzouk, O. A. Contrasting the Cartesian and Polar Forms of the Shedding-Induced Force Vector in Response to 12 Subharmonic and Superharmonic Mechanical Excitations. Fluid Dynamics Research 2010, 42 (3), 035507. [CrossRef]
- Donaldson, E. C.; Chilingarian, G. V.; Yen, T. F. Enhanced Oil Recovery, I: Fundamentals and Analyses; Elsevier: Amsterdam, The Netherlands, 1985.
- SLB, [Schlumberger Limited]. SLB │ Steam-Assisted Gravity Drainage. https://glossary.slb.com/en/terms/s/steam-assisted_gravity_drainage (accessed 2025-10-31).
- SLB, [Schlumberger Limited]. SLB │ Steamflood. https://glossary.slb.com/en/terms/s/steamflood (accessed 2025-10-31).
- SLB, [Schlumberger Limited]. SLB │ Huff and Puff. https://glossary.slb.com/en/terms/h/huff_and_puff (accessed 2025-10-31).
- SLB, [Schlumberger Limited]. SLB │ Cyclic Steam Injection. https://glossary.slb.com/en/terms/c/cyclic_steam_injection (accessed 2025-10-31).
- Johns, R. T. Oil Recovery. In Encyclopedia of Energy; Cleveland, C. J., Ed.; Elsevier: New York, 2004; pp 701–713. [CrossRef]
- Bera, A.; Vij, R. K.; Shah, S. Impact of Newly Implemented Enhanced Oil and Gas Recovery Screening Policy on Current Oil Production and Future Energy Supply in India. Journal of Petroleum Science and Engineering 2021, 207, 109196. [CrossRef]
- DOE, [United States Department of Energy]. DOE │ Enhanced Oil Recovery. https://www.energy.gov/fecm/enhanced-oil-recovery (accessed 2025-10-31).
- SLB, [Schlumberger Limited]. SLB │ Miscible Displacement. https://glossary.slb.com/en/terms/m/miscible_displacement (accessed 2025-10-31).
- Kalita, P.; Sharma, V.; Pandey, L.; Tiwari, P. Secondary and Tertiary Oil Recovery Processes. In Microbial Enhanced Oil Recovery: Principles and Potential; Pandey, L., Tiwari, P., Eds.; Springer: Singapore, 2022; pp 23–50. [CrossRef]
- Wang, Y.; Zhang, L.; Zhao, Y.; Zhou, X.; Lu, S.; Zhang, D.; Qin, J.; Lei, Z.; Tian, Y. Novel Approach to Enhancing Tight Oil Recovery Using N2-Assisted CO2 Flooding and Its Potential for CO2 Storage. Energy Fuels 2023, 37 (11), 7667–7678. [CrossRef]
- SLB, [Schlumberger Limited]. SLB │ Secondary Recovery. https://glossary.slb.com/terms/s/secondary_recovery (accessed 2025-10-31).
- Mohan, K.; Gupta, R.; Mohanty, K. K. Wettability Altering Secondary Oil Recovery in Carbonate Rocks. Energy Fuels 2011, 25 (9), 3966–3973. [CrossRef]
- SLB, [Schlumberger Limited]. SLB │ Primary Recovery. https://glossary.slb.com/en/terms/p/primary_recovery (accessed 2025-10-31).
- Solaimany-Nazar, A. R.; Zonnouri, A. Modeling of Asphaltene Deposition in Oil Reservoirs during Primary Oil Recovery. Journal of Petroleum Science and Engineering 2011, 75 (3), 251–259. [CrossRef]
- Hoy, M.; Derler, M.; Lobianco, L.; Knauhs, P.; Marschall, C. Artificial Lift Failures and Operational Challenges in a Chemical EOR Field - A Comparative Analysis of Sucker Rod Pumps and Electric Submersible Pumps; OnePetro, 2024. [CrossRef]
- SLB, [Schlumberger Limited]. SLB │ Artificial Lift. https://glossary.slb.com/en/terms/a/artificial_lift (accessed 2025-10-31).
- SLB, [Schlumberger Limited]. SLB │ Gas Lift. https://glossary.slb.com/en/terms/g/gas_lift (accessed 2025-10-31).
- Mokheimer, E. M. A.; Hamdy, M.; Abubakar, Z.; Shakeel, M. R.; Habib, M. A.; Mahmoud, M. A Comprehensive Review of Thermal Enhanced Oil Recovery: Techniques Evaluation. Journal of Energy Resources Technology 2018, 141 (030801). [CrossRef]
- Parshall, J. Challenges, Opportunities Abound for Artificial Lift. J Pet Technol 2013, 65 (03), 70–75. [CrossRef]
- Bucaram, S. M. Managing Artificial Lift. J Pet Technol 1994, 46 (04), 335–340. [CrossRef]
- von Flatern, R. Artificial Lift. Oilfield Review 2015, 27 (2), 1–2.
- Mahdi, M. A. A.; Amish, M.; Oluyemi, G. An Artificial Lift Selection Approach Using Machine Learning: A Case Study in Sudan. Energies 2023, 16 (6), 2853. [CrossRef]
- SLB, [Schlumberger Limited]. SLB │ Injection Well. https://glossary.slb.com/en/terms/i/injection_well (accessed 2025-10-31).
- SLB, [Schlumberger Limited]. SLB │ Gas Cap. https://glossary.slb.com/en/terms/g/gas_cap (accessed 2025-10-31).
- SLB, [Schlumberger Limited]. SLB │ Gas Injection. https://glossary.slb.com/en/terms/g/gas_injection (accessed 2025-10-31).
- Khan, W. A.; Rui, Z.; Hu, T.; Liu, Y.; Zhang, F.; Zhao, Y. Application of Machine Learning and Optimization of Oil Recovery and CO2 Sequestration in the Tight Oil Reservoir. SPE J. 2024, 29 (06), 2772–2792. [CrossRef]
- Yu, G.; Xu, F.; Cui, Y.; Li, X.; Kang, C.; Lu, C.; Li, S.; Bai, L.; Du, S. A New Method of Predicting the Saturation Pressure of Oil Reservoir and Its Application. International Journal of Hydrogen Energy 2020, 45 (55), 30244–30253. [CrossRef]
- Smith, D. D.; Ambastha, A.; Ayirala, S.; Bai, B.; Carreras, P.; Hampton, D.; Mohanty, K.; Rossen, W.; Schoeling, L.; Yousef, A. IOR and EOR Terminology Clarifications and Recommendations for the SPE Community; Society of Petroleum Engineers, 2024. [CrossRef]
- Shakeel, M.; Sagandykova, D.; Mukhtarov, A.; Dauyltayeva, A.; Maratbekkyzy, L.; Pourafshary, P.; Musharova, D. Maximizing Oil Recovery: Innovative Chemical EOR Solutions for Residual Oil Mobilization in Kazakhstan’s Waterflooded Sandstone Oilfield. Heliyon 2024, 10 (7). [CrossRef]
- Thomas, S. Enhanced Oil Recovery - An Overview. Oil & Gas Science and Technology - Rev. IFP 2008, 63 (1), 9–19. [CrossRef]
- Tirado, A.; Félix, G.; Trejo, F.; Varfolomeev, M. A.; Yuan, C.; Nurgaliev, D. K.; Sámano, V.; Ancheyta, J. Properties of Heavy and Extra-Heavy Crude Oils. In Catalytic In-Situ Upgrading of Heavy and Extra-Heavy Crude Oils; John Wiley & Sons, Ltd., 2023; pp 1–38. [CrossRef]
- Huc, A.-Y. Heavy Crude Oils: From Geology to Upgrading : An Overview; Editions TECHNIP, 2011.
- El Bassoussi, A. A.; El-sabagh, S. M.; Harb, F. M.; El Nady, M. M. Characterization and Correlation of Crude Oils from Some Wells in the North Western Desert, Egypt. Petroleum Science and Technology 2018, 36 (5), 384–391. [CrossRef]
- Alizadeh, S.; Ta, S.; Ray, A. K.; Lakshminarayanan, S. Determination of Density and Viscosity of Crude Oil Samples from FTIR Data Using Multivariate Regression, Variable Selection and Classification. IFAC-PapersOnLine 2022, 55 (7), 845–850. [CrossRef]
- Correa Pabón, R. E.; Souza Filho, C. R. de. Crude Oil Spectral Signatures and Empirical Models to Derive API Gravity. Fuel 2019, 237, 1119–1131. [CrossRef]
- Lammoglia, T.; Filho, C. R. de S. SATELLITE DETERMINATION OF API GRAVITY AND SARA COMPONENTS OF OFFSHORE PETROLEUM SEEPS. Brazilian Journal of Geophysics 2012, 30 (4), 419–430. [CrossRef]
- Zuo, J. Y.; Mullins, O. C.; Freed, D.; Zhang, D. A Simple Relation between Solubility Parameters and Densities for Live Reservoir Fluids. J. Chem. Eng. Data 2010, 55 (9), 2964–2969. [CrossRef]
- Farkha, S. A.; Zangana, M. H. S.; Shoham, O. Evaluation of Compositional Models and PVT Correlations for Iraqi Light Crude Oils Properties. Energy Science & Engineering 2023, 11 (7), 2654–2667. [CrossRef]
- Poirier, L.; Nelson, J.; Leong, D.; Berhane, L.; Hajdu, P.; Lopez-Linares, F. Application of ICP-MS and ICP-OES on the Determination of Nickel, Vanadium, Iron, and Calcium in Petroleum Crude Oils via Direct Dilution. Energy Fuels 2016, 30 (5), 3783–3790. [CrossRef]
- Solar Thermal Conversion Technologies for Industrial Process Heating, 1st ed.; Arjunan, T. V., Selvaraj, V., Matheswaran, M. M., Eds.; CRC Press: Boca Raton, Florida, USA, 2023. [CrossRef]
- GlassPoint. GlassPoint projects. https://www.glasspoint.com/projects (accessed 2025-05-24).
- GlassPoint. GlassPoint technology. https://www.glasspoint.com/technology (accessed 2025-05-24).
- SHC, [Solar Heating and Cooling Programme]. Solar Heat for Industrial Processes (SHIP); Technology Position Paper; IEA [International Energy Agency]: Paris, France, 2024; pp 1–9. https://www.iea-shc.org/Data/Sites/1/publications/IEA-SHC-Task64-Technology-Position-Paper-SHIP-2024-01.pdf (accessed 2025-04-18).
- Kalogirou, S. A. Solar Thermal Collectors and Applications. Progress in Energy and Combustion Science 2004, 30 (3), 231–295. [CrossRef]
- Barone, G.; Buonomano, A.; Forzano, C.; Palombo, A. Chapter 6 - Solar Thermal Collectors. In Solar Hydrogen Production; Calise, F., D’Accadia, M. D., Santarelli, M., Lanzini, A., Ferrero, D., Eds.; Academic Press, 2019; pp 151–178. [CrossRef]
- Goswami, D. Y. Principles of Solar Engineering, 4th ed.; CRC Press: Boca Raton, Florida, USA, 2022. [CrossRef]
- Sheikholeslami, M. Solar Thermal Systems and Applications: New Design Techniques for Improved Thermal Performance; Elsevier: London, UK, 2024.
- ASI, [Atlantica Sustainable Infrastructure ltd.]. ASI │ Powering the energy transition - Mojave. https://atlantica.com/business/assets/asset/mojave/ (accessed 2025-11-01).
- CEC, [California Energy. CEC │ Mojave Solar Project (Abengoa). https://www.energy.ca.gov/powerplant/solar-thermal/mojave-solar-project-abengoa (accessed 2025-11-01).
- Gallego, A. J.; Macías, M.; de Castilla, F.; Camacho, E. F. Mathematical Modeling of the Mojave Solar Plants. Energies 2019, 12 (21), 4197. [CrossRef]
- Tagle-Salazar, P. D.; Nigam, K. D. P.; Rivera-Solorio, C. I. Parabolic Trough Solar Collectors: A General Overview of Technology, Industrial Applications, Energy Market, Modeling, and Standards. Green Processing and Synthesis 2020, 9 (1), 595–649. [CrossRef]
- Fernández-García, A.; Zarza, E.; Valenzuela, L.; Pérez, M. Parabolic-Trough Solar Collectors and Their Applications. Renewable and Sustainable Energy Reviews 2010, 14 (7), 1695–1721. [CrossRef]
- Paetzold, J.; Cochard, S.; Fletcher, D. F.; Vassallo, A. Wind Engineering Analysis of Parabolic Trough Collectors to Optimise Wind Loads and Heat Loss. Energy Procedia 2015, 69, 168–177. [CrossRef]
- NREL, [United States National Renewable Energy Laboratory]. NREL │ Parabolic Trough Solar Thermal Electric Power Plants; NREL [United States National Renewable Energy Laboratory], 2006. https://docs.nrel.gov/docs/fy06osti/40211.pdf (accessed 2025-11-01).
- Mishra, S. Solar Square │ Parabolic Trough Collector: Working, Benefits, And Drawbacks. Rooftop Solar for your home and more - Blog | SolarSquare. https://solarsquare.in/blog/parabolic-trough-collector/ (accessed 2025-11-01).
- Natraj; Rao, B. N.; Reddy, K. S. Wind Load and Structural Analysis for Standalone Solar Parabolic Trough Collector. Renewable Energy 2021, 173, 688–703. [CrossRef]
- Marzouk, O. A.; Nayfeh, A. H. Simulation, Analysis, and Explanation of the Lift Suppression and Break of 2:1 Force Coupling Due to in-Line Structural Vibration. In 49th AIAA/ASME/ASCE/AHS/ASC Structures, Structural Dynamics, and Materials Conference; AIAA [American Institute of Aeronautics and Astronautics]: Schaumburg, Illinois, USA, 2008; p AIAA 2008-2309. [CrossRef]
- Marzouk, O. A. Directivity and Noise Propagation for Supersonic Free Jets. In 46th AIAA Aerospace Sciences Meeting and Exhibit; AIAA [American Institute of Aeronautics and Astronautics]: Reno, Nevada, USA, 2008; p AIAA 2008-23. [CrossRef]
- Marzouk, O. A. Accurate Prediction of Noise Generation and Propagation. In 18th Engineering Mechanics Division Conference of the American Society of Civil Engineers (ASCE-EMD); Zenodo: Blacksburg, Virginia, USA, 2007; pp 1–6.
- Marzouk, O. A. Solar Heat for Industrial Processes (SHIP): An Overview of Its Categories and a Review of Its Recent Progress. Solar 2025, 5 (4), 46. [CrossRef]
- GlassPoint. GlassPoint │ Maaden Solar I. https://www.glasspoint.com/projects/maaden-solar (accessed 2025-08-11).
- Kar, M. K.; Ӧnal, M. A. R.; Borra, C. R. Alumina Recovery from Bauxite Residue: A Concise Review. Resources, Conservation and Recycling 2023, 198, 107158. [CrossRef]
- Donoghue, A. M.; Frisch, N.; Olney, D. Bauxite Mining and Alumina Refining: Process Description and Occupational Health Risks. Journal of Occupational and Environmental Medicine 2014, 56, S12. [CrossRef]
- Waghmare, S. A.; Gulhane, N. P. Optical Evaluation of Compound Parabolic Collector with Low Acceptance Angle. Optik 2017, 149, 359–371. [CrossRef]
- Schizas, C. N.; Kalogirou, S.; Neocleous, C. A Comparative Study of Methods for Estimating Intercept Factor of Parabolic Trough Collectors. In Engineering Applications of Neural Networks Conference; London, UK, 1996.
- Christian, J. M.; Ho, C. K. Finite Element Modeling and Ray Tracing of Parabolic Trough Collectors for Evaluation of Optical Intercept Factors With Gravity Loading; American Society of Mechanical Engineers Digital Collection, 2012; pp 577–585. [CrossRef]
- Kosić, T.; Svetel, I. Technological and Economical Analysis of Curved Glass Structure. Structural Integrity and Life 2022, 22 (2), 175–181.
- Louter, C.; Bos, F.; Belis, J.; Lebet, J.-P. Challenging Glass 4 & COST Action TU0905 Final Conference; CRC Press: Boca Raton, Florida, USA, 2014.
- Li, J.; Wang, Z.; Li, J.; Lei, D. Vacuum Reliability Analysis of Parabolic Trough Receiver. Solar Energy Materials and Solar Cells 2012, 105, 302–308. [CrossRef]
- Pourbafrani, M.; Ghadamian, H.; Aminy, M.; Moghadasi, M.; Mardani, M.; Akrami, M.; Khaki, A. H.; Sadr, S. M. K. Improving the Energy Performance of an Evacuated Tube Solar Collector Water Heater Using Compound Parabolic Concentrator: An Experimental Study. Journal of Renewable Energy and Environment 2024, 11 (2), 58–66. [CrossRef]
- Bierman, B.; Treynor, C.; O’Donnell, J.; Lawrence, M.; Chandra, M.; Farver, A.; Von Behrens, P.; Lindsay, W. Performance of an Enclosed Trough EOR System in South Oman. Energy Procedia 2014, 49, 1269–1278. [CrossRef]
- GlassPoint. Amal I project in Oman. https://www.glasspoint.com/projects/amal (accessed 2025-05-24).
- Wilson, A. Pilot Steam Generator Uses Solar Energy Successfully for EOR Operations in Oman. J Pet Technol 2015, 67 (06), 111–113. [CrossRef]
- GlassPoint. Amal II project in Oman. https://www.glasspoint.com/projects/amal2 (accessed 2025-05-24).
- Bierman, B.; Al-Lawatia, H.; DiFilippo, M.; O’Donnell, J. Deploying Enclosed Trough for Thermal EOR at Commercial Scale. AIP Conference Proceedings 2018, 2033 (1), 030002. [CrossRef]
- GlassPoint. Miraah project in Oman. https://www.glasspoint.com/projects/miraah (accessed 2025-05-24).
- Madaeni, S. H.; Sioshansi, R.; Denholm, P. Estimating the Capacity Value of Concentrating Solar Power Plants With Thermal Energy Storage: A Case Study of the Southwestern United States. IEEE Transactions on Power Systems 2013, 28 (2), 1205–1215. [CrossRef]
- Falahati, B.; Kargarian, A.; Fu, Y. Timeframe Capacity Factor Reliability Model for Isolated Microgrids with Renewable Energy Resources. In 2012 IEEE Power and Energy Society General Meeting; 2012; pp 1–8. [CrossRef]
- Kamnapure, N. R.; Reddy, K. S. Optical Analysis of Solar Parabolic Trough Collector with Flat Concentrating Photovoltaic Receiver. Applied Mechanics and Materials 2014, 592–594, 2396–2403. [CrossRef]
- Giovannetti, F.; Horta, P. IEA SHC │ Comparison of Process Heat Collectors with Respect to Technical and Economic Conditions; Technical Report A.2.1; IEA SHC [International Energy Agency - Solar Heating and Cooling Programme]: Paris, France, 2016; pp 1–36. https://w.iea-shc.org/Data/Sites/1/publications/Task%2049%20Deliverable%20A2%201_End%20(3).pdf (accessed 2025-08-02).
- Quaschning, V.; Kistner, R.; Ortmanns, W. Influence of Direct Normal Irradiance Variation on the Optimal Parabolic Trough Field Size: A Problem Solved with Technical and Economical Simulations. J. Sol. Energy Eng 2002, 124 (2), 160–164. [CrossRef]
- Blanc, P.; Espinar, B.; Geuder, N.; Gueymard, C.; Meyer, R.; Pitz-Paal, R.; Reinhardt, B.; Renné, D.; Sengupta, M.; Wald, L.; Wilbert, S. Direct Normal Irradiance Related Definitions and Applications: The Circumsolar Issue. Solar Energy 2014, 110, 561–577. [CrossRef]
- Lindberg, O.; Lingfors, D. Oversizing Co-Locatedwind and Solar Parks to Increase the Capacity Factor. In 21st Wind & Solar Integration Workshop (WIW 2022); 2022; Vol. 2022, pp 546–552. [CrossRef]
- Grossmann, W.; Grossmann, I.; Steininger, K. W. Solar Electricity Supply Isolines of Generation Capacity and Storage. Proceedings of the National Academy of Sciences 2015, 112 (12), 3663–3668. [CrossRef]
- Strickland, J. Space Solar vs Base Load Ground Solar and Wind Power. Online Journal of Space Communication 2021, 9 (16).
- Marzouk, O. A. Validating a Model for Bluff-Body Burners Using the HM1 Turbulent Nonpremixed Flame. Journal of Advanced Thermal Science Research 2016, 3 (1), 12–23. [CrossRef]
- Innovation Norway. Innovation Norway │ Conversion Guidelines - Greenhouse Gas Emissions; Innovation Norway: Oslo, Norway, 2019; pp 1–3. https://www.eeagrants.gov.pt/media/2776/conversion-guidelines.pdf (accessed 2025-08-25).
- Kvenvolden, K. A. A Review of the Geochemistry of Methane in Natural Gas Hydrate. Organic Geochemistry 1995, 23 (11), 997–1008. [CrossRef]
- Didmanidze, O. N.; Afanasev, A. S.; Hakimov, R. T. Natural Gas Methane Number and Its Influence on the Gas Engine Working Process Efficiency. Записки Гoрнoгo института 2021, 251 (eng), 730–737.
- Marzouk, O. A.; Huckaby, E. D. A Comparative Study of Eight Finite-Rate Chemistry Kinetics for CO/H2 Combustion. Engineering Applications of Computational Fluid Mechanics 2010, 4 (3), 331–356. [CrossRef]
- Maia, J. L.; da Silva Neves, M. V. Method of Equivalent CO2 Emissions Sources Identification and Quantification of Offshore Petroleum Production Units; OnePetro, 2010. [CrossRef]
- Anwar, S.; Carroll, J. J. Carbon Dioxide Thermodynamic Properties Handbook: Covering Temperatures from -20 Degrees to 250 Degrees Celcius and Pressures up to 1000 Bar; John Wiley & Sons: Salem, Massachusetts, USA, 2011.
- NRG Energy. NRG Energy │ Energy conversion calculator. NRG Energy. https://www.nrg.com/resources/energy-tools/energy-conversion-calculator.html (accessed 2025-08-02).
- Marzouk, O. A.; Huckaby, E. D. Modeling Confined Jets with Particles and Swril. In Machine Learning and Systems Engineering; Ao, S.-I., Rieger, B., Amouzegar, M. A., Eds.; Lecture Notes in Electrical Engineering; Springer Netherlands: Dordrecht, Netherlands, 2010; Vol. 68, pp 243–256. [CrossRef]
- Marzouk, O. A. InvSim Algorithm for Pre-Computing Airplane Flight Controls in Limited-Range Autonomous Missions, and Demonstration via Double-Roll Maneuver of Mirage III Fighters. Scientific Reports 2025, 15, 23382. [CrossRef]
- de Obeso, J. C.; Awolayo, A. N.; Nightingale, M. J.; Tan, C.; Tutolo, B. M. Experimental Study on Plagioclase Dissolution Rates at Conditions Relevant to Mineral Carbonation of Seafloor Basalts. Chemical Geology 2023, 620, 121348. [CrossRef]
- GlassPoint. Map of the Amal Oil Field in Oman. https://images.squarespace-cdn.com/content/v1/622ba70eb380531fbf6cb5df/59876962-14d9-4f99-9a6d-b0ada0043a4b/miraah_map.jpg (accessed 2025-05-22).
- Google. Google Maps │ Amal Oil Field. Google Maps. https://maps.app.goo.gl/WRdqNukjoiUs4RFt6 (accessed 2025-08-02).
- OSMF, [OpenStreetMap Foundation]. OpenStreetMap │ Miraah Solar Farm. OpenStreetMap. https://www.openstreetmap.org/#map=17/18.349281/55.684590 (accessed 2025-08-02).
- OSMF, [OpenStreetMap Foundation]. OpenStreetMap │ Copyright and License - Open Data Commons Open Database License (ODbL). OpenStreetMap. https://www.openstreetmap.org/copyright (accessed 2025-07-31).
- GlassPoint. Sketch of looped enclosed parabolic troughs. https://images.squarespace-cdn.com/content/v1/622ba70eb380531fbf6cb5df/c13e3a89-4a12-460b-bfaa-da0a71f3284a/tech1.jpg (accessed 2025-05-24).
- GlassPoint. Sketch illustrating the structural advantage (wind protection) of enclosed troughs compared to open troughs. https://images.squarespace-cdn.com/content/v1/622ba70eb380531fbf6cb5df/e732593b-4f97-4cfd-8c3d-877227f7a193/wind.jpg (accessed 2025-05-24).
- Zhang, Z.; Sun, J.; Wang, L.; Wei, J. J. Multiphysics-Coupled Study of Wind Load Effects on Optical Performance of Parabolic Trough Collector. Solar Energy 2020, 207, 1078–1087. [CrossRef]
- Natraj; Rao, B. N.; Reddy, K. S. Wind Load and Structural Analysis for Standalone Solar Parabolic Trough Collector. Renewable Energy 2021, 173, 688–703. [CrossRef]
- GlassPoint. Comparison of area needs for PV solar system solar tower system or open trough, and enclosed parabolic troughs. https://images.squarespace-cdn.com/content/v1/622ba70eb380531fbf6cb5df/225ab3da-e05a-488b-901f-b90f65a1a5ac/glasspoint-scale-graphic-revised.png (accessed 2025-05-24).
- Das, P.; V.p., C. A Review on Recent Advances in Hybrid Solar Updraft Tower Plants: Challenges and Future Aspects. Sustainable Energy Technologies and Assessments 2023, 55, 102978. [CrossRef]
- Zhou, X.; Xu, Y. Solar Updraft Tower Power Generation. Solar Energy 2016, 128, 95–125. [CrossRef]
- Liang, Y.; Wang, D.; Li, Y.; Zhang, Q.; Suolang, B.; Yuan, X.; Liu, Y. Novel Approach to Remote Rural Heating: Direct Coupled Photovoltaic Electric Heater Underfloor Heating System with Phase Change Materials. Applied Thermal Engineering 2024, 250, 123525. [CrossRef]
- GlassPoint. Photo of the Amal I project in Oman. https://images.squarespace-cdn.com/content/v1/622ba70eb380531fbf6cb5df/1647980305001-LC69P8W8OWNV4OCSF1AD/project2.jpg (accessed 2025-05-24).
- GlassPoint. Photo of the Amal I greenhouse in Oman. https://images.squarespace-cdn.com/content/v1/622ba70eb380531fbf6cb5df/a5903cf7-be4d-41f6-95fa-441bc534c460/GlassPoint-PDO-13.jpg (accessed 2025-05-24).
- PVsyst. PVsyst │ GCR - Ground coverage Ratio. https://www.pvsyst.com/help-pvsyst7/gcr.htm (accessed 2025-08-02).
- Jensen, A. R.; Sifnaios, I. Modeling, Validation, and Analysis of a Concentrating Solar Collector Field Integrated with a District Heating Network. Solar 2022, 2 (2), 234–250. [CrossRef]
- GlassPoint. Photo of the Amal II greenhouse in Oman. https://images.squarespace-cdn.com/content/622ba70eb380531fbf6cb5df/1647980963994-D2FX6CA6KIDJHJ7EL260/Advance_RD.jpg (accessed 2025-05-24).
- GlassPoint. Photo of the night installation at the Amal II project in Oman. https://images.squarespace-cdn.com/content/v1/622ba70eb380531fbf6cb5df/a3f25ef3-1760-47fd-b34f-6b2d63716b3b/Advance_RD2.jpg (accessed 2025-05-24).
- Google Maps │ Miraah Project. Google Maps. https://maps.app.goo.gl/ZpMJPj7A2S2ZSNZL6 (accessed 2025-08-02).
- GlassPoint. Aerial drone photo of the Miraah project in Oman. https://images.squarespace-cdn.com/content/v1/622ba70eb380531fbf6cb5df/91913927-47bf-43ab-af89-ce55b5ff5bce/Miraah_drone.jpg (accessed 2025-05-24).
- GlassPoint. Front photo of the Miraah project in Oman. https://images.squarespace-cdn.com/content/622ba70eb380531fbf6cb5df/1647368082815-T4QPLQM1BZGL3R2KXU2W/miraah_hero.jpg (accessed 2025-05-24).
- Google. Google │ Brand Resource Center -Products and Services - Geo Guidelines. Brand Resource Center. https://about.google/brand-resource-center/products-and-services/geo-guidelines (accessed 2025-08-02).
- DOE, [United States Department of Energy]. DOE │ Geothermal Basics (and footprint comparison for different power technologies). https://www.energy.gov/eere/geothermal/geothermal-basics (accessed 2025-06-27).
- Hosseini, M.; Bagheri, H. Improving the Resolution of Solar Energy Potential Maps Derived from Global DSMs for Rooftop Solar Panel Placement Using Deep Learning. Heliyon 2025, 11 (1). [CrossRef]
- Szewczyk, R. Management of Solar Energy. Geomatics, Landmanagement and Landscape 2016, no. 1. [CrossRef]
- Bierman, B.; O’Donnell, J.; Burke, R.; McCormick, M.; Lindsay, W. Construction of an Enclosed Trough EOR System in South Oman. Energy Procedia 2014, 49, 1756–1765. [CrossRef]
- Munirasu, S.; Haija, M. A.; Banat, F. Use of Membrane Technology for Oil Field and Refinery Produced Water Treatment—A Review. Process Safety and Environmental Protection 2016, 100, 183–202. [CrossRef]
- Adjovu, G. E.; Stephen, H.; James, D.; Ahmad, S. Measurement of Total Dissolved Solids and Total Suspended Solids in Water Systems: A Review of the Issues, Conventional, and Remote Sensing Techniques. Remote Sensing 2023, 15 (14), 3534. [CrossRef]
- Heijerick, D. G.; Janssen, C. R.; Coen, W. M. D. The Combined Effects of Hardness, pH, and Dissolved Organic Carbon on the Chronic Toxicity of Zn to D. Magna: Development of a Surface Response Model. Arch. Environ. Contam. Toxicol. 2003, 44 (2), 0210–0217. [CrossRef]
- Scheuer, F.; Souza, M. P. de; Sterzelecki, F. C.; Cipriano, F. dos S.; Cerqueira, V. R.; Martins, M. L. Effect of total hardness of water on juvenile mullets (Mugil Liza) raised in fresh water. Acta Veterinaria Brasilica 2023, 17 (1). [CrossRef]
- Rashid, K. H.; Khadom, A. A. Sodium Sulfite as an Oxygen Scavenger for the Corrosion Control of Mild Steel in Petroleum Refinery Wastewater: Optimization, Mathematical Modeling, Surface Morphology and Reaction Kinetics Studies. Reac Kinet Mech Cat 2020, 129 (2), 1027–1046. [CrossRef]
- Javaherdashti, R.; Nwaoha, C.; Tan, H. Corrosion and Materials in the Oil and Gas Industries; CRC Press: Boca Raton, Florida, USA, 2016.
- Marzouk, O. A. Cantera-Based Python Computer Program for Solving Steam Power Cycles with Superheating. International Journal of Emerging Technology and Advanced Engineering 2023, 13 (3), 63–73.
- Redowan, M.; Sami, T. M.; Islam, A. Design and Implementation of Solar Heater System. Thesis, Bachelor of Science in Electrical and Electronic Engineering, BRAC University, Dhaka, Bangladesh, 2016. http://hdl.handle.net/10361/7727 (accessed 2025-08-03).
- Biencinto, M.; González, L.; Valenzuela, L. Using Time-Windowed Solar Radiation Profiles to Assess the Daily Uncertainty of Solar Thermal Electricity Production Forecasts. Journal of Cleaner Production 2022, 379, 134821. [CrossRef]
- Marzouk, O. A. Airfoil Design Using Genetic Algorithms. In The 2007 International Conference on Scientific Computing (CSC’07), The 2007 World Congress in Computer Science, Computer Engineering, and Applied Computing (WORLDCOMP’07); CSREA Press: Las Vegas, Nevada, USA, 2007; pp 127–132.
- Azzouzi, M. Control of Solar Water Heater Design. In 2011 10th International Conference on Environment and Electrical Engineering; 2011; pp 1–5. [CrossRef]
- Marzouk, O. A. Flow Control Using Bifrequency Motion. Theoretical and Computational Fluid Dynamics 2011, 25 (6), 381–405. [CrossRef]
- Alaskaree, E. H.; Breesam, Y. F. The Impact of Electronic Control Systems on Improving the Performance of the Solar Heater. Engineering and Technology Journal 2024, 42 (7), 869–884.
- Zou, Y.; Li, C. A Hydraulically Activated Power Launching Method for Pigs for Gas-Gathering Pipeline Networks in Gas Fields. Journal of Pipeline Systems Engineering and Practice 2022, 13 (2), 04022007. [CrossRef]
- Beavers, J.; Bubenik, T. A. 12 - Stress Corrosion Cracking. In Trends in Oil and Gas Corrosion Research and Technologies; El-Sherik, A. M., Ed.; Woodhead Publishing Series in Energy; Woodhead Publishing: Boston, 2017; pp 295–314. [CrossRef]
- Katona, R. M.; Taylor, J. M.; McCready, T. A.; Bryan, C. R.; Schaller, R. F. Towards Understanding Stress Corrosion Cracking of Austenitic Stainless Steels Exposed to Realistic Sea Salt Brines. Corrosion Science 2024, 232, 111992. [CrossRef]
- SSINA, [Specialty Steel Industry of North America]. SSINA │ Chloride Stress Corrosion Cracking. https://www.ssina.com/education/corrosion/chloride-stress-corrosion-cracking/ (accessed 2025-08-03).
- Venkatramani, A. V.; Okuno, R. Steam-Oil Ratio in Steam-Solvent Coinjection Simulation for Homogeneous and Heterogeneous Bitumen Reservoirs. J. Energy Resour. Technol 2018, 140 (112903). [CrossRef]
- Ighalo, J. O.; Adeniyi, A. G. Factor Effects and Interactions in Steam Reforming of Biomass Bio-Oil. Chem. Pap. 2020, 74 (5), 1459–1470. [CrossRef]
- Hart, A.; Leeke, G.; Greaves, M.; Wood, J. Downhole Heavy Crude Oil Upgrading Using CAPRI: Effect of Steam upon Upgrading and Coke Formation. Energy Fuels 2014, 28 (3), 1811–1819. [CrossRef]
- SLB, [Schlumberger Limited]. SLB │ Steam-Oil Ratio. https://glossary.slb.com/terms/s/steam-oil_ratio (accessed 2025-10-31).
- GER, [General Energy Recovery Inc.]. GER │ Steaming – Reducing Water Usage Through Improved Steam-to-Oil Ratio (SOR). https://www.geri.com/news/steam_to_oil_reduced_water_usage/ (accessed 2025-10-31).
- Goyal, K. L.; Kumar, S. Chapter 11 Steamflooding for Enhanced Oil Recovery. In Developments in Petroleum Science; Donaldson, E. C., Chilingarian, G. V., Yen, T. F., Eds.; Enhanced Oil Recovery, II; Elsevier, 1989; Vol. 17, pp 317–349. [CrossRef]
- Nie, R.-S.; Wang, Y.-M.; Kang, Y.-L.; Jia, Y.-L. A Steam Rising Model of Steam-Assisted Gravity Drainage Production for Heavy Oil Reservoirs. Energy Exploration & Exploitation 2020, 38 (4), 801–818. [CrossRef]
- Adibhatla, S.; Kaushik, S. C. Energy, Exergy and Economic (3E) Analysis of Integrated Solar Direct Steam Generation Combined Cycle Power Plant. Sustainable Energy Technologies and Assessments 2017, 20, 88–97. [CrossRef]
- Zhang, H.; Baeyens, J.; Cáceres, G.; Degrève, J.; Lv, Y. Thermal Energy Storage: Recent Developments and Practical Aspects. Progress in Energy and Combustion Science 2016, 53, 1–40. [CrossRef]
- Cabeza, L. F. 2 - Advances in Thermal Energy Storage Systems: Methods and Applications. In Advances in Thermal Energy Storage Systems (Second Edition); Cabeza, L. F., Ed.; Woodhead Publishing Series in Energy; Woodhead Publishing, 2021; pp 37–54. [CrossRef]
- Werner, S. International Review of District Heating and Cooling. Energy 2017, 137, 617–631. [CrossRef]
- Lund, H.; Østergaard, P. A.; Chang, M.; Werner, S.; Svendsen, S.; Sorknæs, P.; Thorsen, J. E.; Hvelplund, F.; Mortensen, B. O. G.; Mathiesen, B. V.; Bojesen, C.; Duic, N.; Zhang, X.; Möller, B. The Status of 4th Generation District Heating: Research and Results. Energy 2018, 164, 147–159. [CrossRef]
- Karni, J. SOLAR-THERMAL POWER GENERATION. Annual Review of Heat Transfer 2012, 15. [CrossRef]
- Tsoutsos, T.; Gekas, V.; Marketaki, K. Technical and Economical Evaluation of Solar Thermal Power Generation. Renewable Energy 2003, 28 (6), 873–886. [CrossRef]
- Sharma, C.; Sharma, A. K.; Mullick, S. C.; Kandpal, T. C. Assessment of Solar Thermal Power Generation Potential in India. Renewable and Sustainable Energy Reviews 2015, 42, 902–912. [CrossRef]
- Kamfa, I.; Fluch, J.; Bartali, R.; Baker, D. Solar-Thermal Driven Drying Technologies for Large-Scale Industrial Applications: State of the Art, Gaps, and Opportunities. International Journal of Energy Research 2020, 44 (13), 9864–9888. [CrossRef]
- Eswara, A. R.; Ramakrishnarao, M. Solar Energy in Food Processing—a Critical Appraisal. J Food Sci Technol 2013, 50 (2), 209–227. [CrossRef]
- Saxena, A.; Goel, V.; Karakilcik, M. Solar Food Processing and Cooking Methodologies. In Applications of Solar Energy; Tyagi, H., Agarwal, A. K., Chakraborty, P. R., Powar, S., Eds.; Springer: Singapore, 2018; pp 251–294. [CrossRef]
- Lee, M.; Hong, T.; Koo, C. An Economic Impact Analysis of State Solar Incentives for Improving Financial Performance of Residential Solar Photovoltaic Systems in the United States. Renewable and Sustainable Energy Reviews 2016, 58, 590–607. [CrossRef]
- Sarzynski, A.; Larrieu, J.; Shrimali, G. The Impact of State Financial Incentives on Market Deployment of Solar Technology. Energy Policy 2012, 46, 550–557. [CrossRef]
- Matisoff, D. C.; Johnson, E. P. The Comparative Effectiveness of Residential Solar Incentives. Energy Policy 2017, 108, 44–54. [CrossRef]
Figure 1.
Relationship between the density or specific gravity and the American Petroleum Institute gravity degree.
Figure 1.
Relationship between the density or specific gravity and the American Petroleum Institute gravity degree.
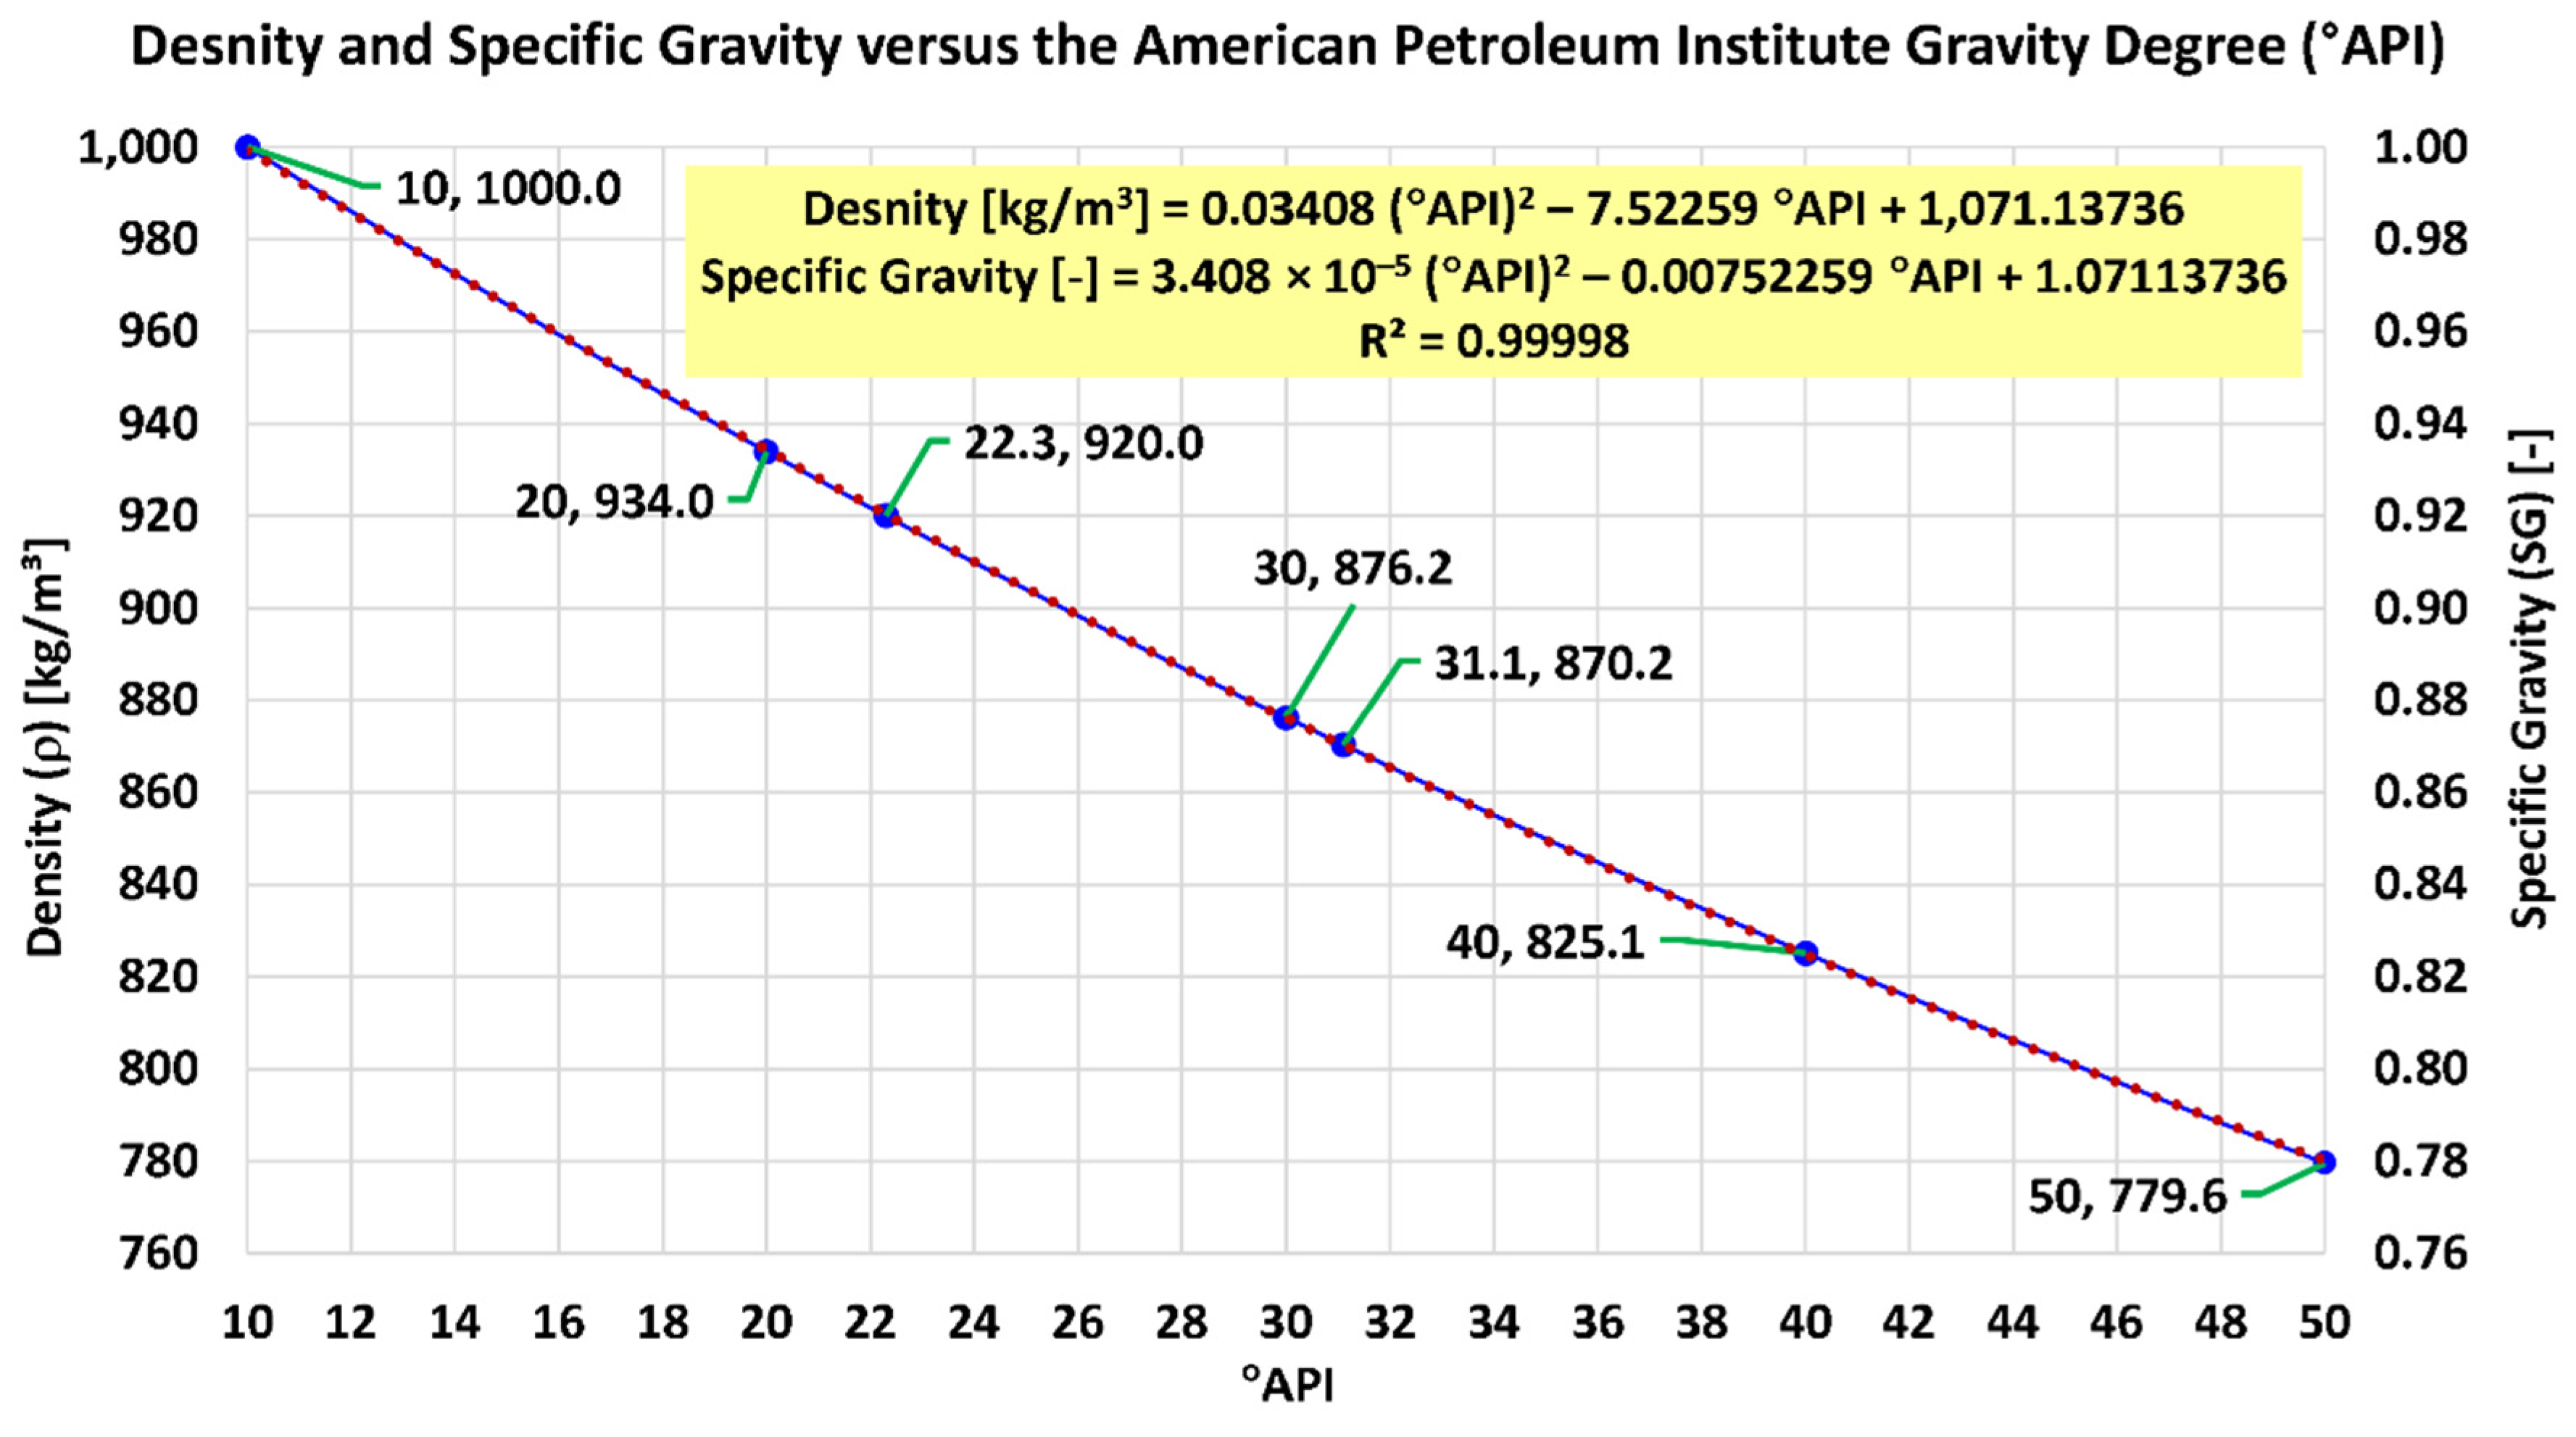
Figure 2.
An illustrative map for Oman and the Amal oil field location (© GlassPoint, reproduced with permission).
Figure 2.
An illustrative map for Oman and the Amal oil field location (© GlassPoint, reproduced with permission).
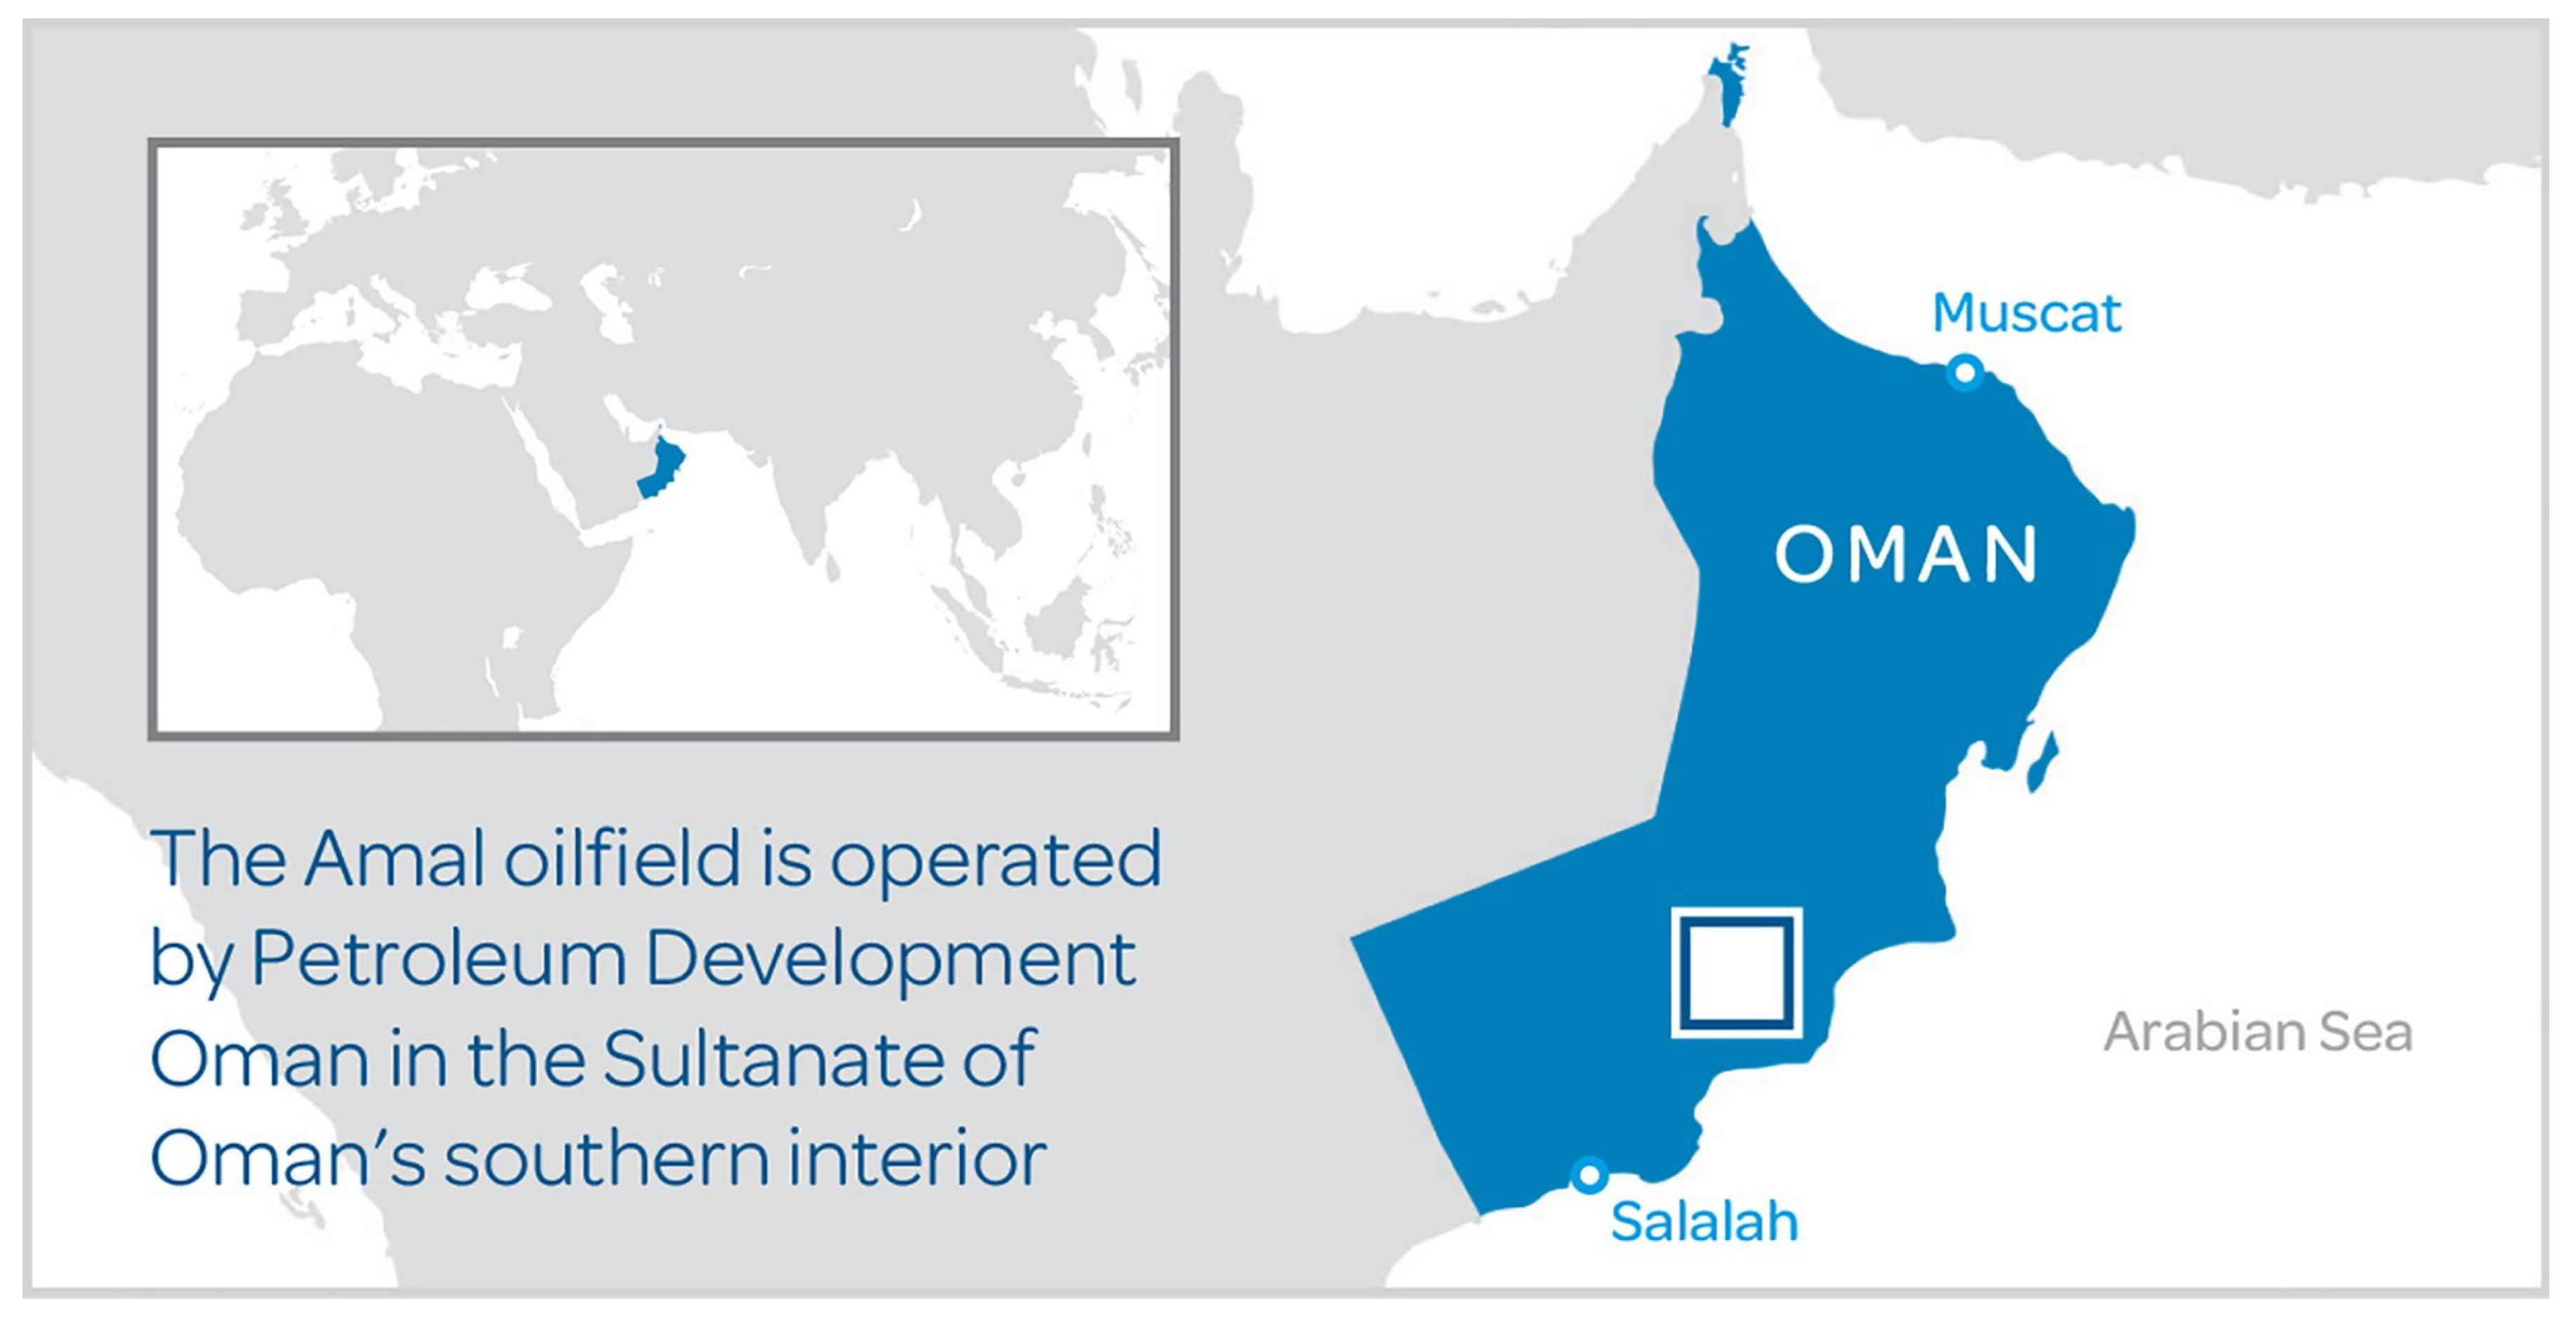
Figure 3.
A sketch of the enclosed parabolic troughs and the water heating loop pipe (© GlassPoint, reproduced with permission).
Figure 3.
A sketch of the enclosed parabolic troughs and the water heating loop pipe (© GlassPoint, reproduced with permission).
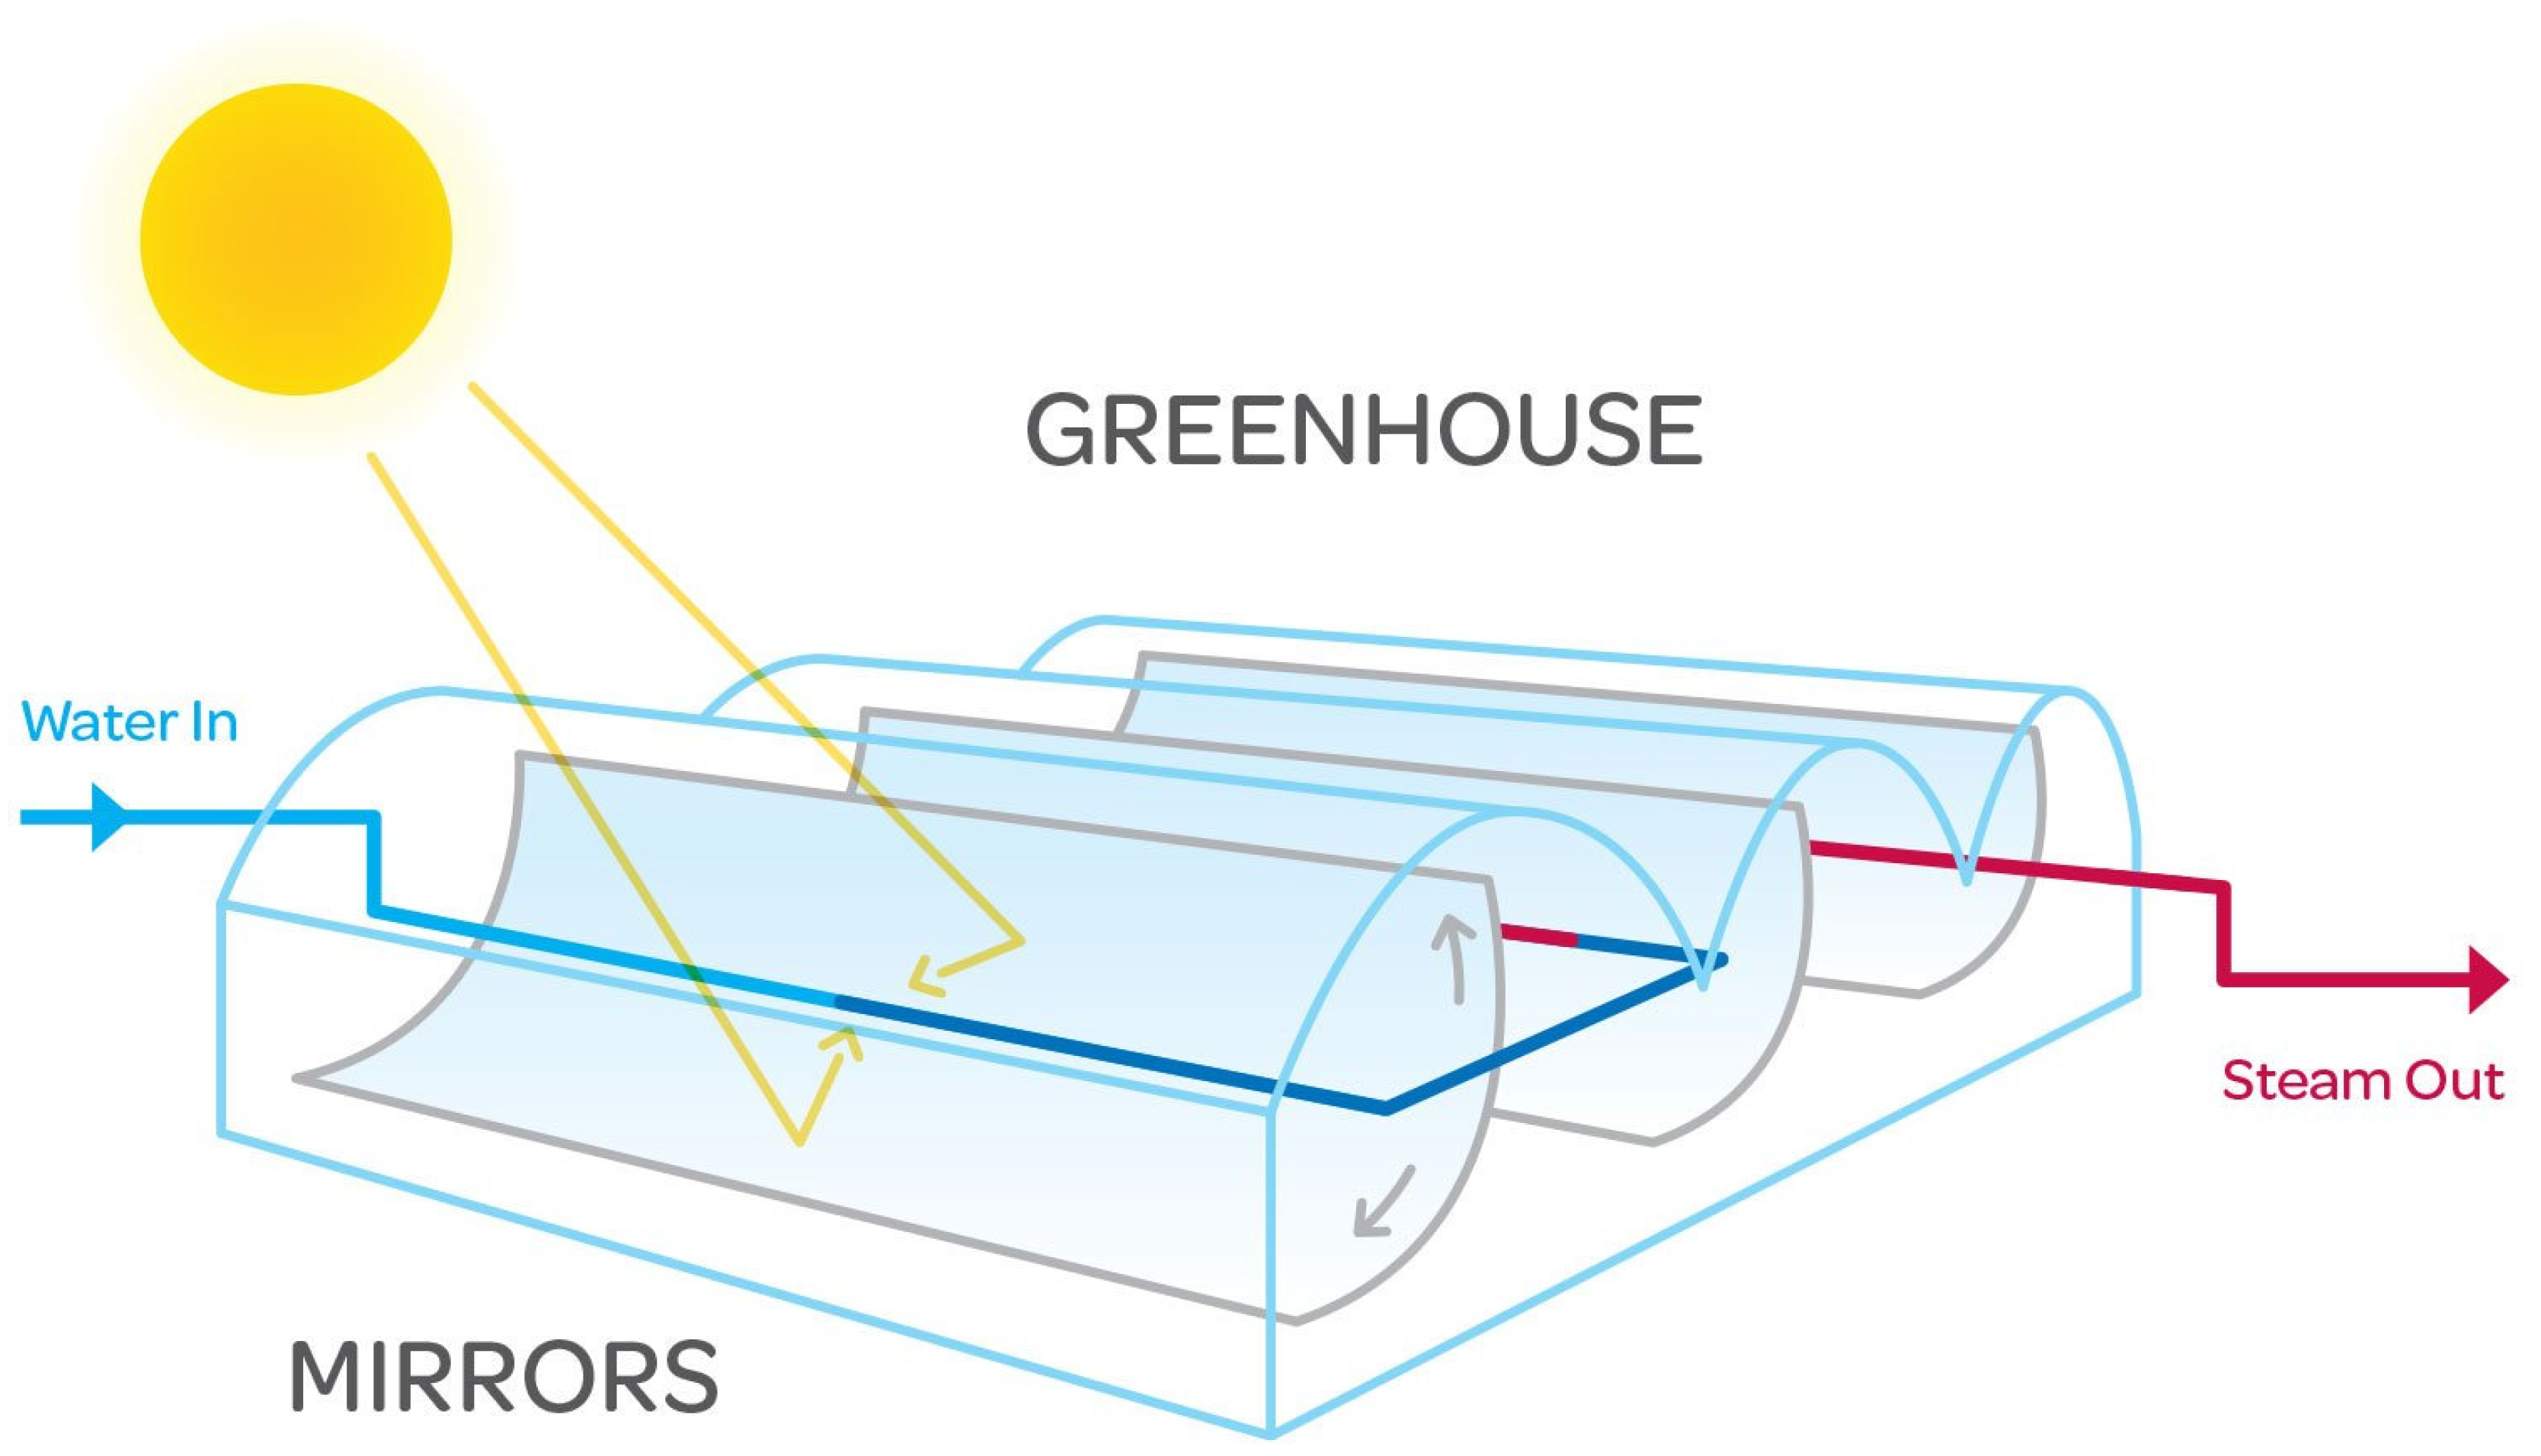
Figure 4.
A sketch showing the wind load for (a) conventional (exposed) parabolic troughs, and (b) enclosed (protected) troughs (© GlassPoint, reproduced with permission).
Figure 4.
A sketch showing the wind load for (a) conventional (exposed) parabolic troughs, and (b) enclosed (protected) troughs (© GlassPoint, reproduced with permission).
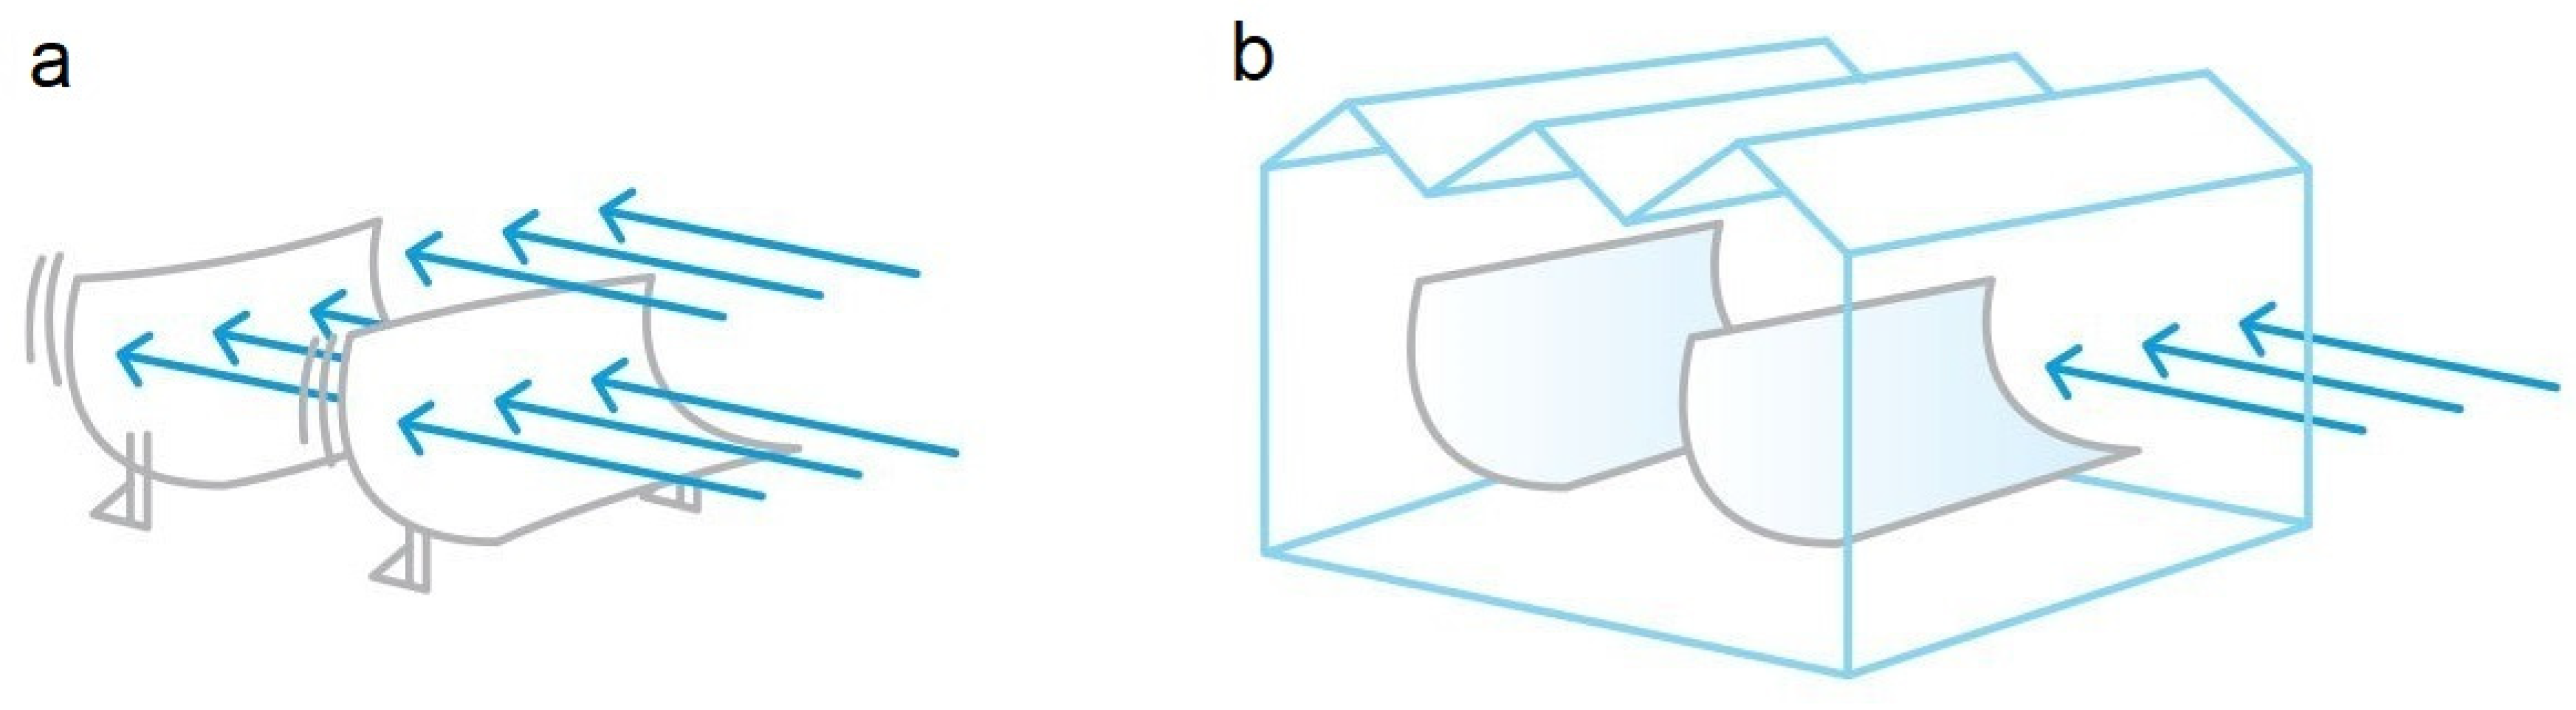
Figure 5.
Comparison of the relative footprint area needs for different systems (© GlassPoint, reproduced with permission).
Figure 5.
Comparison of the relative footprint area needs for different systems (© GlassPoint, reproduced with permission).
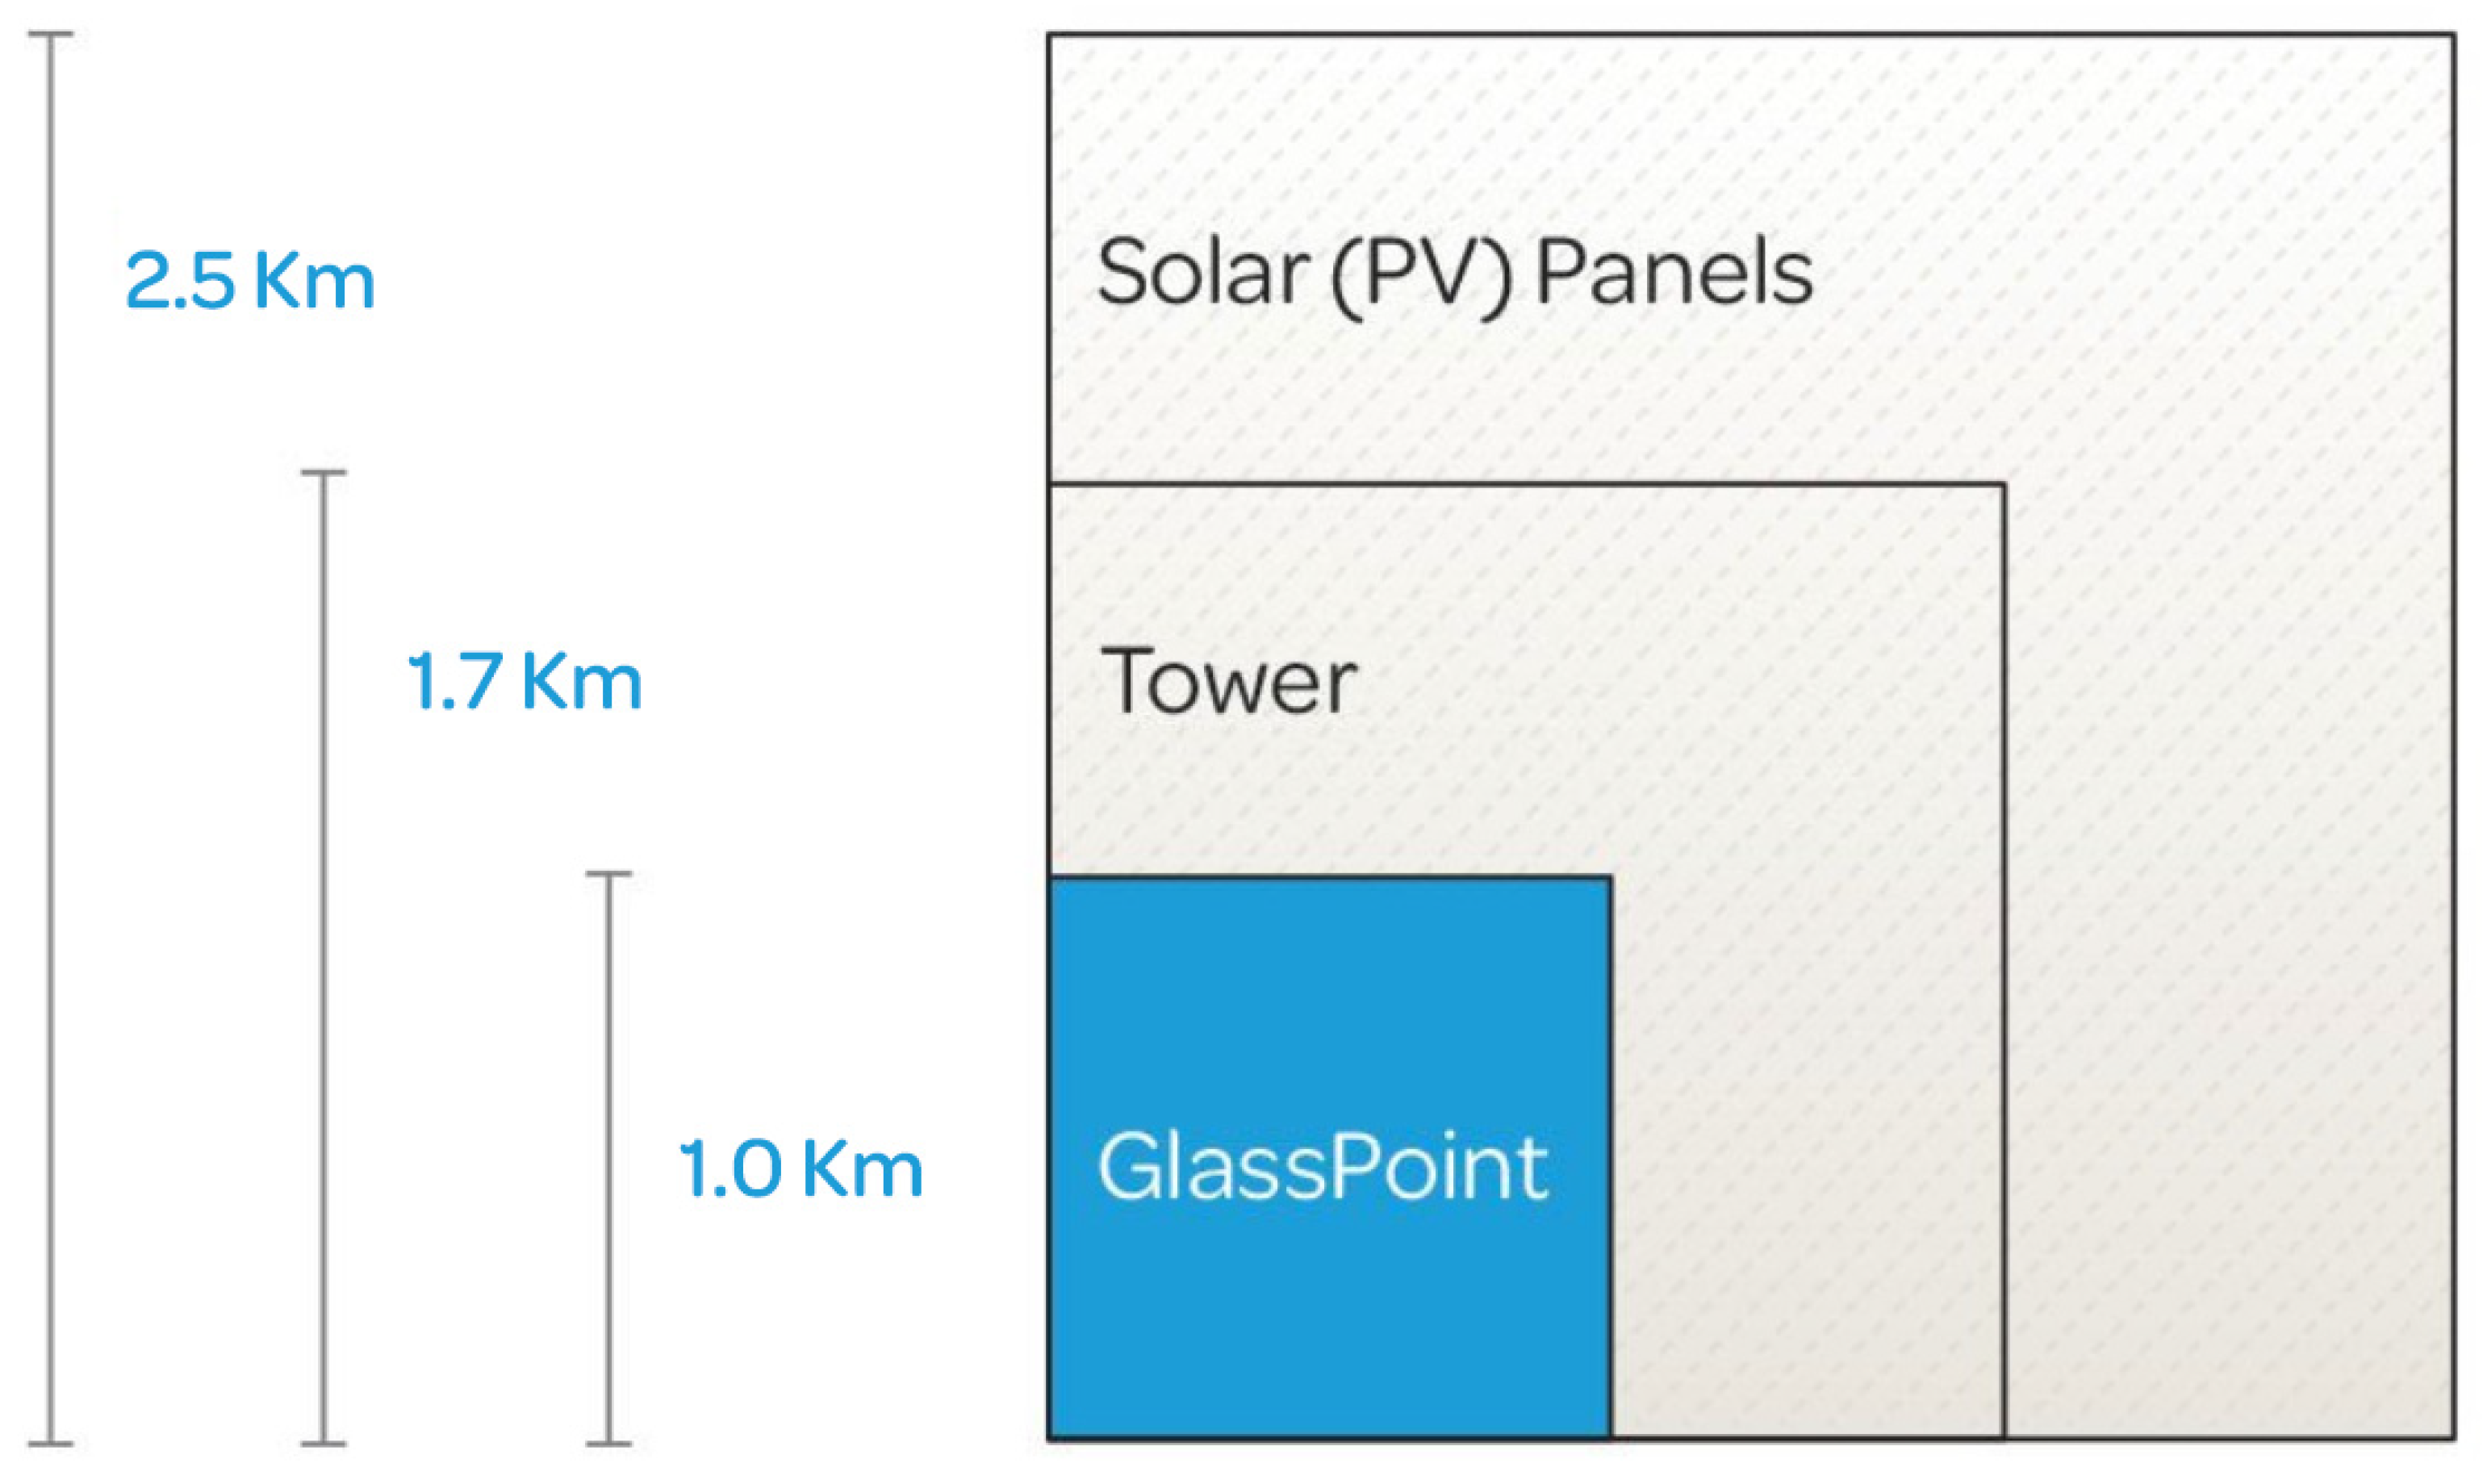
Figure 6.
An aerial view of the Amal I pilot project (© GlassPoint, reproduced with permission). (1) Solar collector field, (2) Cylindrical water storage tank, (3) Steam distribution piping network, (4) Controlled steam vent (release point), (5) beam pumps (pump jacks) within the oil field.
Figure 6.
An aerial view of the Amal I pilot project (© GlassPoint, reproduced with permission). (1) Solar collector field, (2) Cylindrical water storage tank, (3) Steam distribution piping network, (4) Controlled steam vent (release point), (5) beam pumps (pump jacks) within the oil field.
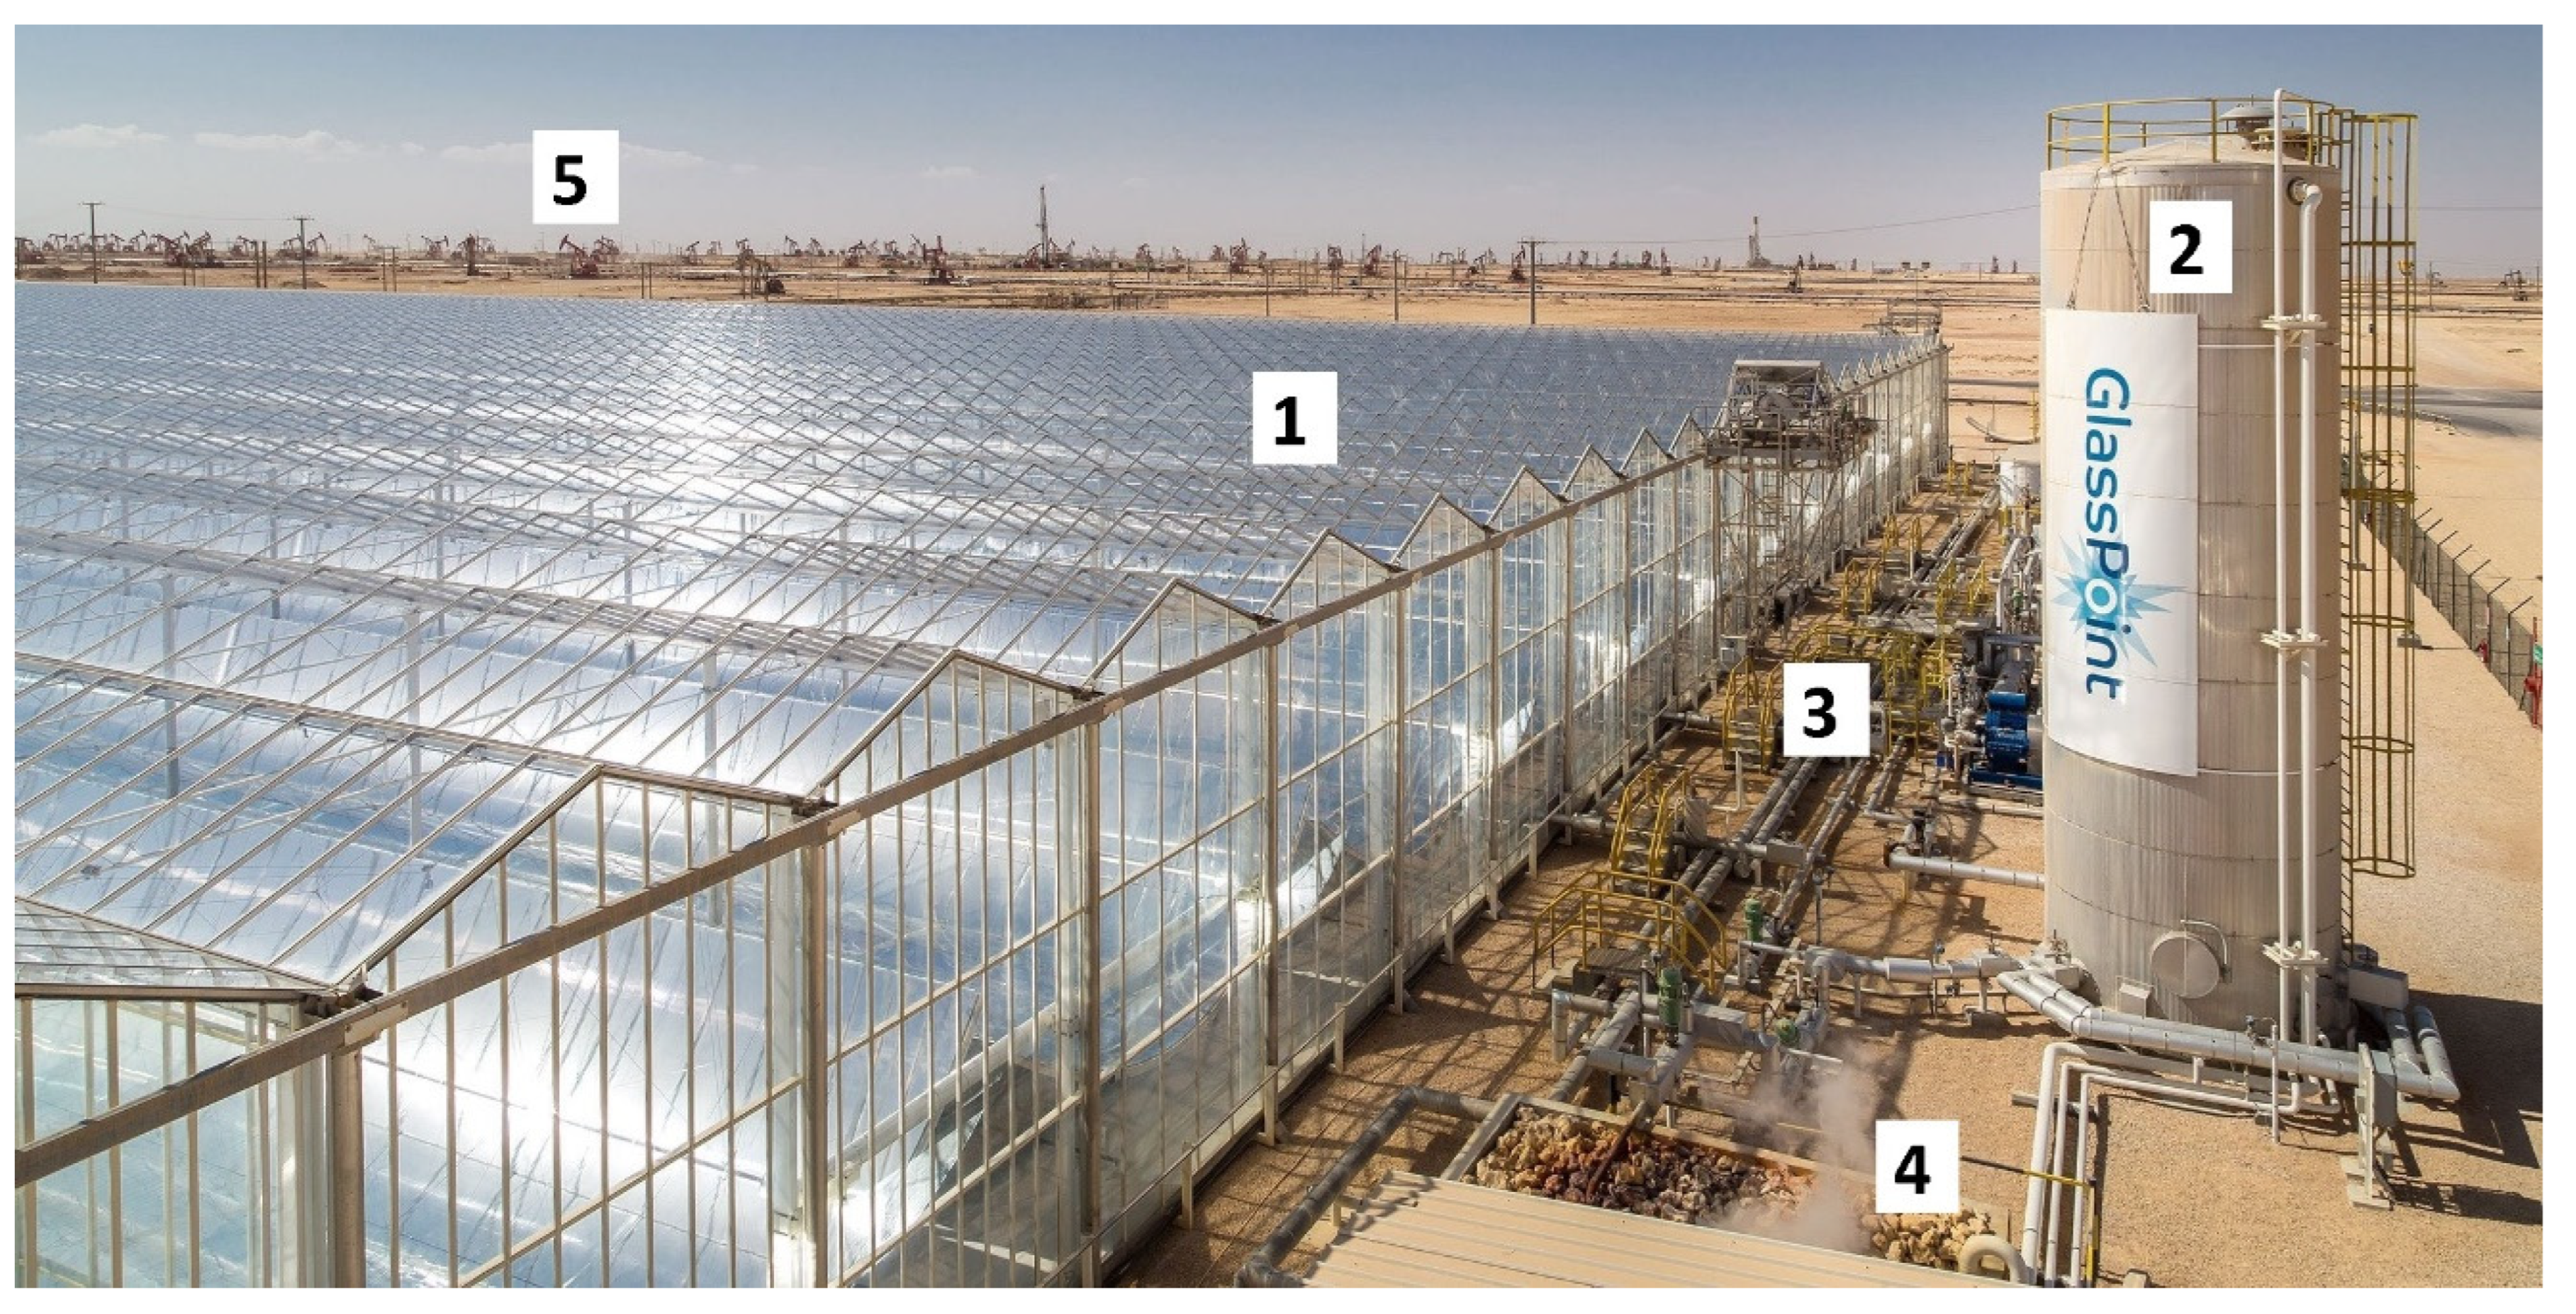
Figure 7.
A side photo of the Amal I pilot project (© GlassPoint, reproduced with permission).
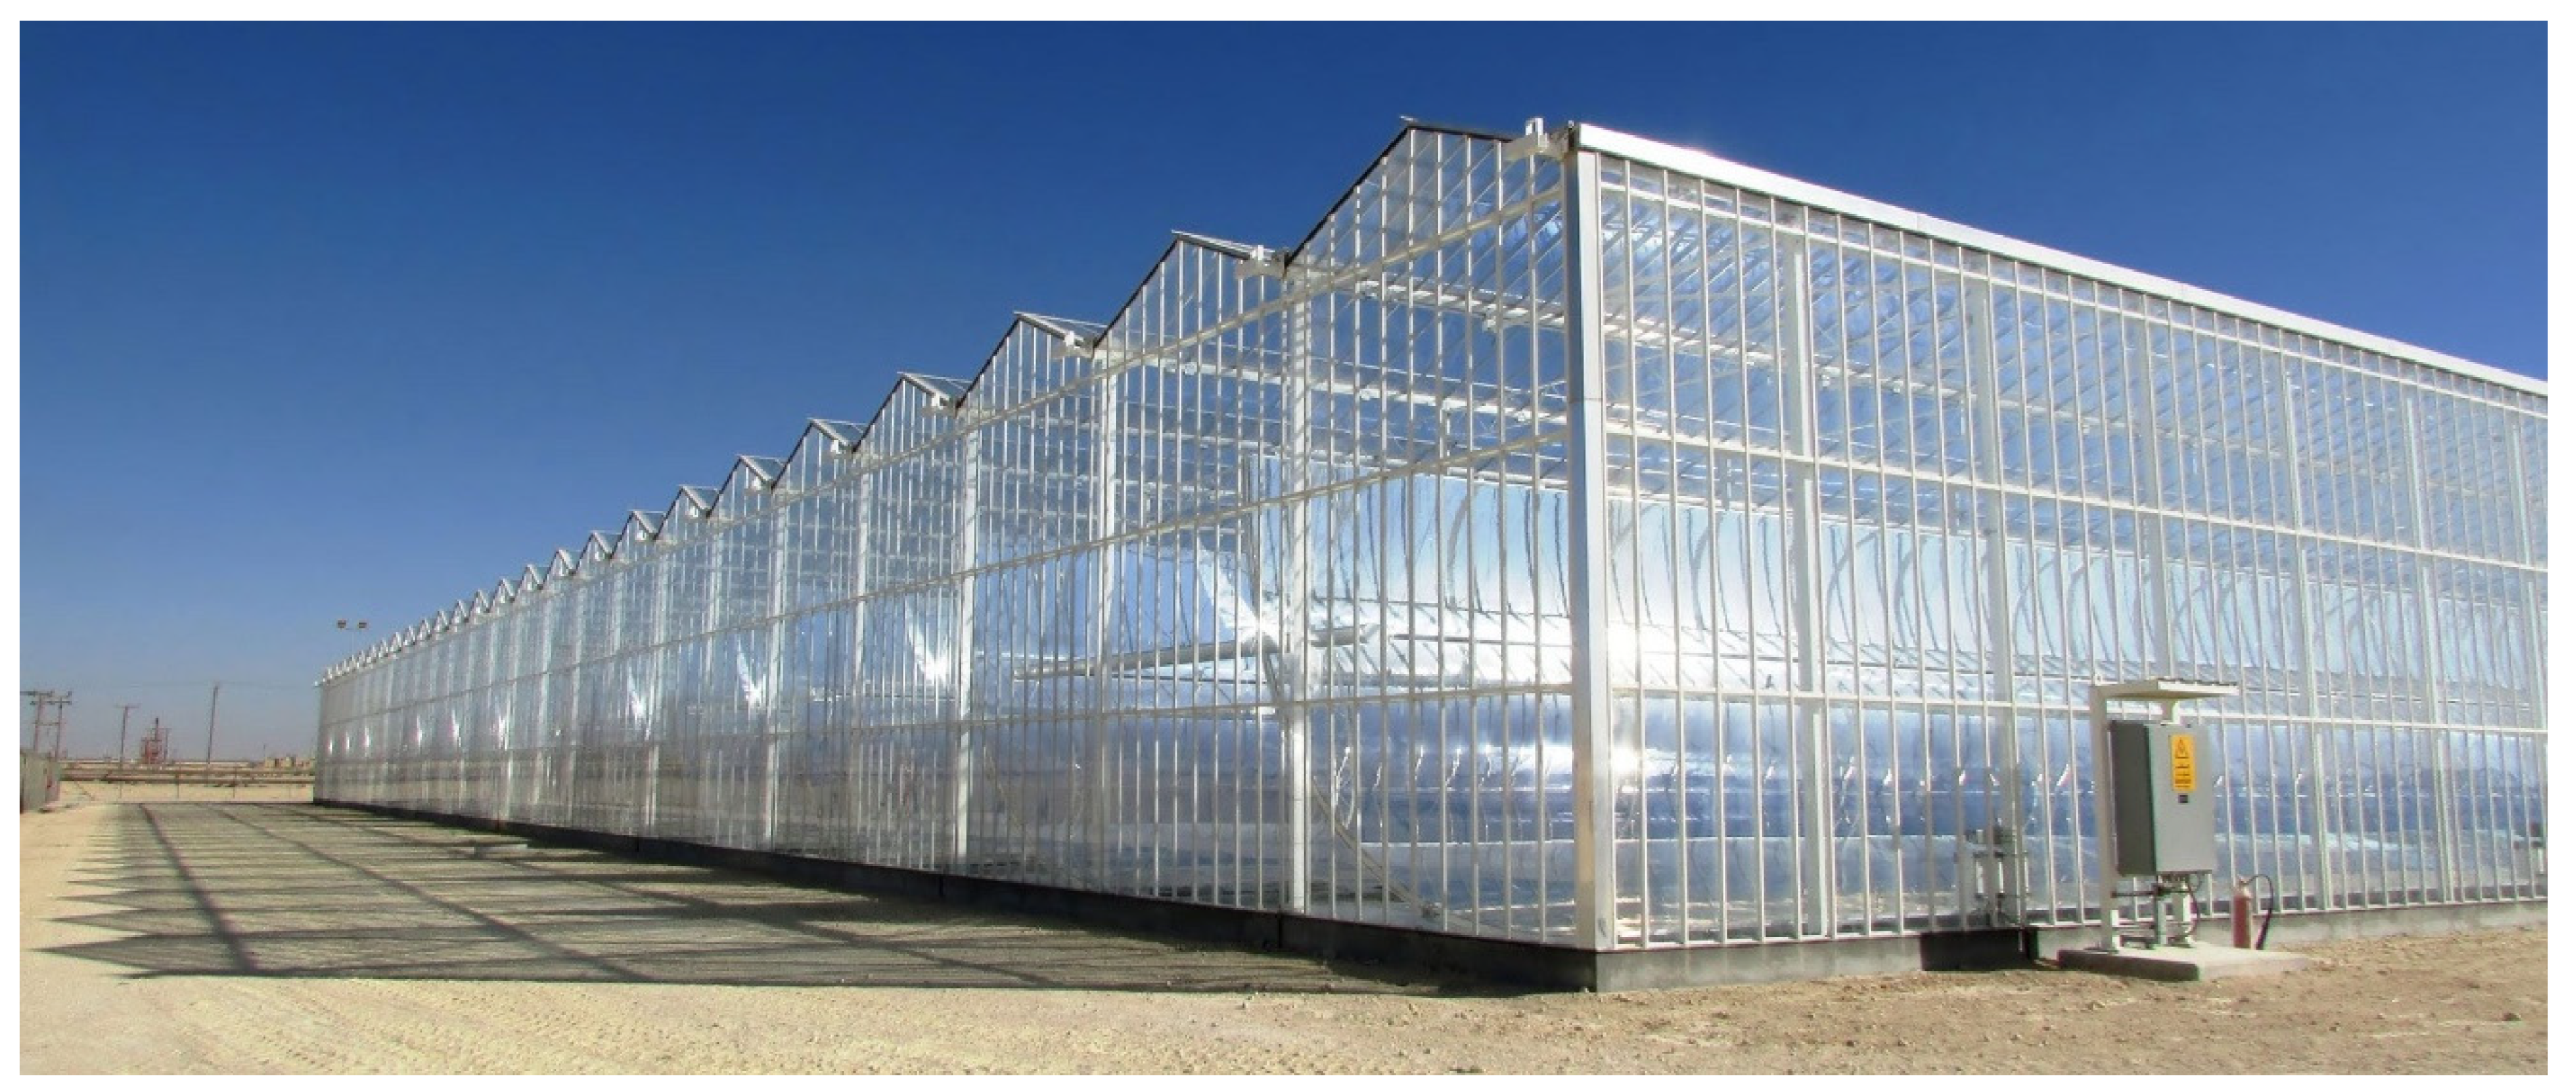
Figure 8.
An aerial view of the Amal II pilot project (© GlassPoint, reproduced with permission). (1) Protective greenhouse enclosure, (2) Parabolic trough collector mirror, (3) Receiver pipe, (4) Beam pumps (pump jacks) within the oil field.
Figure 8.
An aerial view of the Amal II pilot project (© GlassPoint, reproduced with permission). (1) Protective greenhouse enclosure, (2) Parabolic trough collector mirror, (3) Receiver pipe, (4) Beam pumps (pump jacks) within the oil field.
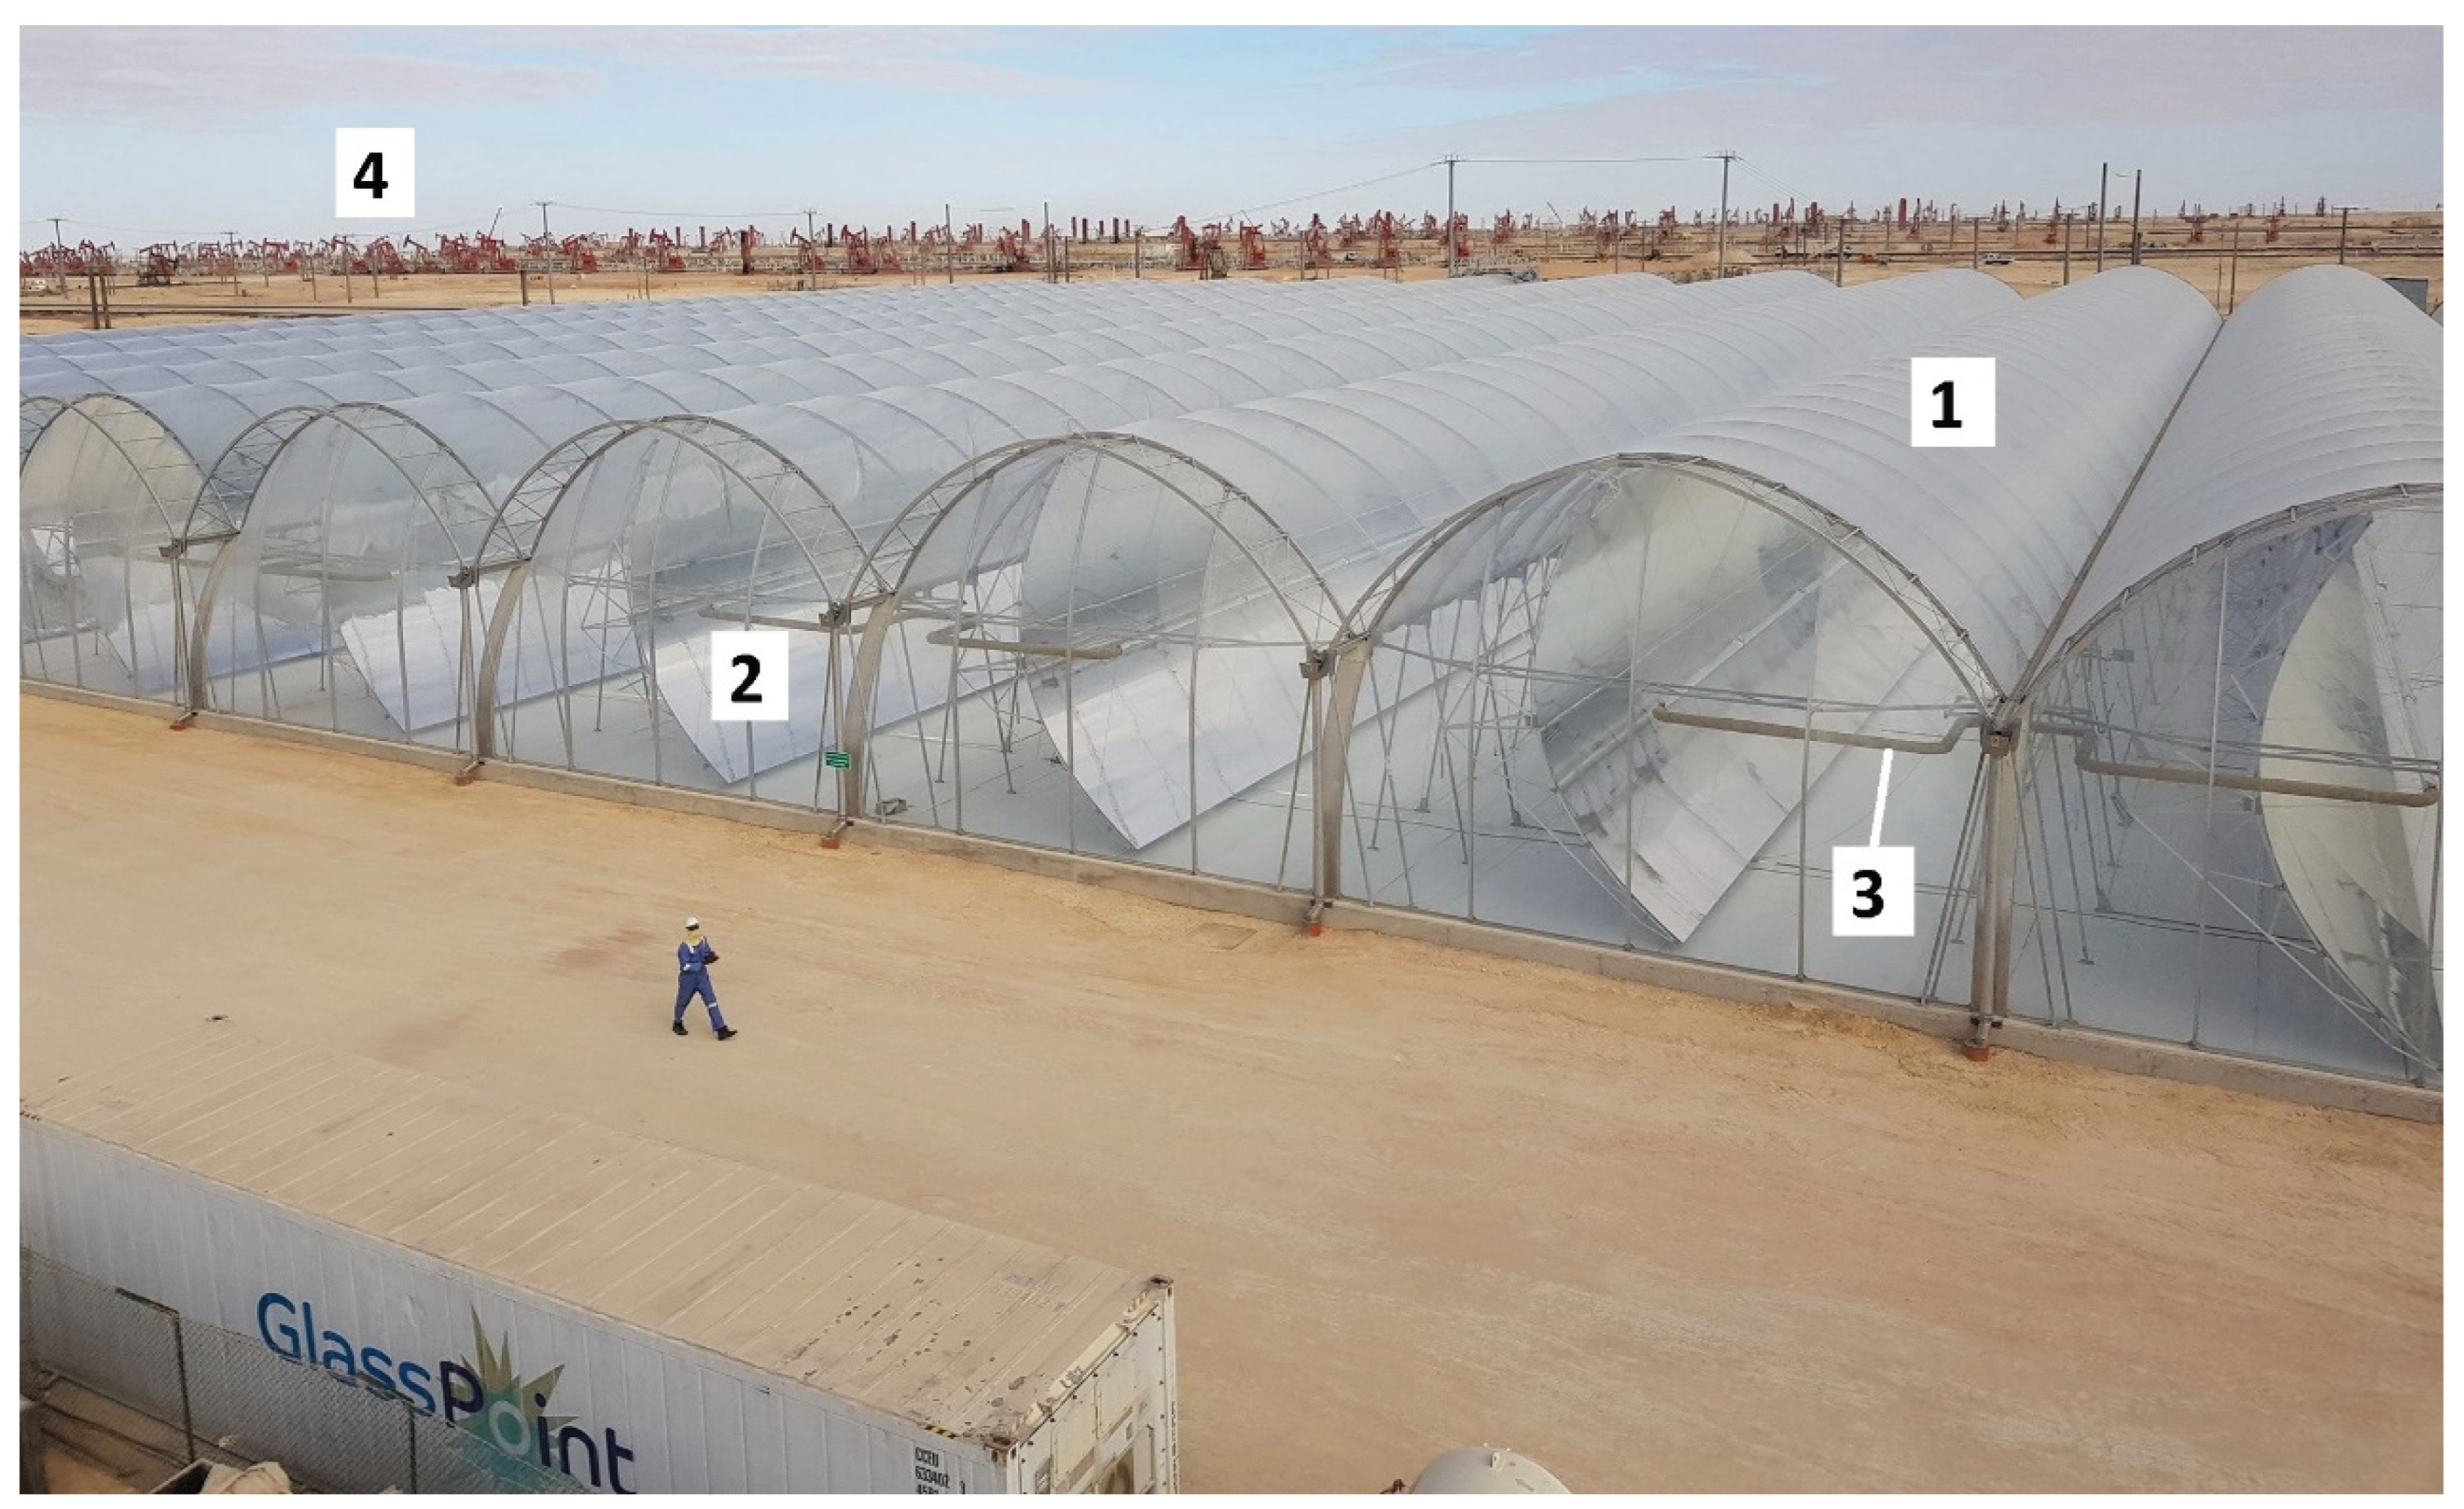
Figure 9.
A photo showing night installation work at the Amal II pilot project (© GlassPoint, reproduced with permission). (1) Reflective collector surface, (2) Receiver pipe, (3) Roof of the protective enclosure, (4) Structural framework, (5) Installation equipment.
Figure 9.
A photo showing night installation work at the Amal II pilot project (© GlassPoint, reproduced with permission). (1) Reflective collector surface, (2) Receiver pipe, (3) Roof of the protective enclosure, (4) Structural framework, (5) Installation equipment.
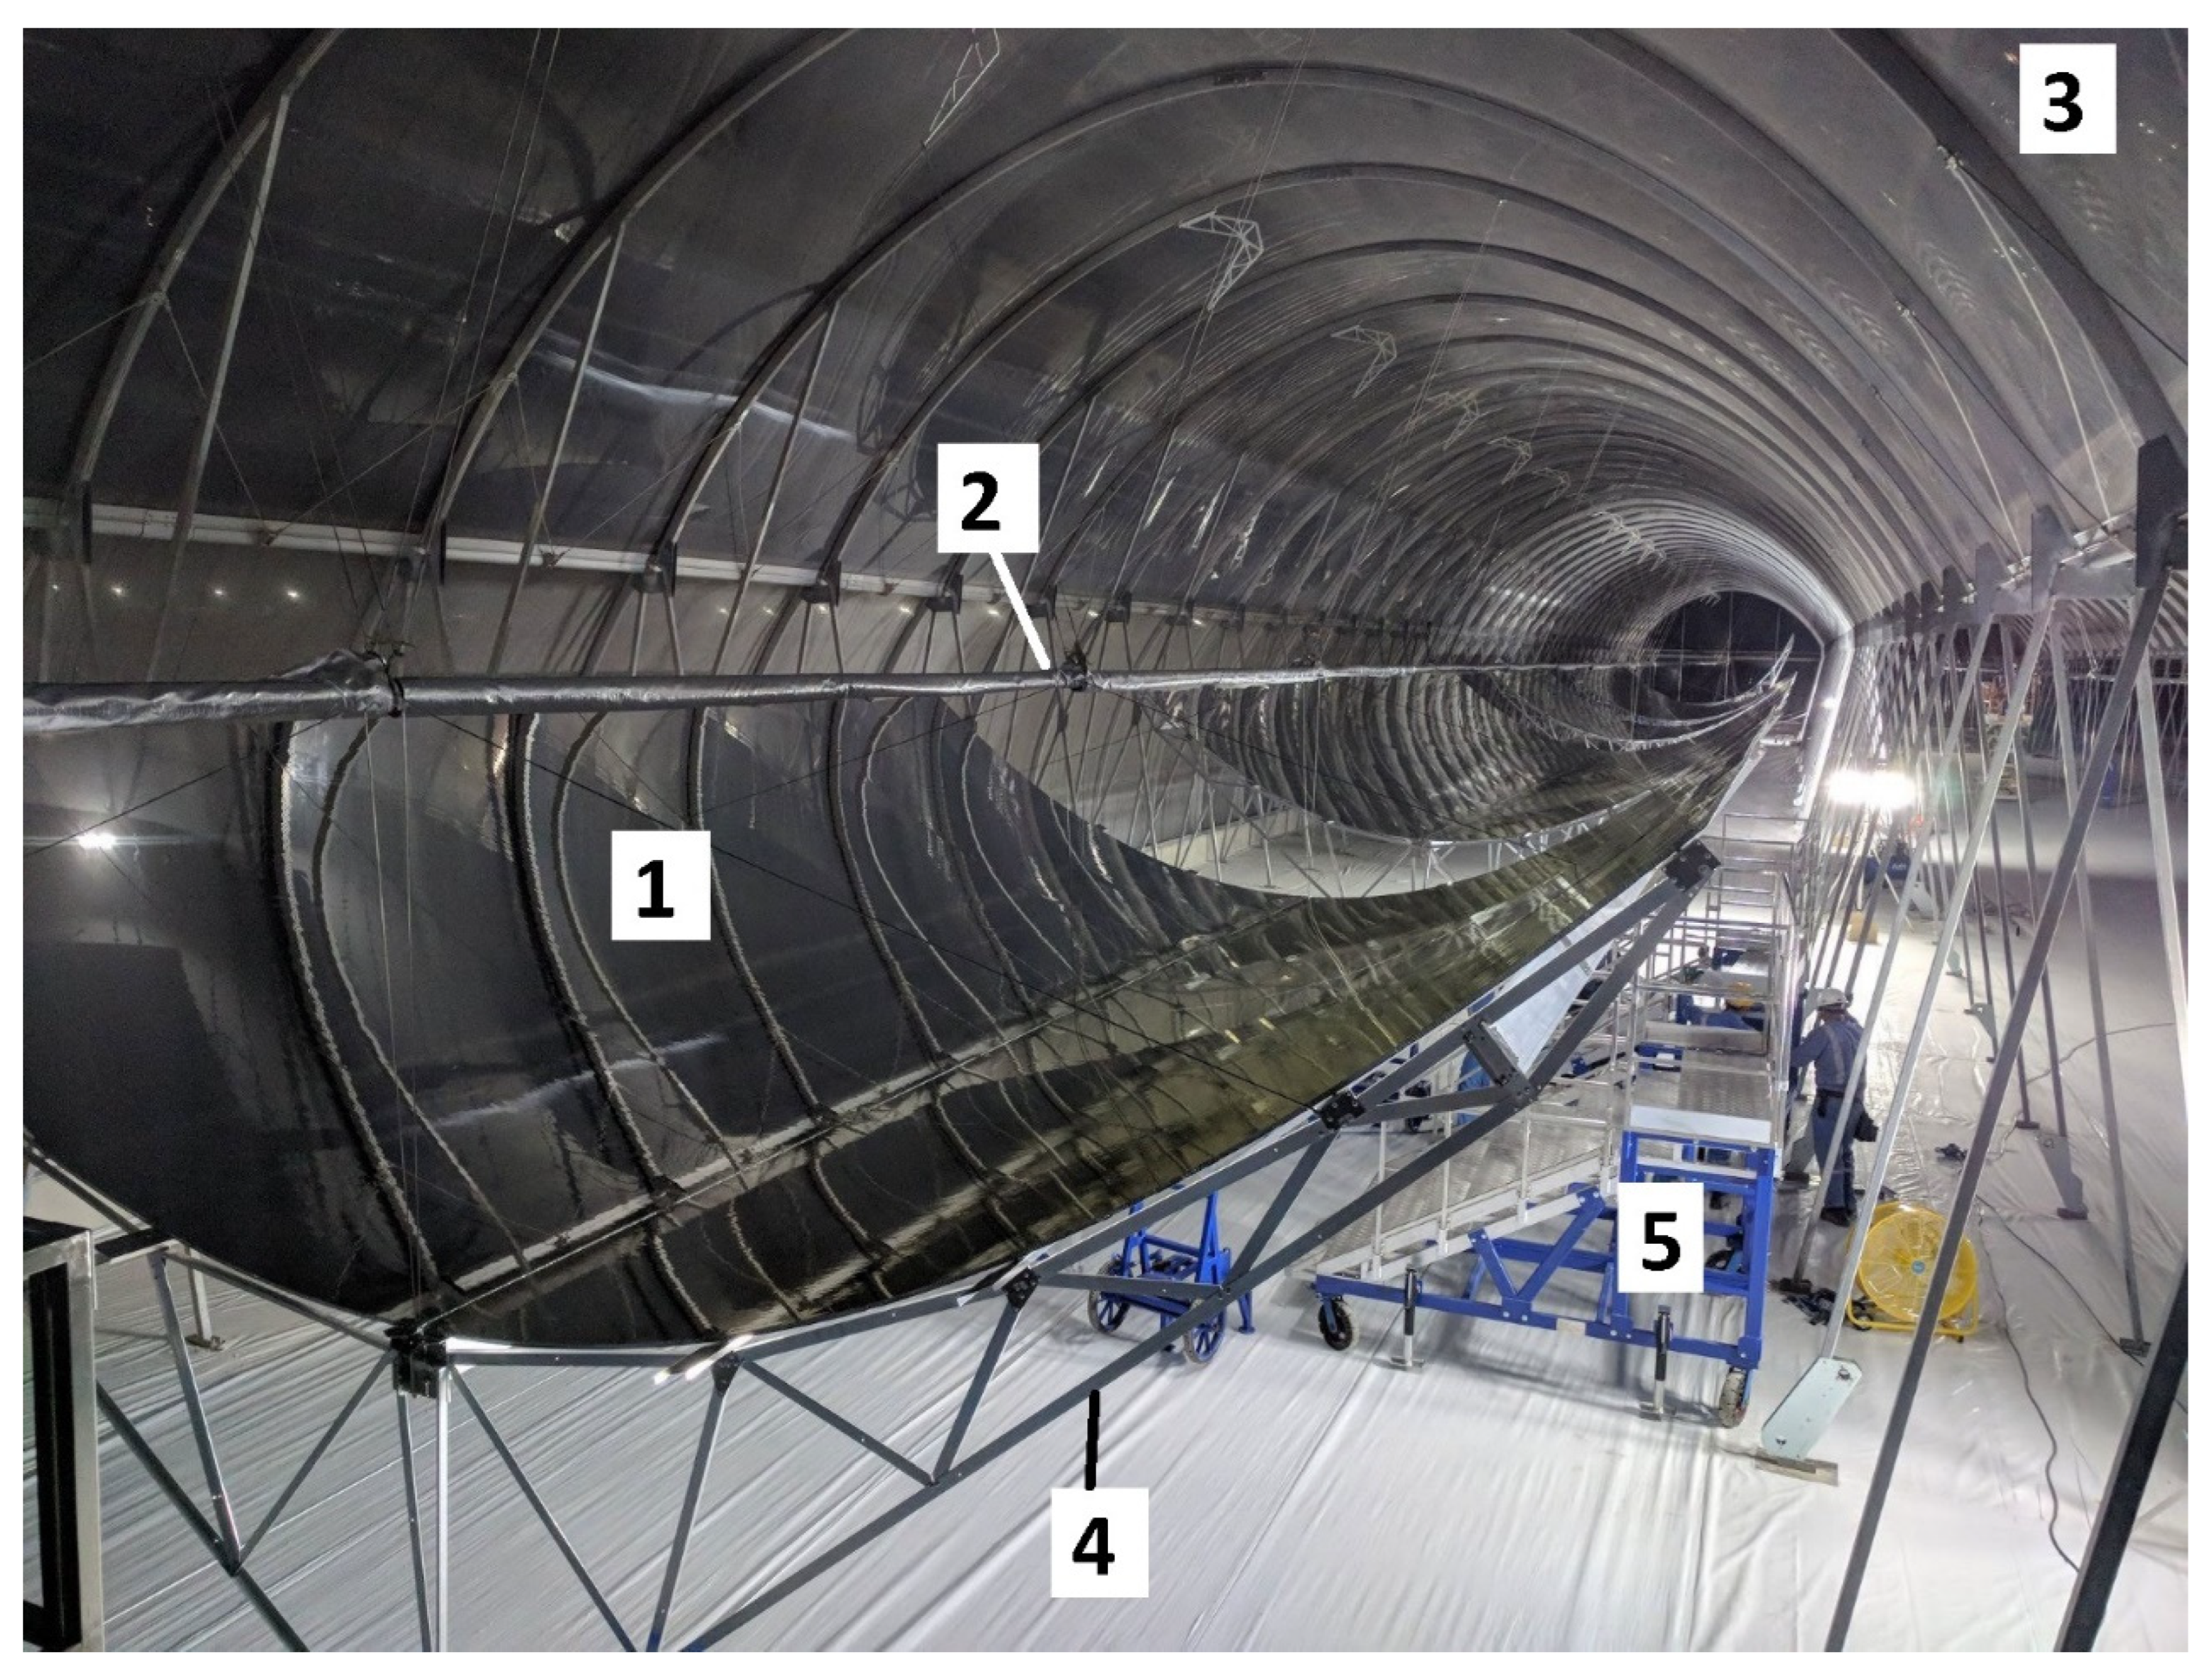
Figure 10.
Stellate image of the Miraah commercial project, North is upward (© Google, Airbus, Maxar Technologies, Map data; permission granted under Google’s Geo guidelines Database License [228]).
Figure 10.
Stellate image of the Miraah commercial project, North is upward (© Google, Airbus, Maxar Technologies, Map data; permission granted under Google’s Geo guidelines Database License [228]).
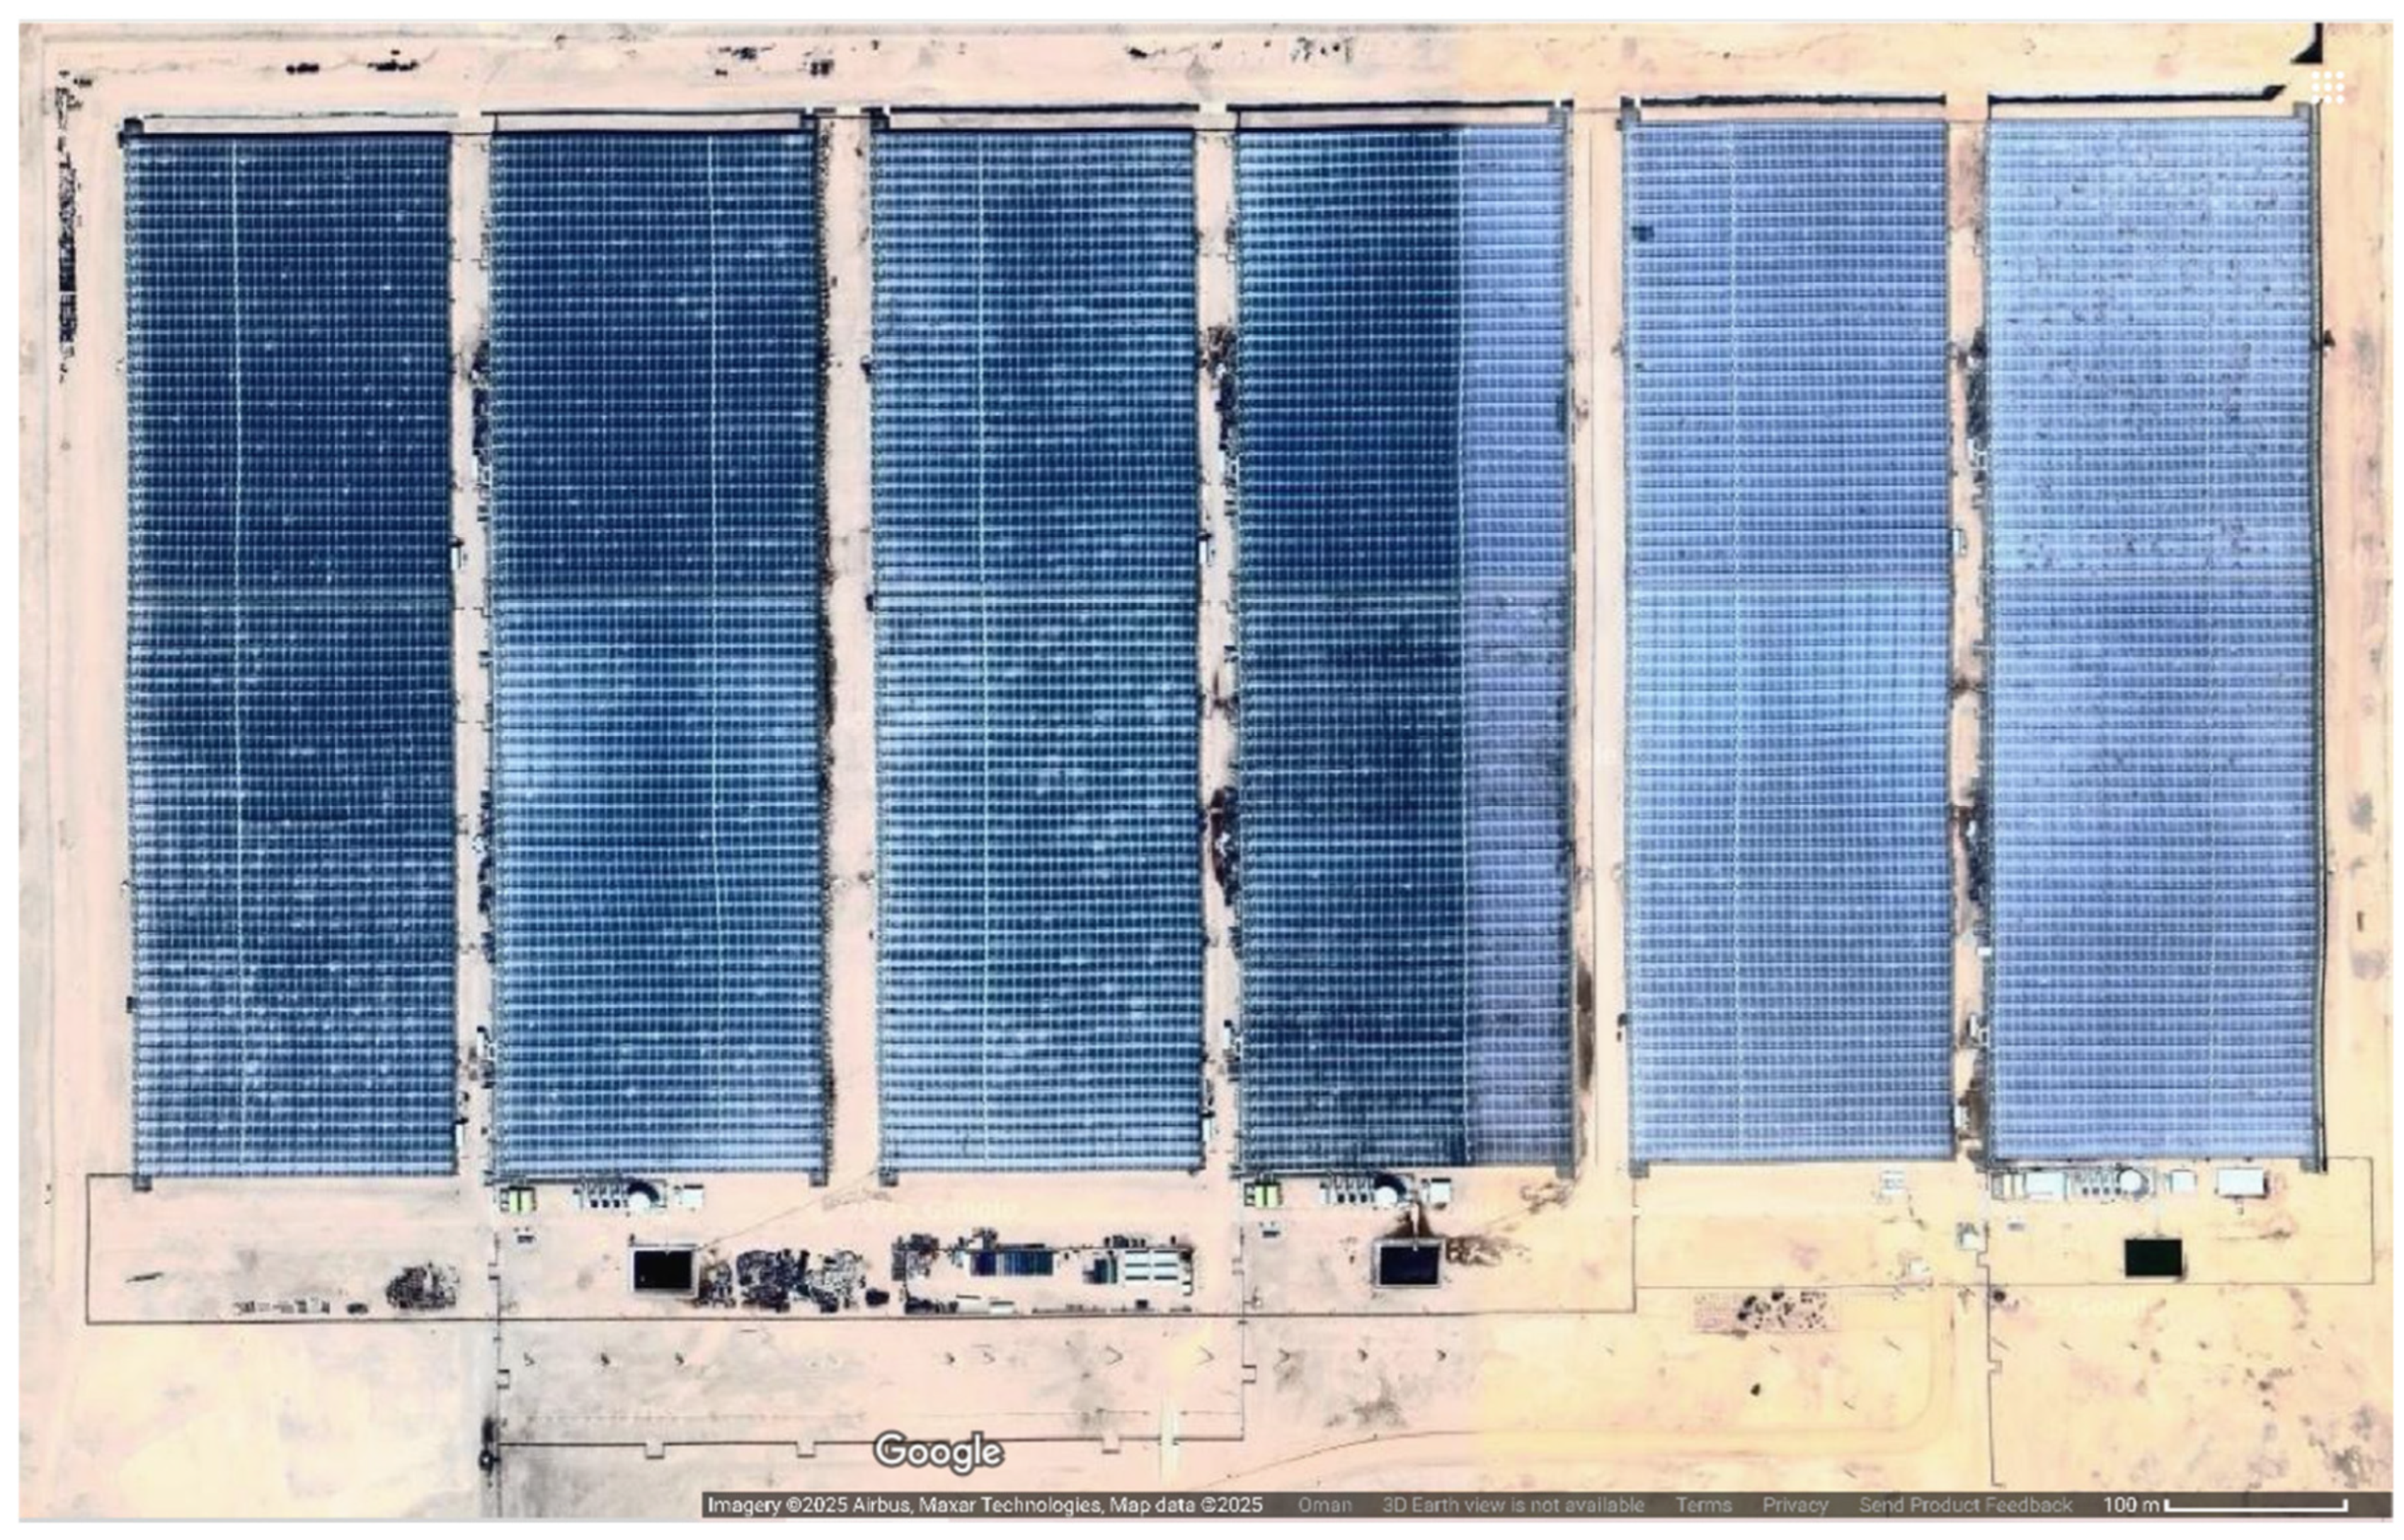
Figure 11.
An aerial photo of one of the six zones of the Miraah commercial project (© GlassPoint, reproduced with permission). (1) Solar collector field (one of the six enclosures), (2) Steam distribution pipes, (3) Water storage tank, (4) Steam generation plant, (5 Control rooms/offices, (6) Pump skid (to pressurize liquid water and deliver it from the storage tank to the receiver tubes), (7) Water reservoir, (8) Adjacent solar collector enclosure.
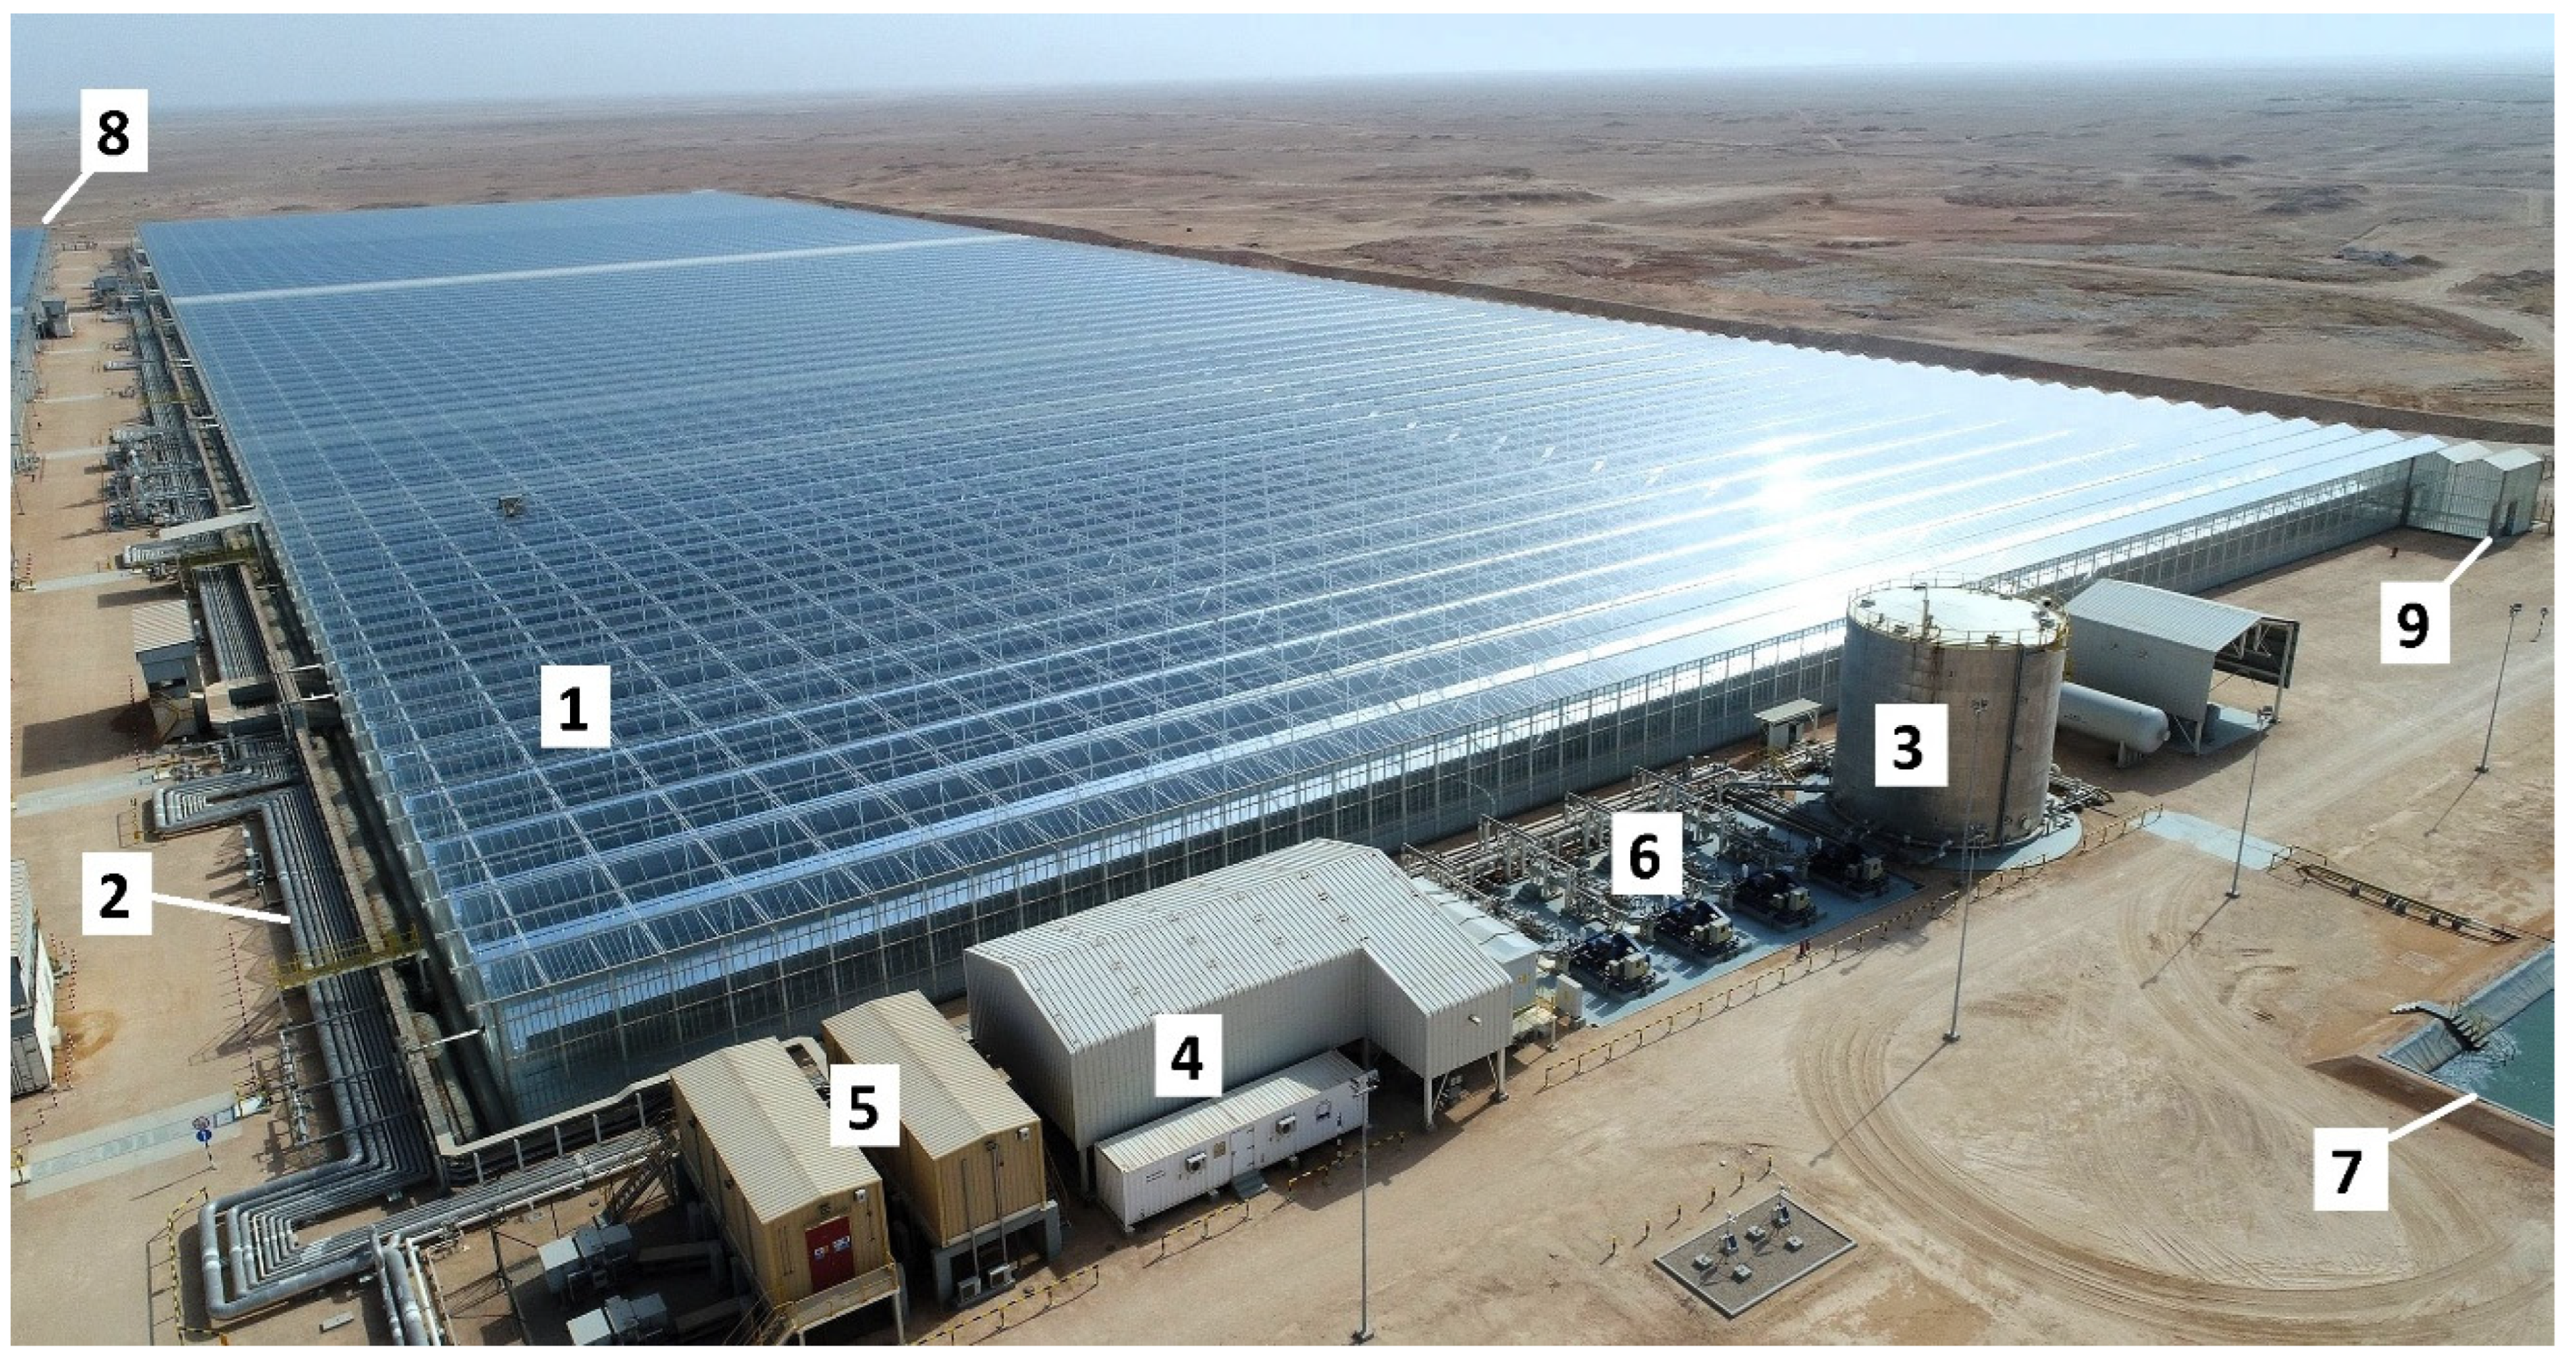
Figure 12.
A front photo of the Miraah commercial project (© GlassPoint, reproduced with permission). (1) Protective greenhouse enclosure, (2) Parabolic trough collector mirror, (3) Steam distribution pipe, (4) Electrical distribution panel.
Figure 12.
A front photo of the Miraah commercial project (© GlassPoint, reproduced with permission). (1) Protective greenhouse enclosure, (2) Parabolic trough collector mirror, (3) Steam distribution pipe, (4) Electrical distribution panel.
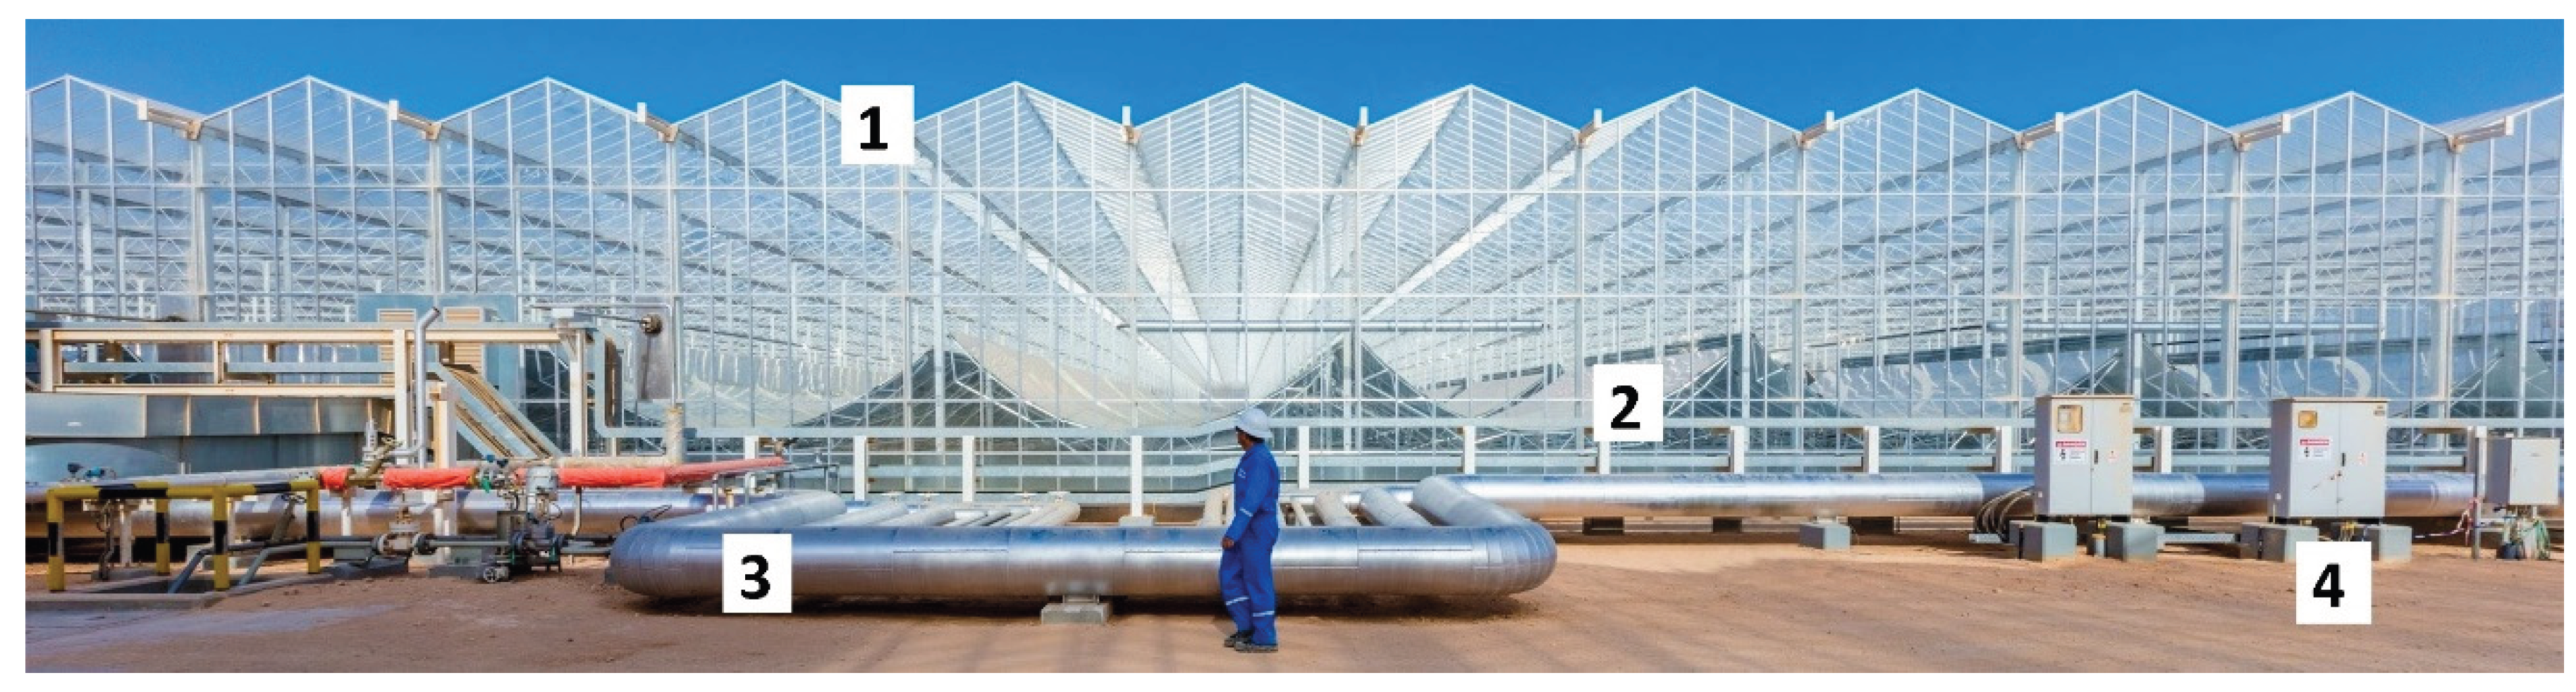

Table 1.
Energy mix in Oman, 2022.
| Energy sector | Category 1 (largest) | Category 2 (intermediate) | Category 3 (smallest) |
| DEP (total: 3,759,259 TJ) |
crude oil | natural gas | wind and solar |
| 59.3% | 40.6% | 0.1% | |
| 2,230,003 TJ | 1,525,393 TJ | 3,863 TJ | |
| TES (total: 1,161,992 TJ) |
natural gas | crude oil | wind and solar |
| 88.1% | 11.5% | 0.3% | |
| 1,023,964 TJ | 134,165 TJ | 3,863 TJ | |
| Electricity generation (total: 42,771 GWh or 153,975.6 TJ) |
natural gas | crude oil | wind and solar |
| 94.7% | 2.8% | 2.5% | |
| 40,508 GWh (145,828.8 TJ) |
1,190 GWh (4,284 TJ) |
1,073 GWh (3,862.8 TJ) |
|
| TFC (total: 1,060,813 TJ) |
natural gas | oil products | electricity |
| 56.6% | 31.1% | 12.3% | |
| 600,340 TJ | 330,230 TJ | 130,243 TJ |
Table 2.
Saturation properties of steam at 100 bar.
| Property | Values | ||
| Saturated Liquid | Saturated vapor | Wet steam, 80% quality | |
| Pressure | 100 bar | 100 bar | 100 bar |
| Temperature | 311.06 °C | 311.06 °C | 311.06 °C |
| Density | 688.7052 kg/m3 | 55.4754 kg/m3 | 67.9754 kg/m3 |
| Specific volume | 0.001452 m3/kg | 0.018026 m3/kg | 0.0147112 m3/kg |
| Specific internal energy* | 1393.04 kJ/kg | 2544.4 kJ/kg | 2314.128 kJ/kg |
| Specific enthalpy [102]* | 1407.56 kJ/kg | 2724.7 kJ/kg | 2461.272 kJ/kg |
| Specific entropy* | 3.3596 kJ/kg.K | 5.6141 kJ/kg.K | 5.1632 kJ/kg.K |
Table 3.
Comparison between the three GlassPoint enclosed solar enhanced oil recovery (ESEOR) projects in Oman.
Table 3.
Comparison between the three GlassPoint enclosed solar enhanced oil recovery (ESEOR) projects in Oman.
| Property | Amal I | Amal II | Miraah |
| 1. Scale/purpose | Pilot | Pilot | Commercial |
| 2. Thermal power capacity | 8 MWth | 8 MWth | 330 MWth (initially planned as 1,021 MWth) |
| 3. Annual heat energy output | 12 GWh/year | 12 GWh/year | 445 GWh/year |
| 4. Average daily steam output | 50 tonnes | 50 tonnes | 2,000 tonnes |
| 5. Solar field area | 17,280 m2 | 17,280 m2 | 622,080 m2 |
| 6. Total project area | 46,200 m2 | 46,200 m2 | 781,200 m2 |
| 7. Current status (as of mid-2025) | Dismantled | Dismantled | Operational (by PDO) |
| 8. Construction starting year | 2011 | 2018 | 2015 |
| 9. Steam production starting year | 2012 | 2020 | 2017 |
| 10. Receiver tube evacuation | No | Yes | No |
| 11. Number of trough rows and reflector mirrors |
12 rows (3 mirrors per row) |
16 rows (1 mirror per row) |
3 modules (18 loops per module) (8 rows and 24 mirrors per loop) Thus, total: 432 rows (3 mirrors per row; thus, 1,296 mirrors) |
| 12. Trough row size (length × aperture width) |
60 m × 7.65 m | 50 m × 7.32 m | 60 m × 7.65 m |
| 13. Shape of the greenhouse roof |
gable | curve | gable |
| 14. Annual natural gas savings | 47,437 MMBtu/year (474,370 therms/year) (13.902 GWh/year) (0.05005 PJ/year) (0.047437 Bcf/year) (1.3553 MNm3/year) |
47,437 MMBtu/year (474,370 therms/year) (13.902 GWh/year) (0.05005 PJ/year) (0.047437 Bcf/year) (1.3553 MNm3/year) |
1,897,461 MMBtu/year (18,974,610 therms/year) (556.091 GWh/year) (2.00193 PJ/year) (1.897461 Bcf/year) (54.2132 MNm3/year) |
| 15. Annual CO2 emissions avoided |
2,514 tonnes/year | 2,514 tonnes/year | 100,565 tonnes/year |
| References | [181,182,183] | [184] | [185,186] |
Table 4.
Total avoided natural gas (NG) consumption if the three ESEOR projects are operated simultaneously.
Table 4.
Total avoided natural gas (NG) consumption if the three ESEOR projects are operated simultaneously.
| Unit | Summed annual avoided NG (three projects together) |
| MMBtu/year | 1,992,335 |
| therms/year | 19,923,350 |
| GWh/year | 569.993 |
| PJ/year | 2.05198 |
| Bcf/year | 1.992335 |
| MNm3/year | 56.9238 |
Disclaimer/Publisher’s Note: The statements, opinions and data contained in all publications are solely those of the individual author(s) and contributor(s) and not of MDPI and/or the editor(s). MDPI and/or the editor(s) disclaim responsibility for any injury to people or property resulting from any ideas, methods, instructions or products referred to in the content. |
© 2025 by the authors. Licensee MDPI, Basel, Switzerland. This article is an open access article distributed under the terms and conditions of the Creative Commons Attribution (CC BY) license (http://creativecommons.org/licenses/by/4.0/).
Copyright: This open access article is published under a Creative Commons CC BY 4.0 license, which permit the free download, distribution, and reuse, provided that the author and preprint are cited in any reuse.


