Preprint
Article

This version is not peer-reviewed.

Symbiotic N Fixation, C Assimilation, and Water-Use Efficiency in Four Groundnut Varieties (Arachis hypogaea L.) Assessed Using 15N and 13C Natural Abundance Techniques

Submitted:

01 November 2025

Posted:

03 November 2025

You are already at the latest version

Abstract

Groundnut is an essential legume crop vital for global food security, especially in resource-limited areas. However, poor soil fertility and climate change often hinder crop growth in Africa, resulting in low yields, particularly on smallholder farms. This study systematically evaluates, for the first time in the North West Province of South Africa, the inter-annual variations in symbiotic nitrogen fixation and water use efficiency among four major groundnut varieties during the 2023 and 2024 cropping seasons, using 15N and 13C natural abundance techniques. Significant differences were observed in plant growth, nitrogen content, δ15N, %Ndfa, N-fixed, soil N uptake, and grain yield across both years. Groundnut varieties derived 35.51% to 85.77% of their nitrogen from symbiotic fixation, contributing 22.13 to 168.48 kg of nitrogen fixed per hectare. The grain yield was much higher (4305.45 to 7465.91 kg ha−1) in 2024 cropping season compared to (514.73 to 1207.95 kg ha−1) in the 2023 cropping season. The shoot 13C values for the groundnut varieties ranged from −28.57‰ to −28.19‰ in 2023 and −30.17‰ to −28.34‰ in 2024. Notably, varieties Kwarts (85.77%) and Shubert (82.95% demonstrated higher symbiotic dependency in 2023 cropping season, whiles varieties ARC K6 (106.86 kg ha−1) and PC 474 (164.48 kg ha−1) fixed the most N in the 2024 cropping season, along with better water-use efficiency. These varieties namely Kwarts, Shubert, and PC 474 show promise for inclusion in future breeding programs.

Keywords: 
;  ;  ;  ;  

1. Introduction

Grain legumes such as groundnut (Arachis hypogaea L.) play a significant role in achieving food and nutritional security globally and in Africa [1]. Nitrogen is one of the most crucial nutrient elements needed by plants for the biosynthesis of chlorophyll, Rubisco, amino acids, protein and nitrogenous molecules such as DNA, RNA, Purines and Pyrimidines. Nitrogen is therefore a significant factor limiting crops yield globally [2]. Legumes are highly valued for their ability to fix atmospheric N2 and contribute to the sustainability of cropping systems [3]. Legumes such as groundnut form a symbiotic relationship with the soil bacteria called rhizobia [4]. The symbiosis between legumes and rhizobia often result in the formation of root nodules in which atmospheric N2 is reduced into NH3 for plant growth, improvement of soil fertility, and healthy ecosystem functioning [4]. Legumes are therefore the best candidates for sustainable crop production, especially in nutrient-poor soils.
Crop production is low in Africa due to soil infertility [4]. Although the use of synthetic N fertilizers can improve soil fertility and increase crops yields [5], they are expensive and not accessible to smallholder farmers in Africa [6]. Incorporating grain legumes such as groundnut into cropping systems is a much cheaper and sustainable way to tap atmospheric N2 for increased crop yields, while maintaining environmental sustainability [7].
A few studies have shown that, in Africa, groundnut can meet its N nutrition from symbiotic fixation, whether in farmers’ fields [8] or experimental plots. Ref. [9] showed that groundnut varieties cultivated in South Africa could contribute symbiotic N of between 58 and 188 kg N ha−1 thus improving soil fertility in smallholder farmers and increase crop yields. Ref. [10] also showed that 30 field grown groundnut genotypes in South Africa could contribute symbiotic N of between 21 and 58.07 kg ha−1. Ref. [11] also found N-fixed between 48 to 108 kg ha−1 in 21 field-grown groundnut genotypes cultivated in Ghana. However, the actual amounts of N-fixed can vary due to biotic and abiotic factors such as environmental conditions, legume varieties, the rhizobial strain, crop growth stage, and soil N [12].
The production of groundnut is threatened by climate change, exacerbated by water scarcity and poor soil fertility, mainly due to N and P deficiencies. These factors negatively impact crop quality and yield [13]. The majority of smallholder farmers cultivating groundnut have low incomes and are resource-poor, and therefore do not commonly use fertilisers due to their high cost [14]. Consequently, crops are often naturally grown in soils with varying nutrient availability and moisture levels; that impair carbon accumulation and water-use efficiency (WUE) [15]. For example, it has been shown that approximately 40% of yield decline in grain legumes is caused by insufficient soil moisture [16].
South Africa is the 30th most-dry country in the world, with an annual average rainfall of less than 500 mm, which is significantly lower than the world annual average of 860 mm [17]. According to the National Water Act No. 38 (RSA, 1998), South Africa’s scarce water resources are limited in extent, and the country also has low levels of rainfall relative to the world average. The climate is characterised by low, unreliable and insufficient rainfall, high temperatures, low humidity, and high evapotranspiration. Rainfall is unequally distributed across the country’s catchments, leaving most of the western and northern regions rather dry. The effects of climate change, including rising atmospheric CO2 levels, reduced freshwater availability, and prolonged droughts, pose significant challenges to agriculture [18,19]. About 90% of groundnut production in South Africa relies on naturally rain-fed conditions, making increased rainfall variability within and between seasons, a significant challenge for crop production [18]. The WUE of a crop is linked to the plant’s ability to survive drought or low soil moisture. According to [20] WUE can be defined as dry matter produced per unit of water consumed and is best measured through C isotope discrimination in C3 crop species. Carbon isotope discrimination can also be defined as the ratio of stable isotopes of carbon (13C/12C) used by crops during photosynthesis, in contrast with the 13C/12C ratio in the atmosphere. In C3 crops, low stomatal conductance can result in reduced CO2 influx and decreased plant growth. During photosynthesis, lower 13C discrimination indicates greater WUE, while high 13C discrimination indicates low WUE. Thus, WUE can be used as an indicator to identify drought-tolerant C3 plants. However, a range of factors can affect the WUE of plants. For example, crops with lower shoot carbon accumulation may show reduced WUE when grown in less fertile soils than more fertile soils [21,22]. With climate change, there is also a need to develop drought-tolerant groundnut varieties that can produce economic yield even under low rainfall conditions. Carbon isotope discrimination during photosynthesis in C3 plants is known to correlate with water-use efficiency and can therefore be used to measure crop WUE [23]. Crops experiencing water limitation tend to show high WUE, measured as greater shoot δ13C values. However, with adequate soil moisture, crops exhibit lower shoot δ13C values due to increased discrimination against 13CO2 [24]. Carbon isotope discrimination has therefore been successfully employed to assess plant water relations in legumes and other C3 species [22]. The level of photosynthetic C accumulation in plants, is regulated by N nutrition [25]. Greater amounts of plant N can enhance chlorophyll and Rubisco biosynthesis and also increase the rates of photosynthesis [26], therefore, the C/N ratio is generally a good indicator of the N status of plants. The C/N value is a ratio of the mass of carbon to the mass of nitrogen in a substance [26,27]. This ratio indicates the availability of carbon and nitrogen for bacterial respiration [28,29]. A low nitrogen content or wide C/N ratio can result in slow decomposition of organic matter. Because bacteroids inside root nodules of symbiotic legumes reduce atmospheric N2 to NH3, nodulated legumes tend to have C/N values less than 24 g g−1 while non-legumes exhibit C/N ratio greater than 24 g g−1 [25]. It has been reported that plant residues of legumes typically undergo faster mineralization when their C/N ratios fall between 9.4 and 22.7 g g−1 [30,31]. Several other studies have assessed WUE using carbon isotopes discrimination for different crops and environment, for example in Bambara groundnut [9,32], Cowpea [3][35] for maize. We hypothesize that, there will be inter-annual genotypic and environmental influence on symbiotic parameters, grain yield and water use efficiency among the four groundnut varieties grown under field conditions. This study systematically evaluates, for the first time in the North West Province of South Africa, the inter-annual variations in symbiotic nitrogen fixation and water use efficiency among four major groundnut varieties during the 2023 and 2024 cropping seasons, using 15N and 13C natural abundance techniques.

2. Materials and Methods

Field experiments were conducted at the Agricultural Research Council-Grain Crops Institute (ARC-GCI) experimental site in Potchefstroom situated at coordinates 27°26′ S, 27°26′ E in North West Province, South Africa during 2023 and 2024 cropping seasons. The soil at the site contained 49.5% clay, with acidic to neutral pH (5.68–6.15) and classified as Alluvial according to South Africa National Biodiversity and Conservation [36] and received an average rainfall of 50.37 and 79.50 mm in the 2023 and 2024 cropping seasons with an annual average temperature of 21.2 °C. The experiment was laid out in a Randomized Complete Block Design (RCBD) with three replicates. Four locally promoted groundnut varieties were used namely Schubert, Kwarts, ARC K6 and PC 474. These locally promoted varieties, their genetic characteristics, their ability to fixed N and form effective nodulation and ability to withstand drought are not yet known. Each experimental plot had three rows with intra-row spacing of 5.5 cm, and inter-row spacing of 0.90 m. Soil samples were collected at a depth of 15–20 cm and processed for chemical analysis prior to planting. Details of rainfall and temperature recorded during the two cropping seasons are shown in Table 1.

2.1. Plant Sampling and Processing

At early-podding stage, 12 plants were randomly sampled from the two middle rows per plot for the four plots per variety, and then separated into nodules, roots, and shoots. The shoots were oven-dried at 65 °C for 72 h and weighed. The dried shoots were ground to a fine powder (0.85 mm sieve) and stored in vials for the 15N and 13C isotope analysis. To estimate soil N uptake, non-legume plant species (Cyperus rotundus L., Rumex obtusifolius, Xanthium strumarium, Solanum nigrum, Amaranthus spp., Daruta stramonium, Solanum carolinense L., Eleusine indica, Amaranthus hybridus and Aster subulatus) growing in the experimental plots were sampled for analysis as reference plants. The shoots of the reference plants were oven-dried for 72 h at 65 °C, weighed, ground to a fine powder, and similarly processed for the 15N isotopic analysis.

2.2. Measurement of Shoot N2 Fixation and C Accumulation

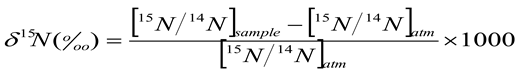
2.2.1. 15N/14N Isotopic Analysis

The analyses of 15N/14N isotopic ratios were performed at the Stable Light Isotope Laboratory, University of Cape Town, Rondebosch, South Africa. For this, 2.0 mg of finely-ground groundnut shoots and 2.5 mg of the reference plants samples were weighed into tin aluminium capsules and loaded onto a Thermo 2000 Elemental Analyzer coupled via a Thermo Conflo IV Plus stable light isotope mass spectrometer (Thermo Corporation, Bremen, Germany). Samples were combusted in an evacuated quartz tube and analysed to determine the ratio of 15N/14N and the N concentration (% N) in the plant material. An internal standard of Nasturtium spp. was included after every five runs of the plant samples to correct for machine errors during the isotopic fractionation. The results were normalized against in-house reference material and reported relative to an international standard (N in air). The 15N/14N ratio was used to calculate the isotopic composition (δ N) as described by [37].
The δ15N/14N values were calculated as:
Preprints 183278 i001
where: δ15Nref is the 15N natural abundance of non-N2-fixing reference plant, δ15Nleg is the 15N natural abundance of the legume, and B-value is the 15N natural abundance of groundnut plants deriving all their N nutrition from N2 fixation. The B-value (−2.70‰) used to calculate %Ndfa was obtained from [8]. The mean δ15N values (5.15‰ and 5.81‰) of the reference plants values were used in this study.

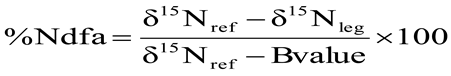
2.2.2. Nitrogen Derived from the Atmosphere (%Ndfa)

The proportion of N obtained from atmospheric N2 fixation was determined according to [38,39]:
Preprints 183278 i002
where: δ15Nref is the 15N natural abundance of non-N2-fixing reference plant, δ15Nlegis the 15N natural abundance of the legume, and B-value is the 15N natural abundance of groundnut plants deriving all their N nutrition from N2 fixation. The B-value (−2.70‰) used to calculate %Ndfa was obtained from [8]. The mean δ15N values (5.15‰ and 5.81‰) of the reference plants values were used in this study.

2.2.3. Shoot N Content

Shoot %N values were obtained directly from the mass spectrometer and the shoot N content computed as the product of %N and shoot dry matter, as described by [40]:
Ncontent = %Nshoot × dry massshoot

2.2.4. Amount of N-Fixed

The amount of N-fixed by the groundnut plants was calculated, as described by [38]:
N f i x e d = % N d f a 100 ×   l e g u m e   b i o m a s s   N
where, legume biomass N is the N content of the groundnut shoot.

2.2.5. Soil N Uptake

Total soil N uptake by the groundnut plants was determined as the difference between total N content of the legume and the amount of N-fixed.

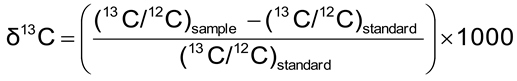
2.2.6. 13C/12C Isotopic Analysis

The 13C/12C isotopic analysis of the groundnut shoots was performed at the Stable Light Isotope Laboratory, Department of Archaeology, University of Cape Town, South Africa, as detailed for the 15N/14N analysis. Groundnut shoot samples were analysed to measure the 13C/12C ratios and C concentrations (%C). The 13C natural abundance (δ13C) values were obtained as described by [23].
Preprints 183278 i003
where, Rsample is the 13C/12C ratio of the sample and Rstandard is the 13C/12C isotopic ratio of PDB, a universally accepted standard from the Belemnite Pee Dee limestone formation. The %C of each plant sample was obtained directly from the mass spectrometer.

2.2.7. Carbon Content

The C content of the groundnut shoots was computed as the product of C concentration and shoot weight, where C concentration (%C) was obtained directly from the mass spectrometer:
C content = %Cplant organ × dry matterplant organ

2.2.8. C/N Ratio

The C/N values were determined as the ratio of C to N concentration in the plant shoots.

2.2.9. Determination of Grain Yield

Grain production per hectare was estimated using 12 plants sampled from the inner rows. Pods were harvested, shelled, and the grain air-dried to 13% moisture and weighed. Thereafter, the weight of 100 seed was determined, and grain yield assessed based on plant density.

2.2.10. Statistical Analyses

Data obtained from the field experiments were subjected to an analysis of variance using the Statistica analytical software program Version 10.1. A one-way ANOVA and where there were significant differences, Data obtained from the field experiments were subjected to an analysis of variance using the Statistica analytical software program Version 10.1. A one-way ANOVA and where there were significant differences, Tukey’s Honestly Significant Difference (HSD) was used to separate the means at p ≤ 0.05.

3. Results

3.1. Chemical Properties of Soil Analysis

The soil samples collected from the field in 2023 recorded pH of 5.68, 0.02% N and 0.83% SOC. The soil also contained 17 mg kg−1 P, 13 mg kg−1 Na, 200 mg kg−1 K, 358 mg kg−1 Mg and 900 mg kg −1 Ca, 9.20 mg kg−1 Fe, 2.44 mg kg−1 Zn and 28.22 mg kg−1 Mn. With the 2024 cropping season, soil exhibited pH 6.31, 0.03% N, 0.85% SOC, 24 mg kg−1 P, 20 mg kg−1 Na, 290 mg kg−1 K, 435 mg kg−1 Mg, 933 mg kg−1 Ca, 9.60 mg kg−1 Fe, 2.56 mg kg−1 Cu, 6.76 mg kg−1 Zn and 33.40 mg kg−1 Mn, as shown in Table 2.

3.2. Shoot δ15N of Reference Plants

Different non-leguminous crop species were sampled from the experimental plots at ARC-GCI during 2023 and 2024 cropping seasons as reference plants for estimating %Ndfa in groundnut varieties the results are shown in Table 3.

3.3. Plant Growth and Nodulation

The shoot dry matter and nodulation varied significantly among and between the four groundnut varieties in both 2023 and 2024 cropping seasons. Across the varieties Kwarts produced a higher shoot dry matter and nodulation in 2023 which ranged from 7.27 g plant−1 to 18.55 g plant−1 (Table 4). While in 2024, Kwarts only produced higher number of nodules and ARC K6 produced significantly more shoot dry matter while the shoot dry matter ranged from 17.75 g plant−1 to 85.87 g plant−1. In the 2023/2024 cropping seasons, variety Kwarts produced the highest number of nodules (28.0 nodules plant−1 and 35.0 nodules plant−1 respectively), followed by ARC K6 (25.0 nodules plant −1 and 32.0 nodules plant−1 respectively). However, in 2023 cropping season PC 474 produced the lowest number of nodules (17.0 nodules plant−1). With 2024 cropping season Schubert produced the least number of nodules (13 nodules plant−1). When comparing the two cropping seasons variety ARC K6 and PC 474 produced the highest number of nodules in contrast with other varieties as shown in Table 4 and Table 5.

3.4. N Concentration and N Content

The shoot N concentration was higher in Schubert, followed by PC 474, ARC K6 and Kwarts recorded the lowest shoot N concentration in 2023 cropping season. With 2024 the shoot N concentration differed among and between the four groundnut varieties, however, variety PC 474 (2.07%) was the highest, while variety Schubert (1.56%) was the lowest. The shoot N content varied significantly between and among the four groundnut varieties in both cropping seasons. The shoot N content was highest for variety Kwarts in 2023 and lowest in PC 474 (Table 4 and Table 5). In 2024, variety PC 474 exhibited much greater shoot N content, with variety Schubert being the lowest.

3.5. Shoot δ15N, %Ndfa and N-Fixed

The study showed that during both 2023 and 2024 cropping seasons, shoot δ15N, %Ndfa and N-fixed differed significantly among the four groundnut varieties. The shoot δ15N values ranged from −2.67‰ for variety PC 474 to −0.88‰ for Kwarts in 2023 cropping season (Table 4). In 2024 cropping season, however the shoot δ15N ranged from +1.46‰ to +3.18‰ for the four groundnut varieties (Table 5). Kwarts recorded the lowest δ15N (+1.46‰), followed by variety PC 474 (+2.92‰), Schubert (+3.12‰) with ARC K6 as the highest (+3.18‰). The percent N derived from fixation was markedly higher in 2023 than 2024, with values of 2023 ranging from 58.18% to 85.77%, and 2024 ranging from 35.51% to 58.63% (Table 4 and Table 5). Of the four tested groundnut varieties all of them obtained up to 50% of its N nutrition from symbiosis in 2023 cropping season, with 2024 only variety ARC K6 obtained less than 40% from its N nutrition. The amount of N-fixed was greater in 2024 than in 2023 due to higher shoot biomass in 2024. N-fixed ranged from 22.13 to 35.61 kg ha−1 in 2023, and 29.24–164.48 kg ha−1 (Table 4 and Table 5).

3.6. Soil N Uptake and Grain Yield

Soil N uptake closely mirrored symbiotic N. Soil N uptake ranged from 0.40 to 10.67 kg ha−1 in 2023, and 27.72–177.76 kg ha−1 in 2024. ARC K6 and PC 474 recorded the lowest soil N in 2023, and the highest in 2024. Grain yield also mirrored N-fixed and soil N uptake in 2023 and 2024, in that yield was much lower in 2023 and higher in 2024. In fact, the range for 2023 was 514.73 to 1207.96 kg ha−1, and 4305.46 to 7465.91 kg ha−1 in 2024 (Table 4 and Table 5).

3.7. Shoot C Concentration (%C) and C Content

Shoot C concentrations were similar. However, shoot C content was highly significant (p ≤ 0.05), and ranged from 2.82 g plant−1 for variety PC 474 to 6.59 g plant−1 for variety Kwarts, which had the highest C content compared to the other varieties. Variety PC 474 showed the lowest C content due to its lowest shoot dry matter in 2023 season (Table 4). With 2024 cropping season, shoot C concentration ranged from 34.76% to 39.05% for the four groundnut varieties (Table 5). The highest C concentration was recorded in the Kwarts variety (39.05%), followed by varieties PC 474 (37.68%), and ARC K6 (35.98%), while Schubert (34.76%) exhibited the lowest C concentration in shoots. Variety PC 474 exhibited the highest shoot C content, followed by ARC K6, Kwarts while Schubert showed the lowest C content (33.48 g plant−1, 29.89 g plant−1, 12.22 g plant−1 and 6.17 g plant−1), respectively for the four varieties (Table 4 and 5).

3.8. Shoot C/N Ratio and δ13C

The shoot C/N ratio varied significantly between and among the four groundnut varieties in 2023 cropping season. The C/N ratio on groundnut shoot were higher in variety ARC K6 (30.76 g g−1) followed by PC 474 (23.49 g g−1), Kwarts (23.13 g g−1) and Schubert (22.60 g g−1) was the lowest among the varieties (Table 4). Shoot C/N ratios ranged from 19.18 g g−1 to 21.53 g g−1 in 2024, though the four varieties recorded similar C/N values, as shown in Table 5. In this study, the δ13C values were similar in 2023 cropping season and ranged from −28.57‰ to −28.19‰ for the four test groundnut varieties (Table 4). The least negative shoot δ13C values were recorded in variety ARC K6, followed by PC 474, Schubert, and variety Kwarts showing the most negative shoot δ13C value (Table 5). With 2024, the shoot δ13C values were similar for all four groundnut varieties, though varieties Schubert and PC 474 recorded greater with δ13C values (−28.34‰ and −29.17‰, respectively) compared to ARC K6 and Kwarts which showed the lowest shoot δ13C values (−30.05‰ and 30.17‰, respectively) (Table 5).

3.9. Correlation Analysis of Groundnut Varieties in 2023 and 2024

In 2023, the shoot DM for variety Schubert correlated positively with N content (r = 0.999), N-fixed (r = 0.9592), and C content (r = 0.97). N content correlated negatively with C/N ratio (r = −0.9849), but positively with N-fixed (r = 0.9659), C content (r = 0.9708). For variety Kwarts, N content correlated positively with C concentration (r = 0.9654), C content (r = 0.9857), and N concentration correlated negatively with C/N ratio (r = −0.9807). %Ndfa correlated positively with Soil N uptake (r = 0.967), C content (r = 0.9798), and N-fixed correlated negatively with δ13C (r = −0.9561), Soil N uptake correlated positively with grain yield (r = 0.9933). For cultivar ARC K6, Nodule number correlated negatively with %Ndfa (r = −0.9802), and Soil N uptake (r = −0.9581). %Ndfa correlated positively with Soil N uptake (r = 0.9828). For variety PC 474, shoot DM correlated positively with N-fixed (r = 0.9918), C content (r = 0.9805), but correlated negatively with grain yield (r = −0.9996). δ13C correlated negatively with N content (r = −0.9935). C Content correlated negatively with grain yield (r = −0.975). Grain yield correlated negatively with N-fixed (r = −0.99) and N-fixed correlated positively with C content (r = 0.9702) (Table 6).
In 2024, variety Schubert N content correlated positively with N-fixed (r = 0.9532), Soil N uptake (r = 1.000), but negatively with C concentration (r = −0.9912), and C/N ratio (r = −0.9723), %Ndfa correlated negatively with C content (r = −0.9522). C concentration correlated negatively with Soil N uptake (r = −0.9905), and correlated positively with C/N ratio (r = 0.9947). For cultivar Kwarts, Shoot DM correlated positively with C content (r = 0.9869), N content (r = 0.952), and N content correlated negatively with C/N ratio (r = −0.9567). %Ndfa correlated negatively with δ15N (r = −0.9857). In 2024, ARC K6 shoot DM correlated positively with N content (r = 0.952), N content correlated positively with C content (0.9586), but correlated negatively with %Ndfa (r = −0.9883). Grain yield correlated positively with C/N ratio (r = 0.9721). δ13C correlated positively with C content (r = 0.977). For variety PC 474 in 2024, δ15N correlated positively with C/N ratio (r = 0.9562), but correlated negatively with grain yield (r = −0.9982), and %Ndfa correlated positively with Soil N uptake (r = 0.9815) (Table 6).

4. Discussion

Crop plant growth in Africa is generally poor due to soil infertility, leading to low grain yield especially on small-holder farms. Although the application of synthetic fertilizers can improve soil fertility and increase grain yield, they are inaccessible to small-holder farmers due to their high cost, this is in addition to their negative effect on the environment [9]. There is therefore a need to seek environmentally-friendly alternative to chemical N fertilizers. The study evaluated plant growth, root nodulation, symbiotic N2 fixation, soil N uptake, grain yield, carbon accumulation, C/N ratio, and δ13C in four groundnut varieties grown under field conditions at the Agricultural Research Council Grain Crops Institute, North West Province, South Africa, during the 2023 and 2024 cropping seasons. The Results revealed significantly marked differences in plant growth, N content, δ15N, %Ndfa, N-fixed, soil N uptake and grain yield in both 2023 and 2024 cropping seasons. In addition, root nodulation varied significantly between the varieties in both cropping seasons. However, in 2023 variety Kwarts produced a higher shoot dry matter (18.55 g plant1) from the increased root nodulation (28 nodules per plant). There was an increase in shoot biomass (85.87 g plant−1) and shoot %N (1.75), as well as shoot N content (1.44 g plant−1) in 2024 for variety ARC K6. These differences in plant growth and symbiotic functioning could be attributed to variation in mineral nutrient availability in the soil or drought since rainfall for the two cropping seasons differed. Variations of SNF have been reported among different groundnut genotypes under drought stress as reported by [41,42,43]. In 2024, for example, the field soil had pH 6.15 compared to the acidic pH 5.68 in 2023. Additionally, the soil used in 2024 contained relatively higher concentrations of N, P, K, Na, Ca, Mg, Fe, Mn and Zn than 2023. The relatively higher levels of these essentials nutrients would have, no doubt, promoted greater plant growth, root nodulation, N2 fixation and grain yield. It is also possible that the acidic pH 5.68 could have negatively affected rhizobial survival, leading to reduced nodulation, N2 fixation, and decreased yields. Beside the year-to-year differences in varietal performance, there were also location-specific variations. For example, at the 2023 site, the variety Kwarts recorded the highest nodulation, shoot biomass, N content, δ15N, amount of N-fixed and soil N uptake compared to the other varieties. In contrast, variety PC 474 exhibited the lowest shoot biomass, N content, δ15N, amount of N-fixed and soil N uptake. These differences are more likely cause by drought as the rainfall pattern differed for the two cropping seasons or differences in the varieties. As reported by [44,46], groundnut response to drought varies depending on the genotypic characteristics, crop growth stages, and environmental conditions. The shoot C concentrations differed significantly amongst the groundnut varieties in 2024 but not in 2023 cropping season, indicating differences in C accumulation through photosynthesis. In fact, shoot C concentration of the four groundnut varieties ranged from 35.58% to 39.01% in the 2023 cropping season and from 34.76% to 39.05% in the 2024 cropping season as shown in Table 4 and Table 5. Though the ranges were similar between seasons, they differed within 2024 season. When comparing cropping seasons, the results indicated that the Kwarts variety accumulated higher shoot C concentration in 2024, a finding similar to the results reported for legume crops [15]. The accumulation of carbon in plants is regulated by nitrogen nutrition, as higher N levels generally enhance chlorophyll and Rubisco biosynthesis, leading to increased rates of photosynthesis [47]. The C/N ratio in legumes often reflect the availability of photosynthate for bacterial respiration leading to greater N2 reduction by bacteroids in root nodules [47]. Nodulated legumes typically have lower C/N values of less than 24 g g−1 due to symbiotic N supply, and this can lead to faster dry matter mineralisation when the C/N ratios are lower and range between 9.4 and 22.7 g g−1. However, ratios exceeding 22.7 g g−1 can result in nitrogen immobilisation into microbial biomass [48]. In this study, of the four test groundnut varieties, the C/N ratios ranged from 22.60 g g−1 to 30.76 g g−1 in the 2023 cropping season and from 19.18 g g−1 to 21.53 g g−1 in the 2024 cropping season. Under those conditions, the dry matter of the three groundnut varieties Kwarts, ARC K6 and PC 474 are less likely to undergo faster decomposition to improve soil fertility. Perhaps, only the Schubert variety when incorporated into the soil was likely to improve soil fertility. In the 2024 cropping season, all four groundnut varieties recorded low C/N ratios, below 24 g g−1. These results would suggest higher N2 fixation in 2024, leading to greater plant growth, grain yield and low C/N ratios. The δ13C values of C3 plants are known to reflect WUE [23]. Less 13C discrimination tends to occur when leaf stomata close due to soil water deficit. Moreover, less negative δ13C values indicate greater WUE, while more negative δ13C values suggest lower WUE during photosynthesis. In this study, shoot 13C values varied for groundnut varieties in 2023 and 2024 cropping seasons. Because these δ13C values were low, ranging from −28.57‰ to −28.19‰ for 2023, and −30.17‰ to −28.34‰ for 2024, it would imply that these variations in 13C values could be as a result of drought since the rainfall data for the two cropping seasons differed. A correlation analysis in 2023 revealed a positive relationship between shoot DM for varieties Schubert (r = 0.9592), and PC 474 (r = 0.9918). There was also a negative correlation between N concentration and C/N ratio for varieties Schubert (r = −0.9849), Kwarts (r = −0.9807), whiles N-fixed also correlated negatively with δ13C for cultivar Kwarts (r = −0.9561). %Ndfa correlated positively with soil N uptake for varieties Kwarts (r = 0.9666) and ARC K6 (r = 0.9828). Grain yield correlated positively with Soil N uptake for variety Kwarts (r = 0.9933), but negatively with shoot DM for variety PC 474 (r = 0.9996), N-fixed (r = −0.99), and C content (r = −0.975). N content correlated positively with C content for varieties Schubert (r = 0.9708), and Kwarts (r = 0.9857). Nodule number correlated negatively with variety ARC K6 for %Ndfa (r = −0.9802), and Soil N uptake (r = −0.9581). N content correlated negatively with δ15N for variety PC 474 (r = −0.9935). In 2024, %Ndfa correlated negatively with C content for variety Schubert (r = −0.9522), δ15N for Kwarts (r = −0.9857), and N content for variety ARC K6 (r = −0.988). The shoot DM for variety Kwarts correlated positively with C content (r = 0.9869), and N content (r = 0.952). Variety ARC K6 shoot DM also correlated positively with N content (r = 0.952). The C/N ratio for variety Schubert correlated negatively with N content (r = −0.9723), but correlated positively with C concentration (r = 0.9947), and correlated negatively with N content for variety Kwarts (r = −0.9567). For variety Schubert, N content correlated positively with Soil N uptake (r = 1.000), but correlated negatively with C concentration (r = −0.9912), and N concentration correlated positively with N-fixed (r = 0.9532). The strongly significant correlation between symbiotic parameters clearly indicates the plants performance for Symbiotic N for their growth and metabolism if bacteroid supply of N was sustained. The negative correlation found between symbiotic parameters and WUE indicates the inhibition of N2-fixation and effect of drought on the groundnut varieties.

5. Conclusions

In conclusion, 15N and 13C natural abundance techniques was used to evaluate symbiotic performance and plant water relations in four groundnut varieties grown in field conditions. The findings revealed about 35.51 to 85.77% dependency on symbiotic N2 fixation for their N nutrition and contributed 22.13 to 168.48 kg of N-fixed ha−1 in both 2023 and 2024 cropping seasons. According to [49], drought tolerant groundnut genotypes were found to have higher %Ndfa than drought-susceptible ones, which is consistent with the high %Ndfa value recorded by variety Kwarts in the present study. Additionally, variety PC474 and ARC K6 were two higher N-fixed symbioses when comparing the two cropping seasons, which indicate that these two varieties could satisfy about 106–164 kg N ha−1 of their N-fixed from nodule symbiosis. The data from this study show that the groundnut varieties that fixed the most N also produced the greatest amounts of biomass, and provided markedly higher grain yields. This confirmed our view that the tested groundnut varieties and other grain legumes can be selected for high N2 fixation, superior plant growth, and greater grain yield, with this results these varieties has a potential to become significant biofertilizer in cropping systems of smallholder farmers and food security crop. The four test groundnut varieties, the C/N ratios ranged from 22.60 g g−1 to 30.76 g g−1 in the 2023 cropping season and from 18.68 g g−1 to 21.53 g g−1 in the 2024 cropping season. Under those conditions, the dry matter of the three groundnut varieties Kwarts, ARC K6 and PC 474 are less likely to undergo faster decomposition to improve soil fertility. Furthermore, it is significant to screen and identify groundnut varieties with superior symbiosis and improved water use efficiency for increase and improve food security in climate change challenge. The huge variations among the groundnut varieties in the present study could be association with drought and differences in genotypic characteristics that may exist among them. We recommend that more field trial should be conducted in contrasting environments together with rhizobial inoculant to properly exploit the full potential of the groundnut varieties Kwarts, ARC K6 and PC 474 for possible inclusion in breeding programs.

Author Contributions

M.M.M. collected samples, analysed data and drafted the original manuscript, R.P.G. was involved in supervision, providing resources, writing-reviewing and editing of the manuscript. T.Y.N. was involved in data analysis and manuscript editing. F.D.D. was the master’s supervisor of M.M.M., assisted in manuscript writing and editing. All authors have read and agreed to the published version of the manuscript.

Funding

This work was supported with the funds from the National Research Foundation (NRF). The Tshwane University of Technology is gratefully acknowledged for financial support.

Institutional Review Board Statement

Ethical waiver to conduct this study was obtained from the Tshwane University of Technology (TUT) Research Ethics Committee, approved on the 18 June 2024, with reference number: REC2024=05=003.

Data Availability Statement

All datasets generated for this study are included in the manuscript.

Acknowledgments

The authors appreciate the Agricultural Research Council-Grain Crops Institute (ARC-GCI) at Potchefstroom, Northwest Province, South Africa for availing their research field for the study and heartfelt thanks to Thobakgale for his invaluable assistance with sampling and the fields experiments and the National Research Foundation (NRF).

Conflicts of Interest

The authors declare that this research was conducted in the absence of any commercial or financial relationships that could be construed as a potential conflict of interest.

Abbreviations

The following abbreviations are used in this manuscript:
ARC-GCI Agricultural Research Council-Grain Crops Institute
Ca Calcium
Cu Copper
Fe Iron
K Potassium
MDPI Multidisciplinary Digital Publishing Institute
Mg Magnesium
Mn Manganese
N Nitrogen
N2 Di-Nitrogen
Na Sodium
%Ndfa Nitrogen derived from the atmosphere
NH3 Ammonia
NRF National Research Foundation
O2 Oxygen
P Phosphorus
Ph Potential Hydrogen
RCBD Randomised Complete Design Block
S Sulphur
SSA Sub-Saharan Africa
TUT Tshwane University of Technology
WUE Water-use efficiency
Zn Zinc

References

  1. Abady, S.; Shimelis, H.; Janila, P.; Mashilo, J. Groundnut (Arachis hypogaea L.) improvement in sub-Saharan Africa: A review. Acta Agric. Scand. Sect. B—Soil Plant Sci. 2019, 69, 528–545. [Google Scholar]
  2. Liliane, T.N.; Charles, M.S. Factors affecting yield of crops. Agron.—Clim. Change Food Secur. 2020, 9, 9–24. [Google Scholar]
  3. Kebede, E. Contribution, utilization, and improvement of legumes-driven biological nitrogen fixation in agricultural systems. Front. Sustain. Food Syst. 2021, 5, 767998. [Google Scholar] [CrossRef]
  4. Sharma, V.; Bhattacharyya, S.; Kumar, R.; Kumar, A.; Ibañez, F.; Wang, J.; Guo, B.; Sudini, H.K.; Gopalakrishnan, S.; DasGupta, M. Molecular basis of root nodule symbiosis between Bradyrhizobium and ‘crack-entry’legume groundnut (Arachis hypogaea L.). Plants 2020, 9, 276. [Google Scholar] [CrossRef]
  5. Dimkpa, C.; Adzawla, W.; Pandey, R.; Atakora, W.K.; Kouame, A.K.; Jemo, M.; Bindraban, P.S. Fertilizers for food and nutrition security in sub-Saharan Africa: An overview of soil health implications. Front. Soil Sci. 2023, 3, 1123931. [Google Scholar] [CrossRef]
  6. Tiemann, T.; Douxchamps, S. Opportunities and challenges for integrated smallholder farming systems to improve soil nutrient management in Southeast Asia. World Dev. Sustain. 2023, 3, 100080. [Google Scholar] [CrossRef]
  7. Snapp, S.; Silim, S. Farmer preferences and legume intensification for low nutrient environments. Plant Soil 2002, 245, 181–192. [Google Scholar] [CrossRef]
  8. Nyemba, R.C.; Dakora, F.D. Evaluating N2 fixation by food grain legumes in farmers’ fields in three agro-ecological zones of Zambia, using 15 N natural abundance. Biol. Fertil. Soils 2010, 46, 461–470. [Google Scholar] [CrossRef]
  9. Mokgehle, S.N.; Dakora, F.D.; Mathews, C. Variation in N2 fixation and N contribution by 25 groundnut (Arachis hypogaea L.) varieties grown in different agro-ecologies, measured using 15N natural abundance. Agric. Ecosyst. Environ. 2014, 195, 161–172. [Google Scholar] [CrossRef]
  10. Ngmenzuma, T.Y.; Oteng-frimpong, R.; Dakora, F.D. N2 fixation, grain mineral accumulation, and water-use efficiency in 30 field-grown groundnut (Arachis hypogaea L.) genotypes in Mpumalanga, South Africa, measured using 15N and 13C natural abundance techniques. Front. Agron. 2025, 7, 1483741. [Google Scholar] [CrossRef]
  11. Oteng-Frimpong, R.; Dakora, F.D. Multienvironment testing for trait stability and G× E interaction on N2 Fixation, plant development, and water-use efficiency of 21 elite groundnut (Arachis hypogaea L.) genotypes in the Guinea Savanna. Front. Plant Sci. 2019, 10, 446640. [Google Scholar] [CrossRef]
  12. Meena, R.S.; Das, A.; Yadav, G.S.; Lal, R. (Eds.) Legumes for Soil Health and Sustainable Management; Springer: Singapore, 2018; p. 541. [Google Scholar]
  13. Singh, A.; Nakar, R.; Goswami, N.; Kalariya, K.; Chakraborty, K.; Singh, M. Water deficit stress and its management in groundnut. Physiol. Nutr. Environ. Stress. Crop Product. 2013, 14, 371–465. [Google Scholar]
  14. Pandey, B.M.; Layek, J.; Das, A.; Choudhary, A.K.; Bahar, F.A.; Singh, S.; Mahdi, S. Agronomic interventions for increasing crop productivity and farmer’s income in Indian Himalayas. Indian J. Agron. 2023, 68, S177–S197. [Google Scholar]
  15. Keteku, A.K.; Yeboah, P.A.; Yeboah, S.; Dormatey, R.; Agyeman, K.; Brempong, M.B.; Ghanney, P.; Poku, S.A.; Danquah, E.O.; Frimpong, F.; et al. Plant nutrition in relation to water-use efficiency in crop production: A review. Agrica 2024, 17, 67–95. [Google Scholar] [CrossRef]
  16. Khatun, M.; Sarkar, S.; Era, F.M.; Islam, A.M.; Anwar, M.P.; Fahad, S.; Datta, R.; Islam, A.A. Drought stress in grain legumes: Effects, tolerance mechanisms and management. Agronomy 2021, 11, 2374. [Google Scholar] [CrossRef]
  17. DWAF. Report of the Department of Water Affair and Forestry; Department of Water Affair and Forestry: Pretoria, South Africa, 2002; Available online: https://www.gov.za/sites/default/files/gcis_document/201409/dwaf-ar-2002.pdf(accessed on).
  18. DAFF. A Profile of the South African Groundnut; Department of Agriculture Forestry and Fisheries: Pretoria, South Africa, 2015; Available online: http://webapps1.daff.gov.za/AmisAdmin/upload/Groundnut%20profile%2014/2015.pdf(accessed on).
  19. Lottering, S.; Mafongoya, P.; Lottering, R. Drought and its impacts on small-scale farmers in sub-Saharan Africa: A review. South Afr. Geogr. J. 2021, 103, 319–341. [Google Scholar] [CrossRef]
  20. Settaluri, V.; Kandala, C.; Puppala, N.; Sundaram, J. Peanuts and their nutritional aspects—A review. Food Nutr. Sci. 2012, 3, 1644–1650. [Google Scholar] [CrossRef]
  21. Querejeta, J.I.; Ren, W.; Prieto, I. Vertical decoupling of soil nutrients and water under climate warming reduces plant cumulative nutrient uptake, water-use efficiency and productivity. New Phytol. 2021, 230, 1378–1393. [Google Scholar] [CrossRef]
  22. Lusiba, S.G.; Maseko, S.T.; Odhiambo, J.J.O.; Adeleke, R. Biological N2 fixation, C accumulation and water-use efficiency (δ13C) of chickpea grown in three different soil types: Response to the addition of biochar from poultry litter and acacia. Acta Agric. Scand. Sect. B—Soil Plant Sci. 2022, 72, 931–944. [Google Scholar]
  23. Farquhar, G.D.; Ehleringer, J.R.; Hubick, K.T. Carbon isotope discrimination and photosynthesis. Annu. Rev. Plant Physiol. Plant Mol. Biol. 1989, 40, 503–537. [Google Scholar] [CrossRef]
  24. Werner, C.; Schnyder, H.; Cuntz, M.; Keitel, C.; Zeeman, M.J.; Dawson, T.; Badeck, F.-W.; BrugnolI, E.; Ghashghaie, J.; Grams, T.E. Progress and challenges in using stable isotopes to trace plant carbon and water relations across scales. Biogeosciences 2012, 9, 3083–3111. [Google Scholar] [CrossRef]
  25. Hobbie, E.A.; Macko, S.A.; Shugart, H.H. Patterns in N dynamics and N isotopes during primary succession in Glacier Bay, Alaska. Chem. Geol. 1998, 152, 3–11. [Google Scholar] [CrossRef]
  26. Kaschuk, G.; Kuyper, T.W.; LeffelaaR, P.A.; Hungria, M.; Giller, K.E. Are the rates of photosynthesis stimulated by the carbon sink strength of rhizobial and arbuscular mycorrhizal symbioses? Soil Biol. Biochem. 2009, 41, 1233–1244. [Google Scholar] [CrossRef]
  27. Thomas, R.J.; Asakawa, N. Decomposition of leaf litter from tropical forage grasses and legumes. Soil Biol. Biochem. 1993, 25, 1351–1361. [Google Scholar] [CrossRef]
  28. Tchobanoglous, G.; Theisen, H.; Vigil, S. Integrated Solid Waste Management, Engineering Principles and Management Issues; McGraw-Hill Inc.: Toronto, ON, Canada, 1993. [Google Scholar]
  29. Norbu, T.; Visvanathan, C.; Basnayake, B. Pretreatment of municipal solid waste prior to landfilling. Waste Manag. 2005, 25, 997–1003. [Google Scholar] [CrossRef]
  30. Hobbie, S.E. Effects of plant species on nutrient cycling. Trends Ecol. Evol. 1992, 7, 336–339. [Google Scholar] [CrossRef]
  31. Chen, X.; Cui, Z.; Fan, M.; Vitousek, P.; Zhao, M.; Ma, W.; Wang, Z.; Zhang, W.; Yan, X.; Yang, J. Producing more grain with lower environmental costs. Nature 2014, 514, 486–489. [Google Scholar] [CrossRef]
  32. Udeh, E.L.; Ngmenzuma, T.Y.; Maseko, S.T.; Nyila, M.A.; Kanu, S.A.; Mohale, K.C. Gas exchange and carbon assimilation of Bambara groundnut landraces co-inoculated with Bradyrhizobium japonicum and Bacillus subtilis under simulated drought stress. Sci. Afr. 2023, 21, e01823. [Google Scholar] [CrossRef]
  33. Ayalew, A.T. The synergic effects of climate variability on rainfall distribution over Hare catchment of Ethiopia. Adv. Meteorol. 2023, 1175426. [Google Scholar] [CrossRef]
  34. Arslan, A.; Zapata, F.; Kumarasinghe, K.S. Carbon isotope discrimination as indicator of water-use efficiency of spring wheat as affected by salinity and gypsum addition. Commun. Soil Sci. Plant Anal. 1999, 30, 2681–2693. [Google Scholar] [CrossRef]
  35. Zhang, C.; Zhang, J.; Zhang, H.; Zhao, J.; Wu, Q.; Zhao, Z.; Cai, T. Mechanisms for the relationships between water- use efficiency and carbon isotope composition and specific leaf area of maize (Zea mays L.) under water stress. Plant Growth Regulation 2015, 77, 233–243. [Google Scholar] [CrossRef]
  36. SANBI. 2024. Available online: https://www.sanbi.org/wp-content/uploads/2024/06/2021_NECS-Handbook.pdf (accessed on day month year).
  37. Mariotti, A.; Germon, J.C.; Hubert, P.; Kaiser, P.; Letolle, R.; Tardieux, A.; Tardieux, P. Experimental determination of nitrogen kinetic isotope fractionation: Some principles; illustration for the denitrification and nitrification processes. Plant Soil 1981, 62, 413–430. [Google Scholar] [CrossRef]
  38. Unkovich, M.; Herridge, D.; Peoples, M.; Cadisch, G.; Boddey, B.; Giller, K.; Alves, B.; Chalk, P. Measuring Plant-Associated Nitrogen Fixation in Agricultural Systems; Australian Centre for International Agricultural Research (ACIAR): Canberra, Austalia, 2008. [Google Scholar]
  39. Shearer, G.; Kohl, D.H. N2-fixation in field settings: Estimations based on natural 15N abundance. Funct. Plant Biol. 1986, 13, 699–756. [Google Scholar]
  40. Pausch, R.C.; Mulchi, C.L.; Lee, E.H.; Forseth, I.N.; Slaughter, L.H. Use of 13C and 15N isotopes to investigate O3 effects on C and N metabolism in soybeans. Part I. C fixation and translocation. Agric. Ecosyst. Environ. 1996, 59, 69–80. [Google Scholar] [CrossRef]
  41. Devi, M.J.; Sinclair, T.R.; Vadez, V. Genotypic variability among peanut (Arachis hypogea L.) in sensitivity of nitrogen fixation to soil drying. Plant Soil 2010, 330, 139–148. [Google Scholar] [CrossRef]
  42. Devi, J.M.; Rowland, D.L.; Payton, P.; Faircloth, W.; Sinclair, T.R. Nitrogen fixation tolerance to soil water deficit among commercial cultivars and breeding lines of peanut. Field Crops Res. 2013, 149, 127–132. [Google Scholar] [CrossRef]
  43. Furlan, A.; Llanes, A.; Luna, V.; Castro, S. Physiological and biochemical responses to drought stress and subsequent rehydration in the symbiotic association peanut-Bradyrhizobium sp. Int. Sch. Res. Not. 2012, 2012, 890–895. [Google Scholar] [CrossRef]
  44. Pimratch, S.; Jogloy, S.; Vorasoot, N.; Toomsan, B.; Kesmala, T.; Patanothai, A.; Holbrook, C.C. Effect of drought stress on traits related to N2 fixation in eleven peanut (Arachis hypogaea L.) genotypes differing in degrees of resistance to drought. Asian J. of. Plant Sci. 2008, 4, 334–342. [Google Scholar] [CrossRef]
  45. Mu, X.; Chen, Y. The physiological response of photosynthesis to nitrogen deficiency. Plant Physiol. Biochem. 2021, 158, 76–82. [Google Scholar] [CrossRef]
  46. Pimratch, S.; Jogloy, S.; Vorasoot, N.; Toomsan, B.; Kesmala, T.; Patanothai, A.; Holbrook, C.C. Heritability of N2 fixation traits, and phenotypic and genotypic correlations between N2 fixation traits with drought resistance traits and yield in peanut. Crop Sci. 2009, 49, 791–800. [Google Scholar] [CrossRef]
  47. Truong, T.H.H.; Marschner, P. Respiration, available N and microbial biomass N in soil amended with mixes of organic materials differing in C/N ratio and decomposition stage. Geoderma 2018, 319, 167–174. [Google Scholar] [CrossRef]
  48. Hobbie, E.A.; Macko, S.A.; Williams, M. Correlations between foliar δ15N and nitrogen concentrations may indicate plant-mycorrhizal interactions. Oecologia 2000, 122, 273–283. [Google Scholar] [CrossRef] [PubMed]
  49. Wang, X.; Chen, C.Y.; Dang, P.; Carter, J.; Zhao, S.; Lamb, M.C.; Chu, Y.; Holbrook, C.; Ozias-akins, P.; Isleib, T.G. Variabilities in symbiotic nitrogen fixation and carbon isotope discrimination among peanut (Arachis hypogaea L.) genotypes under drought stress. J. Agron. Crop Sci. 2023, 209, 228–241. [Google Scholar] [CrossRef]
Table 1. Temperature, rainfall and relative humidity recorded at ARC-GCI during 2023 and 2024 cropping seasons.
Temperature Rainfall Relative
°C (mm) Humidity
%
2023 Min Max Min Max
October 11.19 30.89 45.47 25.26 82.82
November 14.88 32.32 52.32 29.09 88.57
December 15.91 31.49 40.39 35.66 90.61
January 15.69 31.39 63.3 38.22 96.72
Average 14.42 31.51 50.37 32.06 89.68
2024 Min Max Min Max
October 15.43 34.06 17.78 32.11 96.82
November 14.49 33.74 51.31 29.18 93.79
December 9.92 27.95 161.80 35.84 97.75
January 5.29 29.26 87.12 21.26 93.38
Average 11.28 31.25 79.50 29.60 95.44
Table 2. Chemical and physical properties of the soil sampling from ARC-GCI during 2023 and 2024 cropping seasons.
Soil Properties Units Measurements
2023 2024
pH (H2O) 5.68 6.15
SOC % 0.85 0.83
Total N % 0.02 0.03
P mg kg−1 17 22
K mg kg−1 200 218
Na mg kg−1 13 18
Ca mg kg−1 900 923
Mg mg kg−1 358 410
S mg kg−1 22 6
Fe mg kg−1 9.20 9.60
Cu mg kg−1 2.44 2.40
Mn mg kg−1 28.26 31.60
Zn mg kg−1 4.84 6.44
Table 3. Reference plants sampled during 2023 and 2024 cropping seasons for estimating %Ndfa values by groundnuts at ARC-GCI.
2023 Cropping Season 2024 Cropping Season
Common Names Scientific Names δ15N (‰) Common Names Scientific Names δ15N (‰)
Purple Nutsedge Cyperus rotundus L. +5.05
Dock Rumex obtusifolius +5.82 PurpleNutsedge Cyperus rotundusL. +4.06
RoughCocklebur Xanthiumstrumarium +5.12 Goosegrass Eleusine indica L. +6.09
Nightshade Solanum nigrum +5.39 Smooth pigweed Amaranthus hybridus +5.76
Pigweed Amaranthus Spp. +5.95 Goosegrass Eleusine indica L. +5.89
Downy thorn apple Datura stramonium +4.57 Grondsel Senecio valgaris +6.27
Horsenette Solanum Carolinen L. +5.12
Average 5.145 Average 5.814
Table 4. Plant growth, symbiotic performance, C concentration, δ13C, C content and C/N ratio on four groundnut varieties grown under field conditions in 2023 cropping season at ARC-GCI.
Varieties Nodule No. Shoot DM N
Concentration
N Content N-Fixed Ndfa δ15N Soil N Uptake Grain Yield C
Concentration
C
Content
δ13C C/N Ratio
per plant g plant−1 % g plant−1 kg ha−1 % kg ha−1 kg ha−1 % g plant−1 g g−1
Schubert 14.0 ± 0.65 d 16.05 ± 1.19 b 1.76 ± 0.14 a 0.33 ± 0.01 ab 35.61 ± 1.74 a 82.95 ± 0.99 ab −1.64 ± 0.06 b 6.42 ± 0.74 b 1207.95 ± 62.92 a 39.01 ± 0.50 a 6.09 ± 0.68 a −28.30 ± 0.26 a 22.60 ± 1.65 b
Kwarts 28.0 ± 1.49 a 18.55 ± 037 a 1.60 ± 0.22 a 0.35 ± 0.01 a 33.05 ± 1.06 ab 85.77 ± 1.84 a −0.88 ± 0.78 c 10.67 ± 1.26 a 514.73 ± 57.66 d 35.58 ± 1.79 a 6.59 ± 0.35 a −28.19 ± 0.22 a 23.13 ± 2.22 ab
ARC K6 25.0 ± 0.65 b 12.65 ± 0.78 c 1.22 ± 0.03 a 0.15 ± 0.01 b 27.13 ± 0.90 b 76.56 ± 0.79 b −2.14 ± 0.17 ab 2.40 ± 0.08 c 785.82 ± 20.53 c 37.49 ± 0.83 a 4.74 ± 0.31 b −28.57 ± 0.22 a 30.76 ± 0.77 a
PC 474 17.0 ± 1.49 c 7.27 ± 0.56 d 1.65 ± 0.05 a 0.11 ± 0.00 c 22.13 ± 0.87 c 58.18 ± 1.53 c −2.67 ± 0.08 a 0.41 ± 0.061 d 812.73 ± 20.33 b 38.75 ± 0.71 a 2.82 ± 0.24 c −28.41 ± 0.16 a 23.49 ± 0.46 ab
F-statistics 34.03 *** 38.60 *** 3.05 ns 153.66 *** 25.55 *** 14.35 *** 3.60 * 38.46 *** 40.16 *** 2.094 ns 15.31 *** 0.54 ns 7.047 **
Values (Means ± SE) with dissimilar letters in a column are significant at * p ≤ 0.05, ** p ≤ 0.01, *** p ≤ 0.001 and ns = not significant.
Table 5. Plant growth, symbiotic performance C concentration, δ13C, C content and C/N ratio on four groundnut varieties grown under field conditions in 2024 cropping season at ARC-GCI.
Varieties Nodule No. Shoot DM N N Content N-Fixed Ndfa% δ15N Soil N Uptake Grain Yield C C Content δ13C C/N Ratio
per plant g plant−1 % g plant−1 kg ha−1 kg ha−1 kg ha−1 % g plant−1 g g−1
Schubert 13.0 ± 0.63 b 17.74 ± 0.92 d 1.56 ± 0.12 b 0.28 ± 0.02 c 29.24 ± 1.27 c 58.63 ± 0.79 a 3.12 ± 0.65 a 27.72 ± 1.61 c 4305.45 ± 365.8 c 34.76 ± 0.69 b 6.17 ± 0.35 c −28.34 ± 0.97 a 21.23 ± 0.82 a
Kwarts 35.0 ± 0.85 a 30.64 ± 3.46 c 1.73 ± 0.08 ab 0.58 ± 0.07 b 44.49 ± 1.48 b 56.24 ± 1.33 ab 1.46 ± 0.32 b 64.23 ± 1.49 b 6349.55 ± 375.7 ab 39.05 ± 0.39 a 12.22 ± 1.12 b −30.17 ± 0.25 a 21.53 ± 1.65 a
ARC K6 32.0 ± 1.11 ab 85.87 ± 3.80 a 1.75 ± 0.09 ab 1.44 ± 0.07 ab 106.86 ± 4.99 ab 35.51 ± 0.79 c 3.18 ± 0.06 a 141.84 ± 2.98 ab 5424.09 ± 392.9 b 35.98 ± 1.56 ab 29.89 ± 1.10 ab −30.05 ± 0.30 a 19.18 ± 0.72 a
PC 474 19.0 ± 0.95 c 81.57 ± 2.49 ab 2.07 ± 0.12 a 1.66 ± 0.09 a 164.48 ± 1.64 a 52.53 ± 0.38 b 2.92 ± 0.41 ab 177.76 ± 1.11 a 7465.91 ± 747.3 a 37.68 ± 0.96 ab 33.48 ± 1.38 a −29.17 ± 0.29 a 21.00 ± 0.73 a
F-statistics 134.87 *** 144.87 *** 4.29 * 95.76 *** 489.71 *** 138.72 *** 3.87 * 1275.33 *** 7.32 ** 3.54 * 157.66 *** 22.46 ns 1.009 ns
Values (Means ± SE) with dissimilar letters in a column are significant at * p ≤ 0.05, ** p ≤ 0.01, *** p ≤ 0.001 and ns = not significant.
Table 6. Correlation analysis of groundnut genotypes planted under field conditions during 2023–2024 cropping seasons at North West Province, South Africa.
2023
Variety Parameter R-Value p-Value
Schubert Shoot DM vs. N content 0.999 0.0001
Shoot DM vs. N-fixed 0.9592 0.041
Shoot DM vs. C content 0.97 0.03
N concentration vs. C/N ratio −0.9849 0.015
N content vs. N-fixed 0.9659 0.034
N content vs. C content 0.9708 0.029
Kwarts N concentration vs. C/N ratio −0.9807 0.019
N content vs. C concentration 0.9654 0.035
N content vs. C content 0.9857 0.014
%Ndfa vs. Soil N uptake 0.9666 0.033
%Ndfa vs. C content 0.9798 0.02
N-fixed vs. δ13C −0.9561 0.044
Soil N uptake vs. Grain yield 0.9933 0.007
ARCK6 Nodule no. vs. %Ndfa −0.9802 0.02
Nodule no. vs. Soil N uptake −0.9581 0.042
%Nfa vs. Soil N uptake 0.9828 0.017
PC474 Shoot DM vs. N-fixed 0.9918 0.008
Shoot DM vs. Grain yield −0.9996 0.0001
Shoot DM vs. C content 0.9805 0.02
N content vs. δ15N −0.9935 0.006
N-fixed vs. grain yield −0.99 0.01
N-fixed vs. C content 0.9702 0.03
Grain yield vs. C content −0.975 0.025
2024
Variety parameter p-value R-value
Shubert N concentration vs. N-fixed 0.9532 0.047
N content vs. Soil N up take 1.000 0.0001
N content vs. C concentration −0.9912 0.009
N content vs. C/N ratio −0.9723 0.028
%Ndfa vs. C content −0.9522 0.048
C concentration vs. Soil N uptake −0.9905 0.009
C concentration vs. C/N ratio 0.9947 0.005
Kwarts Shoot DM vs. C content 0.9869 0.013
Shoot DM vs. N content 0.952 0.045
N content vs. C/N ratio −0.9567 0.043
δ15N vs. %Ndfa −0.9857 0.014
ARC K6 Shoot DM vs. N content 0.952 0.048
N content vs. %Ndfa −0.988 0.012
N content vs. C content 0.9586 0.041
Grain yield vs. C/N ratio 0.9721 0.028
δ13C vs. C content 0.977 0.023
PC 474 δ15N vs. Grain yield −0.9982 0.002
δ15 vs. C/N ratio 0.9562 0.044
%Ndfa vs. Soil N uptake 0.9815 0.018
Disclaimer/Publisher’s Note: The statements, opinions and data contained in all publications are solely those of the individual author(s) and contributor(s) and not of MDPI and/or the editor(s). MDPI and/or the editor(s) disclaim responsibility for any injury to people or property resulting from any ideas, methods, instructions or products referred to in the content.
Copyright: This open access article is published under a Creative Commons CC BY 4.0 license, which permit the free download, distribution, and reuse, provided that the author and preprint are cited in any reuse.
Prerpints.org logo

Preprints.org is a free preprint server supported by MDPI in Basel, Switzerland.

Subscribe

Disclaimer

Terms of Use

Privacy Policy

Privacy Settings

© 2025 MDPI (Basel, Switzerland) unless otherwise stated