1. Introduction
Biliary tract cancer (BTC) includes malignant tumours, such as intrahepatic cholangiocarcinoma, gallbladder cancer, extrahepatic cholangiocarcinoma and cancer of the papilla of Vater [
1]. Currently, surgery remains the only curative treatment; however, early detection is often difficult, and the prognosis is generally poor [
2,
3]. Furthermore, the postoperative recurrence rate remains high [
4], necessitating the development of effective chemotherapy regimens [
5]. Combination therapy with gemcitabine plus cisplatin (GC) has been considered the standard treatment for chemotherapy; however, the associated median survival of 11.7 months is unsatisfactory [
6]. In 2022, Oh et al. demonstrated that combination therapy with GC plus durvalumab (GCD) improved overall survival (OS), with a hazard ratio (HR) of 0.8 in the TOPAZ-1 trial [
7]. The median OS with this treatment in the final analysis was 12.9 months [
8]. Furthermore, the KEYNOTE-966 trial reported that GC plus pembrolizumab (GCP) combination therapy improved median OS to 12.7 months, with an HR of 0.83 compared with GC [
9]. Consequently, GC plus immune checkpoint inhibitors (ICIs) are now positioned as the standard treatment for advanced cholangiocarcinoma [
10]. Notably, Ioka et al. reported in the KHBO1401-MITSUBA trial that GC plus S-1 (GCS) improved median OS to 13.5 months compared with GC therapy, alone, with an HR of 0.79 [
11]. Although GCS therapy is currently approved only in a limited number of countries, it combines oral treatment with intravenous cytotoxic anticancer agents. Potential benefits include the possibility of reducing the frequency of intravenous outpatient visits and controlling drug costs. Although noninferiority of GS therapy to GC therapy has been reported by Morizane et al. [
12], no randomised controlled trials directly comparing GCD therapy and GCS therapy have been published. In the present study, we prospectively registered cases undergoing either GCS or GCD therapy to evaluate the equivalence of these therapies for unresectable advanced BTC and to examine treatment costs. We assessed OS, PFS and objective response rates (ORR). Furthermore, we performed propensity score matching (PSM) to adjust for patient background factors and then re-evaluated OS, PFS, and ORR, whilst also examining the costs incurred until treatment completion.
2. Materials and Methods
2.1. Patients
All patients with advanced BTC at our hospital for whom radical surgery was deemed unfeasible (on the basis of the decision of our Hepatobiliary Pancreatic Surgery, Internal Medicine and Radiology Department conferences) or who experienced postoperative recurrence and who received GCS or GCD as initial treatment between April 2020 and April 2024 were prospectively registered, provided that informed consent for participation in the study was obtained. Cases in which resection was considered potentially feasible at diagnosis and who received chemotherapy as neoadjuvant therapy with the intention of surgery were excluded. BTC comprised intrahepatic cholangiocarcinoma, extrahepatic cholangiocarcinoma, gallbladder cancer or histologically confirmed cancer of the ampulla of Vater. In principle, every effort was made to register all cases. The choice of treatment modality was left to the judgement of the attending physician and the patient’s wishes. The present study was approved by the Ethics Committee of Kyushu Cancer Center (approval number: 2020-14) and conformed to the principles of the 1975 Declaration of Helsinki.
2.2. Evaluation of Therapeutic Response and Safety
Prior to treatment, patients generally underwent a medical history review and physical examination, imaging studies using contrast-enhanced computed tomography or magnetic resonance imaging and blood tests. Where clinically feasible, tumour biopsy was performed before treatment to establish a definitive pathological diagnosis. Physical examinations and blood tests were performed before the start of each treatment course. Carcinoembryonic antigen and glycoantigen 19-9 concentrations were measured at study enrolment and monthly thereafter. Toxicity was assessed using the Common Terminology Criteria for Adverse Events version 4.0 [
13]. In patients with measurable target lesions, the ORR was evaluated in accordance with the Response Evaluation Criteria in Solid Tumors (RECIST) version 1.1 [
14]. Additional imaging studies were performed at the discretion of the treating physician.
2.3. Treatment Protocol
In the GCS group, gemcitabine and cisplatin were administered intravenously on Day 1 at doses of 1000 and 25 mg/m² respectively, in 14-day cycles. Oral S-1 was administered twice daily for 7 consecutive days starting on Day 1 of each cycle. The S-1 dose was calculated on the basis of body surface area (BSA) as follows: BSA < 1.25 m², 80 mg/day; BSA ≥ 1.25 m2 and < 1.5 m², 100 mg/day and BSA ≥ 1.5 m², 120 mg/day. Chemotherapy was initiated on Day 1 and repeated when the following criteria were met: neutrophil count ≥ 1500/µL, platelet count ≥ 100,000/µL, total bilirubin ≤ 3.0 mg/dL, aspartate aminotransferase and alanine aminotransferase ≤ 150 IU/L and creatinine ≤ 1.2 mg/dL. GCS was administered only if there were no incidents of fever due to infection (≥ 38°C), Grade ≥ 2 stomatitis or diarrhoea, or Grade ≥ 3 nonhaematological toxicities (excluding blood test abnormalities unrelated to the investigational drug). If the above criteria were not met, chemotherapy was deferred until recovery. S-1 was discontinued during the treatment period if any of the following criteria were met: neutrophil count < 1000/mm³, platelet count < 75,000/µL, total bilirubin > 3.0 mg/dL and aspartate aminotransferase and alanine aminotransferase > 150 IU/L, or if any of the aforementioned precondition thresholds were exceeded. Furthermore, if gemcitabine-related Grade 4 neutropenia, Grade 4 thrombocytopenia, febrile neutropenia or Grade 3 nonhaematological toxicity occurred, the subsequent gemcitabine dose was reduced to 800 mg/m². With additional toxicity after this dose reduction, the dose was reduced to 600 mg/m². If necessary, subsequent gemcitabine doses were reduced by 20%. If diarrhoea, stomatitis, anorexia, nausea or fatigue (Grade 3) associated with S-1 administration occurred, the S-1 dose was reduced in the subsequent cycle as follows: 80/60, 100/80 or 120/100 mg/day (predose/postdose). If further S-1 dose reductions were required, the dose was reduced in the subsequent cycle as follows: 60/50, 50/40, 40/20 or 20/0 mg/day (predose/postdose). Cisplatin was interrupted until recovery if the patient met any of the following criteria during treatment: cisplatin-related neuropathy (Grade ≥ 2) or hearing impairment. Each agent was permitted to be re-escalated to the previous dose once toxicity was deemed sufficiently resolved. Protocol treatment was discontinued upon occurrence of any of the following: deterioration in general condition due to disease progression, unacceptable or recurrent treatment-related toxicity, patient refusal or tumour response with potential for curative resection.
In the GCD group, durvalumab (1500 mg) was administered intravenously on Day 1 of each 21-day cycle, whilst gemcitabine (1000 mg/m²) and cisplatin (25 mg/m²) were administered on Days 1 and 8 of each cycle. Following eight cycles, durvalumab 1500 mg monotherapy was continued until clinical or radiographic disease progression, unacceptable toxicity, patient refusal or fulfilment of other discontinuation criteria. Durvalumab was suspended until Grade ≤ 1 toxicity was reached for Grade 2 interstitial pneumonia, hepatic dysfunction, colitis, diarrhoea, renal impairment, neuropathy or skin disorders. Treatment was discontinued if any of the aforementioned immune-related adverse events (IrAEs) progressed to Grade ≥ 3, or if Grade ≥ 2 myocarditis, myasthenia gravis or encephalitis occurred. For gemcitabine-related Grade 4 neutropenia, Grade 4 thrombocytopenia, febrile neutropenia or Grade 3 nonhaematological toxicity, subsequent gemcitabine doses were reduced to 800 mg/m². With further toxicity after this reduction, the dose was reduced to 600 mg/m². If additional gemcitabine dose reductions were necessary, subsequent doses were reduced by 20%. Cisplatin was interrupted until recovery if patients met any of the following criteria during the treatment period: cisplatin-related neuropathy (Grade ≥ 2) or hearing impairment.
2.4. Measured Parameters
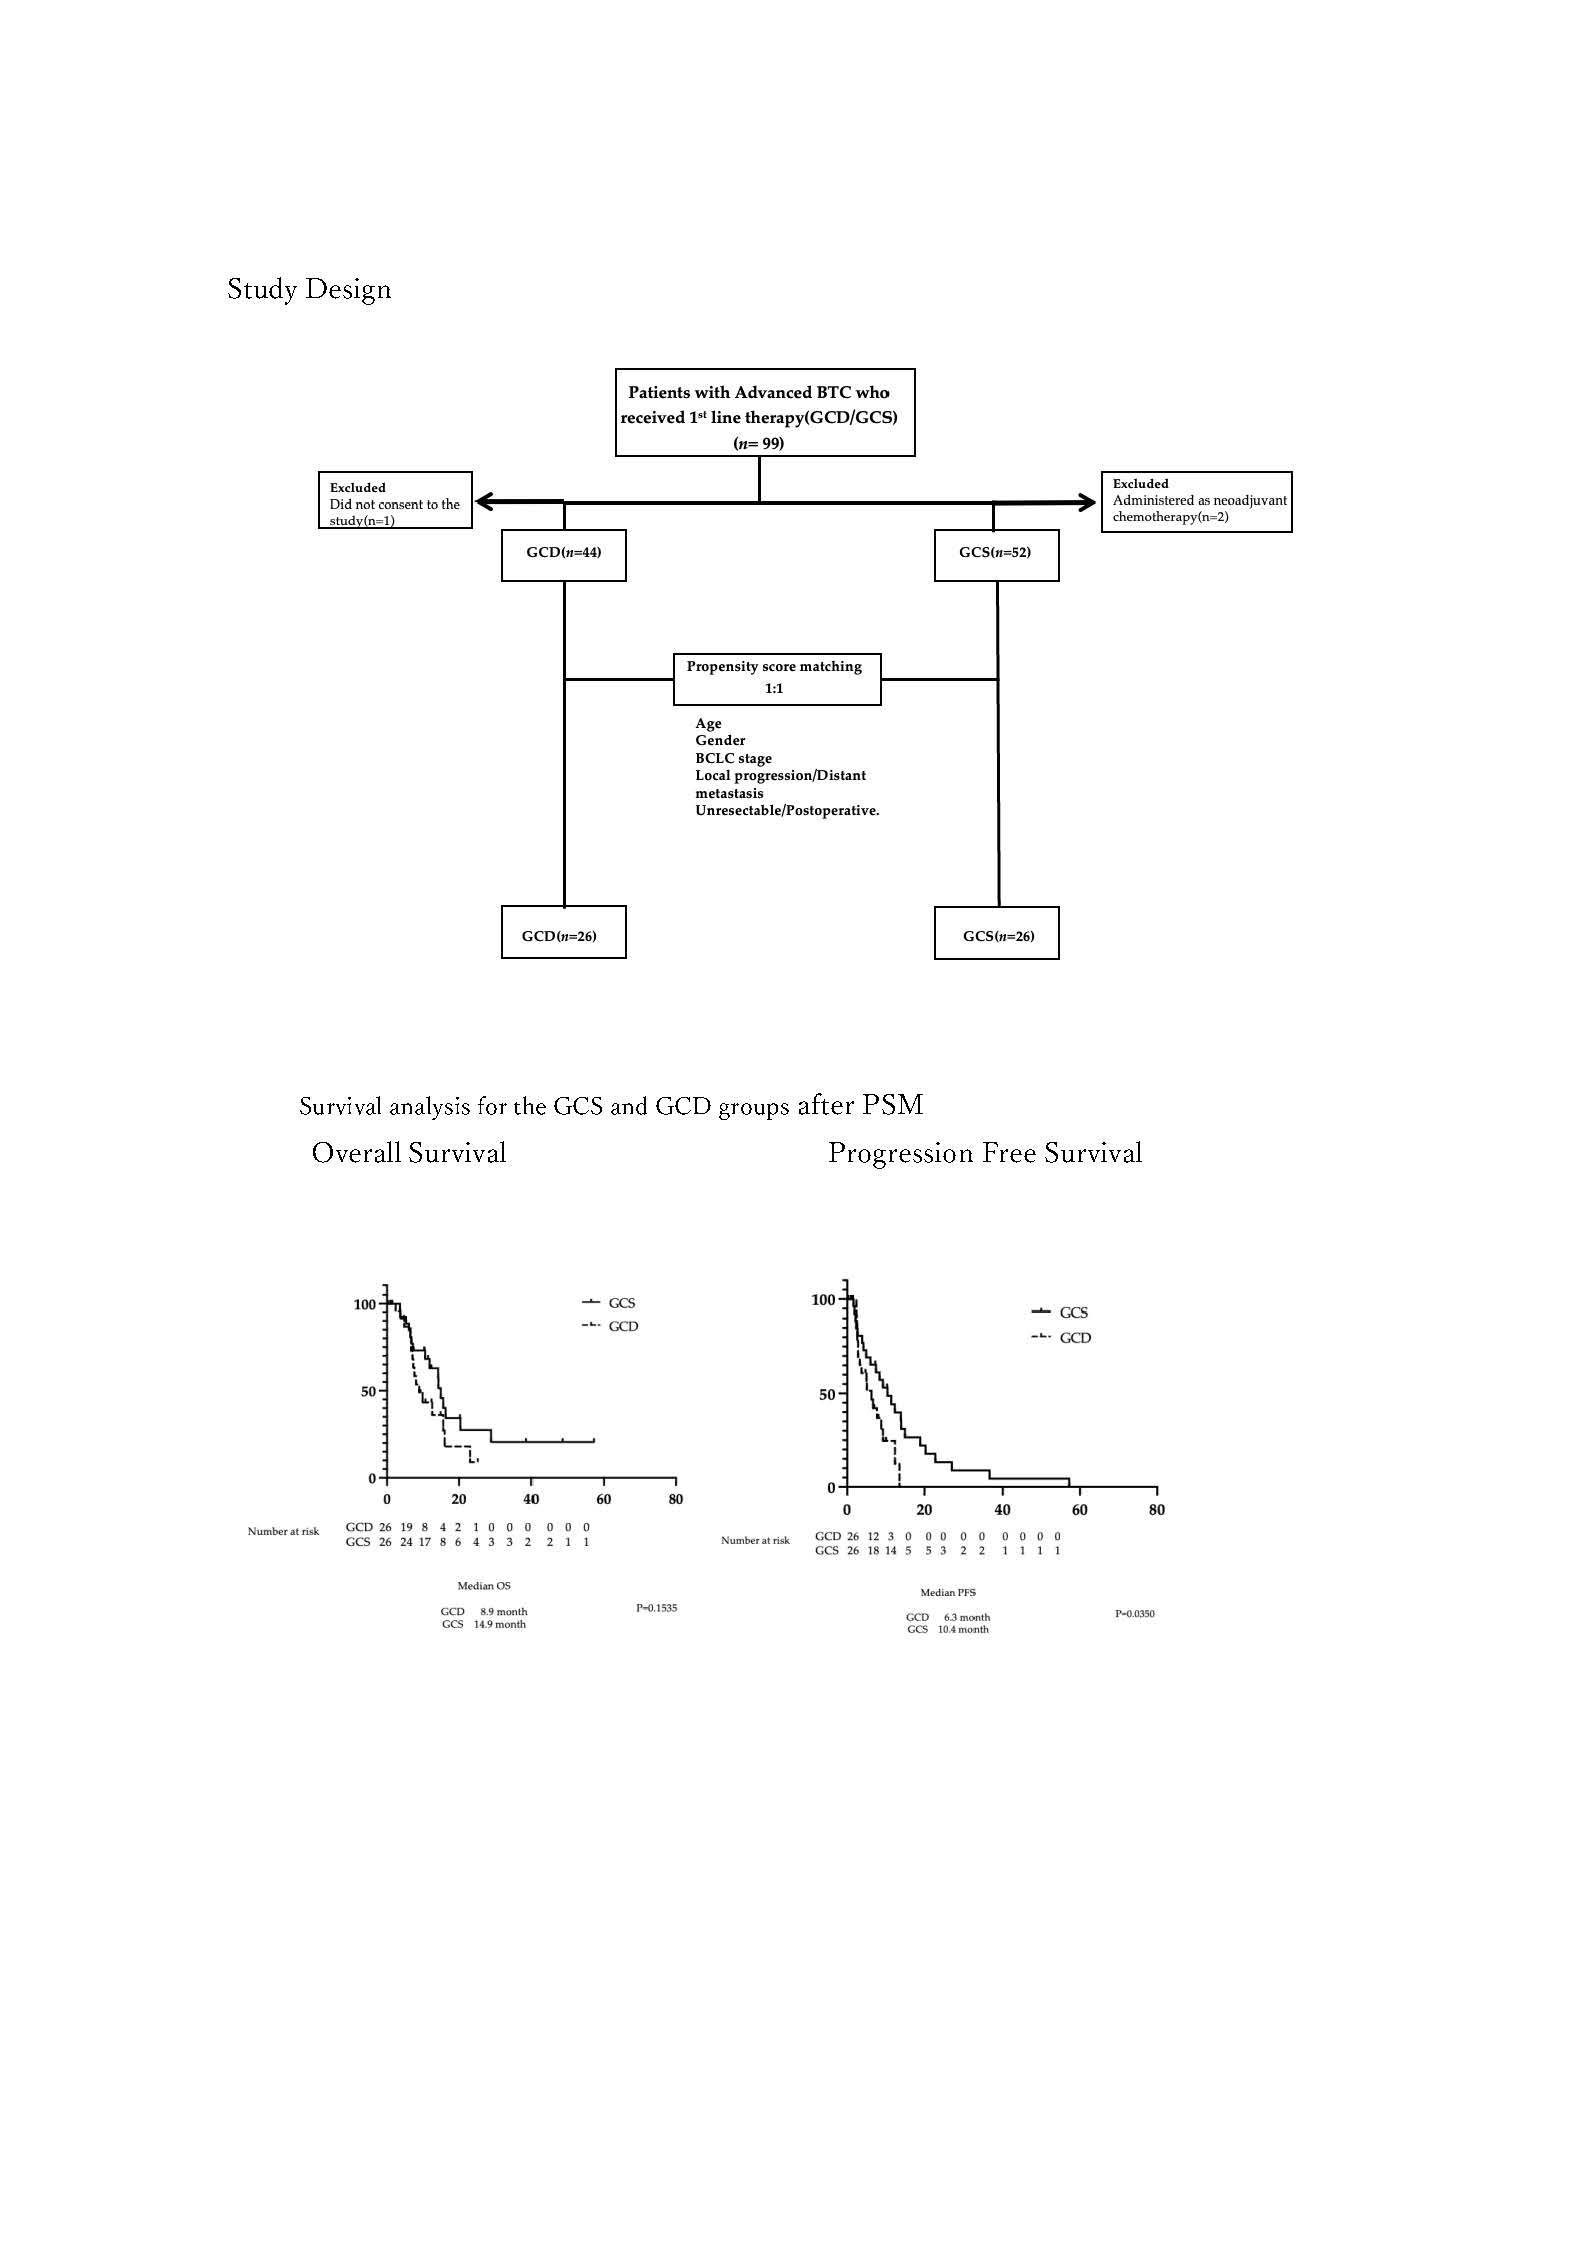
We analysed the following patient data: clinical characteristics; treatment duration; medication costs until treatment completion; therapeutic response, namely OS, PFS, ORR and disease control rates (DCRs); presence or absence of conversion therapy; and adverse events. OS was defined as the time between the start date of GCS or GCD administration and the date of death. PFS was defined as the time between the start date of GCS or GCD administration and the date of the final follow-up examination, disease progression or death, whichever occurred first. Subsequently, PSM was performed between the GCS and GCD groups using age, sex, stage, local progression/distant metastasis and unresectable/postoperative recurrence as the evaluated factors (
Figure 1). Using the 26 matched pairs extracted from the PSM, OS, PFS, ORR and DCR were compared between the GCS and GCD groups. Drug costs incurred until the end of treatment were also compared. Survival follow-up was conducted for patients who survived after treatment completion.
2.5. Statistical Analysis
Continuous data are presented as medians and ranges. The GCS (n = 52) and GCD (n = 44) groups were matched using PSM to reduce the influence of confounding factors. Five factors that were considered to affect the prognosis of progressive bile duct cancer with differences in the patient’s backgrounds were included as baseline variables: age, gender, stage, local progression/distant metastasis and unresectable/postoperative recurrence. The propensity scores for the GCS and GCD groups were 0.681 ± 0.213 and 0.376 ± 0.259, respectively (mean ± standard deviation). The area under the receiver operating characteristic curve was 0.8131. This propensity score was used for one-to-one nearest-neighbour matching, and the calliper width was set at 0.10. This resulted in the selection of 27 participants from each of the GCS and GCD groups. The propensity scores after matching were 0.571 ± 0.183 and 0.569 ± 0.180 for the GCS and GCD groups, respectively. OS and PFS are reported as median values, expressed in months, with 95% confidence intervals (CIs). Survival curves were plotted using the Kaplan–Meier product-limit method. The roles of other variables in survival were assessed using the log-rank test. ORR and DCR were analysed using Fisher’s exact probability test; p < 0.05 was considered statistically significant.
3. Results
3.1. Results Before PSM
3.1.1. Patient Characteristics Before PSM
We enrolled patients at our hospital deemed ineligible for curative surgery (determined by our hepatobiliary-pancreatic multidisciplinary team) or who experienced postoperative recurrence, who received GCS as initial treatment between April 2020 and April 2024. Of these 54 cases, 52 were enrolled after excluding two cases considered resectable at diagnosis who received preoperative adjuvant chemotherapy. Additionally, 44 cases were enrolled from the 45 patients who received GCD between March 2023 and April 2024 after excluding one case in which consent for study participation could not be obtained (
Figure 1). BTC comprised intrahepatic cholangiocarcinoma, extrahepatic cholangiocarcinoma, gallbladder cancer or histologically confirmed cancer of the ampulla of Vater. All patients receiving GCS or GCD who met the inclusion criteria were enrolled, excepting the aforementioned case without study participation consent. The patients’ background characteristics are shown in
Table 1. The overall male-to-female ratio was 62.5% male. Although not statistically significant, the GCS group showed a slightly higher proportion of men (71%) compared with the GCD group (52%) (p=0.0899). The median age was 66.5 years. The median age in the GCS group was 63.9 (61.3–66.6) years, whilst the GCD group had a significantly younger median age of 67.3 (64.4–70.2) years (p=0.0437). The primary sites were intrahepatic (38.5%), hilar (22.9%), distal bile duct (11.4%), gallbladder (25.0%) and ampullary (2.1%). Intergroup comparisons of primary site distribution revealed no significant differences (Chi-square test, χ² = 5.57; degrees of freedom = 4; p=0.234). Regarding stage, the GCS group included relatively early-stage cases (Stage I: 6%, Stage II: 15%, Stage III: 13% and Stage IV: 65%), whereas the GCD group contained no early-stage cases (Stage III: 13% and Stage IV: 86%). There was a significant difference between groups, with the GCS group having more early-stage cases (p=0.0002). Regarding primary unresectability or postoperative recurrence, 96% of the patients in the GCS group experienced postoperative recurrence, whereas only 68% of the GCD group did, indicating a significant difference, with more primary unresectable cases in the GCD group. When examining whether unresectable status was because of local progression or distant metastasis, the GCS group showed 28% local progression and 62% distant metastasis rates, whereas the GCD group had rates of 20% for local progression and 80% for distant metastasis. Although not statistically significant, there was a tendency for fewer distant metastases in the GCS group (p=0.0555). The median observation period was 18.6 months for GCS and 12.2 months for GCD, with the longest observation period being 57.9 months for GCS and 25.2 months for GCD.
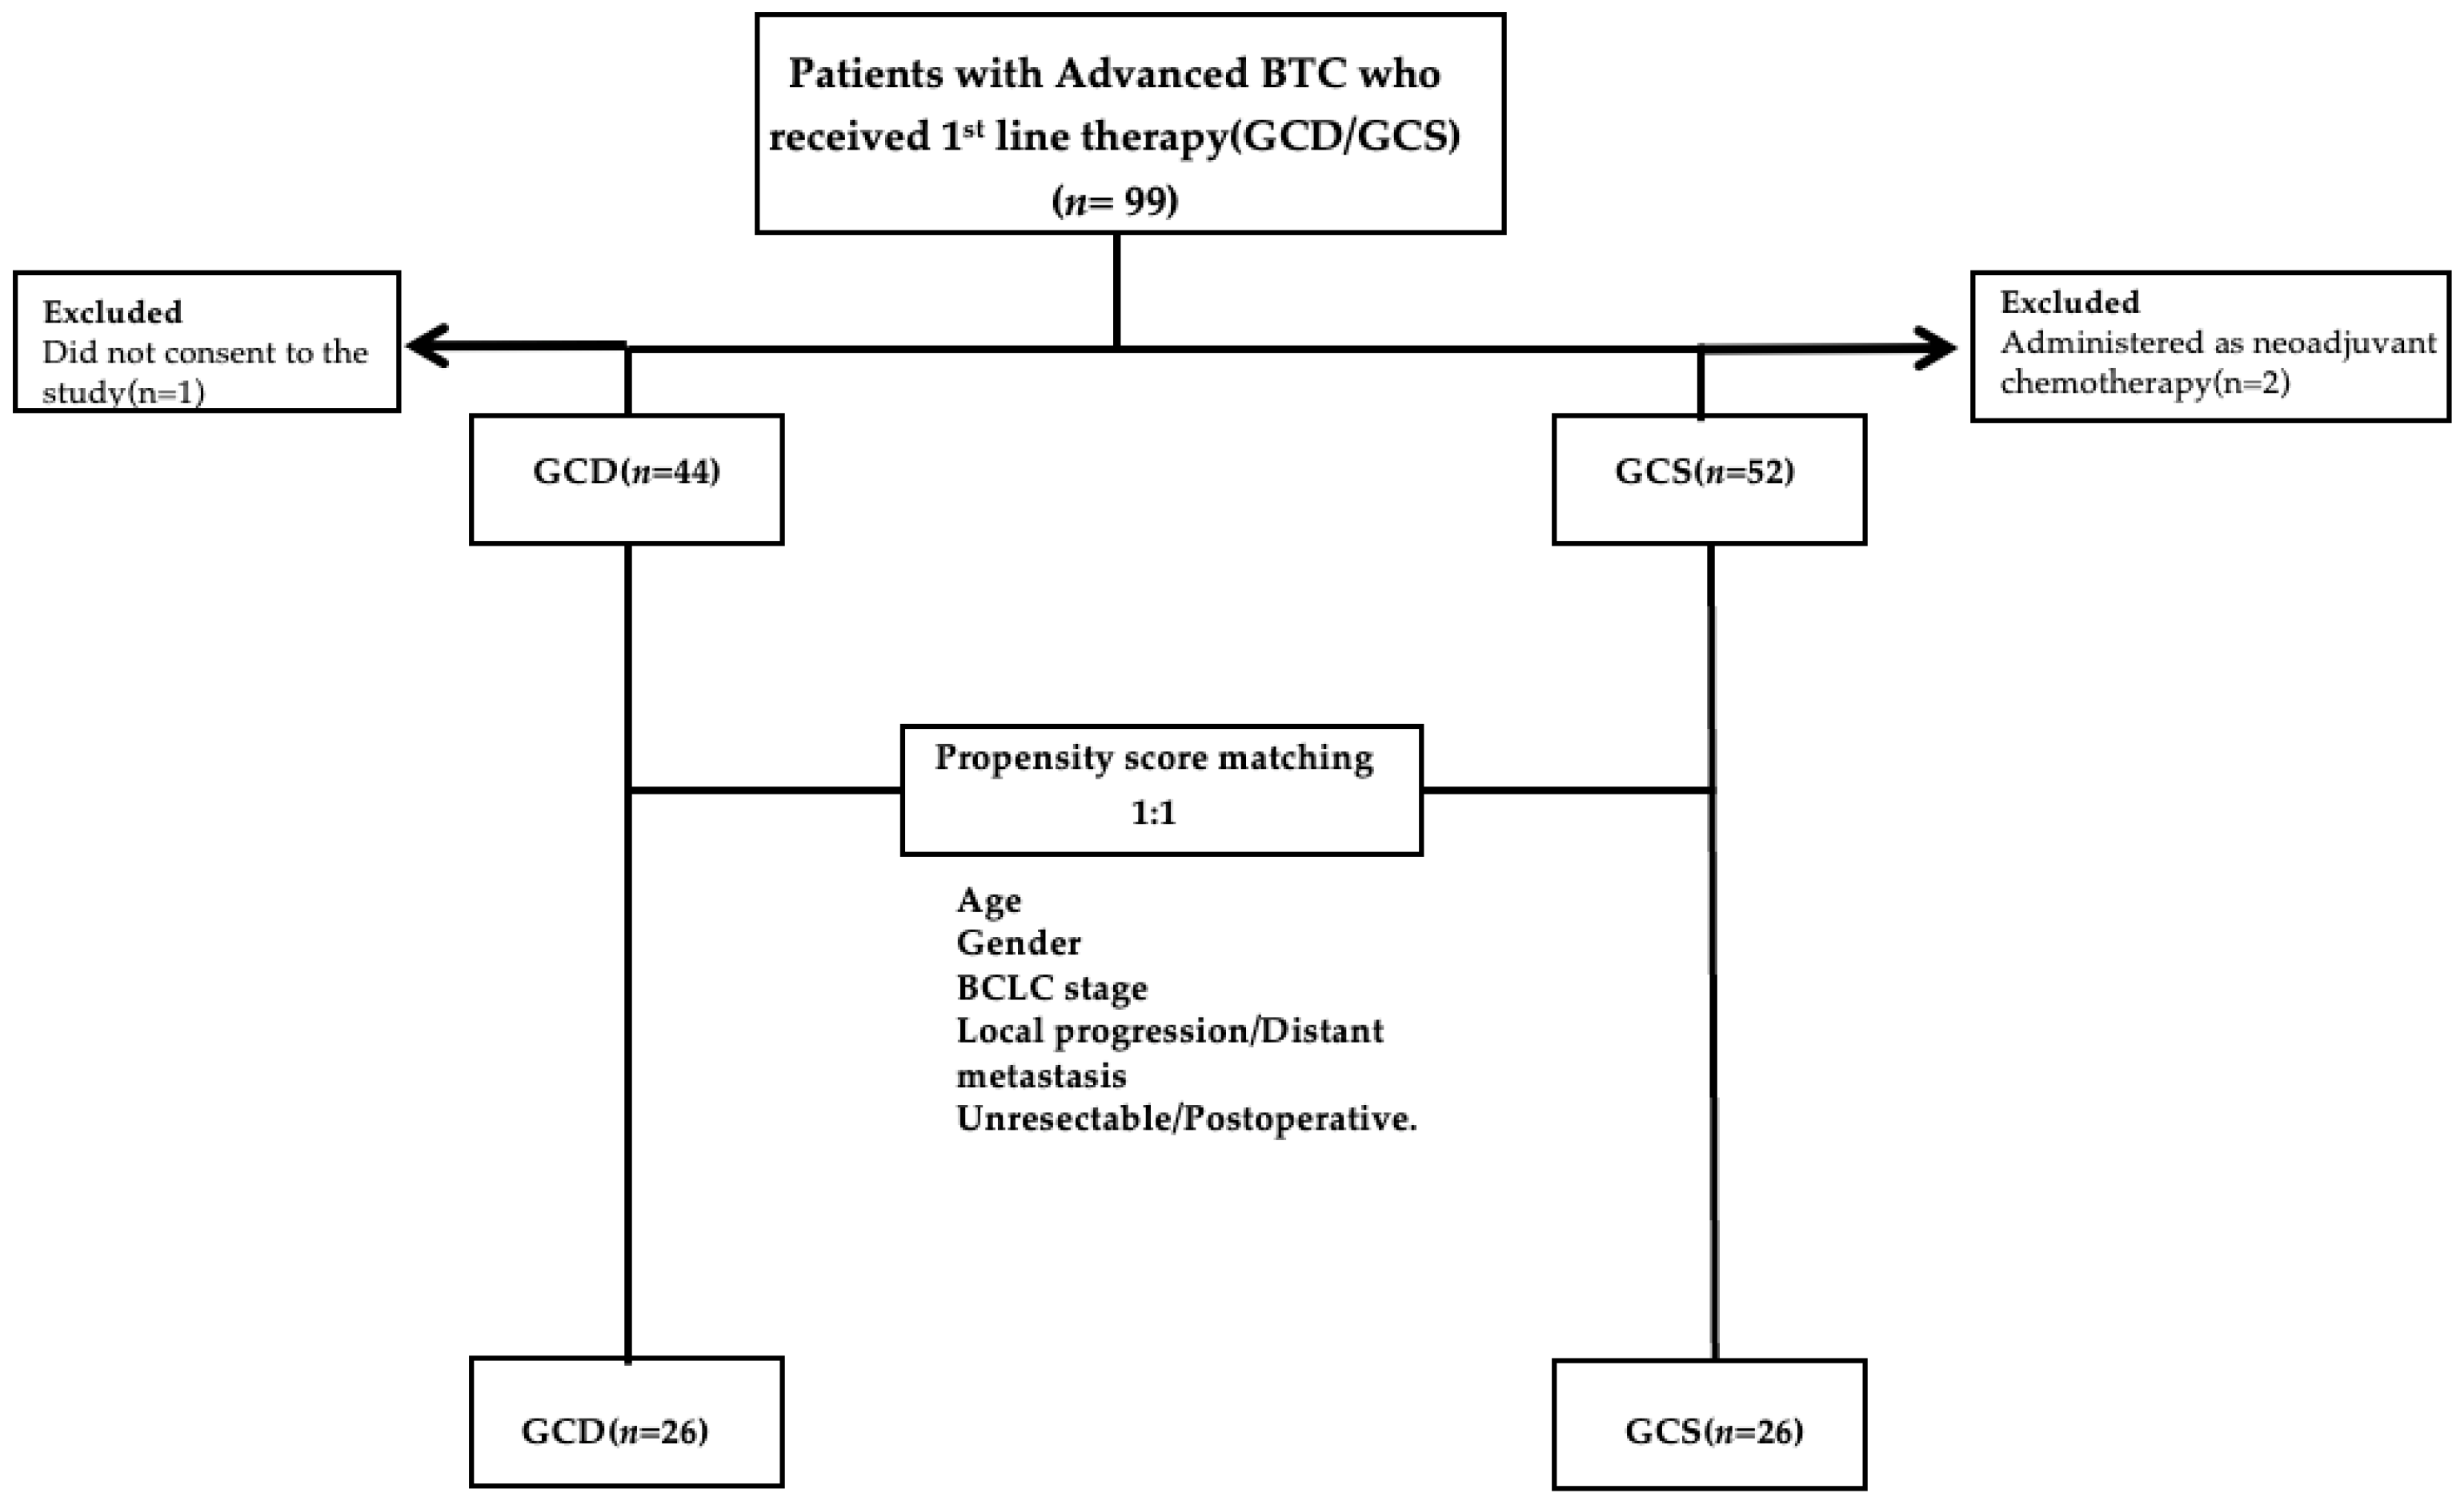
3.1.2. Comparison of OS and PFS Before PSM
There was no significant difference in OS between the GCS and GCD groups (18.6 versus 12.2 months, respectively; p=0.0935). PFS in the GCS group was significantly superior to that in the GCD group at 10.2 months (6.5–13.8 months) versus 6.2 months (3.2–8.8 months), respectively (p=0.0053) (
Figure 2a and b).
3.1.3. Comparison of Treatment Efficacy Before PSM
Treatment efficacy was compared between the GCS and GCD groups. Both the response and the efficacy rates were significantly better in the GCS group (ORR: 36.5% versus 15.9%, respectively; p=0.0211) (DCR: 78.8% versus 50.0%, respectively; p=0.0029). The number of patients receiving conversion therapy was significantly higher in the GCS group versus the GCD group (28.8% versus 6.8%, respectively; p=0.0040) (
Table 2).
3.2. Analysis Results After PSM
3.2.1. Patient Characteristics After PSM
To minimise differences in background factors, we performed PSM using the following variables: age, gender, stage, local progression/distant metastasis and unresectable/postoperative recurrence. No significant differences in background factors remained after PSM (
Table 3).
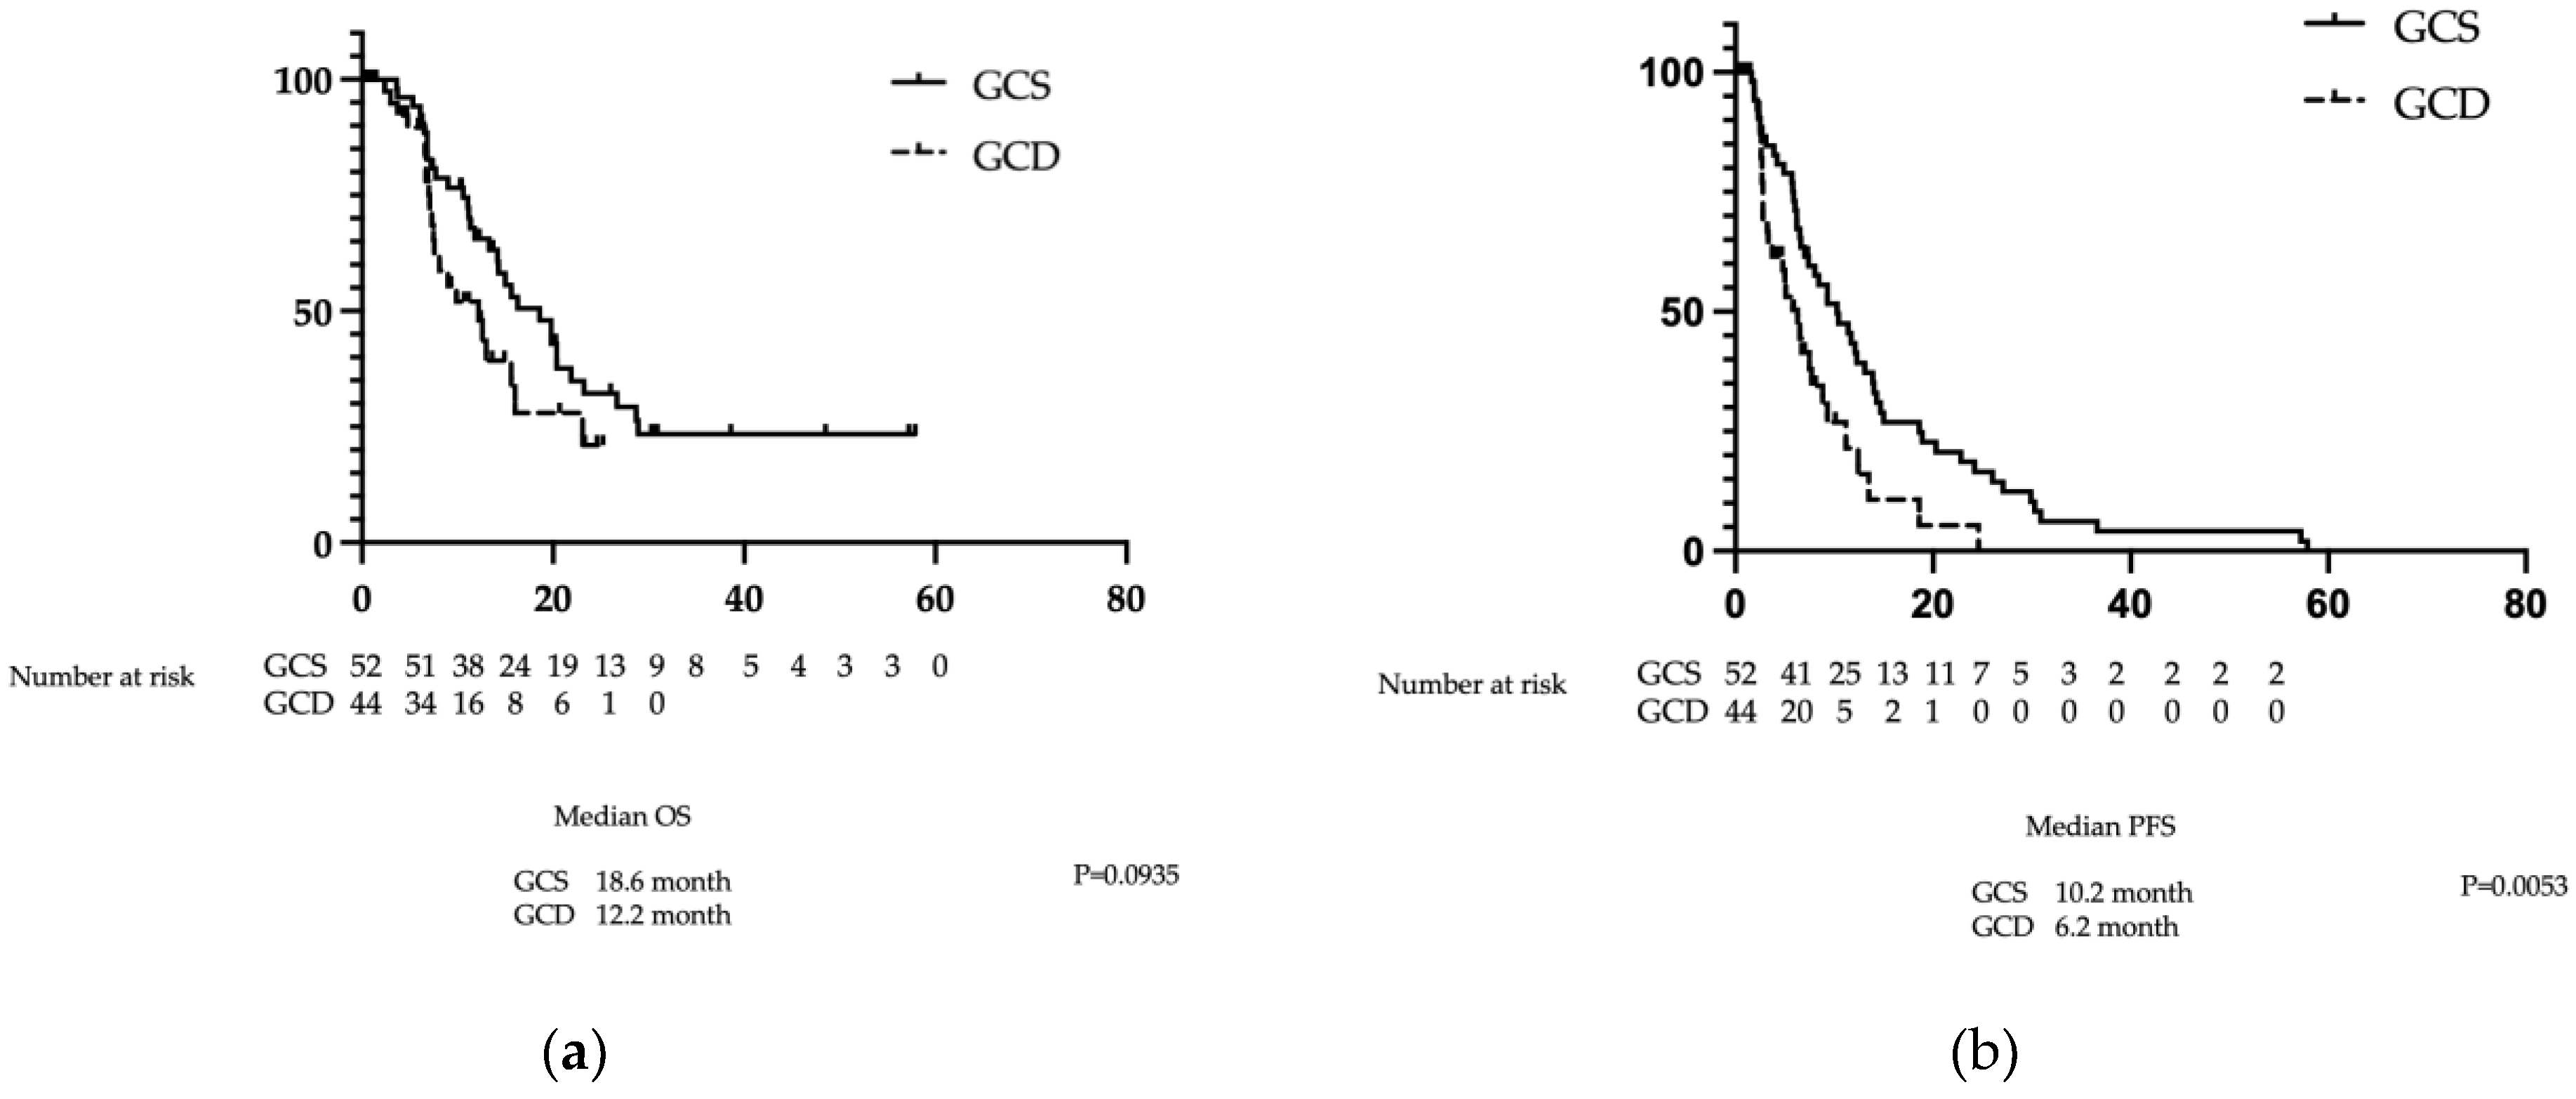
3.2.2. Comparison of PFS and OS After PSM
There was no significant difference in OS between the GCS and GCD groups at 14.9 months (10.6–20.4 months) versus 8.9 months (6.7–16.0 months), respectively (p=0.1535). In contrast, PFS in the GCS group was significantly superior to that in the GCD group at 10.4 months (4.9–14.0 months) versus 6.3 months (2.8–9.2 months), respectively (p=0.0350) (
Figure 3a and b).
3.2.3. Comparison of Treatment Efficacy Following PSM
Treatment efficacy was compared between the GCS and GCD groups. No significant difference was observed between the groups for the response and efficacy rates (ORR: 34.6% versus 15.4%, respectively; p=0.1058) (DCR: 69.2% versus 46.1%, respectively; p=0.0905). There were also no significant differences between the GCS and GCD groups in the number of patients receiving conversion therapy (19.2% versus 7.7%, respectively; p=0.2163).
Table 4.
Best tumour response by RECIST 1.1 before PSM.
Table 4.
Best tumour response by RECIST 1.1 before PSM.
| |
GCS (n=26) |
GCD (n=26) |
| Complete response |
0 |
0 |
|
Partial response
|
9(34.6) |
4(15.4) |
|
Stable disease
|
9(34.6) |
8(30.8) |
|
Progressive disease
|
6(23.2) |
8(30.8) |
|
Not evaluable
|
2(7.7) |
6(23.1) |
|
Conversion surgery
|
5(19.2) |
2(7.7) |
3.3. Adverse Events
Table 5 shows the adverse events that occurred during treatment. The incidence of any adverse event across all grades was 94.2% in the GCS group and 84.1% in the GCD group, with no significant difference between the groups. Grade 3 and 4 adverse events also showed no significant difference between the groups. Haematological toxicity (leucopenia and neutropenia) was observed in 44.2% and 48.1% of the patients in the GCS group, respectively, which is significantly higher than the rates of 22.7% and 15.9% in the GCD group (p=0.0099 and p=0.0322, respectively). Regarding nonhaematological toxicity, constipation was significantly more frequent in the GCD group (56.8% versus 30.8%, p=0.0132), whilst fatigue/malaise was significantly more common in the GCS group (73.1%) than in the GCD (36.4%) group (p=0.0004). Chronic kidney injury was observed in 34.1% of the patients in the GCD group, significantly more than in the GCS group (9.6%) (p=0.0049). No irreversible adverse events were observed.
3.4. Drug Costs
S-1 is approved in Japan as a treatment for cholangiocarcinoma, with a drug price for the original product of Japanese yen (¥)297.5 for each 20-mg tablet and ¥367 for each 25-mg tablet. Calculated for a body surface area of 1.6 m², the drug cost for one GCS cycle is approximately ¥22,750. Conversely, GCD costs approximately ¥1.65 million in Japan for the same body surface area. S-1 is not approved in the USA and is only approved for gastric cancer in Europe. On the basis of its price, 42 tablets (20 mg) cost approximately 217 Euros (€); therefore, assuming GCS is administered, one course would cost approximately €1800. In comparison, GCD costs approximately €5600 per course (i.e., per 21-day treatment cycle), although this varies by country. In the present study, we calculated the total costs incurred in Japan to treatment completion, including dose reductions. The costs for GCS versus GCD were €3961 ± 2664 versus €97,270 ± 61,873 (US dollars $4622 ± 3109 versus $ 113,472 ± 72,198), respectively, demonstrating a significant difference, with GCS being less expensive (p=0.0001). Even in PSM-matched cases, the costs for GCS versus GCD were €3440 ± 2628 ($4043 ± 3088) versus €92,563 ± 54,793 ($108,714 ± 64,386), respectively; thus, GCS is significantly less expensive (p=0.0008).
4. Discussion
The incidence of cholangiocarcinoma is increasing worldwide [
15,
16], with most cases detected at locally advanced or metastatic stages, making systemic drug therapy the cornerstone of treatment [
17,
18]. The cornerstone of first-line systemic drug therapy has long been multi-agent combination therapy, with GC as the long-standing main component [
6]. Compared with GC therapy, the TOPAZ-1 trial demonstrated the superiority of GCD therapy [
7,
8], whilst KEYNOTE-966 showed the superiority of GCP therapy [
9]. The KHBO1401-MITSUBA trial demonstrated the superiority of GCS over GC therapy [
11]. Whilst both GCD and GCP combine a cytotoxic anticancer agent with an ICI, GCS comprises a combination of three cytotoxic anticancer agents. To date, no randomised trial has directly compared GC plus ICI with GCS. The present study is the first prospective observational study, to our knowledge, to demonstrate the noninferiority of GCS compared with GCD. Our findings showed that compared with GCD, GCS showed no significant difference in OS but demonstrated a significant prolongation in PFS. Regarding adverse events, while differences were observed in the frequency of certain events between the two regimens, no overall difference in the frequency or severity of adverse events was noted. In the GCD regimen, IrAEs were observed because of the inclusion of ICIs. Conversely, the GCS regimen, which does not contain ICIs and, thus, does not induce IrAEs, included three cytotoxic anticancer agents, resulting in a higher incidence of adverse events, such as leucopenia and neutropenia. The overall frequency of adverse events and serious adverse events was largely comparable between GCD and GCS. Furthermore, the frequencies of adverse events observed in the present study were generally consistent with those reported in the literature [
7,
11].
The present study represents the first report, to our knowledge, comparing these two regimens; however, as this was an observational study rather than a randomised trial, there was some variation in the patients’ background factors. Therefore, in our analysis, we used PSM to adjust for differences. The results remained similar after PSM, demonstrating the noninferiority of GCS compared with GCD. Previous reports demonstrated superiority of the GCD regimen over GC in terms of PFS (7.2 months versus 5.7 months, respectively; HR: 0.75) and OS (12.8 months versus 11.5 months, respectively; HR: 0.80) [
7,
8]. GCS also demonstrated superiority over GC for PFS: 7.4 months versus 5.5 months, respectively (HR: 0.75) and OS: 13.5 months versus 12.6 months, respectively (HR: 0.79) [
11]. In the present study, no significant differences in OS were observed: OS was 8.9 months for GCD and 14.9 months for GCS, while PFS was 6.3 months for GCD and 10.4 months for GCS. Both GCD and GCS regimens include gemcitabine and cisplatin but differ in drug formulation and dosing intervals. GCD is a 21-day cycle regimen where GC is administered on Day 1 with durvalumab added as an infusion, followed by GC on Day 8. Furthermore, from the ninth cycle onwards, durvalumab is administered as monotherapy. In contrast, GCS is a 14-day cycle regimen involving GC on Day 1, with S-1 administered orally continuously from Days 1–7.
Drug prices vary by country; however, when we calculated the treatment costs in Japan, including dose reductions, the total drug costs incurred until treatment completion were
$113,472 ±
$72,198 for GCD versus
$4622 ±
$3109 for GCS, demonstrating a significant difference in favour of GCS as the more cost-effective option (p=0.0001). Even in cases matched using PSM, GCD versus GCS costs were
$118,714 ±
$64,386 versus
$4043 ±
$3088, respectively, demonstrating a significant cost advantage for GCS (p=0.0008). The cost difference is clear, and considering the noninferiority regarding PFS and OS, GCS is a possible option for standard treatment. In Western cohorts, albumin-bound paclitaxel plus GC [
19] and mFOLFIRINOX [
20] failed to improve prognosis compared with GC. GCS is approved only in Asia, including Japan, whereas S-1 is approved in Europe as a gastric cancer treatment. As the pharmacokinetics and pharmacodynamics of S-1 differ between Asians and people of European descent, similar efficacy may not be expected in the latter population [
21]. However, substituting drugs, such as capecitabine, may enable treatment at a lower cost[
22,
23].
This study has limitations. First, this was a prospective observational study rather than a randomised controlled trial. Additionally, treatment was chosen by the attending physician and the patient, leading to potential bias in the patients’ background factors. Although background factors were matched using PSM, it remains unclear whether completely equivalent backgrounds were achieved. Second, this was a single-centre study rather than a multicentre trial, resulting in a limited number of cases. Third, the observation period was short. Particularly for GCD, the longest follow-up period was 25.2 months, indicating inadequate tracking. Nevertheless, the present study demonstrated the noninferiority of GCS compared with GCD, which is currently the standard treatment worldwide, and is considered a valuable study showing that equivalent therapeutic effects can be expected at a lower cost, with GCS. A randomised trial comparing GCS and GCD is currently underway in Japan [
24] and its results are awaited. Furthermore, in Europe and the USA, treatments using capecitabine and similar agents may offer equivalent efficacy. Considering the significant difference in cost-effectiveness, there is scope for considering prospective trials to compare GCS and GCD.
5. Conclusions
This prospective observational study using PSM demonstrated that GCS was noninferior to GCD as chemotherapy for advanced BTC. GCS was associated with superior PFS compared with GCD, equivalent OS and ORR and similar adverse event rates. Furthermore, GCS was significantly less expensive than GCD.
Author Contributions
Conceptualization, Y.M. and R.S.; Methodology, Y.M. and R.S.; Software, M.T.; Validation, L.L., Y.N. and T.H.; Formal Analysis, Y.M.; Investigation, Y.M., M.K., Y.T., T.S. and T.I.; Resources, Y.M.,K.S; Data Curation, Y.M.; Writing—Original Draft Preparation, Y.M. and R.S.; Writing—Review and Editing, R.S.; Visualization, R.S.; Supervision, M.F.; Project Administration, R.S. All authors have read and agreed to the published version of the manuscript.
Funding
This research received no external funding.
Institutional Review Board Statement
This study was performed in accordance with the Declaration of Helsinki and approved by the Ethics Committee of Kyushu Cancer Center (approval number: 2020-14).
Informed Consent Statement
Informed consent was obtained from all patients involved in the study.
Data Availability Statement
The raw data supporting the conclusions of this article will be made available by the authors upon request.
Conflicts of Interest
R.S. declares that they have competing interests with Eisai Co., Ltd., Chugai Pharma and AstraZeneca. The other authors declare that they have no competing interests.
Abbreviations
The following abbreviations are used in this manuscript:
| BTC |
biliary tract cancer |
| CI |
confidence interval |
| DCR |
disease control rate |
| GC |
gemcitabine plus cisplatin |
| GCD |
gemcitabine plus cisplatin plus durvalumab |
| GCP |
gemcitabine plus cisplatin plus pembrolizumab |
| GCS |
gemcitabine plus cisplatin plus S-1 |
| HR |
hazard ratio |
| ICI |
immune checkpoint inhibitor |
| IrAE |
immune-related adverse events |
| ORR |
objective response rate |
| OS |
overall survival |
| PFS |
progression-free survival |
| PSM |
propensity score matching |
References
- Valle JW, Kelley RK, Nervi B, Oh DY, Zhu AX. Biliary tract cancer. Lancet. 2021;397(10272):428-44.
- Banales, J.M.; Cardinale, V.; Carpino, G.; Marzioni, M.; Andersen, J.B.; Invernizzi, P.; Lind, G.E.; Folseraas, T.; Forbes, S.J.; Fouassier, L.; et al. Expert consensus document: Cholangiocarcinoma: current knowledge and future perspectives consensus statement from the European Network for the Study of Cholangiocarcinoma (ENS-CCA). Nat. Rev. Gastroenterol. Hepatol. 2016, 13, 261–280. [CrossRef]
- Strijker M, Belkouz A, van der Geest LG, van Gulik TM, van Hooft JE, de Meijer VE, et al. Treatment and survival of resected and unresected distal cholangiocarcinoma: a nationwide study. Acta Oncol. 2019;58(7):1048-55.
- Alabraba, E.; Joshi, H.; Bird, N.; Griffin, R.; Sturgess, R.; Stern, N.; Sieberhagen, C.; Cross, T.; Camenzuli, A.; Davis, R.; et al. Increased multimodality treatment options has improved survival for Hepatocellular carcinoma but poor survival for biliary tract cancers remains unchanged. Eur. J. Surg. Oncol. (EJSO) 2019, 45, 1660–1667. [CrossRef]
- Spolverato, G.; Kim, Y.; Alexandrescu, S.; Marques, H.P.; Lamelas, J.; Aldrighetti, L.; Gamblin, T.C.; Maithel, S.K.; Pulitano, C.; Bauer, T.W.; et al. Management and Outcomes of Patients with Recurrent Intrahepatic Cholangiocarcinoma Following Previous Curative-Intent Surgical Resection. Ann. Surg. Oncol. 2015, 23, 235–243. [CrossRef]
- Valle, J.; Wasan, H.; Palmer, D.H.; Cunningham, D.; Anthoney, A.; Maraveyas, A.; Madhusudan, S.; Iveson, T.; Hughes, S.; Pereira, S.P.; et al. Cisplatin plus Gemcitabine versus Gemcitabine for Biliary Tract Cancer. N. Engl. J. Med. 2010, 362, 1273–1281. [CrossRef]
- Oh, D.-Y.; He, A.R.; Qin, S.; Chen, L.-T.; Okusaka, T.; Vogel, A.; Kim, J.W.; Suksombooncharoen, T.; Lee, M.A.; Kitano, M.; et al. Durvalumab plus Gemcitabine and Cisplatin in Advanced Biliary Tract Cancer. NEJM Évid. 2022, 1. [CrossRef]
- Oh, D.-Y.; He, A.R.; Bouattour, M.; Okusaka, T.; Qin, S.; Chen, L.-T.; Kitano, M.; Lee, C.-K.; Kim, J.W.; Chen, M.-H.; et al. Durvalumab or placebo plus gemcitabine and cisplatin in participants with advanced biliary tract cancer (TOPAZ-1): updated overall survival from a randomised phase 3 study. Lancet Gastroenterol. Hepatol. 2024, 9, 694–704. [CrossRef]
- Kelley, R.K.; Ueno, M.; Yoo, C.; Finn, R.S.; Furuse, J.; Ren, Z.; Yau, T.; Klümpen, H.-J.; Ozaka, M.; Verslype, C.; et al. Pembrolizumab in combination with gemcitabine and cisplatin compared with gemcitabine and cisplatin alone for patients with advanced biliary tract cancer (KEYNOTE-966): a randomised, double-blind, placebo-controlled, phase 3 trial. Lancet 2023, 401, 1853–1865. [CrossRef]
- Yoo, C.; Hyung, J.; Chan, S.L. Recent Advances in Systemic Therapy for Advanced Intrahepatic Cholangiocarcinoma. Liver Cancer 2023, 13, 119–135. [CrossRef]
- Ioka, T.; Kanai, M.; Kobayashi, S.; Sakai, D.; Eguchi, H.; Baba, H.; Seo, S.; Taketomi, A.; Takayama, T.; Yamaue, H.; et al. Randomized phase III study of gemcitabine, cisplatin plus S-1 versus gemcitabine, cisplatin for advanced biliary tract cancer (KHBO1401- MITSUBA). J. Hepato-Biliary-Pancreatic Sci. 2022, 30, 102–110. [CrossRef]
- Morizane, C.; Okusaka, T.; Mizusawa, J.; Katayama, H.; Ueno, M.; Ikeda, M.; Ozaka, M.; Okano, N.; Sugimori, K.; Fukutomi, A.; et al. Combination gemcitabine plus S-1 versus gemcitabine plus cisplatin for advanced/recurrent biliary tract cancer: the FUGA-BT (JCOG1113) randomized phase III clinical trial. Ann. Oncol. 2019, 30, 1950–1958. [CrossRef]
- Services USDoHaH. Common Terminology Criteria for Adverse Events (CTCAE) Version 4.0. Bethesda, MD: National Cancer Institute; 2009.
- Eisenhauer, E.A.; Therasse, P.; Bogaerts, J.; Schwartz, L.H.; Sargent, D.; Ford, R.; Dancey, J.; Arbuck, S.; Gwyther, S.; Mooney, M.; et al. New response evaluation criteria in solid tumours: Revised RECIST guideline (version 1.1). Eur. J. Cancer 2009, 45, 228–247. [CrossRef]
- Vithayathil, M.; Khan, S.A. Current epidemiology of cholangiocarcinoma in Western countries. J. Hepatol. 2022, 77, 1690–1698. [CrossRef]
- Khan SA, Tavolari S, Brandi G. Cholangiocarcinoma: Epidemiology and risk factors. Liver Int. 2019;39 Suppl 1:19-31.
- Benson, A.B.; D’aNgelica, M.I.; Abrams, T.; Abbott, D.E.; Ahmed, A.; Anaya, D.A.; Anders, R.; Are, C.; Bachini, M.; Binder, D.; et al. NCCN Guidelines® Insights: Biliary Tract Cancers, Version 2.2023. J. Natl. Compr. Cancer Netw. 2023, 21, 694–704. [CrossRef]
- Vogel, A.; Bridgewater, J.; Edeline, J.; Kelley, R.; Klümpen, H.; Malka, D.; Primrose, J.; Rimassa, L.; Stenzinger, A.; Valle, J.; et al. Biliary tract cancer: ESMO Clinical Practice Guideline for diagnosis, treatment and follow-up. Ann. Oncol. 2023, 34, 127–140. [CrossRef]
- Shroff RT, Javle MM, Xiao L, Kaseb AO, Varadhachary GR, Wolff RA, et al. Gemcitabine, Cisplatin, and nab-Paclitaxel for the Treatment of Advanced Biliary Tract Cancers: A Phase 2 Clinical Trial. JAMA Oncol. 2019;5(6):824-30.
- Phelip, J.M.; Desrame, J.; Edeline, J.; Barbier, E.; Terrebonne, E.; Michel, P.; Perrier, H.; Dahan, L.; Bourgeois, V.; Akouz, F.K.; et al. Modified FOLFIRINOX Versus CISGEM Chemotherapy for Patients With Advanced Biliary Tract Cancer (PRODIGE 38 AMEBICA): A Randomized Phase II Study. J. Clin. Oncol. 2022, 40, 262–271. [CrossRef]
- Chuah, B.; Goh, B.; Lee, S.; Soong, R.; Lau, F.; Mulay, M.; Dinolfo, M.; Lim, S.; Soo, R.; Furuie, T.; et al. Comparison of the pharmacokinetics and pharmacodynamics of S-1 between Caucasian and East Asian patients. Cancer Sci. 2010, 102, 478–483. [CrossRef]
- Ma, J.; Yang, Y. 146P A retrospective study of the efficacy of gemcitabine combined with capecitabine versus capecitabine alone for biliary tract cancer after curative resection. Ann. Oncol. 2024, 35, S1462–S1463. [CrossRef]
- Lee Tae S, Choi Young H, Kim Jun Y, Lee Myeong H, Paik K-H, Cho In R, et al. Comparison of 5-Fluorouracil/Leucovorin and Capecitabine as Adjuvant Therapies in Biliary Tract Cancer. Journal of Gastroenterology and Hepatology. 2025;40(9):2324-34.
- Registry UCT. Phase III study of gemcitabine, cisplatin plus S-1 combination therapy versus gemcitabine, cisplatin plus immune checkpoint inhibitor combination therapy in advanced biliary tract cancer. 2023 [Available from: https://center6.umin.ac.jp/cgi-open-bin/ctr_e/ctr_view.cgi?recptno=R000058983.
|
Disclaimer/Publisher’s Note: The statements, opinions and data contained in all publications are solely those of the individual author(s) and contributor(s) and not of MDPI and/or the editor(s). MDPI and/or the editor(s) disclaim responsibility for any injury to people or property resulting from any ideas, methods, instructions or products referred to in the content. |
© 2025 by the authors. Licensee MDPI, Basel, Switzerland. This article is an open access article distributed under the terms and conditions of the Creative Commons Attribution (CC BY) license (http://creativecommons.org/licenses/by/4.0/).