
Submitted:
01 November 2025
Posted:
03 November 2025
You are already at the latest version
Abstract
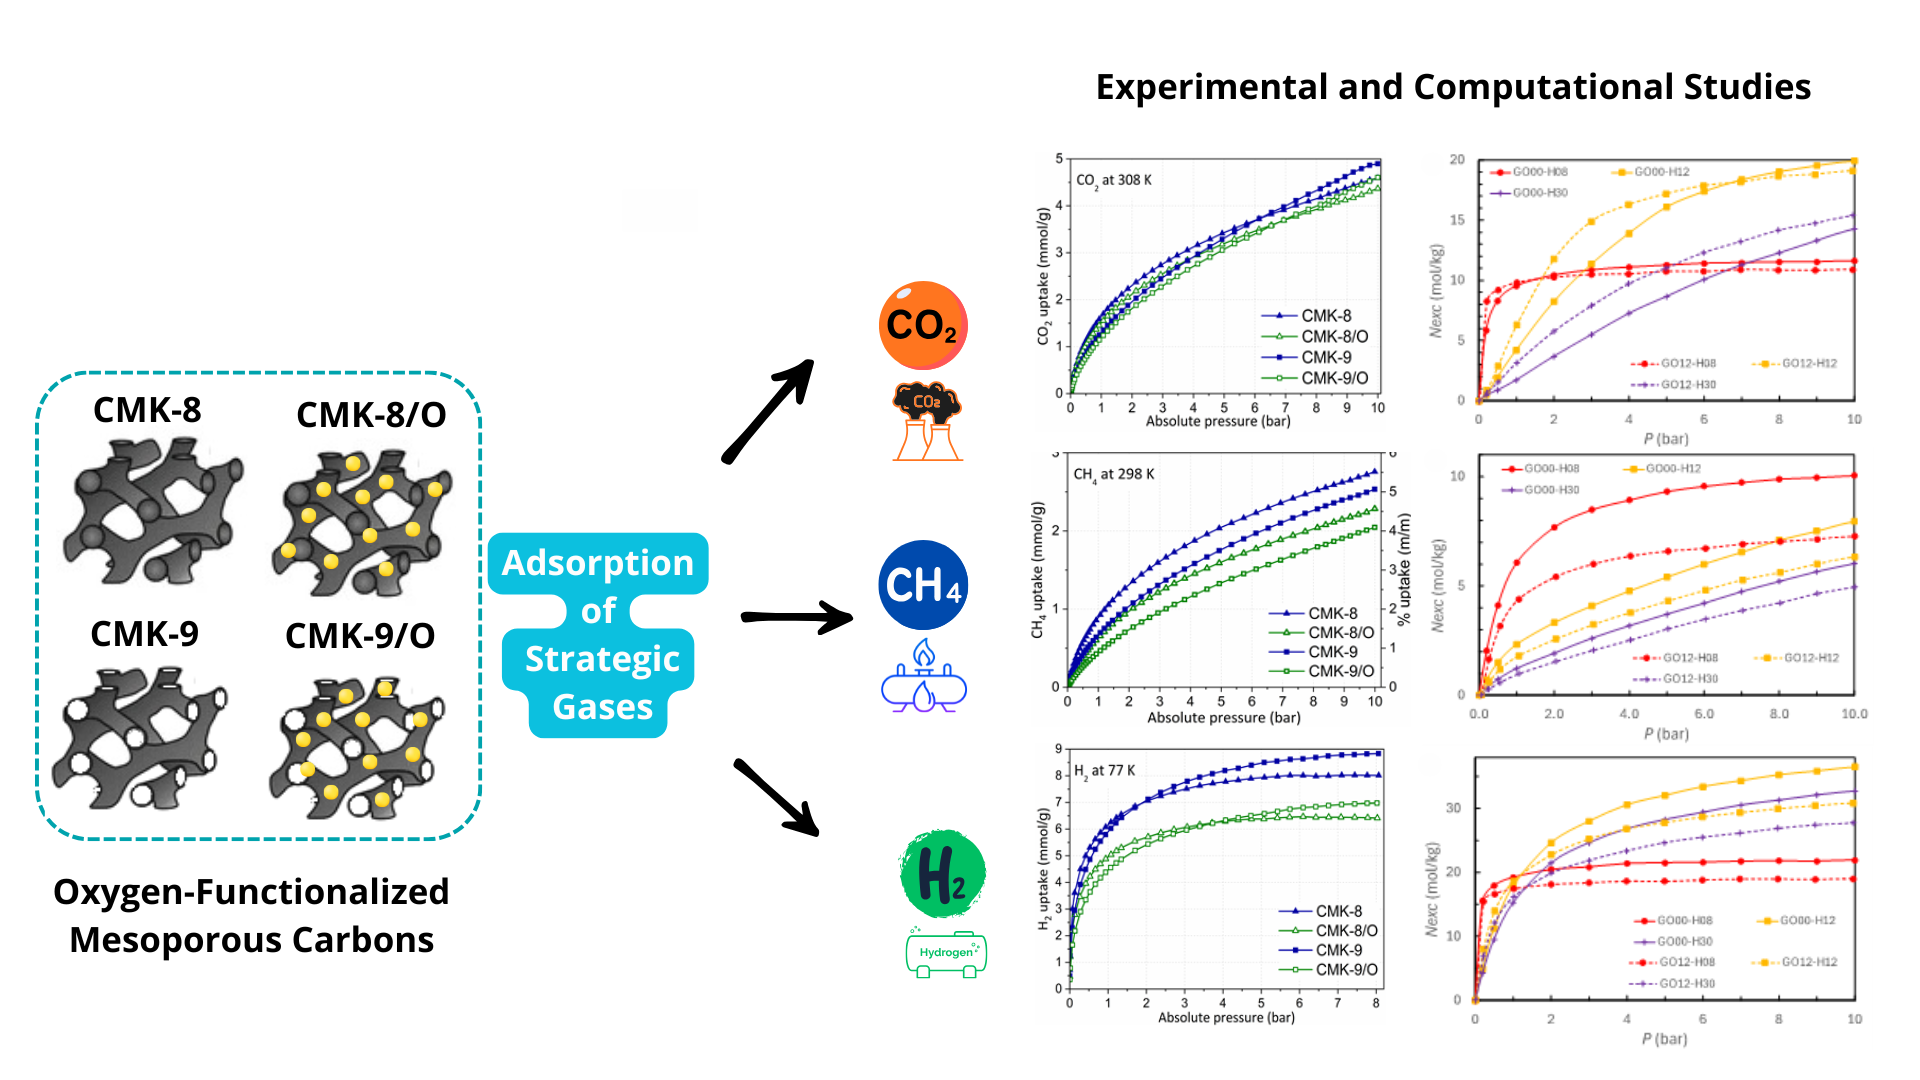
The efficient storage of strategic gases—CH₄, CO₂, and H₂—remains a critical challenge due to the need for high pressures or cryogenic temperatures to achieve sufficient storage densities, often resulting in energy- and cost-intensive processes. Adsorption-based storage using porous materials offers a promising alternative. In particular, ordered mesoporous carbons, such as CMK-8 and CMK-9, are attractive due to their mechanical, thermal, and chemical stability, as well as their highly tunable textural properties. Surface functionalization can further enhance gas uptake, though the effect is often gas-specific. This study investigates the adsorption performance of four carbon materials: pristine CMK-8 and CMK-9, and their oxygen-functionalized counterparts produced via HNO₃ treatment. The adsorption capacities for CH₄, CO₂, and H₂ were evaluated through a combination of experimental gas adsorption measurements and molecular simulations. The results reveal structure–property relationships between surface chemistry and gas-specific adsorption behavior, with implications for the rational design of carbon-based materials for gas storage.
Keywords:
adsorption
; CH4 and H2 storage
; CO2 capture
; oxygen functionalization
; mesoporous carbon
; textural characterization
1. Introduction
The global demand for sustainable energy systems and greenhouse gas mitigation has intensified interest in advanced porous materials capable of efficiently capturing and storing strategic gases, including hydrogen (H2), methane (CH4), and carbon dioxide (CO2) [1,2,3]. Among the most promising candidates are ordered mesoporous carbons (OMC) such as CMK-8 and CMK-9, which exhibit high surface areas, tunable pore architectures, and exceptional chemical and thermal stability [4,5]. These materials are synthesized via nanocasting with silica templates, such as KIT-6, yielding well-defined, interconnected mesostructures (porous networks) that enhance both gas diffusion and adsorption.
A key advantage of OMC lies in its highly reproducible, robust pore structure and its amenability to surface functionalization. In particular, nitric acid oxidation introduces polar oxygen-containing groups (e.g., -COOH and -OH), increasing surface polarity and hydrophilicity [6,7]. While such modifications can enhance the adsorption of polar molecules, such as CO2, through hydrogen bonding and electrostatic interactions, they may also reduce the accessible pore volume and restrict the diffusion of non-polar gases, such as CH4 and H2 [8]. Therefore, achieving a balance between surface reactivity and pore accessibility is critical. Preserving the structural order and porosity after chemical treatment is essential for maintaining consistent performance under cyclic adsorption-desorption conditions, which are vital for practical applications in gas separation, carbon capture, and clean energy storage [9,10].
CMK-8 and CMK-9 provide a compelling platform for such studies due to their distinct morphologies: CMK-8 features pores among rod-like structures, while CMK-9 exhibits tubular channels rather than rod-like structures. This structural contrast allows a systematic exploration of how surface chemistry and pore architecture jointly influence gas sorption behavior.
In this study, we evaluate the adsorption performance of four mesoporous carbon materials: pristine CMK-8 and CMK-9, and their oxygen-functionalized counterparts (CMK-8/O and CMK-9/O), produced via HNO3 oxidation. Experimental characterization included Ar (87 K) and CO2 (273 K) isotherms for textural analysis, scanning electron microscopy (SEM) for morphological characterization, thermogravimetric analysis coupled with mass spectrometry (TGA-MS) for thermal and compositional profiling, and X-ray photoelectron spectroscopy (XPS) for surface chemistry assessment. Molecular simulations offered insight into gas-surface interactions at the atomic level.
Our findings demonstrate that each material responds uniquely to oxidation, with changes in microporosity, mesopore narrowing, and oxygen functional group content resulting in distinct gas storage behaviors. This study elucidates structure–function relationships in functionalized mesoporous carbons and provides design guidelines for next-generation materials for hydrogen and methane storage, as well as CO2 capture under practical conditions.
2. Materials and Methods
2.1. Synthesis of the CMK-8 and CMK-9 Mesoporous Carbons
CMK-8 and CMK-9 were synthesized via nanocasting using KIT-6 silica (SiO2) as the hard template, following a procedure previously reported by our group [11].
CMK-8 synthesis: KIT-6 (1.00 g) was gradually added to an aqueous solution of 1.86 g sucrose (C12H22O11, Sigma-Aldrich®, 99.5%), 0.21 g sulfuric acid (H2SO4, Sigma-Aldrich®, 98%), and 7.30 g deionized water. The mixture was stirred at room temperature for 3 h to promote infiltration of the carbon precursor into the silica pores. A two-step polymerization process was followed: 100 °C for 6 h, then 160 °C for an additional 6 h. A second impregnation was carried out using a fresh solution of 1.17 g sucrose, 0.13 g sulfuric acid, and 7.30 g water, followed by identical thermal treatment. The resulting composite was carbonized under nitrogen (180 mL/min) at 900 °C for 4 h (heating rate: 3 °C/min). Silica was removed by leaching in 5% hydrofluoric acid at room temperature with continuous stirring for 24 h. The resulting carbon was washed several times with a 1:1 (v/v) mixture of water and ethanol, and then dried at 80 °C for 12 h.
CMK-9 synthesis: A mixture of 1.94 g furfuryl alcohol (C5H6O2, Sigma-Aldrich®, 98%), 3.47 g 1,3,5-trimethylbenzene (C9H12, Sigma-Aldrich®, 98%), and 0.017 g oxalic acid (C2H2O4, Biopack®, 99.5%) was stirred at room temperature for 30 min and then added to 1.00 g KIT-6 silica. The mixture was stirred using a rotary evaporator at 35 °C for 2 h. Polymerization was performed in two steps: 60 °C for 16 h, followed by 80 °C for an additional 16 h. Carbonization was carried out under nitrogen flow (180 mL/min) in three stages: (i) 1 °C/min to 150 °C (hold 3 h), (ii) 1 °C/min to 300 °C, and (iii) 3 °C/min to 900 °C (hold 4 h). Silica removal and post-treatment followed the same procedure as for CMK-8.
2.2. Chemical Oxidation of CMK-8 and CMK-9
Surface oxidation was performed using 4 M nitric acid (HNO3, Sigma Aldrich®, 65%). Each carbon sample (1.00 g) was suspended in 50 mL of HNO3 and stirred at 50 °C (200 rpm) for 1 h. The solids were filtered and washed with deionized water until the filtrate conductivity fell below 10 μS/cm. The oxidized carbons (CMK-8/O and CMK-9/O) were dried at 60 °C for 12 h.
2.3. Characterization Techniques
Scanning SEM: Scanning electron microscopy images were acquired using an FEI Quanta 200 microscope. Samples were coated with a ~10 nm gold layer before imaging, performed at 15 kV.
TGA-MS: Thermogravimetric analysis was performed on a TA Instruments SDT Q600 thermal analyzer coupled with a Discovery mass spectrometer. Samples (~4 mg) were placed in alumina pans and analyzed under a N2 flow (100 mL/min) from room temperature to 1000 °C at 10 °C/min.
XPS: X-ray photoelectron spectra were collected on a Physical Electronics PHI 5701 spectrometer using non-monochromatic Mg Kα radiation (1253.6 eV, 300 W, 15 kV). Analyses were performed at a pass energy of 29.35 eV. Charge referencing was done against the C 1s peak (284.8 eV). Spectra were fitted with Gauss–Lorentz functions using PHI ACCESS ESCA-V6.0 F and Multipak v8.2b software.
Gas adsorption and porosity: Ar adsorption–desorption isotherms at 87 K and H2 adsorption (up to 1 bar) at 77, 90, and 105 K were measured using an Autosorb iQ analyzer (Quantachrome Instruments) with a CTI Cryogenics cryocooler. Samples were degassed before measurement (150 °C for pristine, 60 °C for oxidized carbons, 12 h). Analyses were performed with 120 mg of material. The specific surface area (SBET) was determined utilizing the Brunauer, Emmet, and Teller method [12]. The total pore volume (VTP) was calculated using Gurvich’s rule at p/p0 = 0.98 [13]. Micropore volume (VμP-Ar) was derived from Ar isotherms. Pore size distributions (PSD) were determined using the ASiQwin software from Quantachrome Instruments, employing the QSDFT method (Ar at 87 K on carbon, cylindrical pores, adsorption branch) [14].
CO2 adsorption isotherms were measured at 273 K up to 10 bars using a manometric Micromeritics ASAP 2050 analyzer. Micropore size distributions were determined using the Horvath-Kawazoe (HK) method for slit pores [15].
Water sorption-desorption isotherms were measured at 298 K using a VTI SGA-100 gravimetric sorption analyzer with Dynamic Vapor Sorption, employing dry air as the carrier gas. Approximately 5 mg of the sample was used for each analysis. Pristine CMK-8 and CMK-9 were degassed under a dry air flow at 80 °C until reaching equilibrium, with a variation of less than 1 µg over 10 minutes. The oxidized samples were degassed at 60 °C under the same equilibrium conditions.
2.4. CO2, CH4 and H2 Gas Storage Measurements
Adsorption isotherms of CO2 (purity 99.996%) at 308 K, CH4 (purity 99.995%) at 298 K, and H2 (purity 99.999%) at 77 K were performed up to 10 bar, using a Micromeritics ASAP 2050 sorption analyzer. Thermal baths for CO2 and CH4 were maintained using a Julabo F25 recirculating cooler, and H2 was maintained at liquid nitrogen temperature. All the samples were degassed under the same conditions used in Ar adsorption.
2.5. Isosteric Enthalpy of Adsorption
The isosteric enthalpy of adsorption provides insight into the strength of gas–surface interaction, adsorption mechanisms, and surface heterogeneity. Values of for each gas were derived from isotherms collected at different temperatures (see Figure S1), CO2 at 273 K and 308 K, CH4 at 298 K and 313 K, and H2 at 77 K, 90 K, and 105 K, using the Clausius-Clapeyron equation [16]:
where p is the equilibrium pressure, T is the adsorption absolute temperature, and R is the universal gas constant (8.314 kJ/(mol∙K)). The isosteric enthalpy of adsorption at a specific gas uptake was determined from the slope of adsorption isosteres (ln p vs. 1/T) at constant gas uptake.
2.6. Computational Approach
The physisorption of CH4, CO2, and H2 at supercritical conditions occurs through a combination of van der Waals and Coulomb interactions between the adsorbent and the adsorbate [17]. As it does not involve proper chemical bonding, the adsorption is reversible and generally non-specific [18,19]. However, due to its significant electric quadrupole moment, CO2 exhibits a preference for adsorption sites near polar surface groups [20].
To investigate adsorption mechanisms at the atomic level, Grand Canonical Monte Carlo (GCMC) simulations were conducted, which are particularly suitable for modeling gas adsorption in porous materials [21,22,23]. A slit-shaped pore geometry was employed, modeled by two parallel graphene-like surfaces separated by a distance H in the z-direction. Note that H corresponds to the distance between idealized planes of graphene, which is approximately one carbon atom collision diameter (~ 3.5 Å) larger than experimentally measured pore sizes.
Simulations were performed for H = 8, 10, 12, 15, and 30 Å, using two surface types: (i) a pristine graphene surface (denoted GP), and (ii) a graphene oxide surface containing hydroxyl (–OH) and epoxy (–O–) groups (denoted GOx). GP was modeled as a standard graphene honeycomb lattice, with a base unit cell of 140 carbon atoms forming a rectangular domain of lx = 21.300 Å by ly = 17.217 Å, as shown in Figure 1. A simulation box of 2×2×3 unit cells (total 1680 C atoms) was used. For GOx, 12 hydroxyl and 12 epoxy groups were pseudo-randomly introduced (~14% O content), matching the experimentally observed oxygen content (~13%) for CMK-8/O and CMK-9/O.
Before simulations, GOx structures were partially optimized using Density Functional Theory (DFT) with the B3LYP functional and 6-31G(d,p) basis set [24,25,26,27] via Gaussian 16 [28]. DFT results provided atomic coordinates, Mulliken charges, and bonded force constants [28]. Notably, carbon atoms bonded to oxygen groups were slightly displaced from the graphene plane due to altered hybridization, as shown in Figure 1. Non-bonded interactions were defined using parameters derived from the Universal Force Field (UFF) [29,30,31] and CGenFF [32,33]. Crystallographic Information Files (CIFs) are provided in the Supplementary Information.
GCMC simulations were performed using the RASPA2 [34] code. Periodic boundary conditions were applied in all directions, with the simulation box comprised of 2×2×3 replicas of the unit cell lx x ly x H, i.e., Lx x Ly x Lz = 42.600 Å x 34.434 Å x 3 H, consistent with the requirement of an interaction cut-off rc ≤ ½ min (Lx, Ly, Lz) [35]. We employed Universal Force Field (UFF) [29,30,31] potentials. Lorenz-Berthelot combination rules were used for mixed-species Lennard-Jones (LJ) interactions. Electrostatics were treated using the particle-mesh Ewald (PME) method [36].
Molecular models were defined as follows. Methane was modeled in the United Atom Approximation (UAA) as a spherical particle with mass m = 16.04246 and LJ parameters ε = 148.0 K and σ = 3.73 [18,37,38,39,40,41,42,43,44,45]. Carbon dioxide was modeled as a rigid structure with mO = 15.9994 amu, mC = 12.0000 amu, qO = -0.33 e, qC = +0.66 e, and distance between C and O dCO = 1.149 Å, which results in an electric quadrupole moment QzzCO2 = -13.9 x 10-40 C·m2, comparable to experimental values -14 to -15 [20]; LJ parameters employed are εO = 79.0 K, σO = 3.05 Å, and εC = 27.0 K, σC = 2.80 Å. Hydrogen molecules were modeled as two atoms of mH = 1.00794 amu, charge qH = 0.42 e with a separation of dHH = 0.71 Å but no LJ interactions, and an additional massless “ghost” atom mCOM = 0, charge qCOM = -0.84 e, and LJ parameters εCOM = 36.7 K, σCOM = 2.96 Å. This results in an electric quadrupole moment QzzH2 = +1.84 x 10-40 C·m2, comparable to experimental +1.73 to 2.21 x 10-40 cm2 [46]. Note that although H2 has a quadrupole moment it is 11 times smaller than that of CO2. A united-atom model was also tested for comparison with a single “superatom” mH2 = 2.01588 amu, and εH2 = 36.7 K, σH2 = 2.96 Å.
Surface atoms had the following parameters: pristine C atoms were neutral with LJ parameters εC = 35.23 K, σC = 3.55 Å [18,38,39,40,41]. C atoms bonded to –OH or epoxy groups carried partial charges of +0.215 e and +0.221 e, respectively. OH groups: O = –0.601 e, H = +0.386 e; epoxy O = –0.442 e. All systems were electrically neutral. Helium void fractions (XHe) were computed using Widom-Rosenbluth insertion in RASPA2 to estimate the excess adsorption [34].
Simulations were conducted at pressures P = 0.2, 0.5, 1, 2, 3, 4, 5, 6, 7, 8, 9, 10, 15, 20, 30, and 60 bar. Each run included 1,000 initialization cycles for equilibration (verified by monitoring the system energy—in all cases equilibration was reached by 50% of the initialization part of the simulation), followed by 5,000 sampling cycles. Each cycle consisted of at least 100 or the number of adsorbed molecules MC steps. Move types (translation, rotation, insertion, deletion) were attempted with equal probabilities. Acceptance probabilities followed standard Metropolis criteria [21,22,23]:
where β = 1/kBT is the reciprocal temperature, Λ = h/(2πmkBT)1/2 is the thermal wavelength [21,22,23], μ is the chemical potential, and U is the potential energy of the system. We use the ideal gas approximation P ≈ kBΛ3eβμ, introducing negligible error under supercritical conditions.
RASPA2 provided values for absolute adsorption (Na), excess adsorption (Ne = Na – V XHe ρgas), and the isosteric enthalpy of adsorption via fluctuation theorem [23,37]:
where N and E are the number of adsorbed molecules and system energy, respectively.
For each structure, adsorbent, and pressure, we set the RASPA2 code to save the positions of every atom every 50 cycles (i.e., 100 frames, the large number of GCMC steps between frames guarantees each frame to be statistically independent of earlier frames). From these frames, the radial pair distribution function [22,47] g(r) may be computed for any pair of types of atoms, allowing detailed analysis of fluid-fluid or fluid-surface interactions. Notably, peaks in g(r) between polar O atoms and adsorbates such as CO2 provide insight into adsorption mechanisms driven by quadrupolar interactions.
All simulation parameters, molecular models, force fields, and raw data summaries are provided in the Supplementary Information.
3. Results and Discussion
3.1. Morphological Characterization
SEM micrographs (Figure 2) show that CMK-8 and CMK-9 materials exhibit rod-like morphologies with tortuous, interconnected structures characteristic of carbons synthesized from cubic mesostructured silica templates [48]. Upon surface oxidation with nitric acid, no substantial morphological alterations were observed in either material, indicating that the acid treatment preserved the external architecture and particle integrity. This structural stability is particularly relevant for gas adsorption applications, as it ensures the accessibility and uniformity of the porous network without inducing macroscopic collapse or agglomeration. The elongated, contorted rod-like features are expected to promote efficient gas diffusion throughout the porous matrix, a factor of particular interest for optimizing the uptake kinetics of small gas molecules such as CO2, CH4, and H2.
3.2. Structural Characterization
Figure 3 presents the thermal analysis results of CMK-8 and oxidized CMK-8 (CMK-8/O), including TGA-DTG profiles and associated mass spectra (m/z = 18 and 44). In all cases, an initial mass loss is observed below 100 °C, which is attributed to the desorption of physisorbed water. This loss is more pronounced in the oxidized sample, indicating an increased affinity for water formation during the thermal process due to the introduction of polar oxygen-containing functional groups. This trend is further supported by the increased intensity of the m/z = 18 signal (H2O), reflecting a higher degree of hydrophilicity resulting from the acid treatment. In pristine CMK-8 (Figure 3a), the DTG curve exhibits two well-defined thermal events within the temperature ranges of 414 – 520 °C (1.1%) and 520-624 °C (2.3%). These events are associated with the decomposing residual oxygen-containing groups that were not completely removed during carbonization. In parallel, the mass spectrum (Figure 3b) shows signals at m/z 18 and 44, indicating the concurrent release of water and carbon dioxide, typical decomposition products of carboxylic acids, lactones, and carboxylic anhydrides [49]. After oxidative treatment with HNO3 (CMK-8/O, Figure 3c), the material exhibits five distinct mass loss events above 80 °C. The first two, occurring within 87-210 °C and 210-425 °C, correspond to mass losses of 1.3% and 3.5%, respectively. A broad CO2 signal (m/z = 44) is observed within these temperature ranges, related to the loss of carboxylic acid groups. Variation in decomposition temperatures may be attributed to differences in the acidity of functional groups: more acidic groups decompose at lower temperatures, whereas less acidic groups require higher temperatures [50]. Additionally, three further thermal events were identified in the 425-513 °C, 513-614 °C, and 614-853 °C, associated with mass losses of 1.7%, 2.8%, and 4.2%, respectively. Based on the intensity and evolution of the m/z = 44 signal, the first two events are attributed to the decomposition of lactones. At the same time, the third is assigned to the degradation of carboxylic anhydrides.
Figure 4 shows the TGA-DTG-MS analysis results for the pristine CMK-9 and its oxidized analog (CMK-9/O). Both samples exhibit the typical initial event corresponding to the desorption of physisorbed water below 100 °C, which is again more pronounced in the oxidized sample, consistent with its lower hydrophobic character. In pristine CMK-9 (Figure 4a), four thermal events were identified following the initial water loss: 138-216 °C (0.3%), 216-446 °C (0.7%), 446-600 °C (0.9%), and 600-756 °C (1.4%). These events are assigned to the desorption of strongly retained water, the elimination of carboxylic groups, and the decomposition of lactones and anhydrides. The total mass loss in CMK-9 (6.6%) was notably lower than that observed for pristine CMK-8 (10%), suggesting a lower density of surface functional groups in CMK-9. This difference may be related to the type of carbon precursor used during synthesis. While CMK-8 was derived from sucrose, a source rich in hydroxyl and oxygen-containing groups, CMK-9 was synthesized from furfuryl alcohol, a more aromatic and less oxygenated compound [51,52]. This fact can influence both the surface chemistry of the resulting carbon and the incorporation of heteroatoms during carbonization. After oxidation with HNO3, CMK-9/O (Figure 4c) exhibited a more complex thermal profile, with five well-defined events: 92-125 °C (0.5%), 125-200 °C (1.0%), 200-494 °C (5.8%), 494-583 °C (1.7%), and 582-900 °C (6.4%). The first three are attributed to water desorption and the removal of carboxylic groups. In contrast, the last two are associated with the degradation of lactones and anhydrides, as evidenced by the intensified m/z = 18 and 44 signals (Figure 4d). The total mass loss in CMK-9/O reached 17%, a value similar to that observed in CMK-8/O (16.7%). However, analysis of the specific thermal ranges reveals differences in the type of oxygenated functional groups present. Notably, the mass loss observed up to 450 °C was significantly higher in CMK-9/O (7.3%) than in CMK-8/O (4.8%), suggesting a higher density of surface carboxylic groups, which typically decompose within this temperature range [49,53]. At intermediate temperatures (450-650 °C), associated with the removal of phenols, carbonyls, or quinones, CMK-8/O exhibited a greater loss (4.6%) than CMK-9/O (1.7%). Finally, at temperatures above 600 °C, corresponding to the decomposition of lactones and anhydrides, CMK-9/O exhibited a greater loss (6.4%) than CMK-8/O (4.2%). These results indicate that CMK-9/O exhibits a surface functionalization enriched in strongly acidic and polar groups, such as carboxylic acids and anhydrides, suggesting a higher acidic character and potentially greater affinity for polar molecules, such as CO2.
3.3. Surface Characterization
The high-resolution XPS spectra for the C 1s and O 1s core levels of CMK-8 and its oxidized counterpart (CMK-8/O) (Figure 5a and b) reveal the surface chemical changes induced by HNO3 oxidation. In the C 1s spectrum of CMK-8, a dominant peak is observed at 284.7 eV, characteristic of C–C/C=C bonds present in graphitic structures [54]. In CMK-8/O, this peak remains the most intense; however, new components appear at 285.8 eV and 288.2 eV, which are attributed to C–O functional groups (such as hydroxyls and ethers) and O=C–O groups (carboxylic acids), respectively [55]. The relatively low intensity of these latter signals suggests a moderate degree of surface functionalization. This observation is further supported by the O 1s spectra, where CMK-8 exhibits two distinct contributions at 532.5 eV and 530.1 eV. The former is assigned to oxygen in C–O environments, typical of hydroxyl, ether, or phenolic groups. At the same time, the lower binding energy component at 530.1 eV may correspond to oxygen in carbonyl groups (C=O), such as ketones or quinones, often located at defective edges of the carbon framework [56].
In contrast, the O 1s spectrum of CMK-8/O displays a single peak centered at 531.9 eV, likely representing a convolution of oxygenated species such as carbonyl (C=O) and carboxyl (O=C–O) groups, whose binding energies are close and may overlap. A single broad contribution suggests that these functional groups are in a chemically similar or structurally disordered environment. These findings are consistent with the TGA-MS analysis, which showed that CMK-8/O exhibited mass loss attributable to acidic surface functionalities. From a gas adsorption perspective, the introduction of oxygen-containing groups in CMK-8/O is expected to enhance interactions with polar gases such as CO2 through acid-base interactions and hydrogen bonding without significantly affecting the affinity toward non-polar gases like CH4 or H2, which primarily interact via van der Waals dispersion forces.
The XPS spectra of CMK-9 and its oxidized form (CMK-9/O) reveal more pronounced changes upon oxidation (Figure 5c and d). In the C 1s spectrum of CMK-9, the main component is centered at 284.76 eV, corresponding to C–C/C=C bonds, similar to that observed in CMK-8. Well-resolved additional peaks appear at 286.1 eV, assigned to C–O bonds, and at 287.2 eV, attributed to carbonyl (C=O) functionalities. Upon oxidation, the CMK-9/O spectrum shows a clear redistribution of components: the most intense peak shifts to 286.0 eV (C–O), indicating an increase in oxygenated surface groups, followed by peaks at 284.7 eV (C–C/C=C), 287.1 eV (C=O), and a weaker contribution at 289.2 eV, which is associated with carboxylic and anhydride groups (O–C=O) [57,58]. This distribution suggests a more diverse surface functionalization compared to CMK-8/O. A similar trend is evident in the O 1s spectra. For CMK-9, two main peaks are observed: one at 533.7 eV, corresponding to oxygen in C–O environments (alcohols, ethers), and another at 531.60 eV, related to oxygen in carbonyl groups (C=O). In the oxidized sample, CMK-9/O, these bands shift slightly to lower binding energies, appearing at 533.08 eV (C–O) and 530.46 eV (C=O/O–C=O), suggesting a more functionalized chemical environment and possibly a slight decrease in the energetic stability of the oxygen-containing bonds. These findings align with the TGA-MS results, which show that CMK-9/O exhibits the highest mass loss associated with the decomposition of carboxylic and anhydride groups. The enrichment in oxygen functionalities provides more active sites for interaction with CO2, enhancing its adsorption via acid-base interactions and increasing surface polarity. In contrast, for CH4 and H2, gases whose adsorption is dominated by weak physical interactions, the effect may be more limited; however, the highly developed and open porous texture of CMK-9 could still promote their diffusion and retention. These features present CMK-9/O as a versatile candidate for polar and non-polar gas adsorption, highlighting its potential for gas separation and storage applications.
3.4. Textural Characterization
3.4.1. Argon Adsorption-Desorption Isotherms at 87 K
Argon adsorption-desorption isotherms at 87 K for the materials under study are shown in Figure 6. All materials exhibit Type IV(a) isotherms according to the IUPAC classification, a characteristic of micro-mesoporous materials. The hysteresis loops, indicative of mesoporosity, correspond to Type H4 for the CMK-8 materials and Type H2(a) for the CMK-9 materials [59], suggesting differences in pore morphology between both series. Also, a narrower hysteresis loop is observed in the samples corresponding to the CMK-9 materials. At high relative pressures (p/p0 ≈ 1), no significant increase in the adsorbed amount is observed in all isotherms, indicating no significant contribution from macropores. In both CMK-8 and CMK-9 materials, the adsorption isotherms of the pristine samples and the oxygen-functionalized ones exhibit a similar shape, with the isotherm of the pristine samples remaining consistently above that of the functionalized one across the entire range of relative pressures.
The synthesized mesoporous CMK-type materials exhibit clearly differentiated textural characteristics depending on the carbon replica type (CMK-8 and CMK-9) and the subsequent oxidation treatment (Table 1). CMK-9 shows the highest specific surface area (1210 m2/g) and total pore volume (0.96 cm3/g), followed by CMK-8 (820 m2/g, 0.89 cm3/g). After oxidation, both materials experience a decrease in surface area and total pore volume, with reductions ranging from 13% to 24%, depending on the case. This loss can be attributed to the incorporation of oxygen-containing groups (such as carboxylic acids, lactones, or phenols), which partially or entirely block accessible pores, particularly the smaller ones, and may also induce partial collapse or local deterioration of the porous structure.
The microporous volume (VµP-Ar) estimated from Ar adsorption confirms these effects. In the case of CMK-8, microporosity decreases significantly upon oxidation, from 0.10 to 0.03 cm3/g, indicating partial blockage or collapse of the narrow pores. For CMK-9, however, the microporous volume remains unchanged at 0.04 cm3/g before and after oxidation, indicating a lower contribution of micropores or greater structural stability toward functionalization. These differences may be linked to the inherent structural features of the two materials, where the tubular morphology of CMK-9 could favor the development of mesopores over micropores and be less affected by oxidative treatments. Additionally, variations in surface chemistry, as observed by TGA and XPS, may also contribute to these textural trends.
3.4.2. Pore Size Distribution
The pore-size distributions obtained from Ar adsorption at 87 K are shown in Figure 7a. These distributions reveal two main types of porosity: mesopores and micropores.
The analysis of pore size distribution reveals additional structural differences. CMK-8 and CMK-9 samples exhibit different mesopore size distributions, consistent with their respective mesopore structures, which are rod-like in the case of CMK-8 and tube-like in the case of CMK-9. In CMK-9 and its oxidized derivative, the mesopores exhibit a modal size of approximately 3.2 nm, smaller than that observed in CMK-8 and CMK-8/O (4.1 nm). Regarding micropores, the modal sizes are 1.9 and 1.7 nm for CMK-9 and CMK-9/O, respectively. In contrast, for CMK-8 and CMK-8/O, they are centered around 1.5 nm, indicating that CMK-8 contains narrower micropores, which is relevant for the confinement of small molecules. In addition, this material exhibits the highest micropore volume in the series (0.10 cm3/g), which contributes to an enhanced capacity for gas capture or storage in high-energy confined spaces.
Additionally, the microporosity is more clearly observed through the pore size distributions derived from CO2 adsorption at 273 K (Figure 7b), where CMK-9 materials exhibit slightly larger micropores compared to CMK-8, with modal micropore sizes of approximately 0.8 nm and 0.7 nm, respectively.
From an application standpoint, the development of microporosity is crucial for gas storage, given the higher adsorption potential in narrow pores. However, the presence of mesopores is equally essential, as it facilitates faster mass transport and improves the kinetics of adsorption-desorption cycles. Therefore, an optimal balance between both types of porosity is desirable.
3.4.3. H2O Sorption-Desorption Isotherms
The water sorption isotherms, shown in Figure 8a and b, exhibit an S-shaped curve, classified as Type V according to IUPAC, which is typical of water sorption in hydrophobic materials such as carbon with a well-developed and ordered porosity network. All materials show a Type H1 hysteresis loop with two adsorption regions: an initial increase (up to ~0.7 p/p0) attributed to micropore filling, followed by a second increase (up to p/p0≈1) associated with mesopore filling. In all cases, the well-defined hysteresis loop indicates an ordered porosity structure.
For both CMK-8 and CMK-9 materials, oxygen functionalization results in a decrease in total water adsorption. The pristine CMK-8 and CMK-9 samples exhibit a higher adsorption capacity than their oxygen-functionalized counterparts. However, in the low relative pressure region (Figure 8c), where p/p0 < 0.4, and H2O adsorption occurs primarily over functional groups [60], the trend reverses: pristine materials show the lowest adsorption. In contrast, oxygen-functionalized materials exhibit the highest adsorption at low p/p0. This behavior is attributed to the strong affinity of H2O for the oxygen-containing functional groups, making these materials more hydrophilic.
3.5. Experimental Gas Adsorption Studies
3.5.1. CO2 Capture
Figure 9a presents the CO2 adsorption isotherms at 308 K and up to 10 bar for the carbonaceous materials CMK-8 and CMK-9, as well as their oxidized counterparts (CMK-8/O and CMK-9/O). All materials exhibit a characteristic behavior of micro-mesoporous solids, with a progressive increase in CO2 uptake as pressure rises. The absence of an apparent saturation plateau suggests the coexistence of accessible micropores and unsaturated mesopores within the studied pressure range.
As evidenced by the isotherms, CMK-8 exhibits higher CO2 uptake than CMK-9 up to approximately 6.5 bar, beyond which the trend is reversed, and CMK-9 shows superior performance. This crossover highlights the distinct influence of textural properties under different pressure regimes. CMK-8 possesses a significantly larger micropore volume (0.10 cm3/g vs. 0.04 cm3/g for CMK-9), which enhances low-pressure adsorption due to stronger confinement effects and more intense interactions between CO2 molecules and the pore walls. At higher pressures, however, CMK-9 benefits from a larger specific surface area (1210 m2/g) and a higher total pore volume (0.96 cm3/g), providing more accessible sites for gas accumulation.
A similar trend is observed in the oxidized materials: CMK-8/O outperforms CMK-9/O in CO2 adsorption up to approximately 7 bar, after which CMK-9/O surpasses CMK-8/O. Oxidation leads to a general decrease in surface area and micropore volume (Table 1), resulting in somewhat lower adsorption capacities compared to their pristine counterparts. This decline in performance is likely due to the partial or complete blockage of narrower pores or structural collapse caused by the introduction of oxygen-containing functional groups. Although these groups may enhance acid–base interactions with CO2, their overall effect under the studied conditions appears moderately detrimental to the total uptake.
At 10 bar and 308 K, the maximum CO2 capture reach 4.9 mmol/g for CMK-9, 4.6 mmol/g for both CMK-8 and CMK-9/O, and 4.4 mmol/g for CMK-8/O. These values are competitive within the context of carbon-based adsorbents (Table 2), clearly outperforming Maxsorb, a widely used commercial activated carbon, which reports only 2.91 mmol/g under comparable conditions (10 bar, 298 K) [61]. Nevertheless, when compared to more advanced hybrid materials such as CPO-27-Mg@KIT-6, which achieves 15.8 mmol/g at 10 bar and 298 K [62], the performance of the CMK materials remains substantially lower. This discrepancy is primarily attributed to the presence of open metal sites in MOFs, which offer strong and specific interactions with CO2 molecules, in contrast to the predominantly physical adsorption mechanism observed in carbon materials. Despite this limitation, CMK-8 and CMK-9, as well as their oxidized forms, offer important advantages in terms of thermal and chemical stability, as well as ease of regeneration. These attributes make them promising candidates for practical CO2 capture technologies, particularly under moderate-pressure conditions.
3.5.2. CH4 Storage
The The CH4 adsorption isotherms at 298 K up to 10 bars for all materials are shown in Figure 9b. It can be observed that the pristine materials exhibit the highest adsorption capacity, with CMK-8 showing the best performance, reaching 2.8 mmol/g at 10 bar, and CMK-9 reaching 2.5 mmol/g (Table 2). The oxidized versions, CMK-8/O and CMK-9/O, exhibit substantially lower performance, with rates of 2.3 mmol/g and 2.0 mmol/g, respectively. This trend is observed across the entire pressure range.
This behavior suggests that the adsorption capacity of the materials is primarily determined by their total pore volume (VTP) rather than their micropore volume. Although the micropore volume increases in CMK-9 and decreases in CMK-8 after functionalization, both series show a decrease in total pore volume, which correlates with the observed reduction in CH4 uptake. This effect is consistent with the fact that CH4 is a neutral molecule with no permanent dipole moment. Thus, its interaction with the surface chemistry is minimal, and the main effect of functionalization is the loss of accessible pore space.
3.5.3. H2 Storage
H2 adsorption at 77 K follows a trend similar to that observed for CO2 capture, though with significantly higher uptake capacities, as expected due to the cryogenic temperature employed in these experiments. As shown in Figure 9c, the pristine materials exhibit the highest hydrogen uptake, with CMK-9 being the most efficient, reaching 8.8 mmol/g at 8 bar, i.e., 1.76% w/w followed by CMK-8, which achieved 8.0 mmol/g, i.e., 1.60% w/w.
Surface oxidation leads to a notable decrease in H2 adsorption capacity, reducing to 7.0 mmol/g for CMK-9/O and 6.4 mmol/g for CMK-8/O. This decline can be primarily attributed to the partial loss of accessible pore volume following the introduction of oxygen-containing functional groups, which reduces the number of effective sites available for physisorption. Given that H2 is a non-polar molecule with low molecular weight, its adsorption is predominantly governed by the availability of ultramicropores (< 0.7 nm) and accessible surface area at cryogenic temperatures. Therefore, any structural modification that limits access to such pores directly impacts the storage capacity.
3.6. Experimental Isosteric Enthalpy of CO2, CH4, and H2 Adsorption
The isosteric heat of adsorption () profiles of CO2, CH4, and H2 on CMK-8 and CMK-9, along with their oxidized derivatives (CMK-8/O and CMK-9/O), provide insight into the interplay between surface chemistry and textural features.
For CO2 (Figure 10a), the oxidized materials exhibit enhanced initial values, reaching 31 kJ/mol for CMK-8/O and 34 kJ/mol for CMK-9/O, compared to 31 kJ/mol and 29 kJ/mol for the pristine CMK-8 and CMK-9, respectively. While CMK-8 and CMK-8/O share similar initial values, the increase observed in CMK-9/O suggests stronger interactions due to the presence of oxygen-containing functional groups (e.g., carboxylic acids and hydroxyls), which increase the surface polarity and promote specific interactions with the CO2 quadrupole. In all cases, decreases with increasing adsorption loading (nads), reflecting the progressive occupation of high-energy adsorption sites. This trend is more pronounced in the oxidized materials, likely due to their greater surface heterogeneity and the distribution of functionalized sites.
In the case of CH4 (Figure 10b), a non-polar molecule, the values are significantly lower, ranging from ~10 to 30 kJ/mol. The pristine CMK-8 exhibits the weakest interactions (~10-12 kJ/mol), consistent with its wider mesopores (4.1 nm) and limited surface functionality. Upon oxidation, both CMK-8/O and CMK-9/O show a marked increase in at higher loadings, with values rising above 25-30 kJ/mol. This trend is not solely attributable to stronger adsorbent-adsorbate interactions, but rather reflects a combination of factors: the onset of adsorbate-adsorbate interactions within confined mesopores as adsorption progresses, and the enhancement of dispersive interactions promoted by oxygenated surface groups. These functional groups can increase the carbon surface’s polarizability, thereby enhancing van der Waals interactions with CH4 molecules. The smaller mesopore diameter of CMK-9 (3.2 nm vs. 4.1 nm in CMK-8) likely enhances this effect by promoting closer proximity between CH4 molecules, creating a more favorable environment for retention, particularly in the oxidized form.
For H2, adsorption (Figure 10c) occurs through weak physisorption mechanisms, as reflected in the low values (~6-9 kJ/mol). Nevertheless, CMK-8 consistently shows slightly higher across the loading range compared to CMK-9, particularly in its pristine form. This can be attributed to its narrower micropores (1.5 nm modal size) and higher micropore volume (0.10 cm3/g), which enhance confinement effects critical for H2 storage at cryogenic temperatures. In contrast, the oxidized materials display slightly reduced values. This decrease may be explained by partial blockage of micropores due to the incorporation of oxygen-containing functional groups, which can obstruct access to the narrowest and highest-energy adsorption sites. As a result, the overall adsorption potential within micropores is reduced, leading to lower isosteric heat values than in the pristine materials.
3.7. Computational Gas Adsorption Studies
3.7.1. Gas Capture
Figure 11 shows excess adsorption isotherms for CH4, CO2, and H2 for monodispersed slit-shaped pores of type GP and GOx, with pore widths H = 8, 10, 12, 15, 20, and 30 Å within the pressure range 0 ≤ P ≤ 10 bar range (extended isotherms up to 60 bar are provided in the Figures S2-S4, Tables S1-S6). Narrower pores exhibit significantly higher uptake at low pressures due to overlapping interaction potentials from opposing pore walls, while larger pores show increased adsorption at elevated pressures.
We examine the influence of polar functional groups (hydroxyl and epoxy) by comparing adsorption in GP-H (pristine graphene) and GOx-H (oxidized graphene) pores across pore sizes categorized as small (8 Å), medium (10-15 Å), and large (≥20 Å). Figure 12 compares adsorption isotherms for CH4, CO2, and H2 at representative pore widths of 8, 12, and 30 Å.
Key observations include: (i) for CH4, the presence of functional groups consistently reduces uptake, particularly in narrower pores, due primarily to steric volume occupied by surface groups (Figure 1). (ii) H2 shows a similar, though less pronounced, reduction in uptake; its smaller molecular size allows easier access between functional groups, mitigating the impact. (iii) for CO2, polar groups enhance adsorption at low pressures by increasing affinity via interactions between the significant electric quadrupole moment of CO2 and the dipole of hydroxyl groups. At higher pressures, however, the occupied pore volume from the functional groups reduces overall capacity.
3.7.2. Comparison with Experimental Adsorption Isotherms
To relate these simulations to experimental data (Figure 9), we account for the actual pore-size distributions (PSDs) of the materials (Figure 7). Following Ortiz et al. [37], PSDs are modeled as sums of Gaussian distributions
The area under each Gaussian, ZH0, corresponds to the volume fraction of pores centered at H0. The normalized pore fraction fH0 is computed as:
Synthetic adsorption isotherms N(P) are then constructed as weighted sums [37]:
where NH0’(P) are isotherms for individual pore widths, and α scales for differences in surface area between the experimental material and the model (approximately 2600 m2/g). Figure 13 compares synthetic and experimental isotherms for CMK-8, CMK-8/O, CMK-9, and CMK-9/O. Notably, the PSDs from subcritical nitrogen adsorption are applied directly to supercritical adsorption of CH4, CO2, and H2 without further adjustment. Good qualitative agreement is observed for CH4 and CO2; hydrogen fits are less accurate.
3.7.3. Isosteric Enthalpy of CO2, CH4, and H2 Adsorption
Simulated isosteric heats of adsorption are presented in Figure 14 for small (8 Å), medium (12 Å), and large (30 Å) pores in both GP and GOx models. Narrower pores generally yield higher adsorption enthalpies. While the simulated enthalpy ranges qualitatively align with experimental values (), a quantitative comparison would require a careful synthesis of weighted enthalpies across PSDs, as described in Ortiz et al. [37].
Oxidized pores (GOx) show consistently elevated enthalpies for CO2 adsorption, reflecting enhanced interactions due to oxygen-containing surface groups that increase polarity. Differences for CH4 and H2 between oxidized and pristine surfaces are minimal, consistent with their non-polar nature.
3.7.4. Mechanism for Enhanced Interactions of CO2 with Oxidized Materials
To elucidate the origin of CO2 affinity for oxidized pores, radial distribution functions g(r) between adsorbate molecules and adsorbent atoms were calculated [21,22,23,68]. Figure 15 shows g(r) between hydroxyl oxygen atoms and the centers of mass of CH4, CO2, and H2. A pronounced correlation peak is observed for CO2, indicating strong attraction to hydroxyl groups, whereas correlations for CH4 and H2 are weaker. Reducing OH group density or gas pressure increases this correlation by minimizing interference and adsorbate crowding. Using an uncharged atomic approximation (UAA) for H2, which omits the quadrupole moment, slightly lowers correlation. Other surface atoms, such as epoxy oxygens or graphene carbons, showed no notable correlation peaks (see Figure S8, S9). This enhanced CO2–OH interaction via electrostatic complementarity explains the increased low-pressure uptake in oxidized pores.
4. Conclusions
This study presents a comprehensive investigation that combines experimental techniques and molecular simulations to elucidate how the porous structure and surface functionalization via HNO3 oxidation distinctly influence the adsorption behavior of key gases —CO2, CH4, and H2 —on ordered mesoporous carbons CMK-8 and CMK-9.
CMK-8, characterized by a notably higher micropore volume (0.10 cm3/g vs. 0.04 cm3/g for CMK-9), demonstrated superior CO2 and H2 adsorption capacities at low pressures, alongside significant CH4 uptake across the pressure range studied. These findings highlight the critical role of micropore confinement and specific adsorbate-surface interactions in narrow pores, which enhance adsorption potential, especially for gases with intense quadrupole moments or requiring high-energy adsorption sites. In contrast, CMK-9’s larger specific surface area (1210 m2/g) and greater total pore volume (0.96 cm3/g) enabled enhanced adsorption performance at elevated pressures, particularly for CO2 and H2, underscoring the importance of mesopore accessibility and pore volume in facilitating progressive gas uptake under moderate to high-pressure regimes.
Surface oxidation with HNO3 introduced oxygen-containing functional groups, including phenols, carbonyls, and carboxyls, substantially modifying surface chemistry. XPS analysis confirmed the incorporation of these groups, evidenced by new components in the C 1s and O 1s spectra, revealing a higher degree of chemical heterogeneity in CMK-9/O compared to CMK-8/O.
The increased surface polarity strengthened adsorbate interactions, as evidenced by elevated isosteric heats of adsorption for CO2. However, this chemical enhancement was accompanied by a reduction in accessible surface area and pore volume, resulting in lower maximum adsorption capacities for all gases studied. This trade-off between enhanced chemical affinity and diminished structural accessibility highlights a key challenge in adsorbent design: optimizing functionalization to improve selectivity and binding strength without excessively compromising pore availability.
The strong agreement between experimental adsorption isotherms and the qualitative agreement of adsorption isosteric heats validate the structural and chemical models employed and reinforce the reliability of the combined characterization approach. Molecular simulations provided mechanistic insight into gas-surface interactions, including the enhanced CO2 affinity for hydroxyl groups via electrostatic quadrupole-dipole interactions and the steric hindrance effects of surface groups on CH4 and H2 uptake. This synergy of experimental and computational approaches enables a rational framework for tailoring pore architecture and surface chemistry to target specific gases and operating conditions.
Overall, this work demonstrates that an effective strategy for gas capture and storage must strike a careful balance between pore system accessibility and surface chemical functionality. Given their thermal stability, chemical robustness, and regenerability, CMK-8 and CMK-9, along with their oxidized derivatives, are promising materials for the sustainable storage and separation of CO2, CH4, and H2 at moderate pressures and temperatures. Future work could fine-tune oxidation levels and pore structures to optimize selectivity and capacity further, and extend these insights to hybrid and composite materials for enhanced performance in industrial applications.
Supplementary Information
The following supporting information can be downloaded at the website of this paper posted on Preprints.org.
Author Contributions
Conceptualization, C.A.D., K.M-C., J.V-R., D.B., C.W. and K.S.; methodology, C.A.D., K.M-C., J.V-R., D.B., A.D., C.W. and K.S.; software, C.A.D., K.M-C., J.V-R., A.D., C.W. and K.S.; validation, C.A.D., K.M-C., J.V-R., D.B., A.D., C.W. and K.S.; formal analysis, C.A.D., K.M-C., J.V-R., A.D., and C.W.; investigation, C.A.D., K.M-C., J.V-R., A.D., and C.W.; resources, C.W. and K.S., data curation, C.A.D., K.M-C., J.V-R. and C.W.; writing—original draft preparation, C.A.D., K.M-C., J.V-R. and C.W.; writing—review and editing, K.M-C., J.V-R., D.B., C.W. and K.S.; visualization, C.A.D., K.M-C., J.V-R., D.B., A.D., C.W. and K.S.; supervision, J.V-R., K.S.; project administration, C.W. and K.S.; funding acquisition, C.W. and K.S.
Funding
The authors express their gratitude to the Consejo Nacional de Investigaciones Científicas y Técnicas (CONICET), the Agencia Nacional de Promoción de Ciencia y Tecnología (ANPCYT), and the Universidad Nacional de San Luis (UNSL) from Argentina. CW was supported in part by the National Science Foundation Grant No. IIP-2044726, and the University of Missouri Research Council. KS gratefully acknowledges financial support by the Fulbright Scholar-In-Residence Program, which is sponsored by the U.S. Department of State.
Institutional Review Board Statement
Not applicable.
Informed Consent Statement
Not applicable.
Data Availability Statement
Data are contained within the article.
Acknowledgments:
Conflicts of Interest
The authors declare no conflicts of interest.
References
- Bae, Y.; Snurr, R.Q. Development and Evaluation of Porous Materials for Carbon Dioxide Separation and Capture. Angew Chem Int Ed 2011, 50, 11586–11596. [Google Scholar] [CrossRef]
- Muhammad, R.; Nah, Y.-C.; Oh, H. Spider Silk-Derived Nanoporous Activated Carbon Fiber for CO2 Capture and CH4 and H2 Storage. Journal of CO2 Utilization 2023, 69, 102401. [Google Scholar] [CrossRef]
- Langmi, H.W.; Ren, J.; North, B.; Mathe, M.; Bessarabov, D. Hydrogen Storage in Metal-Organic Frameworks: A Review. Electrochimica Acta 2014, 128, 368–392. [Google Scholar] [CrossRef]
- Joo, S.H.; Jun, S.; Ryoo, R. Synthesis of Ordered Mesoporous Carbon Molecular Sieves CMK-1. Microporous and Mesoporous Materials 2001, 44–45, 153–158. [Google Scholar] [CrossRef]
- Schwind, B.; Smått, J.-H.; Tiemann, M.; Weinberger, C. Modeling of Gyroidal Mesoporous CMK-8 and CMK-9 Carbon Nanostructures and Their X-Ray Diffraction Patterns. Microporous and Mesoporous Materials 2021, 310, 110330. [Google Scholar] [CrossRef]
- Engineering Nitrogen and Oxygen Functionalities in Naturally Sourced Activated Carbon for Multicomponent Gas Adsorption | Scientific Reports. Available online: https://www.nature.com/articles/s41598-025-13430-4 (accessed on 4 August 2025).
- Nguyen, H.G.T.; Toman, B.; van Zee, R.D.; Prinz, C.; Thommes, M.; Ahmad, R.; Kiska, D.; Salinger, J.; Walton, I.M.; Walton, K.S.; et al. Reference Isotherms for Water Vapor Sorption on Nanoporous Carbon: Results of an Interlaboratory Study. Adsorption 2023, 29, 113–124. [Google Scholar] [CrossRef]
- Petrovic, B.; Gorbounov, M.; Masoudi Soltani, S. Impact of Surface Functional Groups and Their Introduction Methods on the Mechanisms of CO2 Adsorption on Porous Carbonaceous Adsorbents. Carbon Capture Science & Technology 2022, 3, 100045. [Google Scholar] [CrossRef]
- Sevilla, M.; Fuertes, A.B. Sustainable Porous Carbons with a Superior Performance for CO2 Capture. Energy Environ. Sci. 2011, 4, 1765. [Google Scholar] [CrossRef]
- Mukhtar, A.; Mellon, N.; Saqib, S.; Khawar, A.; Rafiq, S.; Ullah, S.; Al-Sehemi, A.G.; Babar, M.; Bustam, M.A.; Khan, W.A.; et al. CO2/CH4 Adsorption over Functionalized Multi-Walled Carbon Nanotubes; an Experimental Study, Isotherms Analysis, Mechanism, and Thermodynamics. Microporous and Mesoporous Materials 2020, 294, 109883. [Google Scholar] [CrossRef]
- Montiel-Centeno, K.; Barrera, D.; García-Villén, F.; Viseras, C.; Rodríguez-Castellón, E.; Diaz, C.A.; Villarroel-Rocha, J.; Moreno, M.S.; Sapag, K. Three-Dimensional CMK-8 and CMK-9 Ordered Mesoporous Carbons as Potential Nanocarriers for Cephalexin Controlled Release. Microporous and Mesoporous Materials 2025, 392, 113640. [Google Scholar] [CrossRef]
- Brunauer, S.; Emmett, P.H.; Teller, E. Adsorption of Gases in Multimolecular Layers. J. Am. Chem. Soc. 1938, 60, 309–319. [Google Scholar] [CrossRef]
- Rouquerol, F.; Rouquerol, J.; Sing, K.S.W.; Llewellyn, P.L.; Maurin, G. Adsorption by Powders and Porous Solids: Principles, Methodology and Applications; Second edition.; Elsevier/AP: Amsterdam, 2014; ISBN 978-0-08-097035-6. [Google Scholar]
- Neimark, A.V.; Lin, Y.; Ravikovitch, P.I.; Thommes, M. Quenched Solid Density Functional Theory and Pore Size Analysis of Micro-Mesoporous Carbons. Carbon 2009, 47, 1617–1628. [Google Scholar] [CrossRef]
- Horváth, G.; Kawazoe, K. Method for the Calculation of Effective Pore Size Distribution in Molecular Sieve Carbon. J. Chem. Eng. Japan / JCEJ 1983, 16, 470–475. [Google Scholar] [CrossRef]
- Ruthven, D.M. Principles of Adsorption and Adsorption Processes; A Wiley-Interscience publication; Wiley: New York, 1984; ISBN 978-0-471-86606-0. [Google Scholar]
- Ebbing, D.D.; Gammon, S.D. General Chemistry; Recording for the Blind & Dyslexic: Princeton, N.J., 2005.
- Golebiowska, M.; Roth, M.; Firlej, L.; Kuchta, B.; Wexler, C. The Reversibility of the Adsorption of Methane–Methyl Mercaptan Mixtures in Nanoporous Carbon. Carbon 2012, 50, 225–234. [Google Scholar] [CrossRef]
- Pfeifer, P.; Burress, J.W.; Wood, M.B.; Lapilli, C.M.; Barker, S.A.; Pobst, J.S.; Cepel, R.J.; Wexler, C.; Shah, P.S.; Gordon, M.J.; et al. HIGH-SURFACE-AREA BIOCARBONS FOR REVERSIBLE ON-BOARD STORAGE OF NATURAL GAS AND HYDROGEN. MRS Proc. 2007, 1041, 1041-R02-02. [Google Scholar] [CrossRef]
- Yachmenev, A.; Campargue, A.; Yurchenko, S.N.; Küpper, J.; Tennyson, J. Electric Quadrupole Transitions in Carbon Dioxide. The Journal of Chemical Physics 2021, 154, 211104. [Google Scholar] [CrossRef] [PubMed]
- Allen, M.P.; Tildesley, D.J.; Tildesley, D.J. Computer Simulation of Liquids; Oxford science publications; Reprinted.; Clarendon Pr: Oxford, 2009; ISBN 978-0-19-855645-9.
- Frenkel, D.; Smit, B. Understanding Molecular Simulation: From Algorithms to Applications; Computational science series; 2nd ed. Academic Press: San Diego, 2002; ISBN 978-0-12-267351-1. [Google Scholar]
- Nicholson, D.; Parsonage, N.G. Computer Simulation and the Statistical Mechanics of Adsorption; Academic Press: London ; New York, 1982; ISBN 978-0-12-518060-3.
- Becke, A.D. Density-Functional Thermochemistry. III. The Role of Exact Exchange. The Journal of Chemical Physics 1993, 98, 5648–5652. [Google Scholar] [CrossRef]
- Lee, C.; Yang, W.; Parr, R.G. Development of the Colle-Salvetti Correlation-Energy Formula into a Functional of the Electron Density. Phys. Rev. B 1988, 37, 785–789. [Google Scholar] [CrossRef]
- Vosko, S.H.; Wilk, L.; Nusair, M. Accurate Spin-Dependent Electron Liquid Correlation Energies for Local Spin Density Calculations: A Critical Analysis. Can. J. Phys. 1980, 58, 1200–1211. [Google Scholar] [CrossRef]
- Stephens, P.J.; Devlin, F.J.; Chabalowski, C.F.; Frisch, M.J. Ab Initio Calculation of Vibrational Absorption and Circular Dichroism Spectra Using Density Functional Force Fields. J. Phys. Chem. 1994, 98, 11623–11627. [Google Scholar] [CrossRef]
- Frisch, M.J.; Trucks, G.W.; Schlegel, H.B.; Scuseria, G.E. Gaussian 16, Revision C.01; Inc., Wallingford CT, 2016.
- Rappe, A.K.; Casewit, C.J.; Colwell, K.S.; Goddard, W.A.; Skiff, W.M. UFF, a Full Periodic Table Force Field for Molecular Mechanics and Molecular Dynamics Simulations. J. Am. Chem. Soc. 1992, 114, 10024–10035. [Google Scholar] [CrossRef]
- Silvera, I.F.; Goldman, V.V. The Isotropic Intermolecular Potential for H2 and D2 in the Solid and Gas Phases. The Journal of Chemical Physics 1978, 69, 4209–4213. [Google Scholar] [CrossRef]
- Deiters, U.K.; Sadus, R.J. An Intermolecular Potential for Hydrogen: Classical Molecular Simulation of Pressure–Density–Temperature Behavior, Vapor–Liquid Equilibria, and Critical and Triple Point Properties. The Journal of Chemical Physics 2023, 158. [Google Scholar] [CrossRef]
- Vanommeslaeghe, K.; MacKerell, A.D. Automation of the CHARMM General Force Field (CGenFF) I: Bond Perception and Atom Typing. J. Chem. Inf. Model. 2012, 52, 3144–3154. [Google Scholar] [CrossRef]
- Vanommeslaeghe, K.; Raman, E.P.; MacKerell, A.D. Automation of the CHARMM General Force Field (CGenFF) II: Assignment of Bonded Parameters and Partial Atomic Charges. J. Chem. Inf. Model. 2012, 52, 3155–3168. [Google Scholar] [CrossRef]
- Dubbeldam, D.; Calero, S.; Ellis, D.E.; Snurr, R.Q. RASPA: Molecular Simulation Software for Adsorption and Diffusion in Flexible Nanoporous Materials. Molecular Simulation 2016, 42, 81–101. [Google Scholar] [CrossRef]
- Düren, T.; Sarkisov, L.; Yaghi, O.M.; Snurr, R.Q. Design of New Materials for Methane Storage. Langmuir 2004, 20, 2683–2689. [Google Scholar] [CrossRef] [PubMed]
- Ewald, P.P. Die Berechnung Optischer Und Elektrostatischer Gitterpotentiale. Annalen der Physik 1921, 369, 253–287. [Google Scholar] [CrossRef]
- Ortiz, L.; Kuchta, B.; Firlej, L.; Roth, M.W.; Wexler, C. Methane Adsorption in Nanoporous Carbon: The Numerical Estimation of Optimal Storage Conditions. Mater. Res. Express 2016, 3, 055011. [Google Scholar] [CrossRef]
- Abdul Razak, M.; Do, D.D.; Birkett, G.R. Evaluation of the Interaction Potentials for Methane Adsorption on Graphite and in Graphitic Slit Pores. Adsorption 2011, 17, 385–394. [Google Scholar] [CrossRef]
- Ayappa, K.G.; Ghatak, C. The Structure of Frozen Phases in Slit Nanopores: A Grand Canonical Monte Carlo Study. The Journal of Chemical Physics 2002, 117, 5373–5383. [Google Scholar] [CrossRef]
- Miyahara, M.; Gubbins, K.E. Freezing/Melting Phenomena for Lennard-Jones Methane in Slit Pores: A Monte Carlo Study. The Journal of Chemical Physics 1997, 106, 2865–2880. [Google Scholar] [CrossRef]
- Steele, W.A. The Interaction of Gases with Solid Surfaces, The International encyclopedia of physical chemistry and chemical physics. Topic 14: Properties of interfaces, 1st ed.; Pergamon Press: Oxford, New York, 1974; ISBN 978-0-08-017724-3. [Google Scholar]
- Kuchta, B.; Dundar, E.; Formalik, F.; Llewellyn, P.L.; Firlej, L. Adsorption-Induced Structural Phase Transformation in Nanopores. Angewandte Chemie 2017, 129, 16461–16464. [Google Scholar] [CrossRef]
- Goodbody, S.J.; Watanabe, K.; MacGowan, D.; Walton, J.P.R.B.; Quirke, N. Molecular Simulation of Methane and Butane in Silicalite. Faraday Trans. 1991, 87, 1951. [Google Scholar] [CrossRef]
- Mazur, B.; Formalik, F.; Roztocki, K.; Bon, V.; Kaskel, S.; Neimark, A.V.; Firlej, L.; Kuchta, B. Quasicontinuous Cooperative Adsorption Mechanism in Crystalline Nanoporous Materials. J. Phys. Chem. Lett. 2022, 13, 6961–6965. [Google Scholar] [CrossRef] [PubMed]
- Valleroy, Z.; Dos Santos, G.; Lombardi, T.; Wexler, C. Adsorption of Natural Gas Mixtures of Methane, Ethane, and Propane in Nanoporous Carbon: Fully Atomistic Numerical Studies. Langmuir 2020, 36, 3690–3702. [Google Scholar] [CrossRef] [PubMed]
- Borkman, R.F. Electric Quadrupole Moments for H2+, H2 and H3+ from a Point Charge Model. Chemical Physics Letters 1971, 9, 624–626. [Google Scholar] [CrossRef]
- Valleroy, C.; d’Ambrosio, R.; Blanc, C.; Anglaret, E.; Firlej, L.; Wexler, C. Temperature Dependence of the near Infrared Absorption Spectrum of Single-Wall Carbon Nanotubes Dispersed by Sodium Dodecyl Sulfate in Aqueous Solution: Experiments and Molecular Dynamics Study. J Mol Model 2024, 30. [Google Scholar] [CrossRef]
- Montiel-Centeno, K.; Barrera, D.; García-Villén, F.; Sánchez-Espejo, R.; Borrego-Sánchez, A.; Rodríguez-Castellón, E.; Sandri, G.; Viseras, C.; Sapag, K. Cephalexin Loading and Controlled Release Studies on Mesoporous Silica Functionalized with Amino Groups. Journal of Drug Delivery Science and Technology 2022, 72, 103348. [Google Scholar] [CrossRef]
- Moldoveanu, S.C. Chapter 14 - Pyrolysis of Various Derivatives of Carboxylic Acids. In Pyrolysis of Organic Molecules (Second Edition); Moldoveanu, S.C., Ed.; Elsevier, 2019; pp. 635–696 ISBN 978-0-444-64000-0.
- Seguel, J.; García, R.; Chimentão, R.J.; García-Fierro, J.L.; Ghampson, I.T.; Escalona, N.; Sepúlveda, C. Thermal Modification Effect on Supported Cu-Based Activated Carbon Catalyst in Hydrogenolysis of Glycerol. Materials 2020, 13, 603. [Google Scholar] [CrossRef]
- Barrera, D.; Florent, M.; Sapag, K.; Bandosz, T.J. Insight into the Mechanism of Oxygen Reduction Reaction on Micro/Mesoporous Carbons: Ultramicropores versus Nitrogen-Containing Catalytic Centers in Ordered Pore Structure. ACS Appl. Energy Mater. 2019, 2, 7412–7424. [Google Scholar] [CrossRef]
- Regiart, M.; Magallanes, J.L.; Barrera, D.; Villarroel-Rocha, J.; Sapag, K.; Raba, J.; Bertolino, F.A. An Ordered Mesoporous Carbon Modified Electrochemical Sensor for Solid-Phase Microextraction and Determination of Triclosan in Environmental Samples. Sensors and Actuators B: Chemical 2016, 232, 765–772. [Google Scholar] [CrossRef]
- Moldoveanu, S.C. Chapter 17 Pyrolysis of Carboxylic Acids. In Techniques and Instrumentation in Analytical Chemistry; Moldoveanu, S.C., Ed.; Pyrolysis of Organic Molecules with Applications to Health and Environmental Issues; Elsevier, 2010; Vol. 28, pp. 471–526.
- Zhang, X.; Song, H.; He, S.; Wang, H.; Jiang, J.; Han, T. Heterochain Polymer Carbon Modified Transition Metal Composites for Fabricating High Energy-Density Supercapacitors. Surfaces and Interfaces 2024, 51, 104690. [Google Scholar] [CrossRef]
- Brender, P.; Gadiou, R.; Rietsch, J.-C.; Fioux, P.; Dentzer, J.; Ponche, A.; Vix-Guterl, C. Characterization of Carbon Surface Chemistry by Combined Temperature Programmed Desorption with in Situ X-Ray Photoelectron Spectrometry and Temperature Programmed Desorption with Mass Spectrometry Analysis. Anal. Chem. 2012, 84, 2147–2153. [Google Scholar] [CrossRef] [PubMed]
- Grishchenko, L.M.; Zhytnyk, D.O.; Matushko, I.P.; Diyuk, V.E.; Noskov, Y.V.; Malyshev, V.Yu.; Moiseienko, V.A.; Boldyrieva, O.Yu.; Lisnyak, V.V. Microwave Properties of Composite Films Based on Polyvinyl Chloride and Brominated Activated Carbon. ChemistrySelect 2024, 9, e202400432. [Google Scholar] [CrossRef]
- Chen, X.; Wang ,Xiaohui; and Fang, D. A Review on C1s XPS-Spectra for Some Kinds of Carbon Materials. Fullerenes, Nanotubes and Carbon Nanostructures 2020, 28, 1048–1058. [CrossRef]
- Qiu, C.; Jiang, L.; Gao, Y.; Sheng, L. Effects of Oxygen-Containing Functional Groups on Carbon Materials in Supercapacitors: A Review. Materials & Design 2023, 230, 111952. [Google Scholar] [CrossRef]
- Thommes, M.; Kaneko, K.; Neimark, A.V.; Olivier, J.P.; Rodriguez-Reinoso, F.; Rouquerol, J.; Sing, K.S.W. Physisorption of Gases, with Special Reference to the Evaluation of Surface Area and Pore Size Distribution (IUPAC Technical Report). Pure and Applied Chemistry 2015, 87, 1051–1069. [Google Scholar] [CrossRef]
- Velasco, L.F.; Snoeck, D.; Mignon, A.; Misseeuw, L.; Ania, C.O.; Van Vlierberghe, S.; Dubruel, P.; De Belie, N.; Lodewyckx, P. Role of the Surface Chemistry of the Adsorbent on the Initialization Step of the Water Sorption Process. Carbon 2016, 106, 284–288. [Google Scholar] [CrossRef]
- Silvestre-Albero, J.; Wahby, A.; Sepúlveda-Escribano, A.; Martínez-Escandell, M.; Kaneko, K.; Rodríguez-Reinoso, F. Ultrahigh CO2 Adsorption Capacity on Carbon Molecular Sieves at Room Temperature. Chem. Commun. 2011, 47, 6840. [Google Scholar] [CrossRef] [PubMed]
- Villarroel-Rocha, D.; Godoy, A.A.; Toncón-Leal, C.; Villarroel-Rocha, J.; Moreno, M.S.; Bernini, M.C.; Narda, G.E.; Sapag, K. Synthesis of Micro–Mesoporous CPO-27-Mg@KIT-6 Composites and Their Test in CO2 Adsorption. New J. Chem. 2020, 44, 10056–10065. [Google Scholar] [CrossRef]
- Plaza, M.G.; González, A.S.; Pevida, C.; Pis, J.J.; Rubiera, F. Valorisation of Spent Coffee Grounds as CO2 Adsorbents for Postcombustion Capture Applications. Applied Energy 2012, 99, 272–279. [Google Scholar] [CrossRef]
- Arami-Niya, A.; Rufford, T.E.; Zhu, Z. Nitrogen-Doped Carbon Foams Synthesized from Banana Peel and Zinc Complex Template for Adsorption of CO2, CH4, and N2. Energy Fuels 2016, 30, 7298–7309. [Google Scholar] [CrossRef]
- Lee, J.-H.; Heo, Y.-J.; Park, S.-J. Effect of Silica Removal and Steam Activation on Extra-Porous Activated Carbons from Rice Husks for Methane Storage. International Journal of Hydrogen Energy 2018, 43, 22377–22384. [Google Scholar] [CrossRef]
- Adeniran, B.; Mokaya, R. Compactivation: A Mechanochemical Approach to Carbons with Superior Porosity and Exceptional Performance for Hydrogen and CO2 Storage. Nano Energy 2015, 16, 173–185. [Google Scholar] [CrossRef]
- Balahmar, N.; Mokaya, R. Pre-Mixed Precursors for Modulating the Porosity of Carbons for Enhanced Hydrogen Storage: Towards Predicting the Activation Behaviour of Carbonaceous Matter. J. Mater. Chem. A 2019, 7, 17466–17479. [Google Scholar] [CrossRef]
- Lombardi, T. Computational Studies of Gases Adsorbed on Graphene-like Materials. Ph.D, University of Missouri, 2022.
Figure 1.
Base unit cells of GP (left) and GOx (right) for H = 12 Å. Color scheme: C = gray, O = red, H = light gray. Additional surfaces shown separate the accessible and inaccessible volumes for a CH4 or CO2 molecule.
Figure 1.
Base unit cells of GP (left) and GOx (right) for H = 12 Å. Color scheme: C = gray, O = red, H = light gray. Additional surfaces shown separate the accessible and inaccessible volumes for a CH4 or CO2 molecule.
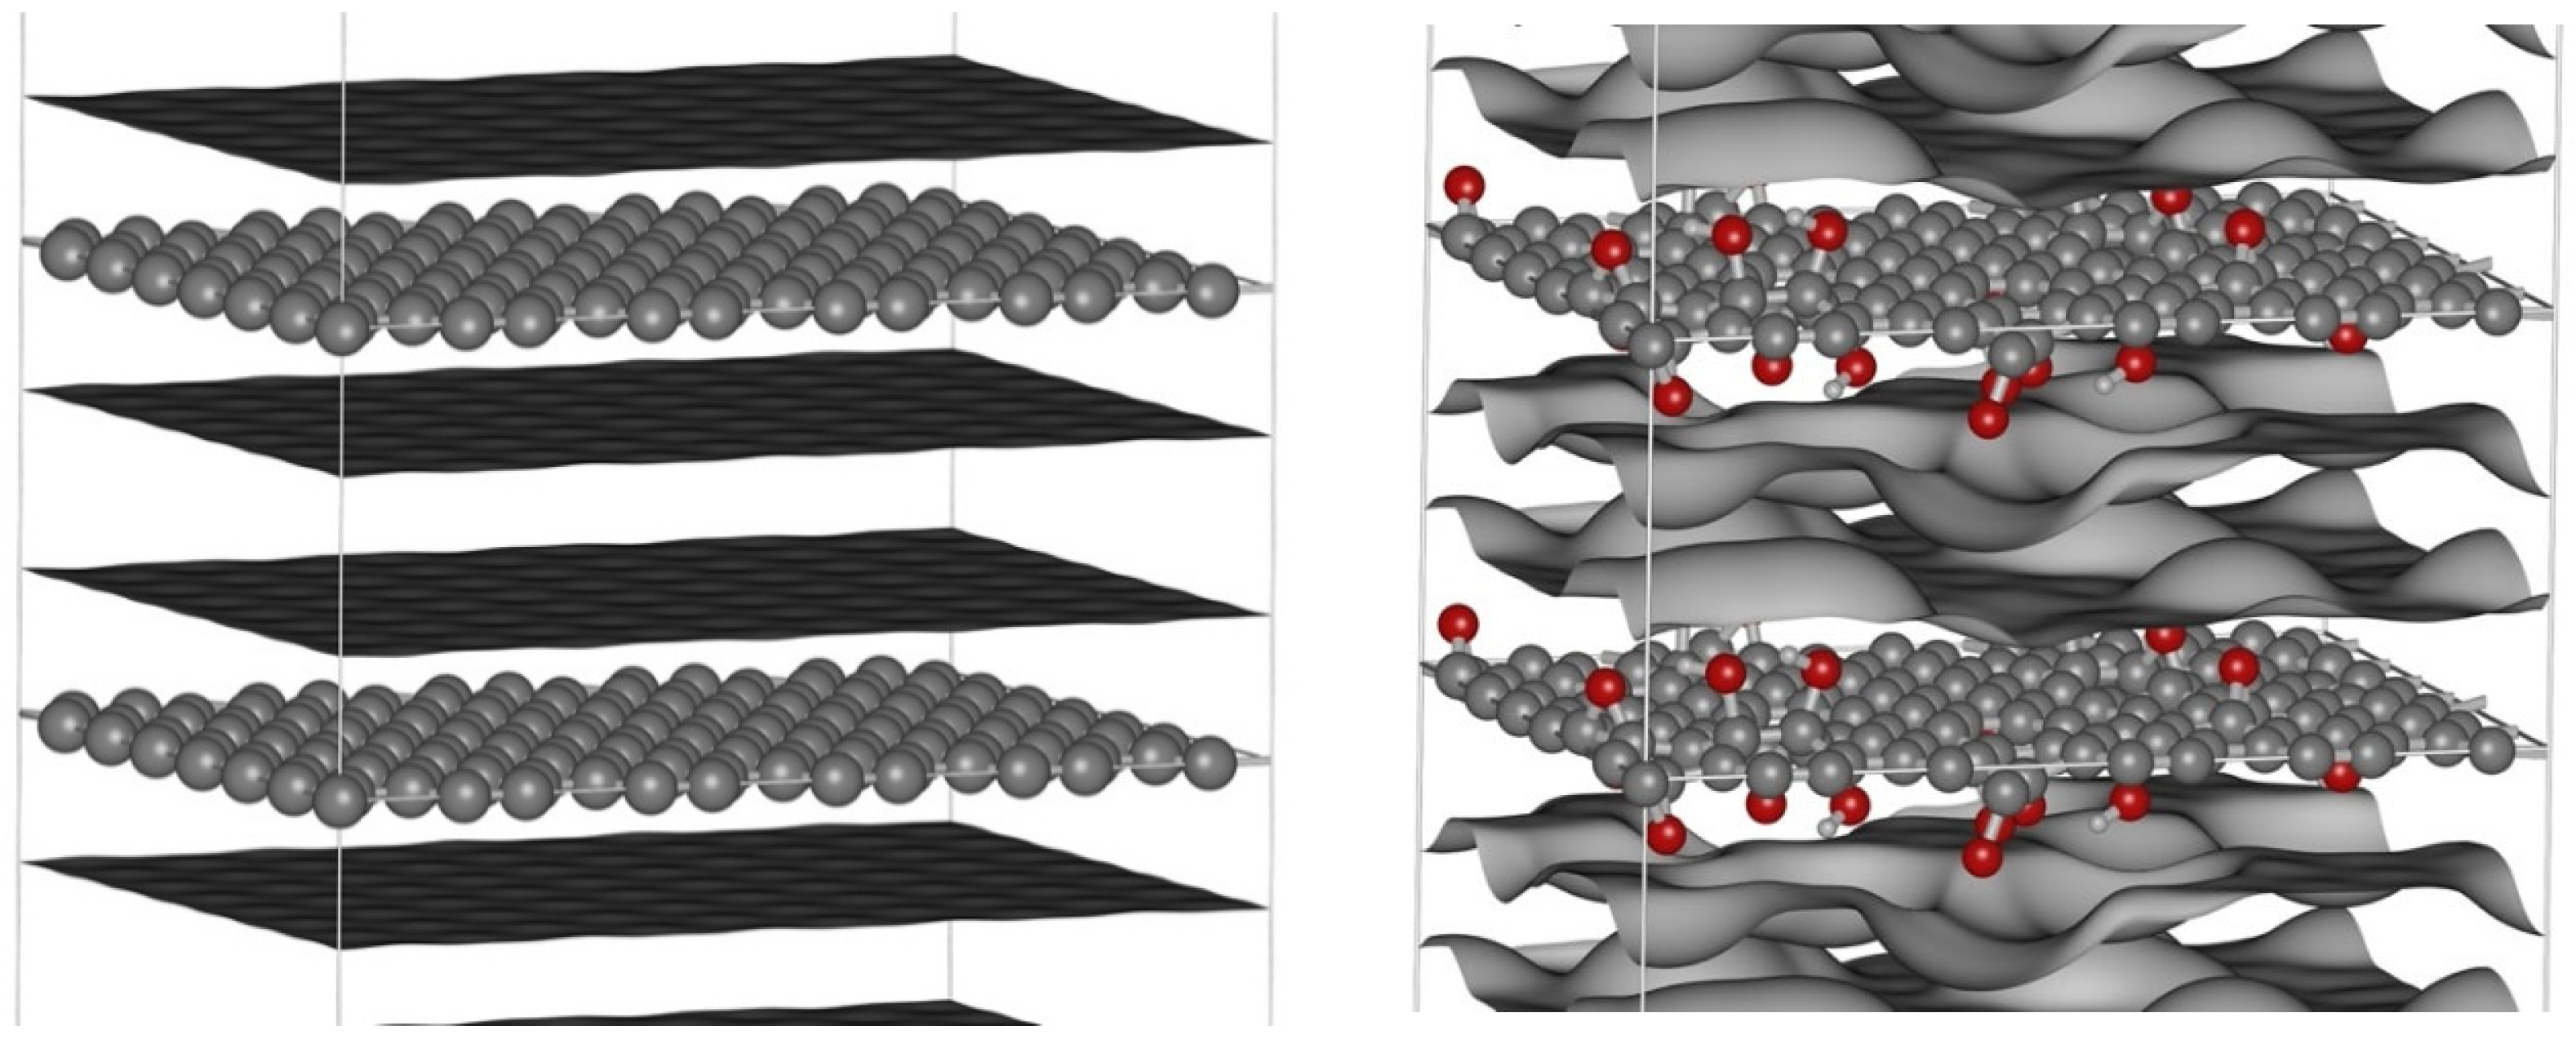
Figure 2.
SEM images of pristine and modified CMK-8 and CMK-9 carbon materials.
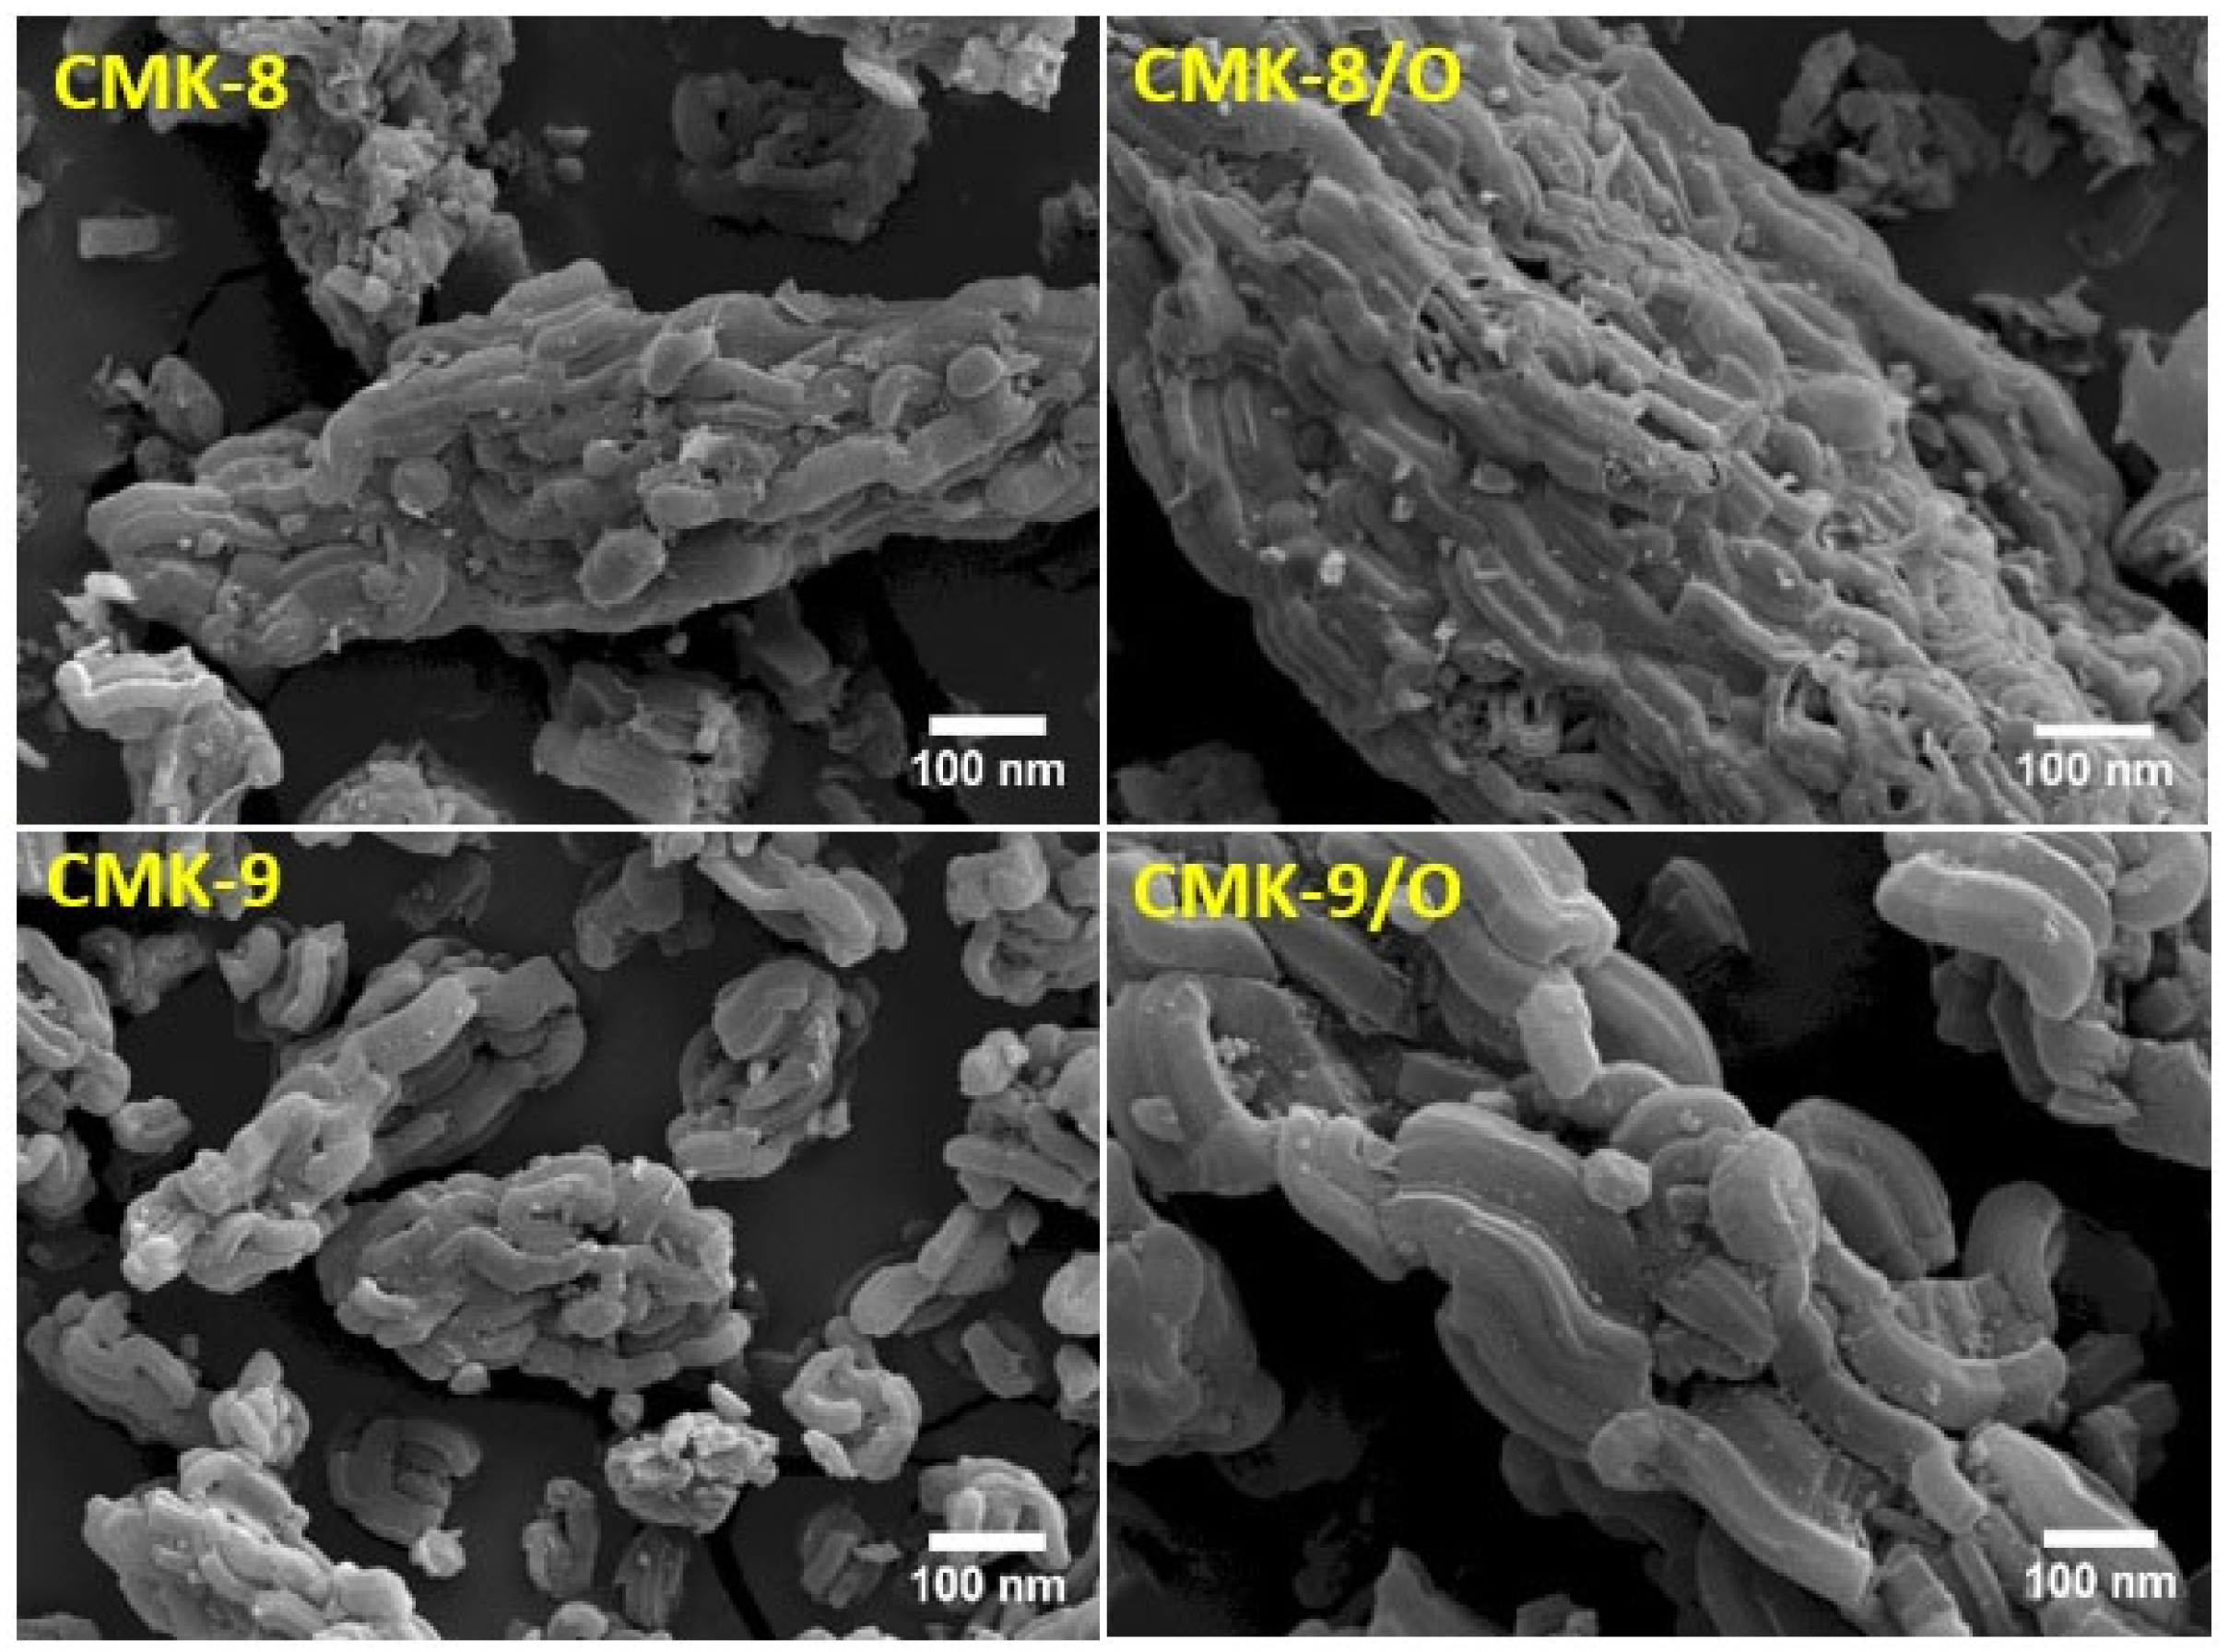
Figure 3.
Thermal analysis of carbon materials: (a) TG-DTG curves of CMK-8; (b) mass spectrometry (MS) signals (m/z = 18 and 44) evolved during TGA of CMK-8; (c) TG-DTG curves of oxidized CMK-8 (CMK-8/O); (d) MS signals (m/z = 18 and 44) evolved during TGA of CMK-8/O.
Figure 3.
Thermal analysis of carbon materials: (a) TG-DTG curves of CMK-8; (b) mass spectrometry (MS) signals (m/z = 18 and 44) evolved during TGA of CMK-8; (c) TG-DTG curves of oxidized CMK-8 (CMK-8/O); (d) MS signals (m/z = 18 and 44) evolved during TGA of CMK-8/O.
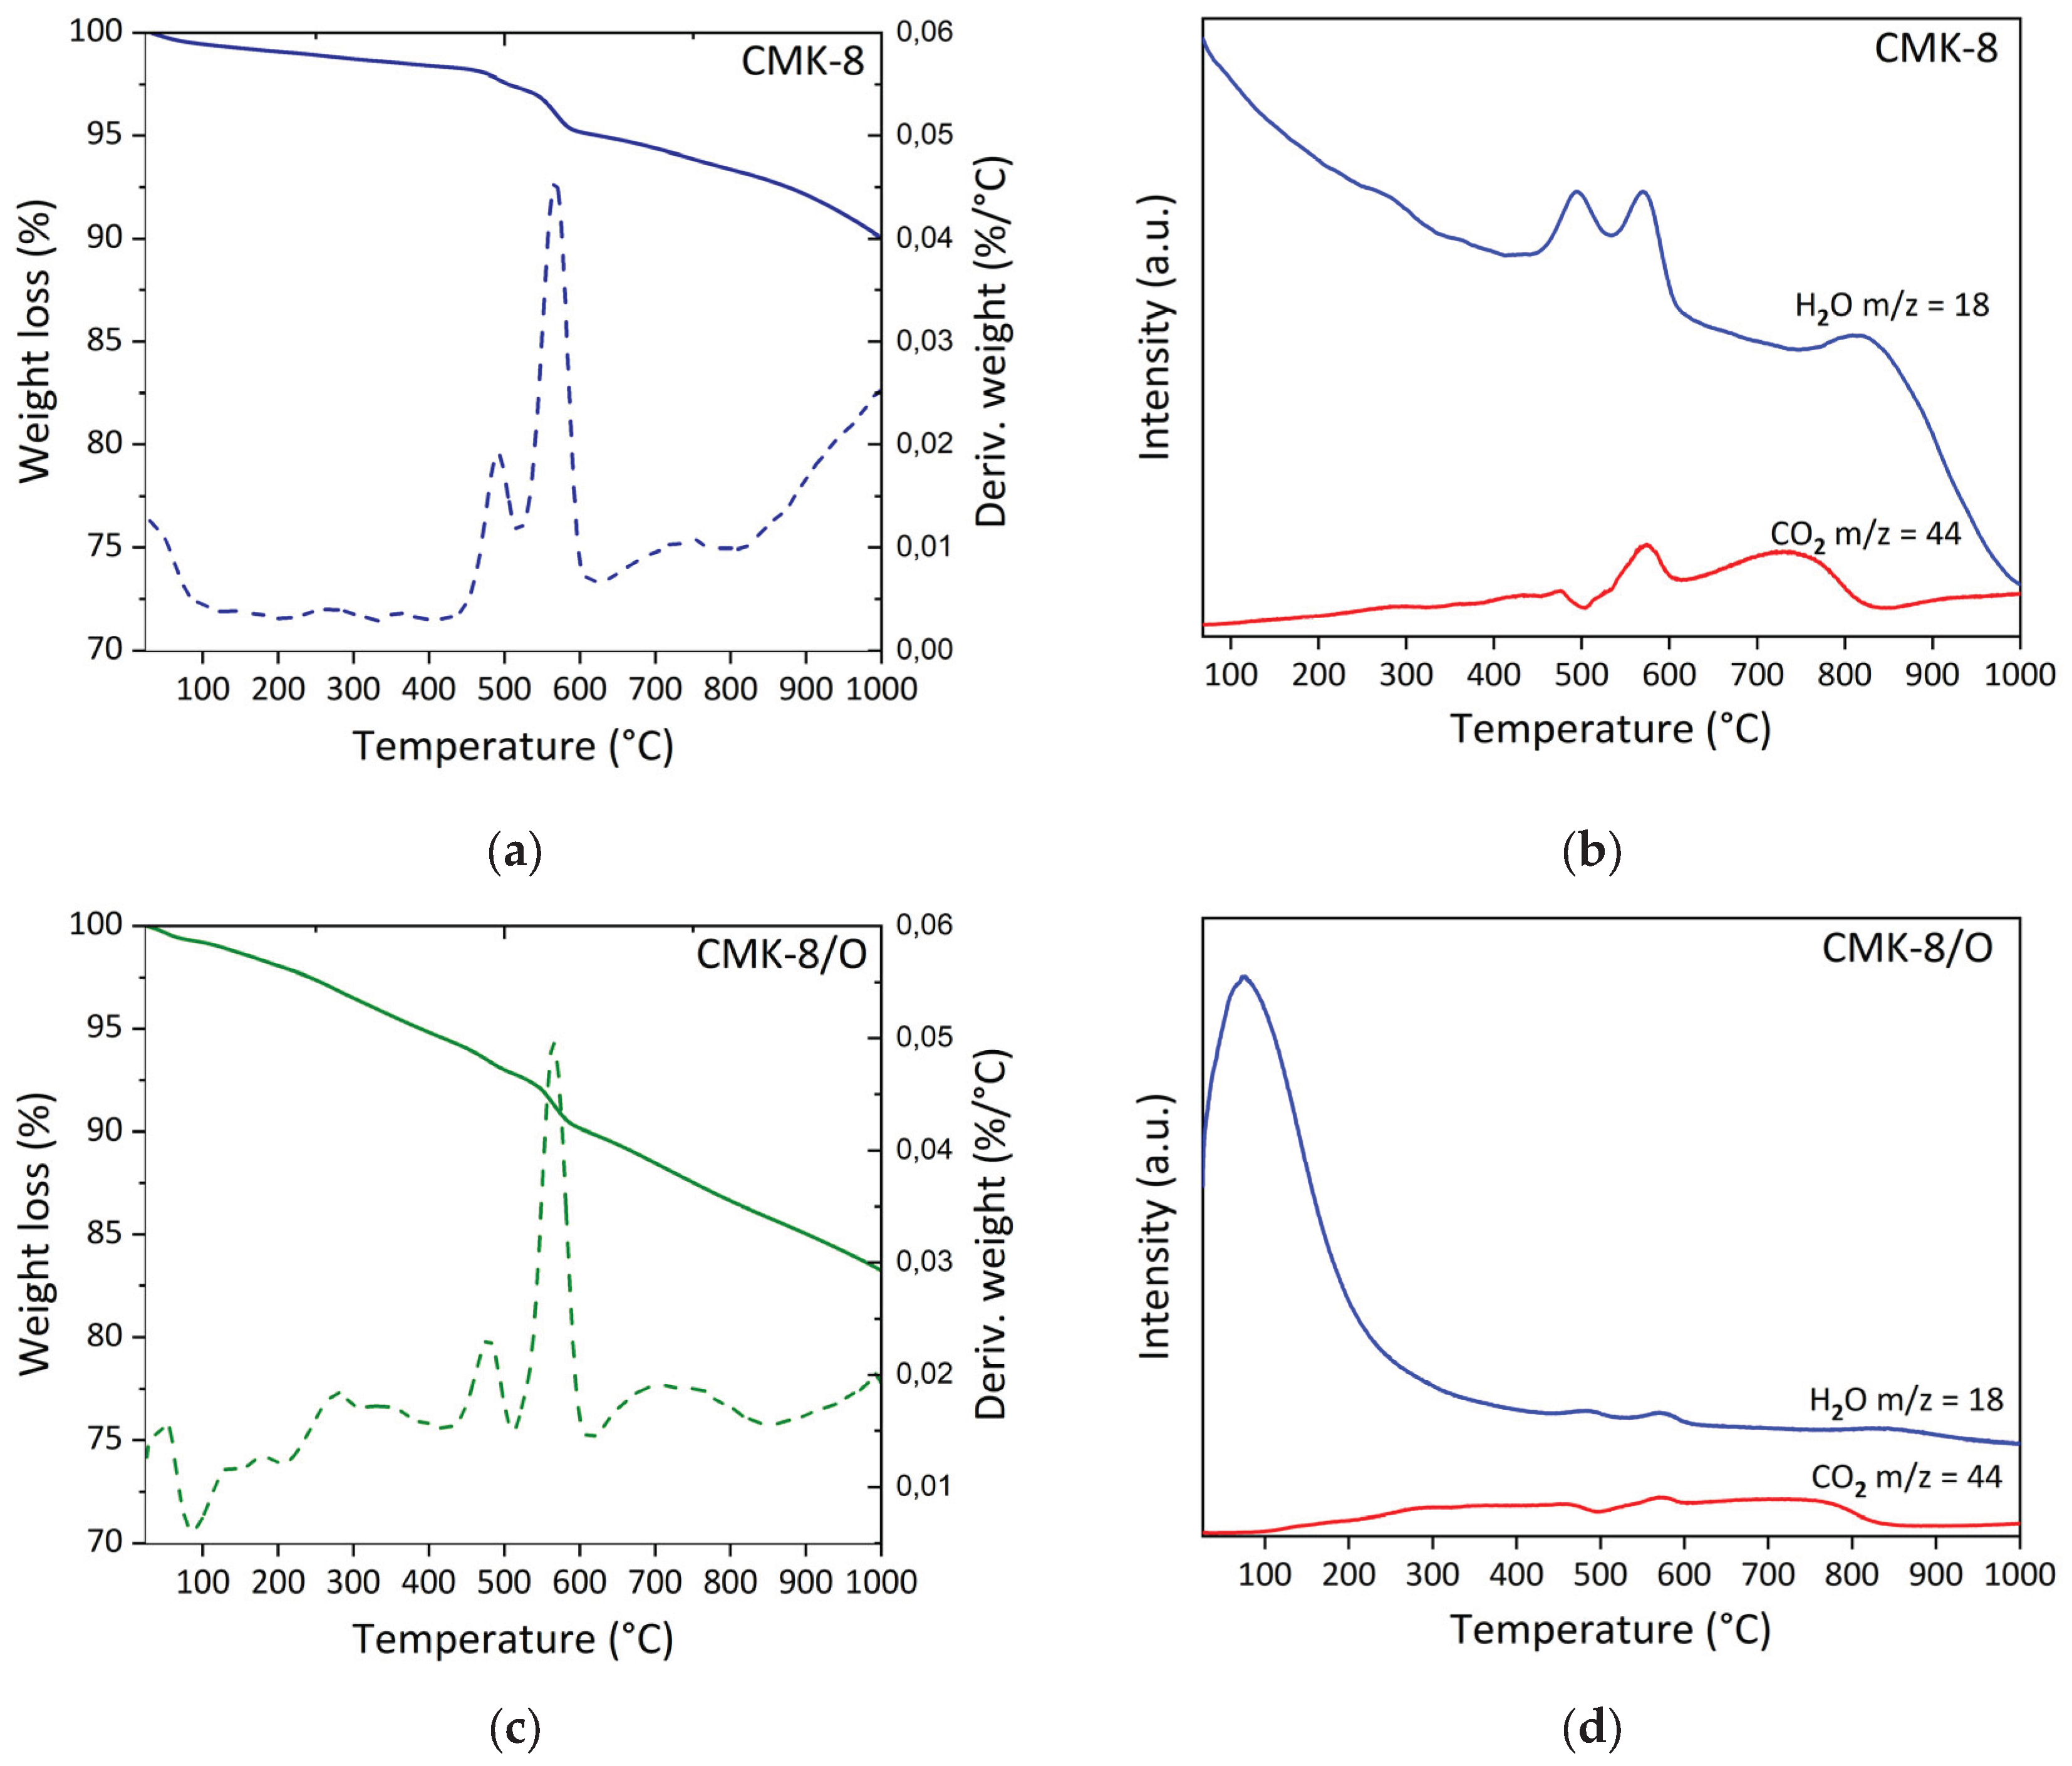
Figure 4.
Thermal analysis of carbon materials: (a) TG-DTG curves of CMK-9; (b) mass spectrometry (MS) signals (m/z = 18 and 44) evolved during TGA of CMK-9; (c) TG-DTG curves of oxidized CMK-9 (CMK-9/O); (d) MS signals (m/z = 18 and 44) evolved during TGA of CMK-9/O.
Figure 4.
Thermal analysis of carbon materials: (a) TG-DTG curves of CMK-9; (b) mass spectrometry (MS) signals (m/z = 18 and 44) evolved during TGA of CMK-9; (c) TG-DTG curves of oxidized CMK-9 (CMK-9/O); (d) MS signals (m/z = 18 and 44) evolved during TGA of CMK-9/O.
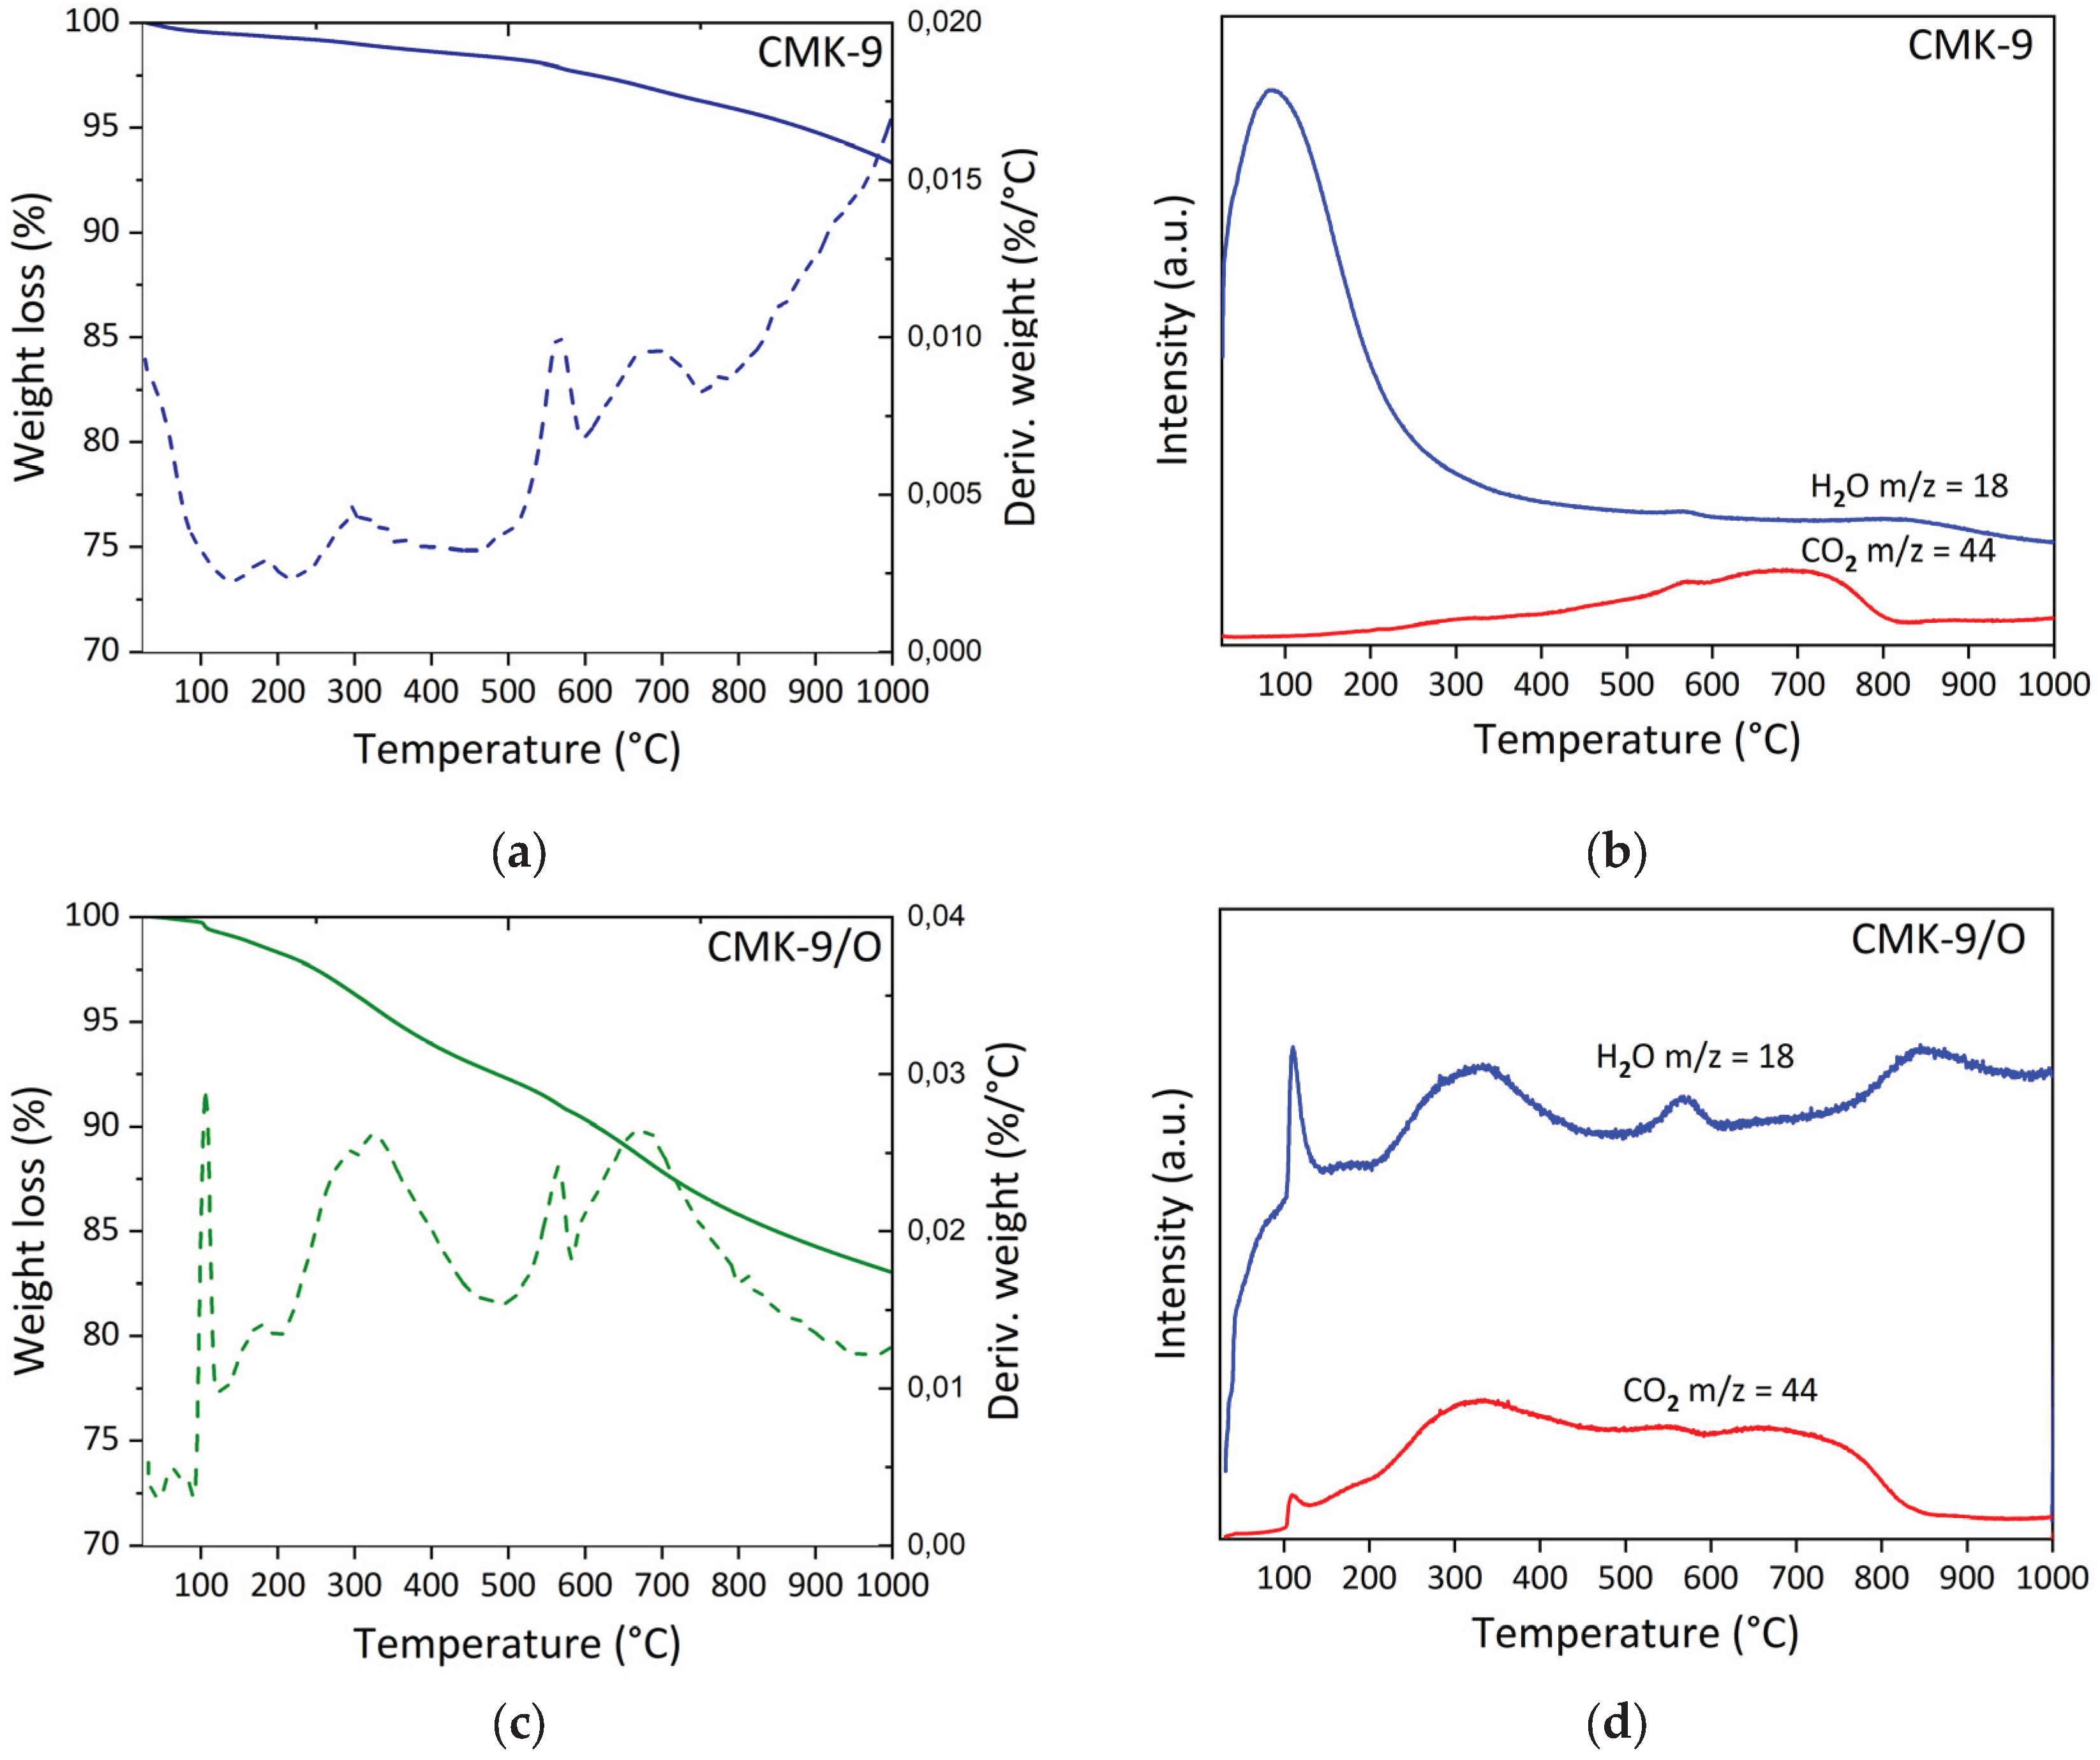
Figure 5.
High-resolution core-level XPS spectra of: (a) C 1s and (b) O 1s of CMK-8 and CMK-8/O; (c) C 1s and (d) O 1s of CMK-9 and CMK-9/O. CMK-8 and CMK-9 were previously reported [11].
Figure 5.
High-resolution core-level XPS spectra of: (a) C 1s and (b) O 1s of CMK-8 and CMK-8/O; (c) C 1s and (d) O 1s of CMK-9 and CMK-9/O. CMK-8 and CMK-9 were previously reported [11].
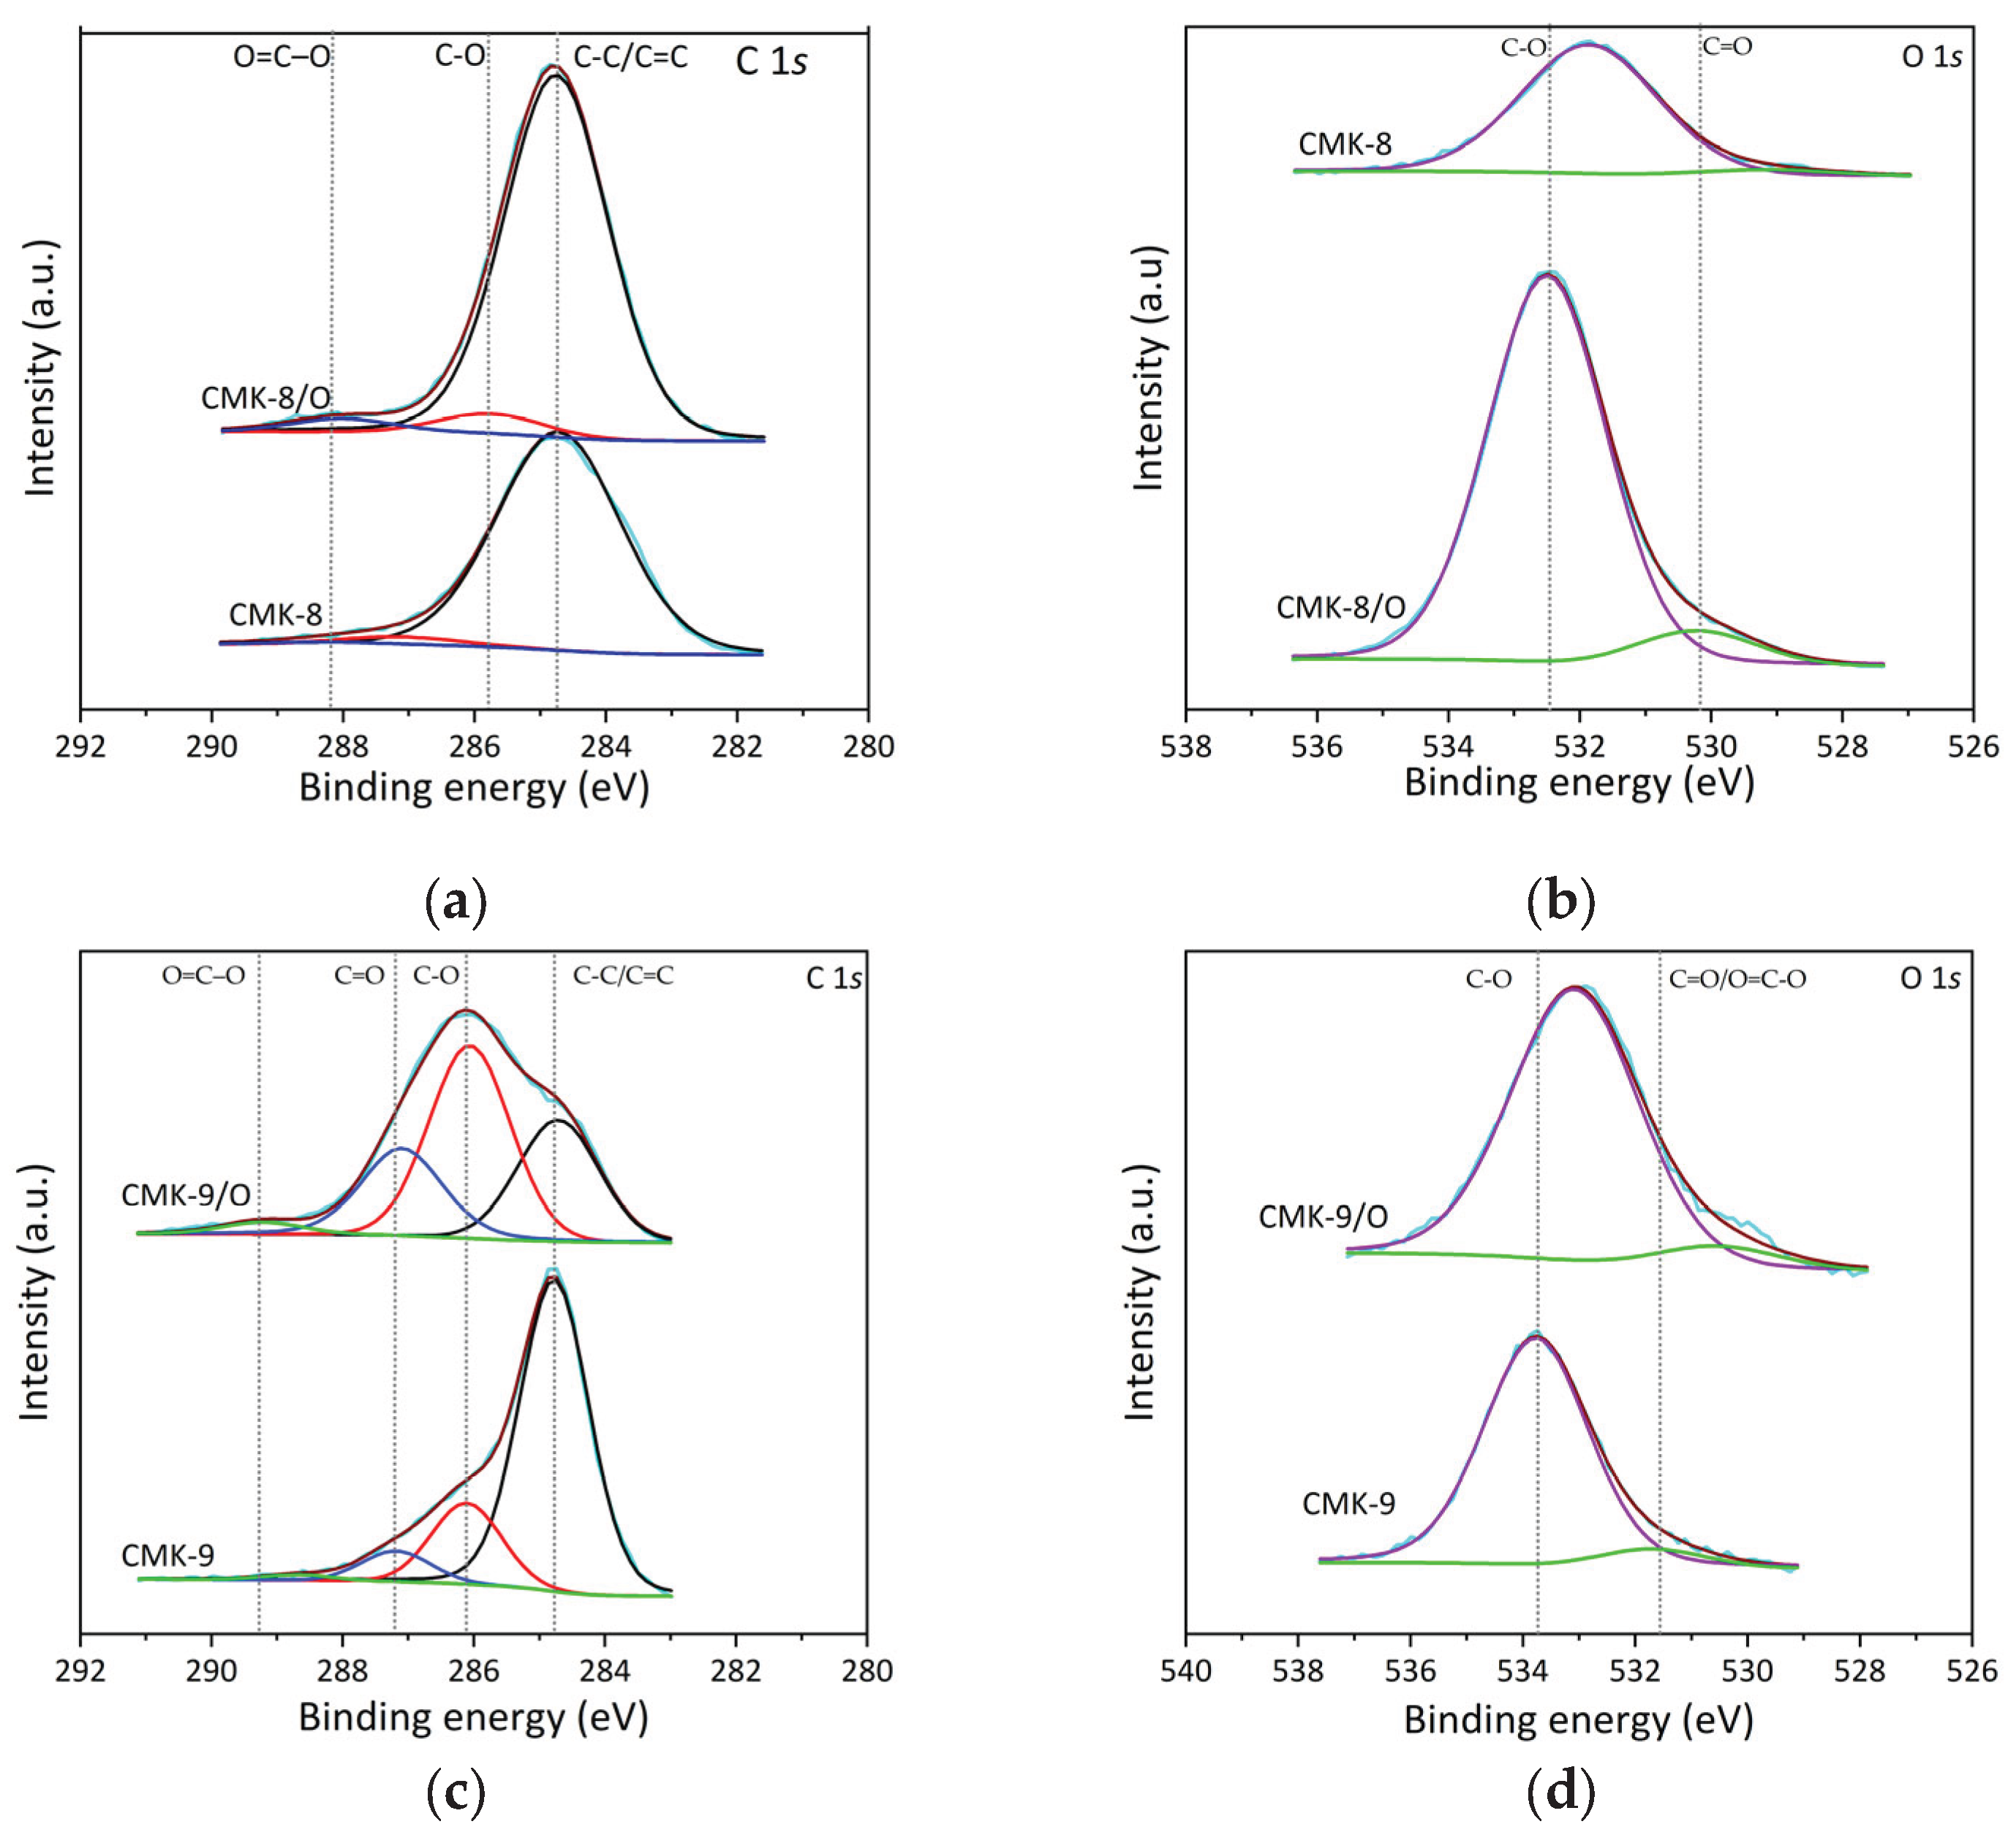
Figure 6.
Ar adsorption-desorption isotherms at 87 K for CMK-8, CMK-9, and the corresponding oxygen-functionalized materials.
Figure 6.
Ar adsorption-desorption isotherms at 87 K for CMK-8, CMK-9, and the corresponding oxygen-functionalized materials.
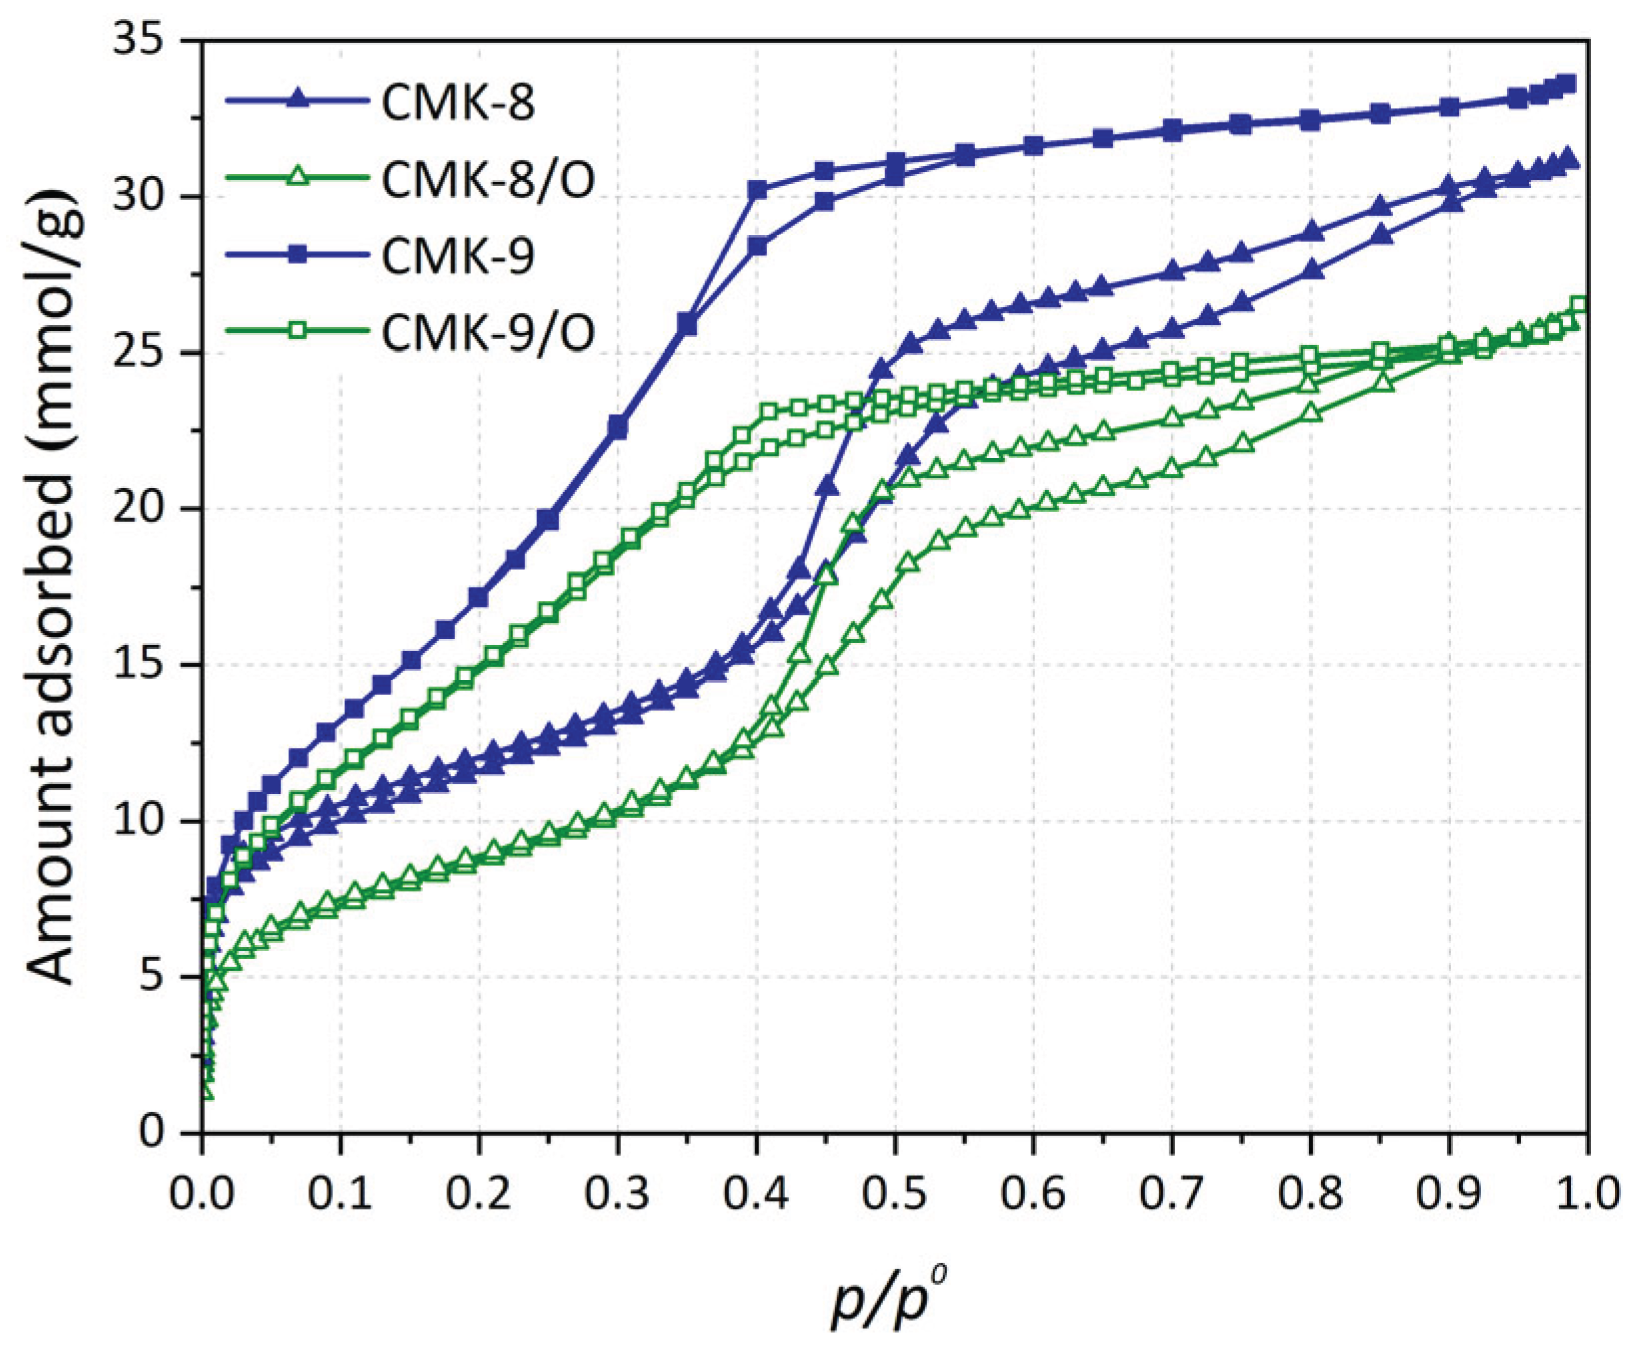
Figure 7.
Pore size distributions of the four CMK samples calculated from (a) full pore size range from Ar adsorption–desorption isotherms at 87 K and (b) microporous region from CO2 adsorption isotherms at 273 K.
Figure 7.
Pore size distributions of the four CMK samples calculated from (a) full pore size range from Ar adsorption–desorption isotherms at 87 K and (b) microporous region from CO2 adsorption isotherms at 273 K.
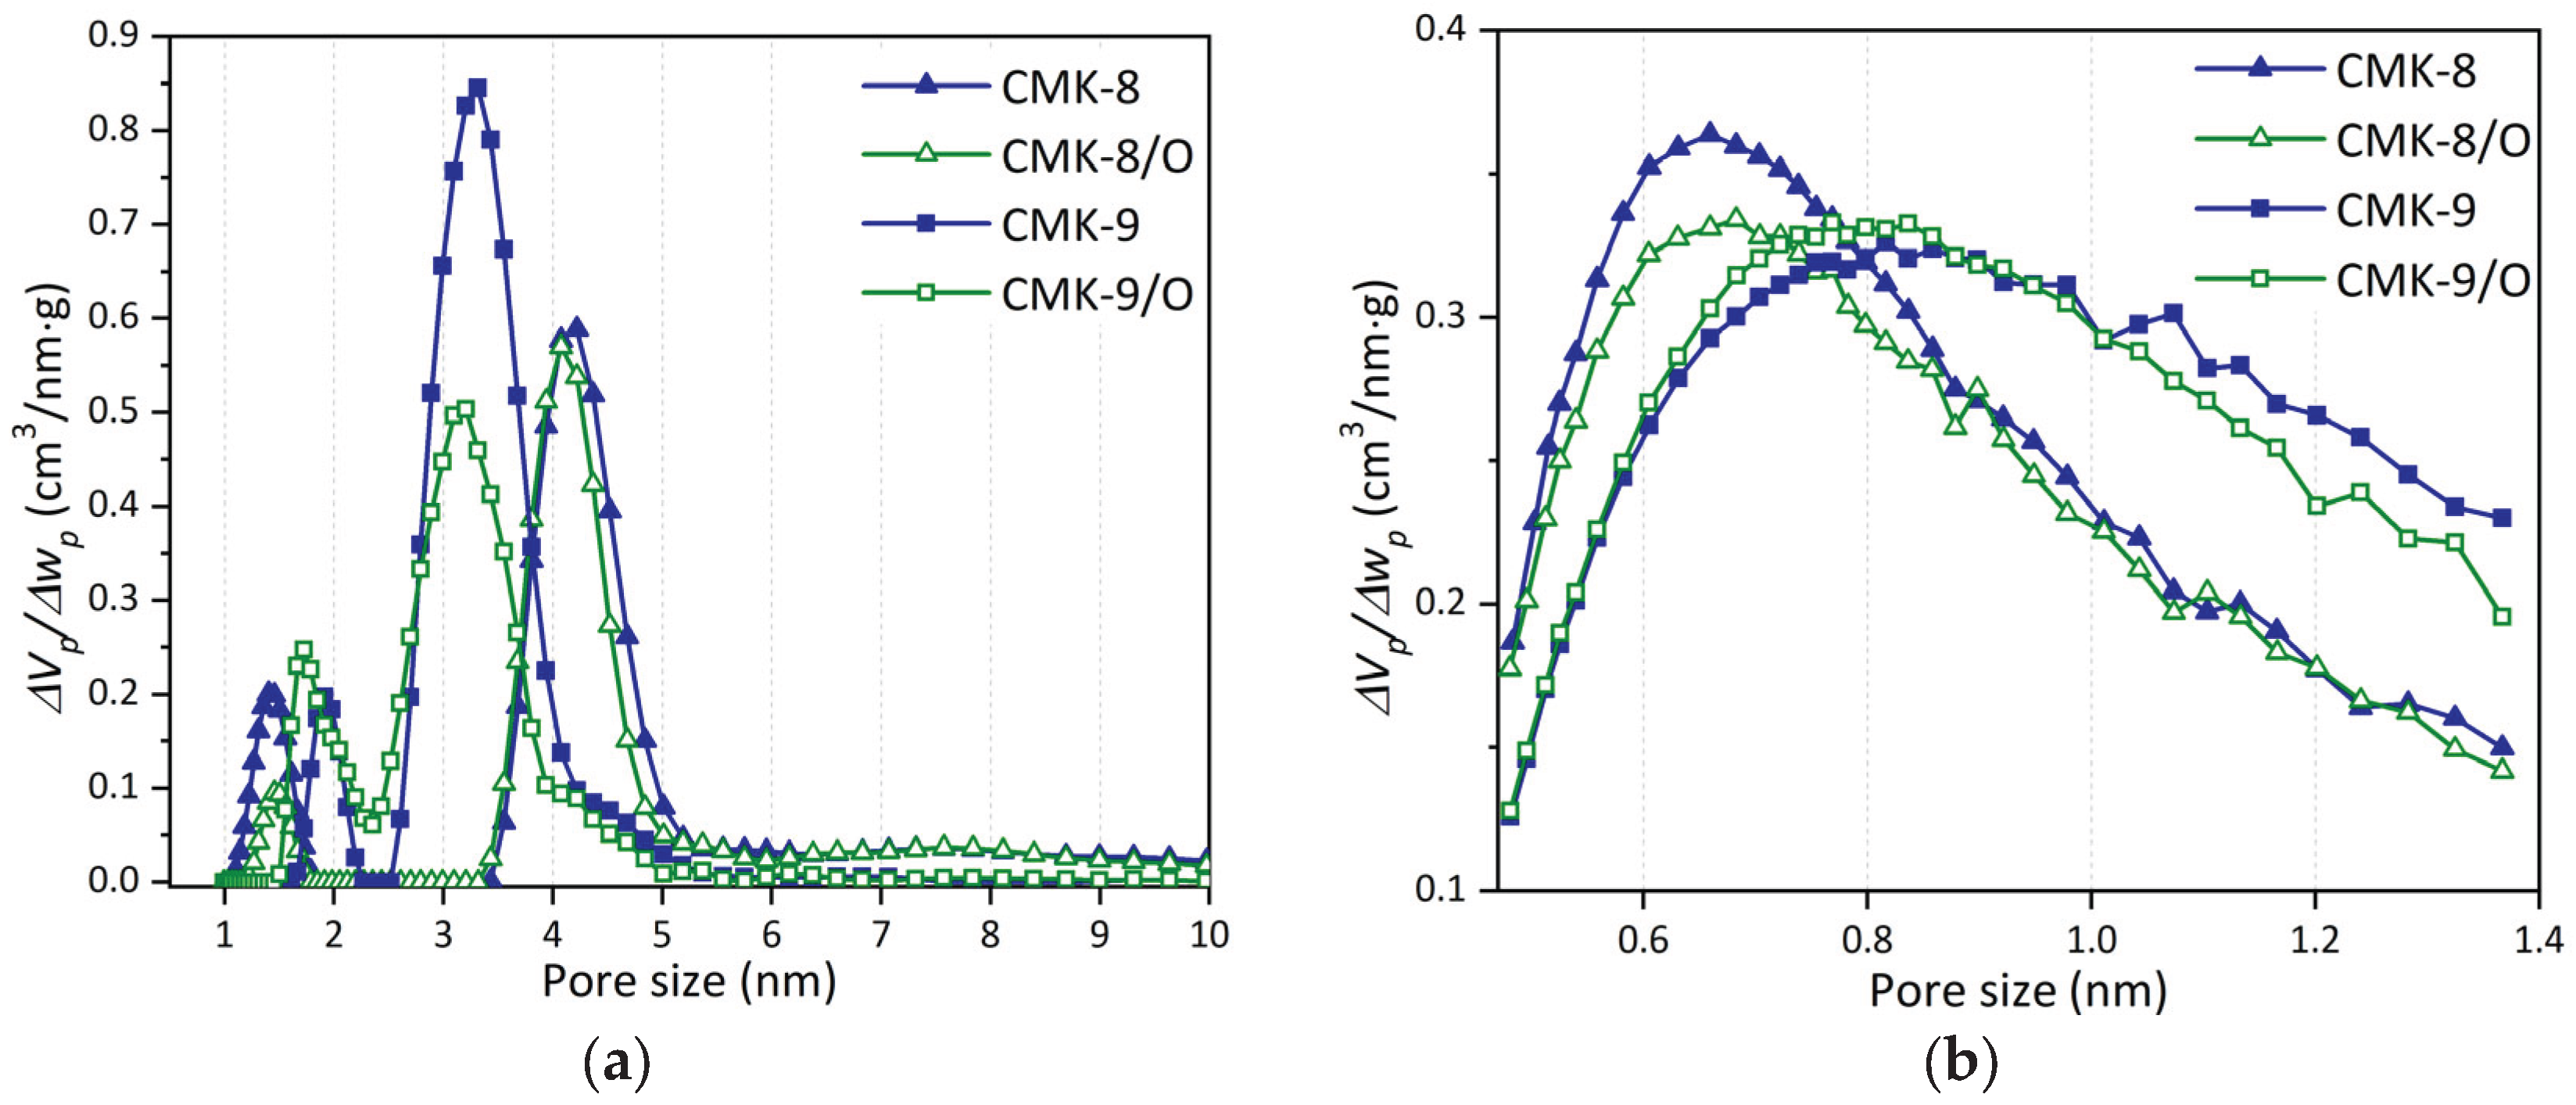
Figure 8.
H2O sorption-desorption isotherms at 298 K: (a) CMK-8 and its functionalized derivatives; (b) CMK-9 and its functionalized derivatives; (c) Low loading region (p/p0 < 0.4) of H2O sorption-desorption isotherms at 298 K.
Figure 8.
H2O sorption-desorption isotherms at 298 K: (a) CMK-8 and its functionalized derivatives; (b) CMK-9 and its functionalized derivatives; (c) Low loading region (p/p0 < 0.4) of H2O sorption-desorption isotherms at 298 K.
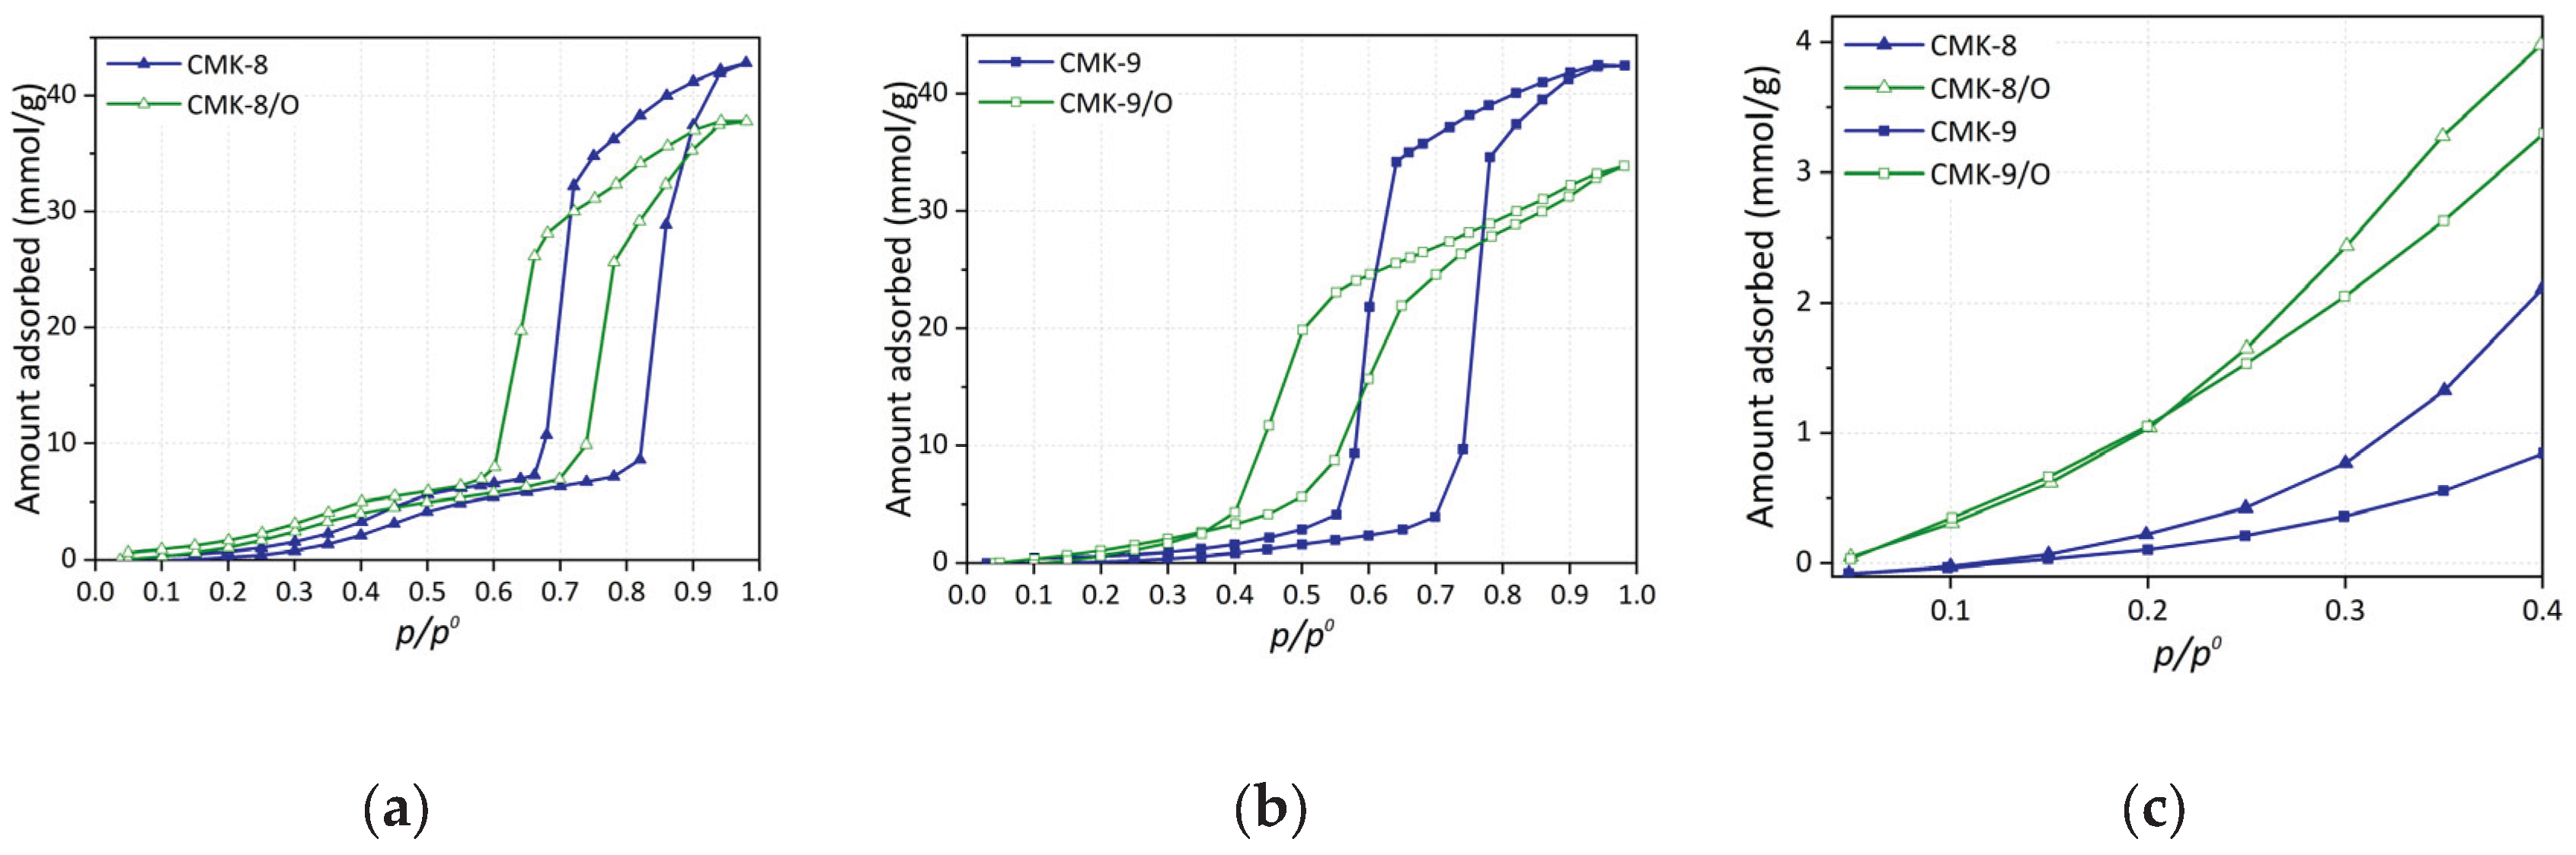
Figure 9.
(a) Adsorption isotherms for all CMK-type carbon materials: (a) CO2 at 308 K up to 10 bar, (b) CH4 at 298 K up to 10 bar, and (c) H2 at 77 K up to 8 bar.
Figure 9.
(a) Adsorption isotherms for all CMK-type carbon materials: (a) CO2 at 308 K up to 10 bar, (b) CH4 at 298 K up to 10 bar, and (c) H2 at 77 K up to 8 bar.
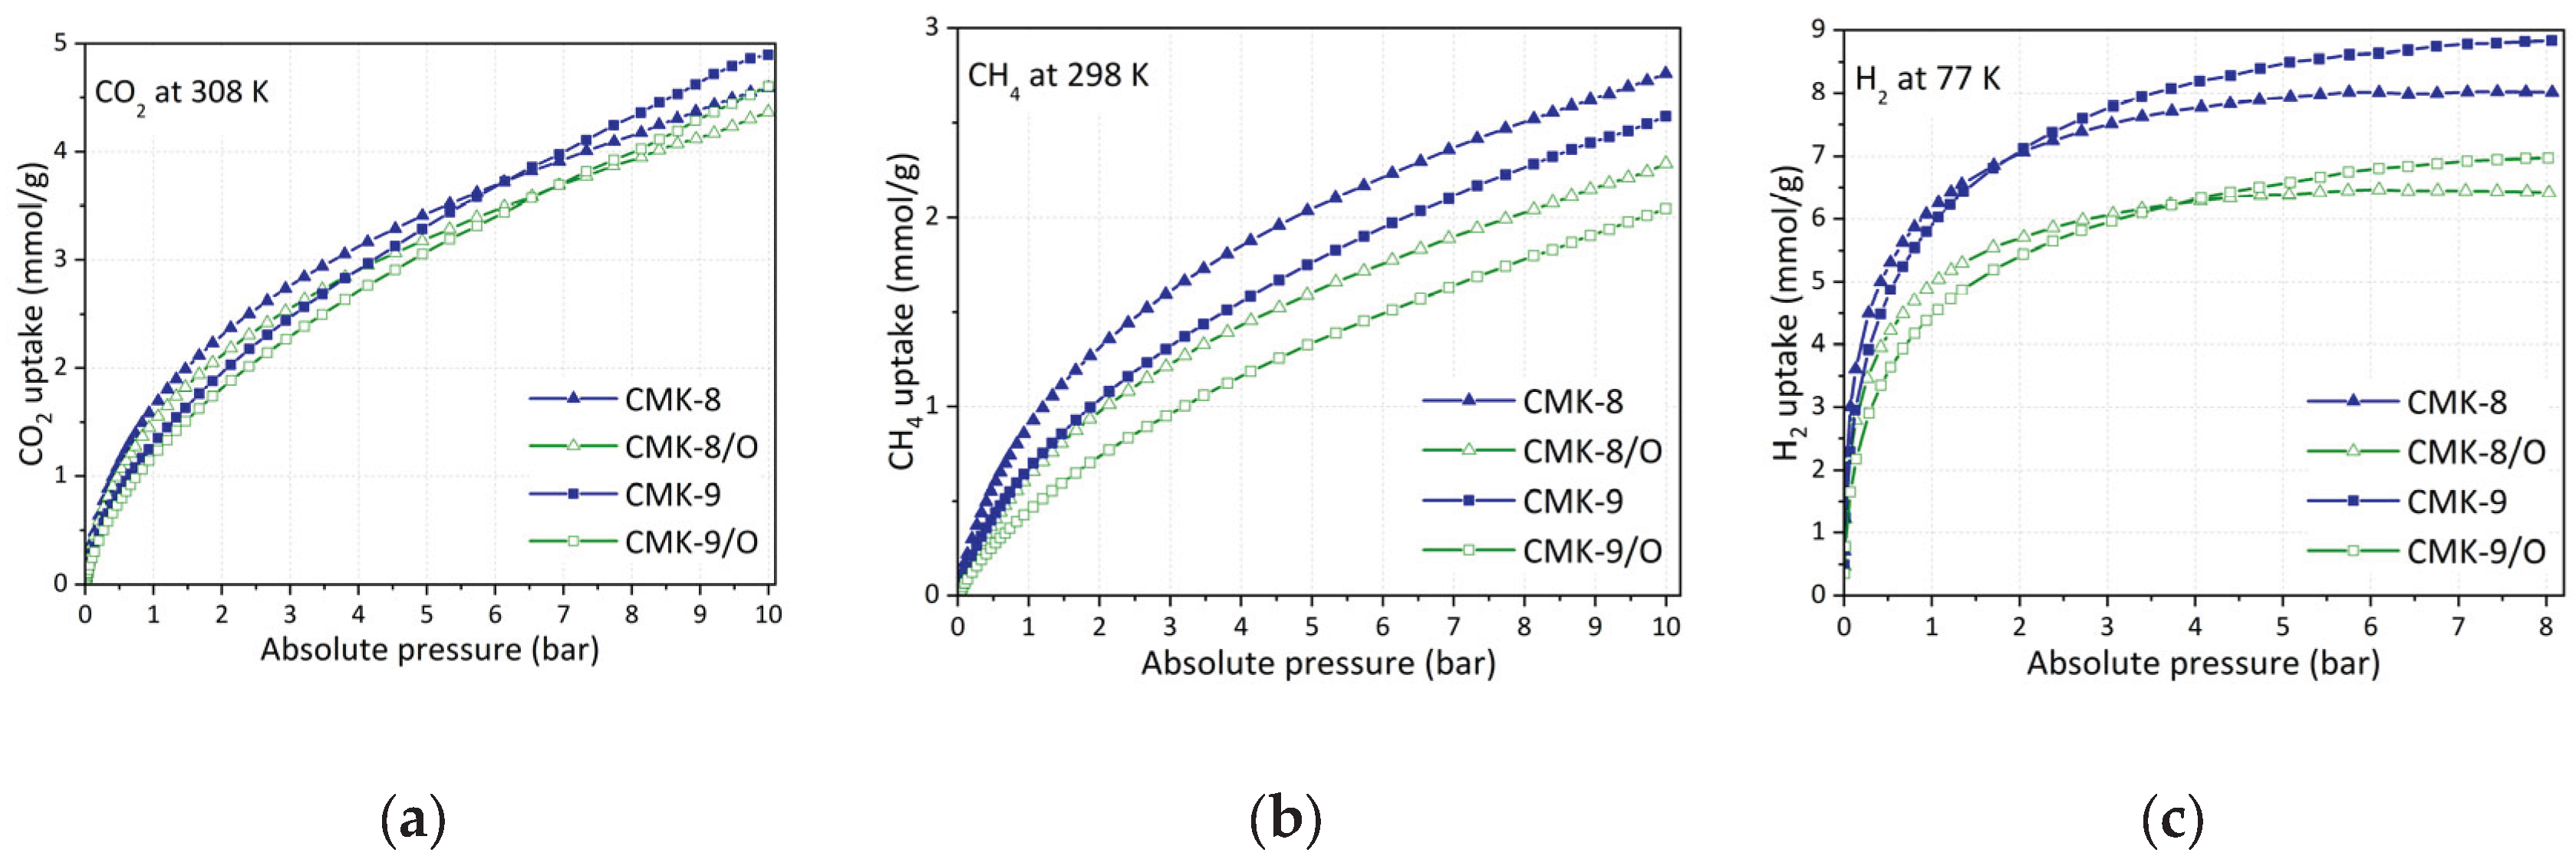
Figure 10.
Experimental isosteric heat of adsorption as a function of loading for (a) CO2, (b) CH4, and (c) H2 on all CMK-type carbon materials.
Figure 10.
Experimental isosteric heat of adsorption as a function of loading for (a) CO2, (b) CH4, and (c) H2 on all CMK-type carbon materials.
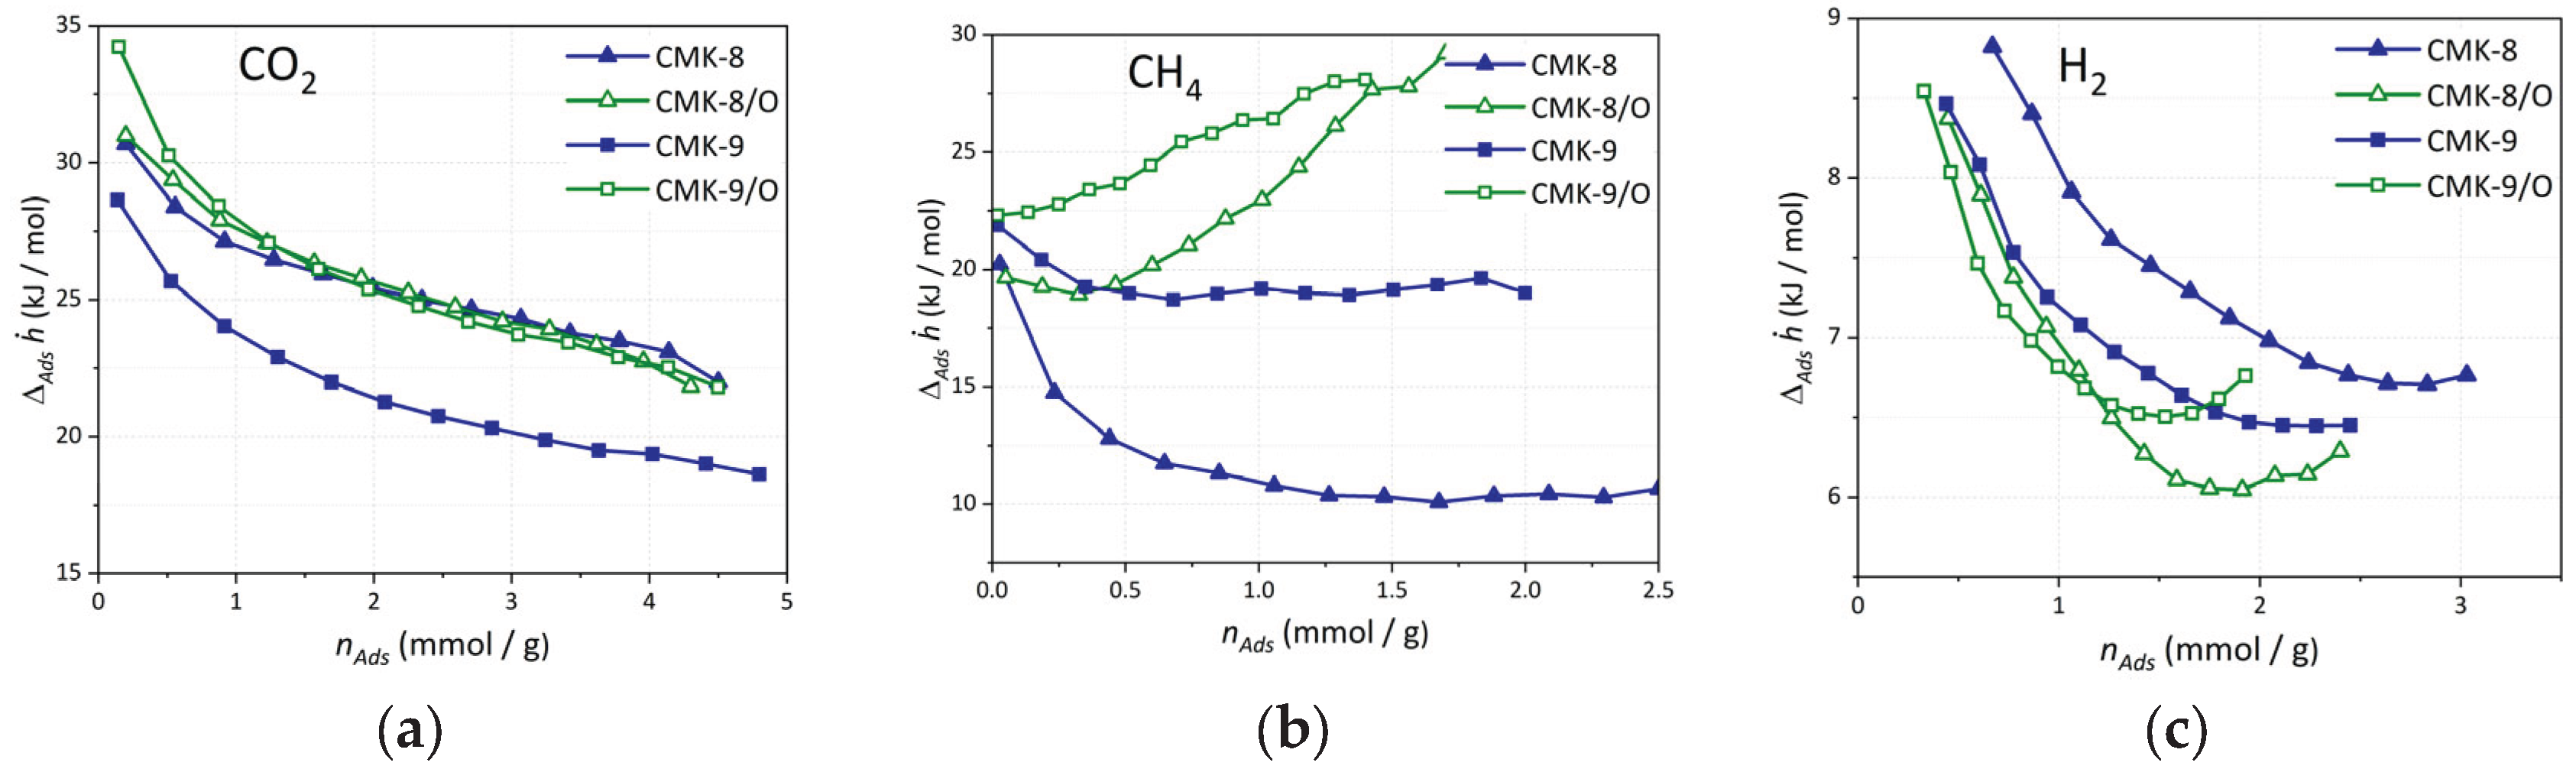
Figure 11.
Adsorption isotherms for CO2 (top), CH4 (center), H2, and (bottom) in GP-H and GOx-H for H = 8, 10, 12, 15, 20, and 30 Å.
Figure 11.
Adsorption isotherms for CO2 (top), CH4 (center), H2, and (bottom) in GP-H and GOx-H for H = 8, 10, 12, 15, 20, and 30 Å.
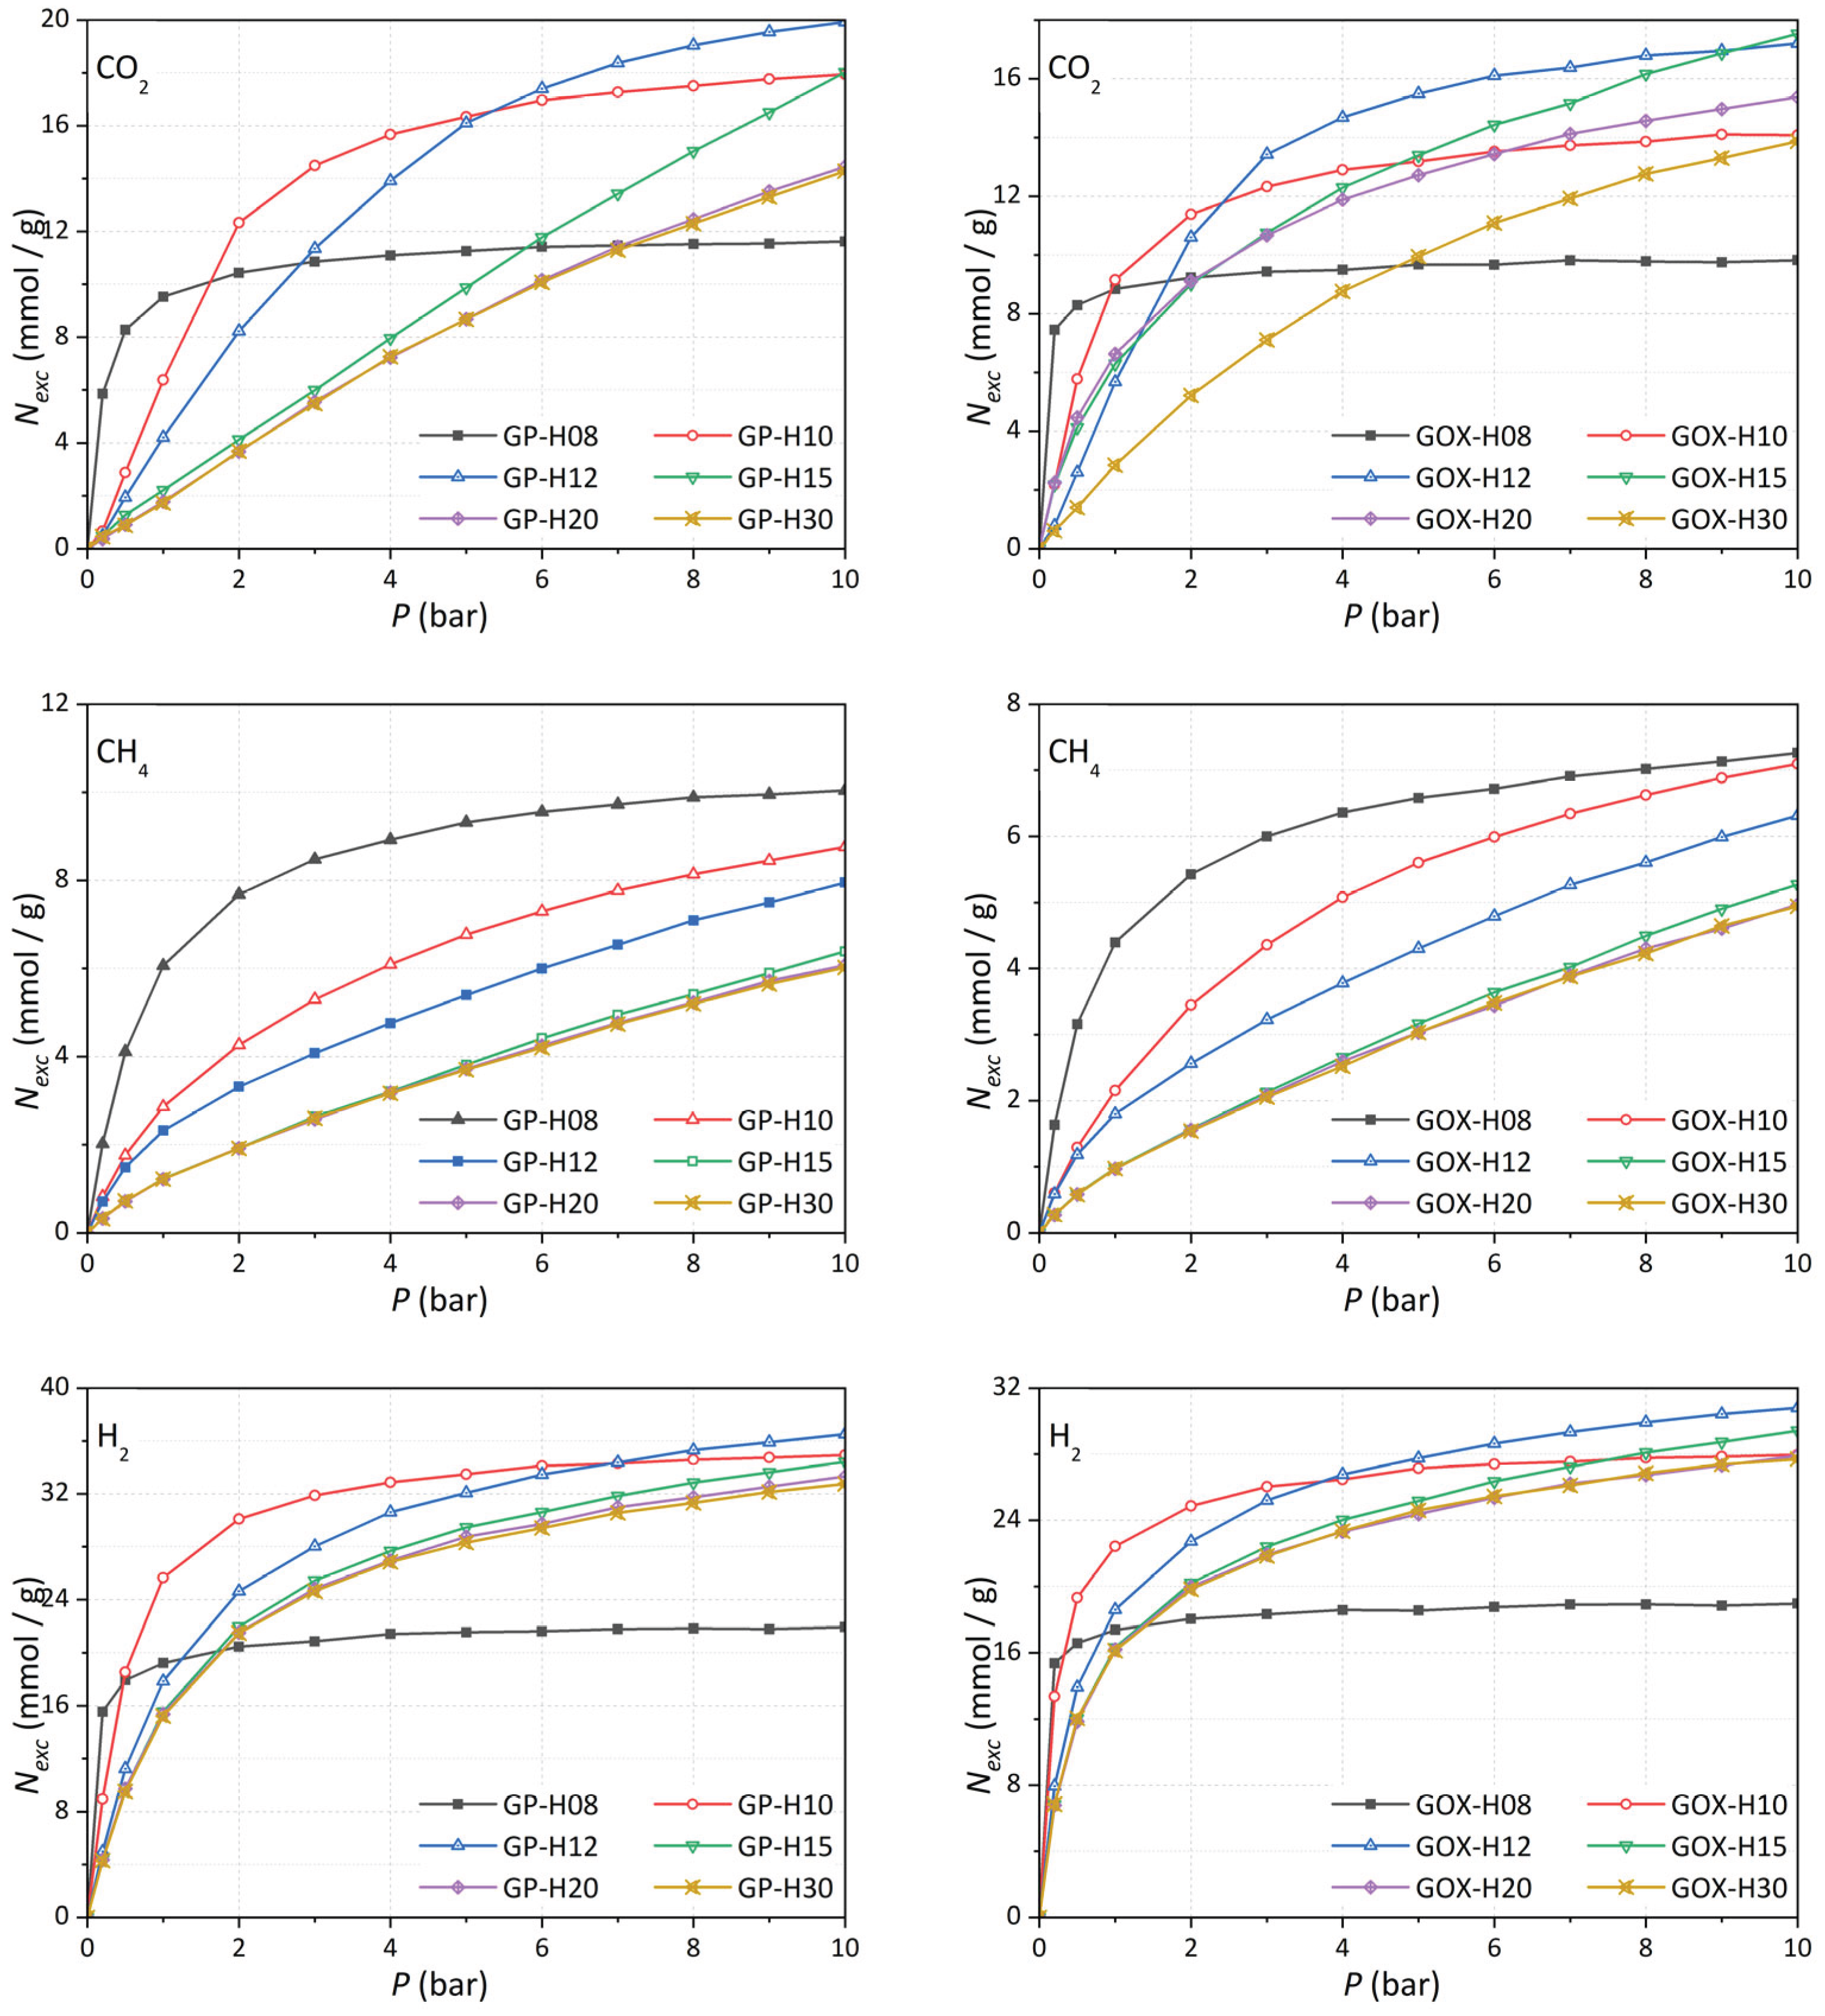
Figure 12.
Comparison of CH4 (left), CO2 (center), and H2 (right) adsorption in GP (pristine) and GOx (oxidized) pores of 8 Å, 12 Å, and 30 Å widths. Figure S5-S7 shows comparisons for additional pore widths.
Figure 12.
Comparison of CH4 (left), CO2 (center), and H2 (right) adsorption in GP (pristine) and GOx (oxidized) pores of 8 Å, 12 Å, and 30 Å widths. Figure S5-S7 shows comparisons for additional pore widths.
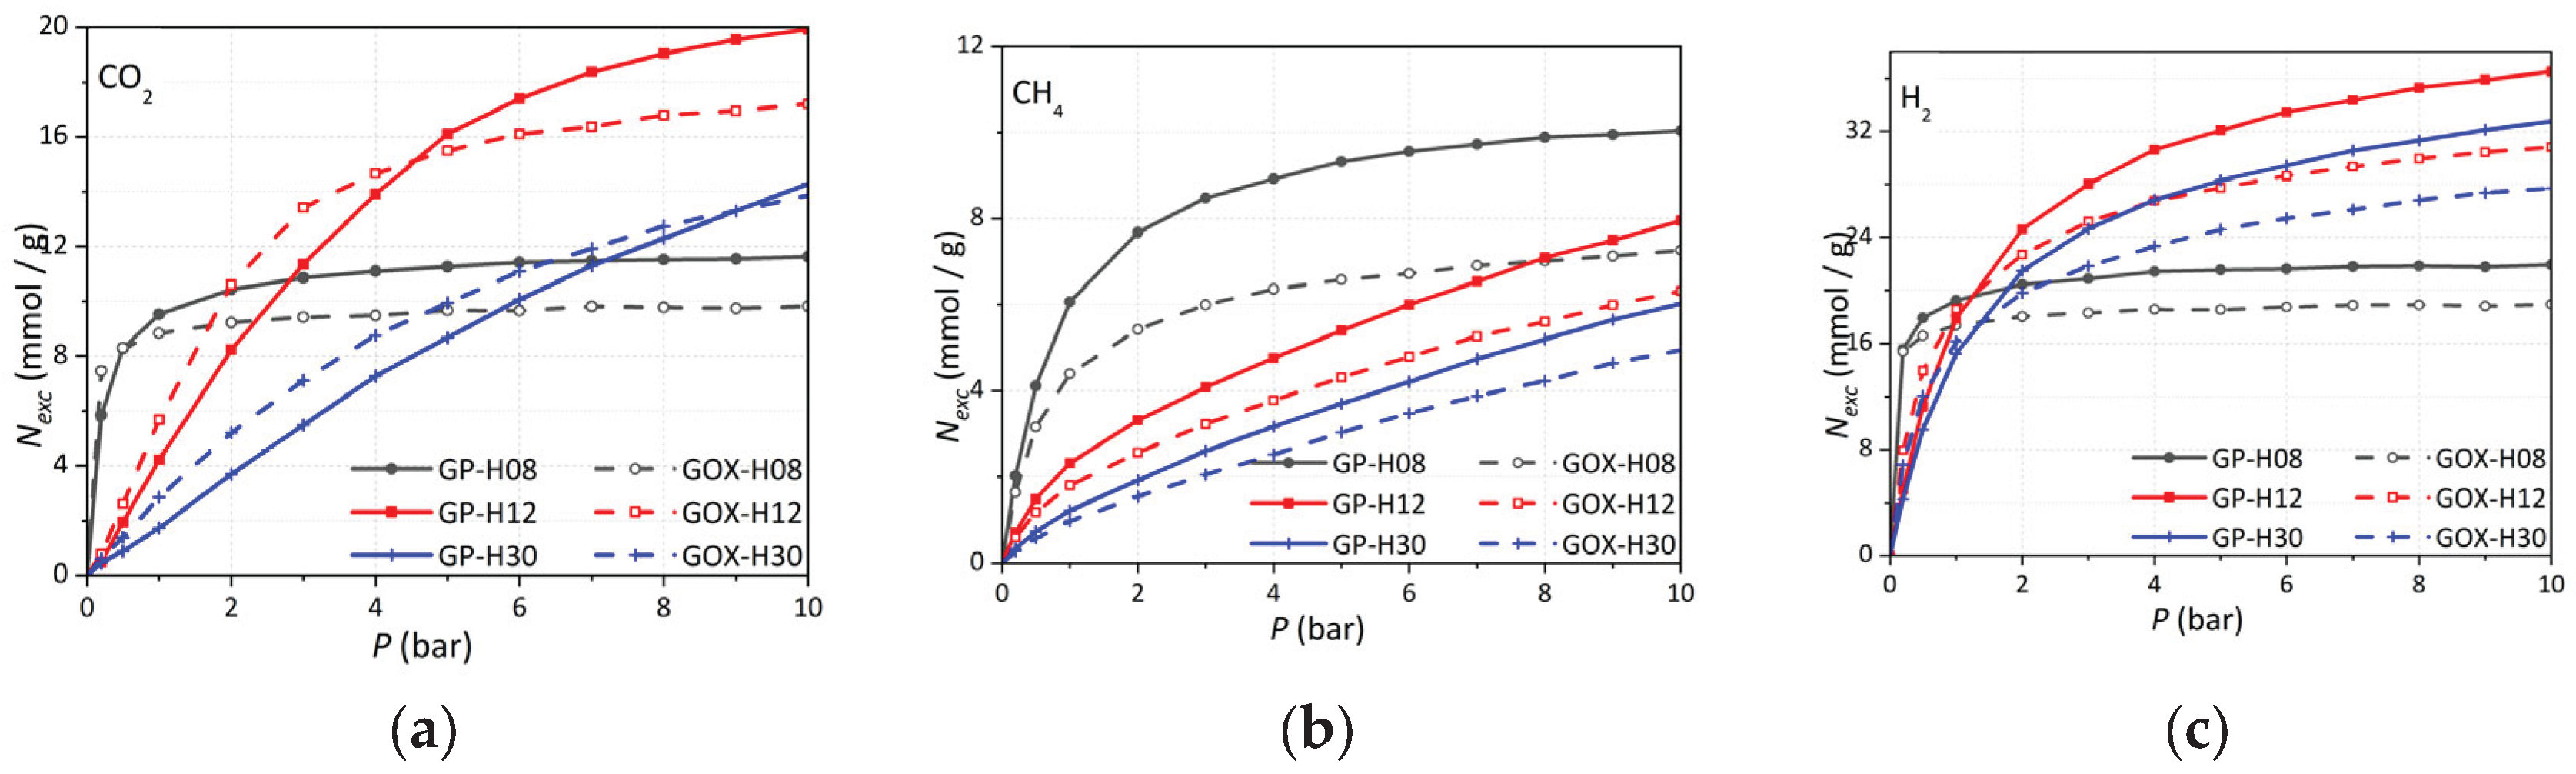
Figure 13.
Synthetic (Eq. 6) vs. experimental excess adsorption isotherms for CMK materials. Left panels: CMK-8 and CMK-8/O. Right panels: CMK-9 and CMK-9/O. CO2 (top), CH4 (middle), H2 (bottom).
Figure 13.
Synthetic (Eq. 6) vs. experimental excess adsorption isotherms for CMK materials. Left panels: CMK-8 and CMK-8/O. Right panels: CMK-9 and CMK-9/O. CO2 (top), CH4 (middle), H2 (bottom).
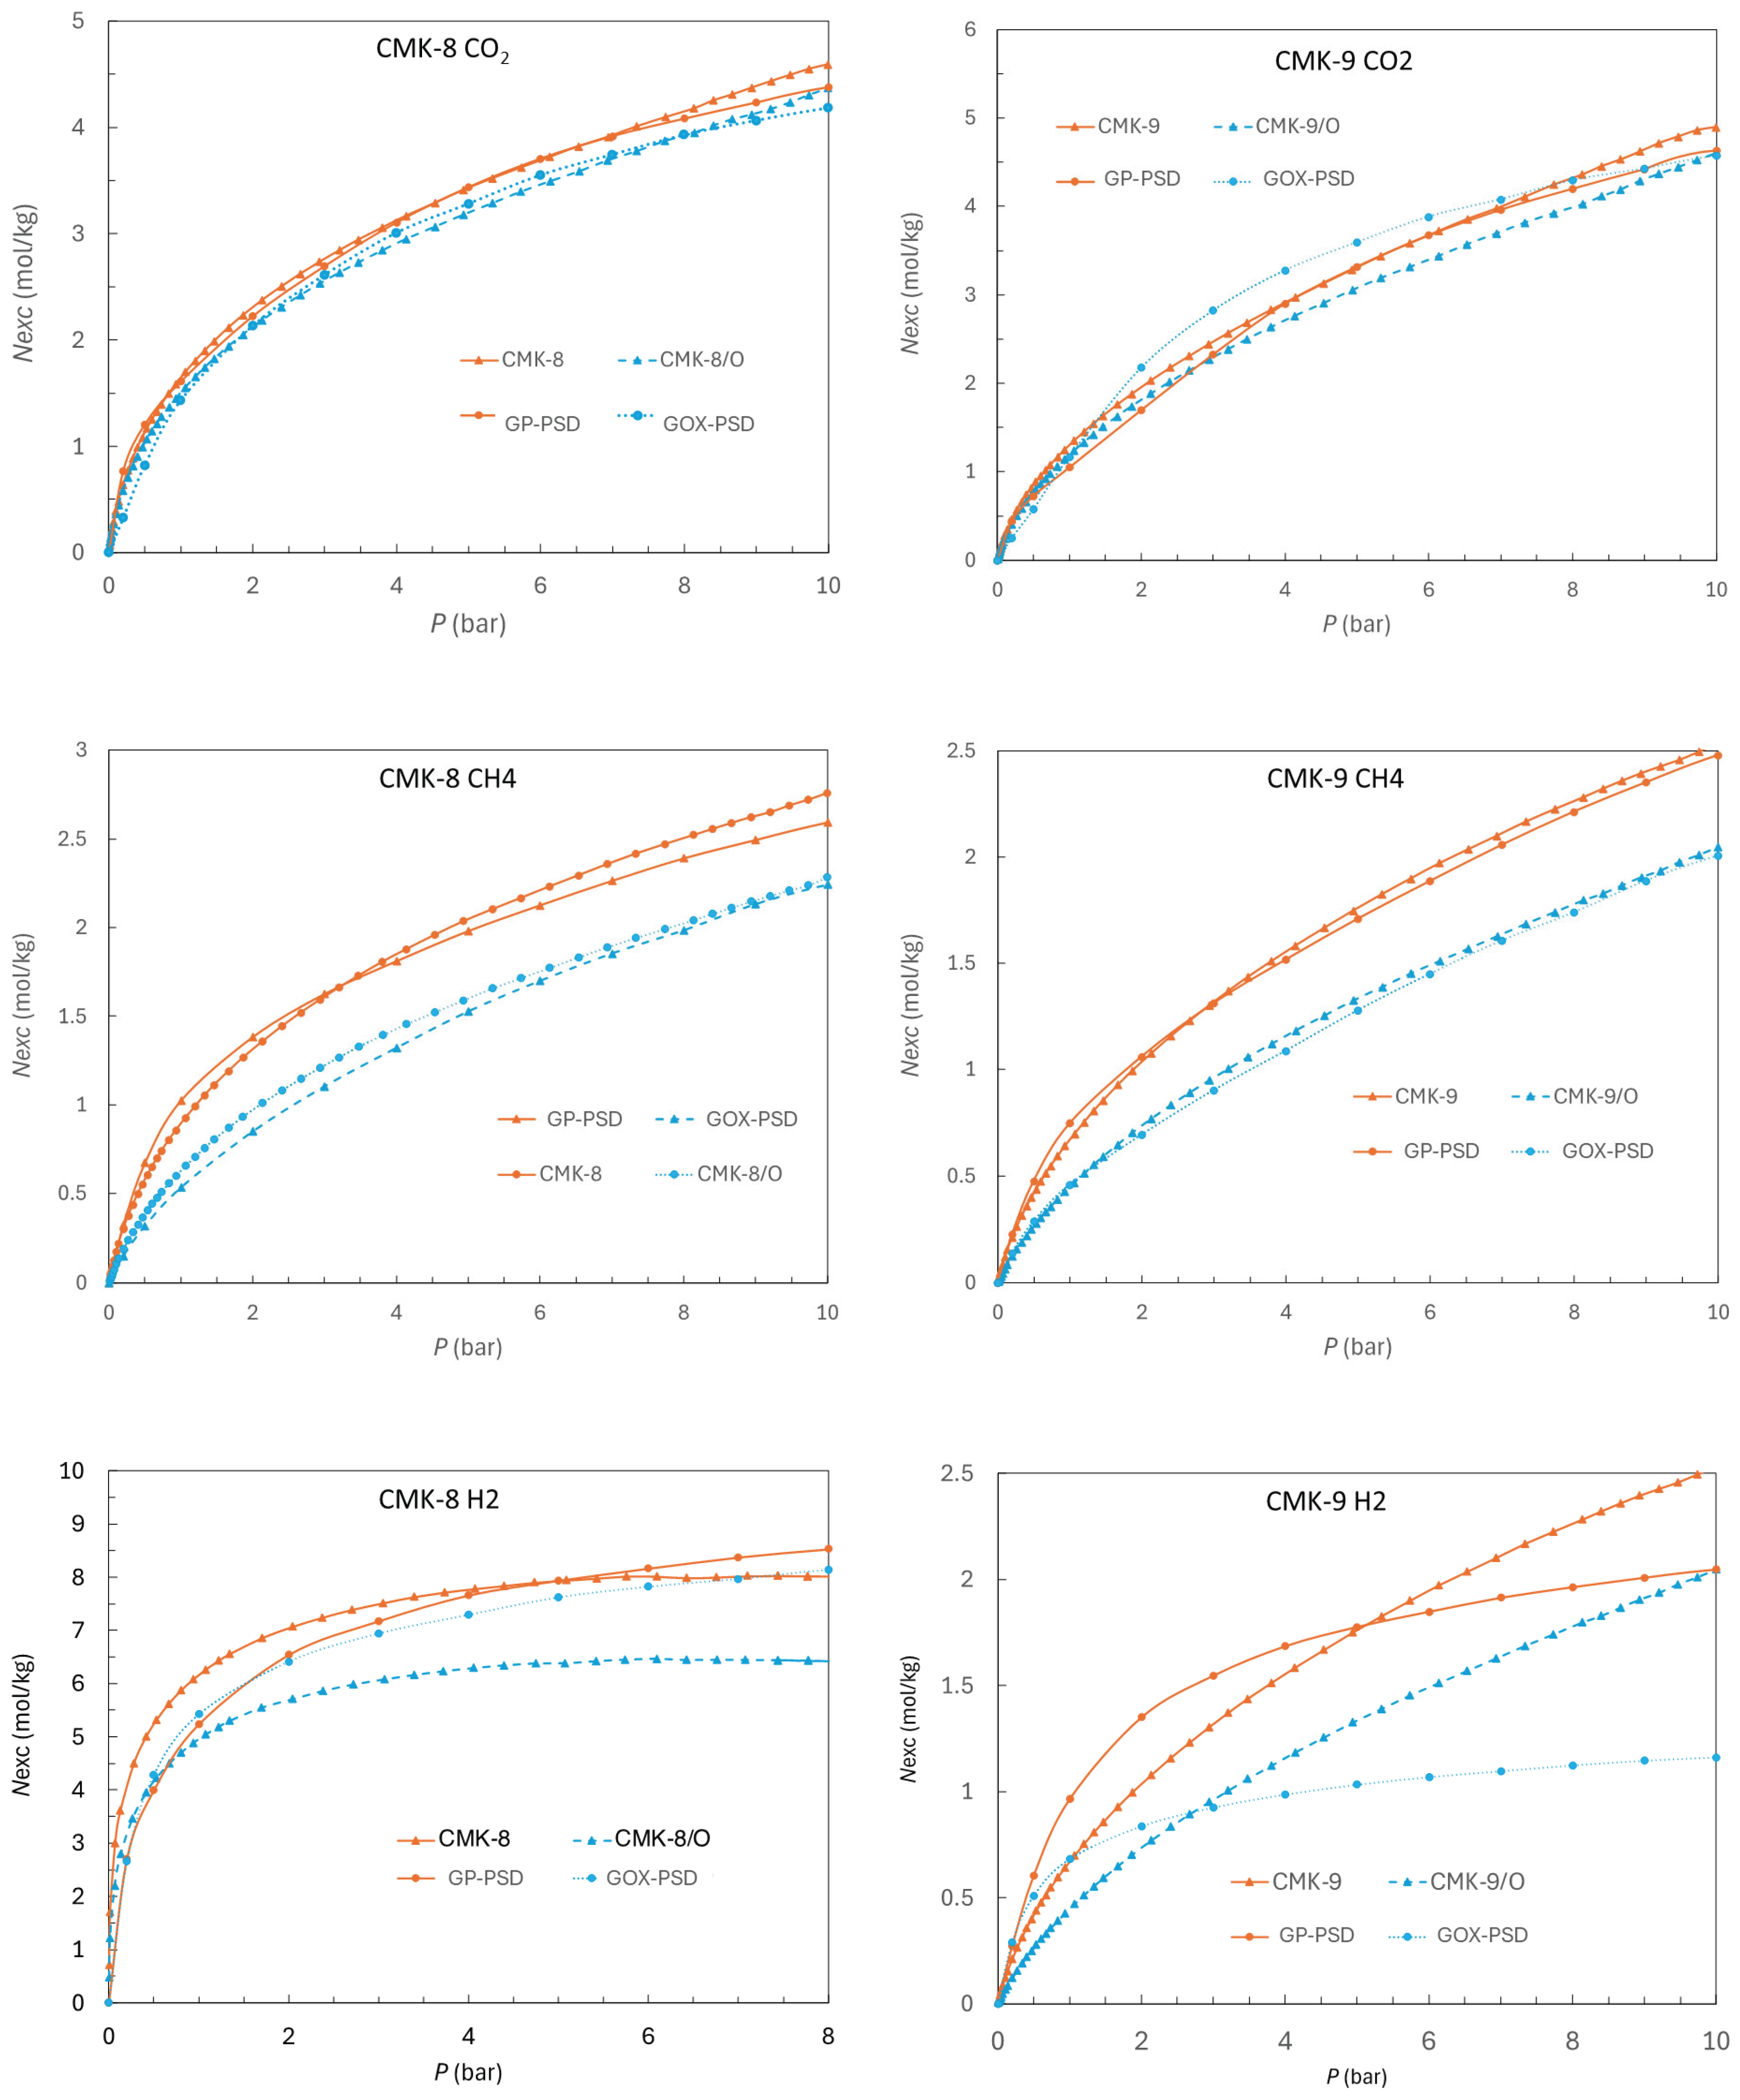
Figure 14.
Simulated isosteric enthalpy profiles for (a) CO2, (b) CH4, and (c) H2 adsorption for pristine (GP) and oxidized (GOx) structures for small (H = 8 Å), medium (12 Å), and large (30 Å) pores.
Figure 14.
Simulated isosteric enthalpy profiles for (a) CO2, (b) CH4, and (c) H2 adsorption for pristine (GP) and oxidized (GOx) structures for small (H = 8 Å), medium (12 Å), and large (30 Å) pores.
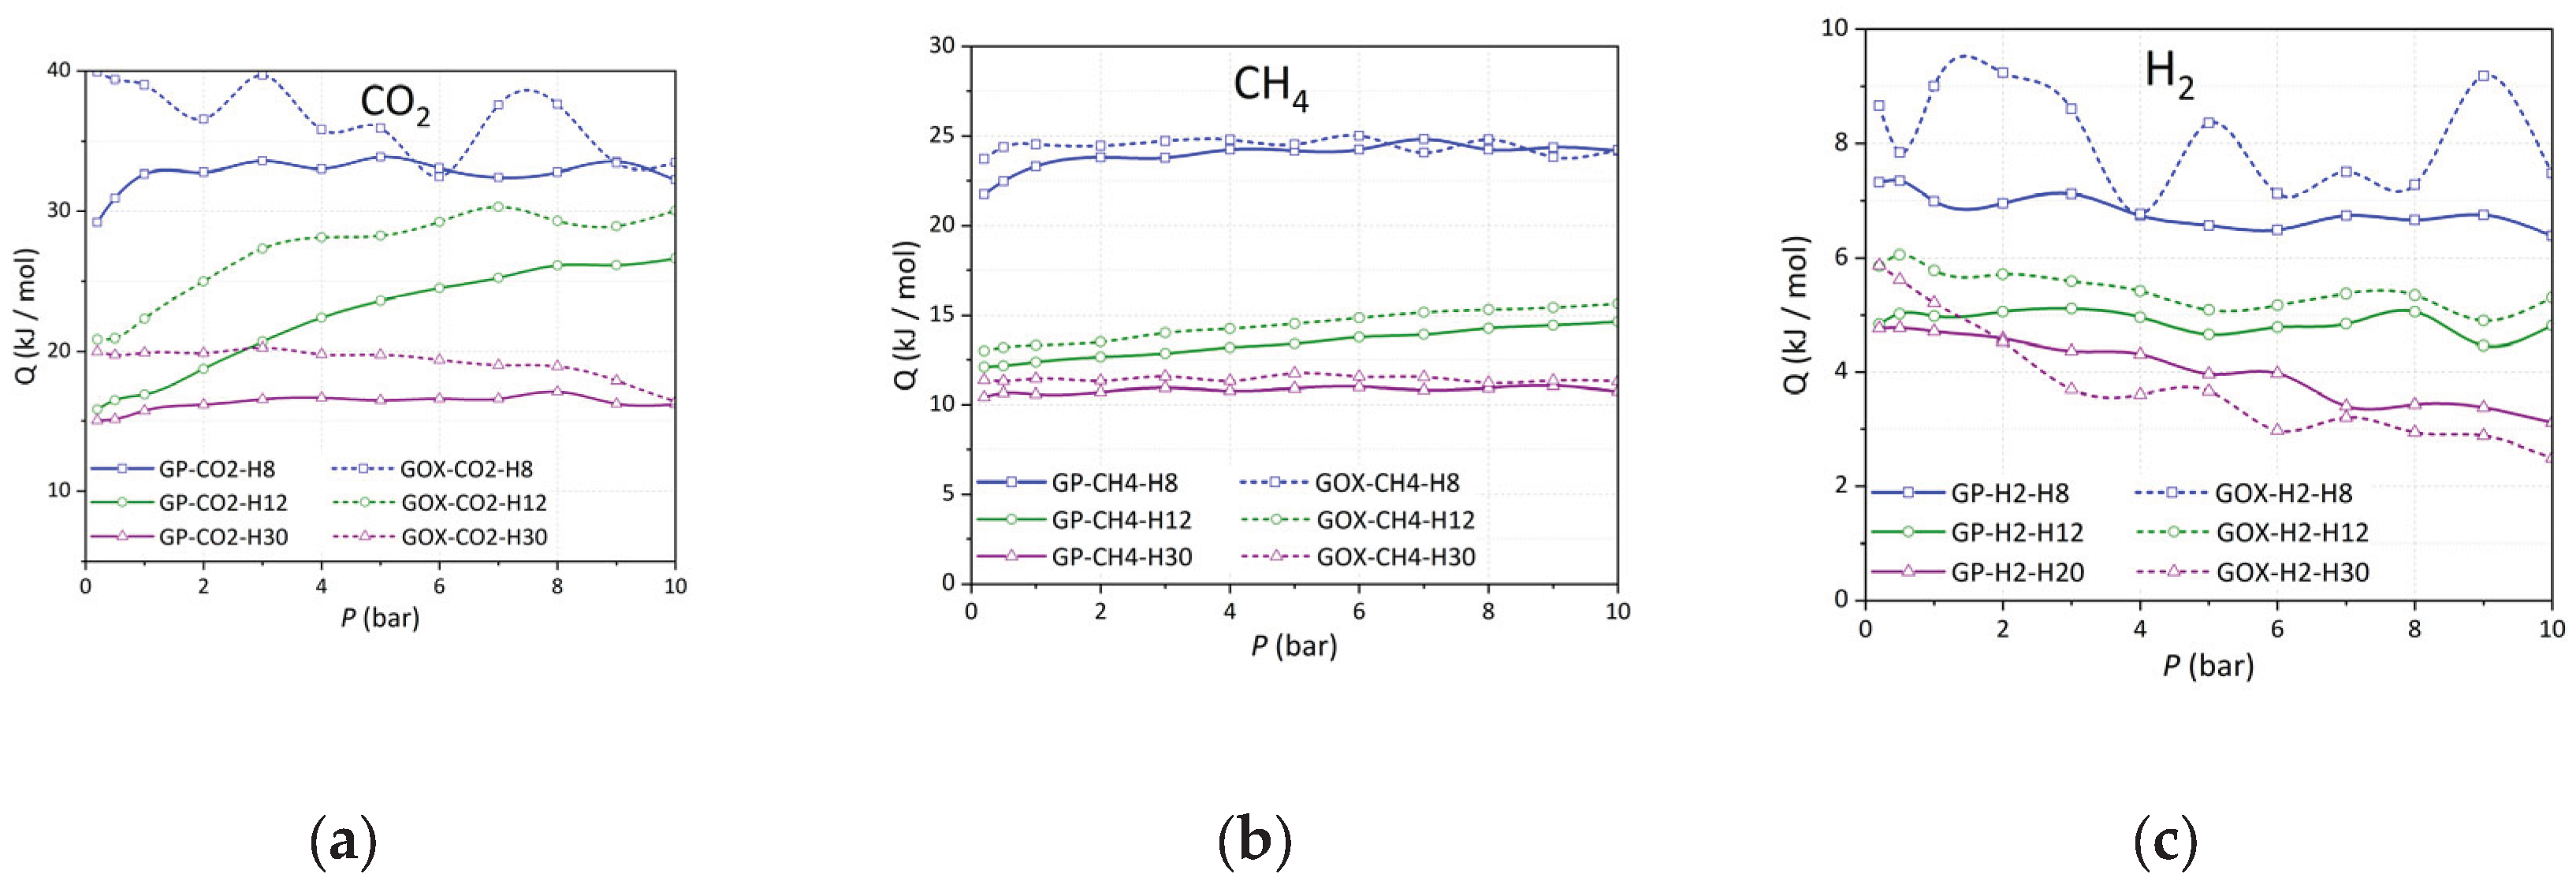
Figure 15.
Pair correlation function g(r) between the hydroxyl oxygens in GP-H20 with the CH4 (a), CO2 (b), and H2 (c) molecules computed at 10 bar. Panel (d) shows an oxidized pore with a single OH group attached, emphasizing the strong correlation it generates. Panel (e) represents a low-pressure run (0.2 atm). Panel (f) corresponds to a UAA model of H2, i.e., without an electric quadrupole, resulting in slightly reduced correlation.
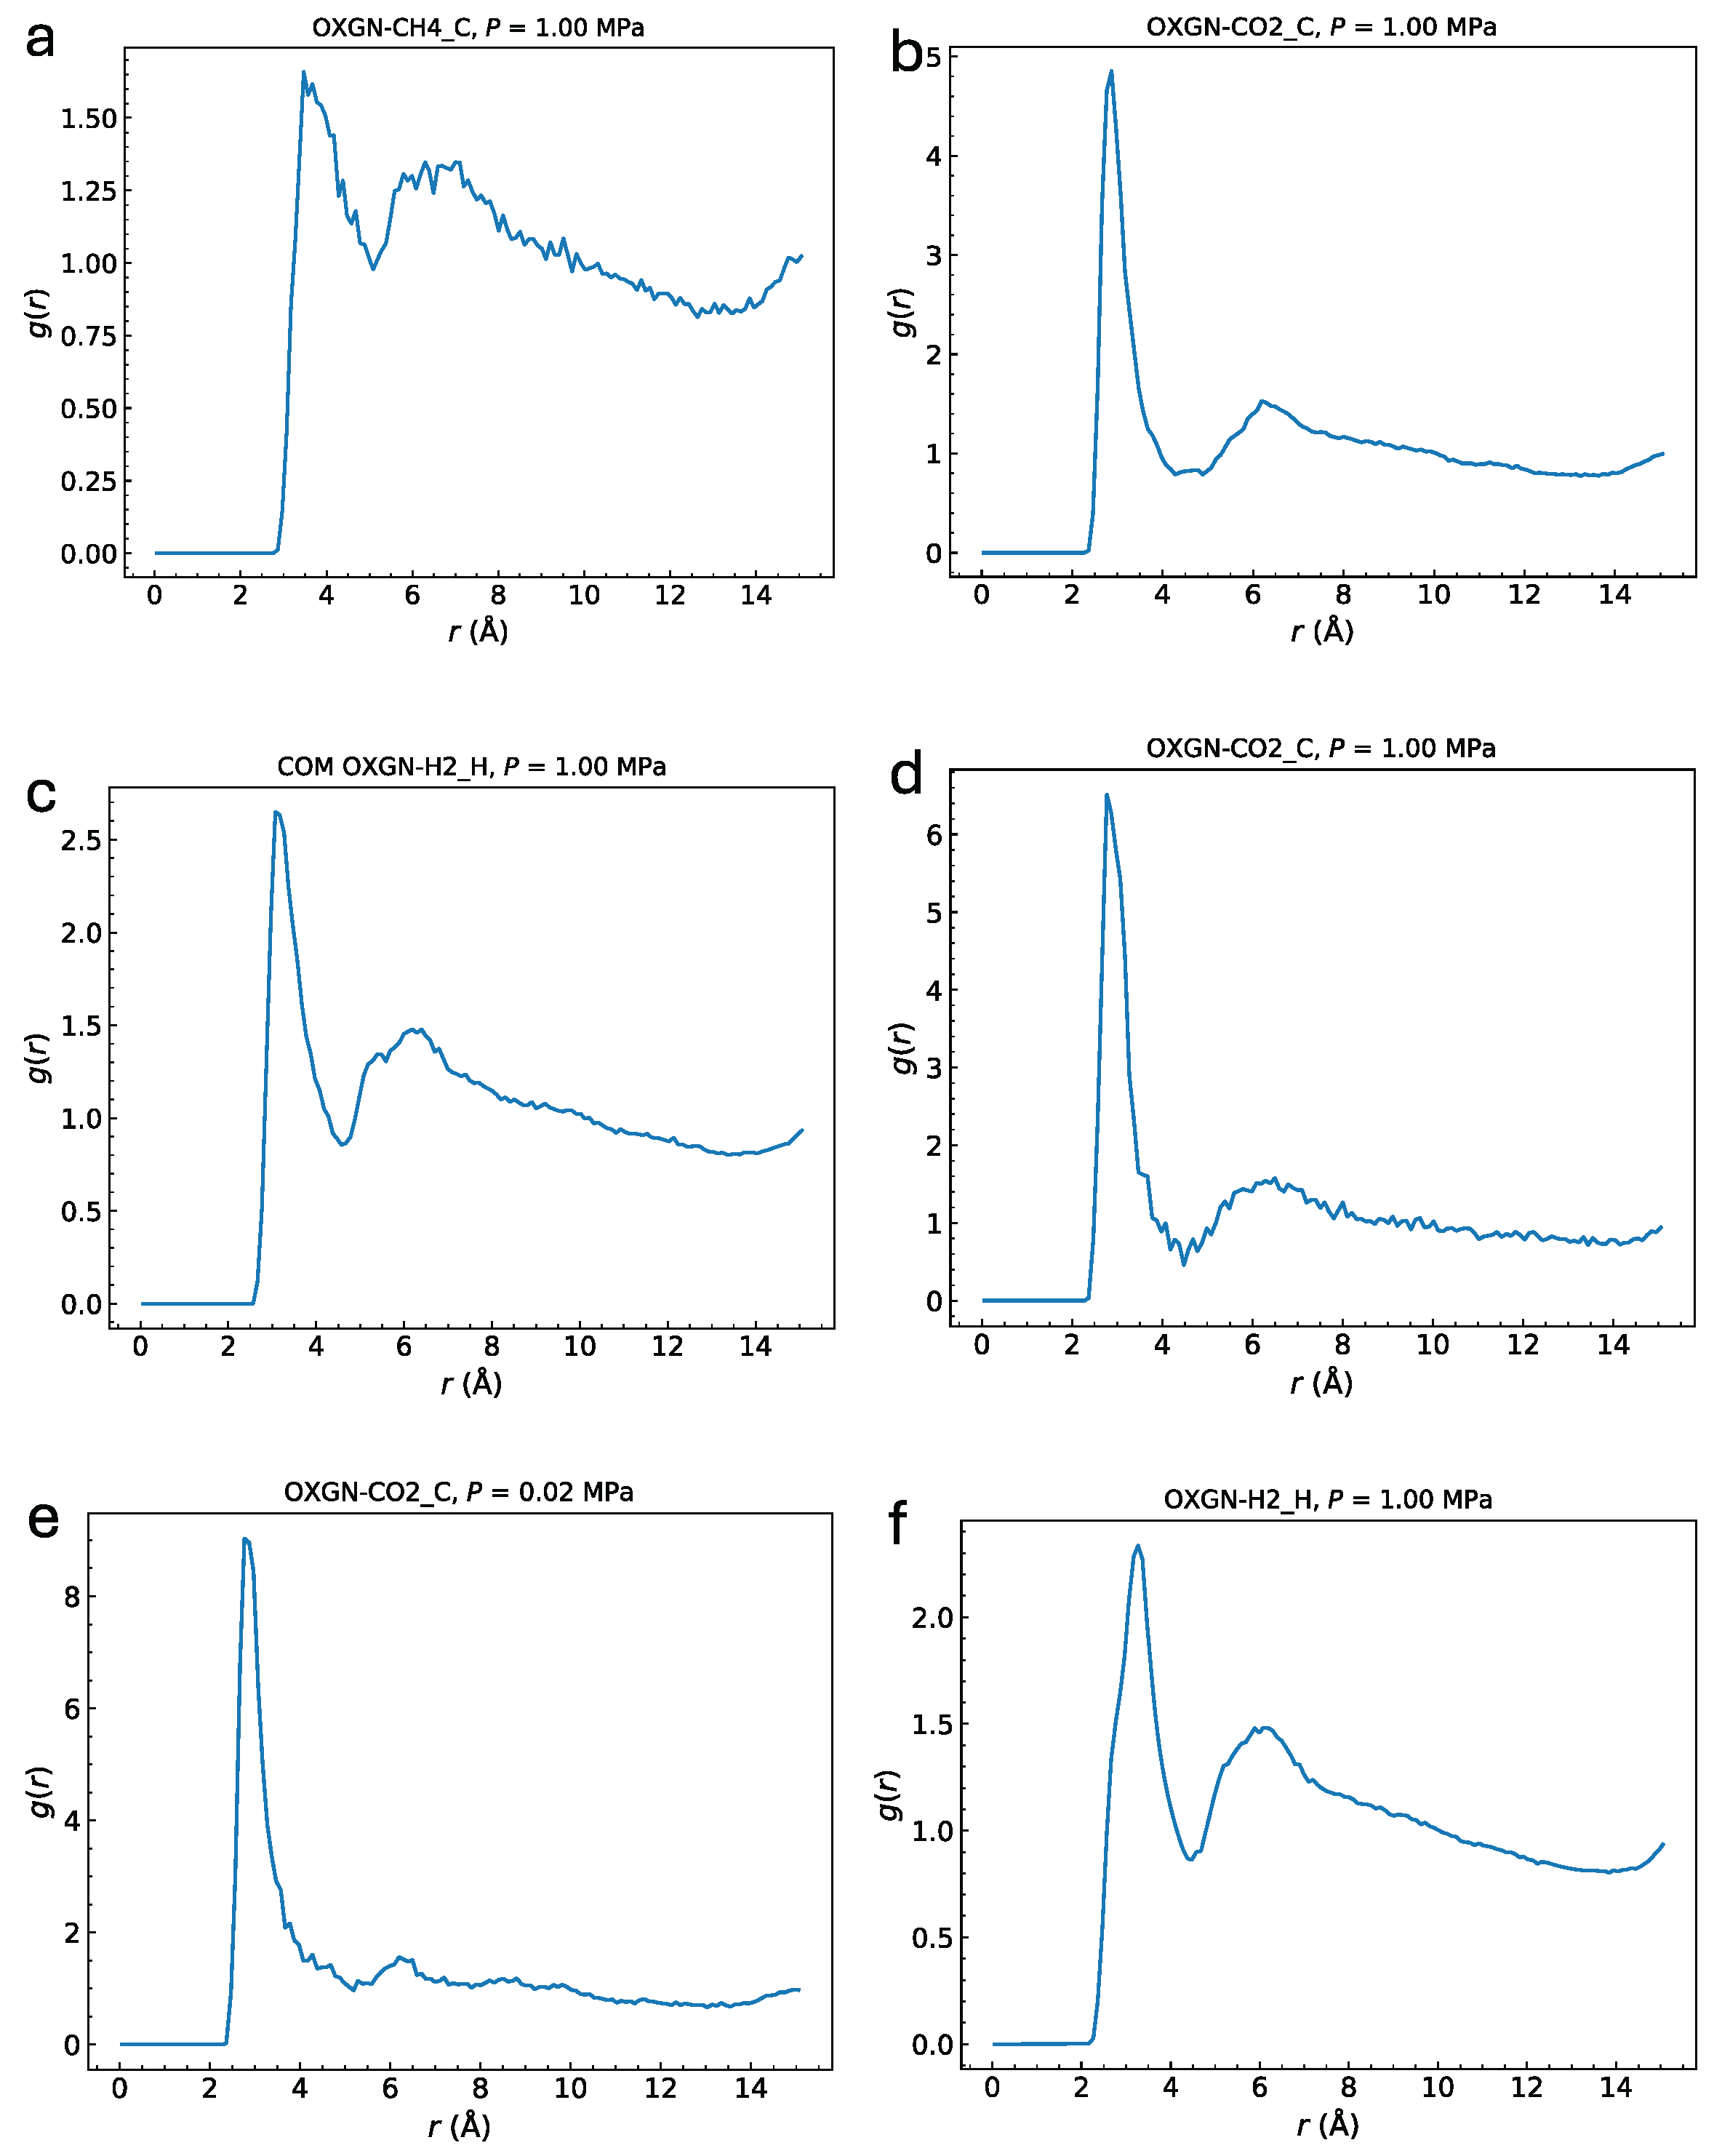

Table 1.
Textural properties obtained from Ar adsorption at 87 K for the four CMK carbon materials.
| Sample | SBET | VµP-Ar | VTP |
| (m2/g) | (cm3/g) | (cm3/g) | |
| CMK-8 | 820 | 0.10 | 0.89 |
| CMK-8/O | 620 | 0.03 | 0.74 |
| CMK-9 | 1210 | 0.08 | 0.96 |
| CMK-9/O | 1050 | 0.08 | 0.76 |
Table 2.
Comparison of gas adsorption performance of the studied materials and selected references.
|
Material |
Conditions |
Gas uptake (mmol/g) |
Ref |
| CO2 | |||
| * CMK-8 | 10 bar, 308 K | 4.6 | This work |
| * CMK-8/O | 10 bar, 308 K | 4.4 | This work |
| * CMK-9 | 10 bar, 308 K | 4.9 | This work |
| * CMK-9/O | 10 bar, 308 K | 4.6 | This work |
| CPO-27-Mg@KIT-6(1:1) | 10 bar, 298 K | 15.8 | [62] |
| Maxsorb (Activated carbon) | 10 bar, 298 K | 2.91 | [61] |
| AS-2-600 (Activated carbon) | 1 bar, 298 K | 4.8 | [9] |
| Coffee grounds (Activated carbon) | 1 bar, 298 K | 3.0 | [63] |
| Palm date seeds (Activated carbon) | 1 bar, 298 K | 4.0 | [9] |
| CH4 | |||
| * CMK-8 | 10 bar, 298 K | 2.8 | This work |
| * CMK-8/O | 10 bar, 298 K | 2.3 | This work |
| * CMK-9 | 10 bar, 298 K | 2.5 | This work |
| * CMK-9/O | 10 bar, 298 K | 2.0 | This work |
| SS-NACF | 25 bar, 298 K | 6.4 | [2] |
| CBF-1273-CO2-1 h | 10 bar, 298 K | 3.5 | [64] |
| RHAC900-SR | 35 bar, 298 K | 4.3 | [65] |
| H2 | |||
| * CMK-8 | 8 bar, 77 K | 8.0 | This work |
| * CMK-8/O | 8 bar, 77 K | 6.4 | This work |
| * CMK-9 | 8 bar, 77 K | 8.8 | This work |
| * CMK-9/O | 8 bar, 77 K | 7.0 | This work |
| SS-NACF | 25 bar, 77 K | 8.1 | [2] |
| PPY2 | 20 bar, 77 K | 2.91 | [66] |
| PPY4800 | 20 bar, 77 K | 4.8 | [67] |
Disclaimer/Publisher’s Note: The statements, opinions and data contained in all publications are solely those of the individual author(s) and contributor(s) and not of MDPI and/or the editor(s). MDPI and/or the editor(s) disclaim responsibility for any injury to people or property resulting from any ideas, methods, instructions or products referred to in the content. |
© 2025 by the authors. Licensee MDPI, Basel, Switzerland. This article is an open access article distributed under the terms and conditions of the Creative Commons Attribution (CC BY) license (http://creativecommons.org/licenses/by/4.0/).
Copyright: This open access article is published under a Creative Commons CC BY 4.0 license, which permit the free download, distribution, and reuse, provided that the author and preprint are cited in any reuse.


