Submitted:
31 October 2025
Posted:
03 November 2025
You are already at the latest version
Abstract
Renewable energy stocks are affected by investor sentiment and trading behavior, particularly during changes in policy or market trends. This study applies a Principal Component Analysis–Hidden Markov Model (PCA–HMM) to examine how sentiment, trading volume, and momentum relate to stock returns in the U.S. renewable energy market. The data include 36 listed companies from 2016 to 2025 across the solar, energy storage, and electric vehicle sectors. Principal Component Analysis was used to extract main factors from market and macroeconomic variables, and the Hidden Markov Model was used to identify hidden market states. The results show that stock returns react more to sentiment than to trading volume or short-term momentum. In high-sentiment periods, both volatility and return fluctuation increase, while low-sentiment periods show partial momentum reversal. Compared with a single-state model, the PCA–HMM achieves a better fit and describes time-varying relationships more accurately. These findings suggest that a state-based approach to sentiment can help monitor market risk and support investment analysis in renewable energy finance. Further research should include higher-frequency data and cross-market sentiment links to enhance model reliability.
Keywords:
renewable energy stocks
; investor sentiment
; trading volume
; momentum effect
; principal component analysis
; hidden Markov model
; market state
1. Introduction
The global expansion of renewable energy investments has intensified academic and financial interest in how investor sentiment and trading behavior shape stock performance in this rapidly evolving sector [1]. Market sentiment—often extracted from financial news, media narratives, or online discussions—has been shown to influence both short-term volatility and long-term return dynamics of clean-energy equities [2]. Despite significant growth in green industries, the renewable-energy market remains highly sensitive to external shocks, including policy revisions, raw material price fluctuations, and supply-chain disruptions [3,4]. In the United States, large-scale capital flows into solar power, battery storage, and electric-vehicle production have not consistently generated stable returns, suggesting that investor psychology and expectation cycles may play a more decisive role than fundamentals in shaping market outcomes [5]. Recent econometric and machine-learning studies have turned to Hidden Markov Models (HMMs) to identify latent market regimes that traditional linear frameworks fail to capture [6]. Simultaneously, Principal Component Analysis (PCA) has been applied to extract orthogonal factors representing key market dimensions such as sentiment, volume, and momentum [7,8]. Combining PCA with HMMs enables the joint modeling of structural and behavioral dimensions of financial markets, providing insight into state-dependent interactions among variables [9]. Previous studies have used this hybrid approach to explore how sentiment-driven dynamics contribute to regime shifts in stock markets [10]. However, empirical applications in renewable-energy equities remain scarce, even though this sector’s volatility is often driven by policy signals, climate targets, and technological innovation cycles [11]. One particularly relevant work demonstrated that a PCA–HMM framework can effectively reveal how market states evolve in response to changes in sentiment, volume, and momentum [12]. Yet, its application to clean-energy markets has not been systematically tested, leaving open questions about how these dynamics differ from those observed in broader technology sectors. Despite growing attention, three major research gaps persist. First, most prior analyses isolate sentiment, trading volume, or momentum effects, lacking an integrated structure that allows these factors to vary across hidden market states [13]. Second, the datasets used in previous studies often cover limited time spans or small sample universes, reducing robustness in sectors characterized by policy volatility and strong cyclicality [14]. Third, many PCA-based analyses fail to connect factor loading variations with state transitions, even though these loadings can shift substantially as market conditions evolve [15]. As a result, current understanding of how behavioral drivers interact with latent market regimes in renewable-energy equities remains incomplete.
The study investigates U.S. renewable-energy stocks spanning 2016–2025, including firms from the solar, energy storage, and electric-vehicle industries. PCA is employed to extract core features representing sentiment, trading activity, and price momentum, while an HMM framework identifies hidden market states that capture nonlinear regime dynamics. The model allows the effect of sentiment on stock returns to vary across states, distinguishing between expansionary, neutral, and contractionary phases. By linking sector-specific sentiment with latent market regimes, the study tests whether sentiment exhibits a stronger and more persistent impact on clean-energy stock returns compared to volume or momentum and whether extreme states demonstrate short-term reversal behavior. From a theoretical perspective, the research expands behavioral finance models by integrating psychological and econometric dimensions under regime-switching dynamics. From an applied standpoint, it provides quantitative evidence to guide investors and policymakers in understanding sentiment-driven risks in sustainable equity markets and optimizing portfolio strategies for renewable-energy assets.
2. Materials and Methods
2.1. Sample and Study Area Description
This study uses daily trading data from 36 listed companies in the U.S. renewable energy market. The sample includes firms from solar, energy storage, and electric vehicle industries. The study period is from January 2016 to March 2025. All data were obtained from Yahoo Finance, including prices, trading volumes, and market indices. In addition, U.S. interest rates, crude oil prices, and the industrial production index were collected to control for macroeconomic effects. Companies were selected based on continuous trading records and a market value of more than 500 million U.S. dollars to ensure data completeness. The sample covers both periods of rapid growth and market correction in the renewable sector.
2.2. Experimental Design and Control Group
The study uses a state-based design with two groups of market conditions. The experimental group contains the hidden states identified by the PCA–HMM model, which describe different patterns of sentiment and trading activity. The control group is built with a standard linear regression model that does not include hidden states. This setting allows comparison between a state-dependent structure and a traditional single-regime model. The PCA–HMM assumes that sentiment and trading volume influence returns in different ways under different market states. Both models were estimated with the same dataset to keep conditions consistent and isolate the role of regime changes.
2.3. Measurement Methods and Quality Control
Investor sentiment was measured using a combined index that includes market volatility, changes in trading volume, and short-term return reversal. All time series were checked for stationarity with the Augmented Dickey–Fuller test. Non-stationary data were differenced until the mean and variance became stable. Outliers were identified by the interquartile range method and replaced with nearby average values when needed. Trading volume and momentum were standardized into z-scores to make results comparable across variables. Data cleaning was done in MATLAB R2022b and Python 3.11. To confirm accuracy, 10% of the data was randomly compared with the original Yahoo Finance records before analysis.
2.4. Data Processing and Model Equations
Principal Component Analysis (PCA) was used to reduce data dimensions and extract the main factors from sentiment, volume, and momentum variables. The number of components was determined by the cumulative variance ratio [16]:
2.5. Statistical Analysis and Validation
The model parameters were estimated using the Expectation–Maximization algorithm based on maximum likelihood. Model fit was checked with the Akaike Information Criterion (AIC) and log-likelihood values. A smaller AIC indicates a better fit with fewer unnecessary parameters. A 70–30 split between training and testing samples was applied, and threefold cross-validation was used to test prediction stability. Statistical significance was evaluated at the 5% level, and confidence intervals were reported for the main coefficients. The results were compared with those of the control regression model to verify whether the PCA–HMM could describe state-dependent changes in investor behavior more clearly.
3. Results and Discussion
3.1. State-dependent effects of sentiment, volume, and momentum
The PCA–HMM identifies two to three latent market states that differ in return dispersion and trading intensity. In states associated with high sentiment, the coefficient on the sentiment factor is positive and larger than in other states, while the effects of volume and momentum are smaller. In low-sentiment or stressed states, the sentiment coefficient weakens or turns insignificant, and short-horizon momentum shows partial reversal. These patterns support the view that the impact of investor mood on renewable-energy equities changes with market conditions rather than remaining constant [18]. Figure 1 provides a reference example of a PCA-based feature pipeline that is consistent with our dimensionality reduction step (see caption for source).
3.2. Model fit and regime classification accuracy
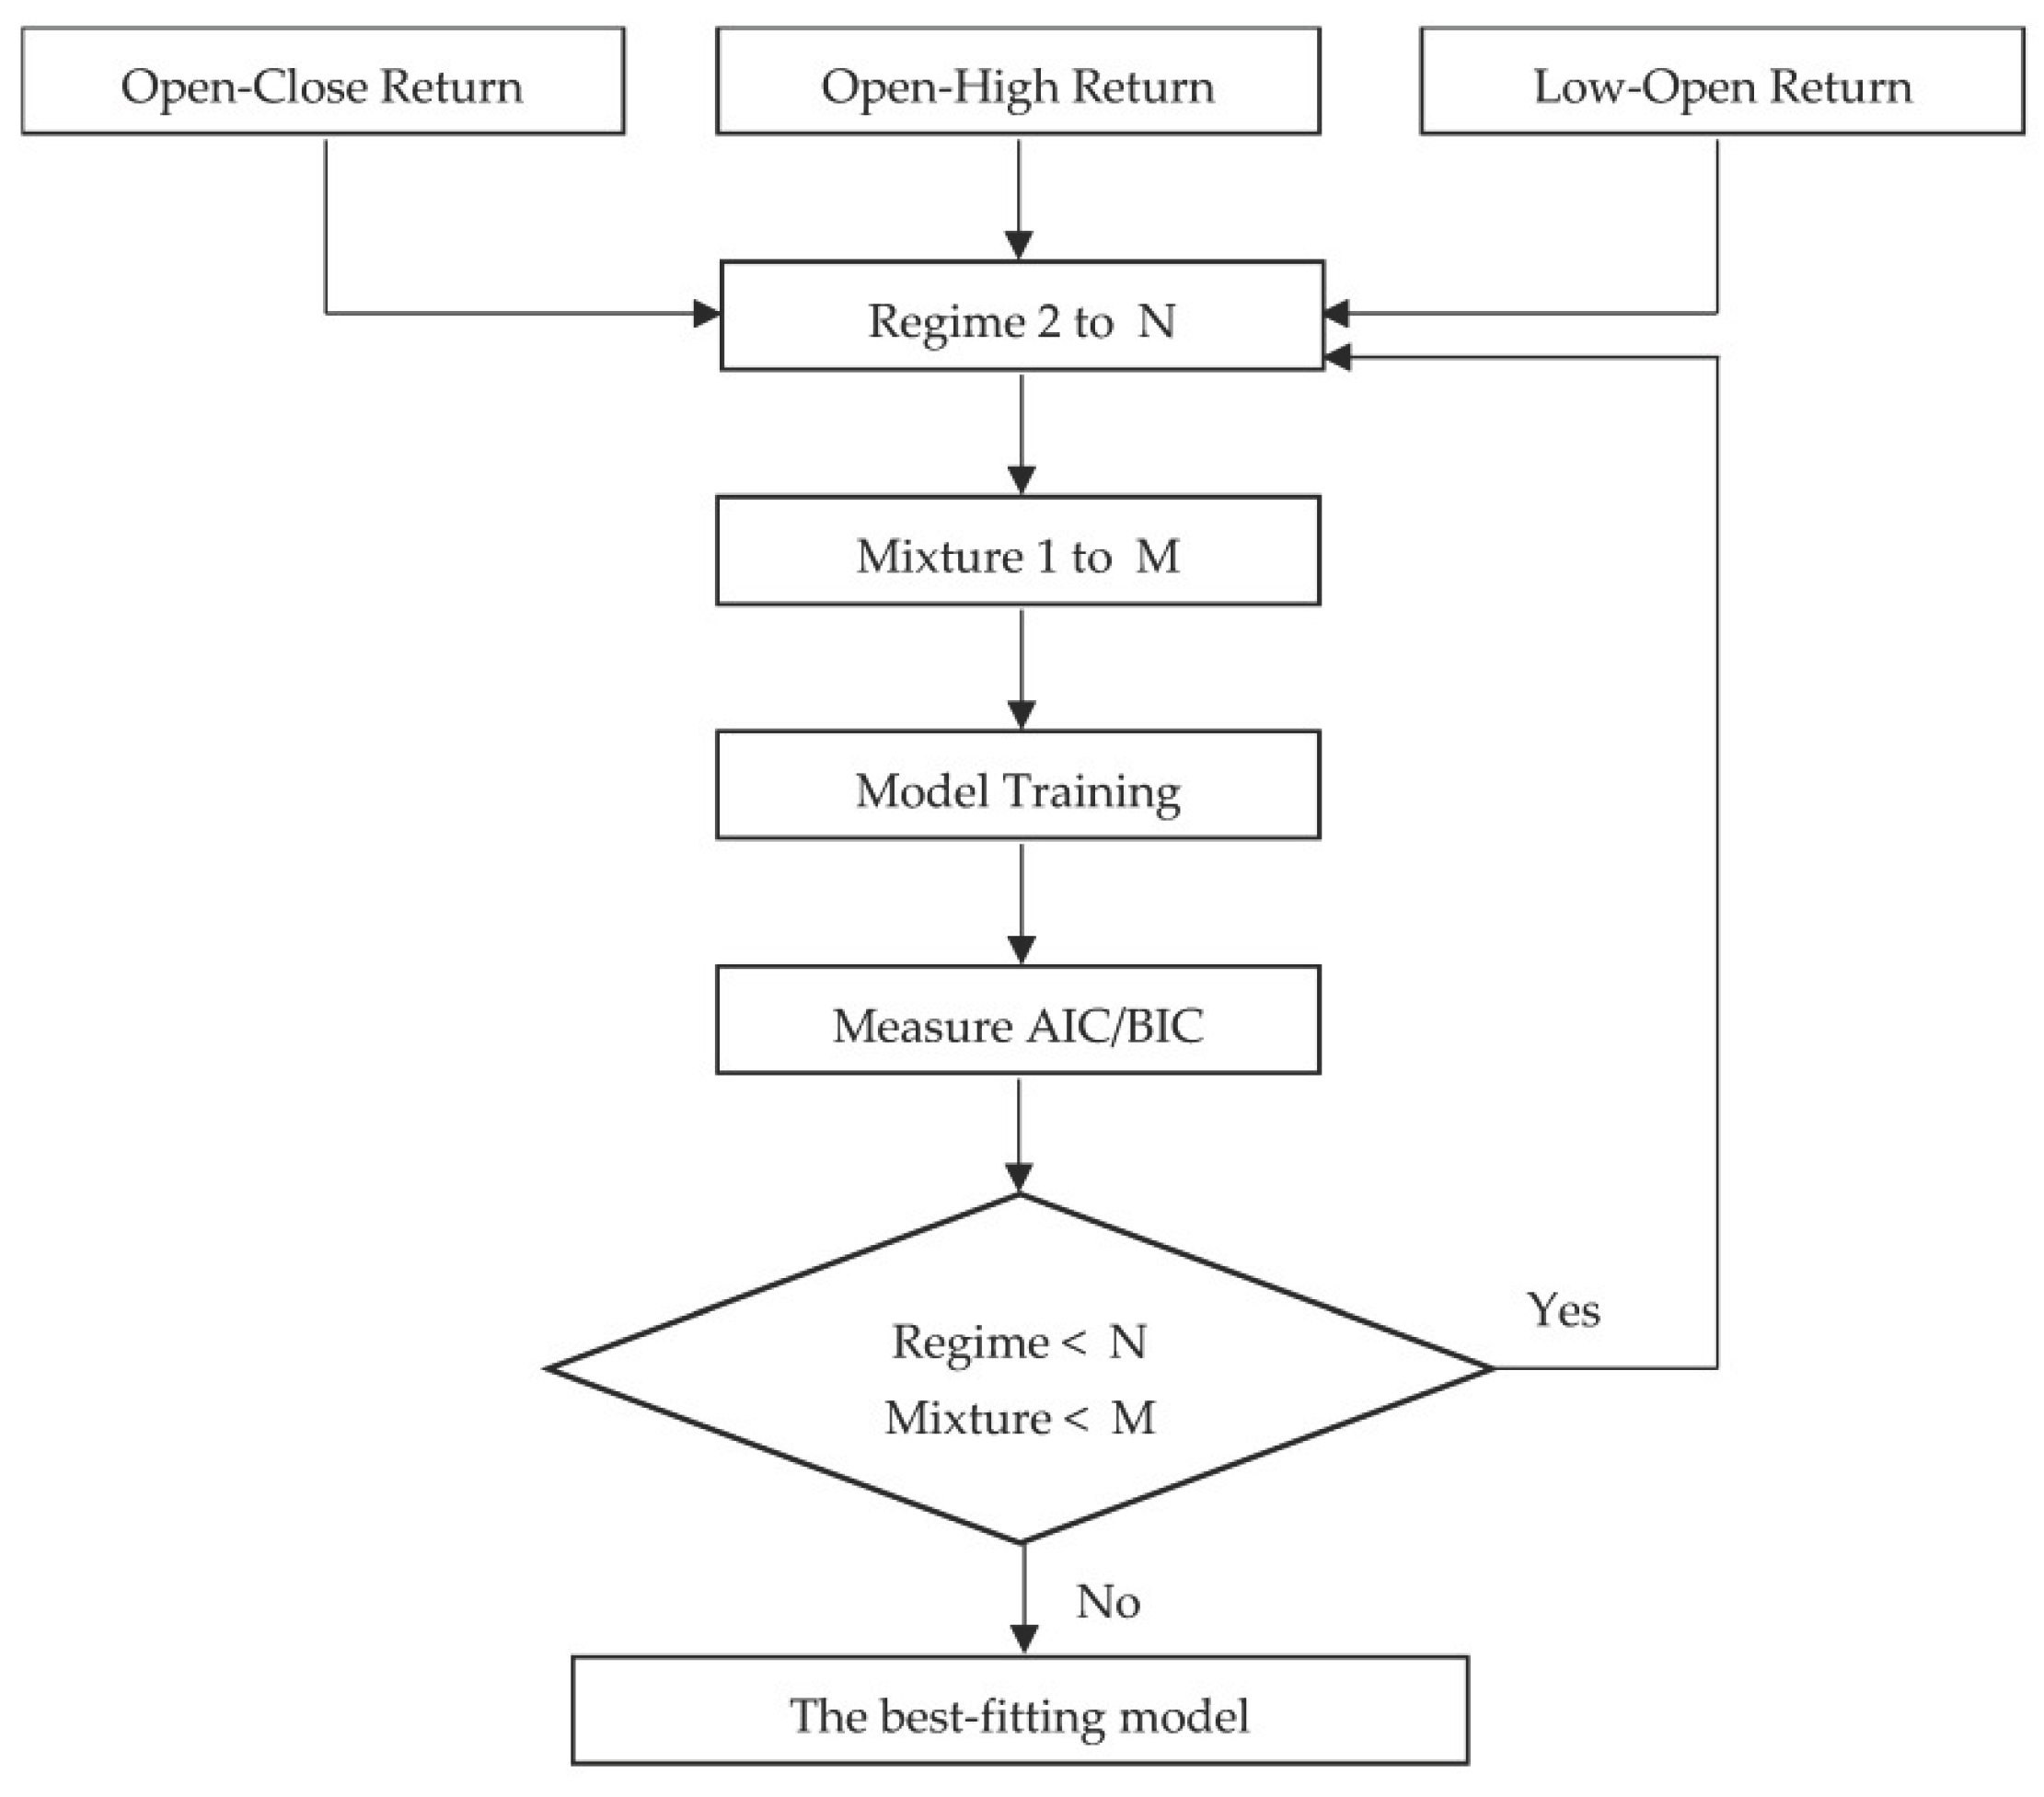
Adding hidden states improves statistical fit relative to the single-regime control model. The HMM specification yields lower information criteria and higher out-of-sample likelihood on the same data split. Decoded state sequences show clustered episodes that align with known sector news and policy events, while the control model cannot separate such periods. The transition matrix features persistent probabilities on diagonal entries, indicating that regimes last for multiple days rather than switching randomly [19,20]. Figure 2 shows an example workflow for regime selection and decoding that mirrors our estimation process.
3.3. Return dynamics within states
Within high-sentiment states, average returns are higher but also more volatile. Trading volume rises, yet its direct contribution to returns is smaller than that of sentiment. In neutral states, returns concentrate near zero and momentum effects fade. In low-sentiment states, dispersion increases and short-term momentum tends to reverse, suggesting fast information reassessment [21]. State-specific regressions confirm that sentiment has a stronger and more stable link with returns than volume or momentum once regime dependence is allowed. These findings are consistent with sector behavior in which policy news and expectations drive price reactions more than pure trading activity.
3.4. Robustness checks and comparison with prior work
Results are robust to alternative numbers of principal components and to different proxies for sentiment (volatility-based and return-based composites). Re-estimation with a two-state HMM preserves the ordering of effects, while a three-state model refines the separation between neutral and stressed periods. These outcomes align with recent studies that combine dimensionality reduction with regime-switching to capture changing market behavior in equity sectors. Our contribution lies in applying this structure to U.S. clean-energy stocks with a unified PCA–HMM design, allowing sentiment, volume, and momentum to vary by state over a long sample. Limitations include the focus on daily frequency and the absence of explicit intraday order-flow measures; future work can extend the model to higher-frequency data and to cross-market spillovers.
4. Conclusion
This study demonstrates that the PCA–HMM framework effectively captures the dynamic and nonlinear relationship between investor sentiment, trading volume, and momentum in the U.S. renewable energy market. The results confirm that stock returns in this sector are significantly more sensitive to sentiment fluctuations than to changes in trading activity or short-term momentum. Importantly, the analysis reveals that this sensitivity varies across different hidden market states, underscoring the role of behavioral heterogeneity and regime-dependent dynamics in renewable-energy finance. During high-sentiment periods, the market exhibits increased volatility and amplified reactions to news and expectations, whereas low-sentiment regimes are characterized by partial momentum reversals and reduced responsiveness to trading volume. By integrating Principal Component Analysis with a Hidden Markov Model, this study provides a structured approach to identifying latent states that traditional single-regime models fail to capture. The hybrid model not only enhances statistical fit but also offers a clearer depiction of how investor behavior and market structure co-evolve under policy and technological shocks. These insights help explain the pronounced price swings often observed in clean-energy equities following policy announcements or media-driven optimism. From a practical standpoint, the PCA–HMM framework introduces a scalable method for real-time monitoring of sentiment-related risks and offers quantitative signals that can inform portfolio allocation and hedging strategies in sustainable investment markets.
References
- Maurya, P. K.; Bansal, R.; Mishra, A. K. Investor sentiment and its implication on global financial markets: a systematic review of literature. In Qualitative Research in Financial Markets; 2025. [Google Scholar]
- Yang, J.; Li, Y.; Harper, D.; Clarke, I.; Li, J. Macro Financial Prediction of Cross Border Real Estate Returns Using XGBoost LSTM Models. Journal of Artificial Intelligence and Information 2025, 2, 113–118. [Google Scholar]
- Maharana, S. Energy Market Shocks: Effect of Oil Price Volatility on Supply Chain. In Supply Chain Disruptions and Impact on Global Inflation; IGI Global Scientific Publishing, 2025; pp. 59–84. [Google Scholar]
- Zhu, W.; Yang, J. Causal Assessment of Cross-Border Project Risk Governance and Financial Compliance: A Hierarchical Panel and Survival Analysis Approach Based on H Company's Overseas Projects. 2025. [Google Scholar] [CrossRef]
- Marcus, A.; Malen, J.; Ellis, S. The promise and pitfalls of venture capital as an asset class for clean energy investment: Research questions for organization and natural environment scholars. Organization & Environment 2013, 26(1), 31–60. [Google Scholar]
- Wang, J.; Xiao, Y. Research on Credit Risk Forecasting and Stress Testing for Consumer Finance Portfolios Based on Macroeconomic Scenarios. 2025. [Google Scholar] [CrossRef]
- Oprea, A. The use of principal component analysis (pca) in building yield curve scenarios and identifying relative-value trading opportunities on the romanian government bond market. Journal of Risk and Financial Management 2022, 15(6), 247. [Google Scholar] [CrossRef]
- Manjunatha, B.; Karthik, R.; Kiran, N. R.; Naik, A. P.; Damodhara, G. N.; Gunashekhar, H.; Mahendra, K. R. Theoretical Foundations and Application of Hidden Markov Models. Journal of Scientific Research and Reports 2024, 30(8), 837–849. [Google Scholar] [CrossRef]
- Lommers, K.; Harzli, O. E.; Kim, J. Confronting machine learning with financial research. arXiv preprint 2021, arXiv:2103.00366. [Google Scholar] [CrossRef]
- Abdollahi, H. Market volatility and new evidence from media sentiment: An AI-driven approach. 2024. [Google Scholar]
- Xiao, X.; Li, A.; Kchouri, B.; Shan, S. Tracing the dynamic impact of energy transitions on equity market volatility in an era of financial turbulence. Energy Economics 2024, 133, 107443. [Google Scholar] [CrossRef]
- Liu, Z. Stock volatility prediction using LightGBM based algorithm. In 2022 International Conference on Big Data, Information and Computer Network (BDICN); January, IEEE, 2022; pp. 283–286. [Google Scholar]
- Li, S. Momentum, volume and investor sentiment study for us technology sector stocks—A hidden markov model based principal component analysis. PLoS One 2025, 20(9), e0331658. [Google Scholar]
- Wu, C.; Zhu, J.; Yao, Y. Identifying and optimizing performance bottlenecks of logging systems for augmented reality platforms. 2025. [Google Scholar] [CrossRef]
- Oprea, A. The use of principal component analysis (pca) in building yield curve scenarios and identifying relative-value trading opportunities on the romanian government bond market. Journal of Risk and Financial Management 2022, 15(6), 247. [Google Scholar] [CrossRef]
- Wang, J.; Xiao, Y. Assessing the Spillover Effects of Marketing Promotions on Credit Risk in Consumer Finance: An Empirical Study Based on AB Testing and Causal Inference. 2025. [Google Scholar] [CrossRef]
- Yuan, M.; Wang, B.; Su, S.; Qin, W. Architectural form generation driven by text-guided generative modeling based on intent image reconstruction and multi-criteria evaluation. In Authorea Preprints; 2025. [Google Scholar]
- Hu, W. Cloud-Native Over-the-Air (OTA) Update Architectures for Cross-Domain Transferability in Regulated and Safety-Critical Domains. In 2025 6th International Conference on Information Science, Parallel and Distributed Systems; September, 2025. [Google Scholar]
- Bazzi, M.; Blasques, F.; Koopman, S. J.; Lucas, A. Time-varying transition probabilities for Markov regime switching models. Journal of Time Series Analysis 2017, 38(3), 458–478. [Google Scholar] [CrossRef]
- Zhu, W.; Yao, Y.; Yang, J. Real-Time Risk Control Effects of Digital Compliance Dashboards: An Empirical Study Across Multiple Enterprises Using Process Mining, Anomaly Detection, and Interrupt Time Series. 2025. [Google Scholar] [CrossRef]
- Fang, J.; Hao, W.; Wongchoti, U. Time-series momentum in individual stocks: is it there and where to look? Applied Economics 2022, 54(18), 2048–2066. [Google Scholar] [CrossRef]
Figure 1.
PCA-based feature extraction for renewable energy stock data before model fitting.
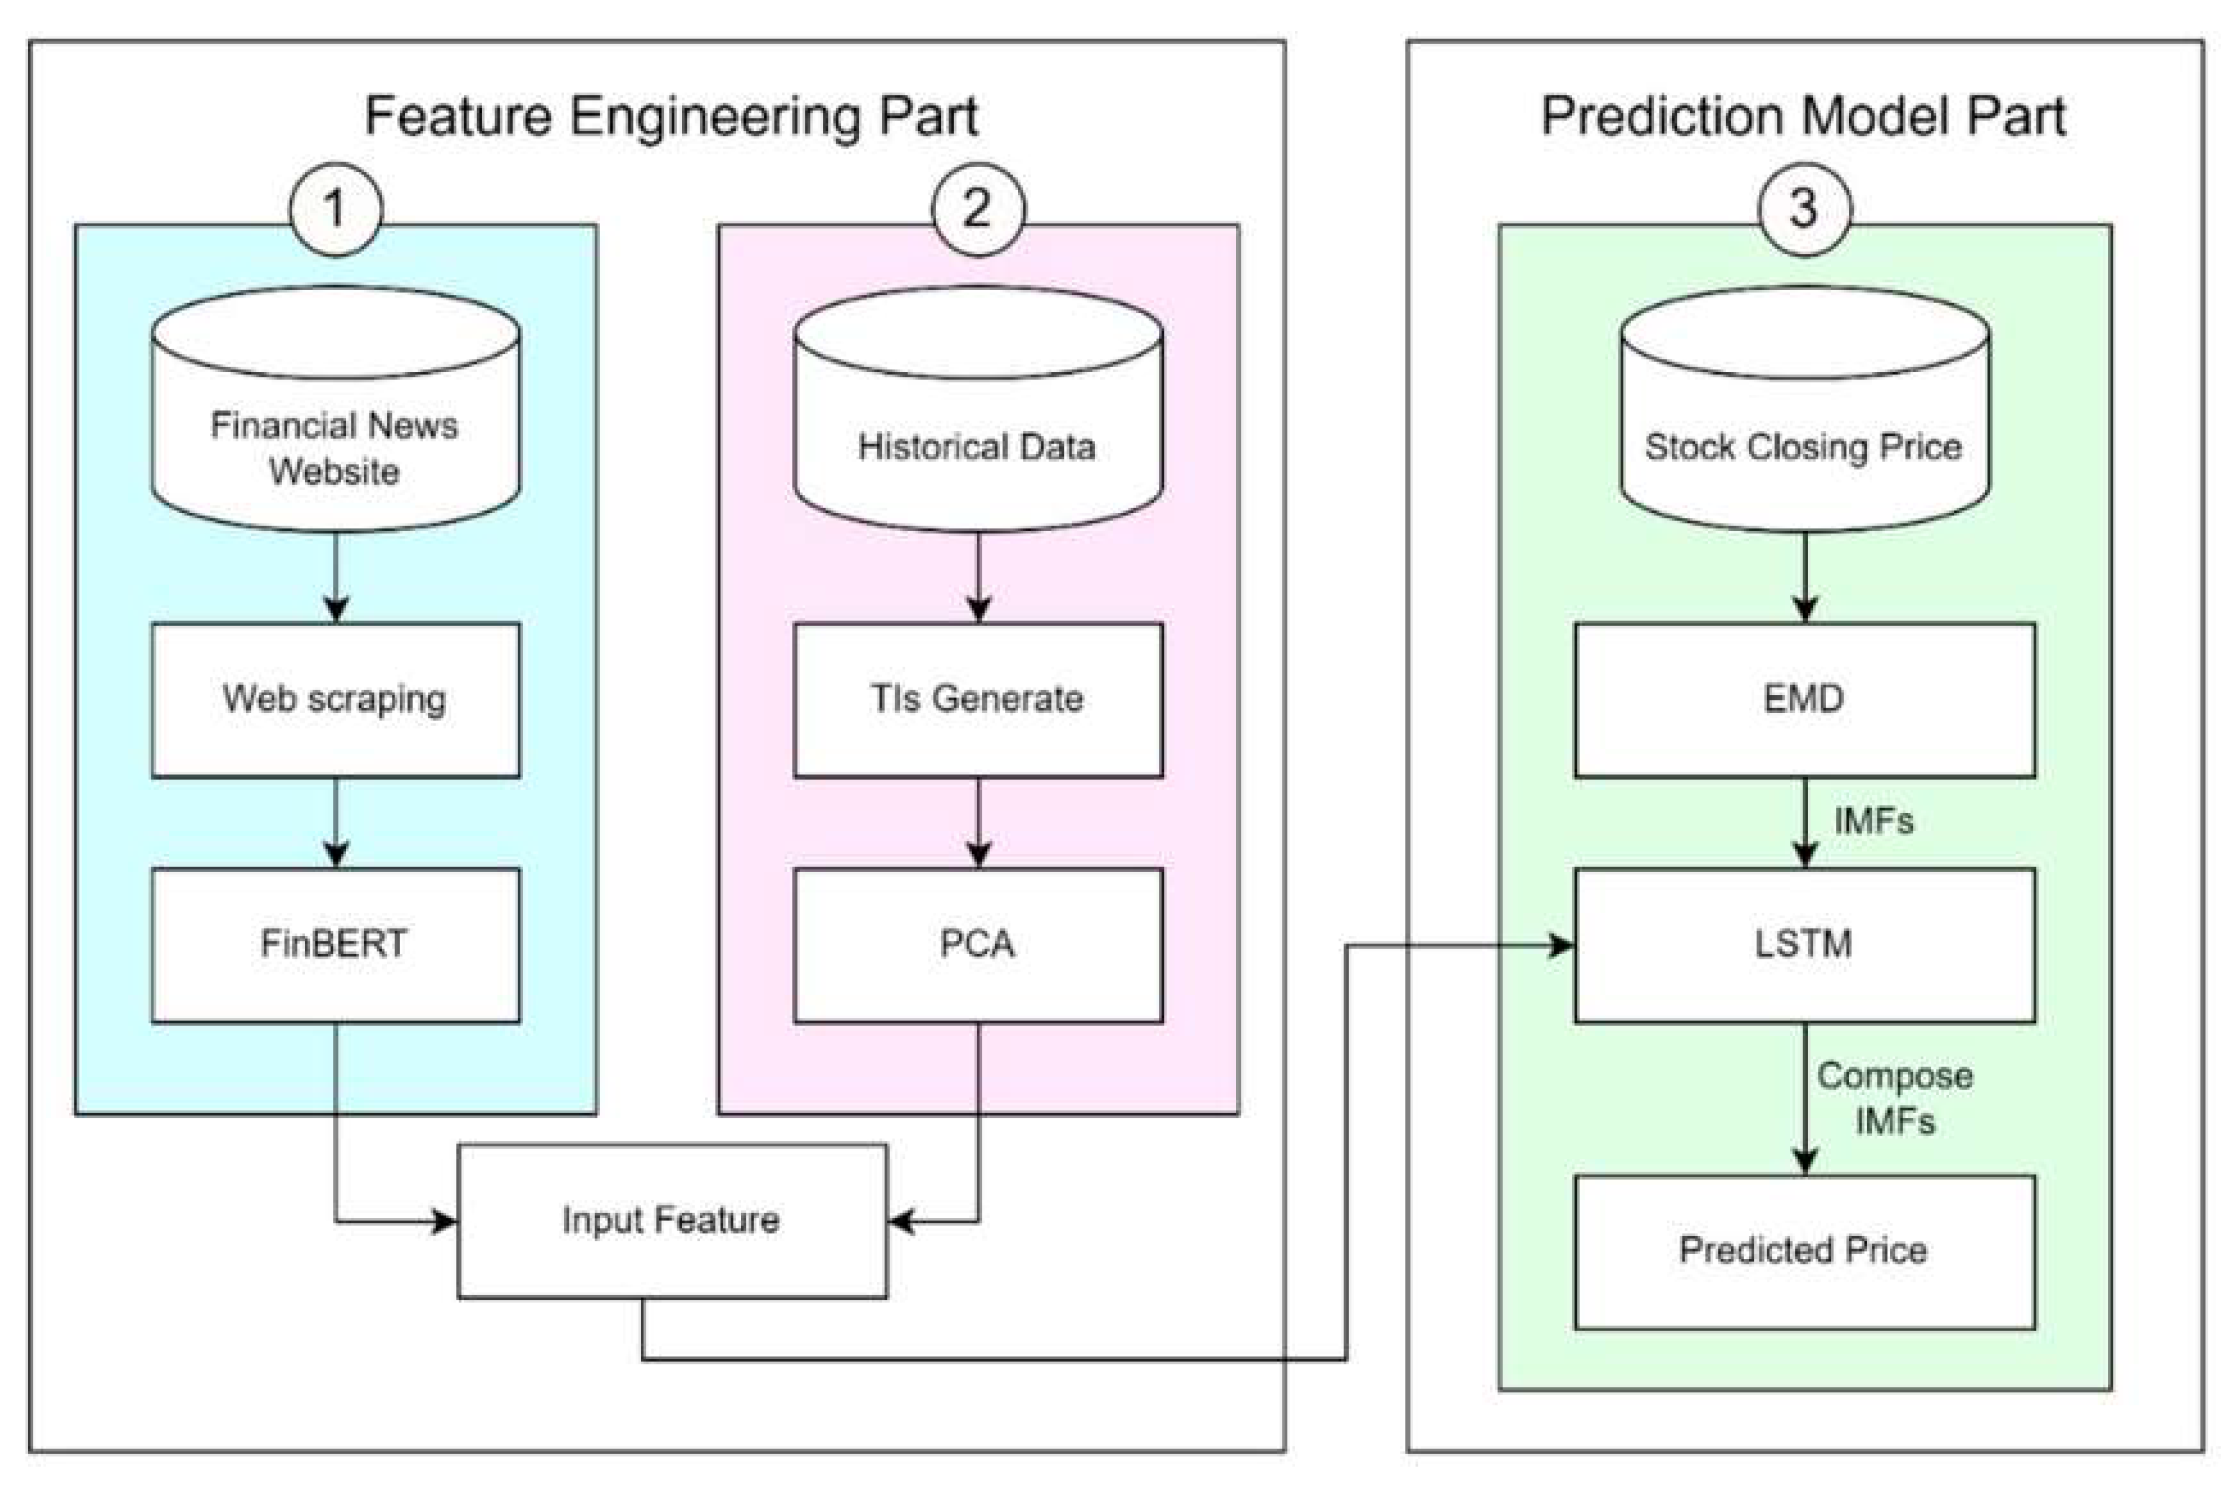
Figure 2.
Hidden market states detected by the HMM and their transition probabilities.
Disclaimer/Publisher’s Note: The statements, opinions and data contained in all publications are solely those of the individual author(s) and contributor(s) and not of MDPI and/or the editor(s). MDPI and/or the editor(s) disclaim responsibility for any injury to people or property resulting from any ideas, methods, instructions or products referred to in the content. |
© 2025 by the authors. Licensee MDPI, Basel, Switzerland. This article is an open access article distributed under the terms and conditions of the Creative Commons Attribution (CC BY) license (http://creativecommons.org/licenses/by/4.0/).
Copyright: This open access article is published under a Creative Commons CC BY 4.0 license, which permit the free download, distribution, and reuse, provided that the author and preprint are cited in any reuse.


