
Submitted:
29 October 2025
Posted:
31 October 2025
You are already at the latest version
Abstract
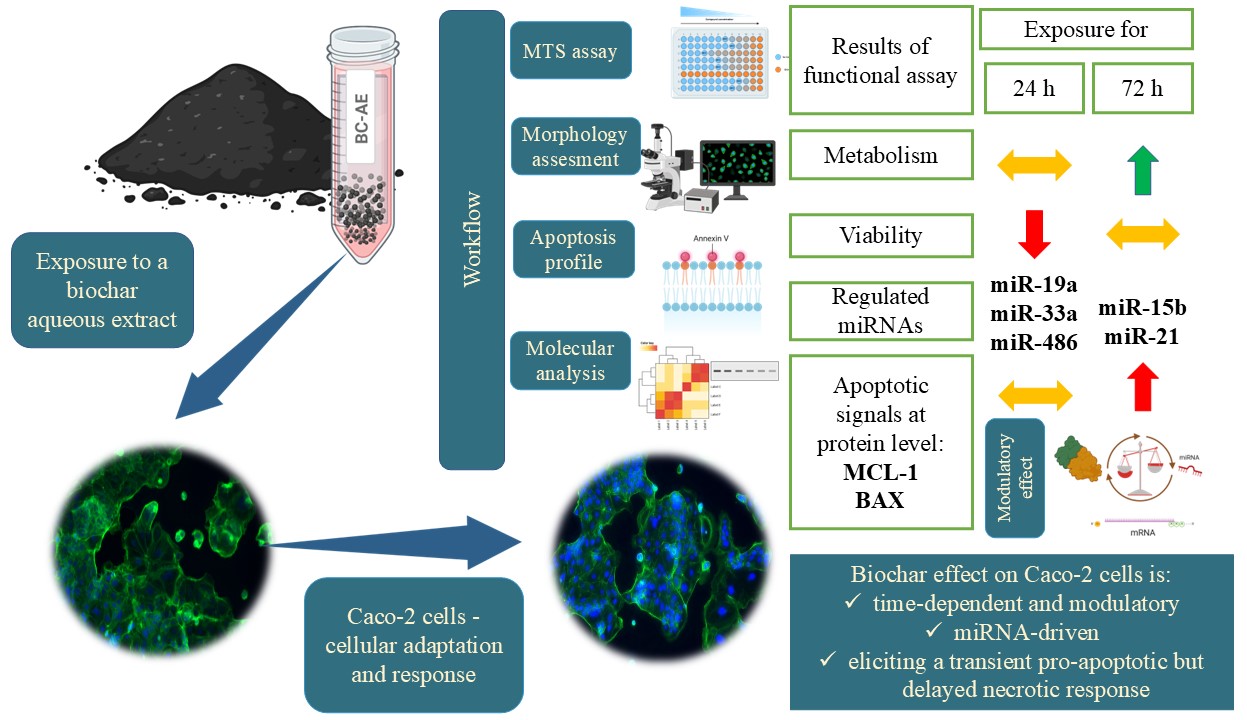
Biochar, a carbon-rich material traditionally used to improve soil health and as a feed additive, has recently attracted attention for its potential biological activity. This study investigated the effects of an aqueous biochar extract (BC-AE) on human intestinal epithelial cells (Caco-2), specifically examining its impact on cell viability and apoptosis. The metabolic activity of Caco-2 cells exposed to BC-AE was first evaluated using an MTS assay. A concentration of 3 mg/mL, which promoted Caco-2 metabolic activity, was selected for further testing at 24 and 72 hours. The effect of BC-AE on cell viability was assessed by epifluorescence microscopy (morphology) and flow cytometry (apoptosis profiling). The transcriptional response of cell viability-related genes (BAX, BAD, BCL-2, BCL-xL, MCL-1, P21, and P53) and microRNAs (miR-15b, miR-19, miR-21, miR-33a, miR-155, and miR-486) was analyzed by RT-qPCR. In parallel, selected proteins (BAD, BAX, BCL-2, and MCL-1) were examined by Western blotting. BC-AE decreased cell viability after 24 hours via late apoptosis, while 72-hour exposure increased necrosis without further viability loss. Both BAX and MCL-1 protein levels increased in Caco-2 cells after 72 hours of BC-AE treatment, and miR-15b and miR-21 were upregulated, suggesting the involvement of a regulatory mechanism controlling cell survival. The obtained findings highlight the importance of considering both concentration and exposure duration when assessing biochar bioactivity.
Keywords:
biochar
; intestinal cell model
; viability regulation
; time-dependent cellular responses
1. Introduction
Biochar, a carbon-rich material obtained from the pyrolysis of organic biomass, whether of plant or animal origin. It has gained recognition as a functional feed additive in livestock production [1,2]. Its purported benefits include improved gut health, enhanced nutrient absorption, and toxin adsorption, making it a promising candidate for biomedical applications [1,3]. Despite the growing use of biochar, its biological effects, particularly its interactions with intestinal epithelial cells, remain poorly understood, as well as its influence on proliferation and survival pathways. Emerging evidence suggests that biochar may influence molecular pathways involved in cellular homeostasis [4,5]; however, its role in regulating non-coding RNAs (ncRNAs) remains undetermined.
MicroRNAs (miRNAs), small non-coding RNAs approximately 20-24 nucleotides in length, comprise a significant class of regulatory RNAs that play essential roles in controlling gene expression and modulating various cellular functions, including proliferation, viability, and differentiation [6]. Moreover, the class of microRNAs responsive to dietary components that can be transferred through food intake has been recognized as an essential mediator of nutritional regulation, due to its involvement in intestinal homeostasis and cellular metabolic adaptation [7].
The Caco-2 cell line, widely recognized as a robust in vitro model of the human intestinal barrier, provides a valuable platform for investigating biochar influence at cellular and molecular levels [8]. The cell line is derived from human colorectal adenocarcinoma. Although this is a cancer cell line, it is applied for nutrient absorption studies and cellular metabolism analyses focused on mimicking the physiological functions of the intestinal epithelium [8,9]. Its ability to differentiate into polarized, enterocyte-like cells makes it a reliable model for investigating intestinal barrier function, transport mechanisms, and the impact of bioactive compounds on gut health [10]. While Caco-2 has been successfully used to study bioactive molecules, and food additives such as curcumin [11], resveratrol [12], and quercetin [13], its application in evaluating biochar remains largely unexplored.
Our research focused on assessing the impact of BC-AE on cellular viability, examining its potential effects on key cellular processes, including metabolic activity and the regulation of apoptosis. We determined whether aqueous biochar extracts modulate the expression of key miRNAs relevant in terms of their potential nutritional effects as well as implicated in lipid metabolism, immune function, and gut barrier integrity, i.e., miR-15b-5p, miR-19a-3p, and miR-21-5p [14,15,16].
The role of regulatory microRNAs in mediating cellular responses to biochar exposure remains largely unexplored, underscoring the need for in-depth mechanistic investigations. Addressing these knowledge gaps is crucial for determining the safety and biological relevance of biochar in various contexts, including biomedical applications, as well as livestock production, where it is used as a feed additive, particularly for species such as poultry, cattle, and swine [2,17]. In this context, evaluating how biochar-derived compounds affect fundamental cellular functions such as viability, metabolism, and gene expression is vital.
Our novel finding highlights the potential of biochar to exert regulatory effects at the molecular level, which offers new perspectives on biochar’s role beyond its physical and chemical properties. Understanding these interactions could provide valuable insights into the bioactivity of biochar and its potential applications in animal and human health.
2. Results
2.1. BC-AE Shows Low Cytotoxicity Toward Caco-2 Cells in a Screening Assay
An MTS assay was performed on Caco-2 cells to evaluate the cytotoxicity and metabolic effects of varying BC-AE concentrations (Figure 1). Cell viability and metabolic activity were monitored over time. Analysis of BC-AE’s influence on the metabolic activity of Caco-2 cells showed its low cytotoxicity. No dose- and time-dependent response was observed. The BC-AE improved the metabolism of Caco-2 cells at doses of 2-, 3-, and 4 mg/mL. The effect was noted after 72 hours. Nevertheless, statistically significant improvement was observed only in cultures treated with 3 mg/mL of BC-AE (Figure 1). Consequently, this concentration was selected for subsequent functional assays.
2.2. Functional Assays—Analysis of Effects of a 3 mg/mL Biochar Aqueous Extract (BC-AE) on Caco-2 Activity
BC-AE maintains Caco-2 cell morphology and structure, but long-term treatment may gradually impact their growth pattern
Cell morphology was monitored using both phase contrast and epifluorescence microscopy to assess structural integrity and growth patterns under the influence of BC-AE at a concentration of 3 mg/mL (Figure 2). The morphology of Caco-2 cells was characteristic, typical of epithelial-origin cell lines, with a polygonal shape in control cultures. After 24 hours of BC-AE treatment, no significant morphological alterations were observed in Caco-2 cultures. Interestingly, BC-AE-treated colonies appeared more developed than those of the untreated controls, suggesting a possible stimulatory effect during early exposure.
After 72 hours of treatment, distinct changes in overall culture appearance and growth dynamics were observed. Treated cells failed to establish a continuous monolayer, and cell colony expansion was noticeably reduced compared to the control group. Despite these alterations, no overt signs of cytotoxicity, such as cell shrinkage, detachment, or membrane blebbing, were detected.
Microscopic observations suggest that prolonged exposure to BC-AE may exert a mild inhibitory effect on cell proliferation or colony formation (Figure 2). Overall, the data indicate that while BC-AE does not disrupt the structural morphology or integrity of Caco-2 cells, it may influence their growth dynamics over time.
2.3. BC-AE Temporarily Regulates the Dynamics of Apoptosis and Necrosis in Caco-2 Cells
Annexin V/PI staining was used to assess the impact of BC-AE (3 mg/mL) on Caco-2 cell viability, allowing for the distinction between apoptotic and necrotic cells (Figure 3).
The viability of Caco-2 cells after 24-hour treatment with BC-AE decreased, which was associated with an increase in late apoptotic cells (Figure 3a,c–g). No noticeable effect on cells viability was observed for cultures treated with BC-AE for 72 hours, and apoptosis was not induced. Nonetheless, in those cultures, a significant increase in the population of necrotic cells was noticed (Figure 3b–g). Interestingly, the 72h treatment with BC-AE resulted in a decrease in late and total apoptosis, noted at the early stage of treatment, i.e., after 24 hours (Figure 3).
2.4. BC-AE Modulates the Endogenous Levels of Survival-Related miRNAs
To assess the impact of BC-AE on endogenous expression of selected (based on literature) miRNAs in Caco-2 cells, RT-qPCR analysis was performed following 24- and 72-hour treatments. This approach enabled the evaluation of the temporal dynamics and specificity of miRNA regulation. RT-qPCR measurement of endogenously accumulated miRNAs showed that BC-AE significantly increases the levels of miR-19a, miR-33a-5p, and miR-486-3p after 24 hours (Figure 4b,d,f, respectively). The levels of miR-15 b-5p and miR-21-5p were not affected by BC-AE treatment after 24 hours (Figure 4a,c). In cultures treated for 72h, the levels of miR-15b-5p and miR-21-5p were significantly upregulated (Figure 4a,c), while miR-19a-3p, miR-33a-5p, and miR-486-3p did not alter significantly (Figure 4b,d,f).
2.5. BC-AE May Trigger Anti-Apoptotic Signals at the mRNA and Protein Levels
To further explore the molecular mechanisms underlying the observed effects of BC-AE on cell viability, we investigated its impact on mRNA expression of common biomarkers associated with cellular viability using RT-qPCR at two time points. The gene expression analysis of well-known factors related to cell survival regulation revealed that pro-apoptotic BAX and anti-apoptotic BCL-2 are not directly affected by BC-AE treatment (Figure 5a,d). However, the relative accumulation of BAX/BCL-2 mRNAs was significantly decreased (Figure 6c), suggesting the activation of anti-apoptotic signals. This effect, noted after 24 hours, is also associated with a significant decrease in mRNA levels for the pro-apoptotic Bcl-2-associated death protein, i.e., BAD molecule (Figure 5b). Transcript levels of the anti-apoptotic BCL-xL, MCL-1, and P21 genes were not significantly changed after 24 hours (Figure 5e,f,h). The mRNA levels of all tested genes remained unchanged after 72 hours of treatment, except for MCL-1 and P53, whose levels decreased significantly (Figure 5f,g).
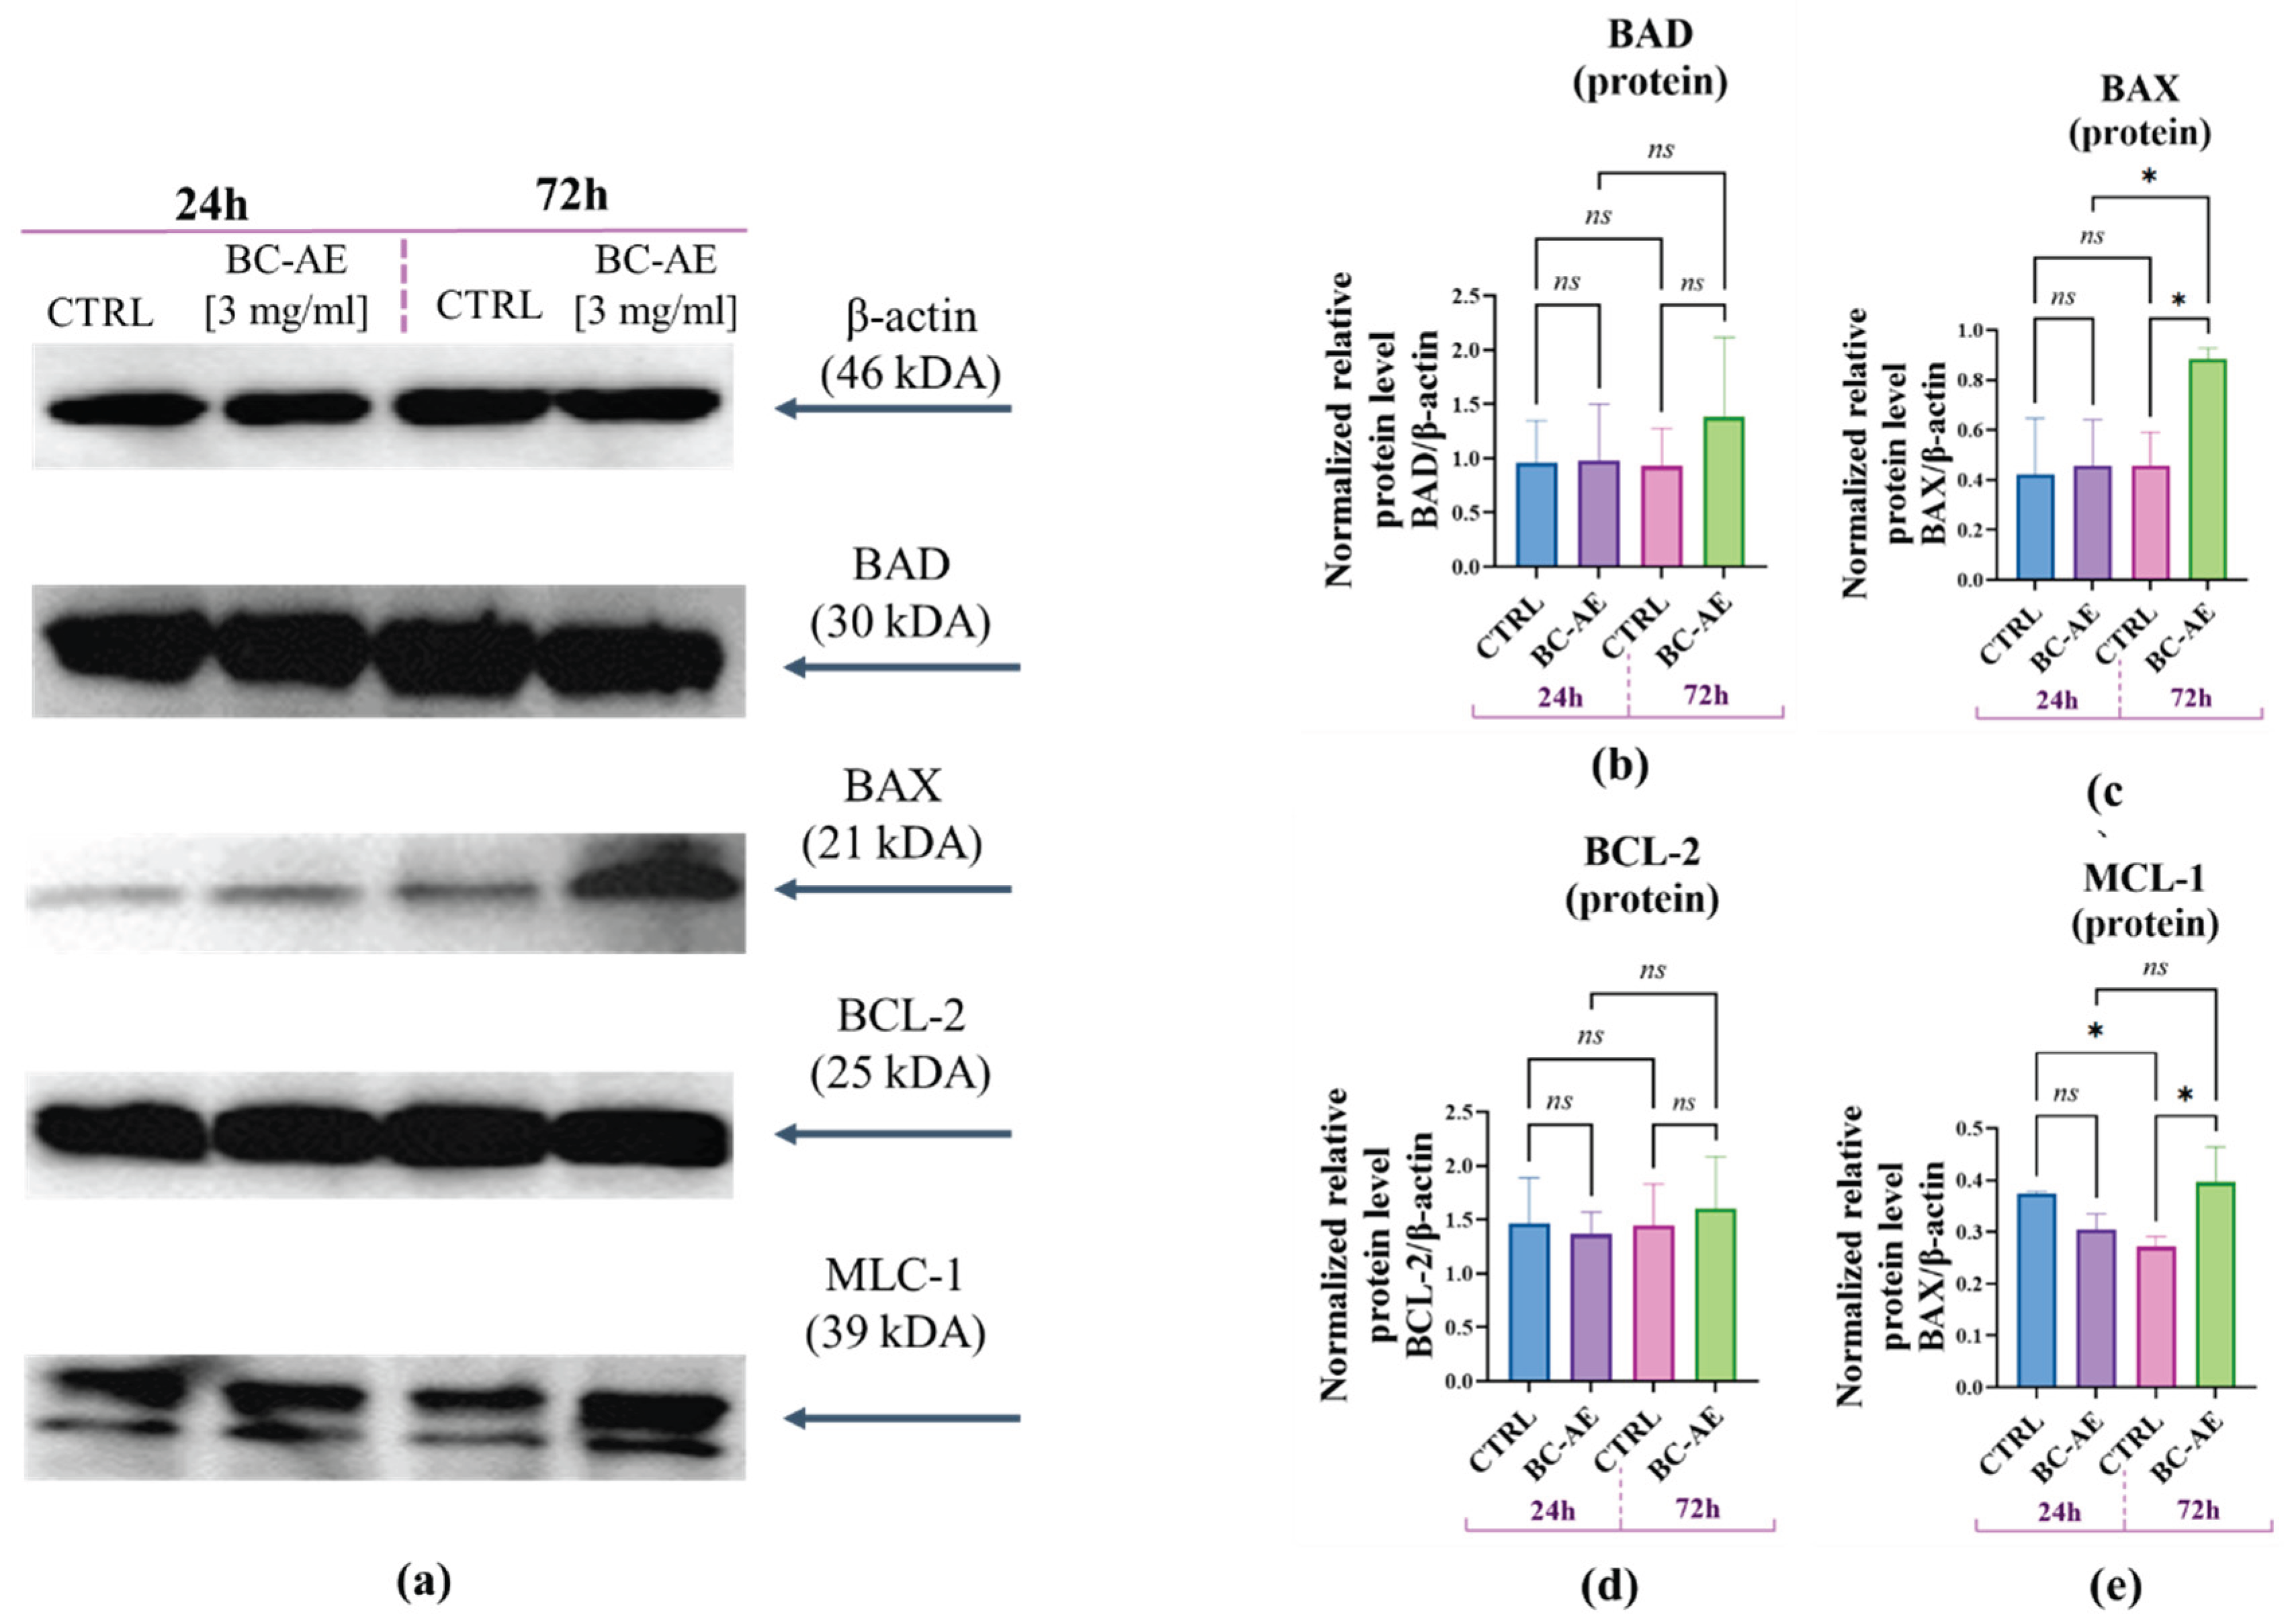
To investigate the molecular pathways through which BC-AE influences Caco-2 viability, Western blot analysis was used to examine the expression of key apoptosis-related proteins at 24 and 72 hours following BC-AE treatment (Figure 6). BC-AE did not affect the intracellular accumulation of BAD, BAX, BCL-2, or MCL-1 proteins after 24 hours of treatment (Figure 6b–e). However, after 72 hours, a significant increase in the expression levels of both pro-apoptotic BAX (Figure 6c) and anti-apoptotic MCL-1 (Figure 6e) proteins was detected, suggesting a time-dependent regulatory effect on apoptotic signaling pathways. Interestingly, a decrease in MCL-1 expression was observed in the control cultures over time, which may reflect natural regulatory processes or cellular stress responses occurring independently of BC-AE treatment (Figure 6e).
3. Discussion
Biochar is a carbon-rich material increasingly used in sustainable agriculture, for example, as a dietary supplement in poultry production, due to its capacity to enhance gut health and nutrient absorption [2,17,24]. The present study provides novel insights into the biological activity of biochar-aqueous extract (BC-AE), demonstrating its modulatory effects on cellular metabolism and apoptosis-related signaling pathways. We showed that biochar exhibits low cytotoxicity toward Caco-2 cells, but its biological effects may result from time-dependent interactions with cellular processes, including the initial stimulation of metabolism and maintenance of morphology.
The well-known biochar’s functional role is related to its high porosity and adsorption capacity as well as its ability to modulate the gut microbiome, which may impact nutrient absorption and immune function [2,25]. In the current study, we aimed to explore the bioactive potential of biochar beyond its physical and chemical properties, focusing on its role in modulating the expression of pro-apoptotic and anti-apoptotic genes at the mRNA and protein level. We also explored biochar as a potential regulator of miRNA levels.
Our screening assay indicated that biochar has low cytotoxicity and, at a concentration of 3 mg/mL, may enhance cellular metabolism. This observation aligns with previous studies where biochar displayed minimal cytotoxic effects across various in vitro models, even at relatively high concentrations. An in vitro study using NIH 3T3 mouse fibroblasts, performed by Sigmund et al. (2017), demonstrated that biochar induces a concentration-dependent cytotoxic response, with EC10 values decreasing over time, indicating an increase in toxicity with prolonged exposure [26]. Our results are also consistent with research on plant-derived extracellular vesicles and RNA-containing molecules, which have been shown to modulate host cellular functions [27].
The studies focusing on the molecular mechanisms of biochar action are scarce. Thus, our study further concentrated on functional assays designed to explore how BC-AE interacts with key regulatory apoptotic proteins. We found that BC-AE not only affects cell metabolism but also influences intracellular signaling at the epigenetic level. Specifically, BC-AE modulated the expression of apoptosis-regulating genes, most notably reducing the BAX/BCL-2 ratio and downregulating BAD expression at 24 hours, suggesting a shift toward an anti-apoptotic state. These effects were accompanied by increased expression of survival-related miRNAs, such as miR-19a, miR-33a, and miR-486, which may further contribute to enhanced cell viability by promoting pro-survival signaling pathways [28]. Notably, miR-486 also plays an oncosuppressive role in colorectal cancer [29]; therefore, the data obtained in this study may indicate that BC-AE exerts anti-cancer activity in the Caco-2 cell line by targeting key regulators of apoptosis and cell proliferation.
Actually, while short-term exposure (24 hours) promoted cellular metabolism and did not alter Caco-2 morphology, prolonged exposure (72 hours) led to significant changes in the cellular architecture of Caco-2, characterized by disrupted monolayer formation compared to the control culture. The obtained data are consistent with the findings of Sigmund et al., who demonstrated that the cytotoxicity of biochar may be linked to its effects on cell morphology. However, in their study, this effect was strictly dependent on the concentration of biochar and became apparent only after 48 hours of exposure [26].
The sustained presence of BC-AE may shift the cellular balance toward apoptosis and necrosis, possibly due to cumulative cellular stress and a regulatory network associated with miRNA. At 72 hours, there was a marked upregulation of miR-15b and miR-21, both of which are known to be involved in regulating apoptosis [30,31]. The miR-15/16 family is known for its pro-apoptotic role, primarily through the downregulation of anti-apoptotic genes, such as BCL-2 [30]. At the same time, miR-15b-5p has been shown to function as a tumor suppressor in hepatocellular carcinoma (HCC) by promoting endoplasmic reticulum stress, inducing apoptosis, and inhibiting cell proliferation through the downregulation of its target gene, Rab1 [32].
Notably, miR-21, also regulated by BC-AE, is well-documented for its role in cell proliferation and survival [30]. In particular, it has been shown to suppress the viability, migration, and invasion of esophageal cancer cells, thereby enabling their apoptosis by inhibiting the PI3K/AKT signaling pathway, a key regulator of cell survival and proliferation [33]. On the other hand, miR-21, often described as an oncogenic microRNA (oncomiR), is known to be upregulated in colorectal cancer and associated with tumor aggressiveness, promoting cell survival and proliferation by targeting tumor suppressor genes and modulating apoptosis-related proteins [34]. Consequently, miR-21a has context-dependent roles that may tilt the balance toward apoptosis under certain stress conditions [35,36].
As it comes to protein expression, although the mRNA analysis did not reveal significant transcriptional upregulation of apoptosis-related genes, we observed increased protein levels of BAX and MCL-1 at 72 hours. This finding suggests that, similarly to miRNA factors, proteins involved in pro- and antiapoptotic pathways also undergo complex modulation under the BC-AE treatment. According to some reports, MCL-1 blocks the progression of apoptosis by binding and sequestering the pro-apoptotic proteins, including BAX, which are capable of forming pores in the mitochondrial membrane [37]. Cytochrome c, released this way into the cytoplasm, induces the activation of caspases, which largely contribute to the macromolecular degradation observed during apoptosis. Inhibition of the pro-apoptotic BAX function by anti-apoptotic MCL-1 has also been reported by other authors, although direct interaction between the two proteins was not required in this case [38]. Given that BAX is a pro-apoptotic protein that promotes cell death, while MCL-1 is an anti-apoptotic protein that supports cell survival, their concurrent upregulation suggests a complex and potentially compensatory cellular response to stress or damage, possibly reflecting the interplay between pro-apoptotic (e.g., miR-15 b-mediated) and pro-survival (e.g., miR-21-mediated) signaling pathways under BC-AE exposure. Additionally, while BAX upregulation is typically associated with apoptosis, its excessive or dysregulated activation in the absence of effective apoptotic execution can promote necrotic cells [39], as observed in Caco-2 cultures after 72 hours of treatment. Concurrently, elevated MCL-1 expression may represent a compensatory survival response, also shifting the balance from apoptosis toward necrosis [40].
The obtained findings highlight the dynamic and time-dependent nature of BC-AE’s biological activity, underscoring the need to consider both concentration and exposure duration when evaluating its safety and potential therapeutic applications. Our study demonstrates that BC-AE modulates functional miRNAs that can regulate cellular metabolism and apoptosis in Caco-2 cells. We showed that short-term exposure enhances metabolic activity, supports proper cell morphology, but increases apoptosis occurrence. In contrast, prolonged exposure leads to necrosis accompanied by the upregulation of pro-apoptotic microRNAs and apoptosis-related proteins.
Moreover, the regulation of so-called nutri-miRs driven by BC-AE may also suggest a novel pathway through which biochar-based products might interact with host cells, influencing gene expression and cellular responses. Indeed, the concept of nutri-miRNA, i.e., diet-derived microRNAs capable of regulating gene expression in host organisms, has recently attracted considerable scientific interest and is now widely studied as a promising research topic in the fields of both nutrition and epigenetics [7,16,41].
While our findings point to these intriguing molecular interactions, they represent only an initial step toward understanding the complex bioactivity of BC-AE and its mechanism of action. Further studies are essential to fully unravel the underlying mechanisms and determine biochar relevance in more physiologically relevant models. However, our study is the first attempt to understand the multifaceted nature of BC-AE’s bioactivity and reveals it in a model of human intestinal epithelial cells (Caco-2).
4. Materials and Methods
4.1. Cell Line
The Caco-2 cell line, derived from human colon carcinoma, was acquired from the American Type Culture Collection (ATCC; HTB-37TM). Cells used for the experiment were established at the 12th passage. Previously developed protocols were employed for culture propagation [18]. In detailes, Caco-2 cells were cultured and grown in a 75 cm2 flask at 37 °C in an incubator with 95% humidity and 5% CO2. The basal growth medium, Eagle’s Minimum Essential Medium (EMEM), was supplemented with 10% fetal bovine serum (FBS) and 1% antibiotics penicillin/streptomycin solution (Sigma Aldrich, Munich, Germany). The complete growth medium (CGM) was changed in cultures every two days. The passage was performed when cells reached approximately 80%-90% confluence, and the procedure was carried out using a trypsin solution (TrypLETM Express; Thermo Fisher Scientific, Warszawa, Poland) according to the manufacturer’s instructions.
4.2. Preparation of Biochar Aqueous Extracts (BC-AE)
The biochar used in our experiment was produced from wheat straw by heating it at 600 °C for 4 hours in an anaerobic environment. Biochar was produced from beech and oak wood chips. The chips were ground, sieved, and then dried for 24 hours at a temperature of 105 °C. The resulting material was subsequently subjected to pyrolysis in a muffle furnace at 600 °C for a holding time of 240 minutes. A detailed characterization of the investigated biochar was described by us previously [19].
The Biochar Aqueous Extract (BC-AE) was prepared using the method described by Martínez-Gómez et al. [20]. Twenty-four hours before the experiment, biochar was soaked in a complete culture medium for in vitro assays. The stock solutions were prepared at a concentration of 20 mg/mL. The mixture was shaken continuously in the shaking incubator at 100 rpm and incubated overnight at 20 °C. The obtained mixture was centrifuged for 15 min at 4,000 × g, and the supernatant was filtered through a 0.22 μm syringe filter. The aqueous extract obtained during the filtration process was directly used for the assays.
4.3. In Vitro Evaluation of Biochar Activity Using the Caco-2 Cell Model
The metabolic activity of Caco-2 was monitored using an MTS assay (Abcam, Cambridge, UK). The test was performed on semi-confluent Caco-2 cells (70-80% of confluency). Cells were seeded at a density of 1.2 × 10³ cells per well on a 96-well plate and cultured in 200 μL of CGM. Before the assay, cells were pre-cultured for 24 hours in a CO2 incubator. Then, the complete growth medium (CGM) was replaced with BC-AE at concentrations of 0.5, 1, 2, 3, 4, 5, 6, 8, and 10 mg/mL. The metabolism of Caco-2 was determined after 24, 48, and 72 h of their propagation in the presence of BC-AE. The metabolic activity of cells was determined by adding 20 μL of MTS solution per well, followed by incubation with the dye for 2 hours at 37 °C in a CO2 incubator. Absorbance was measured spectrophotometrically with a plate reader (Spark®, Tecan, Männedorf, Switzerland) at a wavelength of 490 nm. The acquired results were background-corrected and analyzed. All values were normalized to control cultures to determine the metabolic factor (MF) as described previously.
4.4. Functional In Vitro Assay—In-Depth Evaluation of BC-AE Influence on Caco-2 Viability
For the functional experiments, Caco-2 cells were inoculated at a density of 1.5 × 10⁴ cells/cm2. Based on a screening assay for functional analysis, the BC-AE was used at a concentration of 3 mg/mL, and cells were treated with BC-AE for 24 hours and 72 hours. Cells were cultured in the same manner as described above. The morphology of cells was monitored under an inverted microscope (Primo Vert, Zeiss), equipped with an Axiocam 208 camera (Zeiss, Oberkochen, Germany) to evaluate changes in the growth pattern and morphology of Caco-2 cells treated with BC-AE. After the experiment, cells were harvested for molecular biology assays.
4.5. Evaluation of Gene Expression Patterns Modulated by BC-AE
The total RNA was isolated from Caco-2 cells using the phenol-chloroform method [21], applying previously described protocols [18]. RNA was isolated from 1×10⁶ cells, which were homogenized with 1 mL of TRI Reagent® (Merck, Poznań, Poland). The quality and quantity of the isolated RNA were assessed spectrophotometrically using the DS-11 Fx DeNovix NanoSpectrophotometer (Wilmington, DE, USA). Before the reverse transcription, the RNA preparations (1 μg) were purified from genomic DNA by DNase I treatment (Thermo Fisher Scientific, Warsaw, Poland). The cDNA synthesis was performed using the Tetro cDNA Synthesis Kit (Bioline Reagents Limited, London, UK) and the Mir-X™ miRNA First-Strand Synthesis Kit (Takara Clontech Laboratories, Biokom, Poznań, Poland) for gene expression and miRNA level detection, respectively. The RNA purification, gDNA elimination, and reverse transcription were carried out using a T100 Thermal Cycler (Bio-Rad, Hercules, CA, USA). The obtained cDNA was used as a template for quantitative PCR (qPCR), and transcript accumulation was monitored in real-time. The qPCRs were conducted with the SensiFast SYBR & Fluorescein Kit (Bioline Reagents Ltd.) on a CFX OPUS 384 System (Bio-Rad, Hercules, CA, USA). The total volume of the reaction mixture was 10 µl, the concentration of primers in each reaction was 400 nM (for mRNA detection) and 200 nM (for miRNA detection), while cDNA did not exceed 1% of the mix. The Cq values were normalized to ACTB and GAPDH for mRNA and U6 snRNA for miRNA. Average gene expression fold changes were calculated using the 2−ΔΔCt method and RQMAX algorithm as described previously [22]. Primer sequences and details are provided in Supplementary Tables S1 and S2.
4.6. Evaluation of Cellular Morphology Modulated by BC-AE
To evaluate changes in Caco-2 morphology after BC-AE treatment, the experimental cultures were rinsed with HBSS and fixed using ice-cold 4% paraformaldehyde (PFA; Sigma-Aldrich/Merck Life Science Sp. z o.o., Poznan, Poland). The cultures were fixed for 15 minutes at room temperature, then left overnight at 4 °C to ensure complete fixation. Following fixation, the samples were carefully washed three times with HBSS containing 1% fetal bovine serum (FBS) to eliminate any remaining fixative. To facilitate intracellular staining, cell membranes were permeabilized by exposing the cultures to a 0.1% Triton X-100 solution prepared in HBSS for 15 minutes at room temperature. Cellular cytoskeletal actin filaments were stained with Atto-488-conjugated phalloidin (Sigma-Aldrich/Merck Life Science Sp. z o.o., Poznan, Poland) diluted 1:800 in HBSS. The cells were exposed to the dye for 40 minutes at room temperature in the dark. To visualize nuclei, Caco-2 cells were counterstained with 4′, 6-diamidino-2-phenylindole dihydrochloride (DAPI) in mounting medium (ProLong™ Diamond Antifade Mountant with DAPI, Thermo Fisher Scientific, Warsaw, Poland). The protocol employed in this study was established in our earlier work [23]. The cell morphology and ultrastructure were analyzed using epifluorescence microscopy (Leica DMI8, Wetzlar, Germany) at 20-fold magnification, with images captured by a Leica K3M camera (Wetzlar, Germany). The analysis employed three fluorescence channels for (i) DAPI (excitation at 353 nm, emission at 465 nm), (ii) phalloidin (excitation at 493 nm, emission at 517 nm), and (iii) incorporated biomaterials (excitation at 590 nm, emission at 618 nm).
4.7. Evaluation of Apoptotic Activity Modulated by BC-AE
Apoptosis was assessed using flow cytometry with the Dead Cell Apoptosis Kit and Annexin V for Flow Cytometry (Thermo Fisher Scientific, Warsaw, Poland). A total of 1×10⁵ cells were harvested and stained according to the manufacturer’s instructions. Following staining, a minimum of 1×10⁴ cells per sample were analyzed on a CytoFLEX flow cytometer (Beckman Coulter, CA, USA). Annexin V-FITC and propidium iodide staining allowed for the clear differentiation of live, apoptotic, and necrotic cells. Data acquisition and analysis were performed using CytExpert software (version 2.4, Beckman Coulter, CA, USA), ensuring consistent gating strategies and compensation settings for reliable results.
4.8. Evaluation of Protein Expression Modulated by BC-AE
Western blotting was performed following our previously established protocol [23] to identify intracellular proteins. After the experiment, Caco-2 cells were lysed in ice-cold RIPA buffer with 1% protease and phosphatase inhibitors. Protein concentrations were determined using the Pierce BCA Assay (Thermo Fisher Scientific, Warsaw, Poland). Samples were normalized to 10 µg protein, denatured at 95 °C for 5 minutes in 4× Laemmli buffer, and separated on 15% SDS-PAGE at 100 V for 90 minutes. Proteins were transferred onto a PVDF membrane (100 V, 60 minutes) and blocked with 5% skim milk in TBS-T (Bio-Rad, Warsaw, Poland). Membranes were incubated overnight at 4 °C with primary antibodies and then washed with TBS-T. Afterward, membranes were incubated with secondary antibodies for 60 minutes at room temperature and washed again. Chemiluminescent signals were detected using the Bio-Rad ChemiDoc™ XRS system with Pierce ECL substrate and analyzed with Image Lab™ Software (Bio-Rad, Warsaw, Poland). Antibody details are provided in Supplementary Table S3.
4.9. Statistical Analysis
The results are presented as means with standard deviations (±SD). Each experiment was performed in three independent experiments and with at least three technical replicates. Comparative statistical analyses were conducted using one-way analysis of variance (ANOVA), followed by Tukey’s post hoc test for multiple comparisons. All statistical calculations were performed using GraphPad Prism version 10.0 (GraphPad Software, San Diego, CA, USA). Differences were considered statistically significant at p < 0.05
Supplementary Materials
The following supporting information can be downloaded at the website of this paper posted on Preprints.org, Table S1. Primer sequences used for the detection of miRNA expression, including the characteristic, i.e., gene abbreviation, primer sequence (5′-3′), and annealing temperature; Table S2. Primer sequences used for the detection of mRNA expression, including the characteristic, i.e., transcript full name, gene abbreviation, primer sequence (5′-3′), locus, product length, annealing temperature, and reference number to the gene base; Table S3. List of primary antibodies used for protein detection, including protein name, abbreviation, dilution, product number, and supplier company.
Author Contributions
Conceptualization, S.A. and A.S.; methodology, S.A. and A.S.; validation, A.S.; formal analysis, A.S.; investigation, S.A. and K.M.; resources, A.S.; data curation, S.A. and A.S.; writing—original draft preparation, S.A. and A.S.; writing—review and editing, S.O. and M.W.; visualization, S.A. and A.S.; supervision, A.S., S.O., and M.W.; project administration, A.S.; funding acquisition, S.O. All authors have read and agreed to the published version of the manuscript.
Funding
The work was carried out as part of the research project OPUS-24 entitled “Biochar in the diet of laying hens and the expression of genes and proteins affecting the structure and physicochemical properties of eggs”, which was funded by the National Science Centre based on contract UMO-2022/47/B/NZ9/02182 dated August 1, 2023.
Data Availability Statement
Dataset available on request from the authors.
Conflicts of Interest
The authors declare no conflicts of interest.
References
- Zhao, M.; Zhong, S.; Zhou, X.; Yu, Z. Biochar Derived from Animal and Plant Facilitates Synergistic Transformation of Heavy Metals and Phosphorus in Sewage Sludge Composting. Environ Pollut 2024, 357, 124396. [Google Scholar] [CrossRef]
- Schmidt, H.-P.; Hagemann, N.; Draper, K.; Kammann, C. The Use of Biochar in Animal Feeding. PeerJ 2019, 7, e7373. [Google Scholar] [CrossRef]
- Osman, A.I.; Fawzy, S.; Farghali, M.; El-Azazy, M.; Elgarahy, A.M.; Fahim, R.A.; Maksoud, M.I.A.A.; Ajlan, A.A.; Yousry, M.; Saleem, Y.; et al. Biochar for Agronomy, Animal Farming, Anaerobic Digestion, Composting, Water Treatment, Soil Remediation, Construction, Energy Storage, and Carbon Sequestration: A Review. Environ Chem Lett 2022, 20, 2385–2485. [Google Scholar] [CrossRef]
- Jaiswal, A.K.; Alkan, N.; Elad, Y.; Sela, N.; Philosoph, A.M.; Graber, E.R.; Frenkel, O. Molecular Insights into Biochar-Mediated Plant Growth Promotion and Systemic Resistance in Tomato against Fusarium Crown and Root Rot Disease. Sci Rep 2020, 10, 13934. [Google Scholar] [CrossRef]
- Yang, Y.; Ahmed, W.; Wang, G.; Ye, C.; Li, S.; Zhao, M.; Zhang, J.; Wang, J.; Salmen, S.H.; Wu, L.; et al. Transcriptome Profiling Reveals the Impact of Various Levels of Biochar Application on the Growth of Flue-Cured Tobacco Plants. BMC Plant Biol 2024, 24, 655. [Google Scholar] [CrossRef]
- Millar, A.A.; Waterhouse, P.M. Plant and Animal microRNAs: Similarities and Differences. Funct Integr Genomics 2005, 5, 129–135. [Google Scholar] [CrossRef]
- Zhang, L.; Chen, T.; Yin, Y.; Zhang, C.-Y.; Zhang, Y.-L. Dietary microRNA-A Novel Functional Component of Food. Adv Nutr 2019, 10, 711–721. [Google Scholar] [CrossRef]
- Lopez-Escalera, S.; Wellejus, A. Evaluation of Caco-2 and Human Intestinal Epithelial Cells as in Vitro Models of Colonic and Small Intestinal Integrity. Biochem Biophys Rep 2022, 31, 101314. [Google Scholar] [CrossRef] [PubMed]
- Ran, R.; Muñoz Briones, J.; Jena, S.; Anderson, N.L.; Olson, M.R.; Green, L.N.; Brubaker, D.K. Detailed Survey of an in Vitro Intestinal Epithelium Model by Single-Cell Transcriptomics. iScience 2024, 27, 109383. [Google Scholar] [CrossRef]
- Lea, T. Caco-2 Cell Line. In The Impact of Food Bioactives on Health: in vitro and ex vivo models; Verhoeckx, K., Cotter, P., López-Expósito, I., Kleiveland, C., Lea, T., Mackie, A., Requena, T., Swiatecka, D., Wichers, H., Eds.; Springer: Cham (CH), 2015 ISBN 978-3-319-15791-7.
- Zhou, X.; Ren, M.; Yang, J.; Pan, H.; Yu, M.; Ji, F. Curcumin Improves Epithelial Barrier Integrity of Caco-2 Monolayers by Inhibiting Endoplasmic Reticulum Stress and Subsequent Apoptosis. Gastroenterol Res Pract 2021, 2021, 5570796. [Google Scholar] [CrossRef]
- Kaldas, M.I.; Walle, U.K.; Walle, T. Resveratrol Transport and Metabolism by Human Intestinal Caco-2 Cells. J Pharm Pharmacol 2003, 55, 307–312. [Google Scholar] [CrossRef] [PubMed]
- Amasheh, M.; Schlichter, S.; Amasheh, S.; Mankertz, J.; Zeitz, M.; Fromm, M.; Schulzke, J.D. Quercetin Enhances Epithelial Barrier Function and Increases Claudin-4 Expression in Caco-2 Cells. J Nutr 2008, 138, 1067–1073. [Google Scholar] [CrossRef]
- Agbu, P.; Carthew, R.W. MicroRNA-Mediated Regulation of Glucose and Lipid Metabolism. Nat Rev Mol Cell Biol 2021, 22, 425–438. [Google Scholar] [CrossRef]
- Yu, B.; Liu, J.; Cai, Z.; Mu, T.; Zhang, D.; Feng, X.; Gu, Y.; Zhang, J. MicroRNA-19a Regulates Milk Fat Metabolism by Targeting SYT1 in Bovine Mammary Epithelial Cells. Int J Biol Macromol 2023, 253, 127096. [Google Scholar] [CrossRef]
- Chodur, G.M.; Steinberg, F.M. Human MicroRNAs Modulated by Diet: A Scoping Review. Adv Nutr 2024, 15, 100241. [Google Scholar] [CrossRef]
- Latack, B.C.; Carvalho, P.H.V.; Moura, G.A.B.; Zinn, R.A. Influence of Biochar Supplementation on Comparative Growth Performance and Carcass Characteristics of Angus × Holstein vs. Charolais × Holstein Calf-Fed Steers. J Anim Sci 2025, 103, skaf113. [Google Scholar] [CrossRef] [PubMed]
- Śmieszek, A.; Giezek, E.; Chrapiec, M.; Murat, M.; Mucha, A.; Michalak, I.; Marycz, K. The Influence of Spirulina Platensis Filtrates on Caco-2 Proliferative Activity and Expression of Apoptosis-Related microRNAs and mRNA. Mar Drugs 2017, 15, 65. [Google Scholar] [CrossRef]
- Wolański, B.; Świechowski, K.; Kierzek, K.; Opaliński, S. Pyrolysis conditions and physico-chemical properties of plant-based biochar = Warunki pyrolizy a właściwości fizyczno-chemiczne biowęgla pochodzenia roślinnego. In Przemysł Chemiczny : miesięcznik poświęcony sprawom polskiego przemysłu chemicznego, wydawany staraniem Instytutu Badań Naukowych i Technicznych Metan we Lwowie; 2024.
- Martínez-Gómez, Á.; Andrés, M.F.; Barón-Sola, Á.; Díaz-Manzano, F.E.; Yousef, I.; Mena, I.F.; Díaz, E.; Gómez-Torres, Ó.; González-Coloma, A.; Hernández, L.E.; et al. Biochar from Grape Pomace, a Waste of Vitivinicultural Origin, Is Effective for Root-Knot Nematode Control. Biochar 2023, 5, 30. [Google Scholar] [CrossRef]
- Chomczynski, P.; Sacchi, N. Single-Step Method of RNA Isolation by Acid Guanidinium Thiocyanate-Phenol-Chloroform Extraction. Anal Biochem 1987, 162, 156–159. [Google Scholar] [CrossRef]
- Smieszek, A.; Kornicka, K.; Szłapka-Kosarzewska, J.; Androvic, P.; Valihrach, L.; Langerova, L.; Rohlova, E.; Kubista, M.; Marycz, K. Metformin Increases Proliferative Activity and Viability of Multipotent Stromal Stem Cells Isolated from Adipose Tissue Derived from Horses with Equine Metabolic Syndrome. Cells 2019, 8, 80. [Google Scholar] [CrossRef] [PubMed]
- Smieszek, A.; Marcinkowska, K.; Pielok, A.; Sikora, M.; Valihrach, L.; Carnevale, E.; Marycz, K. Obesity Affects the Proliferative Potential of Equine Endometrial Progenitor Cells and Modulates Their Molecular Phenotype Associated with Mitochondrial Metabolism. Cells 2022, 11, 1437. [Google Scholar] [CrossRef]
- Shoudho, K.N.; Khan, T.H.; Ara, U.R.; Khan, M.R.; Shawon, Z.B.Z.; Hoque, M.E. Biochar in Global Carbon Cycle: Towards Sustainable Development Goals. Current Research in Green and Sustainable Chemistry 2024, 8, 100409. [Google Scholar] [CrossRef]
- Reggi, S.; Frazzini, S.; Fusi, E.; Guagliano, M.; Cristiani, C.; Onelli, E.; Moscatelli, A.; Rossi, L. Biochar’s Adsorption of Escherichia Coli and Probiotics Lactiplantibacillus Plantarum and Limosilactobacillus Reuteri and Its Impact on Bacterial Growth Post In Vitro Digestion. Applied Sciences 2025, 15, 5090. [Google Scholar] [CrossRef]
- Sigmund, G.; Huber, D.; Bucheli, T.D.; Baumann, M.; Borth, N.; Guebitz, G.M.; Hofmann, T. Cytotoxicity of Biochar: A Workplace Safety Concern? Environ. Sci. Technol. Lett. 2017, 4, 362–366. [Google Scholar] [CrossRef]
- Hao, S.; Yang, H.; Hu, J.; Luo, L.; Yuan, Y.; Liu, L. Bioactive Compounds and Biological Functions of Medicinal Plant-Derived Extracellular Vesicles. Pharmacol Res 2024, 200, 107062. [Google Scholar] [CrossRef]
- Ghafouri-Fard, S.; Abak, A.; Shoorei, H.; Mohaqiq, M.; Majidpoor, J.; Sayad, A.; Taheri, M. Regulatory Role of microRNAs on PTEN Signaling. Biomed Pharmacother 2021, 133, 110986. [Google Scholar] [CrossRef]
- Etzi, F.; Griñán-Lisón, C.; Fenu, G.; González-Titos, A.; Pisano, A.; Farace, C.; Sabalic, A.; Picon-Ruiz, M.; Marchal, J.A.; Madeddu, R. The Role of miR-486-5p on CSCs Phenotypes in Colorectal Cancer. Cancers (Basel) 2024, 16, 4237. [Google Scholar] [CrossRef]
- Cimmino, A.; Calin, G.A.; Fabbri, M.; Iorio, M.V.; Ferracin, M.; Shimizu, M.; Wojcik, S.E.; Aqeilan, R.I.; Zupo, S.; Dono, M.; et al. miR-15 and miR-16 Induce Apoptosis by Targeting BCL2. Proc Natl Acad Sci U S A 2005, 102, 13944–13949. [Google Scholar] [CrossRef] [PubMed]
- Hashemi, M.; Mirdamadi, M.S.A.; Talebi, Y.; Khaniabad, N.; Banaei, G.; Daneii, P.; Gholami, S.; Ghorbani, A.; Tavakolpournegari, A.; Farsani, Z.M.; et al. Pre-Clinical and Clinical Importance of miR-21 in Human Cancers: Tumorigenesis, Therapy Response, Delivery Approaches and Targeting Agents. Pharmacol Res 2023, 187, 106568. [Google Scholar] [CrossRef] [PubMed]
- Yang, Y.; Hou, N.; Wang, X.; Wang, L.; Chang, S.; He, K.; Zhao, Z.; Zhao, X.; Song, T.; Huang, C. miR-15b-5p Induces Endoplasmic Reticulum Stress and Apoptosis in Human Hepatocellular Carcinoma, Both in Vitro and in Vivo, by Suppressing Rab1A. Oncotarget 2015, 6, 16227–16238. [Google Scholar] [CrossRef]
- Liu, J.; Xu, H.; Wang, N.; Sun, M. miR-15b, a Diagnostic Biomarker and Therapeutic Target, Inhibits Oesophageal Cancer Progression by Regulating the PI3K/AKT Signalling Pathway. Exp Ther Med 2020, 20, 222. [Google Scholar] [CrossRef]
- Li, T.; Leong, M.H.; Harms, B.; Kennedy, G.; Chen, L. MicroRNA-21 as a Potential Colon and Rectal Cancer Biomarker. World J Gastroenterol 2013, 19, 5615–5621. [Google Scholar] [CrossRef]
- Kunze-Schumacher, H.; Krueger, A. The Role of MicroRNAs in Development and Function of Regulatory T Cells—Lessons for a Better Understanding of MicroRNA Biology. Front Immunol 2020, 11, 2185. [Google Scholar] [CrossRef]
- Gavrilas, L.I.; Ionescu, C.; Tudoran, O.; Lisencu, C.; Balacescu, O.; Miere, D. The Role of Bioactive Dietary Components in Modulating miRNA Expression in Colorectal Cancer. Nutrients 2016, 8, 590. [Google Scholar] [CrossRef]
- Thomas, L.W.; Lam, C.; Edwards, S.W. Mcl-1; the Molecular Regulation of Protein Function. FEBS Lett 2010, 584, 2981–2989. [Google Scholar] [CrossRef]
- Germain, M.; Milburn, J.; Duronio, V. MCL-1 Inhibits BAX in the Absence of MCL-1/BAX Interaction. J Biol Chem 2008, 283, 6384–6392. [Google Scholar] [CrossRef]
- Karch, J.; Molkentin, J.D. Regulated Necrotic Cell Death: The Passive Aggressive Side of Bax and Bak. Circ Res 2015, 116, 1800–1809. [Google Scholar] [CrossRef] [PubMed]
- Widden, H.; Placzek, W.J. The Multiple Mechanisms of MCL1 in the Regulation of Cell Fate. Commun Biol 2021, 4, 1029. [Google Scholar] [CrossRef] [PubMed]
- Quintanilha, B.J.; Reis, B.Z.; Duarte, G.B.S.; Cozzolino, S.M.F.; Rogero, M.M. Nutrimiromics: Role of microRNAs and Nutrition in Modulating Inflammation and Chronic Diseases. Nutrients 2017, 9, 1168. [Google Scholar] [CrossRef] [PubMed]
Figure 1.
The effect of BC-AE on the metabolism of human colorectal adenocarcinoma cells, Caco-2. Cellular metabolism was assessed using the MTS assay, with results expressed as the metabolic factor relative to the activity of cells in the control cultures (expressed as a reference value of 1). A comparative analysis was conducted using results from three independent experiments, each performed in technical triplicate. The data are displayed as bar graphs, representing the mean ± standard deviation (SD). Statistical significance is denoted by asterisks, where *indicates p-value < 0.05.
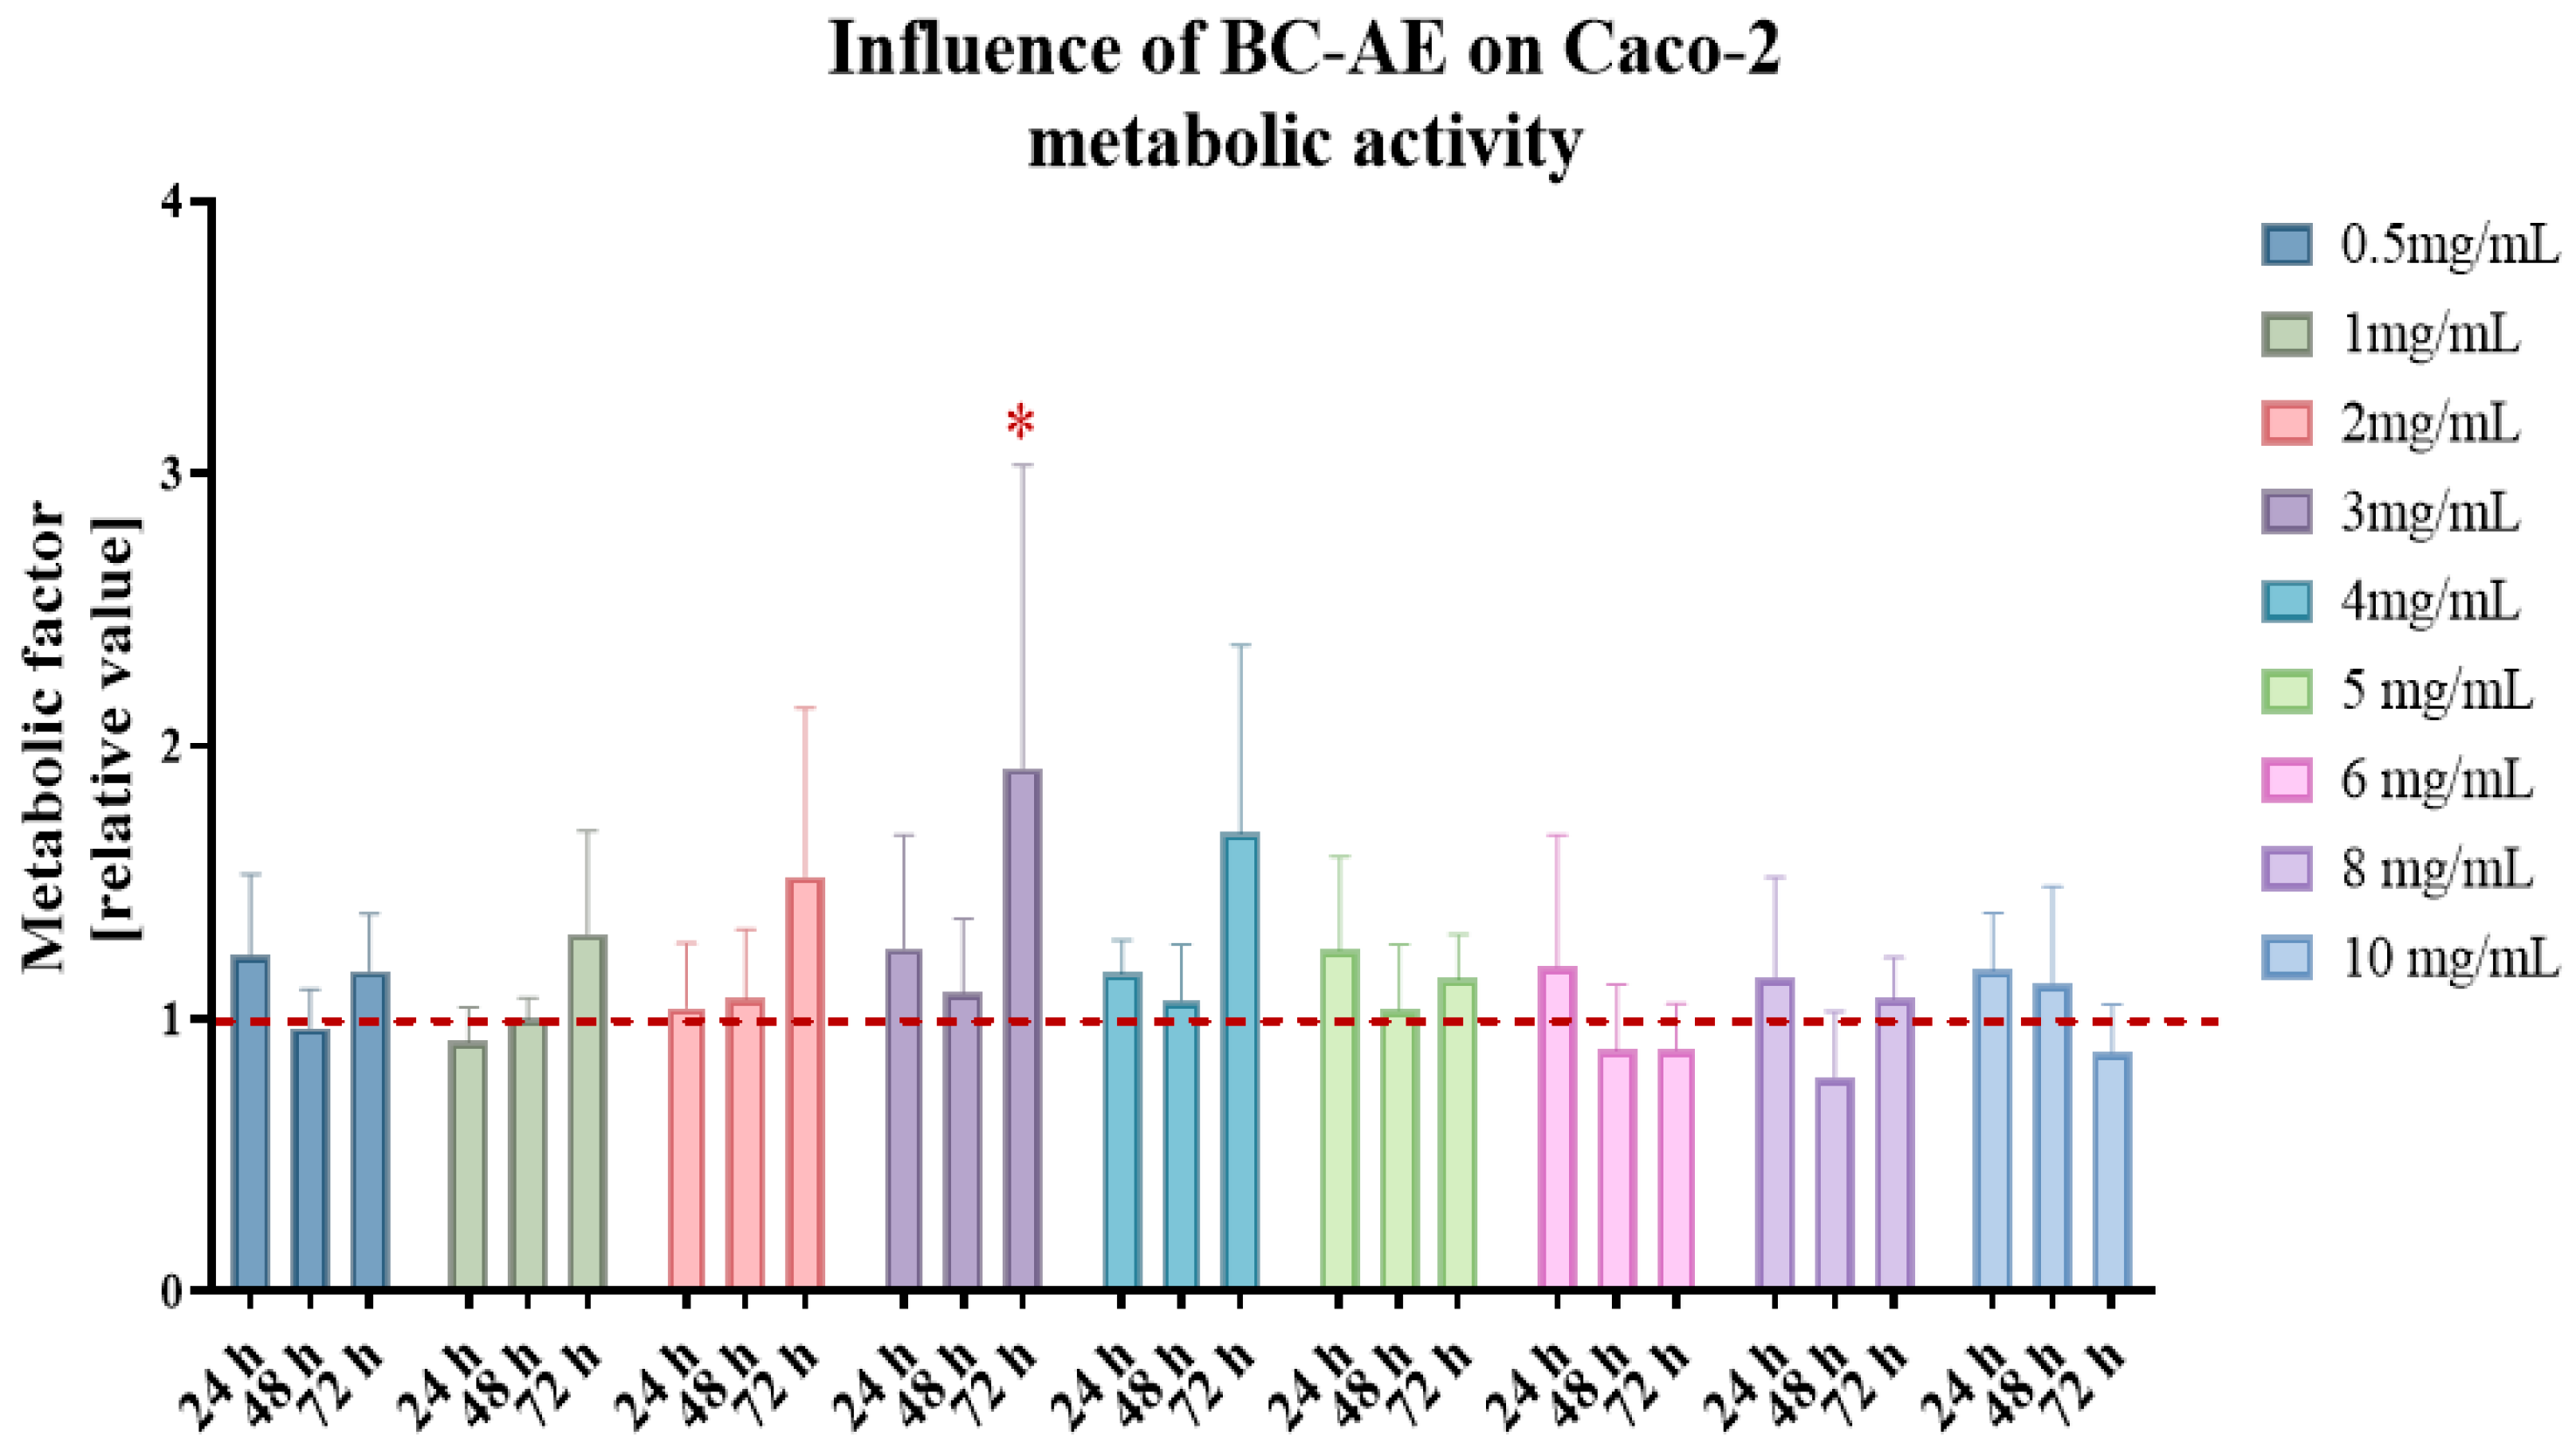
Figure 2.
The effect of BC-AE prepared from a 3 mg/mL sample on Caco-2 cell morphology and growth pattern. The nuclei were stained with DAPI (blue signal), and the cytoskeleton was stained with phalloidin-488 Atto (green signal). Caco-2 cells were treated with BC-AE and observed at designated time points to assess potential morphological alterations and changes in culture dynamics. Analyses were conducted using an inverted phase-contrast microscope to evaluate the overall monolayer structure and cell density, as well as epifluorescence microscopy to visualize cellular details. The representative images illustrate the impact of BC-AE on cell shape, colony formation, and spatial organization within the monolayer. Observations and interpretations are further discussed in the main text. Scale bars are provided within each image.
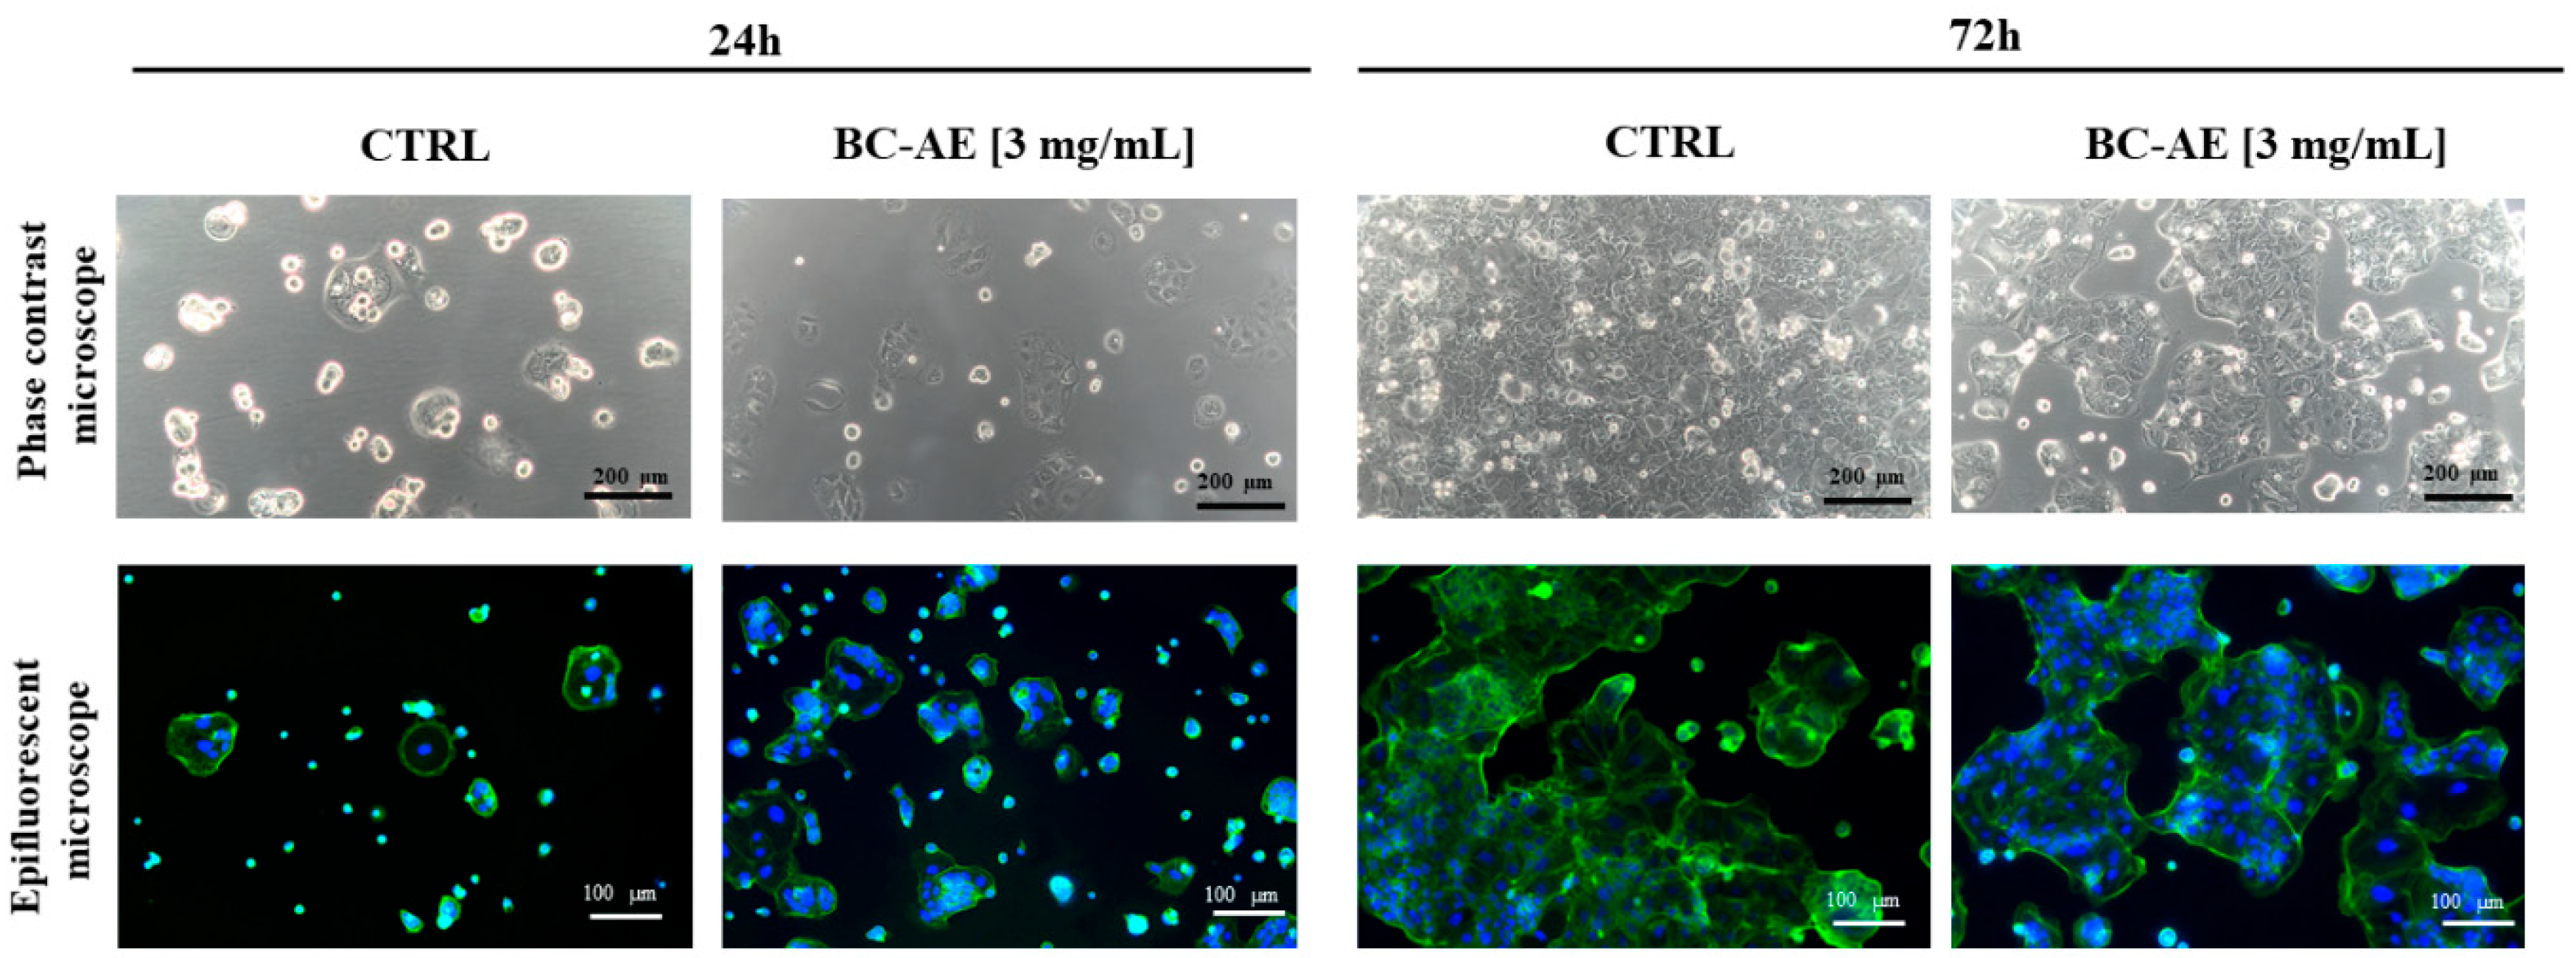
Figure 3.
The distribution of Caco-2 cells based on Annexin V and propidium iodide (PI) staining was assessed using flow cytometry. The representative dot-blots are presented for measurements made after 24 hours (a) and 72 hours (b). Viable cells are located in the Annexin V–/PI– quadrant (left bottom square, fuchsia dots). Early apoptotic (EA) cells are Annexin V+/PI–, indicating externalization of phosphatidylserine without membrane permeabilization, and are shown in the right bottom gate (green dots). Late apoptotic (LA) or secondary necrotic cells are Annexin V+/PI+ (upper right gate), while necrotic cells (Dead) are Annexin V–/PI+ (upper left gate). The comparative analysis revealed differences between treated and untreated cells at various time points (24 and 72 hours) in terms of Caco-2 distribution, including viable cells (c), necrotic cells (d), early apoptosis (e), late apoptosis (f), and total cell apoptosis (g). Means ± SD. * p-value < 0.05, while the ns symbol refers to non-significant differences. Statistically significant differences were indicated as follows: * p-value < 0.05; ** p--value < 0.01 and *** p-value < 0.001, while non-significant differences are denoted as ns.
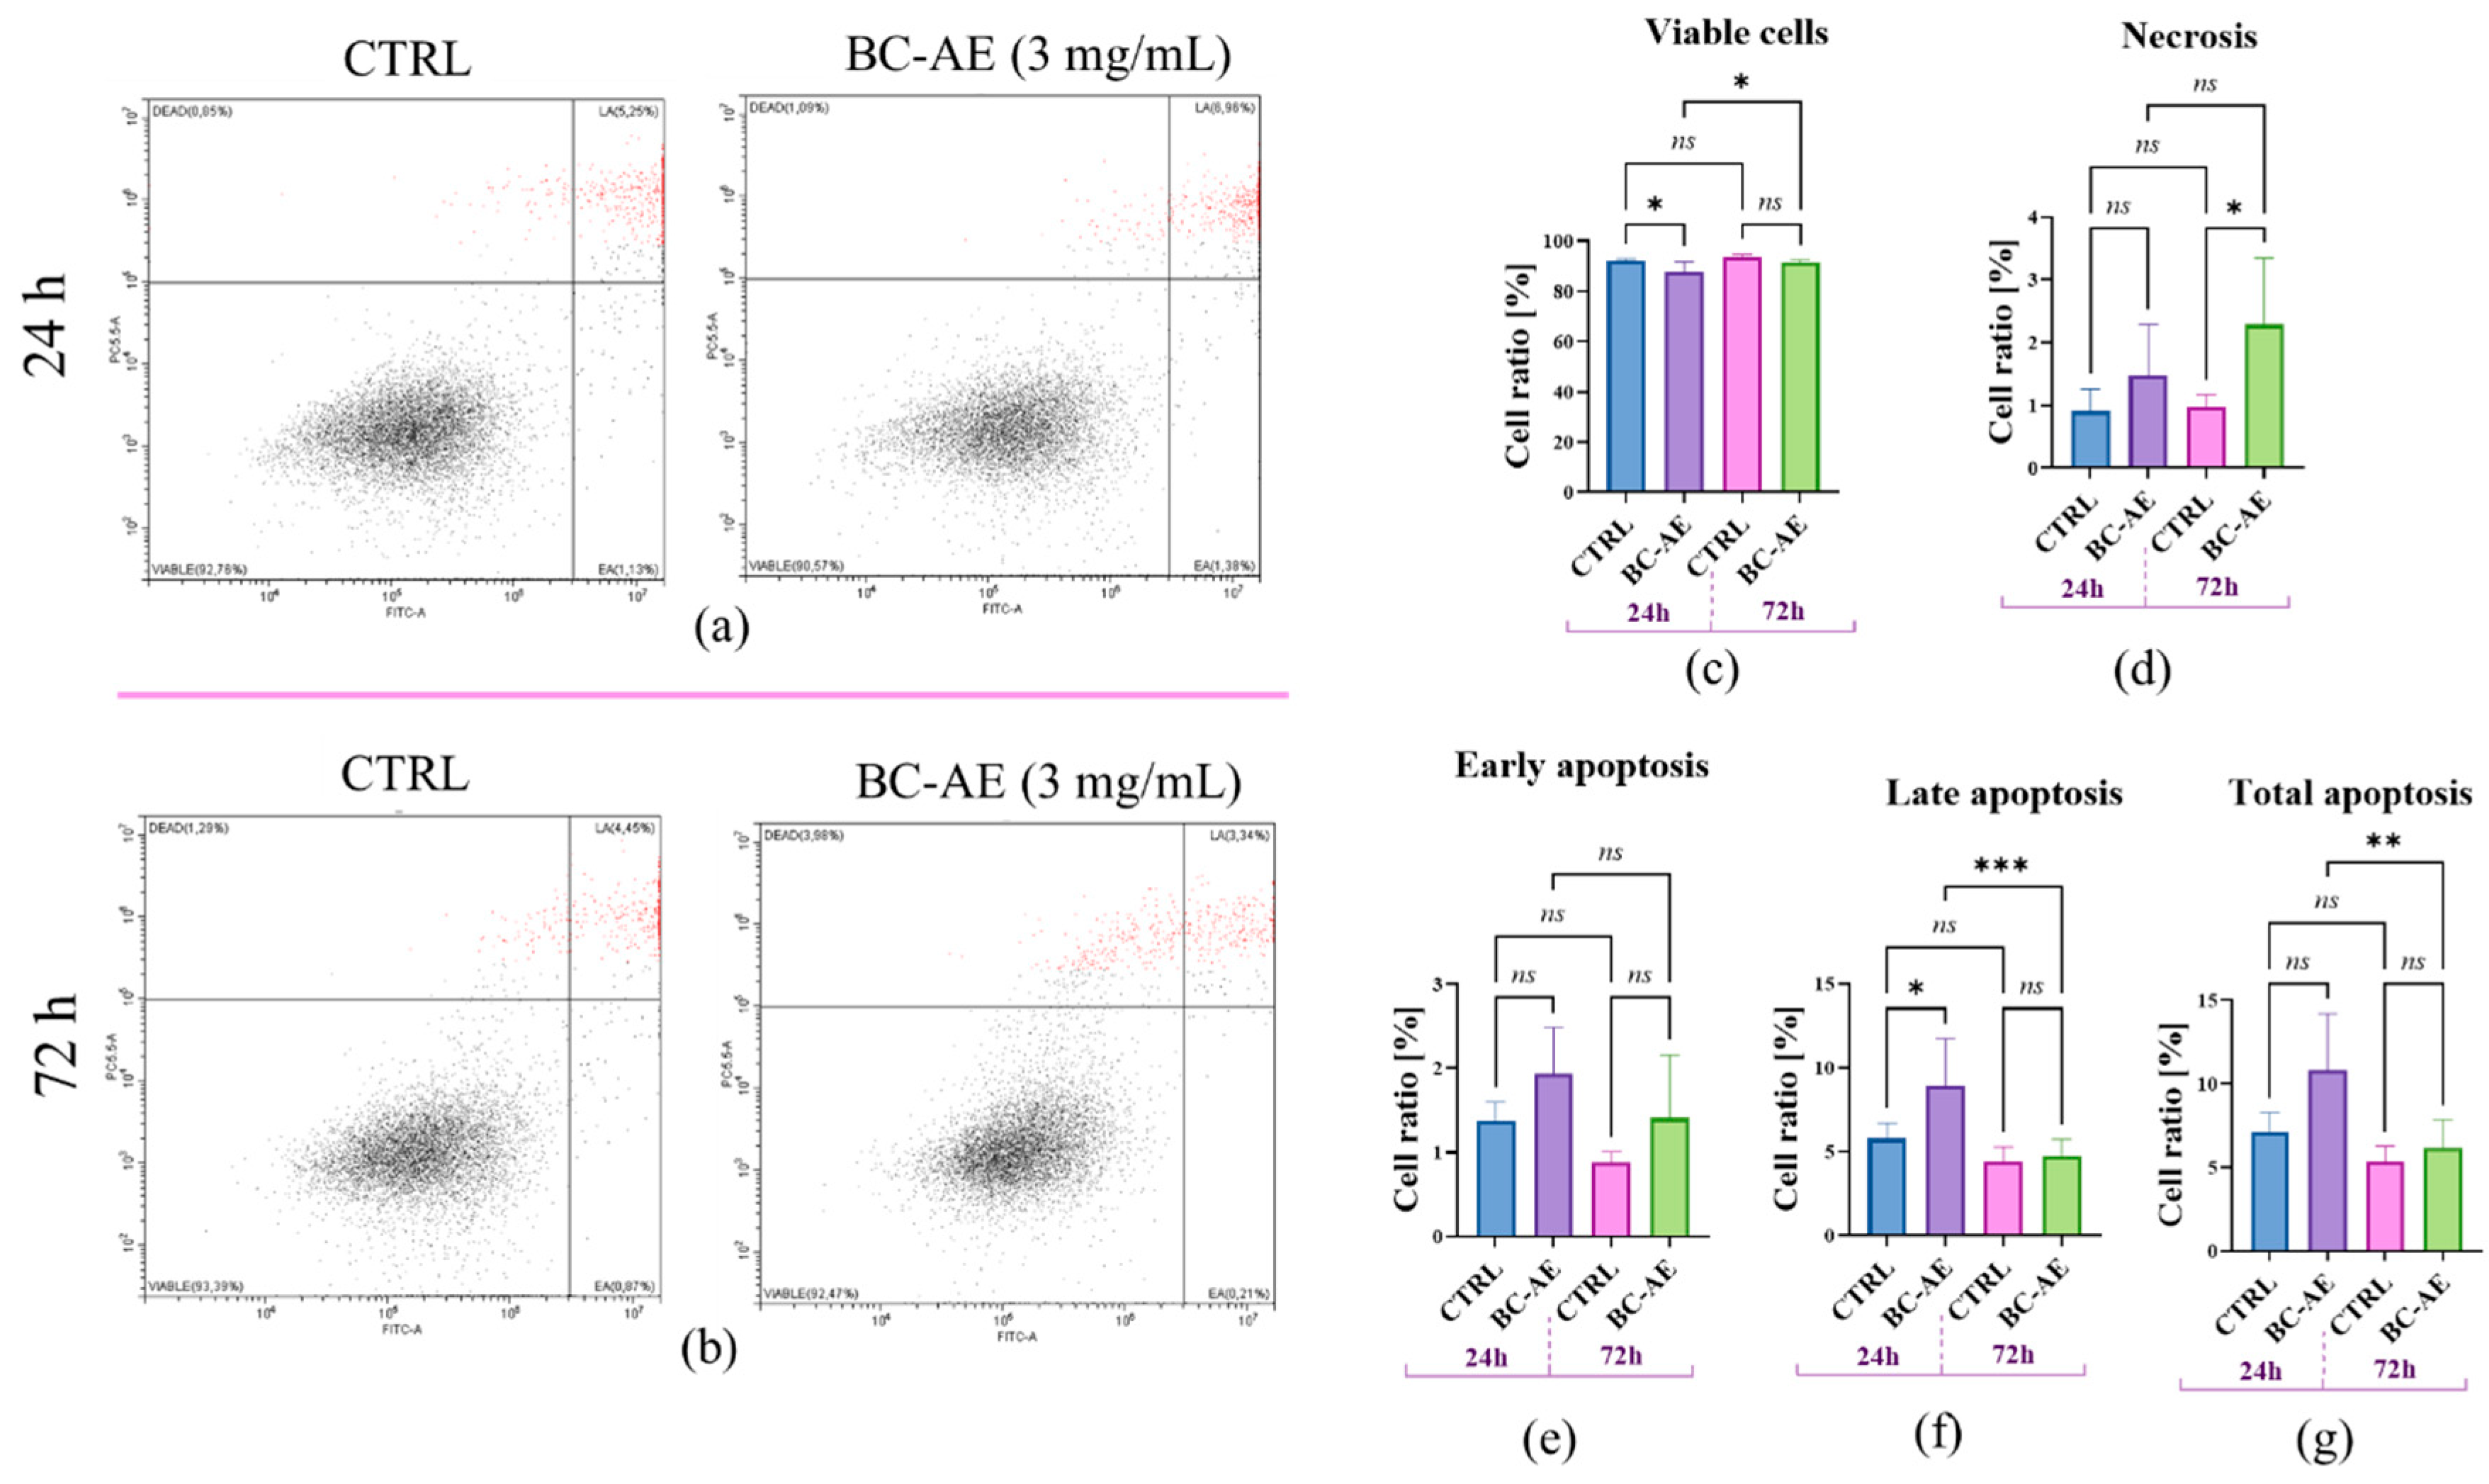
Figure 4.
The analysis examined the influence of BC-AE (3 mg/mL, 24 hours and 72 hours) on the levels of selected miRNAs in Caco-2 cells. Analysis revealed that miR-21a had the highest expression, while miR-155 had the lowest. A comparative analysis was conducted to evaluate the significance of the observed expression patterns. Statistically significant differences were indicated as follows: *p-value < 0.05; ** p--value < 0.01 and **** indicates p < 0.0001, while non-significant differences are denoted as ns.
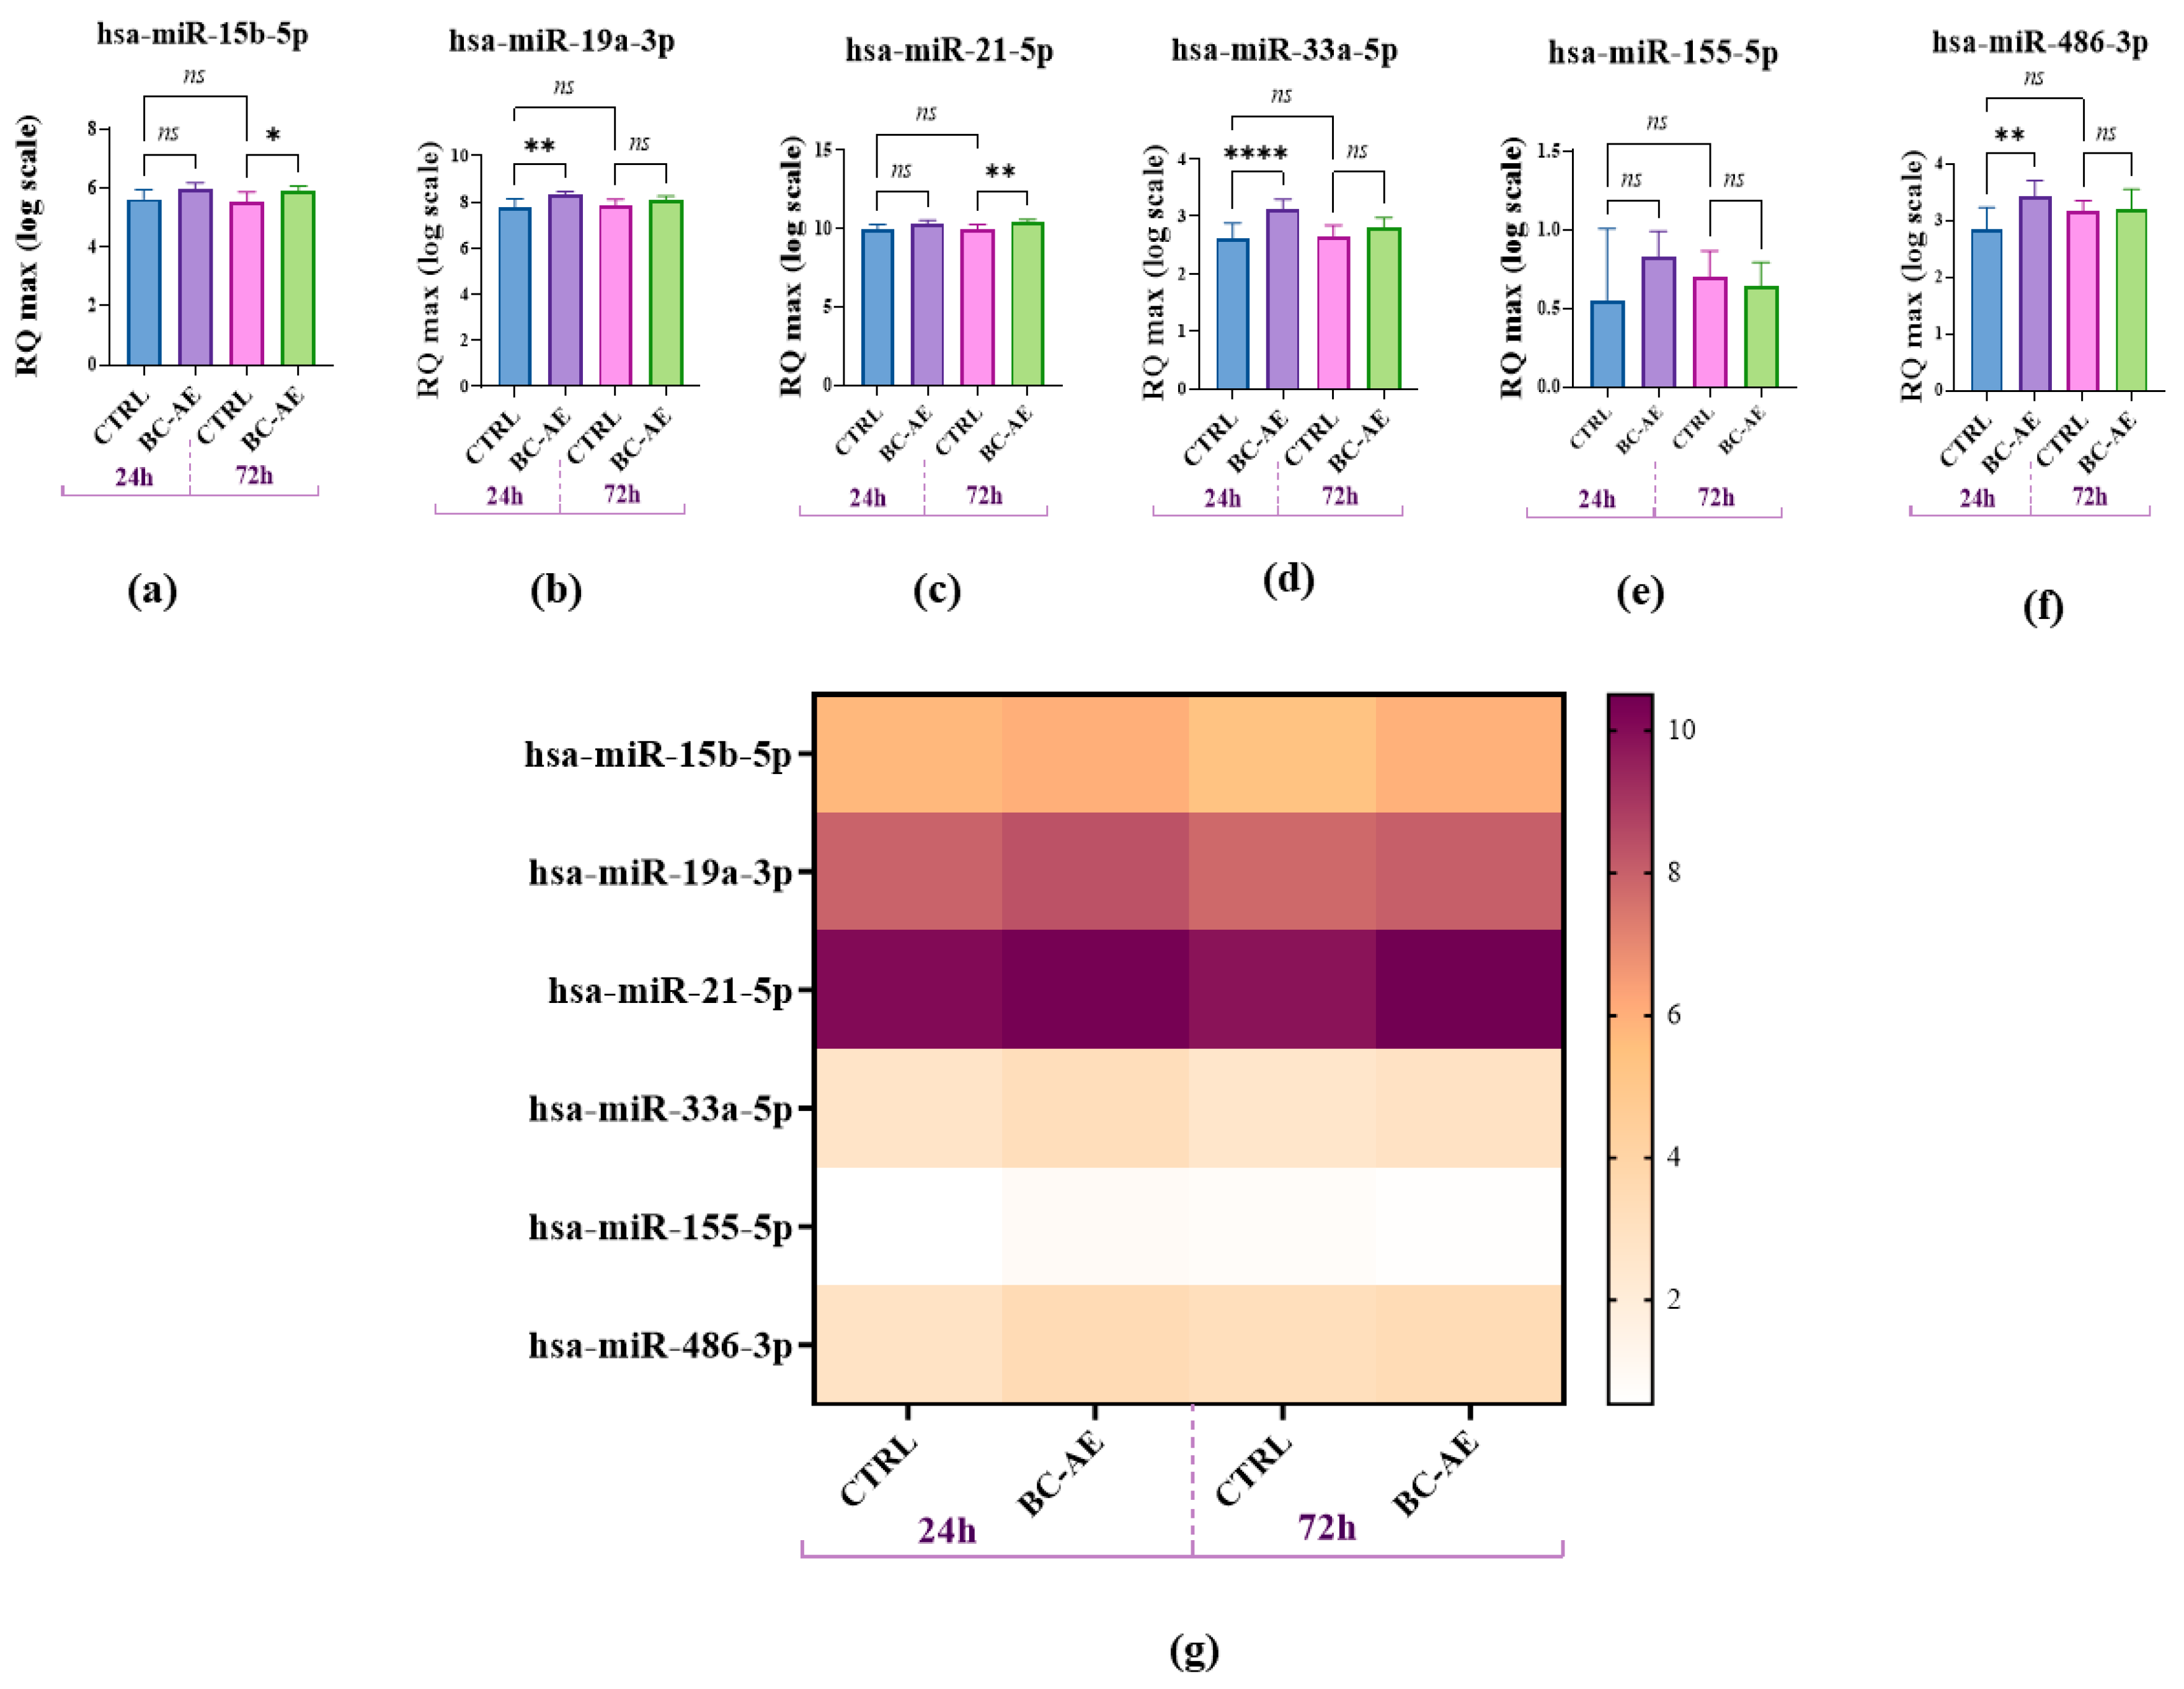
Figure 5.
The influence of BC-AE treatment on the expression of key apoptosis- and cell cycle-regulating genes in Caco-2 cells (3mg/ml, 24h and 72h). The analysis included the determination of pro-apoptotic markers, i.e., BAX and BAD (a and b), and anti-apoptotic markers, i.e., BCL-2 (d), BCL-xL (e), and MCL-1 (f). Moreover, the BAX/BCL-2 ratio was determined to assess the balance between pro- and anti-apoptotic signaling (c). Additionally, mRNA levels of P53 (g) and P21 (h) were analyzed to evaluate the activation of cell cycle regulatory pathways. A comparative analysis was conducted to evaluate the significance of the observed expression patterns. Statistically significant differences were indicated as follows: *p-value < 0.05; ** p--value < 0.01 and **** indicates p < 0.0001, while nonsignificant differences are denoted as ns.
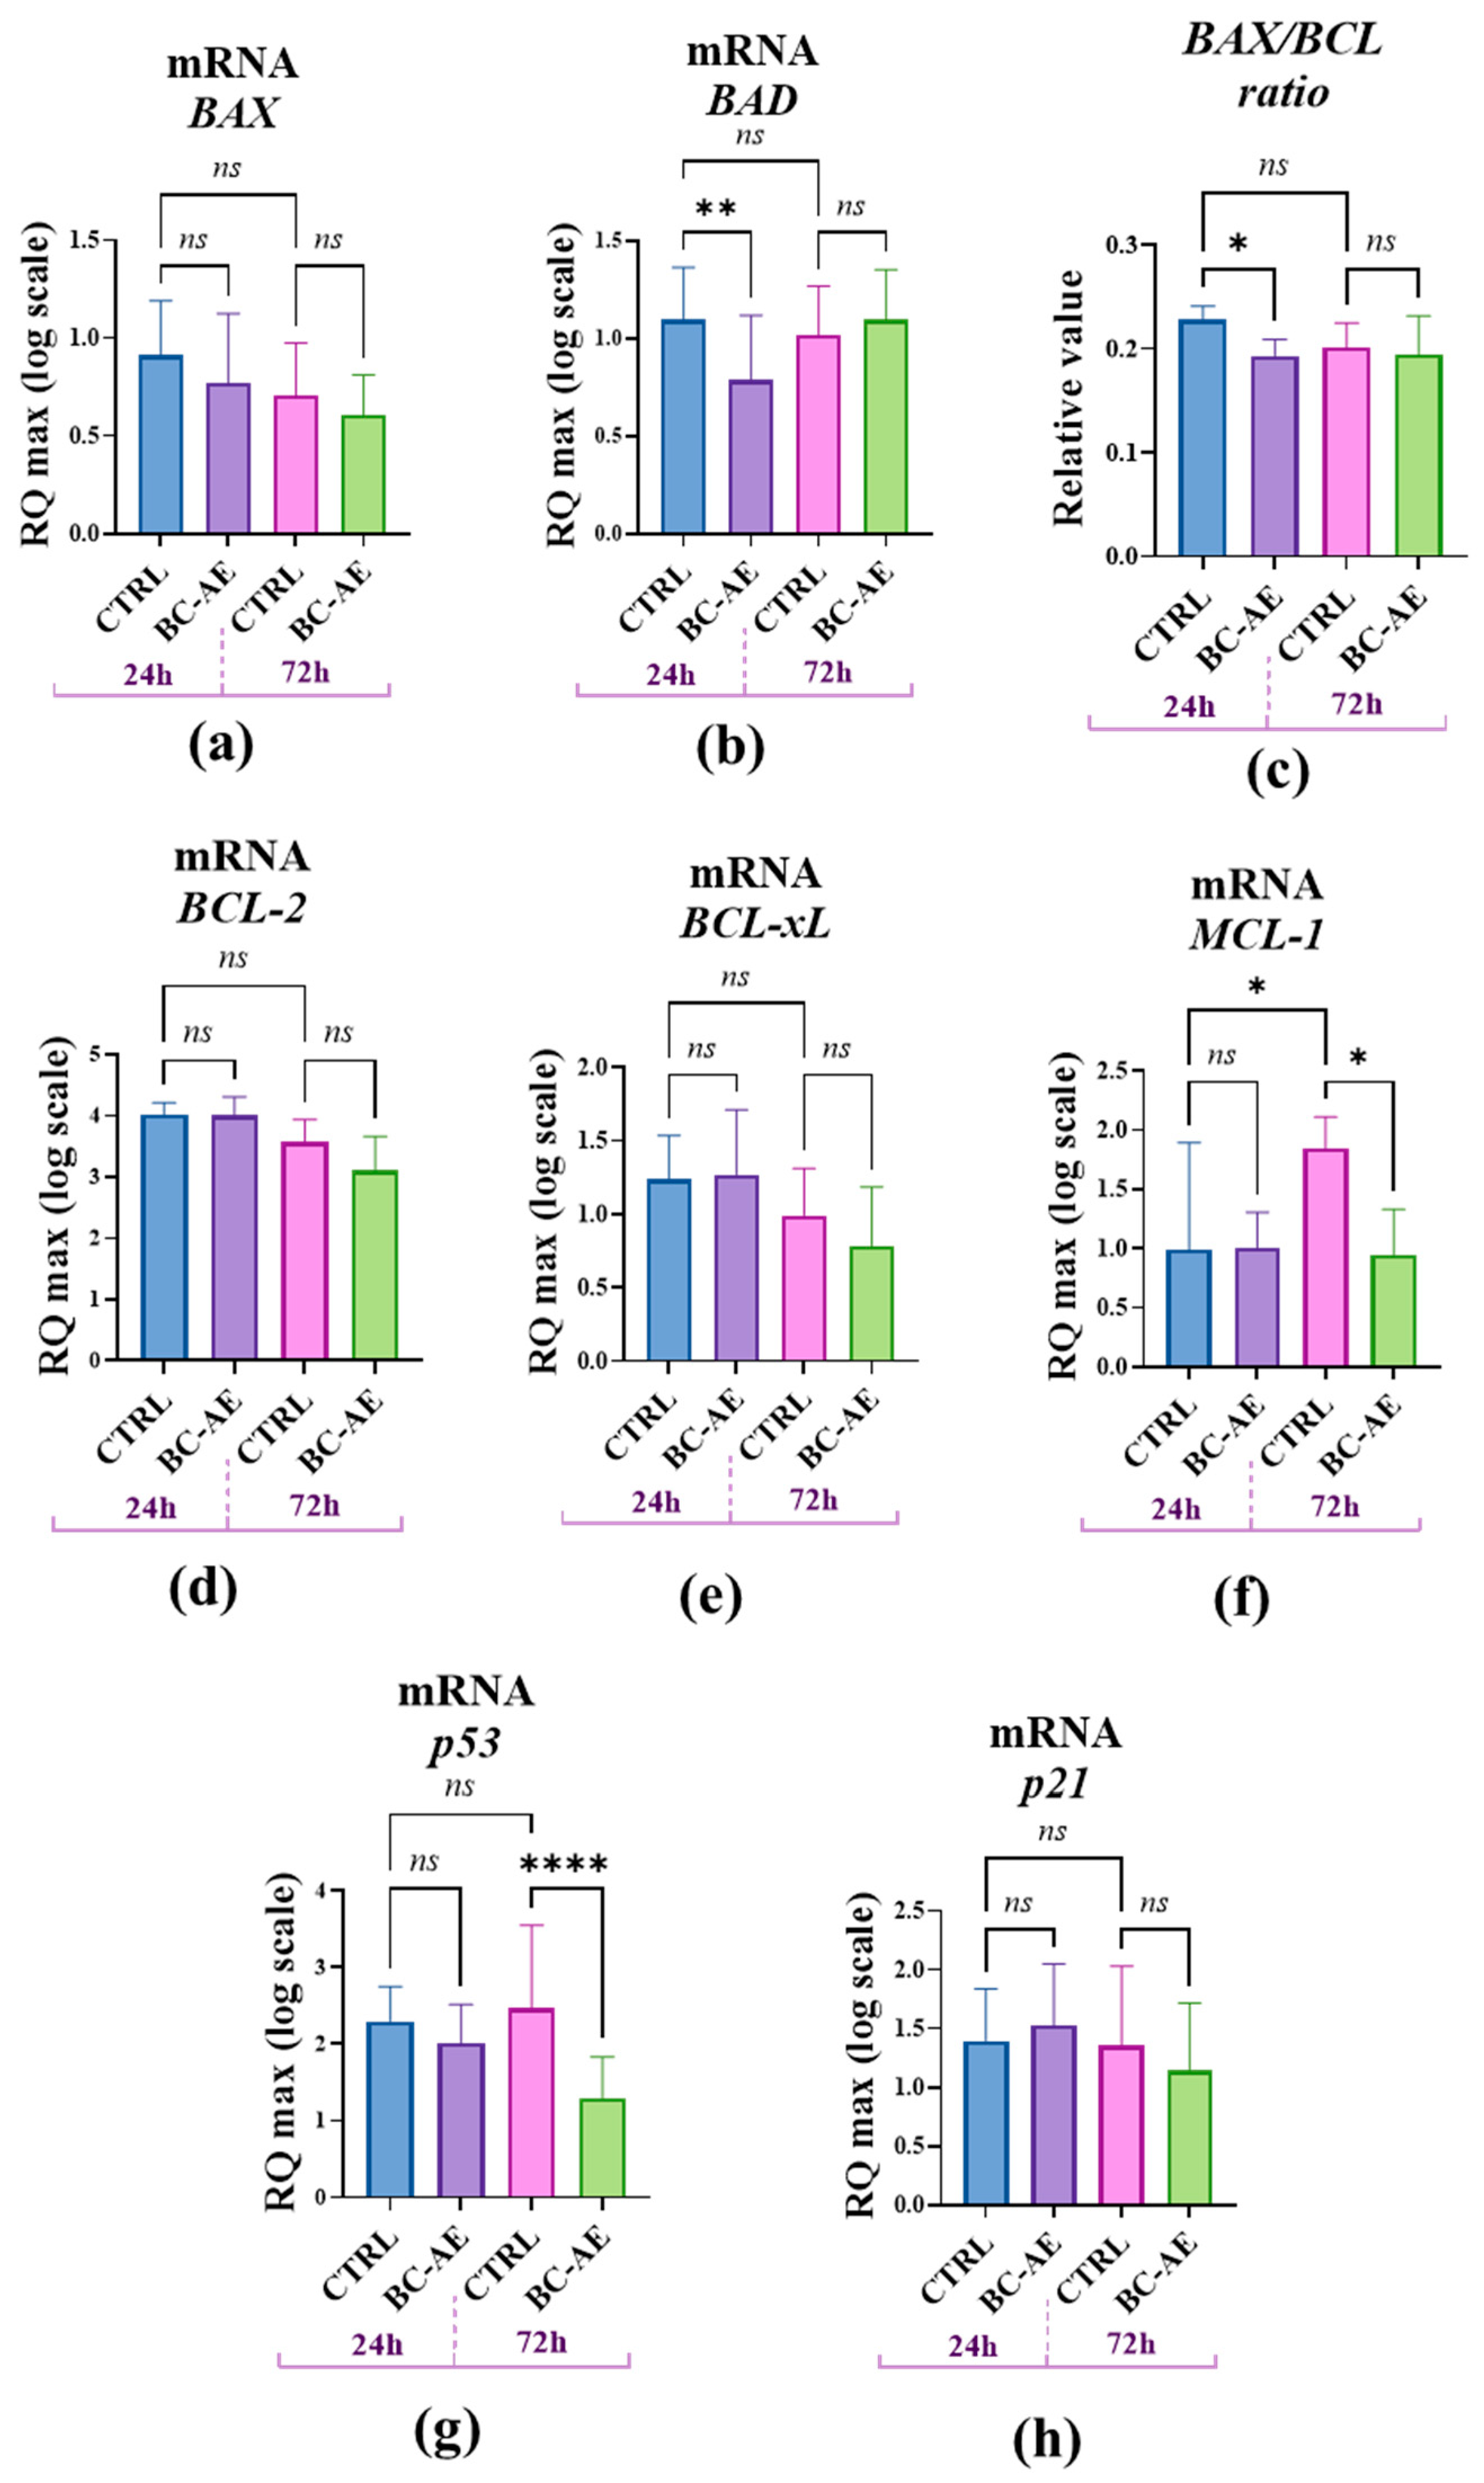
Figure 6.
The influence of BC-AE treatment on the expression of key apoptosis-related proteins in Caco-2 cells (3mg/ml, 24h and 72h). Western blot analysis was performed to determine the protein expression levels of pro-apoptotic markers BAX and BAD (a, b, d), and anti-apoptotic markers BCL-2 and MCL-1 (a, c, e). β-actin was used as a reference molecule. Quantitative analysis was conducted to evaluate the relative protein levels normalized to β-actin. A comparative analysis was conducted to evaluate the significance of the observed changes at both time points *p-value < 0.05; while nonsignificant differences are denoted as ns.
Disclaimer/Publisher’s Note: The statements, opinions and data contained in all publications are solely those of the individual author(s) and contributor(s) and not of MDPI and/or the editor(s). MDPI and/or the editor(s) disclaim responsibility for any injury to people or property resulting from any ideas, methods, instructions or products referred to in the content. |
© 2025 by the authors. Licensee MDPI, Basel, Switzerland. This article is an open access article distributed under the terms and conditions of the Creative Commons Attribution (CC BY) license (http://creativecommons.org/licenses/by/4.0/).
Copyright: This open access article is published under a Creative Commons CC BY 4.0 license, which permit the free download, distribution, and reuse, provided that the author and preprint are cited in any reuse.


