
Submitted:
22 October 2025
Posted:
03 November 2025
You are already at the latest version
Abstract
Spray-drying production of litchi powder is frequently constrained by low yield and unstable quality, largely attributable to variations in fruit sugar–acid profiles. To elucidate the compositional factors affecting powder performance, ten litchi cultivars with distinct sugar–acid ratios were processed under identical conditions. Baitangying produced superior powder with the highest yield (89.23±1.25%), solubility (98.17±0.49%), and glass transition temperature (52.17±2.00 ℃). Jizuili also performed well. Both high-sucrose, low-acidity cultivars demonstrated excellent drying efficiency and storage stability. Conversely, high-acid and reducing-sugar cultivars (Feizixiao, Guanxiangli) retained more moisture (> 7%) and showed lower glass transition temperature, suggesting inferior stability. Correlation analysis revealed that fructose (ρ = −0.794, p < 0.001) and titratable acidity (ρ = −0.770, p < 0.001) were negatively correlated with yield, while sucrose was positively associated with yield and color lightness (ρ = 0.630, p < 0.05). Antioxidant capacity varied among cultivars and was mainly governed by total phenolics and litchi thaumatin-like protein, with Feizixiao and Jingganghongnuo showing the highest FRAP values (19.36 ± 0.12 and 17.38 ± 0.33 μg TE/mg DW). Overall, intrinsic sugar–acid profiles fundamentally determine the drying efficiency, powder stability, and bioactive retention of litchi powder.
Keywords:
litchi
; spray drying
; sugar–acid profile
; powder properties
; correlation analysis
1. Introduction
Litchi (Litchi chinensis Sonn.) is an economically important fruit cultivated in more than twenty tropical and subtropical countries, with southern China being the principal production region [1,2]. Its popularity derives from its distinctive sweetness, aroma, and nutritional composition, which includes vitamins, minerals, proteins, and polyphenols with documented antioxidant and anti-inflammatory activities [3,4,5]. However, litchi is highly perishable during postharvest handling due to its thin pericarp and high moisture content, and is susceptible to browning, cracking, desiccation, which ultimately reduce marketability and cause considerable economic losses [6]. These inherent characteristics underscore the urgent need for effective processing strategies to extend shelf life and maintain fruit quality.
To address these challenges, the development of suitable processing techniques is essential for extending the shelf life and enhancing the commercial value of litchi. Drying is one of the most effective methods for preserving litchi quality and reducing postharvest losses. Among the commonly used techniques, hot air drying (HAD), vacuum freeze drying (VFD), and spray drying (SD) are the most prevalent [7,8,9]. HAD is is low-cost and simple but often results in shrinkage, discoloration, and nutrient loss due to heat-induced degradation [7,9]. VFD produces high-quality powders, but its scalability is constrained by high capital investment, intensive energy consumption, and limited throughput [10].
In contrast, SD is a highly efficient continuous process, making it ideal for large-scale production [11]. It features a rapid drying rate and short heat exposure that facilitate the retention of heat-sensitive compounds such as vitamins and phenolics [8]. Moreover, SD equipment is relatively low-cost, easy to operate, and scalable, making it well adapted for large-scale fruit powder production [12]. Consequently, SD effectively converts litchi into stable powders with extended shelf life, reduced postharvest losses, and preserved nutritional and sensory attributes. These improvements enhance the commercial value and applicability of litchi products, establishing SD as a practical solution for mitigating postharvest deterioration in the industry through its efficient dehydration of heat-sensitive materials.
This study systematically evaluated the SD performance of ten representative litchi cultivars using compositional analysis and powder property assessment, establishing a correlation between sugar–acid profiles and powder quality. It is hypothesized that the sugar-acid profiles play a critical role in determining the spray-drying performance. Specifically, cultivars with higher sucrose content and lower reducing sugar and organic acid contents can form a more stable glassy state structure during the SD process, reducing the phenomena of wall-sticking and caking during drying, and thus improving the drying yield and powder quality. Meanwhile, the litchi powder prepared from such cultivars exhibits better stability during storage and demonstrates superior functional properties. This study will provide theoretical foundations and technical support for the industrial production of litchi powder, promoting the sustainable development of the litchi industry.
2. Materials and Methods
2.1. Materials and Reagents
Ten representative litchi (Litchi chinensis Sonn.) cultivars were selected: Baila, Baitangying, Feizixiao, Guiwei, Jingganghongnuo, Heiye, Fenghuangli, Yuezhouhong, Jizuili, and Guanxiangli. Among them, cultivars from Baila to Heiye were sourced from Gaozhou, Maoming City, Guangdong Province; Yuezhouhong from Guangxi; Jizuili from Lianjiang, Guangdong; and Guanxiangli from Dongguan, Guangdong. Fruits were harvested at commercial maturity, and only fruits of uniform size, free from mechanical damage, pests, and diseases, were selected.
Maltodextrin (MD, DE = 18%) was purchased from Henan Gaobao Industrial Co., Ltd. (Zhengzhou, China), and whey protein isolate (WPI, 90% purity) from Zhengzhou Jinnuo Biotechnology Co., Ltd. (Zhengzhou, China). The standards of glucose, fructose, sucrose (≥ 99% purity, Sigma–Aldrich, St. Louis, MO, USA), gallic acid (≥ 99% purity, Macklin Biochemical Co., Ltd., Shanghai, China), and bovine serum albumin (BSA, Merck KGaA, Darmstadt, Germany) were used for calibration. Folin–Ciocalteu reagent, DPPH (2,2-diphenyl-1-picrylhydrazyl), ABTS (2,2′-azino-bis (3-ethylbenzothiazoline-6-sulfonic acid)), and Coomassie Brilliant Blue G-250 were also obtained from Macklin (Shanghai, China). 3,5-Dinitrosalicylic acid (DNS) was purchased from Phygene Life Sciences Co., Ltd. (Fuzhou, China). The Ferric Reducing Antioxidant Power (FRAP) assay kit was purchased from Suzhou Grace Biotechnology Co., Ltd. (Suzhou, China). All other chemicals used were of analytical grade and obtained from commercial suppliers.
2.2. Preparation of Litchi Powder
Litchi fruits were peeled and deseeded. The pulp was homogenized using a colloid mill (JTM-LB50C, Hao Star Machinery, Wenzhou, China) and filtered through a 100-mesh gauze to obtain juice. A carrier solution composed of maltodextrin (MD) and whey protein isolate (WPI) at a ratio of 1:9 (w/w) was prepared and mixed with the homogenate at a ratio of 5:1 (pulp:carrier). The mixture was homogenized for 10 min before spray drying. Spray drying was conducted using a laboratory spray dryer (ADL311S, Yamato Scientific Co., Ltd., Japan) with the following conditions: inlet temperature 160 °C, feed flow rate 6.7 mL/min, atomization pressure 0.1 MPa, and air flow rate 0.38 m³/min. The powders were collected, sealed in aluminum foil bags, and stored at room temperature in a desiccator for subsequent analysis.
2.3. Analysis of Raw Material Composition
2.3.1. Determination of Acidity Properties
Titratable acidity (TA) was determined by titrating 10 mL of the litchi pulp supernatant (obtained by centrifugation at 10,000 × g) with 0.1 mol/L standardized NaOH solution. The titration endpoint was set at pH 8.2 ± 0.1. TA was calculated as follows:
where C denotes the NaOH concentration (mol/L), V₁ the titration volume (mL), V₂ the sample volume (mL), and K (0.067) the conversion factor expressed as malic acid equivalents.
2.3.2. Determination of Soluble Solids Content (SSC) and Sugar-to-Acid (SSC/TA) Ratio
The SSC of litchi pulp was quantitatively determined using a digital refractometer (PR-32-α, ATAGO Co., Ltd., Tokyo, Japan), with results expressed in °Brix. Prior to measurement, the instrument was zero-calibrated using ultrapure water. Each sample was uniformly applied to cover the prism detection area, and the reading was recorded after stabilization. Triplicate measurements were performed for each sample. Based on the previously determined TA, the sugar-to-acid ratio (SSC/TA) was calculated according to the following equation:
2.3.3. Determination of Nutritional Properties
The total sugar, reducing sugar, soluble protein, and total phenolic contents were quantified by absorbance using a UV-Vis spectrophotometer (UVmini-1240, Shimadzu Corp., Kyoto, Japan). Glucose, fructose, and sucrose contents were determined by high-performance liquid chromatography (HPLC, 1260 Infinity II, Agilent Technologies, USA) equipped with a refractive index detector (RID).
2.3.3.1. Total Sugar
The total sugar content was determined by the phenol–sulfuric acid method, with glucose as the standard. A series of standard solutions (0.02–0.09 mg/mL) were prepared by serial dilution from a glucose stock solution (0.1 mg/mL). For both standards and samples, 2.0 mL of the solution was mixed with 1.0 mL of 6% (w/v) phenol, followed by the rapid addition of 5.0 mL of concentrated sulfuric acid. The mixture was incubated in a boiling water bath for 5 min and then kept in the dark at room temperature for 20 min. After cooling, the absorbance was measured at 490 nm using water as a blank. The total sugar content in the litchi juice samples was quantified against a calibration curve (y = 1.2694x + 0.0177, R² = 0.9988) and expressed as glucose equivalents.
2.3.3.2. Reducing Sugar
The reducing sugar content was determined by the DNS method, using glucose as the standard. Standard solutions (0–1 mg/mL) were prepared, and 1.0 mL of each standard or sample was mixed with 2.0 mL of DNS reagent. The mixture was boiled for 5 min, immediately cooled, and diluted with 9.0 mL of distilled water. Absorbance was measured at 540 nm, and reducing sugar content was calculated from the glucose calibration curve (y = 1.2694x + 0.0177, R² = 0.9988) and expressed as glucose equivalents.
2.3.3.3. Glucose, Fructose, and Sucrose
Litchi pulp (2 g) was placed in a 100 mL volumetric flask and dissolved in 50 mL deionized water. Subsequently, 5 mL Zn(CH₃COO)₂ and 5 mL K₄[Fe(CN)₆] solutions were added with gentle agitation. The mixture was diluted to volume with deionized water, sonicated for 30 min, and centrifuged at 10,000 rpm for 10 min. The supernatant was filtered through a 0.45 μm membrane and collected for analysis.
The quantification of glucose, fructose, and sucrose was performed according to the method described by Sesta [13] with minor modifications. Sugars were quantified using HPLC (1260 Infinity II, Agilent Technologies, USA) equipped with a refractive index detector (RID) and an amino column (250 × 4.6 mm, 5 μm). The mobile phase consisted of acetonitrile/water (7:3, v/v), at a flow rate of 1 mL/min, column temperature 40 °C, and injection volume 20 μL. Each sample was analyzed in triplicate. Glucose, fructose, and sucrose contents were calculated from calibration curves obtained by linear regression:
Glucose: y=2.6671x+2.5322,R2=0.9972
Fructose: y=2.6547x+2.3509,R2=0.9943
Sucrose: y=2.8315x+2.8307,R2=0.9913
2.3.3.4. Total Phenolic
The total phenolic content (TPC)was determined using the Folin–Ciocalteu method. A gallic acid standard stock solution (5 g/L) was serially diluted to prepare working standards (0–750 mg/L). For the assay, 0.1 mL of standard solution was sequentially mixed with 0.5 mL ultrapure water and 0.5 mL Folin–Ciocalteu reagent, and incubated at room temperature in the dark for 3–4 min. Within 8 min, 1.5 mL of 20% (w/v) Na₂CO₃ was added, and the solution was diluted to 10 mL with ultrapure water. After 2 h of incubation in the dark, absorbance was measured at 765 nm to establish the calibration curve (y = 0.0010x + 0.0276, R² = 0.9935). For litchi juice analysis, 0.1 mL supernatant was treated as described, with 0.1 mL ultrapure water as the blank. For litchi powder, a 0.1 g/mL suspension was prepared, centrifuged at 10,000 rpm for 10 min at 4 °C, and 0.1 mL of the supernatant was analyzed identically. All samples were measured in triplicate, and TPC was calculated from the standard curve.
2.3.3.5. Soluble Protein
The modified Bradford method [14] was used to quantify soluble protein content in litchi pulp. BSA was employed as the calibration standard to prepare a series of protein solutions (0–100 μg/mL). Each standard solution was mixed with Coomassie Brilliant Blue G-250 reagent at a 1:1 (v/v) ratio, vortexed thoroughly, and incubated at room temperature for 20 min before absorbance was measured at 595 nm. A calibration curve was established (y = 0.3413x + 0.0979, R² = 0.994). For sample analysis, litchi juice was filtered, and 1.0 mL of the supernatant was diluted with distilled water at a 1:39 (v/v) ratio. Absorbance was measured under identical conditions, with three independent replicates per sample. Soluble protein content was calculated from the calibration curve.
2.3.3.6. Litchi Thaumatin-like Proteins (LcTLP)
Fresh litchis were peeled and deseeded, and the pulp was homogenized. LcTLPs were extracted following the procedure reported by Chen et al. [15] with minor modifications. The solid precipitate was resuspended in 0.01 mol/L potassium phosphate buffer (0.15 mol/L NaCl, pH 7.4) at a 1:20 (w/v) ratio and extracted by shaking at 4 °C for 1 h. The extract was centrifuged (10,000 rpm, 10 min, 4 °C), and the supernatant was dialyzed (14 kDa MWCO) and lyophilized to obtain crude litchi protein. The crude extract was prepared as a 20 mg/mL solution, clarified by centrifugation (10,000 rpm, 10 min, 4 °C), and subjected to stepwise ammonium sulfate precipitation (20–80% saturation). Precipitates from 60% and 80% fractions were collected, redissolved, dialyzed (3 kDa MWCO), and lyophilized to obtain purified LcTLPs. The LcTLP content was calculated as:
where M1 is the mass of purified LcTLP (mg) and M2 is the initial mass of fresh litchi pericarp tissue (g).
2.4. Analysis of Powder Properties
2.4.1. Determination of Product Yield
Litchi powder yield was determined according to the method of Etzbach et al. [16]. The production yield (Rp) was calculated as follows:
where Rp is the production yield (%), and Mp is the recovered litchi powder mass (g), Mj is the litchi juice solids content (g), Mm is the maltodextrin solids content (g), and Mw is the whey protein isolate solids content (g) in the feed solution.
2.4.2. Determination of Moisture Characteristics
The moisture content was determined directly using a rapid moisture analyzer (MA35, Mettler-Toledo Instruments Co., Ltd.). Hygroscopicity was determined according to Caparino et al. [17] with minor modifications. Pre-dried aluminum dishes were equilibrated for 24 h in Conway compartments containing saturated NaCl solution (water activity = 0.75). Subsequently, 2.0 g of litchi powder was accurately weighed and evenly distributed in the dishes, which were then returned to the Conway compartments under the same conditions for another 24 h. Hygroscopicity was calculated as follows:
where m is the post-absorption mass (g).
2.4.3. Determination of Physicochemical Properties
2.4.3.1. Solubility
The solubility was determined according to Li et al. [18] with minor modifications. Specifically, 2.0 g of litchi powder was dispersed in 100 mL distilled water and stirred for 10 min at 25 °C, followed by centrifugation at 3500 rpm for 10 min. A 25 mL aliquot of the supernatant was dried to constant weight at 105 °C. Solubility was calculated as:
where m0 is the tare weight of the dish (g), m1 is the weight of dish plus dried residue (g), and m is the sample mass (g).
2.4.3.2. Particle Size
The average particle size and dispersion index of litchi powder were measured using a laser particle size analyzer (LS 13 320, Beckman Coulter, Inc.). D10, D50, and D90 represent the particle diameters at which 10%, 50%, and 90% of the particles (by volume) are smaller, respectively.
2.4.3.3. Glass Transition Temperature (Tg)
The Tg of litchi powder was measured with a differential scanning calorimeter (DSC 3, Shimadzu Corporation, Japan) following Kingwatee et al. [19] with modifications. Approximately 5 ± 2 mg of sample was sealed in an aluminum pan and scanned from 30 to 150 °C at 10 °C/min. Tg values were determined from thermograms using the instrument software.
2.4.4. Determination of Surface Color
The color of litchi powder was measured using a colorimeter (NR60CP, Shenzhen ThreeNH Technology Co., Ltd.) and expressed in CIE Lab* values. Whiteness index (WI) and yellowness index (YI) were calculated as:
where L*, a*, and b* are lightness, red-green, and yellow-blue values, respectively.
2.4.5. Determination of Antioxidant Activity
The DPPH radical scavenging activity, ABTS radical scavenging activity, and FRAP were quantified by absorbance measurements using a UV-Vis spectrophotometer. For sample pretreatment, 1 g of litchi fruit powder was dissolved in 10 mL deionized water, vortexed thoroughly, and centrifuged at 10,000 rpm for 10 min to collect the supernatant.
The FRAP was determined using a Total Antioxidant Capacity (T-AOC) assay kit in accordance with the manufacturer’s instructions, and results were expressed as μg trolox equivalents per mg dry weight (μg TE/mg DW).
DPPH radical scavenging activity was determined using an optimized method [20]. Specifically, 0.1 mL of the supernatant was added to 3.9 mL of DPPH solution in a light-resistant centrifuge tube, vortexed, and incubated in the dark at 25 °C for 30 min. Absorbance was measured at 517 nm against a 95% ethanol blank, with distilled water used for zero calibration. The DPPH radical scavenging rate was calculated as:
where A0 and A1 are the absorbance of the control (without test sample) and sample, respectively.
ABTS radical scavenging activity was determined according to Yang et al. [21] with slight modifications. Specifically, 0.1 mL of the supernatant was added to a 10 mL light-resistant centrifuge tube containing 3.9 mL of ABTS working solution, vortexed, and incubated in the dark at 25 °C for 30 min. Absorbance was measured at 734 nm, using a 95% ethanol solution as the control and distilled water for zero calibration. The ABTS radical scavenging rate was calculated as:
where A0 and A1 are the absorbance of the control (without test sample) and sample, respectively.
2.5. Data Analysis
All experiments were conducted in triplicate, and the results were expressed as mean ± standard deviation (SD). Statistical significance among groups was assessed using one-way analysis of variance (ANOVA), with differences considered significant at p < 0.05.
3. Results and Discussion
This section may be divided by subheadings. It should provide a concise and precise description of the experimental results, their interpretation, as well as the experimental conclusions that can be drawn.
3.1. Raw Material Chemical Composition
3.1.1. Variations in Nutrient Composition Among Litchi Cultivars
Figure 1A displayed the representative external pericarp and internal pulp morphology of the ten litchi cultivars, including variations in fruit size, shape, and color. Figure 1B showed notable differences in total sugar content among the ten litchi cultivars, which ranged from 128.07 ± 4.26a to 260.13 ± 5.72e mg/mL. Fenghuangli exhibited the highest value (260.13 ± 5.72e mg/mL), whereas Baitangying had the lowest (128.07 ± 4.26a mg/mL). Jizuili presented an intermediate level (176.27 ± 4.85bc mg/mL). Total sugar, comprising soluble sugars and insoluble polysaccharides, was a key determinant of fruit quality, with soluble sugars largely contributing to the sweetness and flavor profile of litchi pulp [22]. As shown in Figure 1C, reducing sugar content also varied significantly across cultivars, with values ranging from 48.01 ± 1.52a to 160.24 ± 2.91f mg/mL. Feizixiao recorded the highest level (160.24 ± 2.91f mg/mL), followed by Jizuili (86.33 ± 0.43b mg/mL), while Baitangying had the lowest (48.01 ± 1.52a mg/mL).
Figure 1D showed the variations in glucose, fructose, and sucrose contents. Heiye had the highest glucose (8.35 ± 0.92c g/100 g), Feizixiao the highest fructose (5.63 ± 0.64d g/100 g), and Fenghuangli the highest sucrose (3.95 ± 0.01d g/100 g). Correlation analysis indicated that cultivars rich in glucose and fructose accumulated less sucrose. For example, Feizixiao and Heiye contained abundant monosaccharides but had sucrose levels among the lowest, sometimes below detection. This pattern reflects sugar metabolism during maturation, where sucrose is enzymatically hydrolyzed into glucose and fructose [23]. Such differences in low-molecular-weight sugars may also affect the glass transition temperature of litchi powder and thus its processing performance [24].
Figure 1E showed soluble solids content (SSC), which ranged from 13.33 ± 0.06a% to 19.67 ± 0.06g%. Feizixiao and Guiwei had the highest SSC, while Baitangying was the lowest. SSC, representing sugars, acids, and other soluble compounds, is a critical quality parameter [25]. Combined with Figure 1A, results showed Baitangying had the lowest reducing sugar (48.01 ± 1.52a mg/mL) and SSC (13.33 ± 0.06a%), and Jizuili also ranked low. These results suggest a positive correlation between reducing sugar and SSC, though other solutes (such as non-reducing sugars, organic acids, vitamins, and minerals) also contribute [26].
Figure 1F showed the soluble protein content of different litchi cultivars. The soluble protein levels ranged from 1227 ± 37a μg/mL to 3210 ± 30h μg/mL, with Fenghuangli having the highest content and Feizixiao the lowest. Thaumatin-like protein (LcTLP) belongs to the PR-5 family, a group of pathogenesis-related proteins involved in plant defense responses [15]. As shown in Figure 1G, LcTLP levels were closely associated with fruit maturity, being the highest in the early-maturing cultivar Feizixiao and the lowest in the late-maturing cultivar Guiwei. LcTLP ranged from 1.26 ± 0.06a μg/mL to 8.44 ± 0.05a mg/100 g. Higher LcTLP levels were linked to immunoreactivity in litchi pulp, which may increase the risk of inflammatory responses [27]. In contrast, Guiwei showed the lowest LcTLP, indicating a relatively lower allergenic potential.
3.1.2. Variations in Acidity and SSC/TA Ratio Among Litchi Cultivars
Figure 2A-C showed the variations in pH, titratable acidity (TA), and SSC/TA ratio among litchi cultivars. The pH values ranged from 5.06 ± 0.015bc (Jizuili) to 6.62 ± 0.060a (Baitangying) (Figure 2A), indicating significant cultivar-dependent differences. These variations are primarily governed by the combined effects of organic acid composition, acidic amino acids, and the buffering capacity of mineral ions in the pulp [28]. Notably, the Baitangying, Yuezhouhong, and Fenghuangli exhibited higher pH values than other cultivars, reflecting their lower organic acid accumulation and milder acidity. In contrast, Jizuili presented the lowest pH, corresponding to stronger acidity.
TA is an important indicator of fruit maturity and sourness perception, also varied considerably among cultivars (Figure 2B). Feizixiao recorded the highest TA level (0.188 ± 0.006a%), followed by Heiye, Jizuili, and Guanxiangli at intermediate levels. In contrast, Yuezhouhong, Fenghuangli, and Baitangying showed the lowest TA values (< 0.07%). These variations are attributable to differences in the accumulation of citric, malic, and tartaric acids, which are key determinants of flavor balance [29,30].
Figure 2C illustrated significant variations in the SSC/TA ratio among litchi cultivars. As a key biochemical parameter, the SSC/TA ratio reflects the balance between soluble sugars and organic acids, thereby serving as an important index of fruit maturity and flavor quality [30]. Feizixiao (104.61 ± 0.31e) and Baila (96.23 ± 2.20e) exhibited the lowest ratios, corresponding to weaker sweetness, whereas Baitangying (350.88 ± 1.52a) and Fenghuangli (400.72 ± 8.23a) showed the highest values, indicative of pronounced sweetness and superior sensory quality. In general, cultivars with higher SSC/TA ratios possess better palatability, providing a practical guideline for cultivar selection for either fresh consumption or processing [31].
3.1.3. Variations in Total Phenolic Content (TPC) Among Litchi Cultivars
Figure 2D illustrated the variations in TPC among litchi cultivars. TPC is widely recognized as an indicator of antioxidant capacity, and cultivars with higher TPC generally exhibit stronger antioxidant activity [32]. Feizixiao showed the highest TPC (696.07 ± 25.54d mg/L), whereas Guanxiangli presented the lowest (279.73 ± 3.51a mg/L). Intermediate levels were observed in Jingganghongnuo, Guiwei, Baitangying, and Jizuili, ranging from 388.07 ± 8.96c mg/L to 399.07 ± 25.03c mg/L. These findings highlight Feizixiao as a superior cultivar for functional product development and provide a basis for breeding strategies aimed at enhancing phenolic content and antioxidant capacity in litchi.
3.2. Litchi Fruit Powder Processing and Physical Properties
3.2.1. Effects of Litchi Cultivars on Powder Yield and Particle Size Distribution
Figure 3A illustrated the effect of different litchi cultivars on the powder yield, a key measure of production efficiency. Baitangying showed the highest yield (89.23 ± 1.25e%), followed by Jizuili (86.60 ± 0.20d%) and Jingganghongnuo (86.20 ± 0.40d%), while Baila was the lowest (74.63 ± 0.45a%). High-yield cultivars likely benefited from higher soluble solids or more favorable sugar–acid profiles (Figure 1 and 2), which improved drying behavior. These results highlight suitable cultivars for efficient litchi powder production.
Table 1 presented the particle size distribution characteristics of litchi fruit powder from ten different cultivars. Heiye, Guiwei, and Feizixiao exhibited the lowest dispersion indices (1.94 ± 0.06g μm, 2.28 ± 0.05g μm, and 2.62 ± 0.02g μm), reflecting superior homogeneity. Such uniformity is generally associated with improved powder flowability due to reduced interparticle cohesion and agglomeration [33]. In contrast, cultivars with larger particle size ranges and higher dispersion values, such as Yuezhouhong and Guanxiangli, may show inferior flow properties, which could limit their applicability in instant beverage or functional food formulations [34]. Moreover, powders with smaller and more uniform particles tend to exhibit greater surface area and denser packing, which can enhance their stability during storage and reconstitution, while coarser powders with wide distributions are more susceptible to caking and uneven hydration behavior [35]. These results suggest that the particle size distribution plays a critical role in determining the physical quality and reconstitution performance of litchi fruit powders.
3.2.2. Effects of Litchi Cultivars on Powder Moisture Content and Hygroscopicity
Figure 3B demonstrated significant differences in moisture content among litchi cultivars. Guiwei (4.59 ± 0.51a%), Baila (5.66 ± 0.28ab%), Baitangying (5.54 ± 0.26ab%), and Jizuili (5.60 ± 0.19ab%) formed the low-moisture group. In contrast, Feizixiao and Guanxiangli > 7%, significantly higher than other cultivars. Low moisture content is critical for fruit powder quality and shelf life, as it suppresses microbial growth, non-enzymatic browning, and bioactive compound degradation while improving stability and reducing caking [36,37]. Figure 3C revealed significant differences in powder hygroscopicity. Guiwei (18.45 ± 0.18c%), Feizixiao (18.16 ± 0.40bc%), and Heiye (18.02 ± 0.43abc%) showed the highest values, while all other cultivars remained < 18%. Low hygroscopicity is essential for powder quality, as it reduces water uptake, mitigating risks of caking, microbial proliferation, and degradation of bioactive compounds, thereby extending storage stability [38]. Notably, cultivars with higher reducing sugar contents, such as Feizixiao (Figure 1B), tended to exhibit increased hygroscopicity (Figure 3C). This could be attributed to the strong water-binding capacity of low-molecular-weight reducing sugars, which has been reported to promote moisture absorption and lower the glass transition temperature of fruit powders.
3.2.3. Effects of Litchi Cultivars on Powder Solubility
Figure 3D showed significant differences in powder solubility among litchi cultivars. Baitangying (98.17 ± 0.49e%), Baila (97.62 ± 0.40e%), and Jizuili (96.40 ± 0.33d%) exhibited significantly higher solubility than Feizixiao (92.79 ± 0.07a%), Fenghuangli (92.48 ± 0.6a%), and Guanxiangli (93.19 ± 0.10a%). These differences are likely related to intrinsic factors such as powder composition and particle size distribution [39,40].
3.3. Product Quality and Functional Properties
3.3.1. Effects of Litchi Cultivars on Powder Colorimetric Properties
Table 2 presented the colorimetric properties of litchi fruit powder obtained from ten different cultivars. Firstly, significant differences were observed in lightness among cultivars. Heiye (89.75 ± 0.11a) and Feizixiao (89.59 ± 0.20a) exhibited the highest L* values, whereas Guanxiangli showed the lowest (82.10 ± 0.22c), suggesting that more severe non-enzymatic browning or Maillard reactions might have occurred during processing. In terms of chromaticity, Feizixiao displayed distinct properties with the lowest a* value (–2.12 ± 0.09c), reflecting the strongest greenish tendency, and the highest b* value (10.82 ± 0.44a), indicating the most pronounced yellowness. In contrast, Guiwei (a* = –0.46 ± 0.03a, b* = 4.69 ± 0.40abc) and Fenghuangli (a* = –0.47 ± 0.01a, b* = 4.82 ± 0.06abc) exhibited the most balanced chromaticity values. Importantly, Guiwei (88.47 ± 0.17a) and Fenghuangli (88.53 ± 0.04a) had the highest WI and the lowest YI (9.66 ± 0.84c and 9.90 ± 0.12b), indicating that their powders possessed the highest purity, the lowest yellow pigment content, and the best overall color quality. These differences mainly originate from intrinsic cultivar traits, including natural pigment composition, phenolic content, and enzymatic activity. The superior color stability of Guiwei and Fenghuangli is likely associated with their lower polyphenol oxidase activity and higher antioxidant levels, which effectively inhibit both enzymatic and non-enzymatic browning during processing.
3.3.2. Effects of Litchi Cultivars on Powder Antioxidant Capacity
The antioxidant capacity of litchi fruit powder varied significantly among cultivars (p < 0.05; Table 3). The DPPH radical scavenging activity showed the largest divergence, ranging from 13.30 ± 2.60a% (Baila) to 55.06 ± 1.99d% (Jingganghongnuo). Jingganghongnuo, Feizixiao (51.47 ± 2.13d%), and Heiye (50.22 ± 2.04d%) consistently exhibited > 50%, while Baitangying, Guiwei, Yuezhouhong and Jizuili clustered between 28.90 ± 3.58bc% to 36.14 ± 3.85c%. The remaining cultivars generally exhibited values < 22%, indicating a relatively weak radical scavenging ability. The ABTS radical scavenging activity of litchi powders was generally high across cultivars. Baitangying showed the strongest activity (79.39 ± 4.13d%), whereas Guiwei exhibited the lowest (57.27 ± 2.88a%). Yuezhouhong, Jizuili, Fenghuangli, Guixiangli, and Baila clustered within 70.72 ± 0.48cd% to 79.39 ± 4.13d%, while the remaining cultivars were < 70%.
Compared with DPPH, the variation in ABTS activity was less pronounced, suggesting that water-soluble antioxidants such as phenolics and ascorbic acid are more broadly distributed among cultivars. FRAP results further confirmed cultivar-dependent differences. Feizixiao (19.36 ± 0.12g μg TE/mg DW) and Jingganhongnuo (17.38 ± 0.33f μgTE/mg DW) exhibited the strongest reducing capacity, while Baitangying, Heiye, and Jizuili showed medium values (11.24 ± 0.12c μg TE/mg DW to 13.31 ± 0.35e μg TE/mg DW), and most other cultivars were < 11 μg TE/mg DW. Overall, Feizixiao and Jingganhongnuo demonstrated broad-spectrum antioxidant activities across assays, whereas Baitangying and Jizuili performed particularly well in ABTS activity. Collectively, the complementary results of DPPH, ABTS, and FRAP assays suggest that cultivar-specific antioxidant properties are largely determined by phenolic and ascorbic acid contents. This conclusion is consistent with previous reports highlighting the key contributions of total phenolics and vitamin C to the antioxidant activity of fruits [41,42], providing a basis for the differentiated utilization of high-antioxidant litchi cultivars in functional food development.
3.3.3. Effects of Litchi Cultivars on Powder Glass Transition Temperature (Tg)
Figure 4 presented the Tg of litchi fruit powders from ten different cultivars. Baitangying exhibited the highest Tg (52.17 ± 2.00e °C), followed by Jizhuili (50.39 ± 0.19de °C), while Feizixiao showed the lowest (38.76 ± 0.47a °C). Tg is a key parameter for powder stability, as powders remain in a stable glassy state below Tg but transform into a rubbery state above Tg, leading to caking and wall adhesion during storage and processing [43,44]. The significant cultivar-dependent differences in Tg are mainly attributed to the chemical composition of raw fruits. Low-molecular-weight sugars, organic acids, and residual moisture retained during spray drying markedly decrease Tg through plasticizing effects [24,45]. The initial chemical profile of the raw material is a crucial factor controlling Tg and storage stability of the powders.
3.4. Correlations Between Litchi Fruit Characteristics and Powder Yield and Quality
Spearman correlation analysis was performed to clarify the independent effects of litchi fruit traits on powder yield and quality (Figure 5). The results indicated that sugar–acid profiles, moisture content, and protein composition were the main determinants of processing performance and final product quality. Powder yield was strongly constrained by sugar–acid composition, showing negative correlations with fructose (ρ = –0.794, p < 0.001) and titratable acidity (ρ = –0.770, p < 0.001). This suggests that fruits with higher sugar and acid contents exhibited reduced powder production efficiency.
The Tg was significantly affected by small molecular components. Reducing sugars (ρ = –0.794, p < 0.001), soluble solids content (ρ = –0.806, p < 0.001), and moisture (ρ = –0.648, p < 0.05) correlated negatively with Tg, confirming their plasticizing effect in lowering Tg. Conversely, Tg correlated positively with solubility (ρ = 0.673, p < 0.05), indicating that higher Tg enhanced powder dissolution performance. Color quality was also governed by acidity and water content. The whiteness index correlated negatively with titratable acidity (ρ = –0.782, p < 0.001) but positively with sucrose (ρ = 0.772, p < 0.001) and the SSC/TA ratio (ρ = 0.697, p < 0.001), suggesting that high acidity promoted browning, whereas high sucrose and balanced sugar–acid ratios contributed to improved lightness. In contrast, the yellowness index increased with moisture (ρ = 0.648, p < 0.05) and decreased with titratable acidity (ρ = –0.503, p < 0.05), implying that high water favored non-enzymatic browning while lower acidity facilitated yellow pigment development.
Antioxidant capacity exhibited consistent associations. DPPH, FRAP, and TPC were positively correlated (ρ > 0.794, p < 0.001; ρ > 0.661, p < 0.05), confirming phenolic compounds as the primary contributors. Additionally, LcTLP content correlated strongly with FRAP (ρ = 0.830, p < 0.001), suggesting that this protein may directly or indirectly regulate antioxidant properties in litchi powder.
4. Conclusions
This study explored the influence of litchi cultivar variations on the processing adaptability and quality of spray-dried fruit powder. Fruit from ten litchi cultivars were processed into powder, and their chemical composition, powder yield, physical properties, color, antioxidant capacity, and thermal stability were systematically evaluated. Cultivars with elevated fructose and titratable acidity (TA) demonstrated markedly diminished powder yields, while increased levels of reducing sugars, soluble solids, and moisture significantly reduced the glass transition temperature (Tg), thereby adversely affecting storage stability. Higher Tg contributed to improved dissolution performance. Acidity promoted browning and reduced whiteness, whereas sucrose supported color lightness. Moisture content was associated with increased yellowness. Antioxidant capacity was consistent across evaluation methods and strongly correlated with phenolic compounds. Notably, LcTLP content showed a significant positive correlation with FRAP activity, suggesting its potential role in modulating antioxidant properties. Cultivars such as Baitangying and Jizuili, characterized by lower acidity, moderate sugar content, and higher phenolic levels, demonstrated superior overall powder quality, including higher yield, desirable physical properties, and improved storage stability. These findings provide critical insights for the selection of litchi cultivars optimized for the industrial production of high-quality fruit powder and value-added products.
Author Contributions
Yu-kui Zhu: Methodology, Investigation, Writing - original draft, review & editing. Zhuo-wei Liu: Data curation, Software, Formal analysis, Writing - original draft, review & editing. Yao-hua Zhong: Formal analysis, Methodology. Rui-pu Xia: Supervision, Formal analysis. Lei Zhao: Conceptualization, Methodology, Writing - review & editing, Project administration, Funding acquisition. All authors have read and agreed to the published version of the manuscript.
Funding
This research received no external funding.
Institutional Review Board Statement
Not applicable.
Informed Consent Statement
Not applicable.
Data Availability Statement
Data available from the authors, upon reasonable request.
Acknowledgments
The work was supported by the Science and Technology Planning Project of Guangzhou City (2023B01J2004), Innovation Team of Guangdong Modern Agricultural Industry Technology System(2024CXTD19), National Key R&D Program (2024YFD1600300).
Conflicts of Interest
The authors declare no conflicts of interest.
Abbreviations
The following abbreviations are used in this manuscript:
| Tg | Glass transition temperature |
| HAD | Hot air drying |
| VFD | Vacuum freeze drying |
| SD | Spray drying |
| DPPH | 2,2-diphenyl-1-picrylhydrazyl |
| ABTS | 2,2'-azino-bis (3-ethylbenzothiazoline-6-sulfonic acid) |
| FRAP | Ferric Reducing Antioxidant Power |
| BSA | Bovine serum albumin |
| MD | Maltodextrin |
| WPI | Whey protein isolate |
| DNS | Dinitrosalicylic acid |
| TA | Titratable acidity |
| SSC | Soluble solids content |
| RID | Refractive index detector |
| LcTLP | Litchi Thaumatin-like protein |
| WI | Whiteness index |
| YI | Yellowness index |
| T-AOC | Total Antioxidant Capacity |
| SSC/TA | Soluble solids to titratable acidity ratio |
References
- Zhao, L.; Wang, K.; Wang, K.; Zhu, J.; Hu, Z. Nutrient components, health benefits, and safety of litchi (Litchi chinensis Sonn.): A review. Compr. Rev. Food Sci. Food Saf. 2020, 19(4), 2139-2163. [CrossRef]
- Lu, Y.; Lnong, X.; Mao, Y.; Qin, L.; Liao, X.; Zhao, L. Structural characterization and hypoglycemic activity of a polysaccharide from Litchi chinensis Sonn. (litchi) pericarp. Food Chem. 2025, 493(3), 145994. [CrossRef]
- Torres-Becerril, M.; Zaldivar Cruz, J. Manuel; Ojeda-Enciso, L.A. Lychee (Lychee chinensis Sonn.), composition and possible applications. Agro Pesq. 2024, 14(1), 41-52. [CrossRef]
- Tian, H.; Wang, K.; Lan, H.; Wang, Y.; Hu, Z.; Zhao, L. Effect of hybrid gelator systems of beeswax-carrageenan-xanthan on rheological properties and printability of litchi inks for 3D food printing. Food Hydrocolloids 2021, 113, 106482. [CrossRef]
- Punia, S.; Kumar, M. Litchi (Litchi chinenis) seed: Nutritional profile, bioactivities, and its industrial applications. Trends Food Sci. Technol. 2021, 108, 58-70. [CrossRef]
- Huang, C.; Paull, R.; Wang, T. T. Litchi postharvest physiology and handling. Crop Sci. 2024, 64(4). [CrossRef]
- Zhang, J.; Chen, J.; Lan, J.; Liu, B.; Wang, X.; Zhang, S.; Zuo, Y. Effect of Different Drying Techniques on the Bioactive Compounds, Antioxidant Ability, Sensory and Volatile Flavor Compounds of Mulberry. Foods 2024, 13(16), 2492. [CrossRef]
- Shubhashish, S.; Kumar, S.; Rajput, R. Innovations in Spray Drying Technology: Enhancing Food Processing and Nutritional Preservation. Eur. J. Nutr. Food Saf. 2025, 17(4), 216-228. [CrossRef]
- Yang, Q.; Yi, X.; Xiao, H.; Wang, X.; Liu, L.; Tang, Z.; Hu, C.; Li, X. Effects of Different Drying Methods on Drying Characteristics, Microstructure, Quality, and Energy Consumption of Apricot Slices. Foods 2024, 13 (9), 1295. [CrossRef]
- Hnin, K. K.; Zhang, M.; Ju, R.; Wang, B. A novel infrared pulse-spouted freeze drying on the drying kinetics, energy consumption and quality of edible rose flowers. LWT 2021, 136(1), 110318. [CrossRef]
- Sosnik, A.; Seremeta, K. Advantages and challenges of the spray-drying technology for the production of pure drug particles and drug-loaded polymeric carriers. Adv. Colloid Interface Sci. 2015, 223, 40-54. [CrossRef]
- Moreira, M. T. C. Spray drying of lactic acid bacteria: understanding cell viability and strate- gies to reduce operational costs during drying of Lactococcus lactis subsp. lactis. Ph.D., Universidade Federal de Viçosa, Viçosa - Minas Gerais, Brazil, 2022. [CrossRef]
- Sesta, G. Determination of Sugars in Royal Jelly by HPLC. Apidologie 2006, 37 (1), 84–90. [CrossRef]
- Bradford, M. M. A rapid and sensitive method for the quantitation of microgram quantities of protein utilizing the principle of protein-dye binding. Anal. Biochem. 1976, 72, 248-254. [CrossRef]
- Chen H, Wang K, Xiao H, Hu Z, Zhao L. Structural Characterization and Pro-inflammatory Activity of a Thaumatin-Like Protein from Pulp Tissues of Litchi chinensis. J. Agric. Food Chem. 2020, 68(23), 6439-6447. [CrossRef]
- Etzbach, L.; Meinert, M.; Faber, T.; Klein, C.; Schieber, A.; Weber, F. Effects of carrier agents on powder properties, stability of carotenoids, and encapsulation efficiency of goldenberry (Physalis peruviana L.) powder produced by co-current spray drying. Curr. Res. Food Sci. 2020, 3, 73-81. [CrossRef]
- Caparino, O. A.; Tang, J.; Nindo, C. I.; Sablani, S. S.; Powers, J. R.; Fellman, J. K. Effect of drying methods on the physical properties and microstructures of mango (Philippine ‘Carabao’ var.) powder. J. Food Eng. 2012, 111(1), 135-148. [CrossRef]
- Li, C.; Li, W.; Zhang, X.; Wang, G.; Liu, X.; Wang, Y.; Sun, L. The changed structures of Cyperus esculentus protein decide its modified physicochemical characters: Effects of ball-milling, high pressure homogenization and cold plasma treatments on structural and functional properties of the protein. Food Chem. 2024, 430, 137042. [CrossRef]
- Kingwatee, N.; Apichartsrangkoon, A.; Chaikham, P.; Worametrachanon, S.; Techarung, J.; Pankasemsuk, T. Spray drying Lactobacillus casei 01 in litchijuice varied carrier materials. LWT 2015, 62(1), 847-853. [CrossRef]
- Huang, H.; Wang, L.; Bi, F.; Xiang, X. Combined Application of Malic Acid and Lycopene Maintains Content of Phenols, Antioxidant Activity, and Membrane Integrity to Delay the Pericarp Browning of Litchi Fruit During Storage. Front Nutr. 2022, 9, 849385. [CrossRef]
- Yang, Z.; Zhang, L.; Wu, Y.-H.; Li, D.-P.; Li, W. Evaluation of Chemical Constituents of Litchi Pericarp Extracts and Its Antioxidant Activity in Mice. Foods 2022, 11 (23), 3837. [CrossRef]
- Tian, X.; Zhu, L. H. U.; Hui, Z. O. U.; Baiyun, L. I.; Fengwang, M. A.; Mingjun, L. I. Research Progress on Accumulation Pattern and Regulation of Soluble Sugar in Fruit. Acta Hortic. Sin. 2023, 50(4), 885-895. [CrossRef]
- Aslam, M. M.; Deng, L.; Wang, X.; Wang, Y.; Pan, L.; Liu, H.; Niu, L.; Lu, Z.; Cui, G.; Zeng, W.; et al. Expression patterns of genes involved in sugar metabolism and accumulation during peach fruit development and ripening. Sci. Hortic. 2019, 257, 108633. [CrossRef]
- George, S.; Thomas, A.; Kumar, M. V. P.; Kamdod, A. S.; Rajput, A.; T, J. J.; Abdullah, S. Impact of processing parameters on the quality attributes of spray-dried powders: a review. Eur. Food Res. Technol. 2022, 249 (2), 241-257. [CrossRef]
- Huang, W.; Wu, Z.; Lu, J.; Shang, S.; Liu, H.; Ma, Y.; Kan, Q.; Chen, Y.; Cao, Y. The comparative study of the quality characteristics of frozen litchi under different thawing temperatures and heat-transfer coefficient: Effects on thawing characteristics, physicochemical properties, nutritional characteristics, and eating quality. LWT 2025, 226, 117959. [CrossRef]
- Gong, Z.; Zhi, Z.; Zhang, C.; Cao, D. Non-Destructive Detection of Soluble Solids Content in Fruits: A Review. Chem. 2025, 7 (4), 115.
- Zeng, S.; Wang, K.; Wu, G.; Liu, X.; Hu, Z.; Li, W.; Zhao, L. Time-specific ultrasonic treatment of litchi thaumatin-like protein inhibits inflammatory response in RAW264.7 macrophages via NF-κB and MAPK transduction pathways. Ultrason. Sonochem. 2023, 95, 106355. [CrossRef]
- Kader, A. A. Flavor quality of fruits and vegetables. J. Sci. Food Agric. 2008, 88 (11), 1863-1868. [CrossRef]
- Liu, Y.; Wu, Y.; Che, F.; Zhang, Z.; Chen, B. Physical–Chemical Composition and Quality Related Changes in “Ruaner” Pear (Pyrus ussuriensis) During Freezing–Thawing Period. Mol. 2019, 24 (14), 2611. [CrossRef]
- Zhou, J.; Yang, S.; Ma, Y.; Liu, Z.; Tu, H.; Wang, H.; Zhang, J.; Chen, Q.; He, W.; Li, M.; et al. Soluble sugar and organic acid composition and flavor evaluation of Chinese cherry fruits. Food Chem.:X 2023, 20, 100953. [CrossRef]
- Meng, Q.; Tan, T.; Feng, S.; Wen, Q.; Shang, J. Prediction and visualization map for physicochemical indices of kiwifruits by hyperspectral imaging. Front. Nutr. 2024, 11. [CrossRef]
- Xie, C.; Wang, K.; Liu, X.; Liu, G.; Hu, Z.; Zhao, L. Characterization and bioactivity of A-type procyanidins from litchi fruitlets at different degrees of development. Food Chem. 2023, 405(A), 134855. [CrossRef]
- Suhag, R.; Kellil, A.; Razem, M. Factors Influencing Food Powder Flowability. Powders 2024, 3(1), 65–76. [CrossRef]
- Lima, A. C. S.; Afonso, M. R. A.; Rodrigues, S.; Aquino, A. C. de. Flowability of spray-dried sapodilla pulp powder. J. Food Process Eng. 2022, 45(5), e13965. [CrossRef]
- Camacho, M. M.; Silva-Espinoza, M. A.; Martínez-Navarrete, N. Flowability, Rehydration Behaviour and Bioactive Compounds of an Orange Powder Product as Affected by Particle Size. Food Bioprocess Technol. 2022, 15, 683–692. [CrossRef]
- Pui, L. P.; Saleena, L. A. K.; Ghazali, H. M. Storage stability and anti-caking agents in spray-dried fruit powders: A review. Foods Raw Mater. 2024, 12(2), 229-239. [CrossRef]
- Erkmen, O., Bozoglu, T. F. Food Preservation by Reducing Water Activity. Food Microbiol.: Princ. Pract. 2016, 2, 44-58. [CrossRef]
- Chen, X.; Ting, J. L.; Peng, Y.; Tangjaidee, P.; Zhu, Y.; Li, Q.; Shan, Y.; Quek, S. Y. Comparing Three Types of Mandarin Powders Prepared via Microfluidic-Jet Spray Drying: Physical Properties, Phenolic Retention and Volatile Profiling. Foods 2021, 10(1), 123. [CrossRef]
- Rosland Abel, S. E.; Yusof, Y. A.; Chin, N. L.; Chang, L. S.; Ghazali, H. M.; Ghani, M. A.; Ishak, I. The effect of particle size on the physical properties of Arabic gum powder. J. Food Process Eng. 2020, 43 (4). [CrossRef]
- Saifullah, M.; Yusof, Y. A.; Chin, N. L.; Aziz, M. G. Physicochemical and flow properties of fruit powder and their effect on the dissolution of fast dissolving fruit powder tablets. Powder Technol. 2016, 301, 396-404. [CrossRef]
- Ňorbová, M., Vollmannová, A., Pintér, E., Šnirc, M., Franková, H., Fedorková, S., & Čeryová, N. THE CONTENT OF VITAMIN C AND ANTIOXIDANT ACTIVITY IN LESS-KNOWN TYPES OF FRUIT. J. Microbiol., Biotechnol. Food Sci., 2023, 13(1). [CrossRef]
- Sun, L., Xu, J., Nasrullah, Wang, L., Nie, Z., Huang, X., Sun, J., & Ke, F. Comprehensive studies of biological characteristics, phytochemical profiling, and antioxidant activities of two local citrus varieties in China. Front. Nutr., 2023, 10. [CrossRef]
- Geethamma, V. G.; Drupitha, M. P. Glass Transition Temperature of Polymers. Reson. 2024, 29, 1401-1420. [CrossRef]
- Fitzpatrick, J. J.; Hodnett, M.; Twomey, M.; Cerqueira, P. S. M.; O'Flynn, J.; Roos, Y. H. Glass transition and the flowability and caking of powders containing amorphous lactose. Powder Technol. 2007, 178 (2), 119-128. [CrossRef]
- Kawai, K. Glass Transition Properties and Quality Control of Food. Jpn. J. Food Eng. 2018, 19(1), 9-14. [CrossRef]
Figure 1.
Fruit appearance and nutritional composition of different litchi cultivars. (A) Representative external and internal morphology of ten litchi cultivars; (B) Total sugar content; (C) Reducing sugar content; (D) Contents of low-molecular-weight sugars (glucose, fructose, and sucrose); (E) Soluble solids content; (F) Soluble protein content; (G) Thaumatin-like protein content.
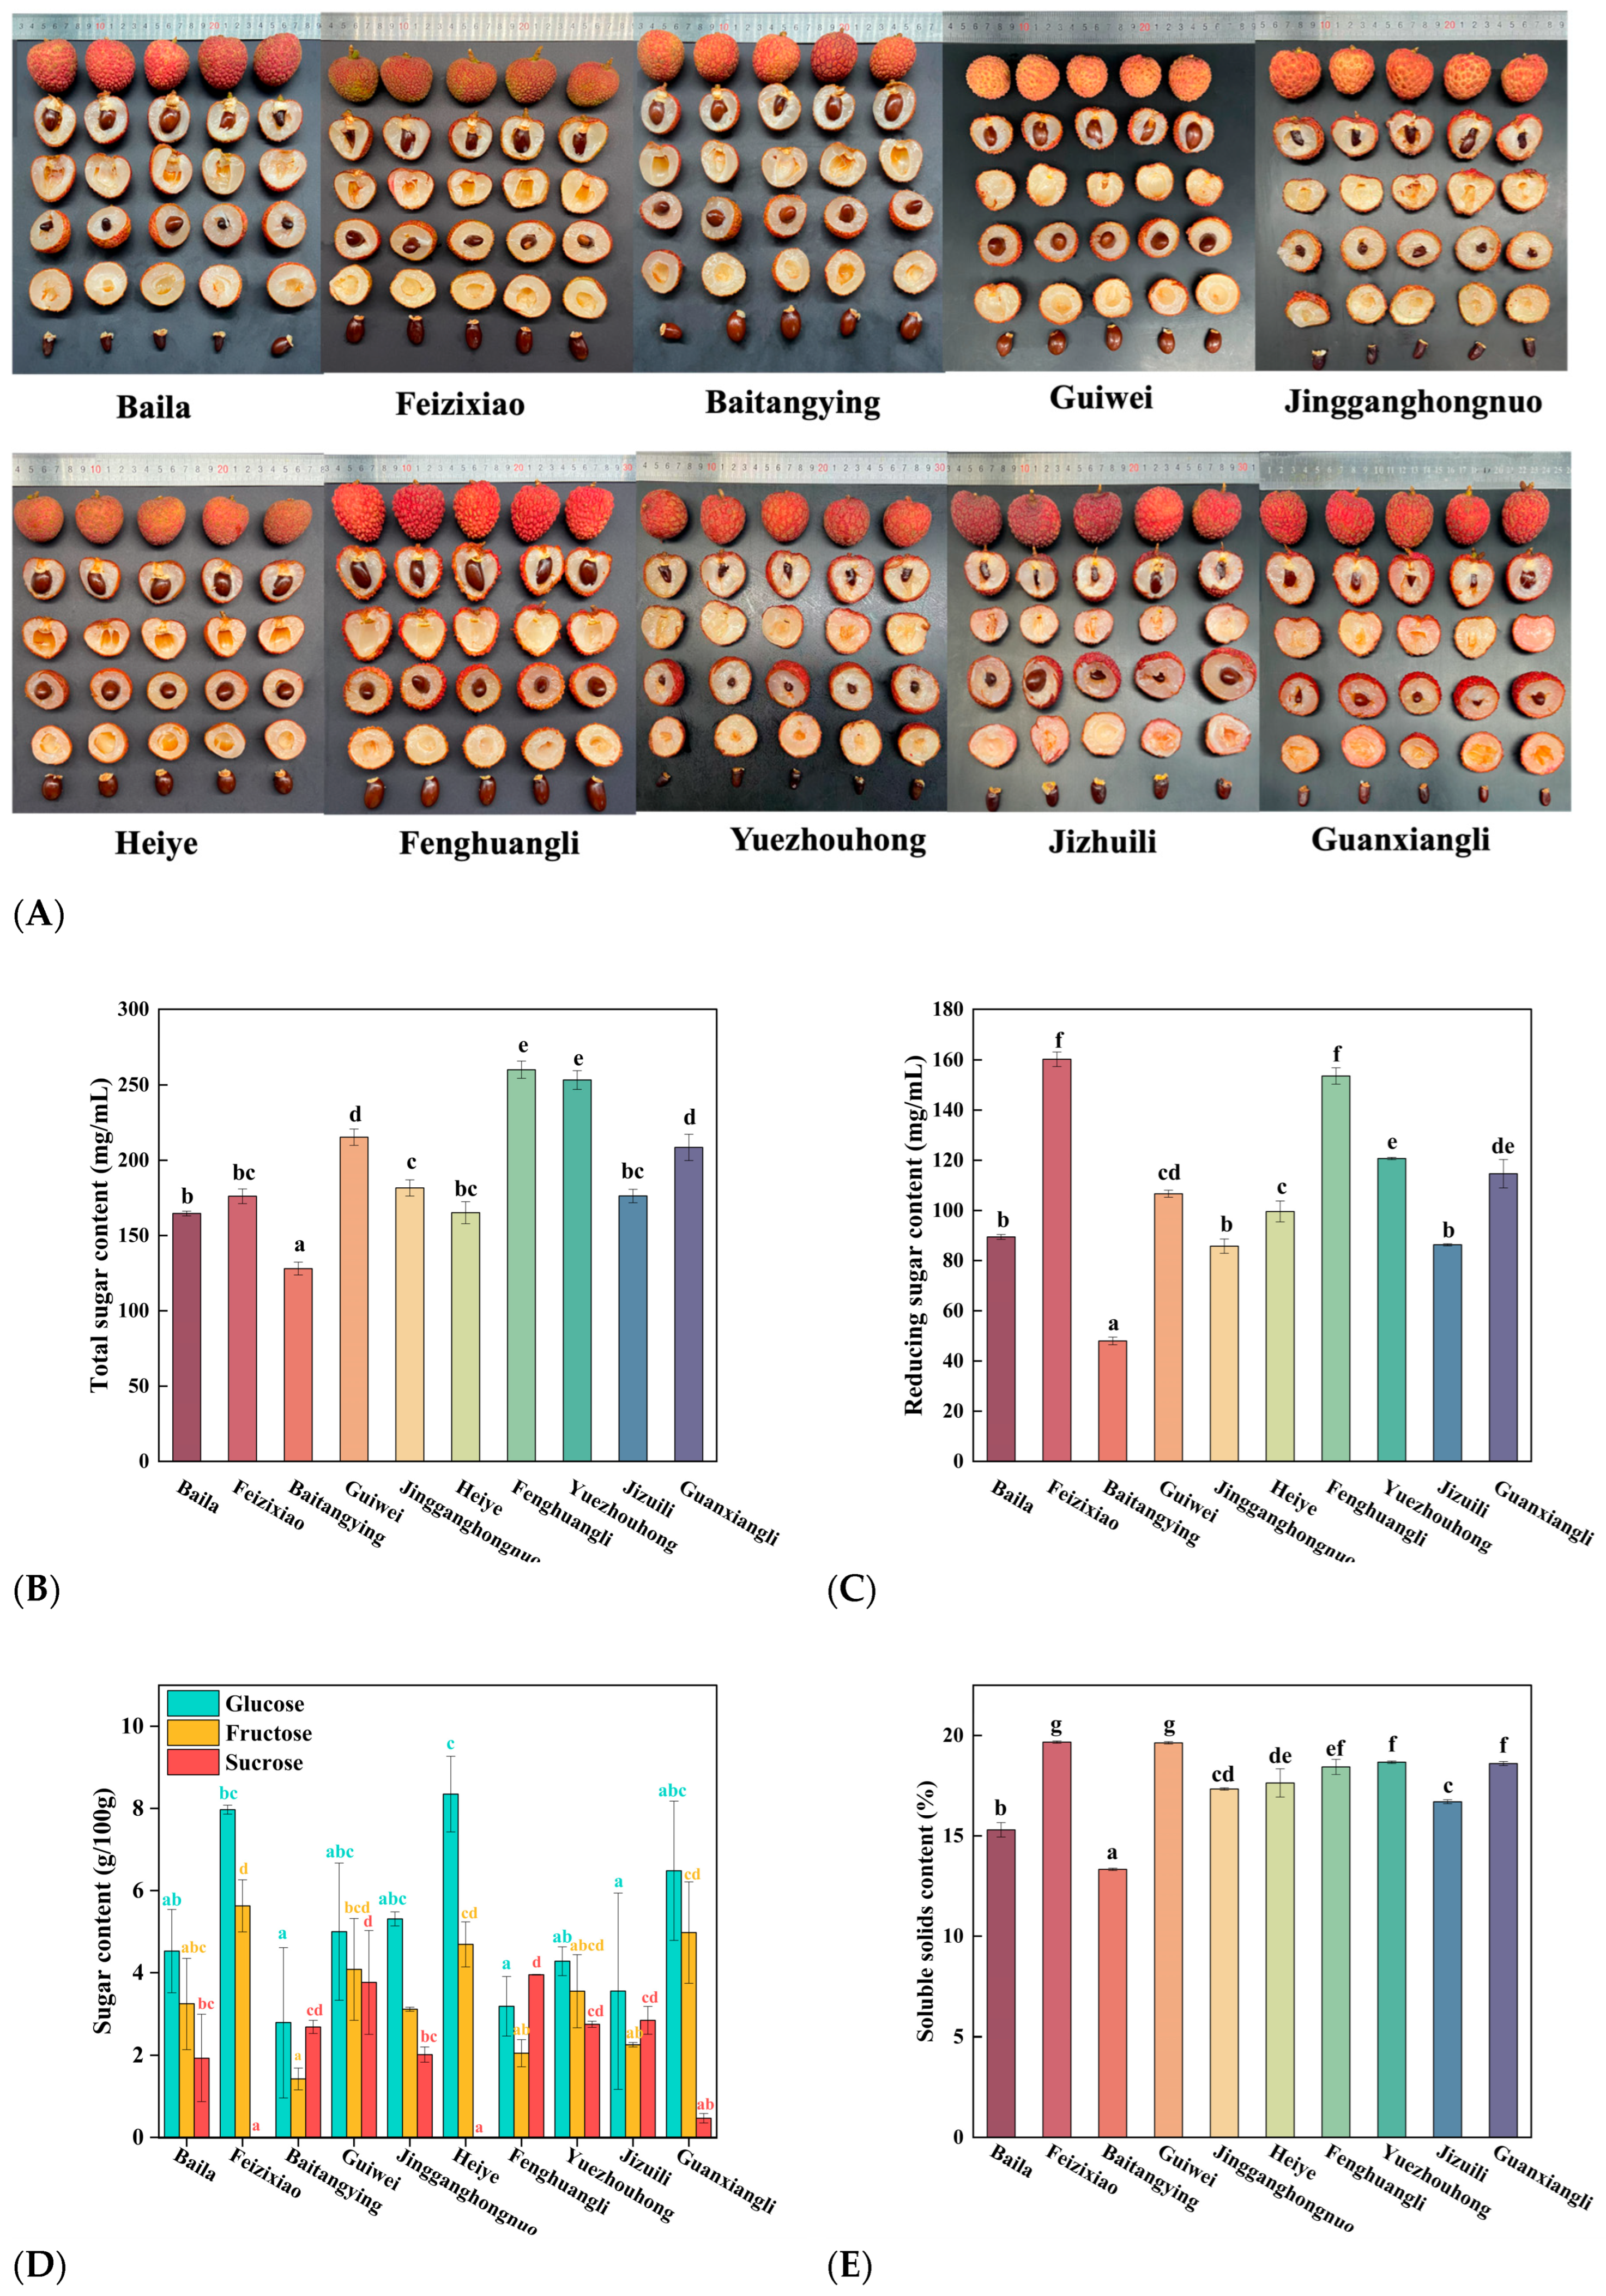
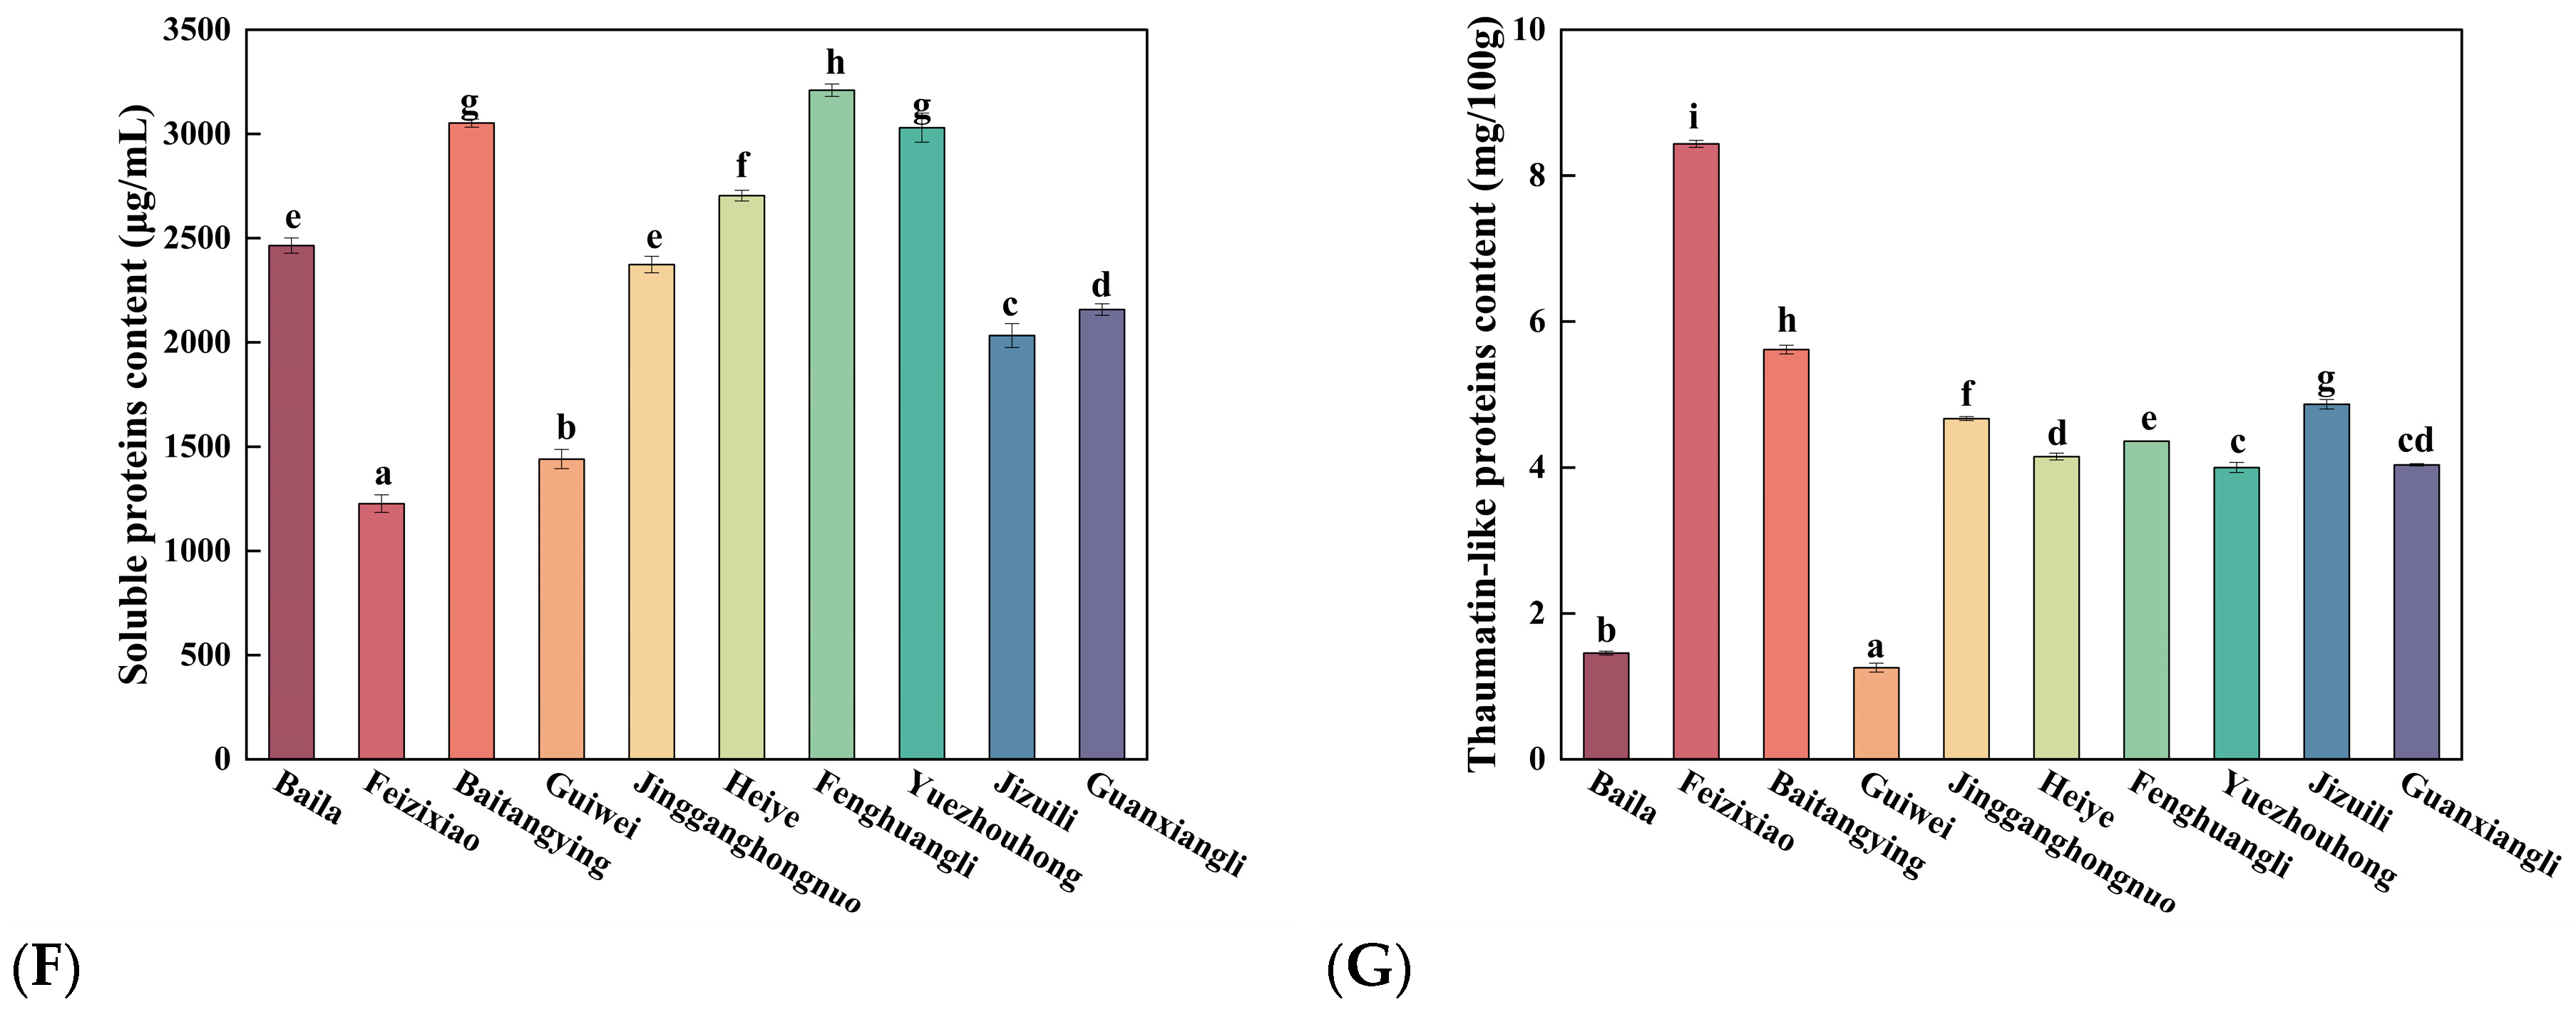
Figure 2.
Comprehensive analysis of physicochemical and bioactive properties in different litchi cultivars. (A) pH value, (B) titratable acidity (TA), (C) soluble solid to titratable acid ratio (SSC/TA), and (D) total phenolic content.
Figure 2.
Comprehensive analysis of physicochemical and bioactive properties in different litchi cultivars. (A) pH value, (B) titratable acidity (TA), (C) soluble solid to titratable acid ratio (SSC/TA), and (D) total phenolic content.
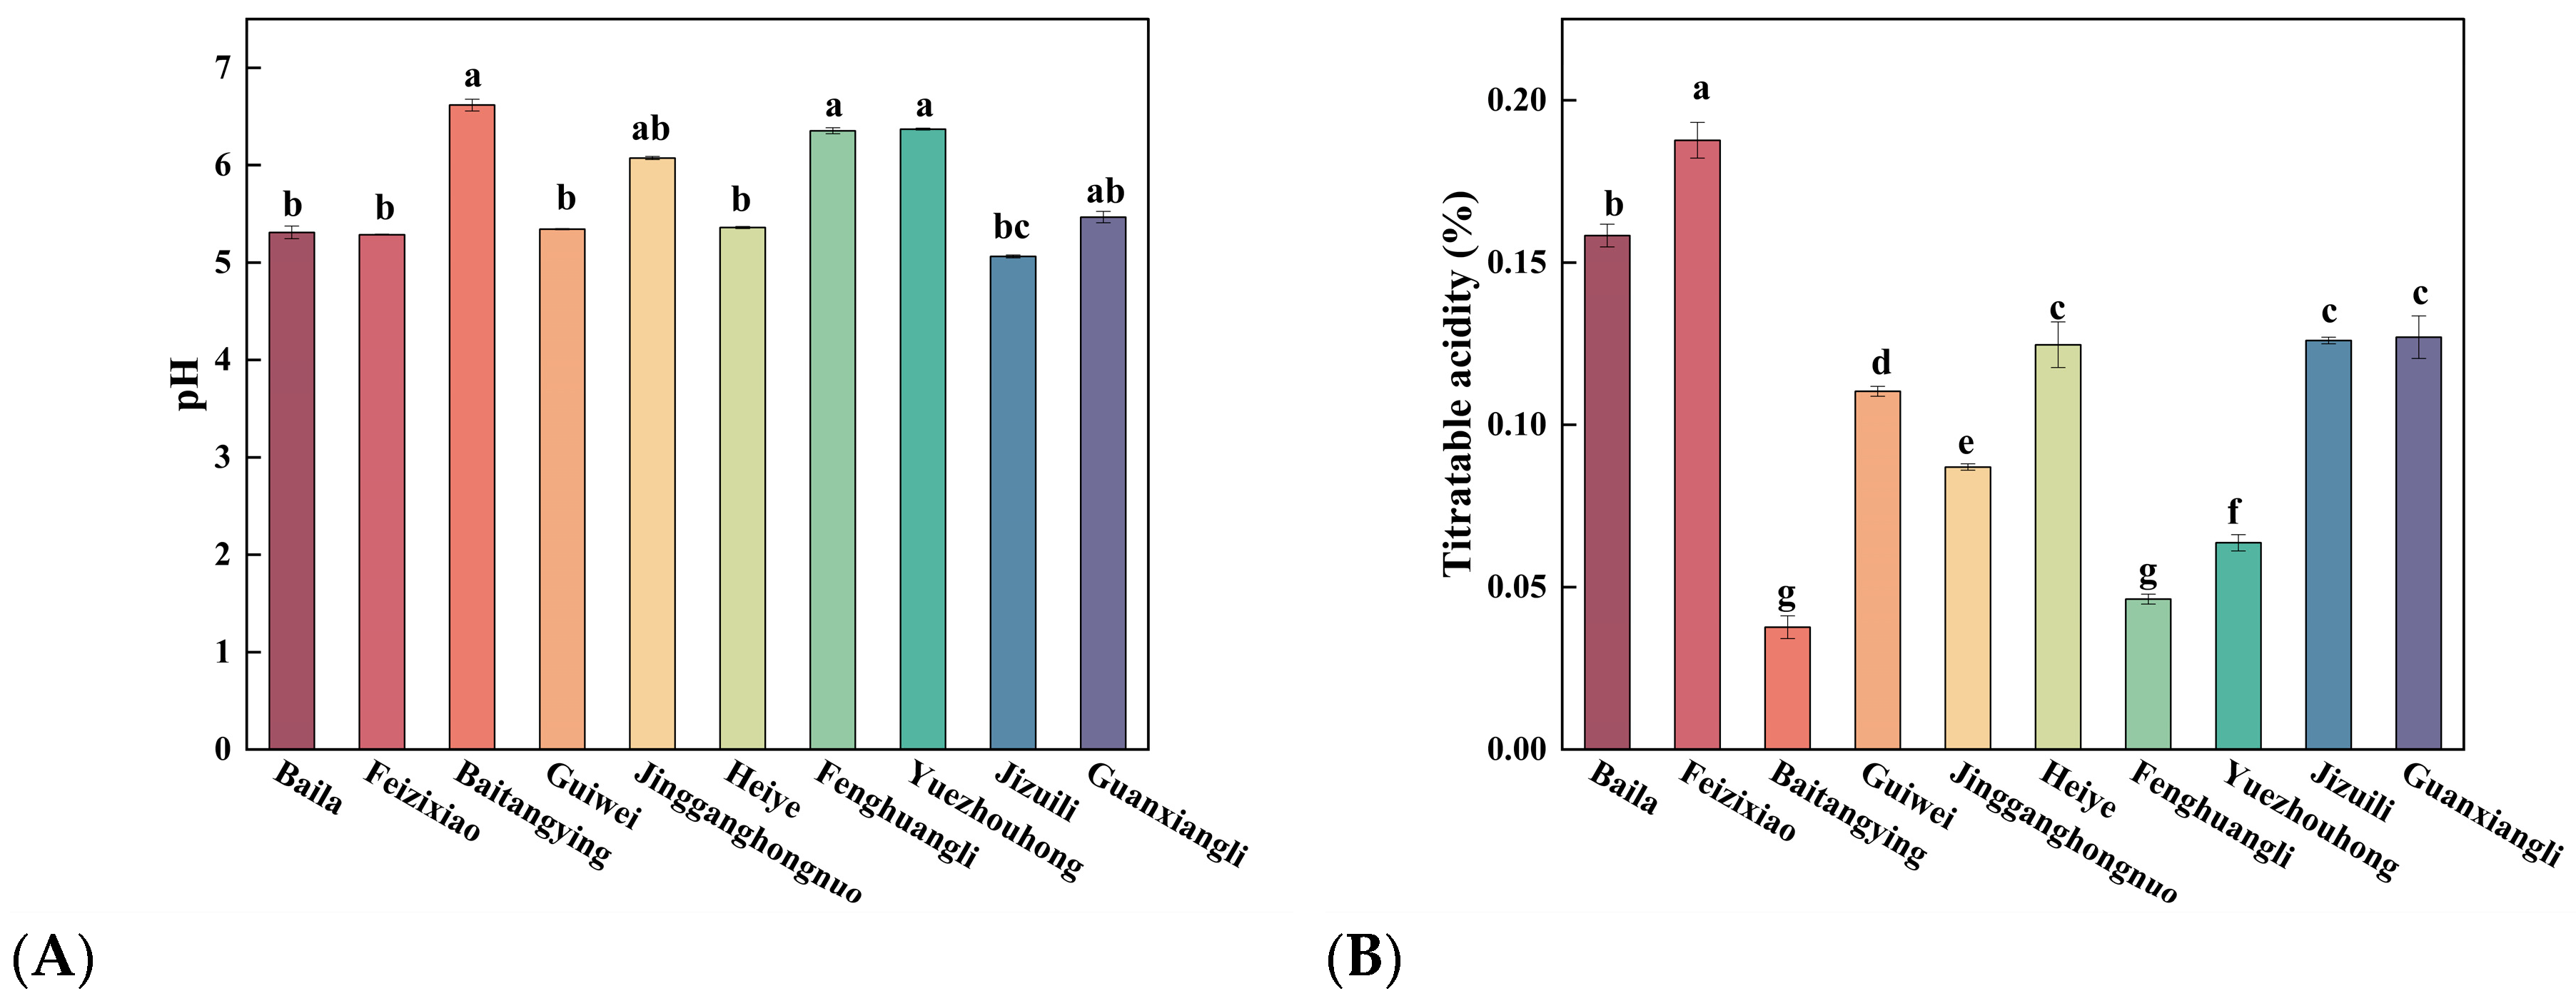
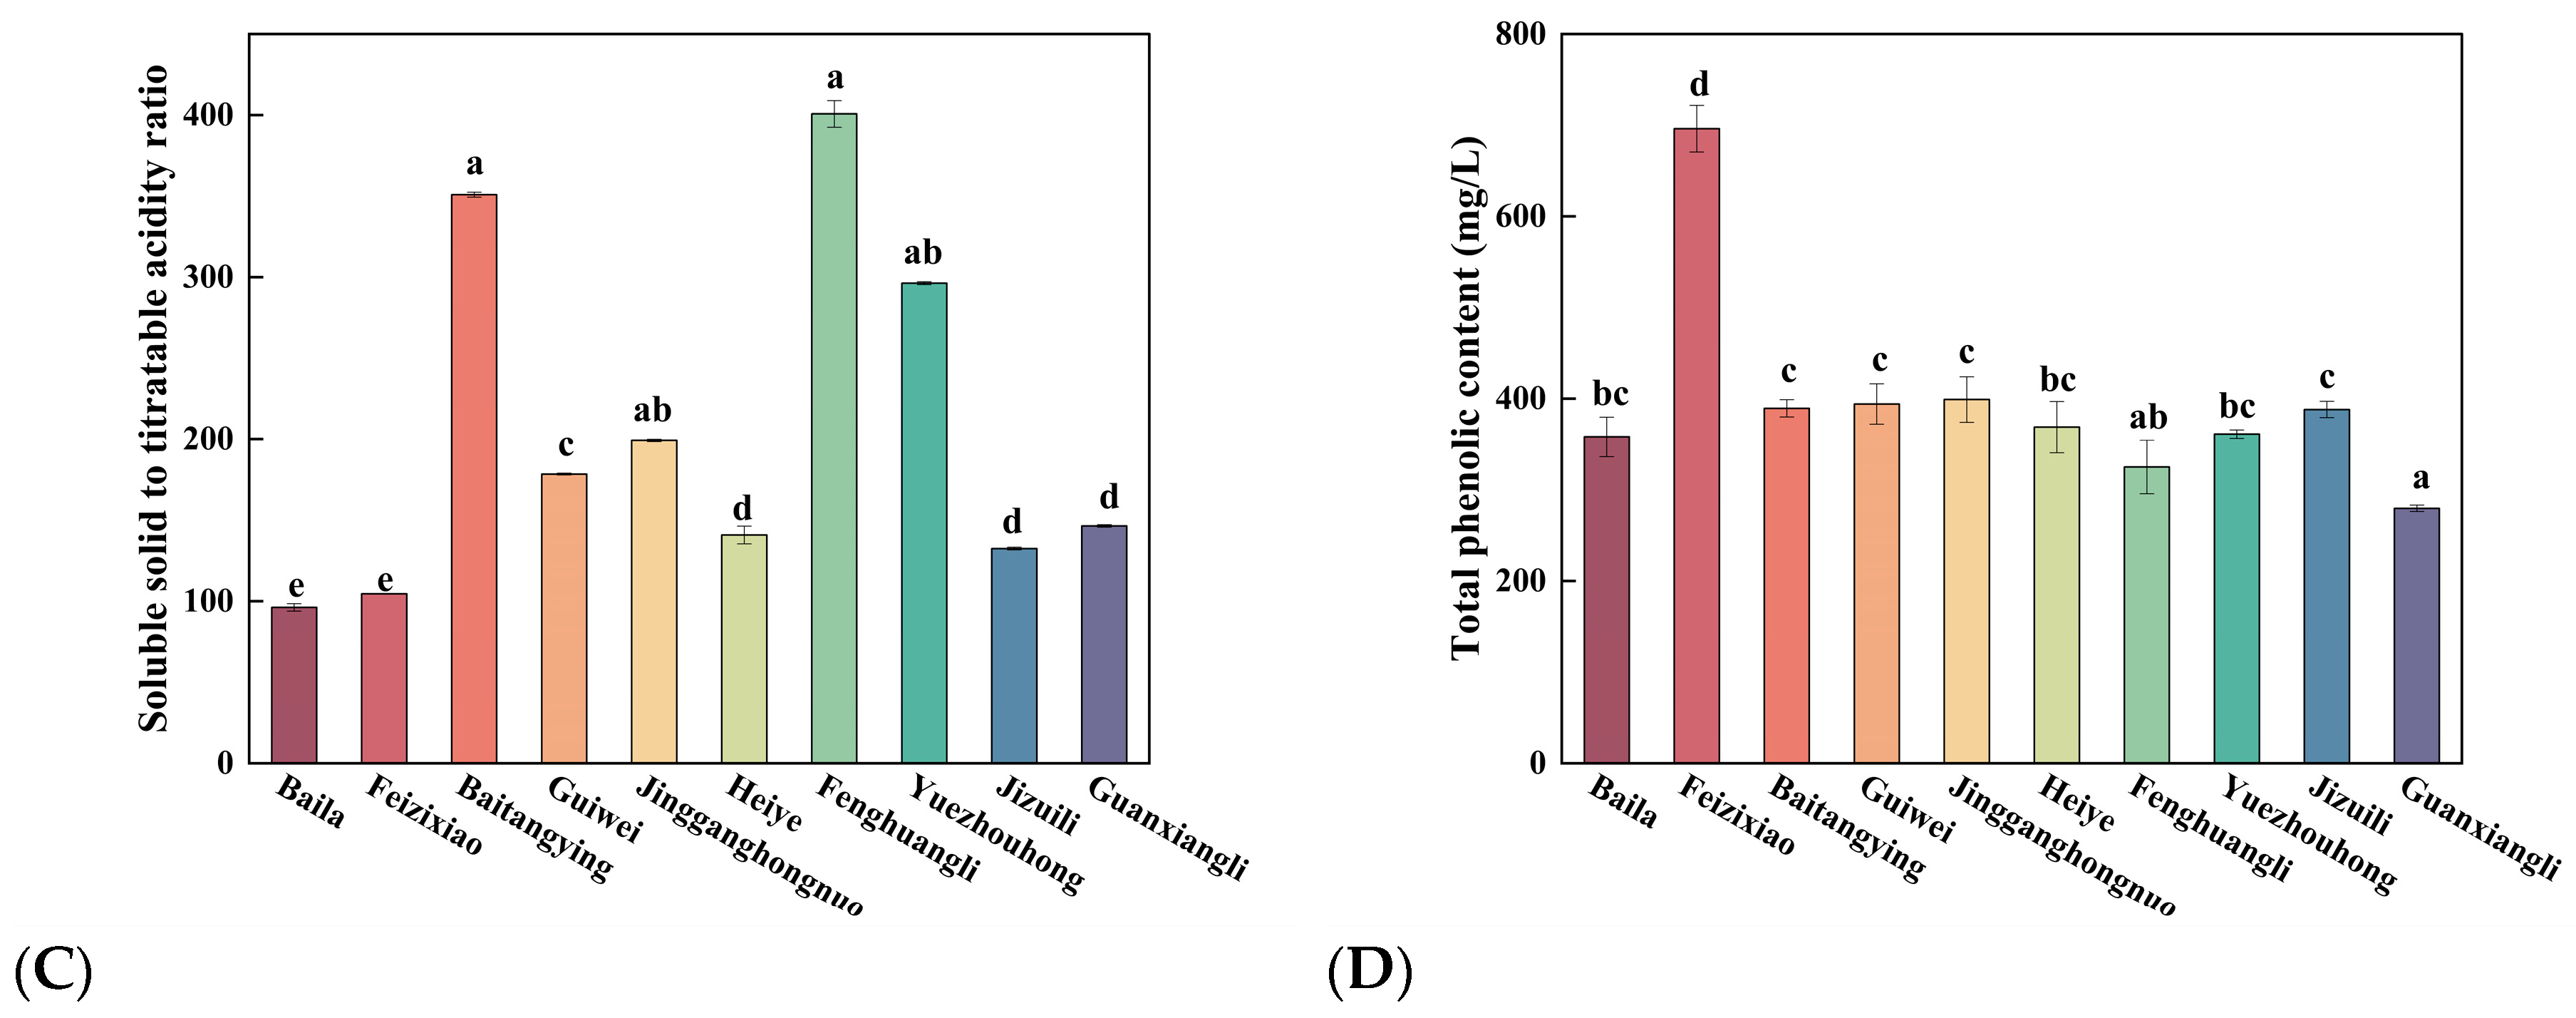
Figure 3.
Comprehensive analysis of different litchi fruit powder on (A) yield, (B) moisture content, (C) hygroscopicity and (D) solubility.
Figure 3.
Comprehensive analysis of different litchi fruit powder on (A) yield, (B) moisture content, (C) hygroscopicity and (D) solubility.
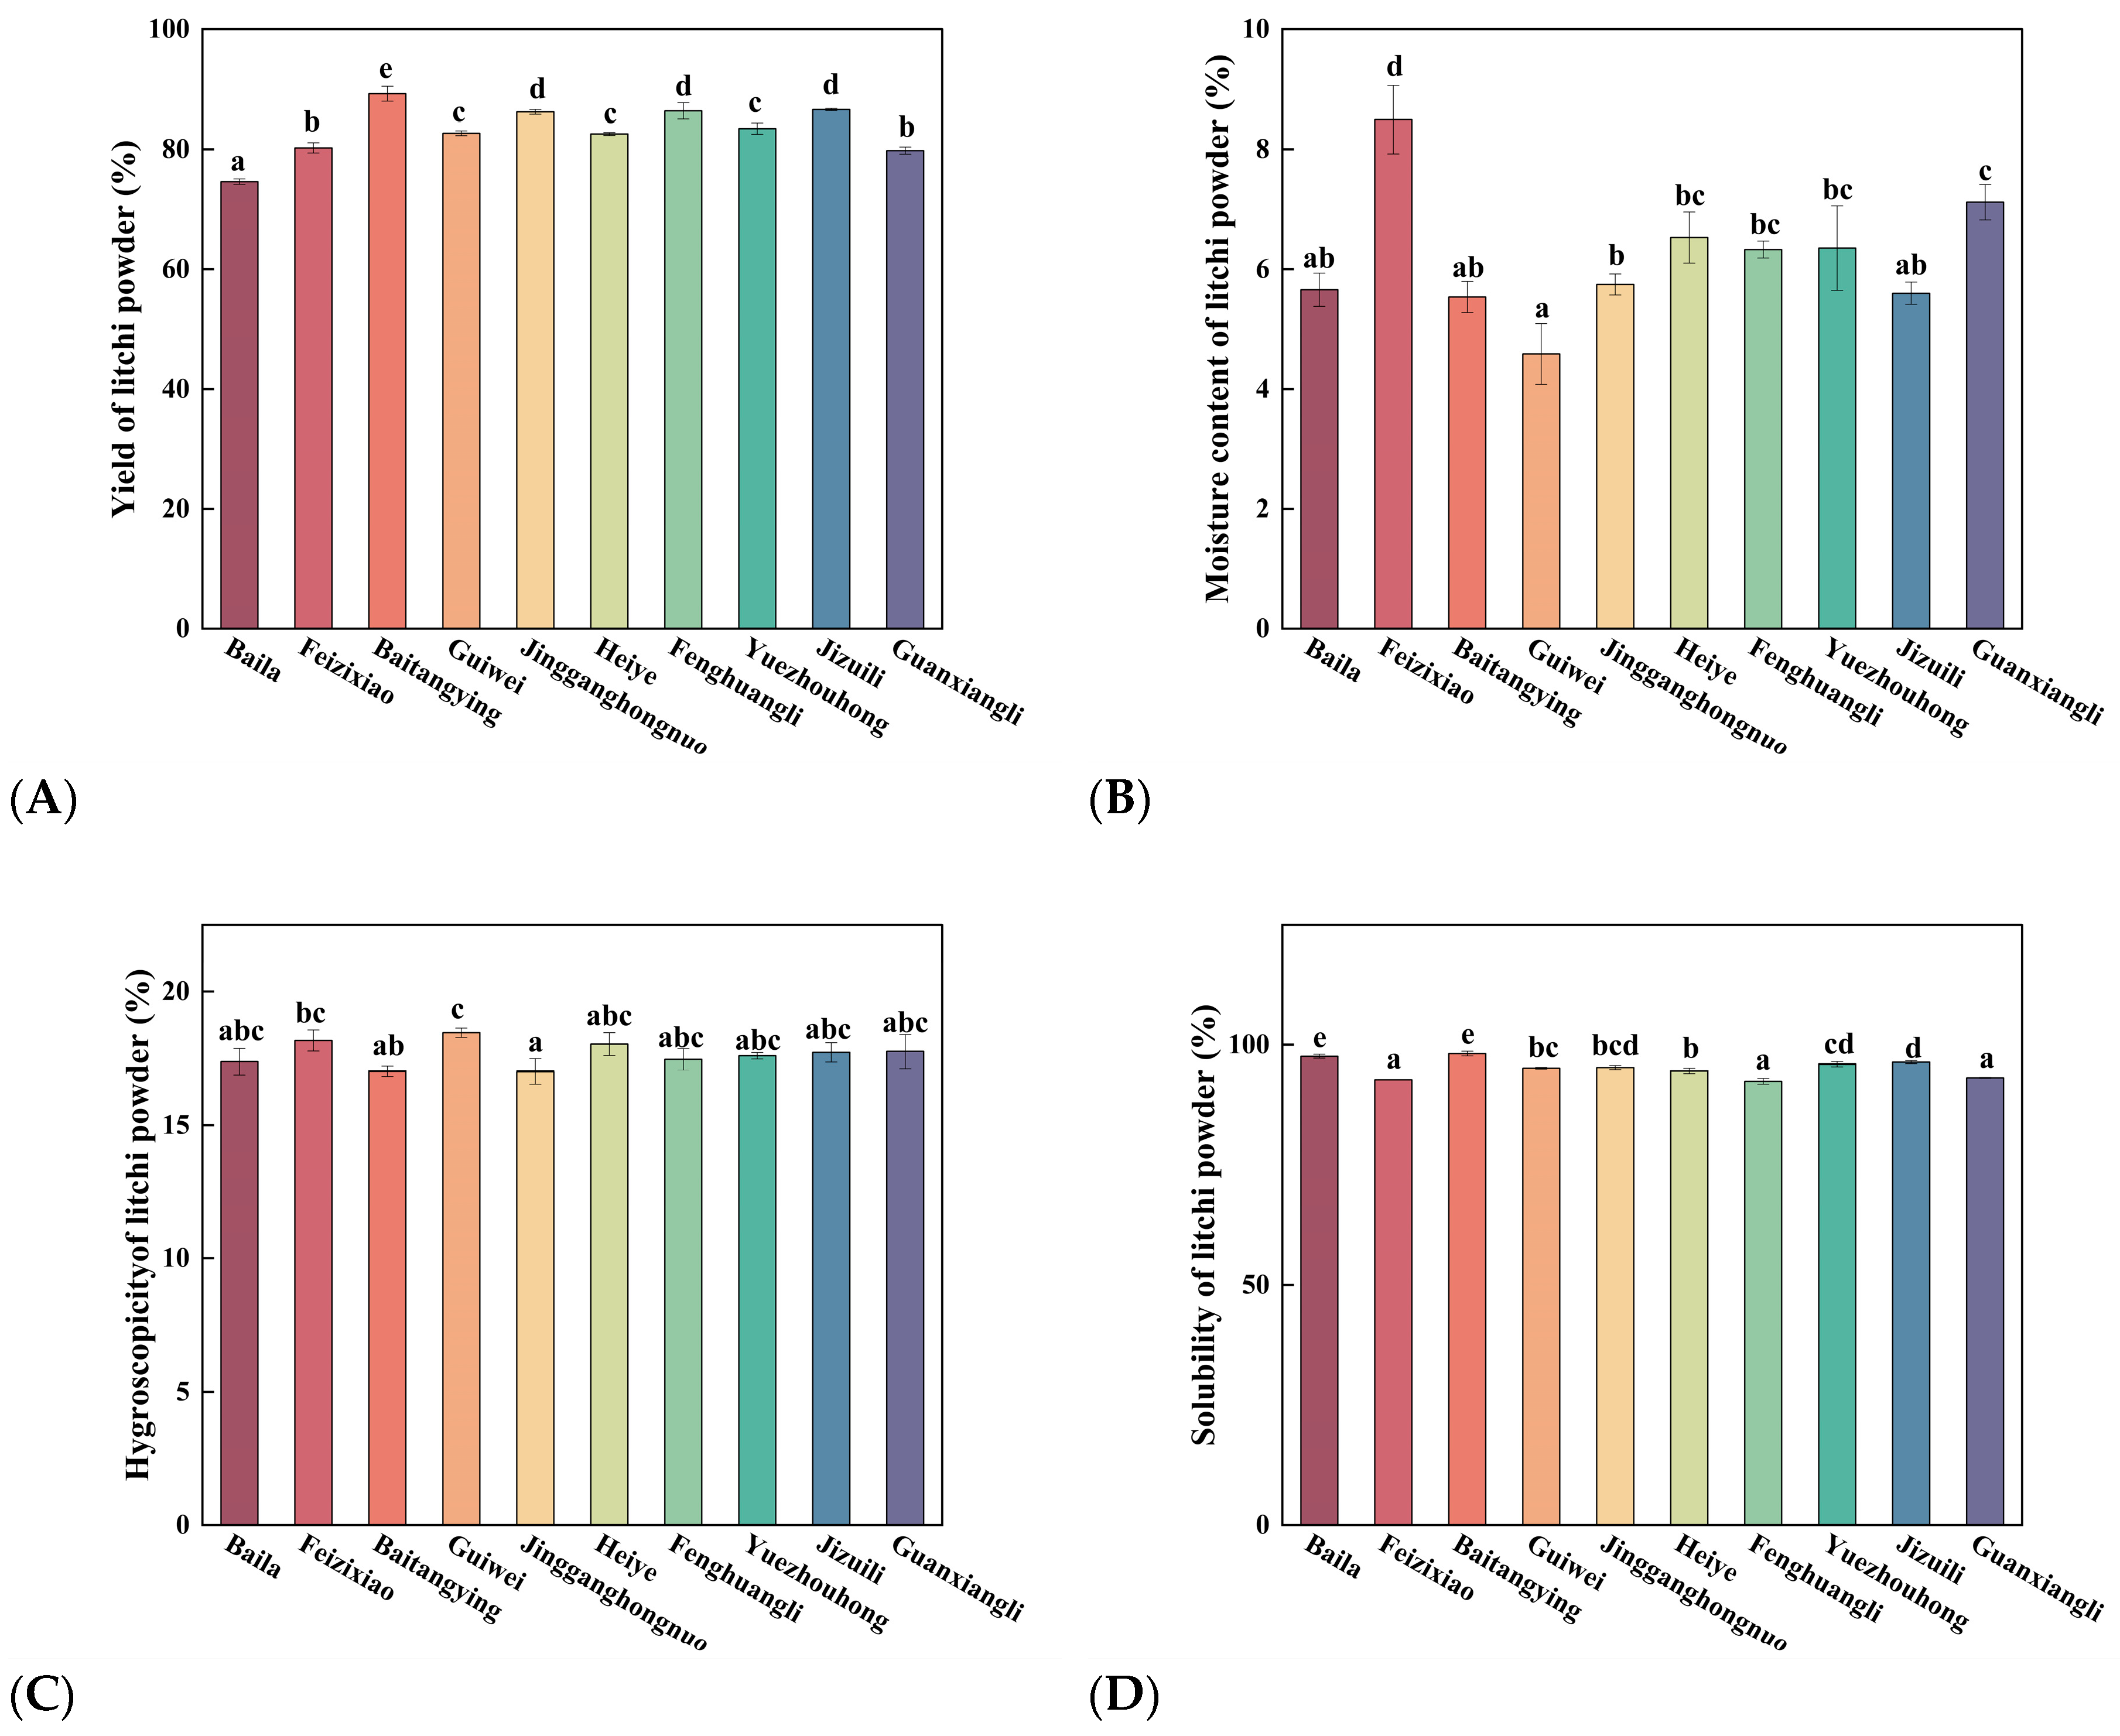
Figure 4.
Comprehensive analysis of litchi fruit powder on Tg.
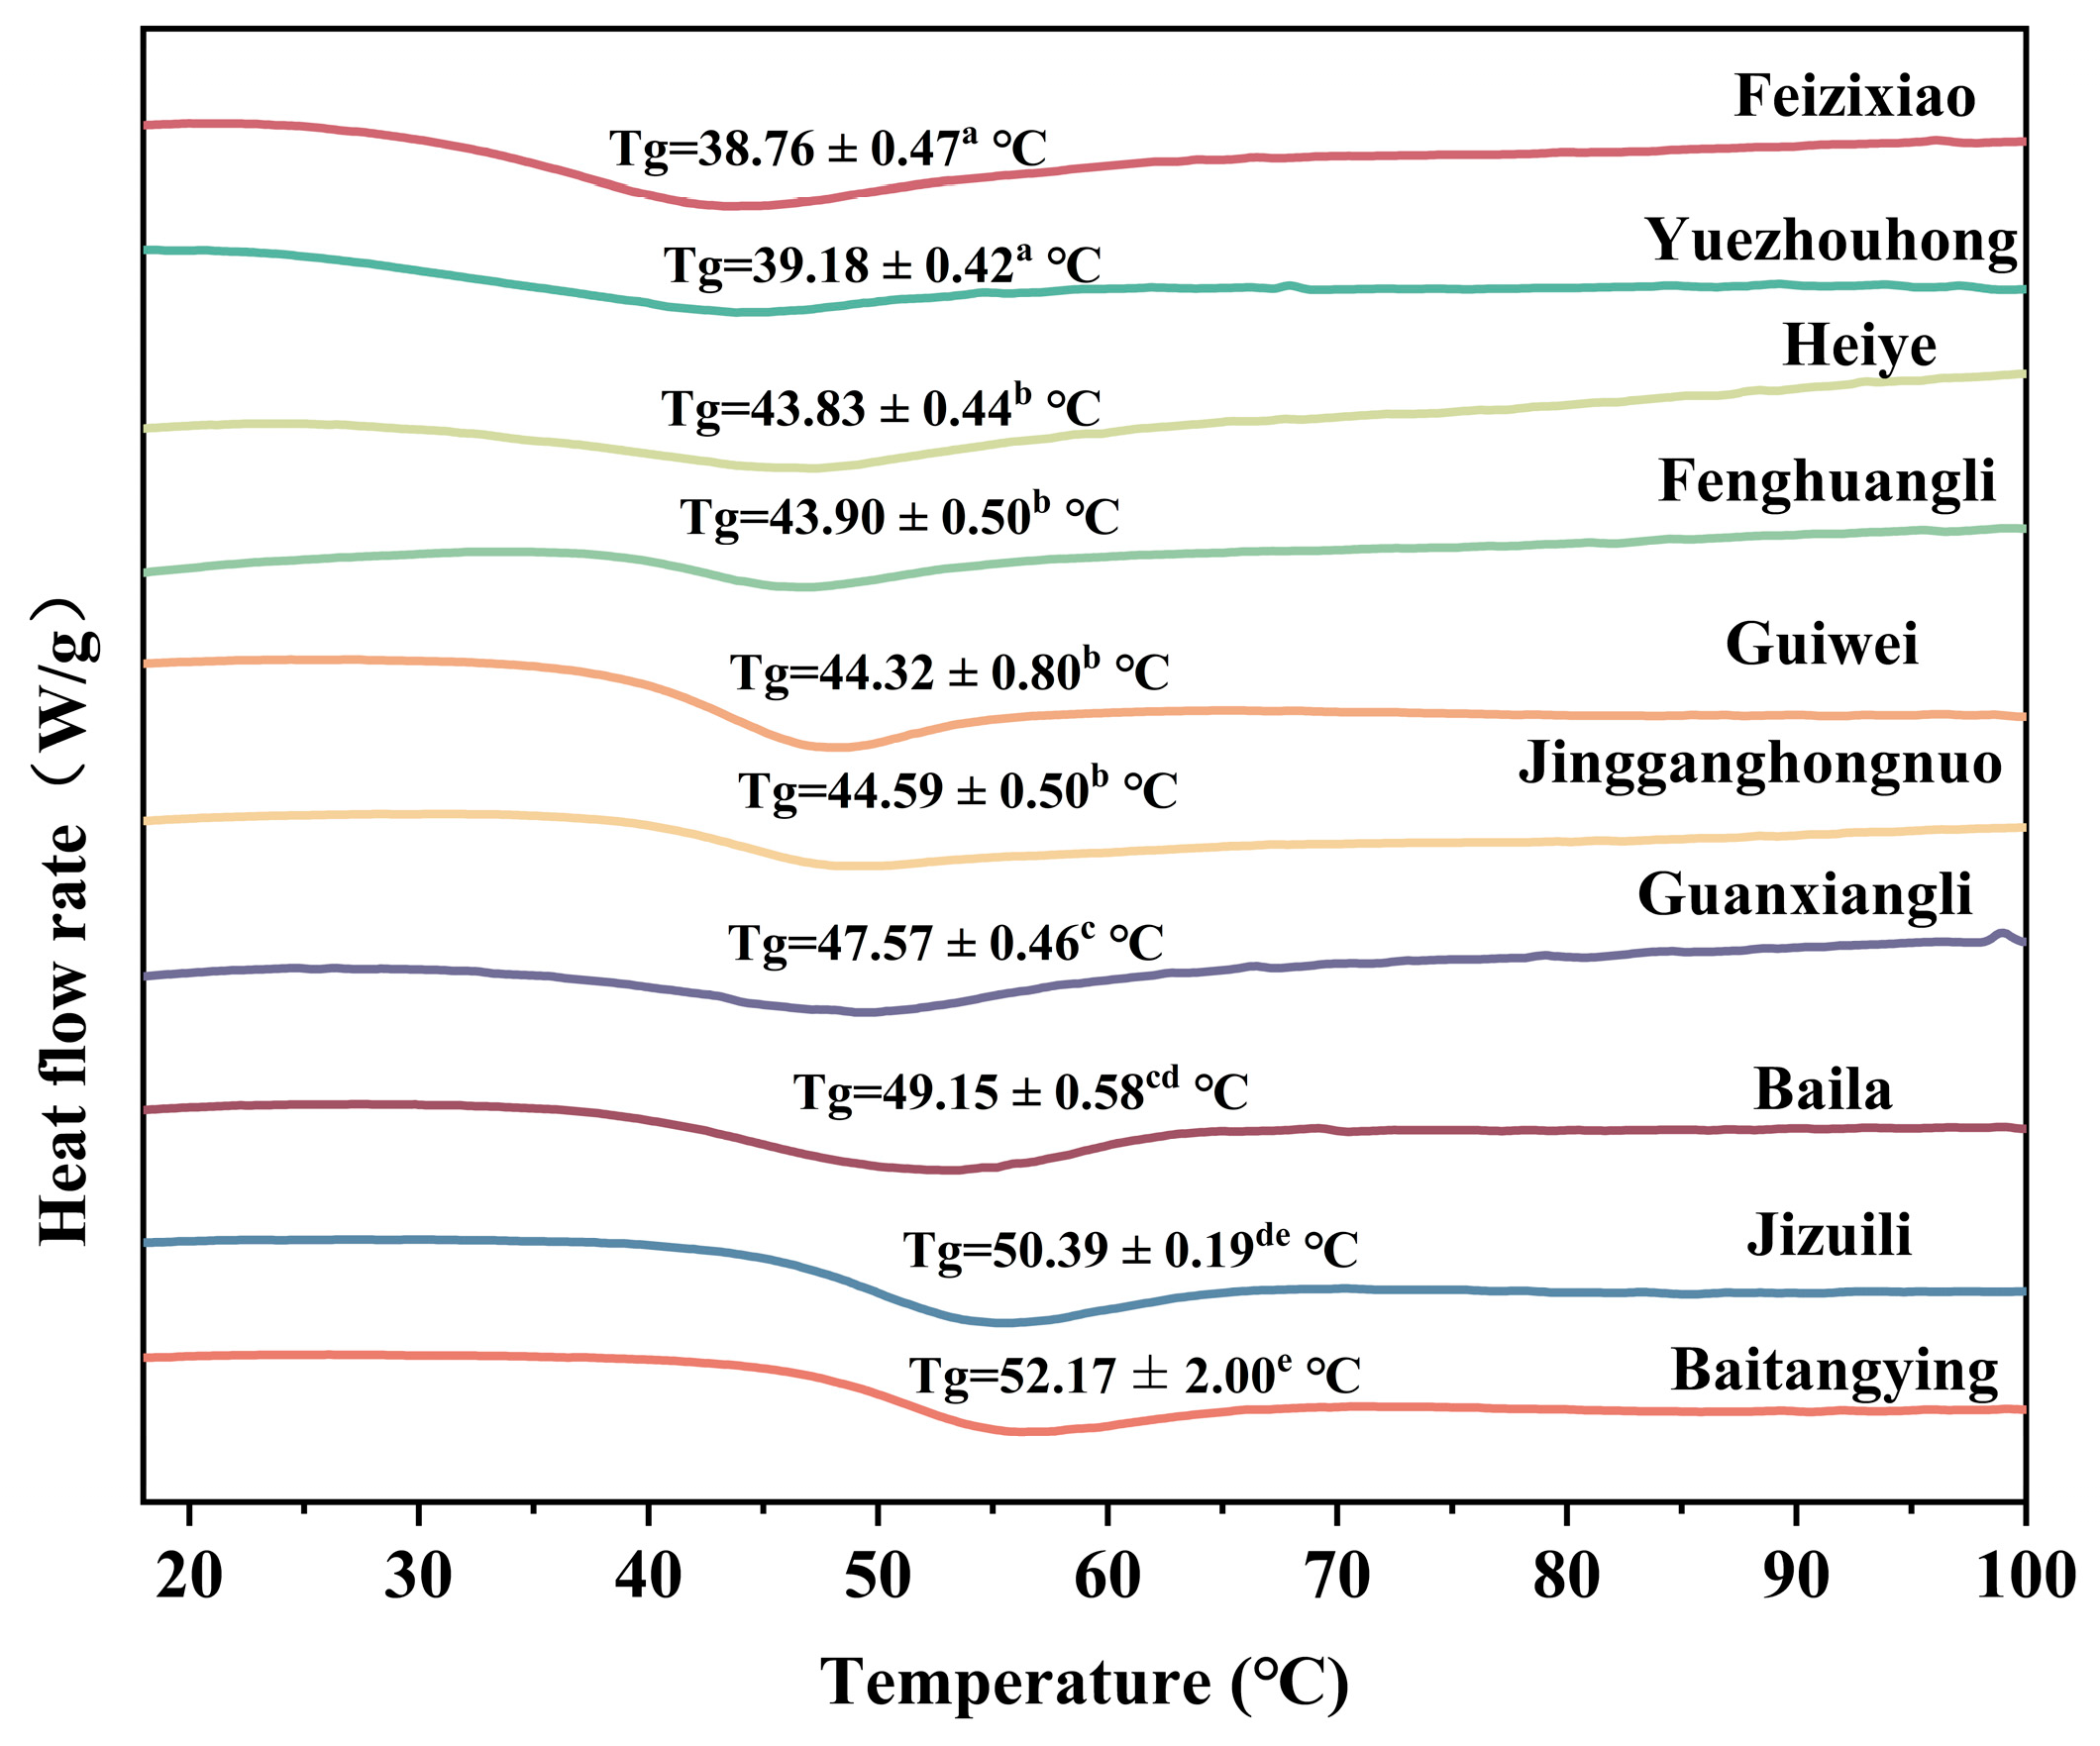
Figure 5.
Spearman correlation analysis heat map.
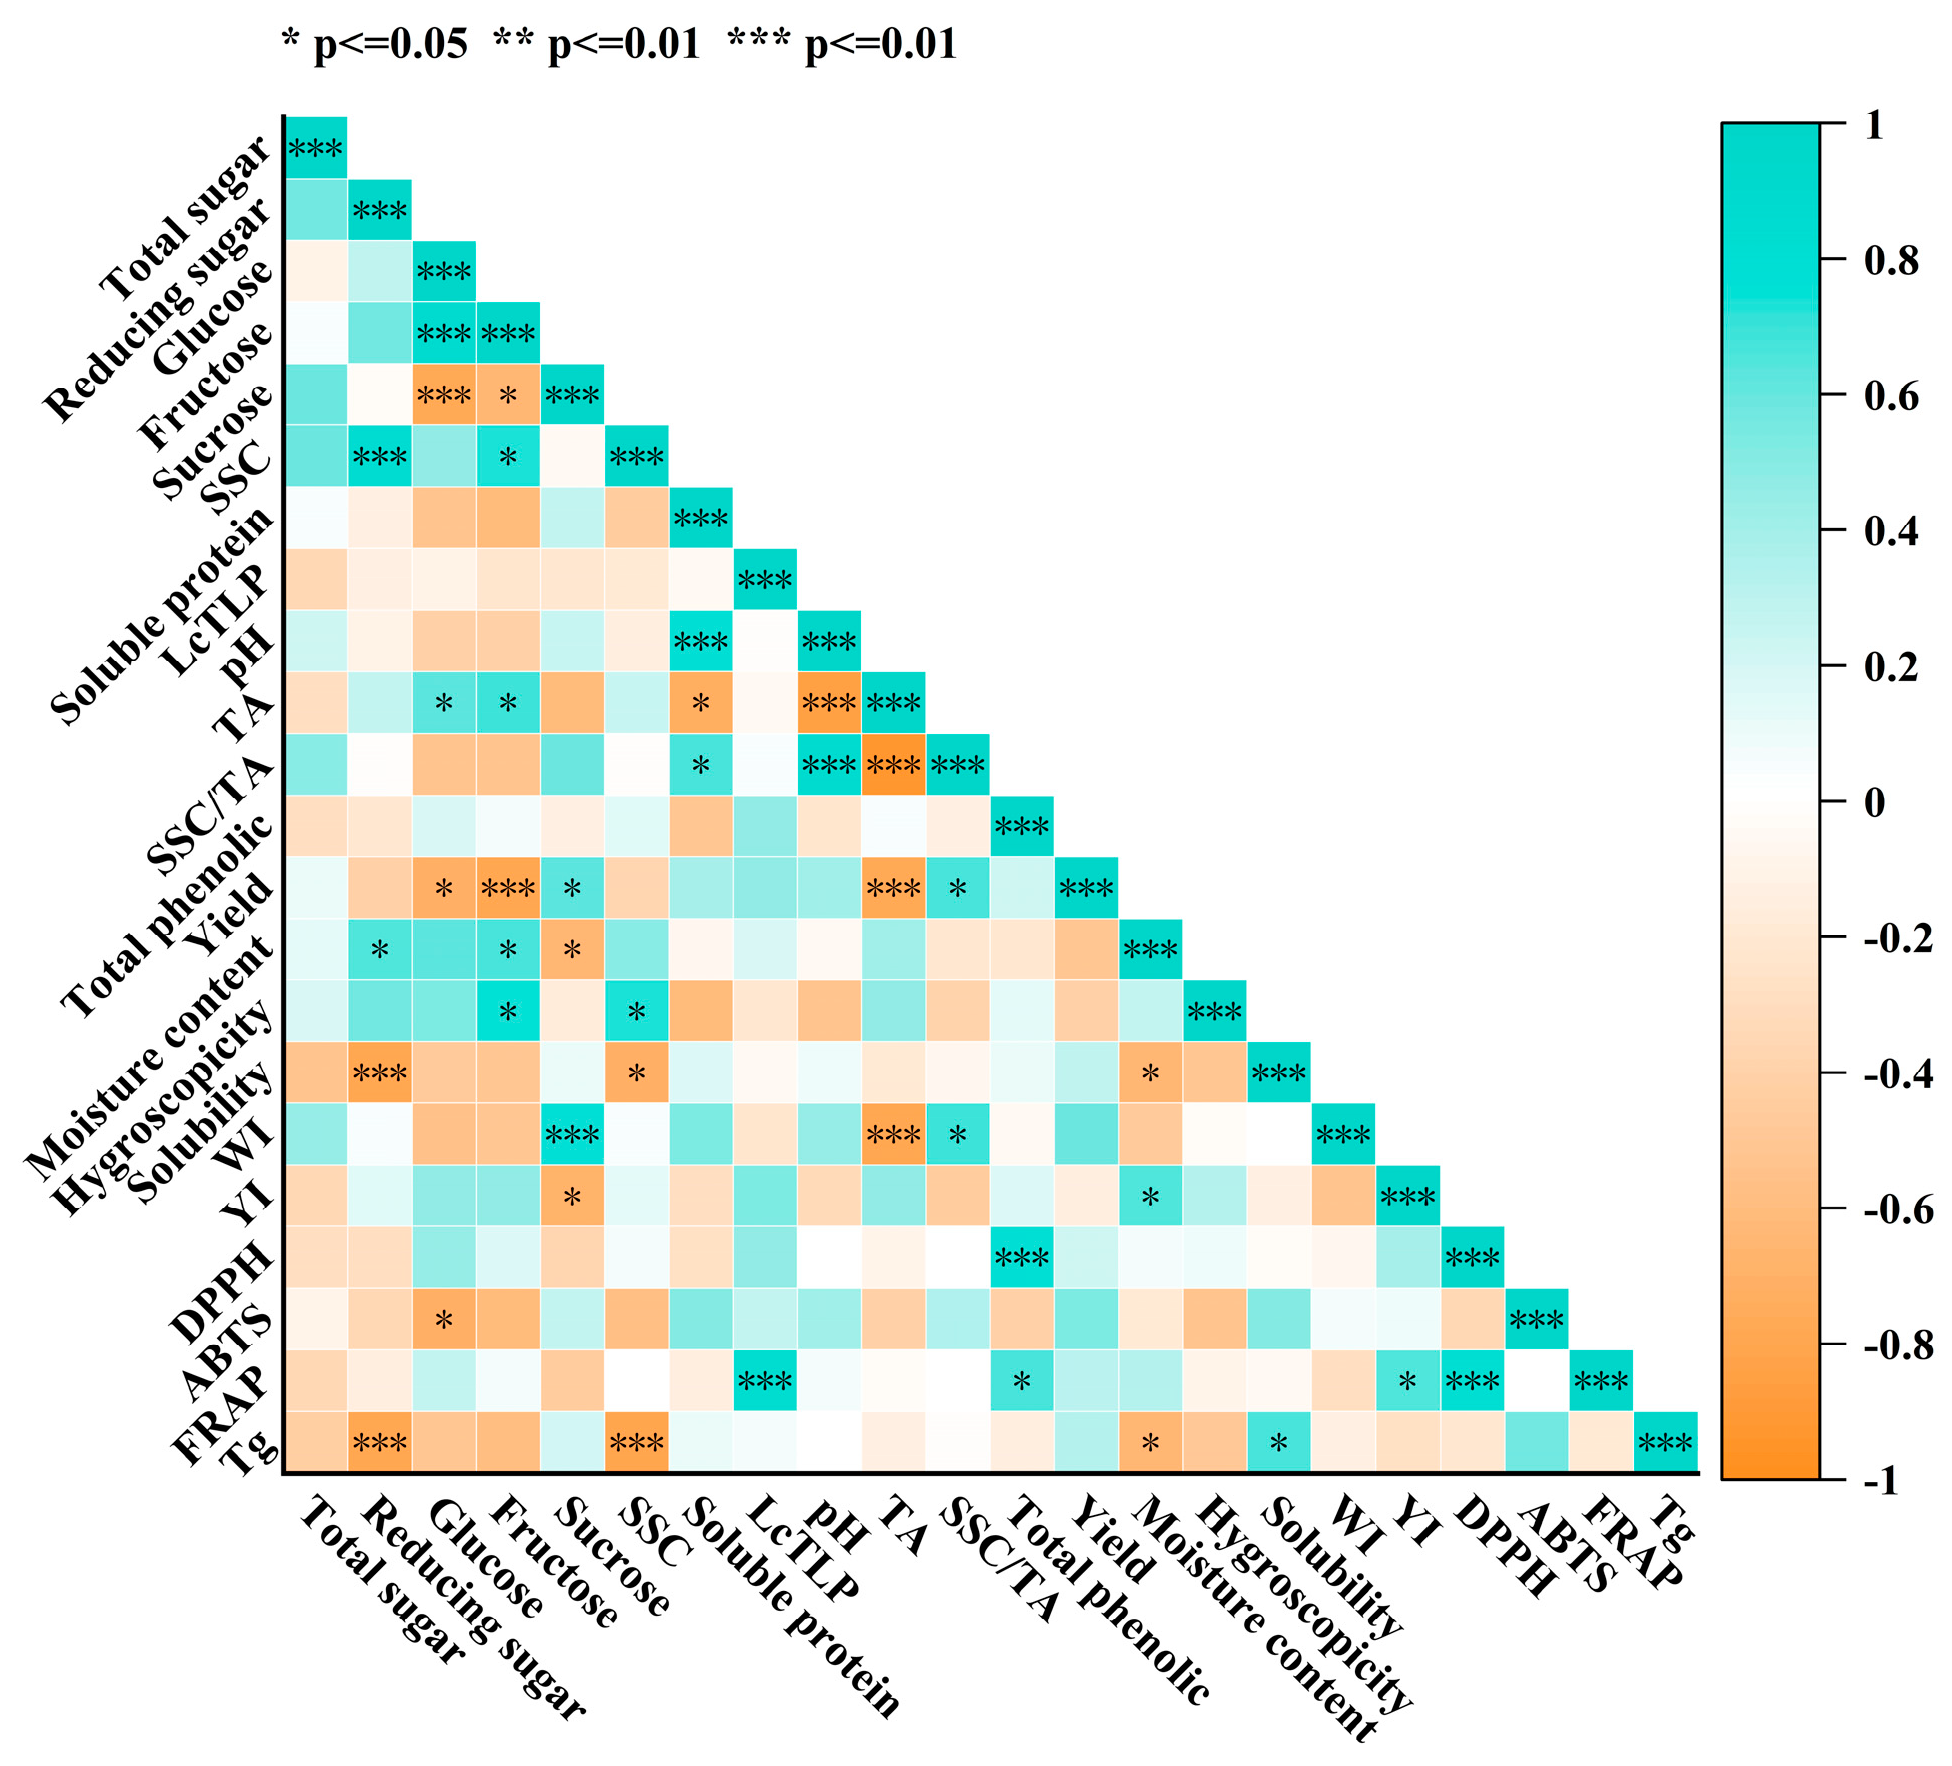

Table 1.
Particle size distribution of fruit powder from different litchi cultivars.
| Cultivars | D10 (μm) | D50 (μm) | D90 (μm) | Average size (μm) | Dispersion | ||
| Baila | 0.732 ± 0.008h | 4.463 ± 0.068e | 71.490 ± 4.393e | 21.56 ± 0.89c | 15.85 ± 0.74d | ||
| Feizixiao | 1.878 ± 0.008b | 15.817 ± 0.091b | 43.370 ± 0.436f | 24.09 ± 0.17c | 2.62 ± 0.02g | ||
| Baitangying | 0.873 ± 0.012d | 6.016 ± 0.010d | 44.203 ± 1.256f | 19.40 ± 0.45c | 7.20 ± 0.20f | ||
| Guiwei | 2.832 ± 0.027a | 18.333 ± 0.240a | 44.720 ± 1.449f | 26.47 ±0.90c | 2.28 ± 0.05g | ||
| Jingganghongnuo | 0.804 ± 0.007g | 9.223 ± 0.164c | 177.033 ± 3.257a | 49.62 ± 1.06a | 19.11 ± 0.12c | ||
| Heiye | 2.356 ± 0.097a | 19.830 ± 0.618a | 40.830 ± 2.319f | 23.53 ± 2.67c | 1.94 ± 0.06g | ||
| Fenghuangli | 0.868 ± 0.009e | 6.377 ± 0.126d | 91.003 ± 3.751d | 26.48 ± 1.41c | 14.14 ± 0.45e | ||
| Yuezhouhong | 0.712 ±0.006i | 4.923 ± 0.105e | 153.367 ± 2.829b | 39.40 ± 1.39b | 31.01 ± 0.21a | ||
| Jizuili | 0.893 ± 0.013c | 5.223 ± 0.560e | 43.910 ± 2.273f | 17.18 ± 0.70c | 8.24 ± 0.38f | ||
| Guanxiangli | 0.814 ± 0.011f | 6.369 ± 0.145d | 133.500 ± 5.122c | 36.26 ± 1.66b | 20.83 ± 0.32b |
Table 2.
Color parameters of fruit powder from different litchi cultivars.
| Cultivars | L* | a* | b* | WI | YI |
| Baila | 87.94 ± 1.40b | -0.70 ± 0.02b | 5.44 ± 0.54ab | 86.75 ± 1.47b | 11.41 ± 1.29ab |
| Feizixiao | 89.59 ± 0.20a | -2.12 ± 0.09c | 10.82 ± 0.44a | 84.84 ± 0.44b | 22.24 ± 0.95a |
| Baitangying | 89.10 ± 0.11b | -0.61 ± 0.02ab | 5.91 ± 0.12ab | 87.58 ± 0.09ab | 12.22 ± 0.24ab |
| Guiwei | 89.48±0.02a | -0.46 ± 0.03a | 4.69 ± 0.40abc | 88.47 ± 0.17a | 9.66 ± 0.84c |
| Jingganghongnuo | 88.48 ± 0.37b | -0.92 ± 0.02bc | 5.77 ± 0.09ab | 87.08 ± 0.35b | 12.00 ± 0.21ab |
| Heiye | 89.75 ± 0.11a | -1.22 ± 0.02c | 7.21 ± 0.13a | 87.41 ± 0.12ab | 14.79 ± 0.28a |
| Fenghuangli | 89.60 ± 0.06a | -0.47 ± 0.01a | 4.82 ± 0.06abc | 88.53 ± 0.04a | 9.90 ±0.12b |
| Yuezhouhong | 89.53 ± 0.04a | -0.54 ± 0.02ab | 6.13 ± 0.07ab | 87.86 ± 0.03ab | 12.61 ± 0.14ab |
| Jizuili | 89.11 ± 0.04a | -0.80 ± 0.01bc | 6.44 ± 0.04a | 87.32 ± 0.04b | 13.31 ± 0.10a |
| Guanxiangli | 82.10 ± 0.22c | -0.34 ± 0.02a | 5.69 ± 0.17ab | 81.21 ± 0.23c | 12.76 ± 0.40ab |
Table 3.
Antioxidant activity of fruit powder from different litchi cultivars.
| Cultivars | DPPH(%) | ABTS(%) | FRAP(μg TE/mg DW) |
| Baila | 13.30 ± 2.60a | 70.72 ± 0.48cd | 8.65 ± 0.37a |
| Feizixiao | 50.00 ± 4.39d | 59.90 ± 0.98ab | 19.36 ± 0.12g |
| Baitangying | 36.14 ± 3.85c | 79.39 ± 4.13d | 13.31 ± 0.35e |
| Guiwei | 35.92 ±1.23c | 57.27 ± 2.88a | 9.41 ± 0.82ab |
| Jingganghongnuo | 55.06 ± 1.99d | 69.82 ± 5.12c | 17.38 ± 0.33f |
| Heiye | 51.07 ± 2.43d | 68.22 ± 4.52bc | 13.19 ± 1.10de |
| Fenghuangli | 16.20 ± 2.66a | 71.05 ± 3.21cd | 9.57 ± 0.34ab |
| Yuezhouhong | 28.90 ± 3.58bc | 72.23 ± 2.93cd | 11.24 ± 0.12c |
| Jizuili | 29.56 ± 2.64bc | 76.91 ± 2.57cd | 11.77 ± 0.25cd |
| Guanxiangli | 21.36 ± 1.57ab | 71.68 ± 1.73cd | 10.65 ± 0.10bc |
Disclaimer/Publisher’s Note: The statements, opinions and data contained in all publications are solely those of the individual author(s) and contributor(s) and not of MDPI and/or the editor(s). MDPI and/or the editor(s) disclaim responsibility for any injury to people or property resulting from any ideas, methods, instructions or products referred to in the content. |
© 2025 by the authors. Licensee MDPI, Basel, Switzerland. This article is an open access article distributed under the terms and conditions of the Creative Commons Attribution (CC BY) license (http://creativecommons.org/licenses/by/4.0/).
Copyright: This open access article is published under a Creative Commons CC BY 4.0 license, which permit the free download, distribution, and reuse, provided that the author and preprint are cited in any reuse.


