
Submitted:
30 October 2025
Posted:
31 October 2025
You are already at the latest version
Abstract
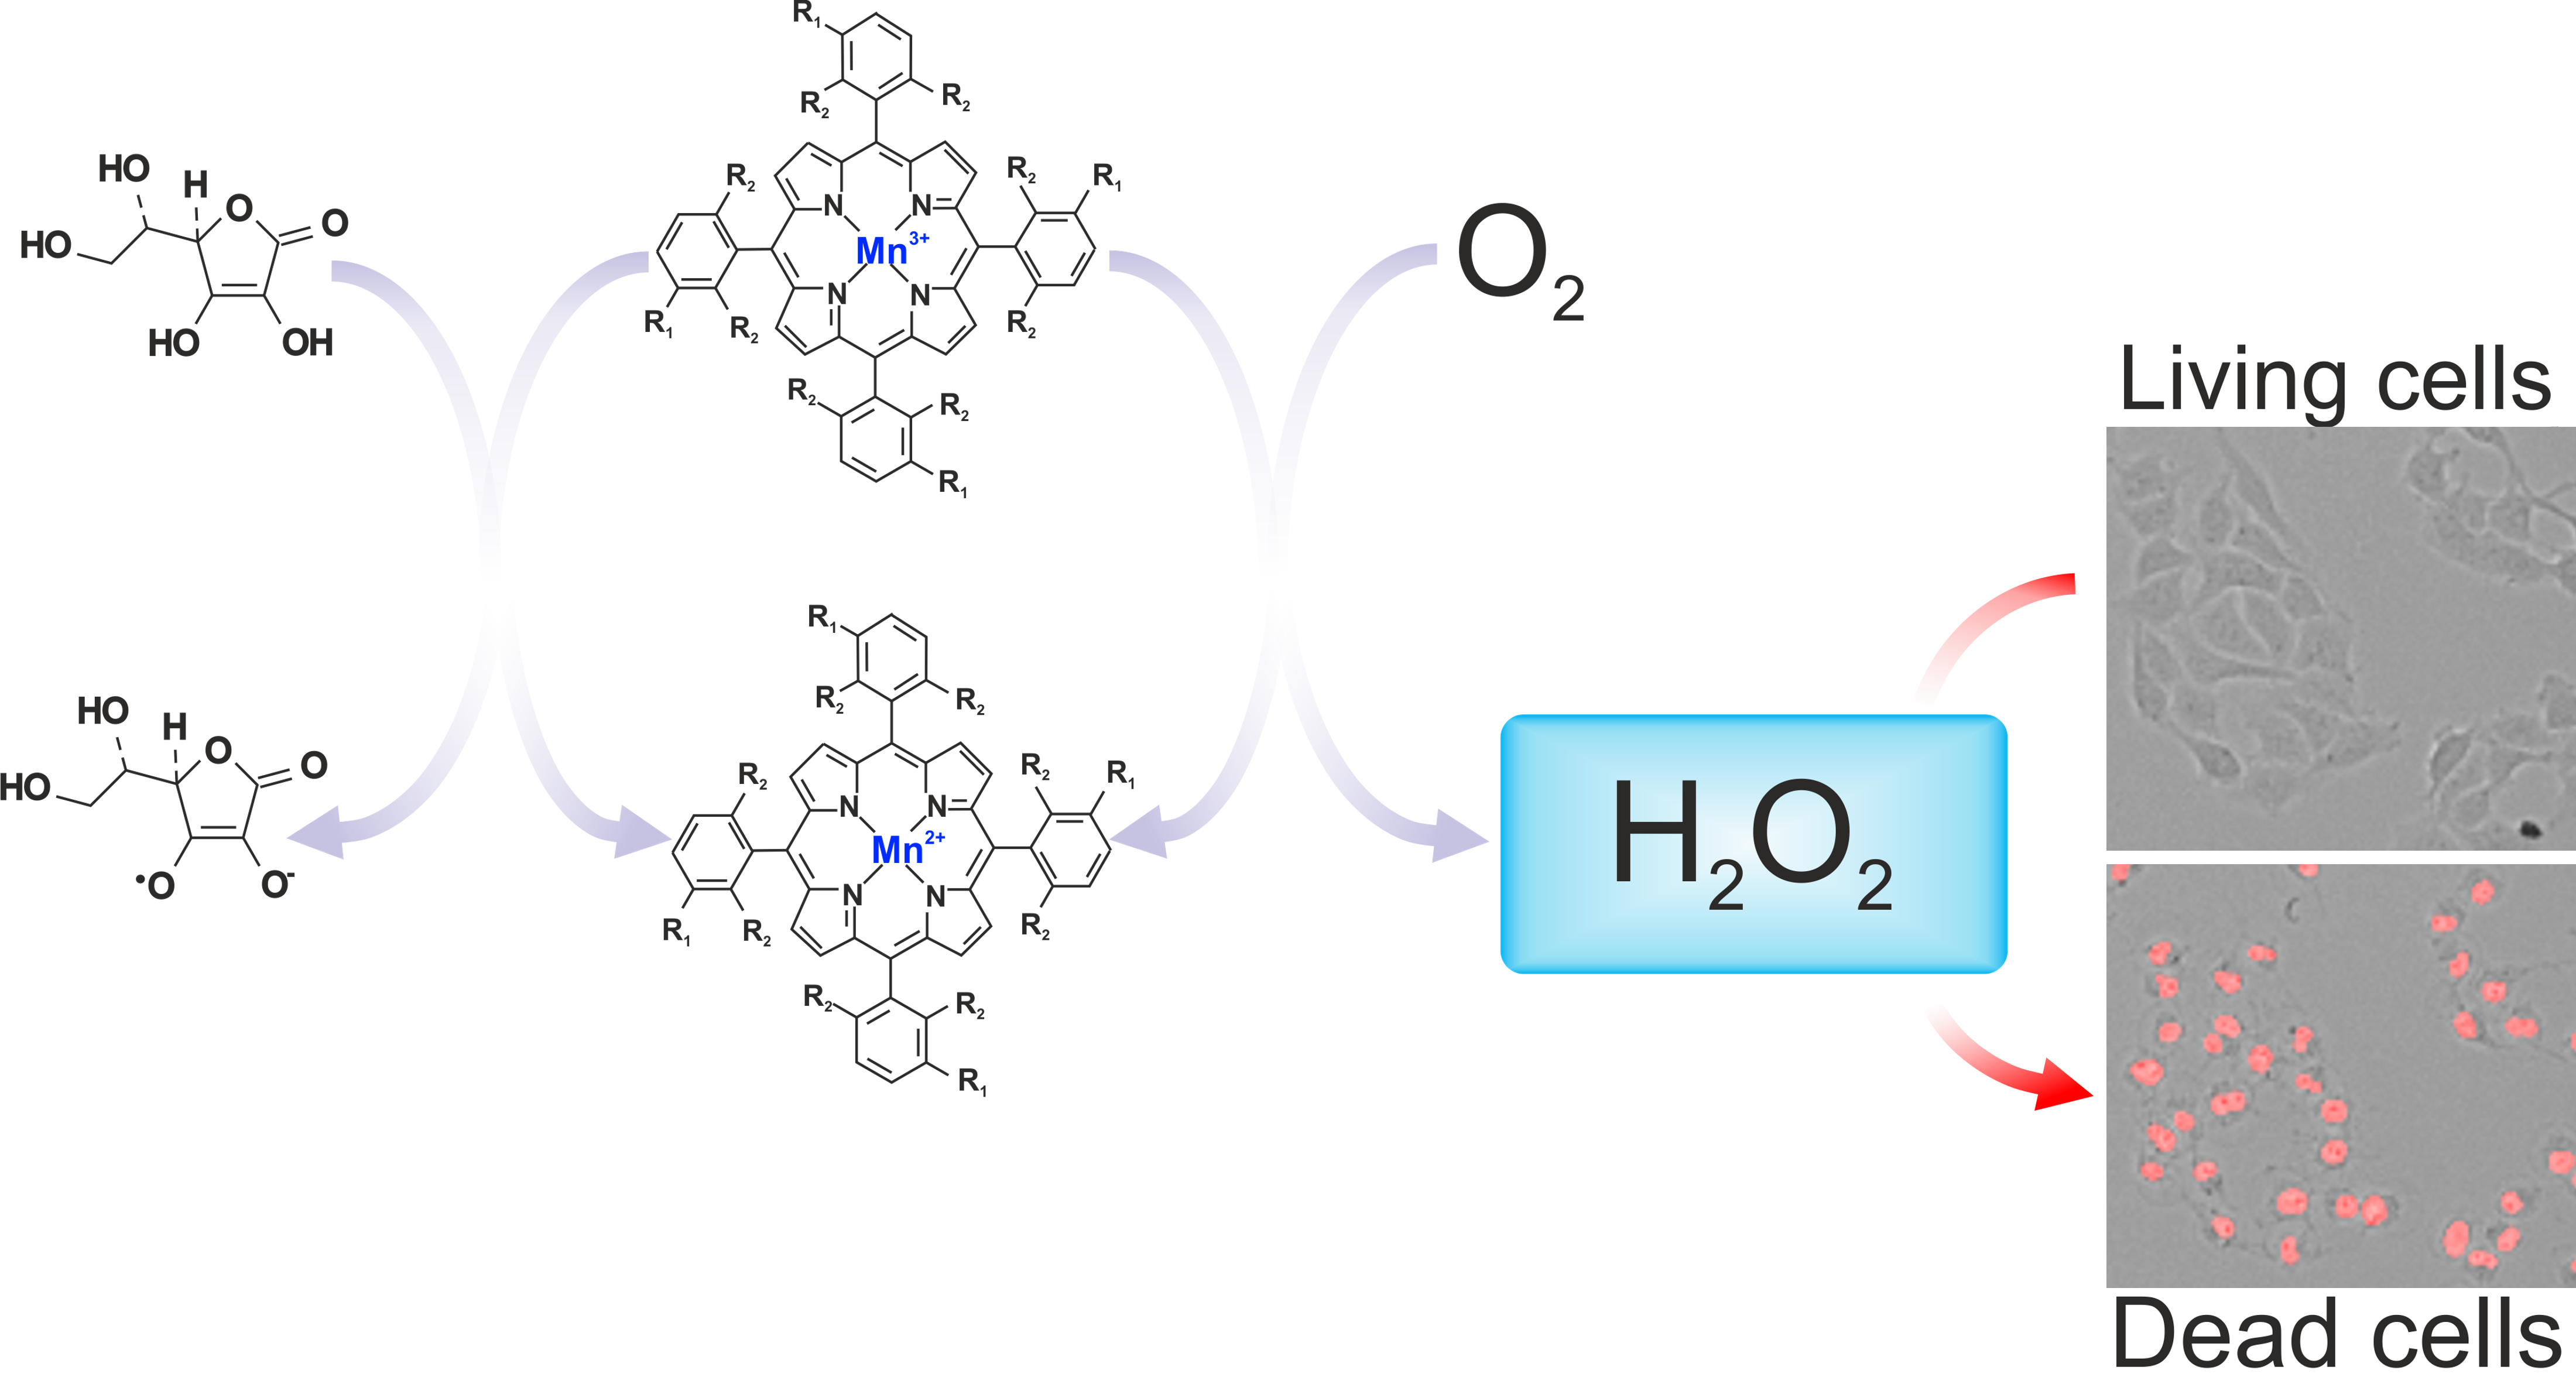
Background: The combination of manganese porphyrins (MnPs) and ascorbate (ASC) represents a promising redox-based therapeutic approach for selectively targeting cancer cells. In this study, we investigated the cytotoxic effects of two structurally distinct MnPs (MnTPPS and MnF₂BMet) with differing lipophilicity and potential membrane permeability in combination with ASC. Methods: Human cancer cell lines (MCF-7, PANC-1, U87, T98G, AT-2), and normal human dermal fibroblasts (HDF), were treated with MnTPPS and MnF₂BMet in the absence or presence of ASC. Their viability and invasive potential were then assessed with single-cell methods along with the analyses of intracellular oxidative stress. Results: MnPs alone exhibited no intrinsic cytostatic or cytotoxic activity, as confirmed by proliferation, viability, and motility assays. When combined with ASC, both MnTPPS and MnF₂BMet significantly enhanced ASC-induced oxidative stress, leading to lipid peroxidation, glutathione depletion, mitochondrial dysfunction, and cell membrane disruption. Time-lapse microscopy revealed rapid necrotic cell death under co-treatment. The cytotoxic effect was completely abolished by catalase, indicating the essential role of hydrogen peroxide. In contrast, dehydroascorbate (DHA), which increases intracellular ASC levels, did not reproduce the same toxicity, suggesting that extracellular ROS gener ation contributes predominantly to the observed effects. Normal fibroblasts were minimally affected, supporting the selectivity of the MnPs–ASC system toward cancer cells. Conclusions: The results indicate that MnTPPS and MnF₂BMet enhance extracellular oxidation of ascorbate and subsequent ROS production, leading to selective oxidative stressmediated cancer cell death. This study supports the potential of MnPs–ASC redox catalysis as a complementary oxidative stress–based anticancer strategy and highlights the need for further mechanistic and structure–activity investigations.
Keywords:
manganese porphyrins
; vitamin C
; redox catalysis
; reactive oxygen species
; cancer therapy
1. Introduction
Porphyrins are polycyclic aromatic compounds consisting of four pyrrole rings interconnected by methine bridges, forming an extended conjugated π-electron system with 18 delocalized electrons. Their ability to coordinate metal ions within the macrocyclic cavity determines their unique catalytic properties. These molecules are fundamental components of numerous biologically significant proteins, playing key roles in essential processes such as oxygen transport, electron transfer, and enzymatic catalysis. A prominent example is heme, which serves as a prosthetic group in hemoglobin and cytochromes, where the coordinated iron ion (Fe2+) undergoes cyclic redox reactions, facilitating electron transport in processes such as cellular respiration [1]. Beyond their biological significance, porphyrins exhibit distinctive photochemical and catalytic properties, making them attractive for biomedical applications, particularly in oncology. Their role as photosensitizers in photodynamic therapy (PDT) and as contrast agents for fluorescence and photoacoustic imaging is well established [2]. Upon light absorption, porphyrins undergo transition to triplet excited states, subsequently generating reactive oxygen species (ROS), which trigger oxidative stress, leading to apoptosis or necrosis of targeted cells. Furthermore, photogenerated ROS contribute to tumor vasculature disruption, trigger inflammatory responses, enhance the expression of heat-shock proteins, and promote immune cell infiltration, thereby supporting the development of long-term immune memory. [3,4]. A key advantage of PDT lies in its spatial selectivity, as ROS production occurs exclusively in the illuminated region, minimizing systemic side effects [5,6]. However, the clinical use of porphyrin-based photosensitizers in PDT is limited by poor light penetration into deep tissues, restricting its efficacy mainly to superficial tumors. To address this limitation, alternative strategies have been explored, including chemical modulation, such as structural modifications involving the reduction of pyrrole rings, attachment of substituents to enhance long-wavelength absorption and biocompatibility, or the addition of adjuvants to improve therapeutic efficacy [7]. Among potential adjuvants, ascorbate (vitamin C) has attracted considerable attention for its ability to enhance the therapeutic efficacy of porphyrin-based systems, particularly when light activation is not feasible [8].
L-ascorbic acid (AA) is a key regulator of lysyl and prolyl hydroxylase activity, making it indispensable for collagen biosynthesis [9]. It plays a fundamental role in maintaining the homeostasis of connective tissue; however, due to a mutation in the gene encoding L-gulono-γ-lactone oxidase, humans lack the ability to synthesize it endogenously, necessitating dietary intake. Under physiological conditions, the plasma concentration of AA is approximately 90 µM, with a maximum level of about 220 µM achievable through oral supplementation. At these concentrations, AA primarily functions as an antioxidant, scavenging ROS to protect cells from oxidative stress and prevent degradation of subcellular structures [10]. However, at pharmacological concentrations, AA exhibits a distinct prooxidant effect, which has been linked to its potential anticancer activity. Intravenous administration can elevate plasma ASC levels to approximately 0.5 mM without causing severe adverse effects [11]. Transiently, plasma concentrations as high as 20 mM can be achieved, leading to a disruption of cellular redox homeostasis. This oxidative imbalance contributes to glutathione oxidation and depletion of intracellular antioxidant reserves, as well as the redox cycling of iron ions, which often accumulate in cancer cells due to ferritin overexpression. These processes facilitate the generation of hydroxyl radicals via the Fenton and Haber-Weiss reactions, ultimately contributing to cytotoxic effects [12].
The cytotoxic effect of pharmacological ascorbate appears to be selective toward cancer cells, which often display weakened antioxidant defense systems and increased susceptibility to ferroptosis resulting from metal ion accumulation [12]. Additionally, certain tissues, particularly tumors, can locally accumulate higher concentrations of ASC, further enhancing its cytotoxic potential [14]. Cellular uptake of vitamin C occurs primarily through sodium-dependent vitamin C transporters (SVCT-1 in intestinal epithelial cells and SVCT-2 in other tissues) [15,16], as well as via glucose transporters (GLUT). They mediate the uptake of dehydroascorbate (DHA), which is the oxidized form of ascorbate, taken up via GLUT transporters and intracellularly reduced to ASC. Structurally similar to glucose, DHA enters cells through GLUT transporters and is subsequently reduced intracellularly to ASC. This mechanism is particularly relevant in cancer cells, which exhibit increased glucose uptake and GLUT overexpression, enabling preferential accumulation of ASC in tumor tissue [10]. Some studies also suggest that a fraction of ASC may directly diffuse through lipid membranes, although this is considered a secondary uptake mechanism [11]. Both in vitro and clinical studies indicate that pharmacological doses of vitamin C can exert selective cytotoxic effects on cancer cells, presenting a promising adjunctive strategy in oncology [17]. An emerging therapeutic concept involves the combination of ASC and manganese porphyrins as a complementary approach to conventional porphyrin-based photodynamic therapy (PDT), potentially enhancing therapeutic efficacy.
Manganese porphyrins (MnPs) have been explored as redox-active compounds with potential roles in radio- and chemosensitization, and some analogs have also shown radioprotective properties in normal tissues [18]. This dual function, combined with their superoxide dismutase (SOD)-mimicking catalytic activity, makes them particularly valuable in oncology, as they can enhance the effectiveness of radiotherapy and chemotherapy while mitigating radiation-induced damage to normal cells. Several MnPs have been developed that catalyze the oxidation of ASC and thiols, leading to the generation of ROS. The redox potential (E1/2) of the Mn3+/Mn2+ couple plays a crucial role in determining the ability of Mn3+ to participate in redox cycling with ASC [19]. When the half-cell reduction potential (E1/2) of MnPs is well-matched with the redox potential of the Asc•−/AscH− pair, ROS production via redox cycling is significantly enhanced [20]. Several MnPs have already been tested in combination with ASC on cancer cells, yielding promising therapeutic outcomes [18,19,21].
These findings prompted us to investigate the biological activity of two manganese porphyrins, MnTPPS and MnF2BMet, obtained following a general synthetic route previously described for related porphyrins prepared for other applications. These compounds are structurally related to porphyrin-based photosensitizers used in PDT, but their design allows them to undergo redox reactions without the need for light activation [7,22,23,24]. In particular, we aimed to assess the synergy between the cytotoxic effects of these MnPs and ASC. Furthermore, we explored the molecular mechanisms underlying this cytotoxicity, with particular attention to the contribution of hydrogen peroxide (H2O2) in mediating these effects. To achieve this, we employed an experimental model integrating analyses of glutathione (GSH) depletion, lipid peroxidation, and direct H2O2 quantification in a panel of normal and cancer cell lines undergone MnPs/ASC treatment in vitro.
2. Materials and Methods
2.1. Cell Lines
Human MCF-7 and PANC-1, and rat cancer AT-2 cells were cultured under standard conditions (37 °C, 5% CO2) in RPMI 1640 medium (Sigma). Glioblastoma cell lines U87 and T98G, along with normal human dermal fibroblasts (HDF), were maintained under identical conditions in DMEM-high glucose medium (Sigma). Culture media were supplemented with 10% heat-inactivated fetal bovine serum (FBS; Gibco) and 1% Antibiotic-Antimycotic Solution (Merck; 100 U/mL penicillin, 0.1 mg/mL streptomycin, 0.25 µg/mL amphotericin B). Cells were harvested using TrypLE™ (Gibco), counted using a Z2 particle counter (Beckman Coulter), and seeded into multi-well tissue culture plates (Falcon®).
2.2. Manganese Porphyrins
Mn(III) tetrakis(4-benzoic acid) porphyrin chloride (MnTBAP) was purchased from Sigma-Aldrich. The manganese(III) porphyrins were prepared following a general multistep procedure commonly used for related metalloporphyrins, involving condensation via the nitrobenzene method, chlorosulfonation, and subsequent manganese(III) complexation[25]. Solid manganese porphyrins (MnPs) were stored in light-protected vials at −20 °C. When dissolved in DMSO, solutions were stored at 4 °C in light-protected vials. MnPs were added to cell cultures for 24 hours, after which the medium was removed, and cells were washed with PBS (Gibco) to eliminate unbound porphyrins. The final DMSO concentration in the medium was 0.1% for 5 µM porphyrins and 1% for 50 µM porphyrins. Control samples received the same DMSO concentration without porphyrins.
2.3. Optical Properties
Electronic absorption spectra of MnTPPS and MnF2BMet were recorded in PBS using quartz cuvettes with a 1 cm path length. Measurements were performed with a UV-3600 Shimadzu spectrophotometer, covering the 300–800 nm wavelength range. Fluorescence spectra were acquired in the 500–750 nm range following excitation at the respective Soret bands. Measurements were conducted using a RF-6000 Shimadzu Spectrophotometer. Samples were initially adjusted to an absorbance of 0.2 at the Soret band and subsequently diluted 100-fold for fluorescence analysis.
2.4. Cytotoxicity Assay
In all experiments, a sequential treatment approach was applied: cells were incubated with MnPs for 24 hours, after which unbound porphyrins were removed by washing with PBS (Sigma). ASC was added in fresh medium. The ascorbate solution was freshly prepared immediately before use. Cells were seeded into 24-well plates at a density of 10,000 cells/well. After 24 hours of incubation, cell viability was assessed using the Trypan Blue (Sigma) exclusion assay. Cytotoxicity of MnPs was evaluated after the same incubation period, with the same procedure but without adding ASC. The experiments were done in three biological replicates.
For proliferation analysis, cells were seeded in 12-well plates at a density of 10,000 cells per well and then incubated for 24 hours with MnPs. Subsequently, unbound porphyrins were removed, and fresh culture medium containing ASC was added. Cell were harvested after 96 hours of incubation with ASC. Cell counts were performed using a Z2 particle counter (Beckman Coulter). Experiments with extracellular catalase were conducted using catalase from bovine liver (Sigma). Catalase was dissolved in PBS and added to the culture medium at a final concentration of 200–500 U/mL.
2.5. Kinetics of Propidium Iodide Uptake
Propidium iodide (PI) uptake kinetics was monitored using time-lapse videomicroscopy on 24-well plates (Falcon®). MCF-7 cells were seeded at a density of 10,000 cells/well and incubated with 5 µM MnTPPS or 5 µM MnF2BMet for 24 hours. After removing unbound porphyrins, fresh medium containing 0.5 or 1 mM ASC was added, along with propidium iodide. Cell viability was monitored for 12 hours at 5-minute intervals using a Leica DMI6000B imaging system equipped with integrated modulation contrast (IMC; Hoffman contrast), fluorescence module, and environmental control for temperature (37 °C) and CO2 (5%). Propidium iodide fluorescence intensity was measured over time in specific cells (n=30). Cell imaging was started 30 min after ASC addition.
2.6. Cell Migration Assay
MCF-7 cell migration was analyzed using 24-well plates (Falcon®). Cells were seeded at a density of 10,000 cells/well and incubated with 5 µM MnTPPS or 5 µM MnF2BMet for 24 hours. After removing unbound porphyrins, fresh medium containing ascorbate was added. Cell movement was recorded for 8 hours at 5-minute intervals using a Leica DMI6000B imaging system equipped with integrated modulation contrast (IMC; Hoffman contrast), CO2 (5%), and temperature (37 °C) monitoring. Cell migration trajectories were manually tracked using Hiro v.1.0.0.4 software (developed by W. Czapla), and the speed of movement (µm/min) was calculated [26].
2.7. Fluorescence Microscopy
For fluorescence microscopy studies, MCF-7 cells were seeded into 12-well plates on UVC-sterilized coverslips at a density of 10,000 cells/well. Cells were incubated for 24 hours with 5 µM MnPs, washed with PBS, and subsequently incubated with 0.5 mM ASC for 6 hours. Cells were then fixed with 3.7% formaldehyde and permeabilized with 0.1% Triton X-100. Non-specific binding sites were blocked with 2% BSA (Invitrogen). Actin cytoskeleton visualization was performed using AlexaFluor546-conjugated phalloidin (1:80), and nuclear staining was performed with Hoechst 33,258 (Sigma, 1–2 µg/mL). After 45 minutes of incubation, samples were mounted in Moviol 4–88 mounting medium. Images were acquired using a Leica Stellaris 5 confocal microscope [27].
2.8. Quantification of GSH, Lipid Peroxidation, and Mitochondrial Membrane Potential
MCF-7 cells were seeded at 10,000 cells/well in 24-well plates (Eppendorf). Cells were incubated with 5 µM MnTPPS or 5 µM MnF2BMet for 24 hours, washed with PBS, and incubated in phenol red-free RPMI 1640 medium. GSH levels were quantified using the ThiolTracker™ Violet assay (Invitrogen™) after 2 hours of incubation with 0.5 mM ASC. Lipid peroxidation was assessed using the Image-iT™ Lipid Peroxidation Kit (Invitrogen) according to the manufacturer’s protocol. Mitochondrial membrane potential was analyzed using the JC-1 fluorescence probe in glass-bottom culture dishes (Thermo Fisher™). MCF-7 cells were preloaded with 20 µM MnF2BMet for 24 hours, washed with PBS, and incubated in phenol red-free RPMI 1640 [28]. Red-to-green fluorescence ratio was measured 2 hours after the addition of 0.5 mM ASC. All imaging was performed using a Leica Stellaris 5 microscope equipped with a CO2 chamber (5%) and temperature control (37 °C).
2.9. Quantification of Intracellular H2O2
Intracellular hydrogen peroxide levels were measured using the HyPer7 fluorescent probe [29]. MCF-7 cells were transfected with pCS2+HyPer7-NES plasmid (kindly provided by Dr. Vsevolod Belousov; Addgene plasmid #136467) using Lipofectamine 3000 (Invitrogen), according to manufacturer’s protocol. 24 hours later, 5 µM MnF2BMet was added and the cells were incubated in its presence for the next 24 hours. Imaging was performed in glass-bottom culture dishes (Ibidi) using a Leica Stellaris 5 confocal microscope with CO2 (5%) and temperature control (37 °C). Images were collected at 30-second intervals over 6 minutes. After initial 90 seconds of imaging, ASC was added to achieve a final concentration of 0.1 mM. Cells were imaged using excitation at 405 and 488 nm, with emission in the green fluorescence range. Fluorescence analysis was performed using a custom ImageJ macro, which generated 488/405 nm ratiometric images by pixel-by-pixel division and applied threshold-based masks to automatically detect individual cells. For each time point, the average ratio within each cell was calculated.
2.10. Quantification of Intracellular Ascorbate Levels
Intracellular ASC levels were measured using the Ascorbic Acid Assay Kit II (Sigma). MCF-7 cells (1 × 10⁶) were seeded in culture dishes and treated with either 0.5 or 2 mM ASC, or 0.5 or 2 mM DHA in PBS for 90 minutes. Then, the cells were washed twice with PBS, lysed, and centrifuged to remove cellular debris. Proteins were eliminated from the supernatant with a 10 kDa MWCO spin filter, and the reducing activity of each sample was measured at 595 nm. For each sample, a control containing ASC oxidase was included to distinguish between the oxidized and reduced forms of ASC. All samples were prepared in triplicate to ensure statistical accuracy.
2.10. Statistical Analysis
The statistical significance of variances in cell migration speed, cell viability and fluorescence assay was evaluated using the Student’s t-test. All statistical analyses were conducted using STATISTICA 13, with a threshold for statistical significance set at p < 0.05.
3. Results
3.1. Optical properties of Manganese Porphyrins
Figure 1 presents the structures of the two studied manganese(III) porphyrins: 5,10,15,20-Tetrakis(4-sulfonylphenyl)porphyrin manganese(III) acetate (MnTPPS) and 5,10,15,20-Tetrakis [2,6-difluoro-5(N-methylsulfamoyl)phenyl]porphyrin manganese(III) (MnF2BMet) porphyrins, which differ in their meso- or para-substituents (sulfonyl, sulfonamide) and ortho-halogen substituents. These structural variations may influence their stability, lipophilicity, and, consequently, their potential cellular distribution, localization and possibly biological activity. Electronic absorption spectra of these metal complexes are also demonstrated in Figure 1. Emission spectra were recorded; fluorescence was negligible under our conditions, which is consistent with strong excited-state quenching in Mn(III) porphyrins.
Table 400. nm region and additional charge-transfer features that extend into the 300–400 nm region. These additional bands arise from charge transfer (CT) transitions, which are especially pronounced in high-spin manganese(III) porphyrins. In manganese(III) complexes, these transitions include metal-to-ligand charge transfer (MLCT), involving electron density from manganese d orbitals to porphyrin π* orbitals, and ligand-to-metal charge transfer (LMCT), where electrons transfer from porphyrin π orbitals to manganese d orbitals. These features define hyper d-type spectra, characteristic of high-spin manganese(III) porphyrins, and explain their electronic absorption properties shown in Figure 1.
3.2. Selective Cytotoxicity of the MnPs-ASC System Toward Cancer Cells: A Screening Approach
To evaluate the cancer cell specificity of the cytotoxic effects exerted by the MnPs/ASC system, we conducted a screening study across a range of selected human glioblastoma, prostate, and pancreatic cancer cell lines (MCF-7, PANC-1, U87, and T98G) and compared their responses to those of rat prostate cancer cells (AT-2) and normal human dermal fibroblasts (HDFs).
Among the tested cell lines, MCF-7, AT-2, and PANC-1 exhibited the highest sensitivity to ASC, demonstrating a substantial reduction in viability upon co-treatment with manganese porphyrins (Figure 2A). In contrast, T98G glioblastoma cells displayed greater resistance to ASC treatment; however, the addition of MnTPPS or MnF2BMet significantly enhanced ASC-induced cytotoxicity (Figure 2B). Interestingly, U87 glioblastoma cells exhibited a response profile similar to T98G cells in terms of ASC resistance, yet in this case, the presence of manganese porphyrin did not significantly enhance the cytotoxicity of ASC. For both U87 and T98G cells, the survival curves were extended to a broader ASC concentration range (up to 20 mM) to capture differential effects at higher doses. Notably, normal HDFs were the most resistant to ASC treatment, and the inclusion of MnTPPS or MnF2BMet did not enhance ASC cytotoxicity in these cells (Fig. 2B). These results suggest that, under the tested conditions, MnPs can potentiate ascorbate-induced cytotoxicity in several cancer cell lines, with minimal effects observed in normal fibroblasts. This apparent cancer-selective enhancement justified further evaluation of manganese porphyrins as modulators of ascorbate-based strategies. Based on these findings, two cell lines characterized by differing ASC sensitivity—AT-2 (ASC-sensitive) and T98G (ASC-resistant)—were selected for further investigations to assess MnPs activity at higher concentrations. However, neither MnTPPS nor MnF2BMet exhibited direct cytotoxic effects when administered alone at concentrations ranging from 0 to 50 µM (Figure 2C, D).
For subsequent studies, MCF-7 cells were selected as the primary model due to their frequent use in oxidative stress-based therapeutic strategies involving porphyrins and their well-documented resistance mechanisms [30]. MCF-7 cells are known to overexpress the breast cancer resistance protein (BCRP), which actively effluxes macrocyclic compounds such as pheophorbide a, protoporphyrin IX (PpIX), chlorin e6, and porphyrins, making BCRP-positive tumors challenging targets for porphyrin-based treatments [31,32]. Investigating the MnPs-ASC system in this cell line provides valuable insights into its potential efficacy against resistant breast cancer models.
3.3. Effect of MnPs-ASC Treatment on MCF-7 Cell Viability, Proliferation, and Migration
To further explore the cytotoxic effects of the MnPs-ASC system in the MCF-7 cells, a series of assays were conducted to evaluate cell viability, proliferation, migration, and morphological changes (Figure 3). The viability of MCF-7 cells was assessed using the trypan blue exclusion assay following treatment with 5, 20 or 50 μM MnTPPS or MnF2BMet for 24 hours (Figure 3A). Neither porphyrin alone significantly affected cell survival. However, when cells were preloaded with 5 μM MnTPPS or 5 μM MnF2BMet and subsequently treated with ASC (0–1.5 mM) for 24 hours, a marked reduction in viability was observed (Figure 2A). To assess the long-term effects of ASC treatment in the presence of manganese porphyrins, the total number of viable cells was quantified 96 hours post-treatment (Figure 3B). Co-administration of ASC (0.5 or 1 mM) with 5 or 20 μM MnTPPS or MnF2BMet significantly reduced the proliferative capacity of MCF-7 cells compared to ASC alone, indicating a sustained cytostatic effect. The impact of ASC treatment on cell motility was analyzed by tracking migration rates (Figure 3C) and migration pattern (Figure 3D), after ASC exposure. Cells pretreated with MnPs and subsequently exposed to ASC exhibited a notable reduction in motility, further confirming the inhibitory effects of the MnPs-ASC system. Finally, morphological analysis of MCF-7 cells treated with 0.5 mM ASC for 6 hours, with or without prior exposure to 5 μM MnTPPS, revealed significant cytoskeletal rearrangements (Figure 3E). Fluorescence imaging demonstrated pronounced actin filament reorganization (red – F-actin) and nuclear condensation (blue – DNA) in MnPs-ASC-treated cells, indicative of stress-induced cytoskeletal remodeling. These findings further support the potentiating effect of MnPs on ASC-mediated cytotoxicity in breast cancer cells and underscore the potential of this system as a targeted therapeutic strategy for resistant cancer models.
3.4. Kinetics of MCF-7 Cell Death Induced by MnPs-ASC Treatment
The observed synergy between manganese porphyrins (MnPs) and ASC in inducing cytotoxic effects prompted an investigation into the kinetics of this process. To determine the timing and progression of ASC-induced MCF-7 cell death in the absence and presence of MnPs, propidium iodide (PI) uptake was monitored using time-lapse videomicroscopy as an indicator of membrane integrity loss (Figure 4).
When applied alone, MnTPPS and MnF2BMet did not induce PI uptake during the first 12 hours following drug administration, confirming their lack of intrinsic cytotoxicity. Similarly, ASC at 0.5 mM did not exhibit direct toxicity and failed to induce PI uptake in MCF-7 cells. However, when 5 µM MnTPPS or 5 µM MnF2BMet was introduced prior to ASC exposure, a marked cytotoxic response was observed, with PI uptake occurring within 2 to 4 hours, depending on the ASC concentration (Figure 4A, C, Video S1, S2, S3). At 1 mM, ASC alone was sufficient to induce cytotoxicity, leading to cell death approximately 4 hours post-treatment. Notably, the presence of MnTPPS or MnF2BMet significantly accelerated this process, reducing the time required for detectable PI uptake to 2 hours (Figure 4B, D, Video S4, S5, S6). These results indicate that MnPs enhance the cytotoxic properties of ASC by accelerating the loss of membrane integrity, ultimately leading to a rapid and effective induction of cell death in MCF-7 cells.
3.5. Hallmarks of Oxidative Stress Induced by the MnPs-ASC System
To further elucidate the mechanisms underlying early cell membrane damage induced by the MnPs-ASC system in MCF-7 cells, we investigated key hallmarks of oxidative stress following MnPs and/or ASC treatment. These analyses revealed that the membrane integrity loss observed in the previous experiments (Figure 4) is accompanied by a significant increase in lipid peroxidation in cells treated with 0.5 mM ASC in the presence of 5 µM MnTPPS or 5 µM MnF2BMet. While 0.5 mM ASC alone also induced lipid peroxidation within 2 hours post-treatment, this effect was less pronounced compared to cells preloaded with MnPs (Figure 5A, B).
In parallel with the observed lipid peroxidation, we detected a substantial depletion of intracellular glutathione (GSH) and mitochondrial membrane depolarization in MnPs-ASC-treated MCF-7 cells. A statistically significant decrease in GSH levels was observed upon ASC administration in cells preloaded with 5 µM MnTPPS or 5 µM MnF2BMet (Figure 5C). Notably, MnPs alone did not alter intracellular GSH levels in these conditions. Interestingly, treatment with 0.5 mM ASC alone led to a moderate increase in the intracellular GSH pool, which may reflect a compensatory cellular response to oxidative stress. Finally, we observed that MnPs-ASC treatment also caused mitochondrial membrane depolarization, which was significantly more pronounced in the cells preloaded with 20 µM MnF2BMet. These alterations were accompanied by structural changes in mitochondria, including mitochondrial fragmentation and loss of network continuity, as visualized by fluorescence microscopy (Figure 5D, E).
Collectively, these findings indicate that MnPs enhance ASC-induced oxidative stress, leading to membrane lipid peroxidation, depletion of intracellular antioxidant defenses, and mitochondrial dysfunction, ultimately contributing to cellular damage and death.
3.6. Combined MnPs/ASC Treatment Increases H2O2 Levels in MCF-7 Cells
To further elucidate the mechanisms underlying oxidative stress induction in MnPs/ASC-treated MCF-7 cells, we investigated intracellular H2O2 level using the HyPer7 biosensor. As a control, MCF-7 cells preloaded with 5 µM MnF2BMet were repeatedly illuminated for 6 minutes, with no detectable changes in H2O2 levels or cellular morphology (Figure 6), both confirmed within a subsequent 6 minutes of imaging (data not shown). These findings confirm that 5 µM MnF2BMet alone does not contribute to H2O2 generation in experimental conditions and does not interfere with the measurement when ASC is added. This is particularly relevant given that the free porphyrin ligand is photochemically active and capable of generating ROS. The lack of ROS production in the presence of Mn(III)-complexed porphyrin indicates that no free ligand molecules remain in the system, thereby confirming full coordination of manganese.
In contrast, the introduction of 0.1 mM ASC into the culture medium resulted in a rapid and pronounced increase in the H2O2-specific signal, reaching a maximum intensity within 30 seconds, followed by a gradual decline (Video S7, S8). Notably, when ASC was added to cells preloaded with 5 µM MnF2BMet, the increase in H2O2 levels was significantly higher than in ASC-treated cells without porphyrin pretreatment (Video S9, S10).
These results confirm that the light-induced enhancement of the HyPer7 fluorescence signal likely reflects localized ROS amplification, potentially involving photoactivation of membrane-bound MnPs or intracellular processes facilitated by ASC-induced redox cycling. Although HyPer7 is considered a highly selective probe for H2O2, it cannot entirely exclude the contribution of other ROS, particularly under conditions involving light exposure and redox-active metal complexes. Thus, photo-assisted redox processes have been proposed in related systems [33]; while HyPer7 is selective for H2O2, secondary ROS could contribute to membrane damage. Our findings point to H2O2 as the principal ROS involved but they also suggest that, under light exposure, a broader ROS network may be activated, further amplifying the cytotoxic effects of the MnPs–ASC system.
3.7. Extracellular Interactions Between ASC and MnPs Mediate Their Combined Cytotoxicity
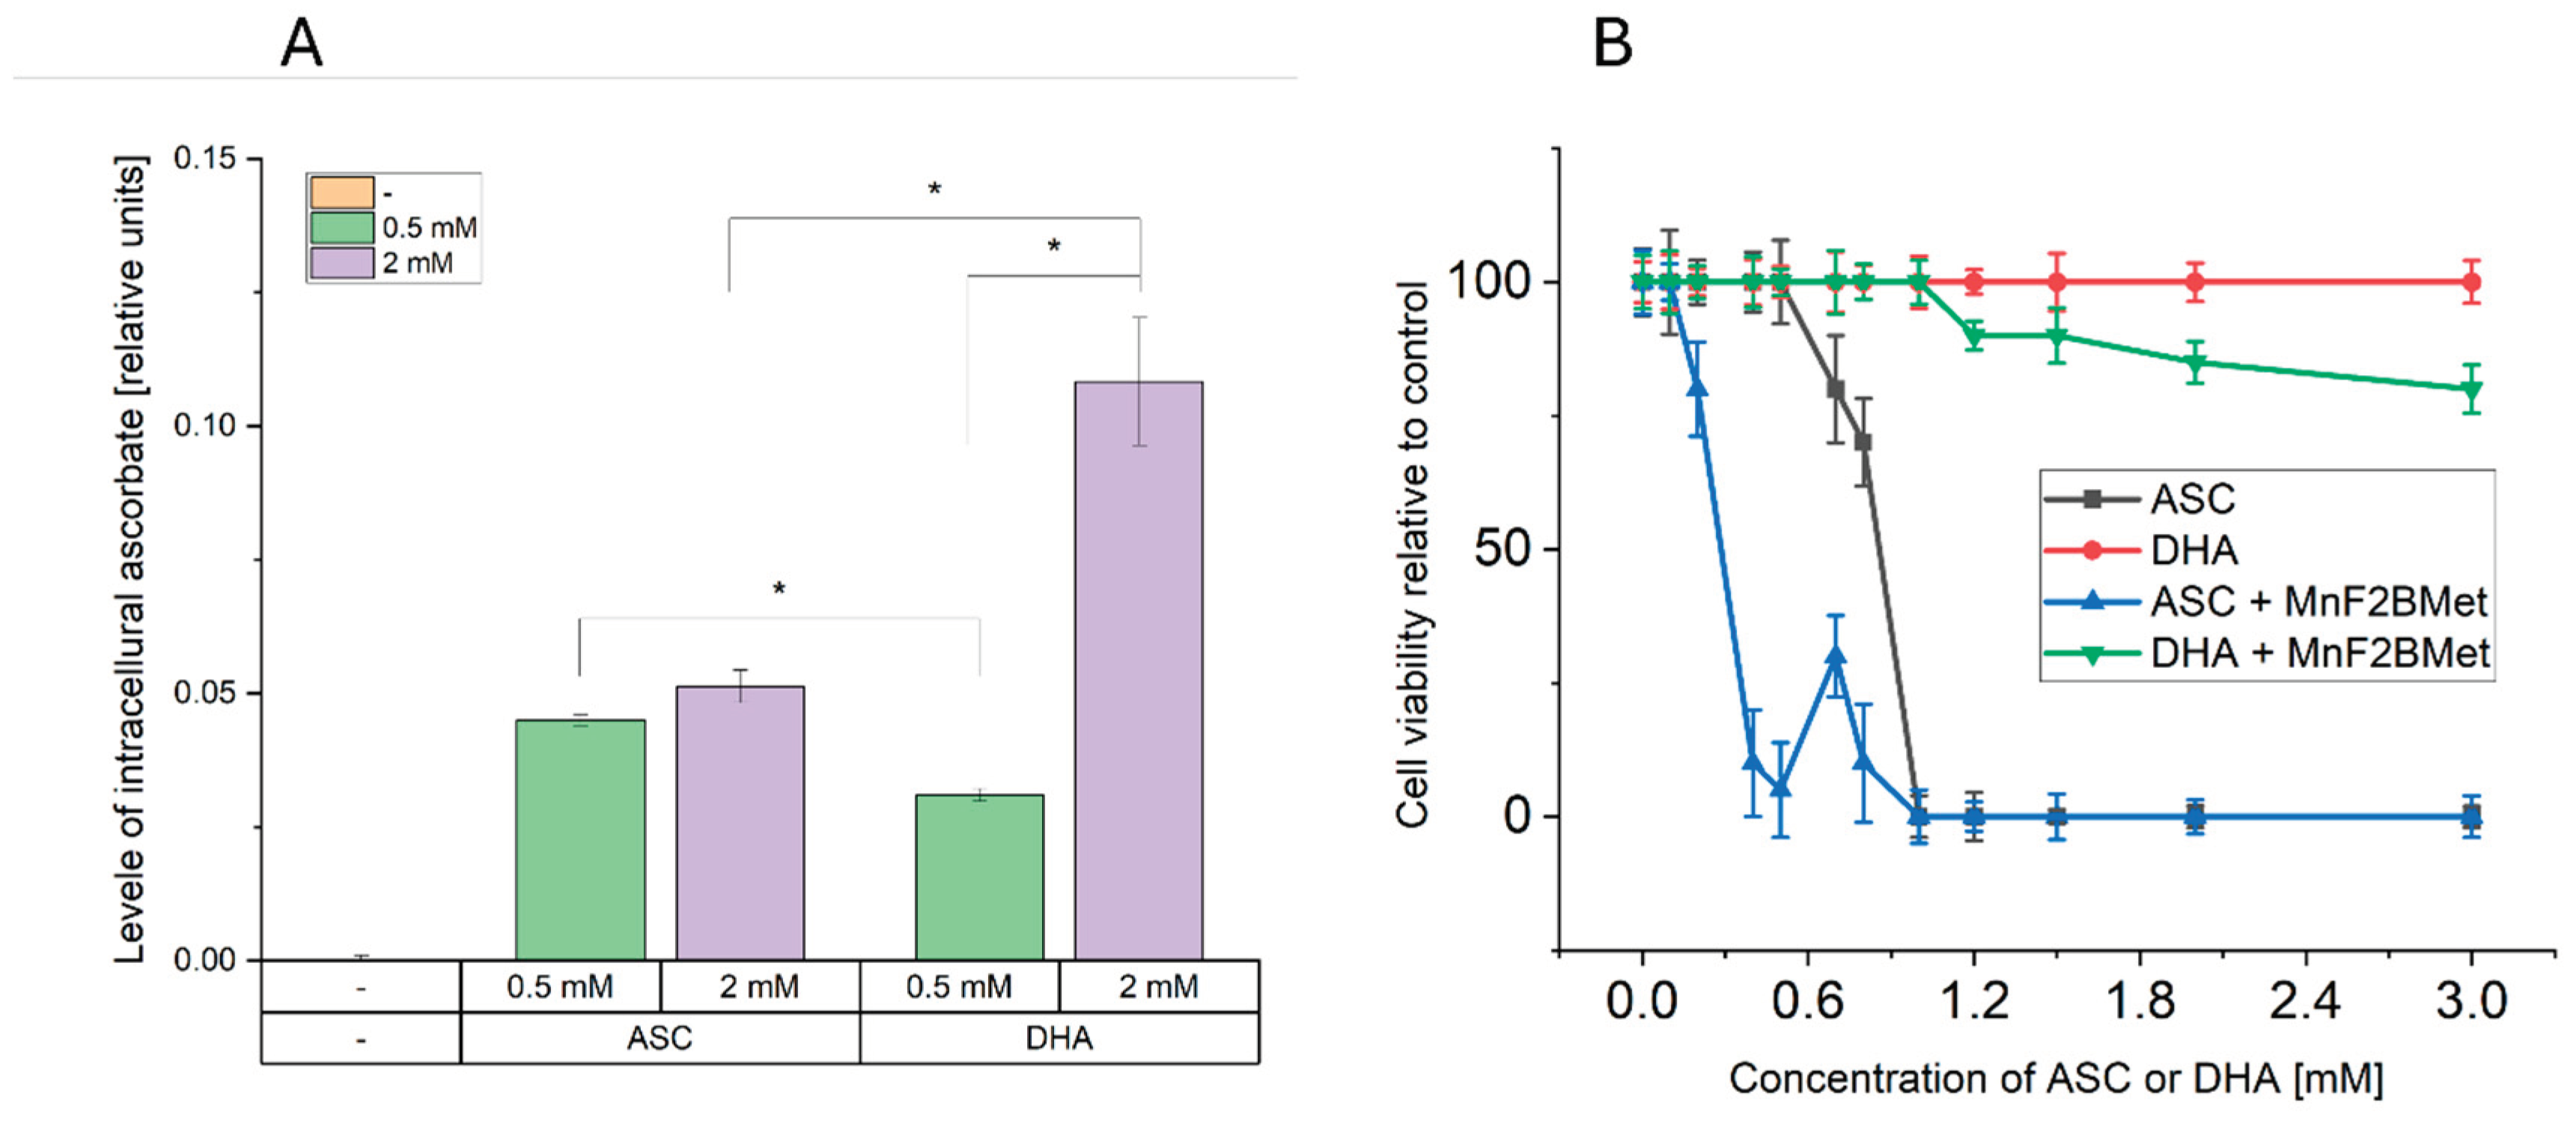
Given that both ASC and MnPs are present in the extracellular space and can also accumulate intracellularly, the generation of H2O2 induced by MnPs/ASC interactions may occur in both compartments [34]. To determine whether extracellular or intracellular ROS production is responsible for the cytotoxic effects of the MnPs-ASC system, we examined the impact of exogenously added catalase on MCF-7 cell viability (Figure 7). As an additional control, we included MnTBAP, used here as a reference manganese porphyrin with low catalytic activity toward ascorbate [35]. Our results show that extracellular catalase completely abolished the cytotoxic effects of the MnPs-ASC system, indicating a predominant contribution of extracellular H2O2 to the observed response. This conclusion was further reinforced by experiments utilizing 1 mM DHA, a non-radical form of ASC that is taken up by cells via GLUT transporters and subsequently reduced to ASC intracellularly. While DHA alone remained non-toxic to MCF-7 cells, its addition to 5 µM MnF2BMet-loaded cells resulted in only a minor, statistically insignificant decrease in viability, supporting the notion that intracellular ASC alone is insufficient to drive the MnPs-mediated cytotoxic response.
Importantly, a significant increase in intracellular ASC levels was observed 6 hours after the addition of 2 mM DHA (Figure 8). However, despite the intracellular accumulation of ASC, no substantial cytotoxic effects were observed, supporting the view that extracellular ascorbate is critical for the MnPs-ascorbate response under our conditions. Consistent with this mechanism, extracellular catalase fully neutralized the cytotoxic effects of MnPs-ASC treatment (Figure 7), underscoring the central role of H2O2 production in mediating cell death. Additionally, MnTBAP (5 µM) did not enhance ASC cytotoxicity, further demonstrating that the redox activity of MnTPPS and MnF2BMet is essential for their potentiating effects. These findings collectively support extracellular ascorbate oxidation as the main contributor to MnPs-ascorbate cytotoxicity, whereas intracellular ascorbate accumulation alone was insufficient in our assays.
4. Discussion
The hypothesis that manganese porphyrins catalyze ascorbate oxidation, yielding ascorbyl radicals and hydrogen peroxide (H2O2) with preferential toxicity toward cancer cells, has been widely investigated [18, 21, 34). MnPs are recognized as potent redox-active catalysts that facilitate the formation of ROS from ASC, which preferentially damages cancer cells due to their heightened sensitivity to oxidative stress and impaired antioxidant defenses [3]. Despite the promising results of previous studies, the precise mechanisms underlying MnPs-ASC cytotoxicity remain only partially understood. Notably, in several studies the role of H2O2 as a major mediator was inferred from indirect markers such as GSH depletion or lipid peroxidation, with fewer reports providing direct H2O2 readouts [35]. Furthermore, both intracellular and extracellular sources have been discussed, although multiple studies have supported a predominant extracellular contribution under specific conditions [19,36,37].
Here, we evaluated two synthetic MnPs (MnTPPS and MnF2BMet) for their ability to efficiently catalyze ASC oxidation, generate H2O2, and exert cytotoxic effects in cancer cells. Our study indicates a predominant contribution of extracellular H2O2 to the observed cytotoxicity, reinforcing the relevance of extracellular ROS dynamics in MnP–ascorbate responses.
Previous studies have reported that some MnPs exhibit intrinsic cytotoxicity when administered alone [38]. However, our results demonstrate that MnTPPS and MnF2BMet, when applied at standard in vitro concentrations (5–20 µM), do not induce significant cytotoxic nor do they affect the migratory or proliferative potential of cancer cells [18,21,38,39]. These findings align with earlier observations regarding the redox properties of manganese porphyrins in breast cancer models [34,40,41]. In contrast, when combined with ASC, both MnPs significantly enhance ASC-induced cytotoxicity in MCF-7 cells, consistent with the proposed mechanism of ASC oxidation and subsequent ROS generation. The extent of ascorbate oxidation by manganese porphyrins, with H2O2 generation, depends on their redox and structural properties [21]. To date, numerous MnPs have been developed that catalyze ASC oxidation, generating ROS such as superoxide (O2•−) and H2O2. Among these, 5''N-substituted pyridyl-porphyrins have been specifically designed as superoxide dismutase (SOD) mimetics [38]. Notably, the ASC concentrations used in our experiments are physiologically relevant, corresponding to plasma levels observed in patients receiving pharmacological ASC administration [11,17]. Some studies have even reported ASC concentrations as high as 20 mM in patient sera shortly after intravenous administration [13]. Thus, our findings add to reports of ROS-dependent cytotoxicity in cancer models and support further evaluation of this approach.
To date, most studies on the pro-oxidative activity of MnPs have been based on oxygen consumption assays and indirect detection of H2O2 in cell-free systems [35]. It has been shown that numerous MnPs generate ROS under cell-free conditions, particularly when combined with high concentrations of ASC [18,19,34]. These findings indirectly suggest the induction of oxidative stress in cells treated with MnPs/ASC; however, the intracellular environment is highly complex and contains many redox-active species that can interact with MnPs, including thiols, superoxide anions (O2•−), and hydrogen peroxide. Moreover, local pH fluctuations further modulate these interactions [34]. Previous in vitro studies have suggested that MnPs-ASC interactions lead to ROS generation, but these conclusions were mostly based on indirect markers such as GSH depletion or lipid peroxidation. It has been demonstrated that H2O2 is crucial for the cytotoxic properties of MnPs-ASC, as the application of extracellular catalase abolished the cytotoxic effect. This indicates an extracellular mechanism of ROS generation.
In our study, we directly quantified intracellular H2O2 levels using the HyPer7 fluorescent probe, providing clear evidence that H2O2 is the key mediator of MnPs-ASC-induced oxidative stress in MCF-7 cells. This method allowed us to demonstrate that MnPs-ASC treatment leads to sustained intracellular H2O2 elevation, correlating with increased lipid peroxidation, mitochondrial membrane depolarization, and ultimately cell death. The trypan blue exclusion test and (PI) uptake are complementary assays that indicate the loss of cell membrane integrity but are not capable of detecting cells in the early stages of apoptosis. On the other hand, the PI-uptake kinetics are consistent with rapid membrane integrity loss; however, definitive discrimination between necrosis and apoptosis would require dedicated markers [21,42,43]. Our results support extracellular H2O2 as a main contributor to MnP–ascorbate cytotoxicity under our conditions. Extracellular catalase completely abolished MnPs-ASC cytotoxic effects, confirming that H2O2 is generated outside the cells and must diffuse intracellularly to exert its effects. DHA supplementation (which enters cells and is reduced to ASC intracellularly) failed to induce significant cytotoxicity, even though it increased intracellular ASC levels. This strongly suggests that intracellular ASC alone is insufficient to drive MnPs-mediated ROS production and cell death. Washing the MnPs prior to ascorbate addition did not alter cytotoxicity. Although this observation suggests an intracellular mechanism, alternative explanations—such as residual surface-associated compound or incomplete washout—cannot be excluded.
Collectively, these findings confirm the role of extracellular interactions between manganese porphyrins and ascorbate in H2O2 formation at or near the cell surface. A similar mechanism has been described in the degradation of hyaluronic acid, which depends on MnPs-ASC interactions in the extracellular milieu [37]. Based on these observations, we propose a mechanistic model in which i) MnPs accumulate on the cancer cell surface, possibly through electrostatic interactions with extracellular proteins or altered glycocalyx structures; ii) in the presence of ASC, MnPs catalyze the extracellular accumulation of H2O2 and its diffusion into the cells iii) locally accumulated ROS lead to cell membrane damage, whereas intracellular H2O2 overwhelms antioxidant defenses (GSH depletion), induces lipid peroxidation, and disrupts mitochondrial function, leading to iv) irreversible damages and necrotic cell death. These findings support an extracellular ROS-linked mechanism of cancer cell death and motivate further studies to define conditions under which such redox modulation could be therapeutically leveraged.
5. Conclusions
Our results indicate that MnTPPS and MnF2BMet can enhance the cytotoxic effects of ascorbate, consistent with a predominant contribution of extracellular hydrogen peroxide (H2O2) generation. The resulting H2O2 likely diffuses into cells, where it contributes to oxidative damage of organelles and membranes, leading to loss of cell integrity, while sparing normal fibroblasts under the tested conditions. These findings support the potential of manganese porphyrin–ascorbate redox systems, in which a metal-based catalyst promotes ascorbate oxidation and the formation of reactive peroxide species. Further development of this concept should focus on: i) structural optimization of manganese porphyrins to improve redox efficiency and selectivity; ii) in vivo studies to evaluate the therapeutic relevance of MnP–ascorbate interactions in tumors with altered redox balance;iii) assessment of interactions between MnPs, ascorbate, and extracellular matrix components that may modulate their localization and ROS generation; and iv) combination of MnP–ascorbate treatment with other oxidative stress–based modalities, such as photodynamic therapy, radiotherapy, or chemotherapy. By refining these approaches, MnP–ascorbate systems may evolve into a promising platform for redox-based cancer therapy that selectively exploits the oxidative vulnerabilities of tumor cells.
Supplementary Materials
Video S1.mp4 0.5 mM ASC. PI uptake in MCF-7 cells over time. Video starts 30 min after ASC addition; Video S2.mp4 0.5 mM ASC + 5 µM MnTPPPS, PI uptake in MCF-7 cells over time. Video starts 30 min after ASC addition; Video S3.mp4 0.5 mM ASC+ 5 µM MnF2BMet, PI uptake in MCF-7 cells over time. Video starts 30 min after ASC addition; Video S4.mp4 1 mM ASC, PI uptake in MCF-7 cells over time. Video starts 30 min after ASC addition; Video S5.mp4 1 mM ASC + 5 µM MnTPPPS, PI uptake in MCF-7 cells over time. Video starts 30 min after ASC addition; Video S6.mp4 1 mM ASC + 5 µM MnF2BMet, PI uptake in MCF-7 cells over time. Video starts 30 min after ASC addition; Video S7.mp4 HyPer7 ratio fluorescence in time. 0.1 mM ASC, ASC addition after 90 s of live-cell imaging. The grayscale corresponds to the ratio of fluorescence intensity: black – fluorescence ratio = 0, white – fluorescence ratio > 4; Video S8.mp4 HyPer7 ratio fluorescence in time. 0.1 mM ASC, ASC addition after 90 s of live-cell imaging. The colour scale corresponds to the ratio of fluorescence intensity: black – fluorescence ratio = 0, red – fluorescence ratio > 4; Video S9.mp4 HyPer7 ratio fluorescence in time. 0.1 mM ASC + 5 µM MnF2BMet, ASC addition after 90 s of live-cell imaging. The grayscale correspond, to the ratio of fluorescence intensity: black – fluorescence ratio = 0, white – fluorescence ratio > 4; Video S10.mp4 HyPer7 ratio fluorescence in time. 0.1 mM ASC + 5 µM MnF2BMet, ASC addition after 90 s of live-cell imaging. The colour scale corresponds to the ratio of fluorescence intensity: black – fluorescence ratio = 0, red – fluorescence ratio > 4.
Author Contributions
Conceptualization, Michał Rąpała, Janusz Dąbrowski and Zbigniew Madeja; Methodology, Michał Rąpała and Maciej Pudełek; Software, Sławomir Lasota; Validation, Michał Rąpała and Maciej Pudełek; Formal analysis, Sławomir Lasota; Investigation, Michał Rąpała and Maciej Pudełek; Resources, Michał Rąpała and Maciej Pudełek; Data curation, Sławomir Lasota; Writing – original draft, Michał Rąpała and Zbigniew Madeja; Writing – review & editing, Michał Rąpała, Jarosław Czyż, Janusz Dąbrowski and Zbigniew Madeja; Visualization, Michał Rąpała and Sławomir Lasota; Supervision, Zbigniew Madeja; Project administration, Michał Rąpała and Zbigniew Madeja; Funding acquisition, Michał Rąpała, Janusz Dąbrowski and Zbigniew Madeja.
Funding
This research was funded by Polish Ministry of Science and Higher Education (Diamond grant no. 0054/DIA/2020/49) and JMD thank National Science Center (NCN) for the project no 2020/37/B/NZ7/04157.
Institutional Review Board Statement
Not applicable.
Informed Consent Statement
Not applicable.
Data Availability Statement
The datasets used and/or analysed during the current study are available from the corresponding author on reasonable request.
Acknowledgments
I would like to acknowledge the Laboratories of Multi-Level Imaging of Biological Structures for providing access to the Leica Stellaris 5 microscope.
Conflicts of Interest
The authors declare no conflicts of interest.
Abbreviations
The following abbreviations are used in this manuscript:
| MnPs | Manganese Porphyrins |
| ASC | Ascorbate |
| HDF | Human dermal fibroblasts |
| DHA | Dehydroascorbate |
| PDT | Photodynamic therapy |
| ROS | Reactive oxygen species |
| AA | L-ascorbic acid |
| SOD | Superoxide dismutase |
| GSH | Glutathione |
| MnTBAP | Mn(III) tetrakis(4-benzoic acid) porphyrin chloride |
| MnTPPS | Manganese(III) porphyrin: 5,10,15,20-Tetrakis(4-sulfonylphenyl)porphyrin manganese(III) acetate |
| MnF2BMet | 5,10,15,20-Tetrakis [2,6-difluoro-5(N-methylsulfamoyl)phenyl]porphyrin manganese(III) |
| RPMI 1640 | Roswell Park Memorial Institute 1640 medium |
| DMSO | Dimethyl sulfoxide |
| FBS | Fetal bovine serum |
| PBS | Phosphate buffered saline |
References
- Král, V.; Králová, J.; Kaplánek, R.; Bríza, T.; Martásek, P. Quo vadis porphyrin chemistry? Physiol. Res. 2006, 55 (Suppl 2), S3–S26. [Google Scholar] [CrossRef]
- Repetowski, P.; Warszyńska, M.; Dąbrowski, J.M. NIR-activated multifunctional agents for the combined application in cancer imaging and therapy. Adv. Colloid Interface Sci. 2025, 336, 103356. [Google Scholar] [CrossRef]
- Waris, G.; Ahsan, H. Reactive oxygen species: role in the development of cancer and various chronic conditions. J. Carcinog. 2006, 5, 14. [Google Scholar] [CrossRef]
- Warszyńska, M.; Repetowski, P.; Dąbrowski, J.M. Photodynamic therapy combined with immunotherapy: recent advances and future research directions. Coord. Chem. Rev. 2023, 495, 215350. [Google Scholar] [CrossRef]
- Dabrowski, J.M.; Arnaut, L.G. Photodynamic therapy (PDT) of cancer: from local to systemic treatment. Photochem. Photobiol. Sci. 2015, 14, 1765–1780. [Google Scholar] [CrossRef]
- Karwicka, M.; Pucelik, B.; Gonet, M.; Elas, M.; Dąbrowski, J.M. Effects of photodynamic therapy with Redaporfin on tumor oxygenation and blood flow in a lung cancer mouse model. Sci. Rep. 2019, 9, 12655. [Google Scholar] [CrossRef]
- Soares, H.T.; Campos, J.R.; Gomes-da-Silva, L.C.; Schaberle, F.A.; Dabrowski, J.M.; Arnaut, L.G. Pro-oxidant and antioxidant effects in photodynamic therapy: cells recognise that not all exogenous ROS are alike. ChemBioChem 2016, 17, 836–842. [Google Scholar] [CrossRef] [PubMed]
- Faustova, M.; Nikolskaya, E.; Sokol, M.; Zabolotsky, A.; Mollaev, M.; Zhunina, O.; et al. High-effective reactive oxygen species inducer based on Mn-tetraphenylporphyrin loaded PLGA nanoparticles in binary catalyst therapy. Free Radic. Biol. Med. 2019, 143, 522–533. [Google Scholar]
- Houglum, K.P.; Brenner, D.A.; Chojkier, M. Ascorbic acid stimulation of collagen biosynthesis independent of hydroxylation. Am. J. Clin. Nutr. 1991, 54, 1141S. [Google Scholar] [CrossRef] [PubMed]
- Ryszawy, D.; Pudełek, M.; Catapano, J.; Ciarach, M.; Setkowicz, Z.; Konduracka, E.; et al. High doses of sodium ascorbate interfere with the expansion of glioblastoma multiforme cells in vitro and in vivo. Life Sci. 2019, 232, 116657. [Google Scholar] [CrossRef] [PubMed]
- Tanaka, H.; Matsuda, T.; Miyagantani, Y.; Yukioka, T.; Matsuda, H.; Shimazaki, S. Reduction of resuscitation fluid volumes in severely burned patients using ascorbic acid administration: a randomized, prospective study. Arch. Surg. 2000, 135, 326–331. [Google Scholar] [CrossRef]
- Lőrincz, T.; Holczer, M.; Kapuy, O.; Szarka, A. The interrelationship of pharmacologic ascorbate-induced cell death and ferroptosis. Pathol. Oncol. Res. 2019, 25, 669–679. [Google Scholar] [CrossRef] [PubMed]
- Chen, Q.; Espey, M.G.; Sun, A.Y.; Lee, J.H.; Krishna, M.C.; Shacter, E.; et al. Ascorbate in pharmacologic concentrations selectively generates ascorbate radical and hydrogen peroxide in extracellular fluid in vivo. Proc. Natl. Acad. Sci. U.S.A. 2007, 104, 8749–8754. [Google Scholar] [CrossRef] [PubMed]
- Gąbka, M.; Dałek, P.; Przybyło, M.; Gackowski, D.; Oliński, R.; Langner, M. The membrane electrical potential and intracellular pH as factors influencing intracellular ascorbate concentration and their role in cancer treatment. Cells 2021, 10, 11. [Google Scholar] [CrossRef]
- Liang, W.J.; Johnson, D.; Jarvis, S.M. Vitamin C transport systems of mammalian cells. Mol. Membr. Biol. 2001, 18, 87–95. [Google Scholar] [CrossRef]
- Przybyło, M.; Langner, M. On the physiological and cellular homeostasis of ascorbate. Cell. Mol. Biol. Lett. 2020, 25, 32. [Google Scholar] [CrossRef]
- Padayatty, S.J.; Levine, M. Vitamin C: the known and the unknown and Goldilocks. Oral Dis. 2016, 22, 463–493. [Google Scholar] [CrossRef]
- Evans, M.K.; Tovmasyan, A.; Batinic-Haberle, I.; Devi, G.R. Mn porphyrin in combination with ascorbate acts as a pro-oxidant and mediates caspase-independent cancer cell death. Free Radic. Biol. Med. 2014, 68, 302–314. [Google Scholar]
- Ye, X.; Fels, D.; Tovmasyan, A.; Aird, K.M.; Dedeugd, C.; Allensworth, J.L.; et al. Cytotoxic effects of Mn(III) N-alkylpyridylporphyrins in the presence of cellular reductant, ascorbate. Free Radic. Res. 2011, 45, 1289–1306. [Google Scholar] [CrossRef]
- Batinić-Haberle, I.; Rebouças, J.S.; Spasojević, I. Superoxide dismutase mimics: chemistry, pharmacology, and therapeutic potential. Antioxid. Redox Signal. 2010, 13, 877–918. [Google Scholar] [CrossRef] [PubMed]
- Tovmasyan, A.; Sampaio, R.S.; Boss, M.K.; Bueno-Janice, J.C.; Bader, B.H.; Thomas, M.; et al. Anticancer therapeutic potential of Mn porphyrin/ascorbate system. Free Radic. Biol. Med. 2015, 89, 1231–1247. [Google Scholar]
- Clichici, S.; Filip, A.; Daicoviciu, D.; Ion, R.M.; Mocan, T.; Tatomir, C.; et al. The dynamics of reactive oxygen species in photodynamic therapy with tetra sulfophenyl-porphyrin. Acta Physiol. Hung. 2010, 97, 41–51. [Google Scholar]
- Rocha, L.B.; Schaberle, F.; Dąbrowski, J.M.; Simões, S.; Arnaut, L.G. Intravenous single-dose toxicity of Redaporfin-based photodynamic therapy in rodents. Int. J. Mol. Sci. 2015, 16, 29236–29249. [Google Scholar] [CrossRef] [PubMed]
- Rocha, L.B.; Gomes-da-Silva, L.C.; Dąbrowski, J.M.; Arnaut, L.G. Elimination of primary tumours and control of metastasis with rationally designed bacteriochlorin photodynamic therapy regimens. Eur. J. Cancer 2015, 51, 1822–1830. [Google Scholar] [CrossRef] [PubMed]
- Pinto, S.M.A.; Henriques, C.A.; Tomé, V.A.; Vinagreiro, C.S.; Calvete, M.J.F.; Dąbrowski, J.M.; et al. Synthesis of meso-substituted porphyrins using sustainable chemical processes. J. Porphyrins Phthalocyanines 2016, 20, 45–60. [Google Scholar] [CrossRef]
- Wybieralska, E.; Koza, M.; Sroka, J.; Czyż, J.; Madeja, Z. Ascorbic acid inhibits the migration of Walker 256 carcinosarcoma cells. Cell. Mol. Biol. Lett. 2008, 13, 103–111. [Google Scholar] [CrossRef]
- Pudełek, M.; Ryszawy, D.; Piwowarczyk, K.; Lasota, S.; Madeja, Z.; Kędracka-Krok, S.; et al. Metabolic reprogramming of poly(morpho)nuclear giant cells determines glioblastoma recovery from doxorubicin-induced stress. J. Transl. Med. 2024, 22, 757. [Google Scholar] [CrossRef]
- ie, L.; Chen, Y.; Chen, J.; Zhang, H.; Liao, Y.; Zhou, Y.; et al. Anti-tumor effects and mechanism of GA-13315, a novel gibberellin derivative, in human lung adenocarcinoma: an in vitro and in vivo study. Cell. Mol. Biol. Lett. 2019, 24, 6. [Google Scholar] [CrossRef]
- Pak, V.V.; Ezeriņa, D.; Lyublinskaya, O.G.; Pedre, B.; Tyurin-Kuzmin, P.A.; Mishina, N.M.; et al. Ultrasensitive genetically encoded indicator for hydrogen peroxide identifies roles for the oxidant in cell migration and mitochondrial function. Cell Metab. 2020, 31, 642–653. [Google Scholar] [CrossRef]
- Dąbrowski, J.M.; Pereira, M.M.; Arnaut, L.G.; Monteiro, C.J.P.; Peixoto, A.F.; Karocki, A.; et al. Synthesis, photophysical studies and anticancer activity of a new halogenated water-soluble porphyrin. Photochem. Photobiol. 2007, 83, 897–903. [Google Scholar] [CrossRef]
- Szafraniec, M.J.; Szeliga, M.; Urbanska, K.; Fiedor, L. Determinants of the activity and substrate recognition of breast cancer resistance protein (ABCG2). Drug Metab. Rev. 2014, 46, 459–474. [Google Scholar]
- Mao, Q.; Unadkat, J.D. Role of the breast cancer resistance protein (BCRP/ABCG2) in drug transport—an update. AAPS J. 2015, 17, 65–82. [Google Scholar] [CrossRef]
- Brillas, E.; Sirés, I.; Oturan, M.A. Electro-Fenton process and related electrochemical technologies based on Fenton’s reaction chemistry. Chem. Rev. 2009, 109, 6570–6631. [Google Scholar] [CrossRef]
- Batinić-Haberle, I.; Tovmasyan, A.; Spasojević, I. An educational overview of the chemistry, biochemistry and therapeutic aspects of Mn porphyrins—from superoxide dismutation to H2O2-driven pathways. Redox Biol. 2015, 5, 42–65. [Google Scholar] [CrossRef]
- Rawal, M.; Schroeder, S.R.; Wagner, B.A.; Cushing, C.M.; Welsh, J.L.; Button, A.M.; et al. Manganoporphyrins increase ascorbate-induced cytotoxicity by enhancing H2O2 generation. Cancer Res. 2013, 73, 5232–5241. [Google Scholar] [CrossRef]
- 35 Tian, J.; Peehl, D.M.; Knox, S.J. Metalloporphyrin synergizes with ascorbic acid to inhibit cancer cell growth through Fenton chemistry. Cancer Biother. Radiopharm. 2010, 25, 439–448. [Google Scholar]
- Valachová, K.; Rapta, P.; Moura, N.M.M.; Batinić-Haberle, I.; Šoltés, L. Ortho isomeric Mn(III) N-alkyl- and alkoxyalkylpyridylporphyrins—enhancers of hyaluronan degradation induced by ascorbate and cupric ions. Int. J. Mol. Sci. 2021, 22, 16. [Google Scholar] [CrossRef] [PubMed]
- Hasan, B.; Tovmasyan, A.; Batinić-Haberle, I.; Benov, L. Ascorbate-dependent and ascorbate-independent Mn porphyrin cytotoxicity: anticancer activity of Mn porphyrin-based SOD mimics through ascorbate-dependent and -independent routes. Redox Rep. 2021, 26, 85–93. [Google Scholar] [CrossRef]
- Batinić-Haberle, I.; Tome, M.E. Thiol regulation by Mn porphyrins, commonly known as SOD mimics. Redox Biol. 2019, 25, 101139. [Google Scholar] [CrossRef]
- Flórido, A.; Saraiva, N.; Cerqueira, S.; Almeida, N.; Parsons, M.; Batinić-Haberle, I.; et al. The manganese(III) porphyrin MnTnHex-2-PyP5+ modulates intracellular ROS and breast cancer cell migration: impact on doxorubicin-treated cells. Redox Biol. 2019, 20, 367–378. [Google Scholar] [CrossRef] [PubMed]
- Gilloteaux, J.; Jamison, J.M.; Neal, D.R.; Loukas, M.; Doberzstyn, T.; Summers, J.L. Cell damage and death by autoschizis in human bladder (RT4) carcinoma cells resulting from treatment with ascorbate and menadione. Ultrastruct. Pathol. 2010, 34, 140–160. [Google Scholar] [CrossRef] [PubMed]
- van Nieuwenhuijze, A.E.; van Lopik, T.; Smeenk, R.J.; Aarden, L.A. Time between onset of apoptosis and release of nucleosomes from apoptotic cells: putative implications for systemic lupus erythematosus. Ann. Rheum. Dis. 2003, 62, 10–14. [Google Scholar] [CrossRef] [PubMed]
- Jaramillo, M.C.; et al. Manganese porphyrin, MnTE-2-PyP5+, acts as a pro-oxidant to potentiate glucocorticoid-induced apoptosis in lymphoma cells. Free Radic. Biol. Med. 2012, 52, 1272–1284. [Google Scholar]
Figure 1.
Chemical structures and electronic absorption spectra of 5,10,15,20-Tetrakis(4-sulfonylphenyl)porphyrin manganese(III) acetate (MnTPPS) and 5,10,15,20-Tetrakis [2,6-difluoro-5(N-methylsulfamoyl)phenyl]porphyrin manganese(III) (MnF2BMet) recorded in PBS or PBS with 0.5 % DMSO at room temperature.
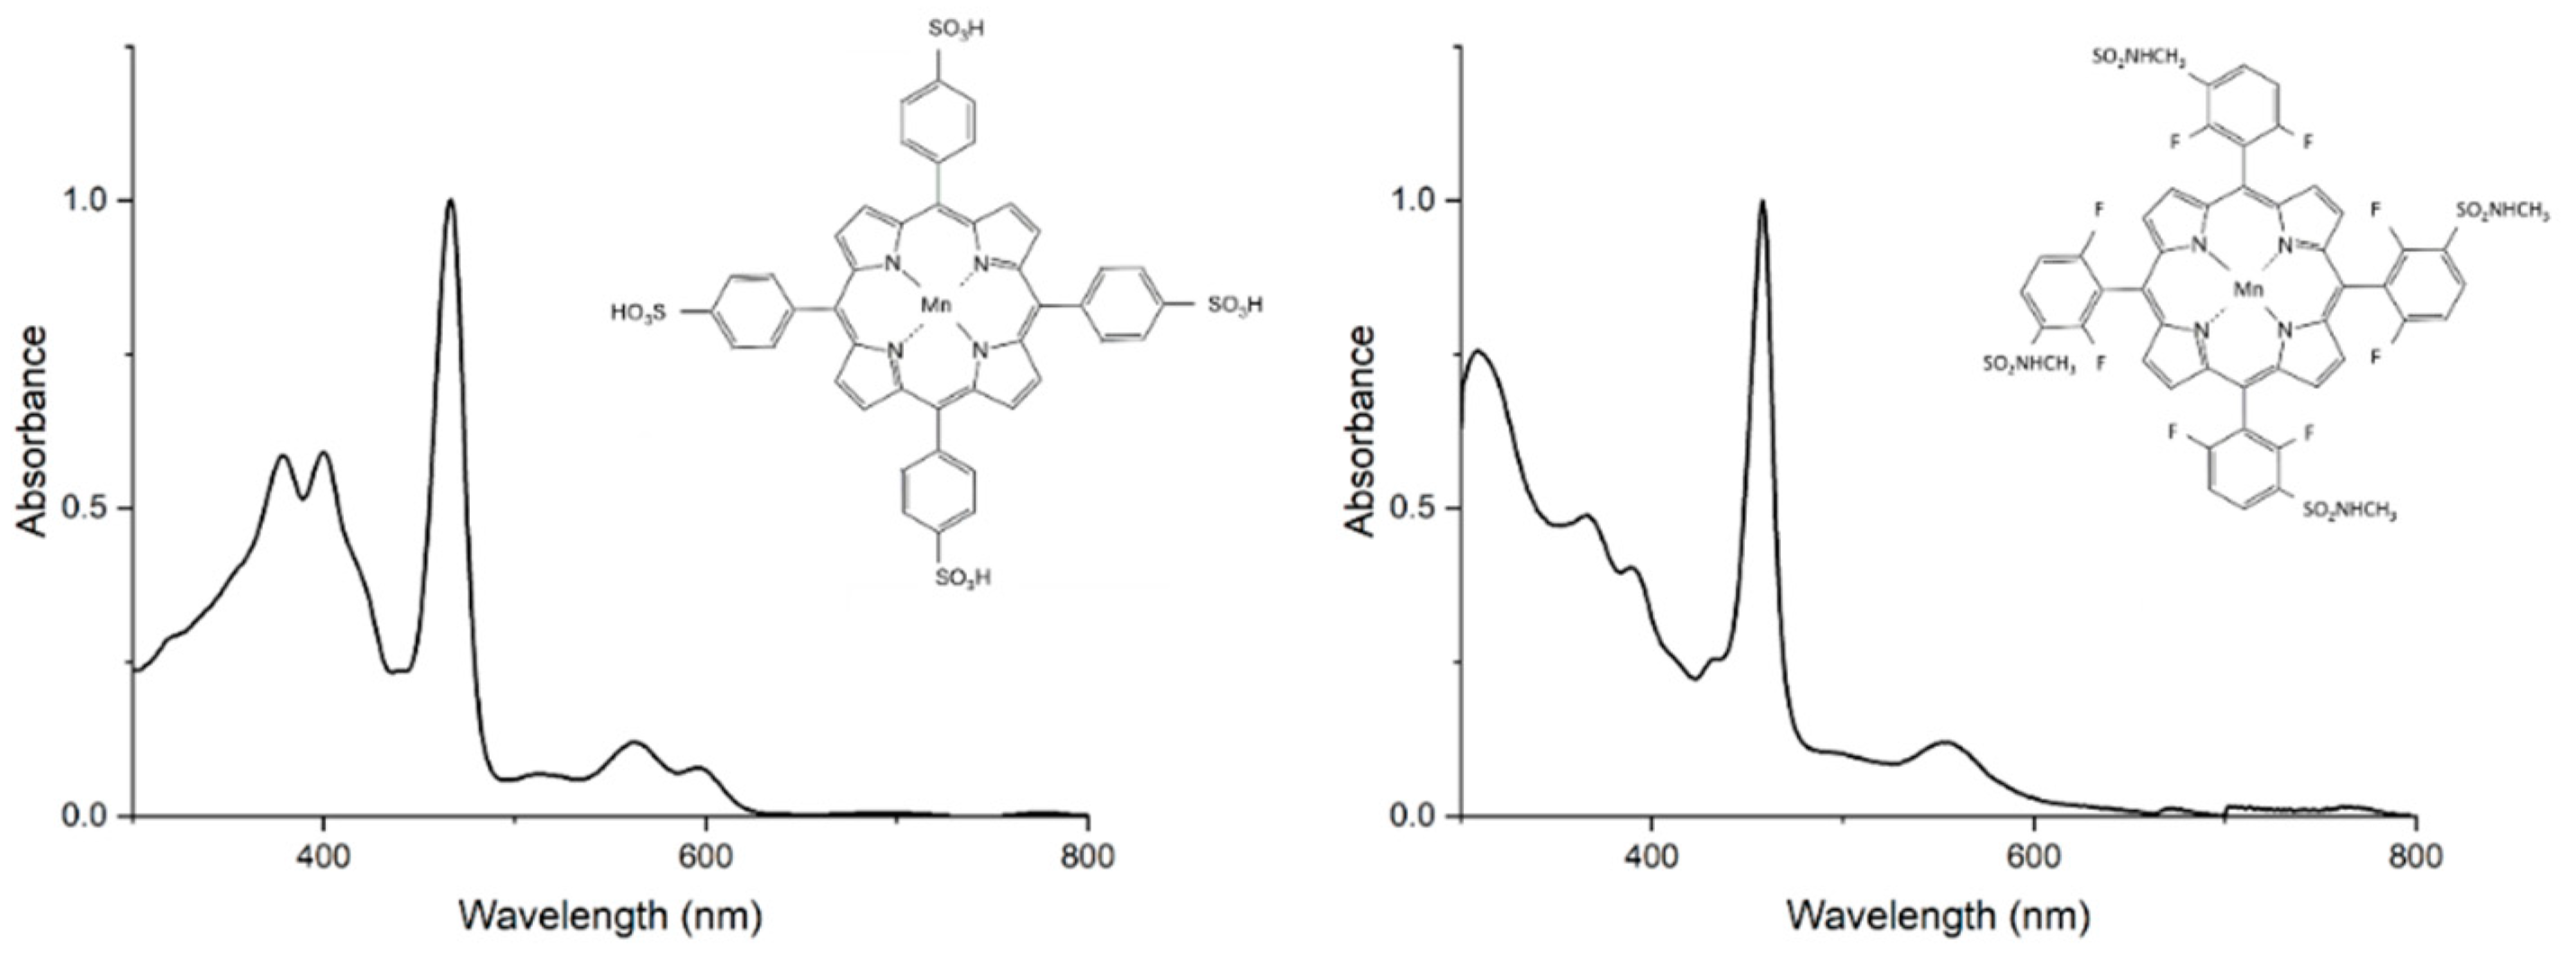
Figure 2.
(A) Viability of PANC-1, AT-2, and MCF-7 cells assessed using the trypan blue exclusion assay following treatment with 5 μM MnTPPS or 5 μM MnF2BMet in the presence of ASC at concentrations ranging from 0 to 2 mM, measured after 24 hours. (B) Viability of HDF, U87, and T98G cells determined using the trypan blue exclusion assay after treatment with 5 μM MnTPPS or 5 μM MnF2BMet in the presence of high concentrations of ASC (0–20 mM), measured after 24 hours. Data are presented as mean ± SEM, with viable cells expressed as a percentage of the total cell population, n = 3, (* p < 0.05) Statistical significance relative to the control without MnPs. (C) Viability of AT-2 cells and (D) viability of T98G cells, assessed using the trypan blue exclusion assay following treatment with MnTPPS or MnF2BMet over a concentration range of 0 to 50 µM, measured after 24 hours. Data are normalized to a DMSO control (0–1%) and presented as mean ± SEM, with viable cells expressed as a percentage of the total cell population.
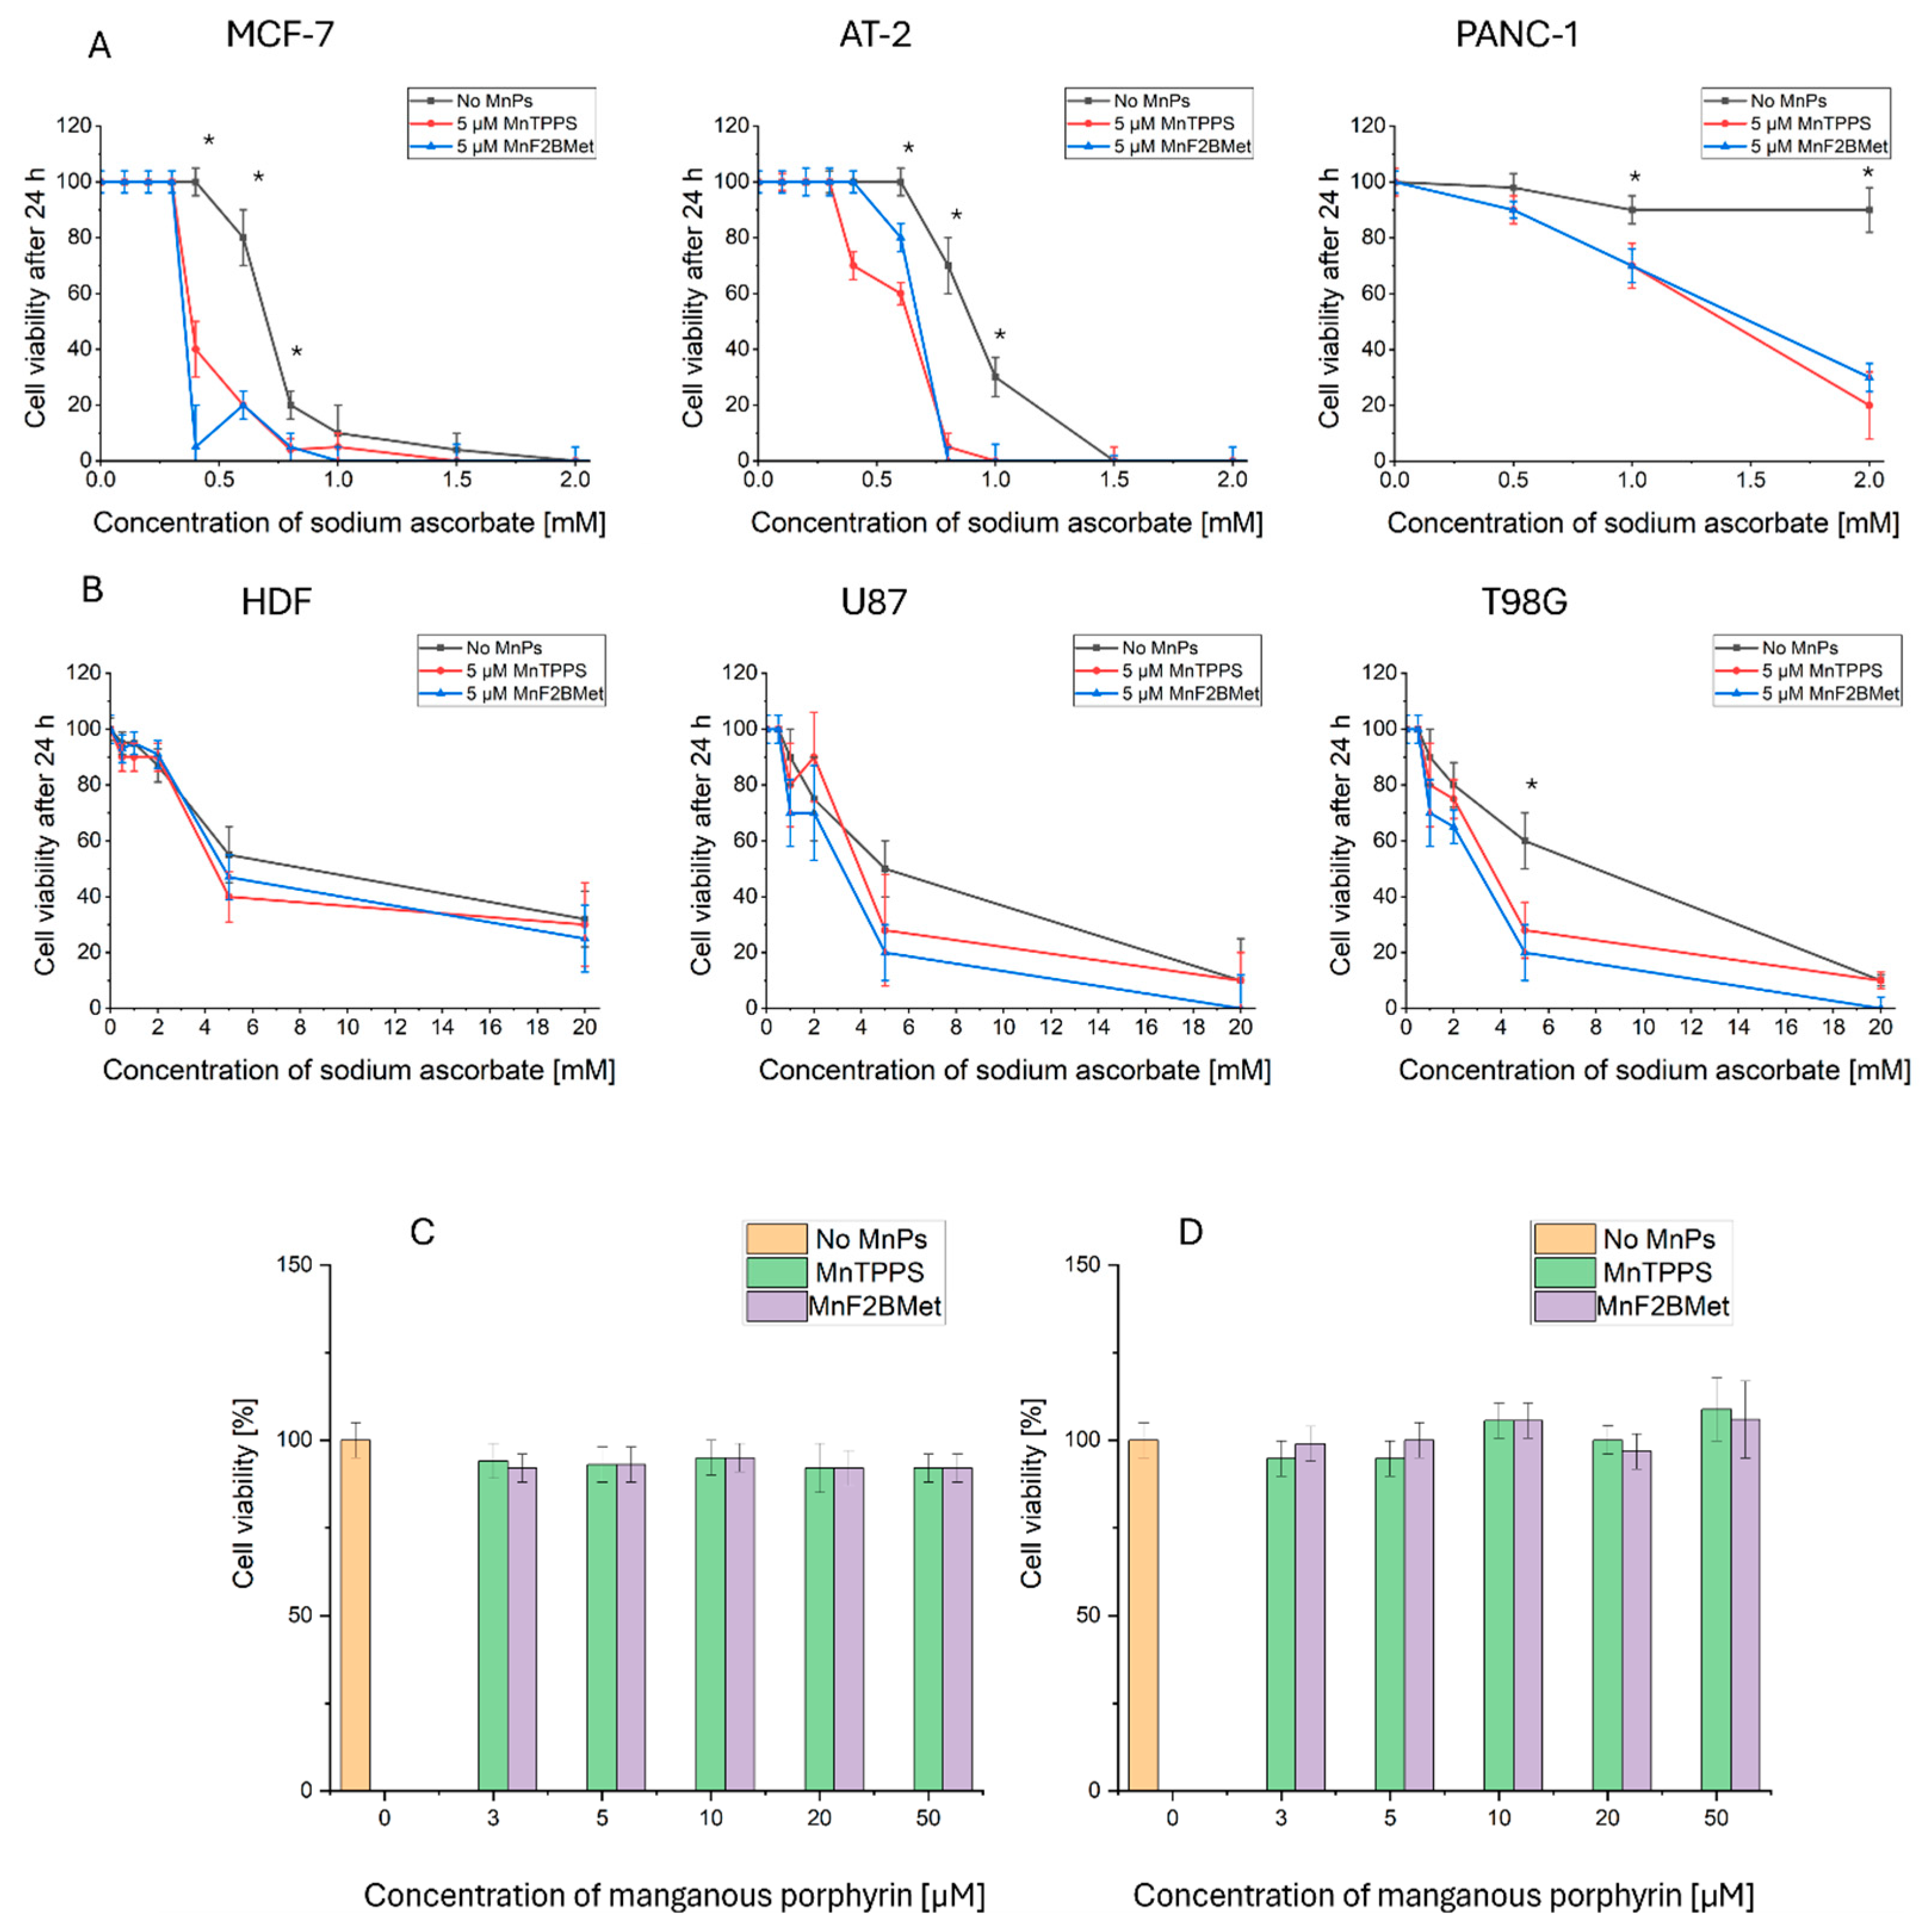
Figure 3.
(A) Viability of MCF-7 cells, assessed using the trypan blue exclusion assay, following treatment with MnTPPS (5, 20 or 50 μM) or MnF2BMet (5, 20 or 50 μM) for 24 hours. Data represent mean ± SEM of viable cells as a percentage of total cells n = 3. (B) Cell count measured 96 hours after treatment with 0.5 or 1 mM ASC, in the presence of either 5 or 20 μM MnTPPS or MnF2BMet. Data represent mean ± SEM, n = 3, * p < 0.05. (C) Cell migration rate of ASC-treated MCF-7 cells, assessed after ASC exposure. Data represent mean ± SEM of analyzed cells, n = 60, (p < 0.05). (D) Cell movement trajectories, determined over an 8-hour time-lapse experiment. (E) Cell morphology, visualized after the treatment with 0.5 mM ASC for 6 hours, with or without preloading with 5 μM MnTPPS. Red – F-actin, Blue – DNA.
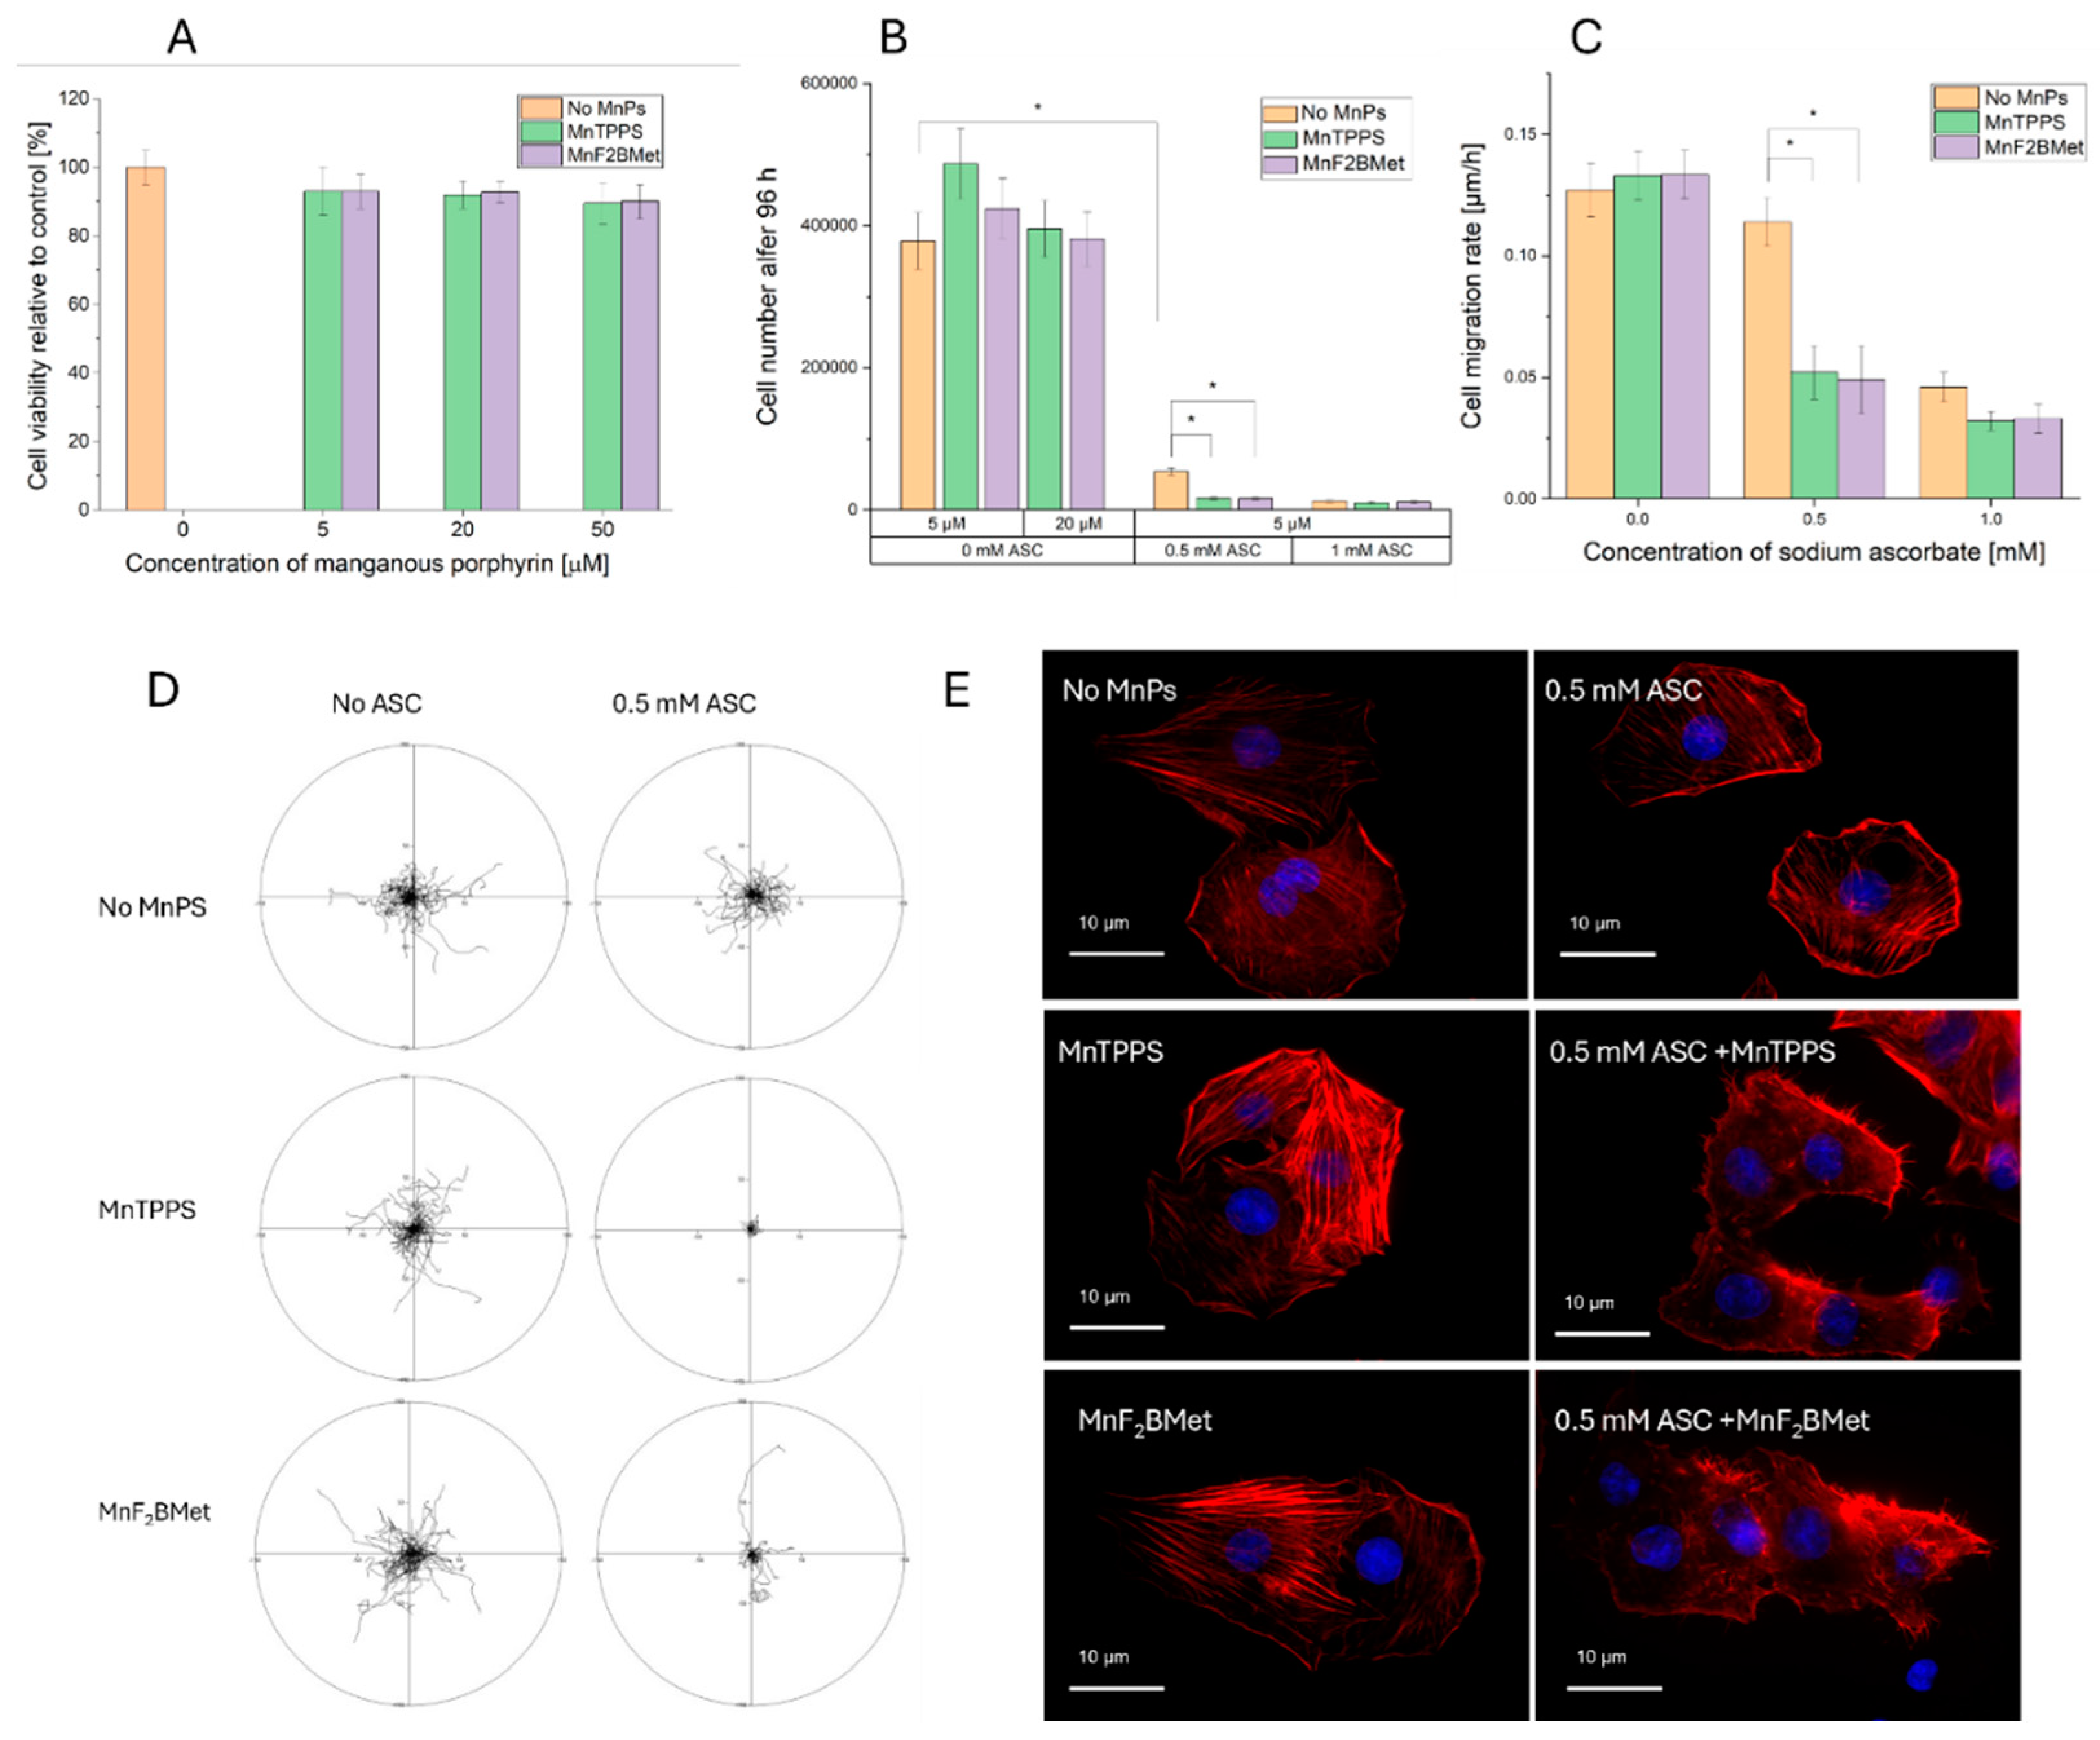
Figure 4.
Time-dependent propidium iodide (PI) uptake following ASC administration. PI uptake was monitored as an indicator of loss of membrane integrity in MCF-7 cells preloaded with 5 µM MnTPPS or 5 µM MnF2BMet and subsequently treated with 0.5 mM ASC (A) or 1 mM ASC (B). In the absence of MnPs, PI uptake was detected 4 hours post-treatment with 1 mM ASC. However, the presence of manganese porphyrins significantly accelerated this process, leading to detectable PI uptake within 2.5 hours after ASC administration. Decrease of fluorescence intensity after about 6 h of imaging is related to cell detachment. Microscopic images of MCF-7 cells captured at 1, 3, and 5 hours after treatment with 0.5 mM ASC (C) or 1 mM ASC (D) illustrate the progressive loss of membrane integrity. Images are composites of integrated modulation contrast (IMC) microscopy and the red fluorescence channel, highlighting PI-positive cells undergoing membrane permeabilization.
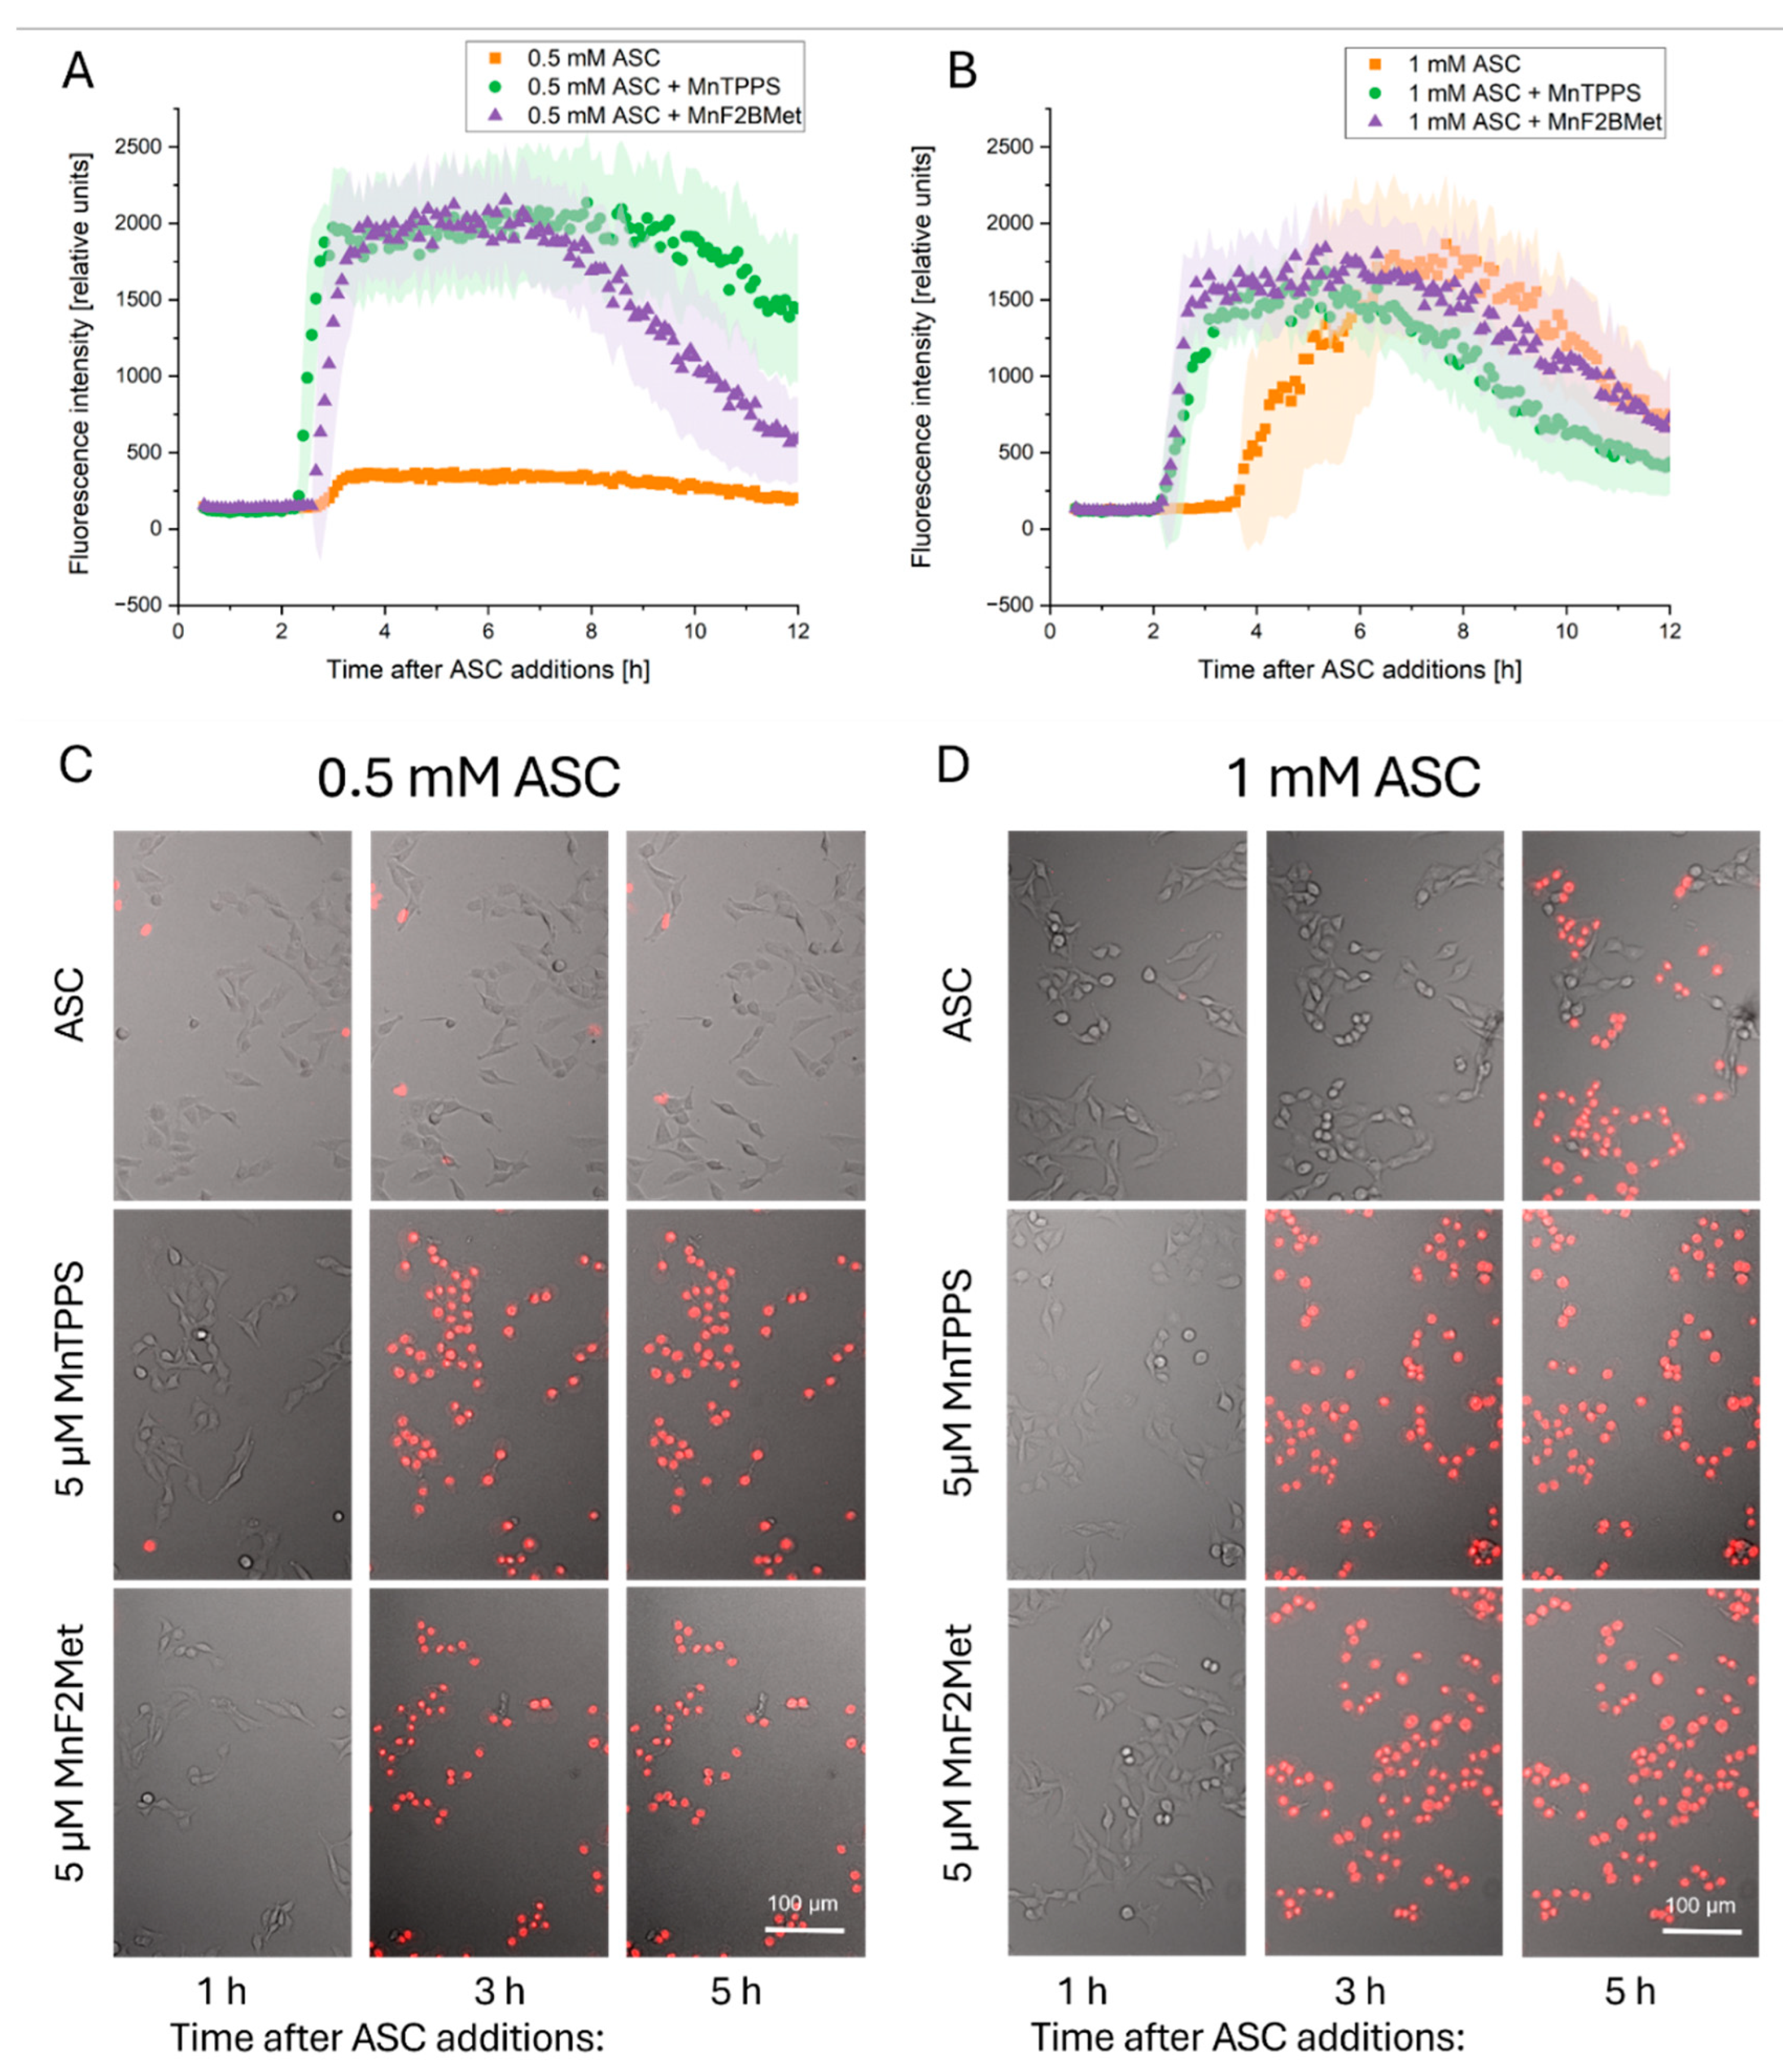
Figure 5.
Manganese porphyrins combined with ASC induce oxidative cellular damage. (A) Lipid peroxidation in MCF-7 cells, assessed 2 hours after ASC administration using the Image-iT™ Lipid Peroxidation Kit. (B) Representative fluorescence images show merged channels (red – no peroxidation, green - peroxidase lipid) with arrows indicating morphological changes associated with oxidative stress. (C) Intracellular glutathione (GSH) levels, measured 2 hours after exposure to 0.5 mM ASC in MCF-7 cells preloaded with 5 µM MnTPPS or 5 µM MnF2BMet, using ThiolTracker™ Violet assay and fluorescence microscopy. (D) Mitochondrial membrane potential, assessed using the JC-1 assay. MCF-7 cell loaded with 5 µM MnF2BMet and treated 0.5 mM ASC. (E) Representative fluorescence images highlight mitochondrial morphology alterations, with arrows indicating regions of structural disruption (red - High potential of mitochondrial membrane, green - low potential of mitochondrial membrane). Data represent mean ± SEM (n = 50, *p < 0.05).
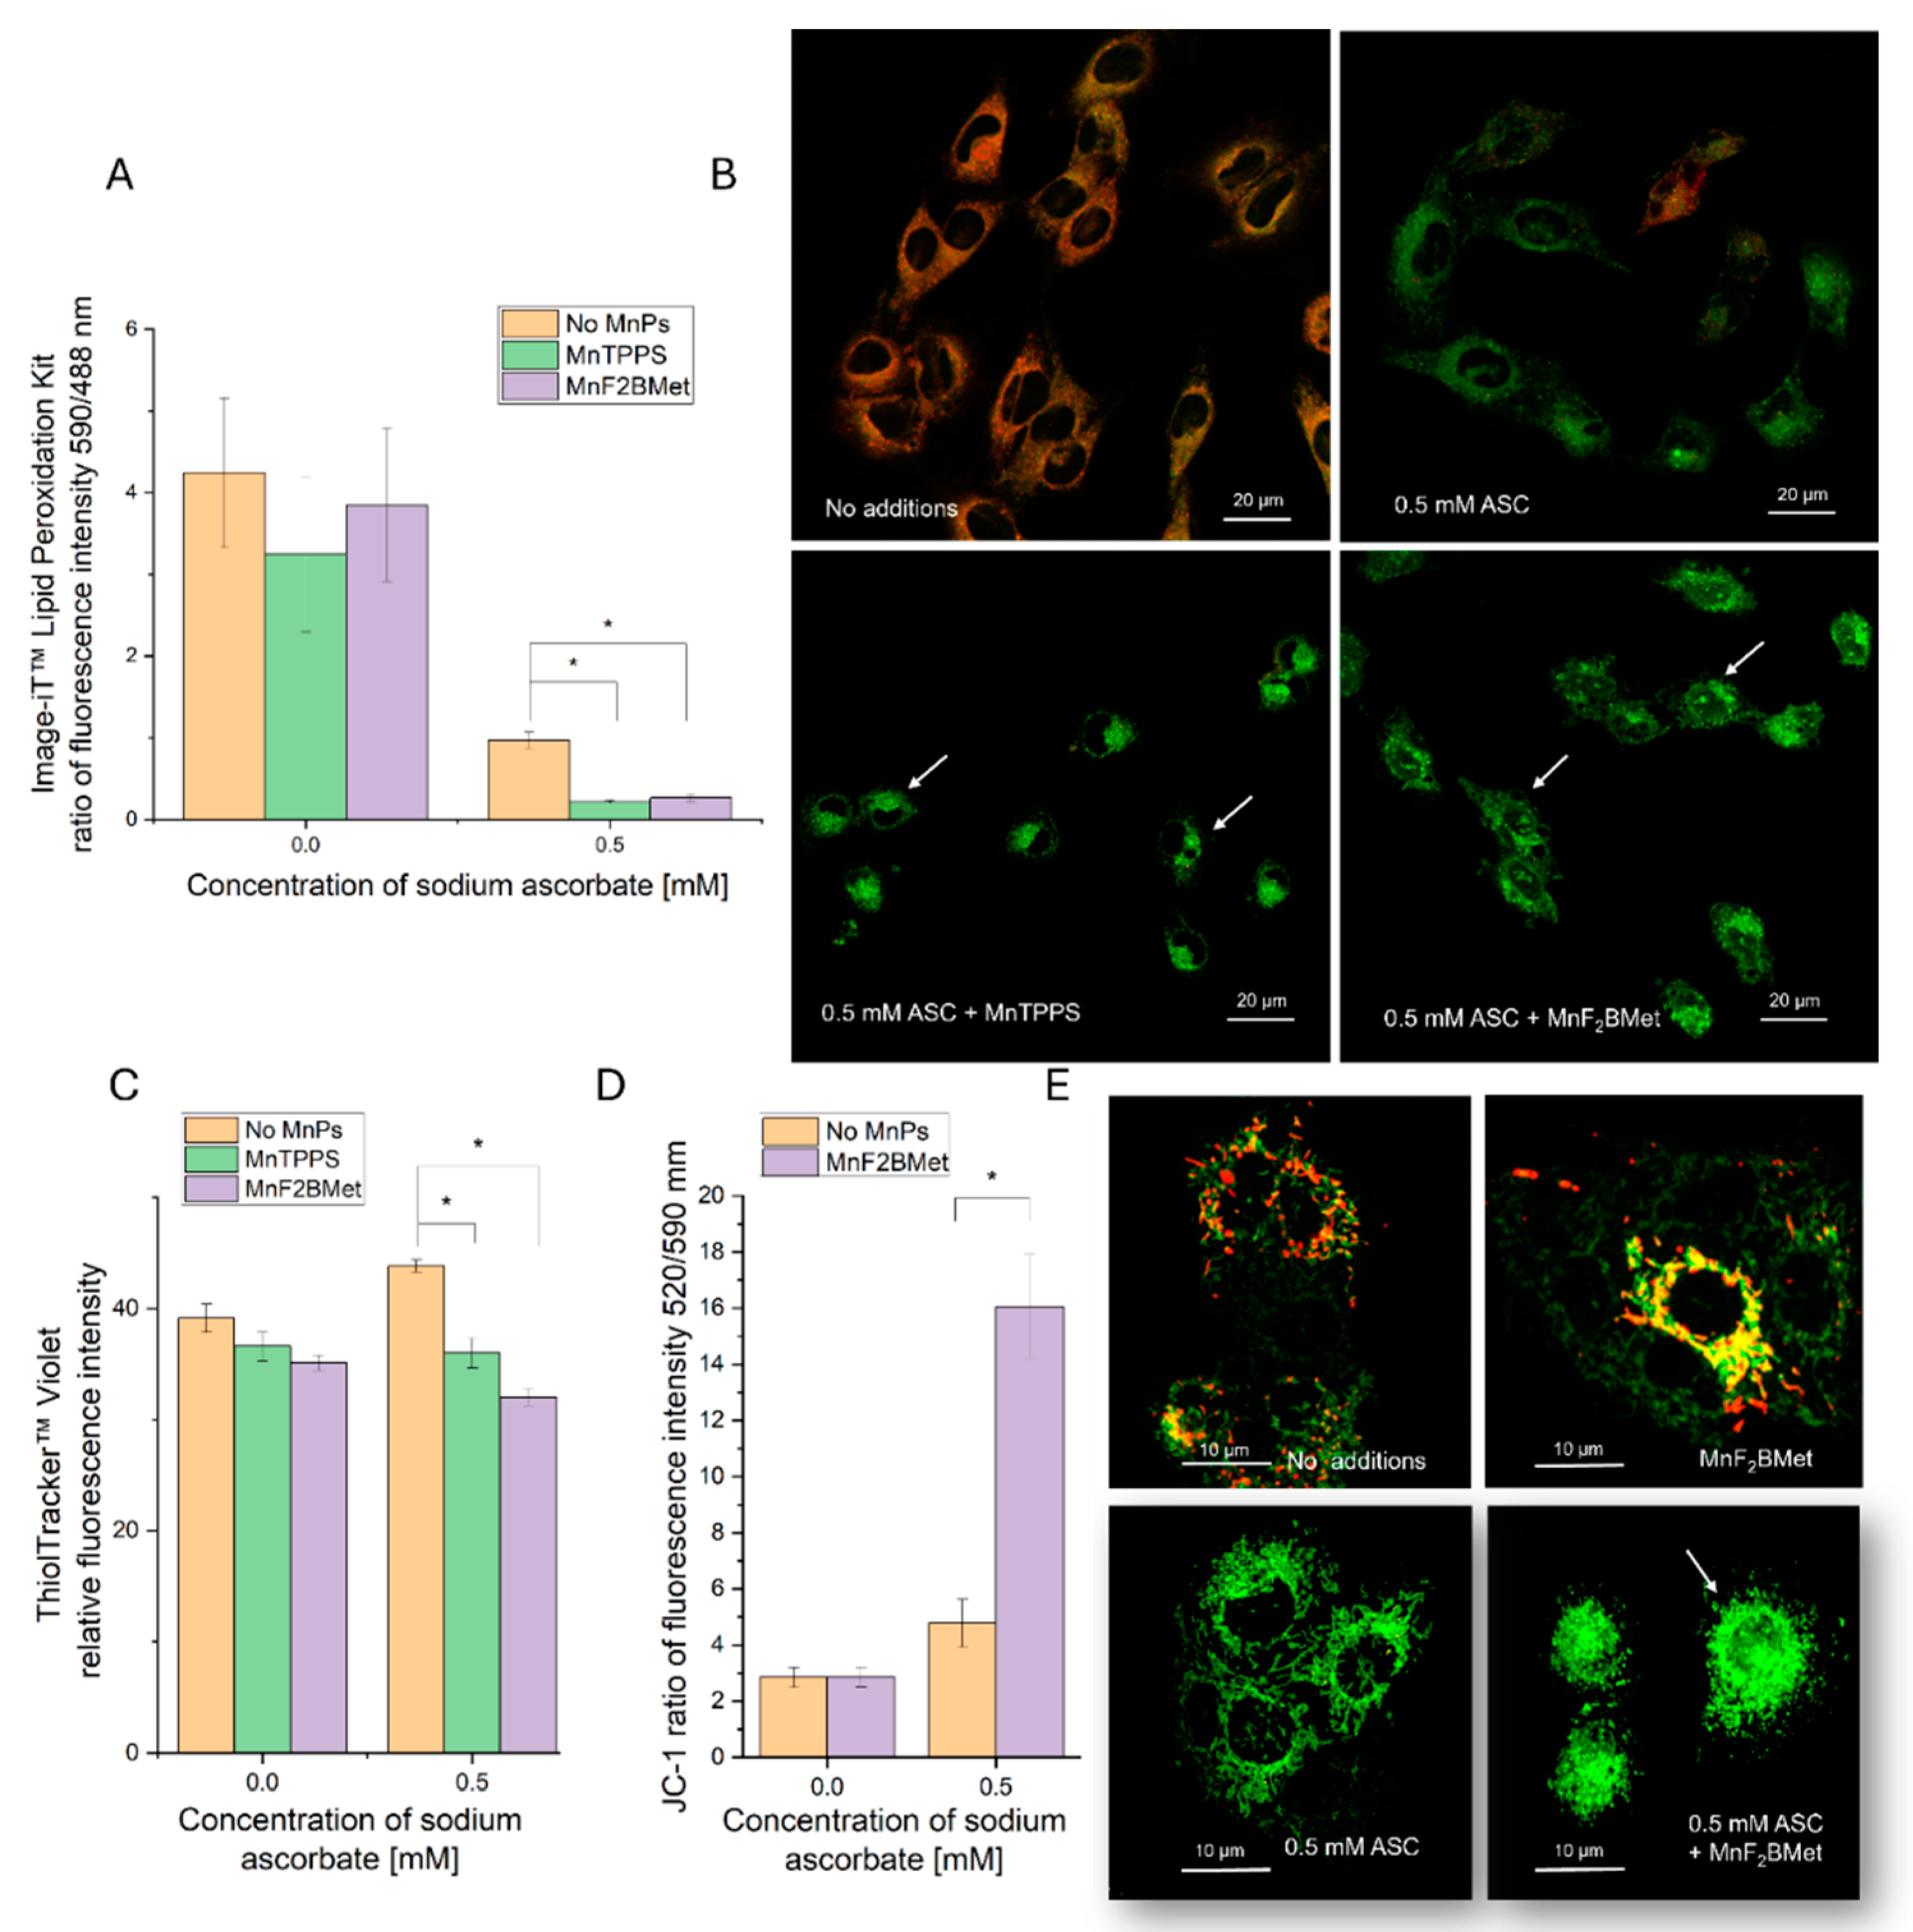
Figure 6.
Detection of intracellular hydrogen peroxide (H2O2) using the HyPer7 biosensor. (A) MCF-7 cells preloaded with 5 µM MnF2BMet were illuminated every 30 seconds with 405 nm and 488 nm lasers over the course of a 6-minute experiment to establish a baseline fluorescence level and confirm that MnF2BMet does not generate intracellular H2O2 upon light exposure. ASC was added after 90 seconds. In the absence of MnPs, the addition of 0.1 mM ASC caused a rapid increase in H2O2 levels, followed by a gradual decline in fluorescence intensity. In contrast, when 0.1 mM ASC was added to cells preloaded with 5 µM MnF2BMet, the increase in H2O2 levels was slower but reached a maximum, that was 2.5 times higher than in ASC-treated cells without MnPs. Data represent mean ± SEM, n = 30. (B) Fluorescence microscopy images of MCF-7 cells captured at 1, 2, and 5 minutes live cell imaging, either in the presence of 5 µM MnF2BMet or in MnPs-free control cells. ASC was introduced between the 1st and 2nd minute of live-cell imaging. The images represent ratiometric data, with the fluorescence signal excited at 488 nm divided by the signal excited at 405 nm. The pseudocolor scale reflects ratio fluorescence.
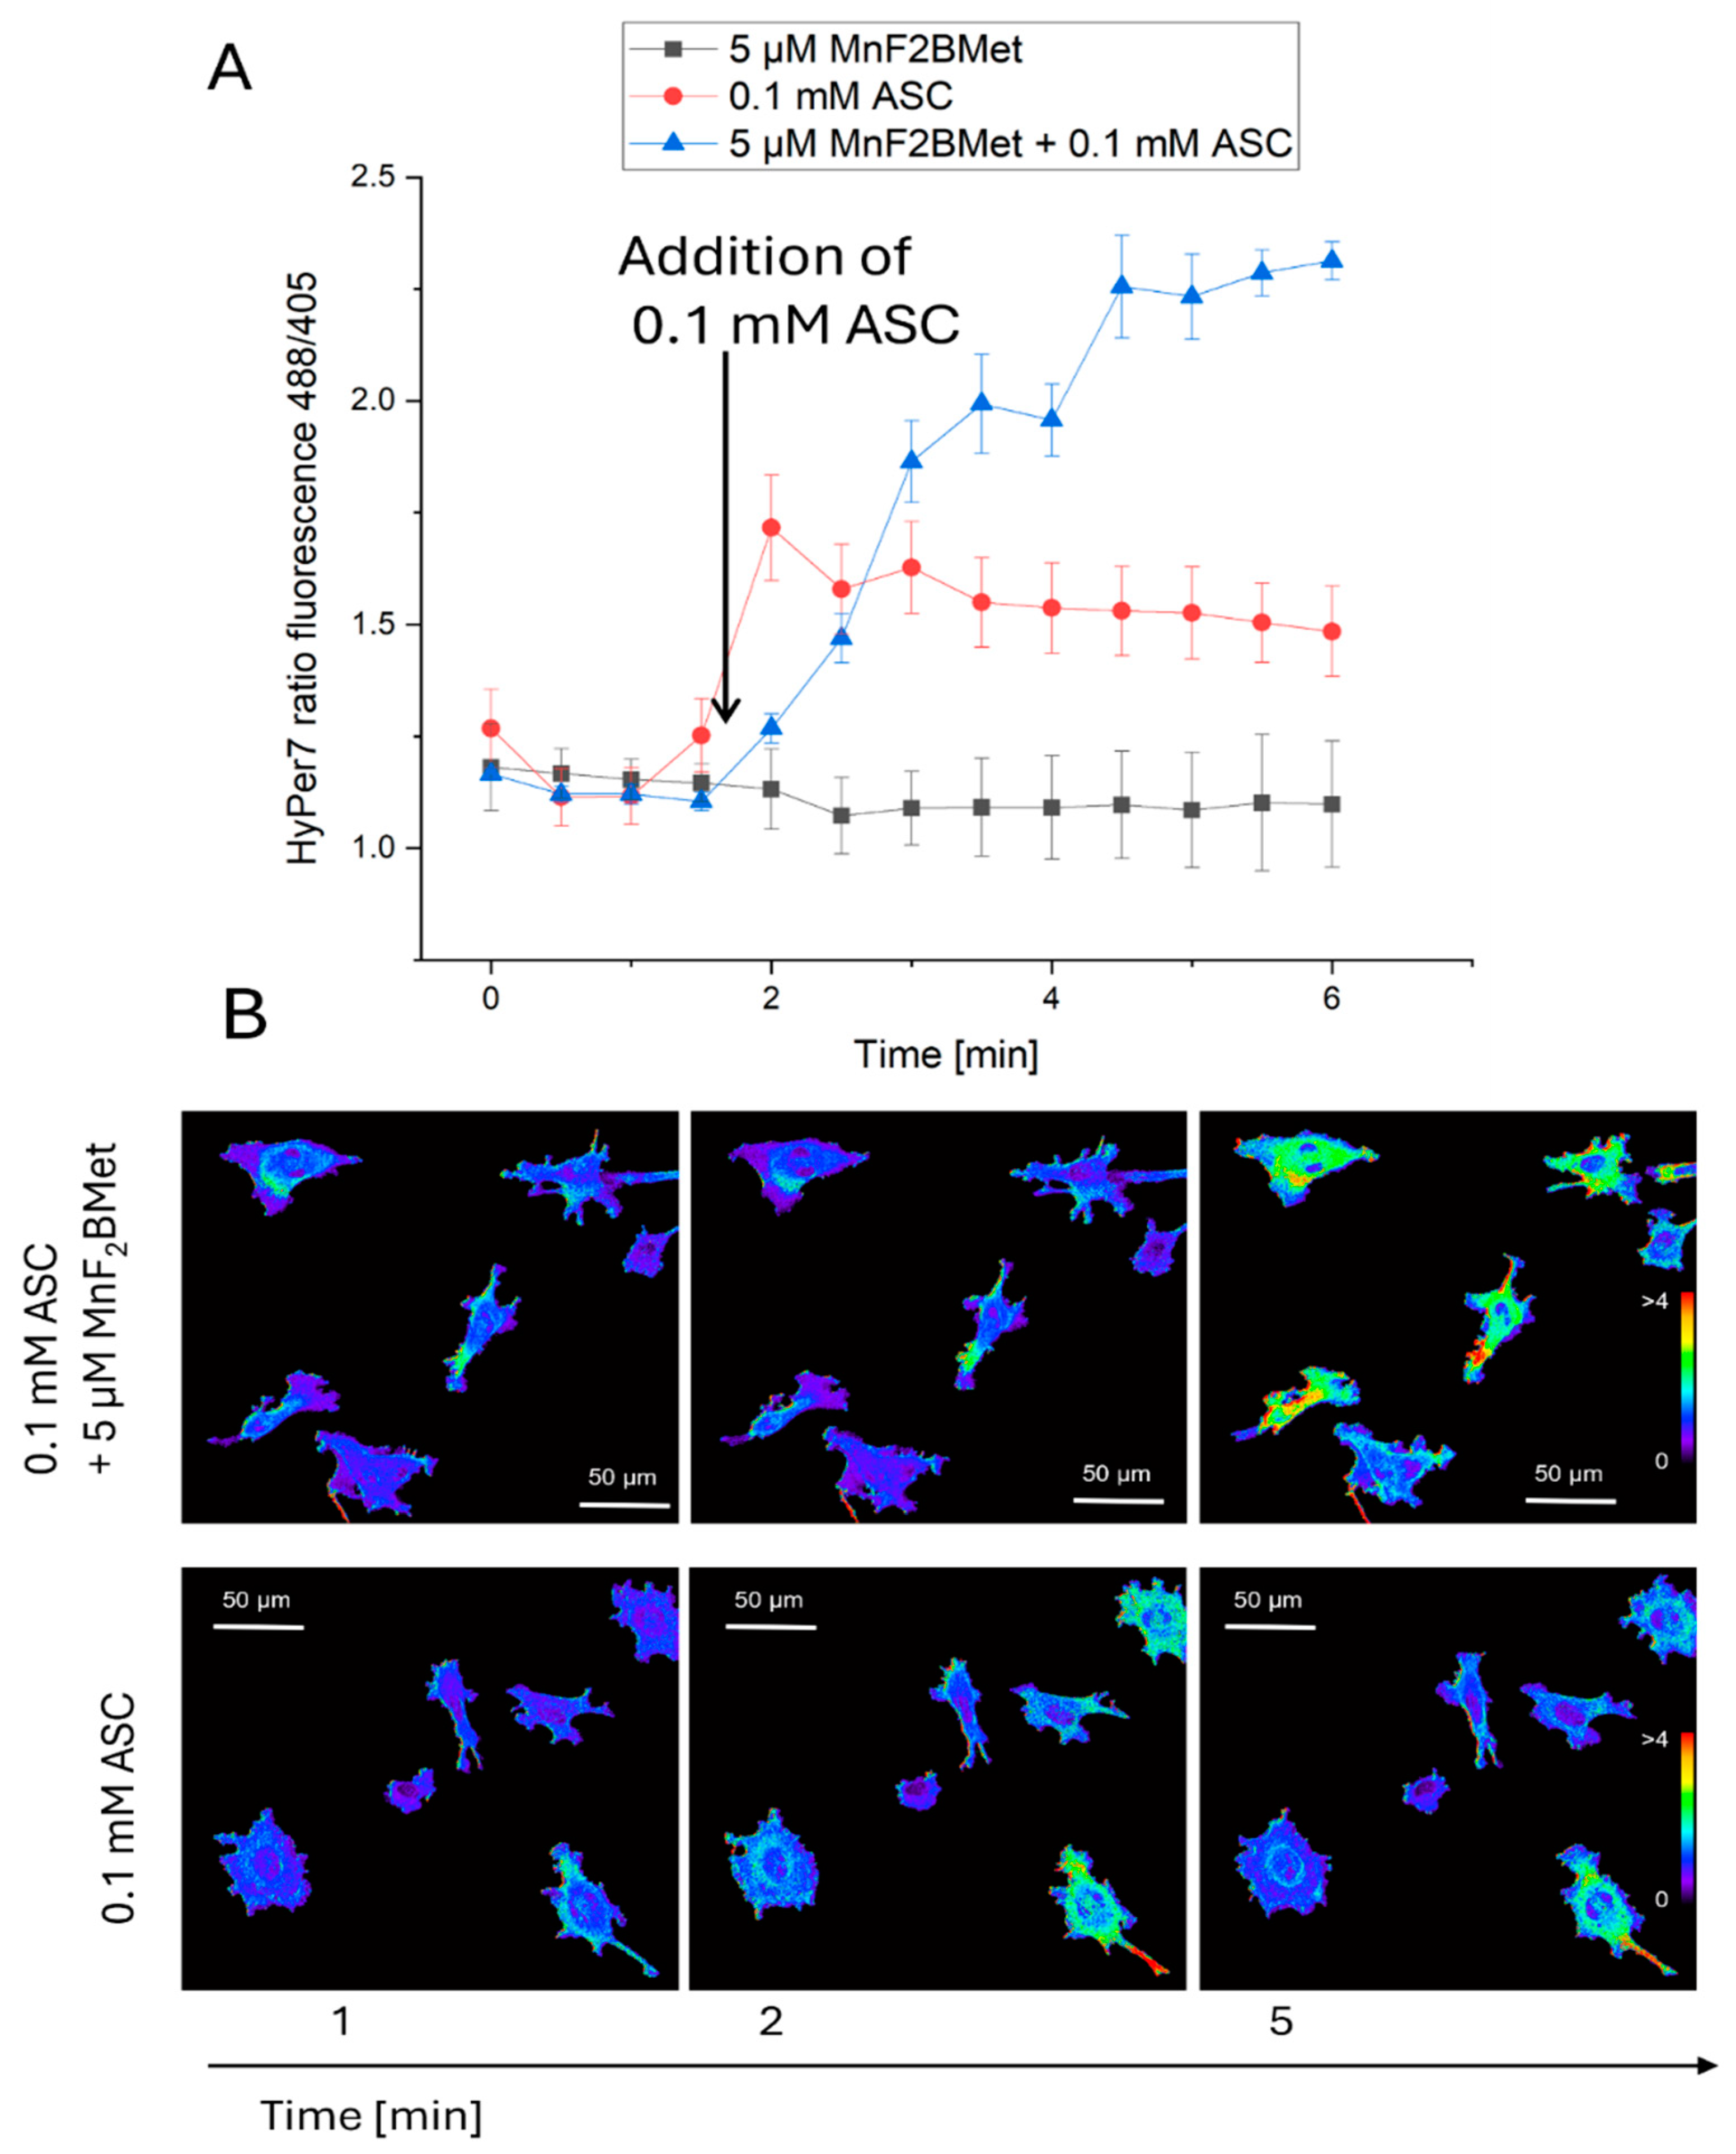
Figure 7.
MCF-7 cell viability following MnPs-ASC treatment and the effect of extracellular catalase. Viability of MCF-7 cells was assessed using the trypan blue exclusion assay after 24 hours of treatment with 5 µM MnTPPS or 5 µM MnF2BMet in the presence of ASC (0.6, 1, and 2 mM). Data are expressed as mean ± SEM, (*p < 0.05) with viable cells presented as a percentage of the total cell population.
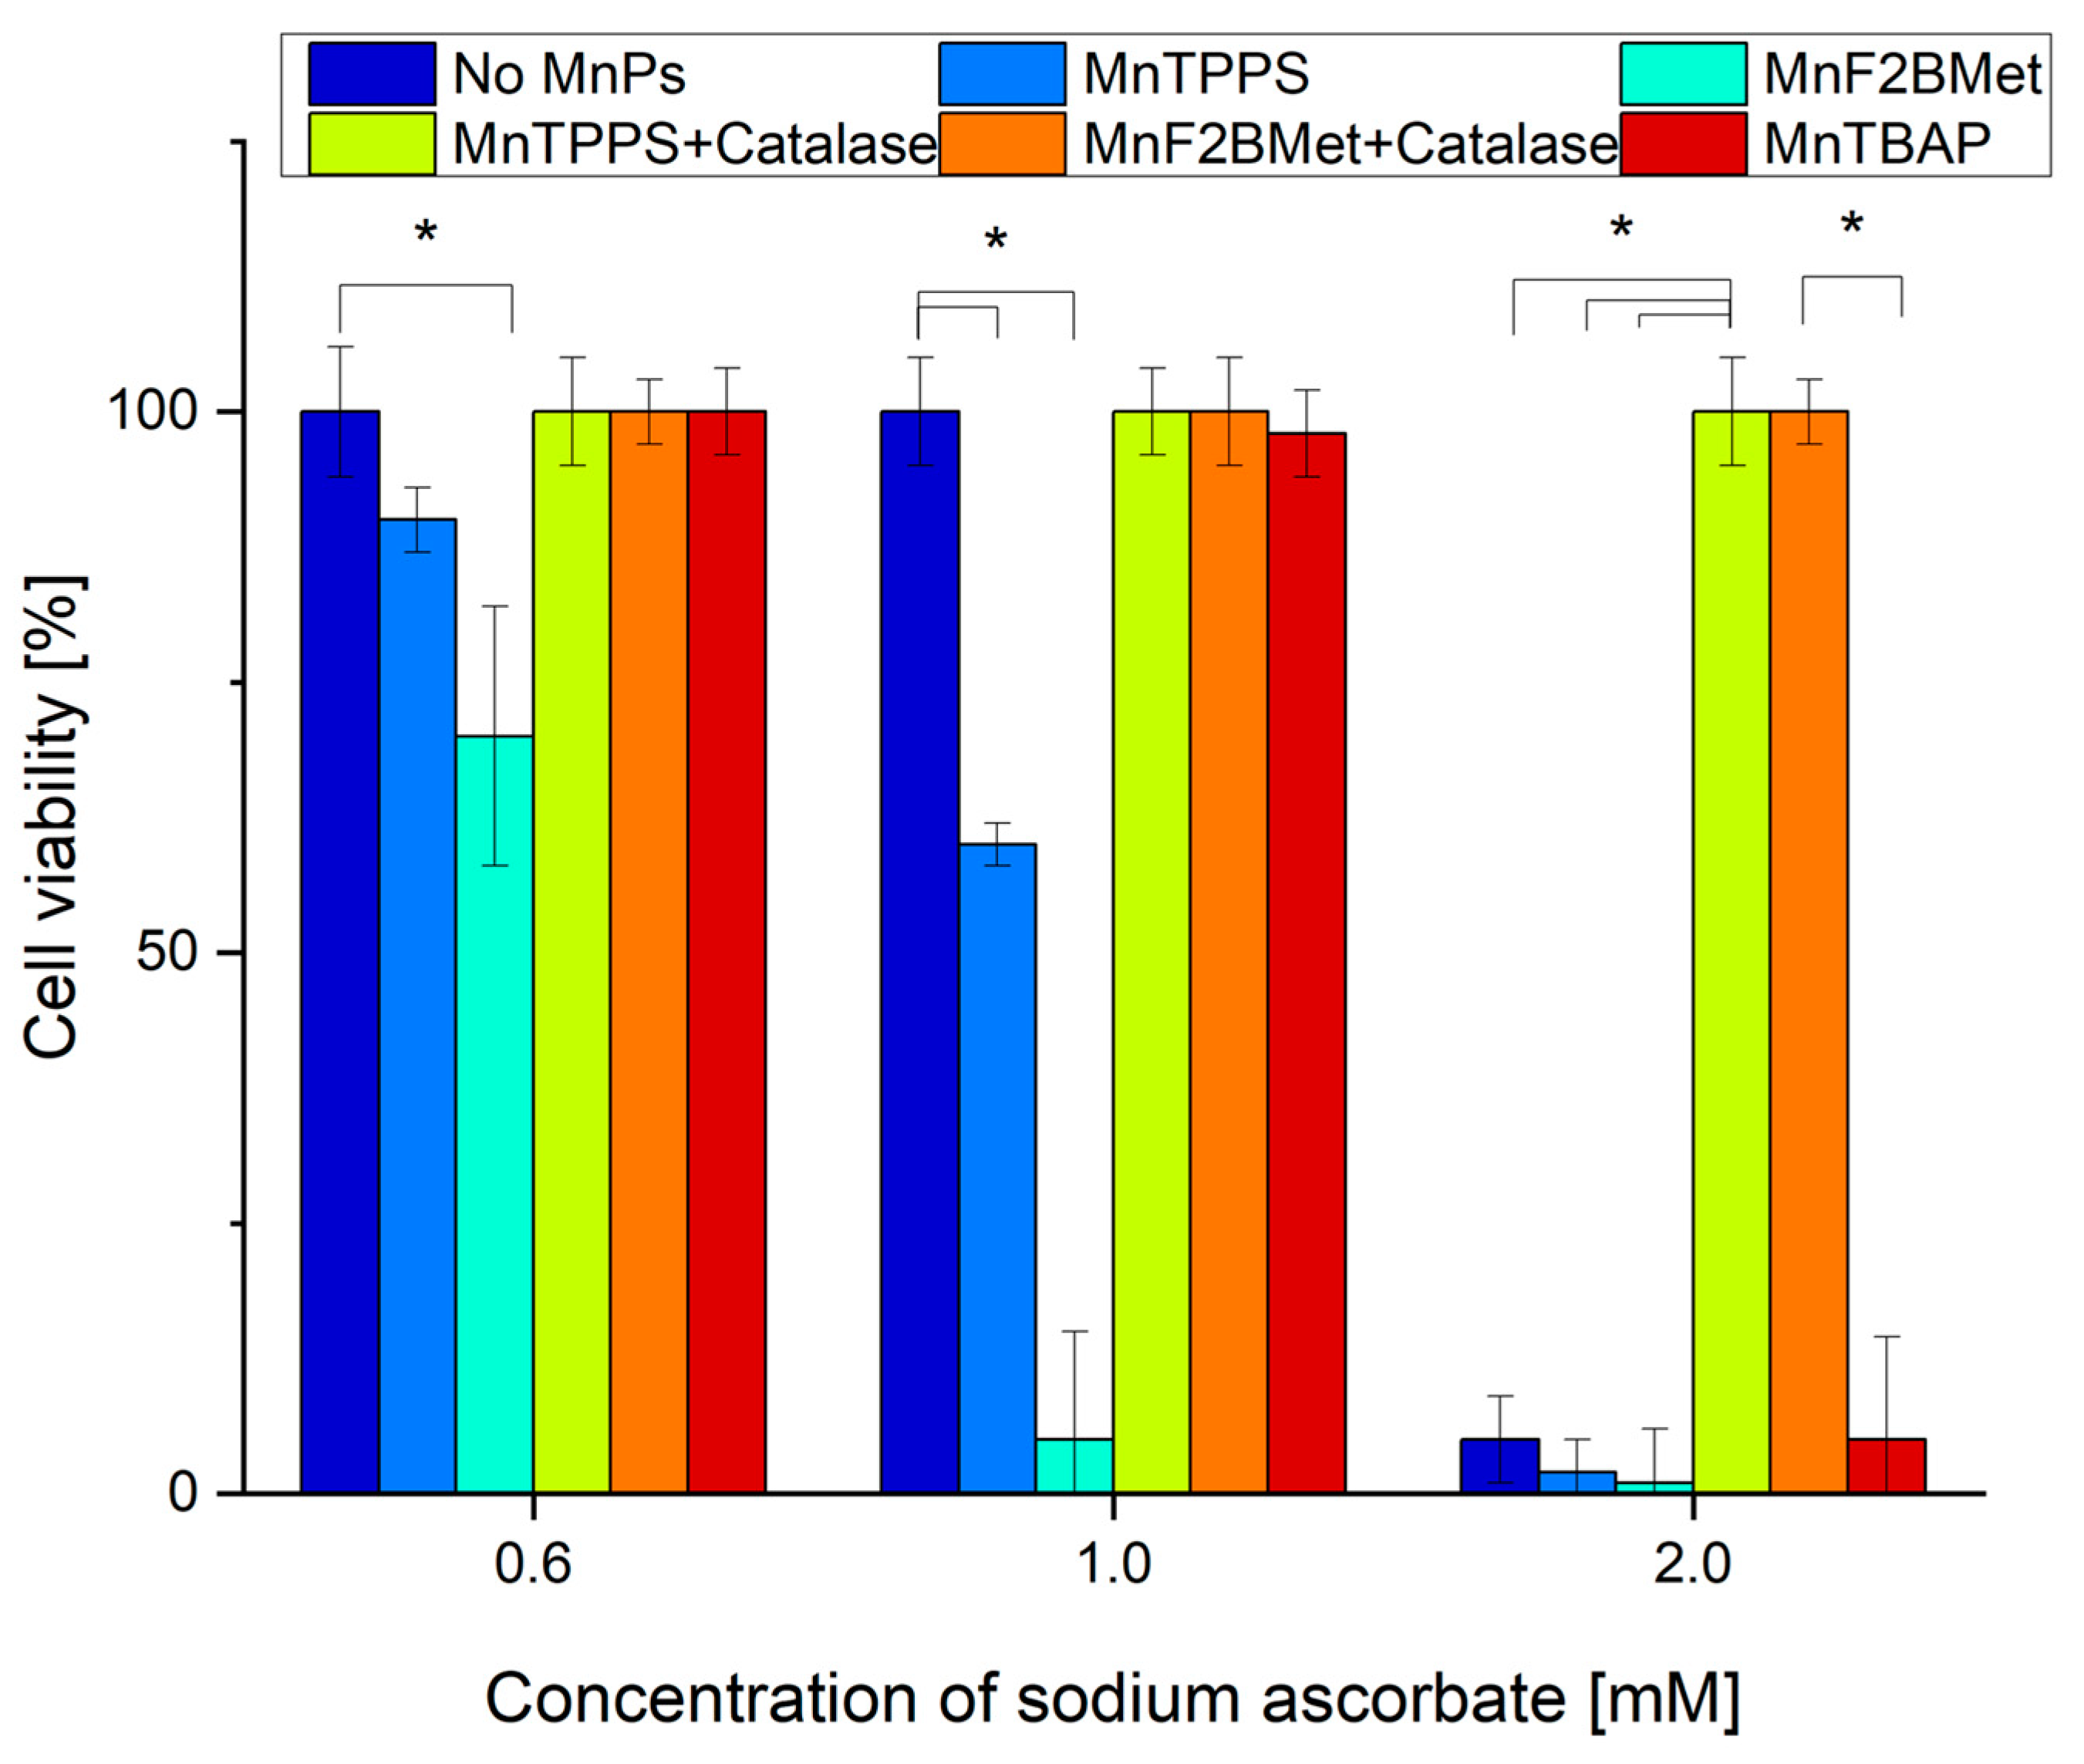
Figure 8.
Dehydroascorbic acid (DHA) enhances intracellular ASC levels but exhibits limited cytotoxicity in MCF-7 cells. (A) Intracellular ASC levels following the administration of 0.5 or 2 mM ASC or 0.5 or 2 mM DHA in MCF-7 cells. While 0.5 and 2 mM ASC resulted in a similar increase in intracellular ASC levels, 0.5 mM DHA was less effective in delivering ASC to cancer cells compared to its reduced form. The most efficient method for increasing intracellular ASC levels was the administration of 2 mM DHA, indicating a concentration-dependent effect. (B) Cytotoxic effects of ASC and DHA on MCF-7 cells. Unlike ASC, DHA alone did not exhibit cytotoxic properties in MCF-7 cells. However, the presence of 5 µM MnF2BMet led to a moderate decrease in cell viability (~80%) after 24 hours of DHA treatment. In contrast, under the same conditions, ASC treatment alone and ASC combined with 5 µM MnF2BMet resulted in a significant reduction in cell viability, further supporting the role of ASC in MnPs-induced cytotoxicity.
Disclaimer/Publisher’s Note: The statements, opinions and data contained in all publications are solely those of the individual author(s) and contributor(s) and not of MDPI and/or the editor(s). MDPI and/or the editor(s) disclaim responsibility for any injury to people or property resulting from any ideas, methods, instructions or products referred to in the content. |
© 2025 by the authors. Licensee MDPI, Basel, Switzerland. This article is an open access article distributed under the terms and conditions of the Creative Commons Attribution (CC BY) license (http://creativecommons.org/licenses/by/4.0/).
Copyright: This open access article is published under a Creative Commons CC BY 4.0 license, which permit the free download, distribution, and reuse, provided that the author and preprint are cited in any reuse.


