

Submitted:
30 October 2025
Posted:
31 October 2025
You are already at the latest version
Abstract
Weapply numerical analysis to interpret reported simulations of polymer blend melts, in particular simulational determinations of mean-square displacements g(t) of polymer beads and polymer centers of mass. Our interest is a quantitative comparison of g(t) with theoretical models that predict g(t). Manymodels predict that g(t) can be described as a sequence of power-law regimes g(t) ∼ tα. In each regime, α has a model-predicted value. We find that these models are not consistent with simulations of blend melts. Instead, g(t) generally has a single power-law regime (and, when those times are reached) a long-time diffusive (α ≈ 1) regime. Outside these two regions, if one writes g(t) ∼ tα, then α is a smoothly-changing function of time.
Keywords:
polymer dynamics
; mean-square displacement
; polymer melt
; polymer solution
; computer simulation
; scaling behavior
; polymer blend
; scaling exponents
; power-law behavior
1. Introduction
This paper extends our prior reviews of the phenomenology of polymeric fluid dynamics. Our volume Phenomenology of Polymer Solution Dynamics [2] examined the concentration, molecular weight, and time dependences of polymer solution properties, including centrifugation, electrophoresis, polarized and depolarized light scattering spectroscopy, solvent diffusion, segmental relaxation, dielectric relaxation, mutual diffusion, probe diffusion, viscosity, viscoelasticity, and non-linear viscoelastic behavior, and the same properties as shown by solutions of spherical colloids. Comparison of experiments on polymer solutions with familiar theoretical models found that hydrodynamic scaling forms for the self-diffusion coefficient D as a function of polymer concentration c and molecular weight M[3], viz., , worked well, but reptation-scaling forms[4,5], viz., , are almost entirely inconsistent with experiment. The other solution transport coefficients that we studied show the same behavior, namely that they are consistent with the hydrodynamic scaling model and not the reptation-scaling model.
When we presented our solution dynamics results, we were challenged to discuss whether our results also applied to melts, but were not then prepared to do so. This paper is part of a series responding to that challenge. There are several alternative pathways to examining the melt question. We have elected to consider the phenomenology of computer simulations. This choice has both advantages and disadvantages. On the positive side, computer simulations give exact control over the polymer molecular weight and chain topology. Computer simulations allow one to measure correlation functions that are not readily accessible to experiment, for example the amplitudes and time correlation functions of individual Rouse modes. On the negative side, hardware limitations make it difficult to study high-molecular-weight polymers, because the required computation times become inaccessibly large.
There is an extended literature on simulations of polymer melts. Melt dynamic properties that have been studied would certainly include determinations of the stress modulus [6], the nonlinear viscosity [6], segmental and whole-chain orientation vector autocorrelation functions[7,8,9,10], self- (single-chain) and cross- (two chain) correlation functions of the orientation tensor[11,12], the coherent scattering function [13], the incoherent scattering function [13,14,15], the torsional autocorrelation function [8], segmental escape from a hypothesized tube[16], and the storage and loss moduli and [16].
We have already reviewed properties of simulated Rouse modes[17]. Of course, Rouse’s predictions[18] refer to an isolated bead-spring polymer in highly dilute solution, not to a polymer in a melt, but there are theoretical models[4,5] that invoke the Rouse model to describe polymer motions in melts on some time and distance scales, so examination of Rouse mode behavior in melts is appropriate. In an extended review[17], we demonstrated that Rouse-model predictions for Rouse mode amplitudes and their time correlation functions are generally incorrect for simulations of polymer melts. We concluded that polymer motions in the melt are not described by the Rouse model.
We then reviewed the time dependence of mean-square displacements of polymer beads and polymer centers of mass in simulated melts of monodisperse linear polymers[19,20]. There are theoretical models that predict that the time dependence of is described as a series of power laws . These models appear to be correct in two limits: At very early times, corresponds to the ballistic motion predicted by Newton’s Laws of motion. At very late times, corresponds to the simple diffusion predicted by Doob’s Theorem[21]. Outside these two limits, we found that power-law behavior is generally not present. In most cases, does not follow a series of power laws separated by transition regimes. Because this result was not anticipated, we made a point of surveying a large number of simulational studies, thus avoiding the suggestion that we had accidentally selected a few special cases in which power-law behavior is not encountered.
In this paper, we consider linear polymers in simulated bidisperse melts. we limit ourselves toa narrow range of dynamic properties, namely the mean-square bead displacement functions and , and the mean-square center-of-mass displacement function . Rather than extending the paper indefinitely, we paused after considering four representative sets of results. To examine simulations of short polymers, we considered a study by Sacristan, et al.,[22]. To examine lightly entangled polymers, polymers with , we treat simulations by Kopf, et al.,[23]. Here N is the chain length and is a nominal entanglement length. Results due to Adeyemi, et al., include a long polymer with [25], while results of Wang and Larson[24] extend out to chains having . It would of course be desirable to include simulations on still-longer polymers when these become available. A further review examining of non-linear polymers, notably branched polymers and rings, is in preparation.
The remainder of this paper has three sections. The next Section presents definitions and our quantitative method for analyzing to determine its time dependence. A further Section applies our quantitative method to representative results from the simulation literature. A final Section presents our conclusions. The verisimilitude of our analysis arises from the graphical presentations of our numerical analyses, so Supplemental Figures present each of our plots at full scale.
2. Definitions and Methods
We first give a few definitions and note what familiar models say about them. We then describe our approach to a numerical analysis of the . We have previously presented tests of our method against representative data.[19].
Tube models[4,5] for polymer dynamics make a series of predictions of chain mean-square displacements, including motions of individual beads and motions of the chain center of mass. The mean-square displacement functions are the , where , the being defined in terms of polymer bead positions . Here i labels each of the N beads of a single polymer chain, while the chain center of mass is denoted . The average includes averages over all chains and over all values of the initial time .
The single-bead mean-square displacement over a time interval t is
Here and are times. The sum may be over the positions of all N beads of a chain, or over the positions of a subgroup of n beads in a longer chain.
The mean-square motion of the beads relative to the chain center-of-mass is
The corresponding center-of-mass mean-square displacement is
For linear chains, tube-reptation models predict the time dependences of these mean-square displacements, the predictions having the form of a series of power laws . The exponent depends on the polymer chain length and the time scale under consideration. According to the tube model, the relevant time scales are separated by a segmental relaxation time , an entanglement time , a Rouse time , and a disentanglement time . Within the tube model, is an average time at which a diffusing polymer encounters a wall of the hypothesized tube. is the relaxation time of the longest-lived Rouse mode[18]. is the time at which, on the average, a polymer has diffused through its radius of gyration and therefore is said to have escaped from its tube.
For melts of chains sufficiently short that, within the ansatz of the tube model, the chains are unentangled, the tube model predicts for short times that chain motions are described by the relaxation of pure Rouse modes, while at long times chain motions are described by simple Brownian diffusion, leading to
and
at all times.
For linear chains long enough that, according to the tube model, the chains entangle, the model predicts for that
For long linear chains, the tube model predicts for that
These predictions were originally made for monodisperse melts. However, changing the molecular weight of the matrix polymers, relative to the molecular weight of the polymer of interest, changes the importance of various mechanisms for relaxing the chain of interest or the tube, but leaves the qualitative model intact.
The regime for of long chains during is sometimes said to demonstrate that the tube model is correct. However, Puetz, et al.[26] note that the Schweizer mode-coupling model[27,28] predicts a time dependence in this regime, even though Schweizer’s description of bead motion is entirely different from the tube model.
How do we test for power-law behavior and extract values for exponents? In this paper, we represent as a generalized power law
Here is a constant prefactor and is the time-dependent instantaneous exponent at time t. Our interest is in finding the time dependence of . We previously demonstrated[19] how to do this.
Our method, described below, should be contrasted – no criticism is here intended – with many literature studies in which was assumed to have extended regions in which follows a power law in time, i.e., extended regions within which is constant. Those regions were assumed to be separated by crossovers. However, regimes in which is a constant were the primary focus of these studies, because in those regimes there were theoretical predictions of . In some earlier studies, log-log plots of against t were to be compared with lines drawn to guide the eye, the lines being placed so that they did not overlay the data. In other studies, linear fits were made of a section of to a form , with fixed in advance or used as a fitting parameter. In all these cases, simple power-law behavior of was assumed. Note, however, a paper by Nahali and Rosa[29], who obtained from determinations of a time-dependent series of values of , using a method for determining that is apparently not the same as ours.
Our first objective is to test whether power-law behavior is actually present. Determinations of power-law exponents must wait until the presence of power-law behavior is established. Our approach is to take published simulations of , and extract from them the logarithmic derivative , which is the local value of in .
Slight caution is needed in extracting the from the literature. While many authors simply computed the from the record of the bead positions, a few authors first calculated the incoherent scattering function as
where here the sum is over all scatterers, is a scattering vector, and denotes an average. They then applied a supposed Gaussian approximation
to extract from a mean-square displacement . However, if the Gaussian approximation is correct as arising from assumed uncorrelated forces on each polymer chain, then Doob’s Theorem guarantees that increases linearly in time and necessarily has a simple exponential form. If, on the other hand, as is almost always the case, is not a simple exponential, then eq. 18 is inapplicable to the problem, and any nominally extracted from via equation 18 will be incorrect, in some cases by an order of magnitude or more. See ref. [30] for an extended analysis of errors arising from invoking the Gaussian approximation when it does not apply.
Our approach to extracting an exponent begins with a plot of against . As an approximation, we fit to a smooth curve
where the are coefficients obtained from a linear-least-mean-squares fit of equation 19 to the measured , and where is a truncation limit. As we previously demonstrated[19], with modest values for equation 19 – which may be recognized as a Taylor series expansion in – accommodates well both to regions where is linear in and to regions where the slope of depends non-trivially on t. The instantaneous value of follows from equation 19 via
For the we recovered from the literature, fits with in the range 6-8 almost always gave curves that agreed with the reported . We display our results graphically, comparing reported measurements of to our fitted curve and to the corresponding values for .
There are two practical restrictions. First, the curves generated from equation 19 are interpolants, not extrapolants. Extrapolating a fitted curve to times outside the range over which is reported may give unphysical results. A representative example appears below. Second, the fitting process is sensitive to statistical noise near the end points of the measured . At an end point, the fit is somewhat free to change its slope to accommodate a final few points that, due to statistical fluctuations, are too high or too low, without the change in slope creating excessive root-mean-square error from hypothetical times beyond the end points.
The simulations considered here invoke variations on the Kremer-Grest polymer model, in which a polymer chain is represented as a line of interacting beads linked by bonds[31]. In some simulations, beads interacted with a Lennard-Jones potential
Here is an interaction energy, is an interaction length, r is the distance between bead centers, and the mass of a bead is m. The potential is given a cut-off distance . Kremer and Grest used , giving a purely repulsive bead-bead force. Adeyemi, et al.,[25] used , which includes most of the potential’s attractive well. The bonds between the beads are typically represented with a FENE (Finitely Extensible Nonlinear Elastic) potential
where here k and are parameters for the potential and r is the length of the bond. These potentials lend themselves to the use of reduced Lennard-Jones units in which length, energy, time, and temperature are scaled by , , , and , respectively, being Boltzmann’s constant.
3. Simulations of Blends
We now turn to a series of simulations that determined polymer mean-square displacements in melts of polymer blends. We consider results of Sacristan, et al.,[22] Kopf, et al.,[23] Wang and Larson,[24] and Adeyemi, et al.,[25]. These authors treated systems that, in terms of the tube model, are unentangled, lightly entangled, or moderately entangled. In addition, in our previous papers we analyzed results of Brodeck, et al,[15] as part of our proof-of-principle test of our data interpretation method.
Sacristan, et al.,[22] report simulations of a 20 wt% polyethylene oxide: 80 wt% polymethylmethacrylate blend and a polyethylene oxide:polymethylmethacrylate block copolymer having the same 20:80 weight composition for the two blocks. Their interest was the effect of the local composition of the system around each polymer bead. By ‘local composition’, they refer to the number of beads of each monomer species in the immediate vicinity, 5-25 Å, of the bead of interest. The effective concentration of each species around a bead of interest differs between the blend and the block copolymer because the block copolymer has intramolecular connectivity that forces some beads of the two species to remain nearly adjacent to each other. These simulations are of interest here because the polymers are both short, namely 30 monomers for the PEO and 10 monomers for the PMMA. Entanglement issues should therefore be minimal. The polymers were represented with a united atom formalism, using a force field taken from the literature[32,33]. The authors calculated intermolecular pair correlation functions, local concentrations of monomers as functions of distance from a given monomer, mean-square displacements and , and the self intermediate scattering function . was found to be bimodal; Sacristan, et al., demonstrate that its slow relaxation is described by a stretched exponential in time.
In summary, Sacristan, et al.’s results for the mean-square displacements of their short polymers, as described in detail below, find that the local exponent that describes is initially large, decreases to a single local minimum, increases to at most one plateau, and then increases again, a long-time limiting slope not being reached over the times studied in these simulations. The plateau is least evident for the motions of polyethylene oxide in the blend, as seen in Figure 1a. Said differently, in these measurements is found to have at most one power-law regime, that being seen at intermediate times.
Figure 1 shows Sacristan, et al.’s measurements of for the two polymers in the blend and for the PEO and PMMA segments of the copolymer. In computing mean-square bead displacements of the two diblock components, Sacristan, et al., did not include a few monomers near the junction between the two diblock components. Transforming from the blend to the diblock copolymer slows the faster-moving PEO chains and speeds the slower-moving PMMA chains. At sufficiently long times the mean-square displacements of the PEO and PMMA segments of the diblock copolymer must converge, but Sacristan, et al., did not quite reach such extended times. The qualitative behavior of is the same for both types of monomer, either in the blend or the diblock: In all cases, is initially quite large, at least 1.5 for the blend and for the two chains of the diblock. then has a local minimum near nS, following which it increases again. At times in the range 0.5-5 nS, approaches a plateau, the plateau being least flat for the polyethylene oxide chains in the blend, but quite nearly constant in the other three subfigures, with close to 0.53 or 0.63. At times beyond a few ns, increases again.
The depth of the first minimum varies substantially over the four subfigures. These are all clear minima, not regimes where is a constant. In the blend, the first minimum is at for the PEO monomers and at for the PMMA monomers. For the diblock copolymers, has a minimum at for the PEO chain segment and for the PMMA chain segment.
Figure 2 shows Sacristan, et al.,’s measurements for center-of-mass mean-square displacements. In both subfigures, at early times is . then declines to a minimum at times near nS. The minimum is at for the PEO, but for the copolymer. At still larger times, increases, reaching a near-plateau having . That value for is not a prediction of one of the standard theoretical models. The long-time increase to is finally approached.
Kopf, et al.,[23] used the Kremer-Grest model[31] for polymer dynamics to simulate a bidisperse system of polymers. Their interest was in studying properties of blends of slow- and fast-moving polymers, the two polymeric species other than their relative speeds being as similar as possible. Kopf, et al., obtained polymers differing only in the speed of their motions by considering a blend of two polymer species, the species differing only in the masses of their individual beads. Beads of the fast species were assigned nominal mass . In different simulations, beads of the slow species had masses 1, 4, or 100, the heavier beads leading to less rapid polymer motions. Beads interacted with Lennard-Jones and FENE potentials. In these simulations, the Lennard-Jones and FENE parameters were set at , , , , and , with a bead density . Other than the bead mass, the two polymer species were identical. Chain lengths in different systems ranged from 10 to 150 beads, the entanglement length being beads. The simulation box, a cube with periodic boundary conditions, contained between 16 and 30 polymer chains. To confirm that their results agreed with Kremer and Grest’s model, Kopf, et al., computed static properties including the mean-square end-to-end distance, the radius of gyration, and the single-chain static structure factor, finding agreement with Kremer and Grest in all cases.
Kopf, et al., emphasize results on 20- and 30- bead polymers, these lengths being chosen to be short enough that entanglement effects are not significant but long enough that chain statistics show random-walk behavior. The study included properties of pure melts of each of their four species, and blends of the polymer with a heavy polymer at mole ratios of 80:20, 50:50, and 20:80. They compute and from the motions of a single bead located at the midpoint of the chain. Kopf, et al.,[23] divide their results into three time regimes, namely a short time regime with ’deterministic’ motion, an intermediate time regime said to be described by Rouse dynamics, and a long-time regime approximated by free diffusion.
Figure 3 and Figure 4 show and , respectively, for monodisperse polymers having chain lengths of 20, 30, 50, or 150 beads. The 30-bead chains were only reported for longer times. As seen in Figure 3, is independent of chain length for . At longer times, the mean-square bead displacement slows as chain length is increased. At short times , is . For the 20-, 50-, and 150-bead polymers, as time increases falls to a single minimum and then increases again. The 30-bead polymer was only examined over a narrow range of times, but it did have an apparent minimum. The minimum in decreased with increasing polymer length, being 0.50, 0.51, 0.43, or 0.37, respectively, for the four chain lengths. The minima clearly represent inflection points of . Power-law behavior, a region where is constant, was approximately present for the 30-bead polymer at times but was absent for the other three polymers.
In contrast to , the mean-square center-of-mass motion shown by , as seen in Figure 4, sometimes showed power-law behavior. For long times , the three shorter polymers have , corresponding to simple diffusion. Over the same time period, the 150-bead polymer also shows close-to-power-law behavior with , i.e., . This exponent is not familiar from standard models.
Figure 5 and Figure 6 show and for 30-bead polymers in 50:50 blends, teh beads of the second species in the blend having mass 4 or mass 100. The effect on the motions of the lighter chains of changing the mass of the heavier polymer’s beads is modest. Figure 5 refers to motions of the light () chain through the blend, while Figure 6 refers to motions of the heavier ( or ) chain through the blend. In the blends, and of the lighter chains both show substantial power-law regimes. For of the lighter chains, regardless of the mass of the heavy chains, at short times is a near-constant , while at later times appears to climb toward 0.9. For of the lighter chains, regardless of the mass of the heavy chains, increases from 0.85 at earlier times to 0.95 or 1.0 at later times.
The motions of the heavier chains ( or ), as seen in Figure 6, are quite similar to those of the lighter chains. Changing the mass of the heavier chains has little qualitative effect on their dynamics, perhaps because the systems are heavily overdamped, so that chain inertia is negligible. from of the heavier chains is at earlier times. At later times it increases toward 0.9 or 1.0. from of the heavier chains is not quite constant. It increases from at the shortest time observed to 1.0 at long times. In the blend, at long times from is indeed constant, showing long-time simple diffusive behavior.
Wang and Larson[24] simulated the motions of dilute long-chain () polymers through matrices of shorter polymers (). Their objective was to study the effect of constraint release in the diffusion of the 350-bead chains, using the rationale that the importance of constraint release increases as the length of the matrix chains is reduced. They report , and for the long chains, for the short chains, a chain diffusion coefficient D, and an estimate of the distribution of lifespans during which short chains remain within the nominal tube surrounding each long chain. Their beads interacted with a Lennard–Jones potential, a FENE potential between bonded beads, and a three-bead bending stiffness potential for trios of adjoining beads in the same chain. Bead motions were described by Langevin equations in which a velocity-dependent friction force and a stochastic force were added to the potential energy forces on each bead. The volume fraction of the long chains was ; increasing the volume fraction of the long chains to 0.2 had nearly no effect on the long-chain dynamics. The entanglement length was estimated as 23 based on primitive path analysis and as 32 as calculated from the tube diameter as inferred from the measured single-chain dynamic structure factor . is in good agreement with the inferred by Adeyemi, et al.,[25] from their determinations (see below) of . Wang and Larson’s results and our analyses are seen in Figure 7, Figure 8, Figure 9, Figure 10 and Figure 11.
Figure 7 shows mean-square single-bead displacements of the 350-bead polymer in each of the four matrix polymers. In the 25-bead polymer matrix, is close to a power law, with in the range 0.51-0.44. In the 50- and 100-bead polymers, has a local maximum in the range 0.50-0.53. There is then an extended region in which is close to constant, namely near 0.43 in the 50-bead polymer and 0.37 in the 80-bead polymer. For 350-bead chains in the 160-bead polymer matrix, first decreases from 0.60 to 0.32, and then increases to . This minimum appears to be a broad saddle point, not a power-law region.
Figure 8 shows for the 350-bead polymer in the four matrices. In all four matrices, at early times is a local maximum. then decreases. There is then a single power-law region, with of 0.46 in the 25-bead polymer and 0.40, 0.35, and , respectively, in the three longer-chain matrices. In the 25-bead matrix, has a final local minimum at . It is expected for that must necessarily go to zero at sufficiently long times, but for the 350-bead polymer those times were not reached in this study.
Figure 9 shows for the three shorter polymers. In all three cases, decreases smoothly to zero at longer times and remains there, as expected. The initial maximum is 0.50 for the two longer polymers and 0.58 for the shortest polymer. The only power-law regime here is the long-time regime.
Figure 10 shows for the 350-bead polymer in each of the four matrix polymers. The time dependence of is qualitatively the same for all four matrices. There is an early minimum in , and hence a saddle point in . With increasing matrix polymer molecular weight, the saddle point moves to later times, and also deepens, from in the 25-bead matrix to 0.57 in the 160-bead matrix. With two of the three shorter matrix chains, at times after the saddle point there is a single region that could be described as a power law in (i.e., has a single region where is approximately constant), following which appears to increase toward a free-diffusion limit .
Figure 11 shows and for the 350-bead polymer in its monodisperse melt. has a single power-law region, namely at late times. At earlier and later times, is larger, rising to at early times and at the longest times studied. clearly does not have a power-law region. Instead, its decreases from 0.7 at early times to a saddle point at ; then increases to the free-diffusion limit at the longest times studied.
Adeyemi, et al.,[25] simulated bidisperse blend melts with the Kremer-Grest model. The melts contained a long (350 bead) polymer and a shorter polymer, the shorter chains having 25, 50, or 100 beads. Comparison was made with monodisperse melts of chains having each of the four chain lengths. The blends were either 0.7 or 0.3 by volume fraction of the longer chains, and therefore 0.3 or 0.7 by volume fraction of the shorter chains. The molecular weights follow those in Wang and Larson[24], except that here neither polymer species in the blend is dilute. Comparison was made with simulations of the four polymers in single component systems. The authors determined the center-of-mass displacement function and, for the monodisperse chains, the single-bead displacement function . To avoid chain-end effects, the reported was taken as the motion of the central bead of each chain, not the motions of all the beads of each chain. They further examined, not considered here, the dynamics of the Rouse modes and stress relaxation following a step shear strain.
By force-fitting the observed for the monodisperse systems to tube-reptation predictions for and , Adeyemi, et al., estimated for a monodisperse system that the number of beads between adjoining entanglements was . This result agrees with Kremer and Grest[31]. It follows that Adeyemi, et al.,’s three shorter polymers were unentangled or barely entangled , while their long polymer averaged entanglements.
Figure 12 presents Adeyemi, et al.,’s measurements of for their four polymers in monodisperse melts. For all polymers, is close to 0.5 at early times, and at long times reaches . For the 50-bead polymer, these values of correspond to manifest power-law regimes. With increasing chain length, a minimum in appears at intermediate times, the minimum increasing in depth and width with increasing chain length. The minimum is scarcely visible for the 50-bead polymer, bottoms out at for the hundred bead polymer, and declines to a broad for the 350-bead polymer. These are all minima, not places where is a local constant, as would be seen if power-law behavior were present at intermediate times. The transition regions between the and behaviors are quite wide.
Figure 13 shows the center-of-mass displacements for the pure long-chain polymer and for the long-chain polymer mildly diluted () by each of the three shorter-chain polymers. In summary, at shorter times () the mean-square center-of-mass displacements approach power-law behavior with exponents near , the approach being closest with dilution by the lightest polymer. At longer times, out to the longest times observed, increases progressively with increasing time, with no sign that a long-time regime has been reached. It is not obvious that has a maximum at the longest time reported. Near its minimum, for each system is clearly concave upward; correspondingly, near this point has an inflection point, not power-law behavior.
Diluting the long-chain polymer with modest amounts of the shorter chains, as seen in Figure 13b-d, has only a modest effect on . at the shortest times studied gradually increases from (for dilution of the 350-bead polymer with the 100-bead polymer) to 0.77 (for dilution with the 25-bead polymer). At its minimum, from increases from 0.63 in pure long-chain polymer to 0.70 for dilution of the 350-bead polymer by the shortest, 25-bead, polymer.
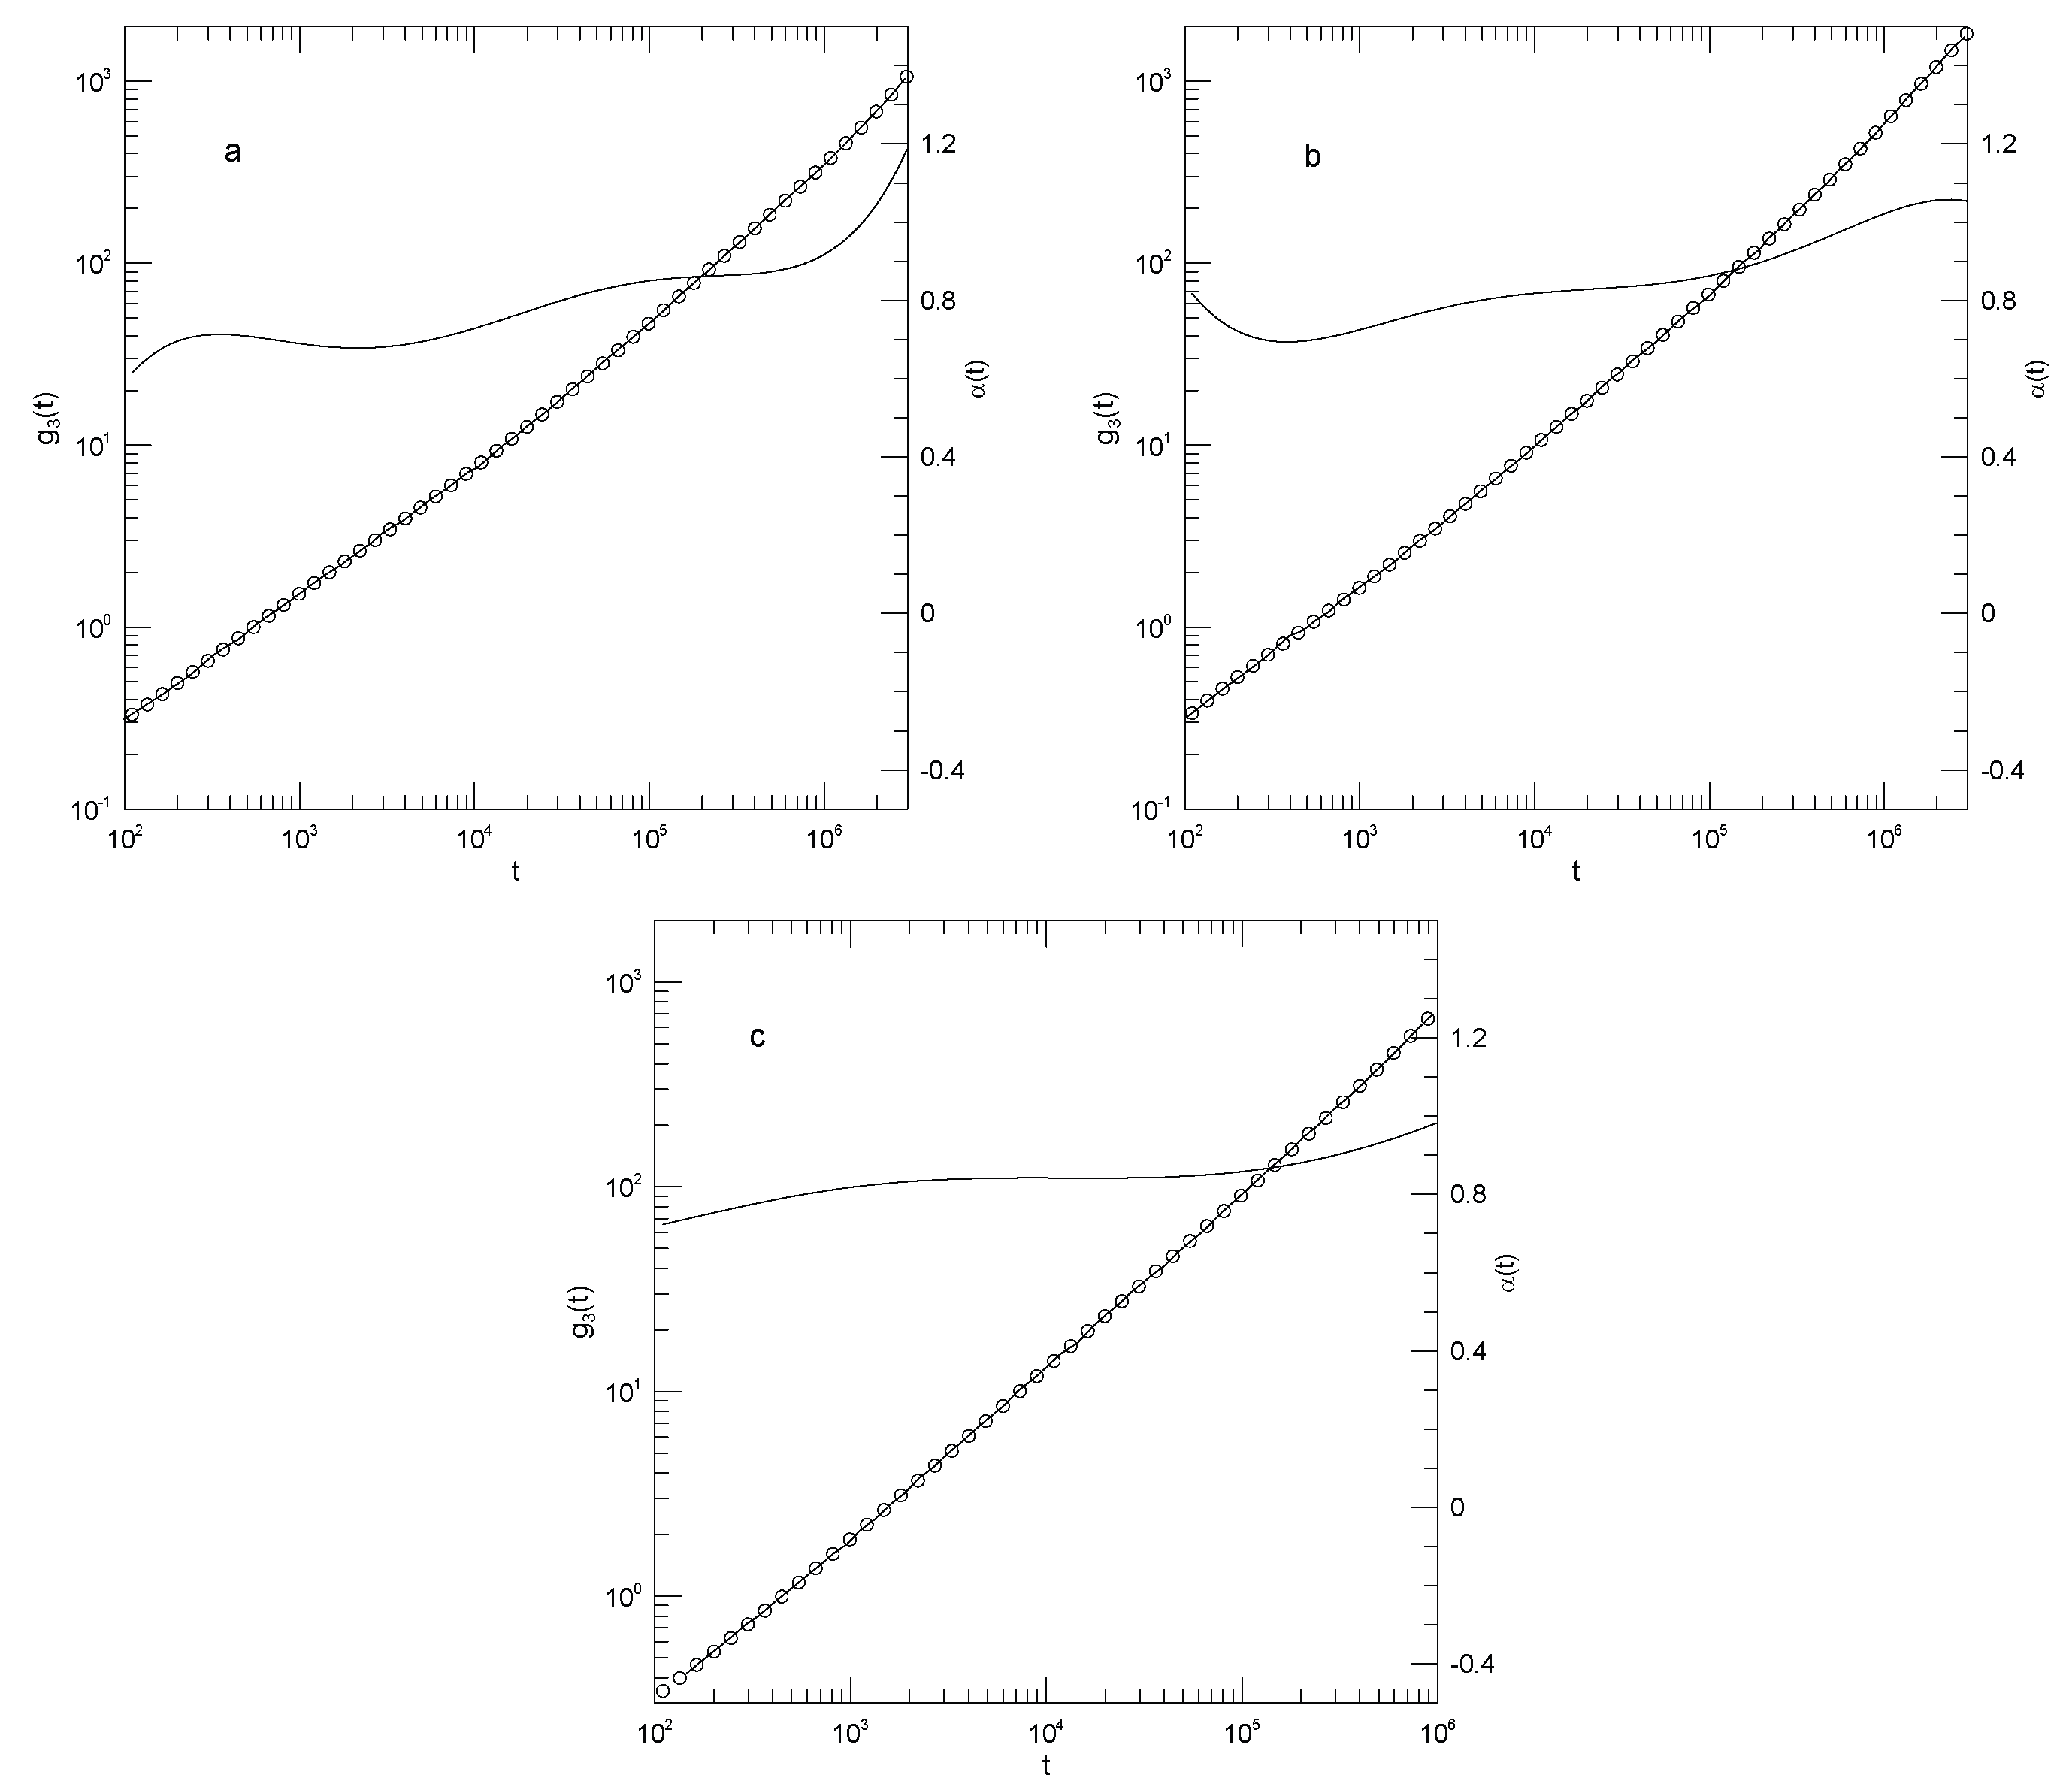
Figure 14 shows for the 350-bead polymer that has been heavily diluted (, ) with shorter chains. At this dilution, is nearly featureless in all three diluents. When mixed with the 100-bead or 50-bead diluents, increases from to over the observed range of times. When combined with the 25-bead polymer, over an extended range does show power-law behavior, with exponent .
Finally, as part of our demonstration in our previous papers[19,20] that our method can identify power-law regions when they are present, we examined results of Brodeck, et al.,[15]. As part of their study, these authors reported simulations of polyethylene oxide/polymethylmethacrylate (PEO–PMMA)blends at a series of temperatures. PEO–PMMA has large dynamical asymmetry, glass temperatures of PEO and PMMA differing by 200 K; the authors examined among other properties of their PEO chains. They found that consistently had a single power-law regime, whose exponent increased from 0.30 to 0.48 with increasing temperature over the temperature range 300-500 K that they examined.
4. Discussion
We examined the time dependences of and in a series of monodisperse and bidisperse systems. Comparison was made with tube-reptation-scaling model predictions for the time dependence of the mean-square displacements. (For completeness we also reported the less-interesting , which increases and sometimes reaches its asymptotic long-time behavior in which is a constant.) We searched for power-law behaviors. Long-time diffusive behavior () was sometimes seen. At earlier times, at most one power-law regime was observed.
We turn first to the single-bead motions described by . In general, at short times is large, corresponding to a rapid initial increase of . then decreases to a local minimum, corresponding to an inflection point in . Particularly for the shorter chains and shorter matrix chains, following the inflection point has a single plateau corresponding to a single power-law regime in . After the plateau, increases again, reaching at the longest times studied diffusive () behavior.
In more detail, the depth of the local minimum depends on the system being observed, but was 0.2 or 0.46 for the two polymers in Sacristan, et al.’s blend[22]. From Kopf, et al.,’s results[23], the time at which the minimum is seen increases with increasing polymer molecular weight, from for their 20-bead blend to for their 50-bead blend and for their 150-bead polymers. Kopf, et al., created a blend by changing the mass of the beads of some of their polymer chains. Changing the mass had only a modest effect on . Wang and Larson[24] observed 350-bead chains in shorter-chain matrices. They observed slightly more rapid motion at earlier times, an extended plateau or broad minimum in at intermediate times, and with the longer matrix polymers an increase in at large times. The plateau corresponds to a single power-law or near-power-law regime, with exponent falling from 0.46 to 0.30 with increasing blend matrix molecular weight, and finally to for the plateau in the pure melt. Adeyemi, et al.,[25] extended their measurements to a sufficient time that the diffusive behavior was clearly seen at long times. At short times, their had structure, including for different polymer lengths an early increase followed by a saddle point, the slope at the saddle point being in the range 0.3-0.4. Brodeck, et al.[15] also found a single power-law regime having exponents in the range 0.30-0.48 at different temperatures.
We may also consider the center-of-mass motions described by . For very short chains, Sacristan, et al’s results, Figure 2 find that is large at early times, decreases to a local minimum, and then increases into a plateau, revealing a single local power-law regime with exponent . Kopf, et al.,[23] report over two-and-a-half orders of magnitude in time, during which has a nearly featureless increase. For their 20-bead polymers, a weak saddle point is seen at early times. For their chains in their blend, for either blend component is very gently curving, corresponding to an exponent in the range 0.9-1.0. Their results show near-power-law behavior with a single exponent. Wang and Larson[24] examine 350-bead polymers in melts of 25, 50, 80, or 160-bead polymers, finding that in the 160-bead polymer melt has a weak saddlepoint. As we progress to shorter and shorter matrix polymers, the curvature in the plot of fades. In the 25-bead melt, for is very close to a power law with . Finally, Adeyemi, et al.,[25] examined for 350-bead chains mixed with shorter chains in 70:30 and 30:70 mixtures. When the long chain was the major component, at times , we find is close to a power law with exponent . At larger times the slope smoothly and progressively increases to . In the 30:70 blend, the log-log plots of Figure 14 show that is weakly concave upward. increases by a tenth or two in the different blends over most of the times examined. The shorter the length of the short polymer, the closer a region of approaches to power-law behavior. In the blend with the 25-bead polymer, a single power-law region is seen, with .
From our fits to log-log plots, we see that at intermediate times , , and have at most a single power-law regime, the time dependence of their logarithmic derivative at all other times being described by a curve of continuously changing slope. This result is quite different from reptation-scaling predictions that the are each described as a series of power laws, presumably separated by transition regions having unspecified forms. This prediction is not sustained for the polymer blends considered here. The analysis here specifically rejects a key segment of the reptation-scaling model for polymer dynamics.
It could be proposed that the transition regions are quite wide, so that the power-law regimes have been more-or-less completely swallowed up by the transitions between them. However, in this case theories treating the power-law regions would be describing a very small part of the time dependence. The important theoretical target in this case should instead be to predict the forms of the transition regions, not to predict the behavior of any largely invisible power-law region.
One anticipates the objection that tube-reptation predictions were originally made for a monodisperse system, not a blend. However, a central assumption of the original reptation model is that the chain of interest is confined to a tube, the tube being taken to be stationary on the time scales of interest, with the walls of the tube being formed by other chains. If the chains forming the walls of the tube are replaced with chains of different molecular weight, then within the context of the reptation model the motions of the tube walls would become faster or slower, but until the chains in the tube walls became very short they would still, according to the model, confine the chain of interest to some tube. The validity of the reptation model would not be eliminated, though some model-predicted transition times would change.
Supplementary Materials
The following supporting information can be downloaded at the website of this paper posted on Preprints.org.
Funding
This research received no external funding.
Institutional Review Board Statement
Not applicable.
Informed Consent Statement
Not applicable.
Data Availability Statement
Data are contained within the article.
Conflicts of Interest
The author declares no conflicts of interest.
References
- Padding, J. T.; Briels, W. J. Time and Length Scales of Polymer Melts Studied by Coarse-Grained Molecular Dynamics Simulations. J. Chem. Phys. 2002, 117, 925–943. [Google Scholar] [CrossRef]
- Phillies, G. D. J. Phenomenology of Polymer Solution Dynamics; Cambridge University Press: Cambridge, U.K, 2011. [Google Scholar]
- Phillies, G. D. J. Kirkwood-Riseman Model in Non-Dilute Polymeric Fluids. Polymers 2023, 15, 3216. [Google Scholar] [CrossRef] [PubMed]
- Doi, M.; Edwards, S. F. The Theory of Polymer Dynamics. Clarendon Press: Oxford, U.K. 1988.
- de Gennes, P.-G. Scaling Concepts in Polymer Physics; Cornell U.P.: Ithaca, NY, USA, 1979. [Google Scholar]
- Peters, B. L.; Salerno, K. M.; Ge, T.; Perahia, D.; Grest, G. S. Viscoelastic Response of Dispersed Entangled Polymer Melts. Macromolecules 2020, 53, 8400–8405. [Google Scholar] [CrossRef]
- Faller, R. Correlation of Static and Dynamic Inhomogeneities in Polymer Mixtures: A Computer Simulation of Polyisoprene and Polystyrene. Macromolecules 2004, 37. 1095-1101 and Macromolecules 2006, 39, 462. [Google Scholar] [CrossRef]
- Bedrov, D.; Smith, G. D. A Molecular Dynamics Simulation Study of Relaxation Processes in the Dynamical Fast Component of Miscible Polymer Blends. Macromolecules 2005, 38, 10314–10319. [Google Scholar] [CrossRef]
- Bedrov, D.; Smith, G. D. A Molecular Dynamics Simulation Study of Segmental Relaxation Processes in Miscible Polymer Blends. Macromolecules 2006, 39, 8529–8535. [Google Scholar] [CrossRef]
- Katsarou, A. F.; Tsamopoulos, A. J.; Tsalikis, D. G.; Mavrantzas, V. G. Dynamic Heterogeneity in Ring-Linear Polymer Blends. Polymers 2020, 12, 752. [Google Scholar] [CrossRef]
- Cao, J.; Likhtman, A. E. Time-Dependent Orientation Coupling in Equilibrium Polymer Melts. Phys. Rev. Lett. 2010, 104, 207801. [Google Scholar] [CrossRef]
- Peters, B. L.; Salerno, K. M.; Ge, T.; Perahia, D.; Grest, G. S. Effect of Chain Length Dispersity on the Mobility of Entangled Polymers. Phys. Rev. Lett. 2018, 121, 057802. [Google Scholar] [CrossRef]
- Neelakantan, A.; May, A. F.; Maranas, J. K. The Role of Environment in Structural Relaxation of Miscible Polymer Blends. Macromolecules 2005, 38, 6598–6609. [Google Scholar] [CrossRef]
- May, A. F.; Maranas, J. K. The Single Chain Limit of Structural Relaxation in a Polyolefin Blend. J. Chem. Phys. 2006, 125, 024906. [Google Scholar] [CrossRef] [PubMed]
- Brodeck, M.; Alvarez, F.; Moreno, A. J.; Colmenero, J.; Richter, D. Chain Motion in Nonentangled Dynamically Asymmetric Polymer Blends: Comparison between Atomistic Simulations of PEO/PMMA and a Generic Bead-Spring Model. Macromolecules 2010, 43, 3036–3051. [Google Scholar] [CrossRef]
- Baig, C.; Stephanou, P. S.; Tsolou, G.; Mavrantzas, V. G.; Kroeger, M. Understanding Dynamics in Binary Mixtures of Entangled cis-1,4-Polybutadiene Melts at the Level of Primitive Path Segments by Mapping Atomistic Simulation Data onto the Tube Model. Macromolecules 2010, 43, 8239–8250. [Google Scholar] [CrossRef]
- Phillies, G. D. J. Simulational Tests of the Rouse Model. Polymers 2023, 15, 2615. [Google Scholar] [CrossRef]
- Rouse, P. E. A Theory of the Linear Viscoelastic Properties of Dilute Solutions of Coiling Polymers. J. Chem. Phys. 1953, 21, 1272–1280. [Google Scholar] [CrossRef]
- Phillies, G. D. J. Quantitative Interpretation of Simulated Polymer Mean-Square Displacements. Polymers 2025, 17, 516. [Google Scholar] [CrossRef]
- Phillies, G. D. J. Mean-Square Displacements of Simulated Polymers. Polymers 2025, 17, 1193. [Google Scholar] [CrossRef] [PubMed]
- Doob, J. L. The Brownian Movement and Stochastic Equations. Ann. Math. 1942, 43, 351–369. [Google Scholar] [CrossRef]
- Sacristan, J.; Chen, C.; Maranas, J. K. Role of Effective Composition on Dynamics of PEO-PMMA Blends. Macromolecules 2008, 41, 5466–5476. [Google Scholar] [CrossRef]
- Kopf, A.; Duenweg, B.; Paul, W. Dynamics of Polymer “Isotope” mixtures: Molecular Dynamics Simulation and Rouse Model Analysis. J. Chem. Phys. 1997, 107, 6945–6955. [Google Scholar] [CrossRef]
- Wang, Z.; Larson, R. G. Constraint Release in Entangled Binary Blends of Linear Polymers: A Molecular Dynamics Study. Macromolecules 2008, 41, 4945–4960. [Google Scholar] [CrossRef]
- Adeyemi, O.; Zhu, S.; Xi, L. Dynamics and Stress Relaxation of Bidisperse Polymer Melts with Unentangled and Moderately Entangled Chains. Phys. Fluids 2021, 33, 063105. [Google Scholar] [CrossRef]
- Puetz, M.; Kremer, K.; Grest, G. S. What is the Entanglement Length in a Polymer Melt? Europhys. Lett. 2000, 49, 735–741. [Google Scholar] [CrossRef]
- Schweizer, K. S. Mode-Coupling Theory of the Dynamics of Polymer Liquids: Qualitative Predictions for Flexible Chain and Ring Melts. J. Chem. Phys. 1989, 91, 5822–5839. [Google Scholar] [CrossRef]
- Schweizer, K. S. Microscopic Theory of the Dynamics of Polymeric Liquids: General Formulation of a Mode-Mode-Coupling Approach. J. Chem. Phys. 1989, 91, 5802–5821. [Google Scholar] [CrossRef]
- Nahali, N.; Rosa, A. Nanoprobe Diffusion in Entangled Polymer Solutions: Linear Vs. Unconcatenated Ring Chains. J. Chem. Phys. 2018, 148, 194902. [Google Scholar] [CrossRef]
- Phillies, G. D. J. The Gaussian Diffusion Approximation is Generally Invalid in Complex Fluids. Soft Matter, 2015, 11, 580–586. [Google Scholar] [CrossRef]
- Kremer, K.; Grest, G. S. Dynamics of Entangled Linear Polymer Melts: A Molecular Dynamics Simulation. J. Chem. Phys. 1990, 92, 5057–5086. [Google Scholar] [CrossRef]
- Smith, G. D.; Jaffe, R. L.; Yoon, D. Y. Force Field for Simulations of 1,2-Dimethoxyethane and Poly(oxyethylene) Based upon Ab Initio Electronic Structure Calculations on Model Molecules. J. Phys. Chem. 1993, 97, 12752–12759. [Google Scholar] [CrossRef]
- Okada, O.; Oka, K.; Kuwajima, S.; Toyoda, S.; Tanabe, K. Molecular Simulation of an Amorphous Poly(methyl methacrylate)-Poly(tetrafluoroethylene) Interface. Comput. Theor. Polym. Sci. 2000, 10, 371–381. [Google Scholar] [CrossRef]
Figure 1.
Mean-square center-of-mass displacements (thick lines), our fits of to eighth-order polynomials(circles), and the corresponding first logarithmic derivatives (thin lines). The subfigures show (a) polyethylene oxide chains in a polyethylene oxide-polymethylmethacrylate blend, (b) polymethylmethacrylate chains in a polyethylene oxide-polymethylmethacrylate blend, (c) the polyethylene oxide segment of a polyethylene oxide-polymethylmethacrylate diblock copolymer, and (d) the polymethylmethacrylate segment of a polyethylene oxide-polymethylmethacrylate diblock copolymer, based on simulations by Sacristan, et al.,[22].
Figure 1.
Mean-square center-of-mass displacements (thick lines), our fits of to eighth-order polynomials(circles), and the corresponding first logarithmic derivatives (thin lines). The subfigures show (a) polyethylene oxide chains in a polyethylene oxide-polymethylmethacrylate blend, (b) polymethylmethacrylate chains in a polyethylene oxide-polymethylmethacrylate blend, (c) the polyethylene oxide segment of a polyethylene oxide-polymethylmethacrylate diblock copolymer, and (d) the polymethylmethacrylate segment of a polyethylene oxide-polymethylmethacrylate diblock copolymer, based on simulations by Sacristan, et al.,[22].
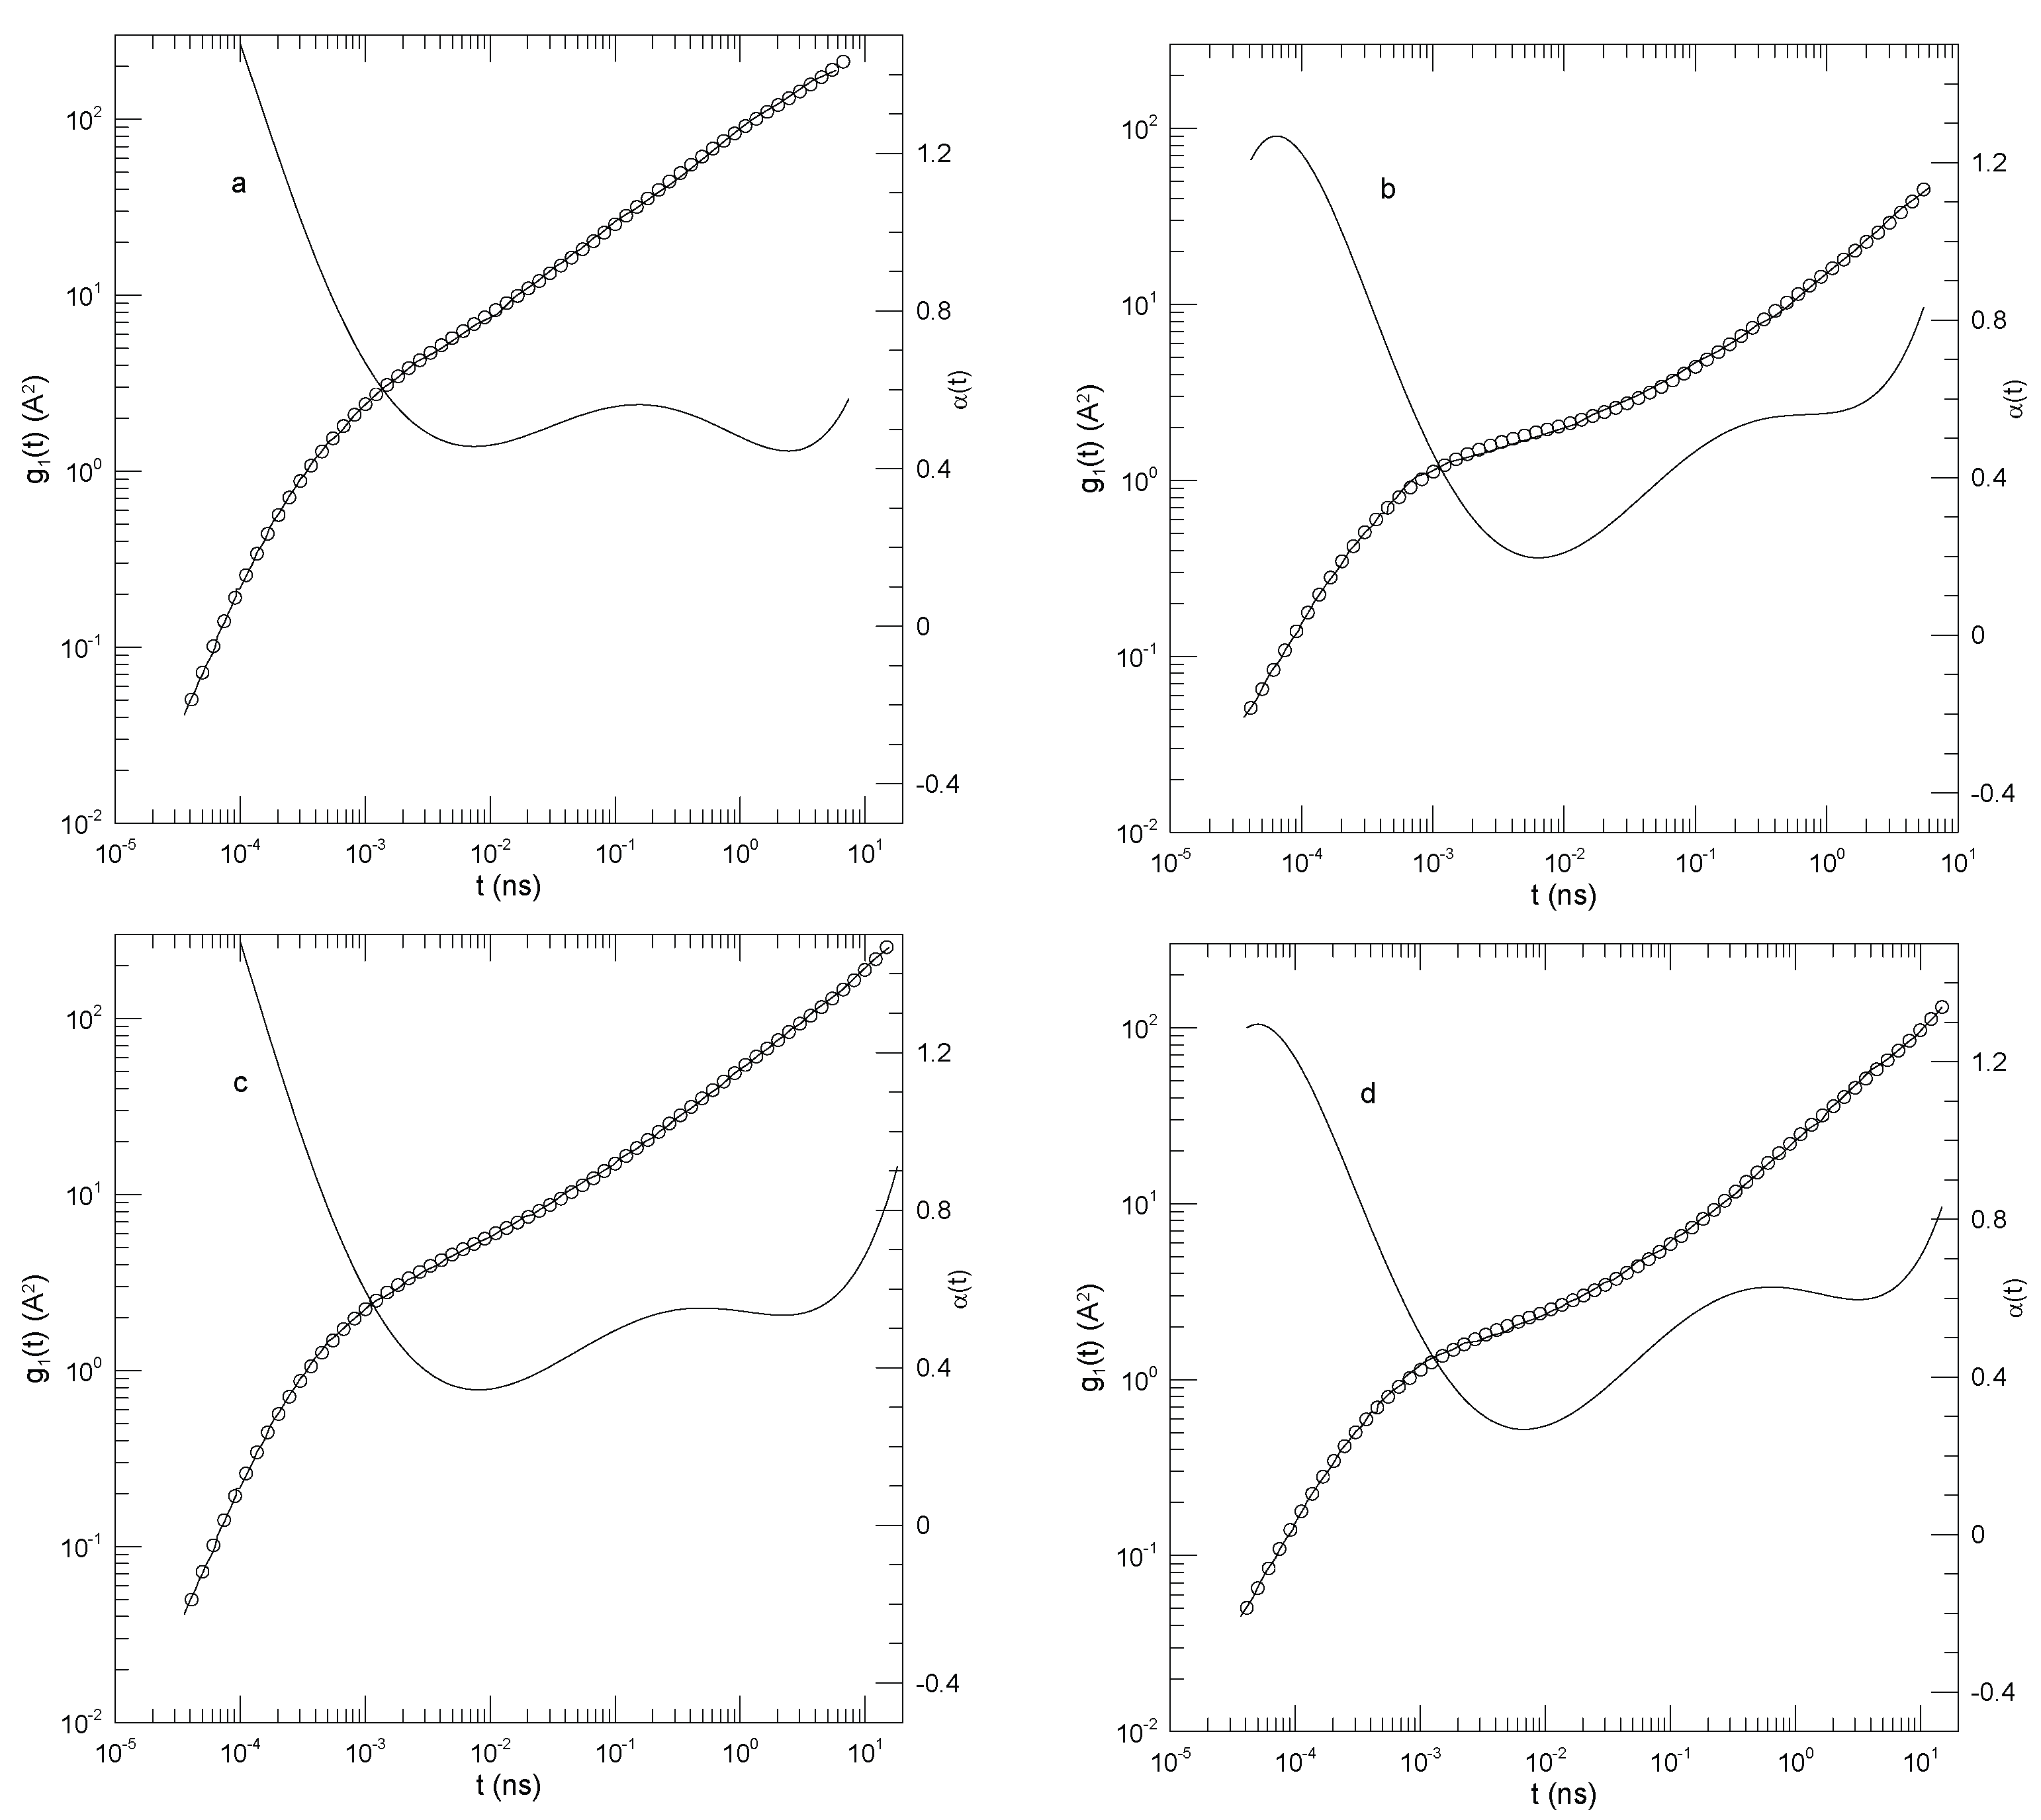
Figure 2.
Mean-square center-of-mass displacements (thick lines), our fits of to eighth-order polynomials (circles), and the corresponding first logarithmic derivatives (thin lines). The subfigures show (a) polyethylene oxide chains in a polyethylene oxide-polymethylmethacrylate blend and (b) a polyethylene oxide:polymethylmethacrylate block copolymer, based on simulations of Sacristan, et al.[22]. Mean-square displacements of PMMA in the blend are nearly equal to mean-square center-of-mass displacements of PEO:PMMA diblock copolymers, so they are not shown separately.
Figure 2.
Mean-square center-of-mass displacements (thick lines), our fits of to eighth-order polynomials (circles), and the corresponding first logarithmic derivatives (thin lines). The subfigures show (a) polyethylene oxide chains in a polyethylene oxide-polymethylmethacrylate blend and (b) a polyethylene oxide:polymethylmethacrylate block copolymer, based on simulations of Sacristan, et al.[22]. Mean-square displacements of PMMA in the blend are nearly equal to mean-square center-of-mass displacements of PEO:PMMA diblock copolymers, so they are not shown separately.
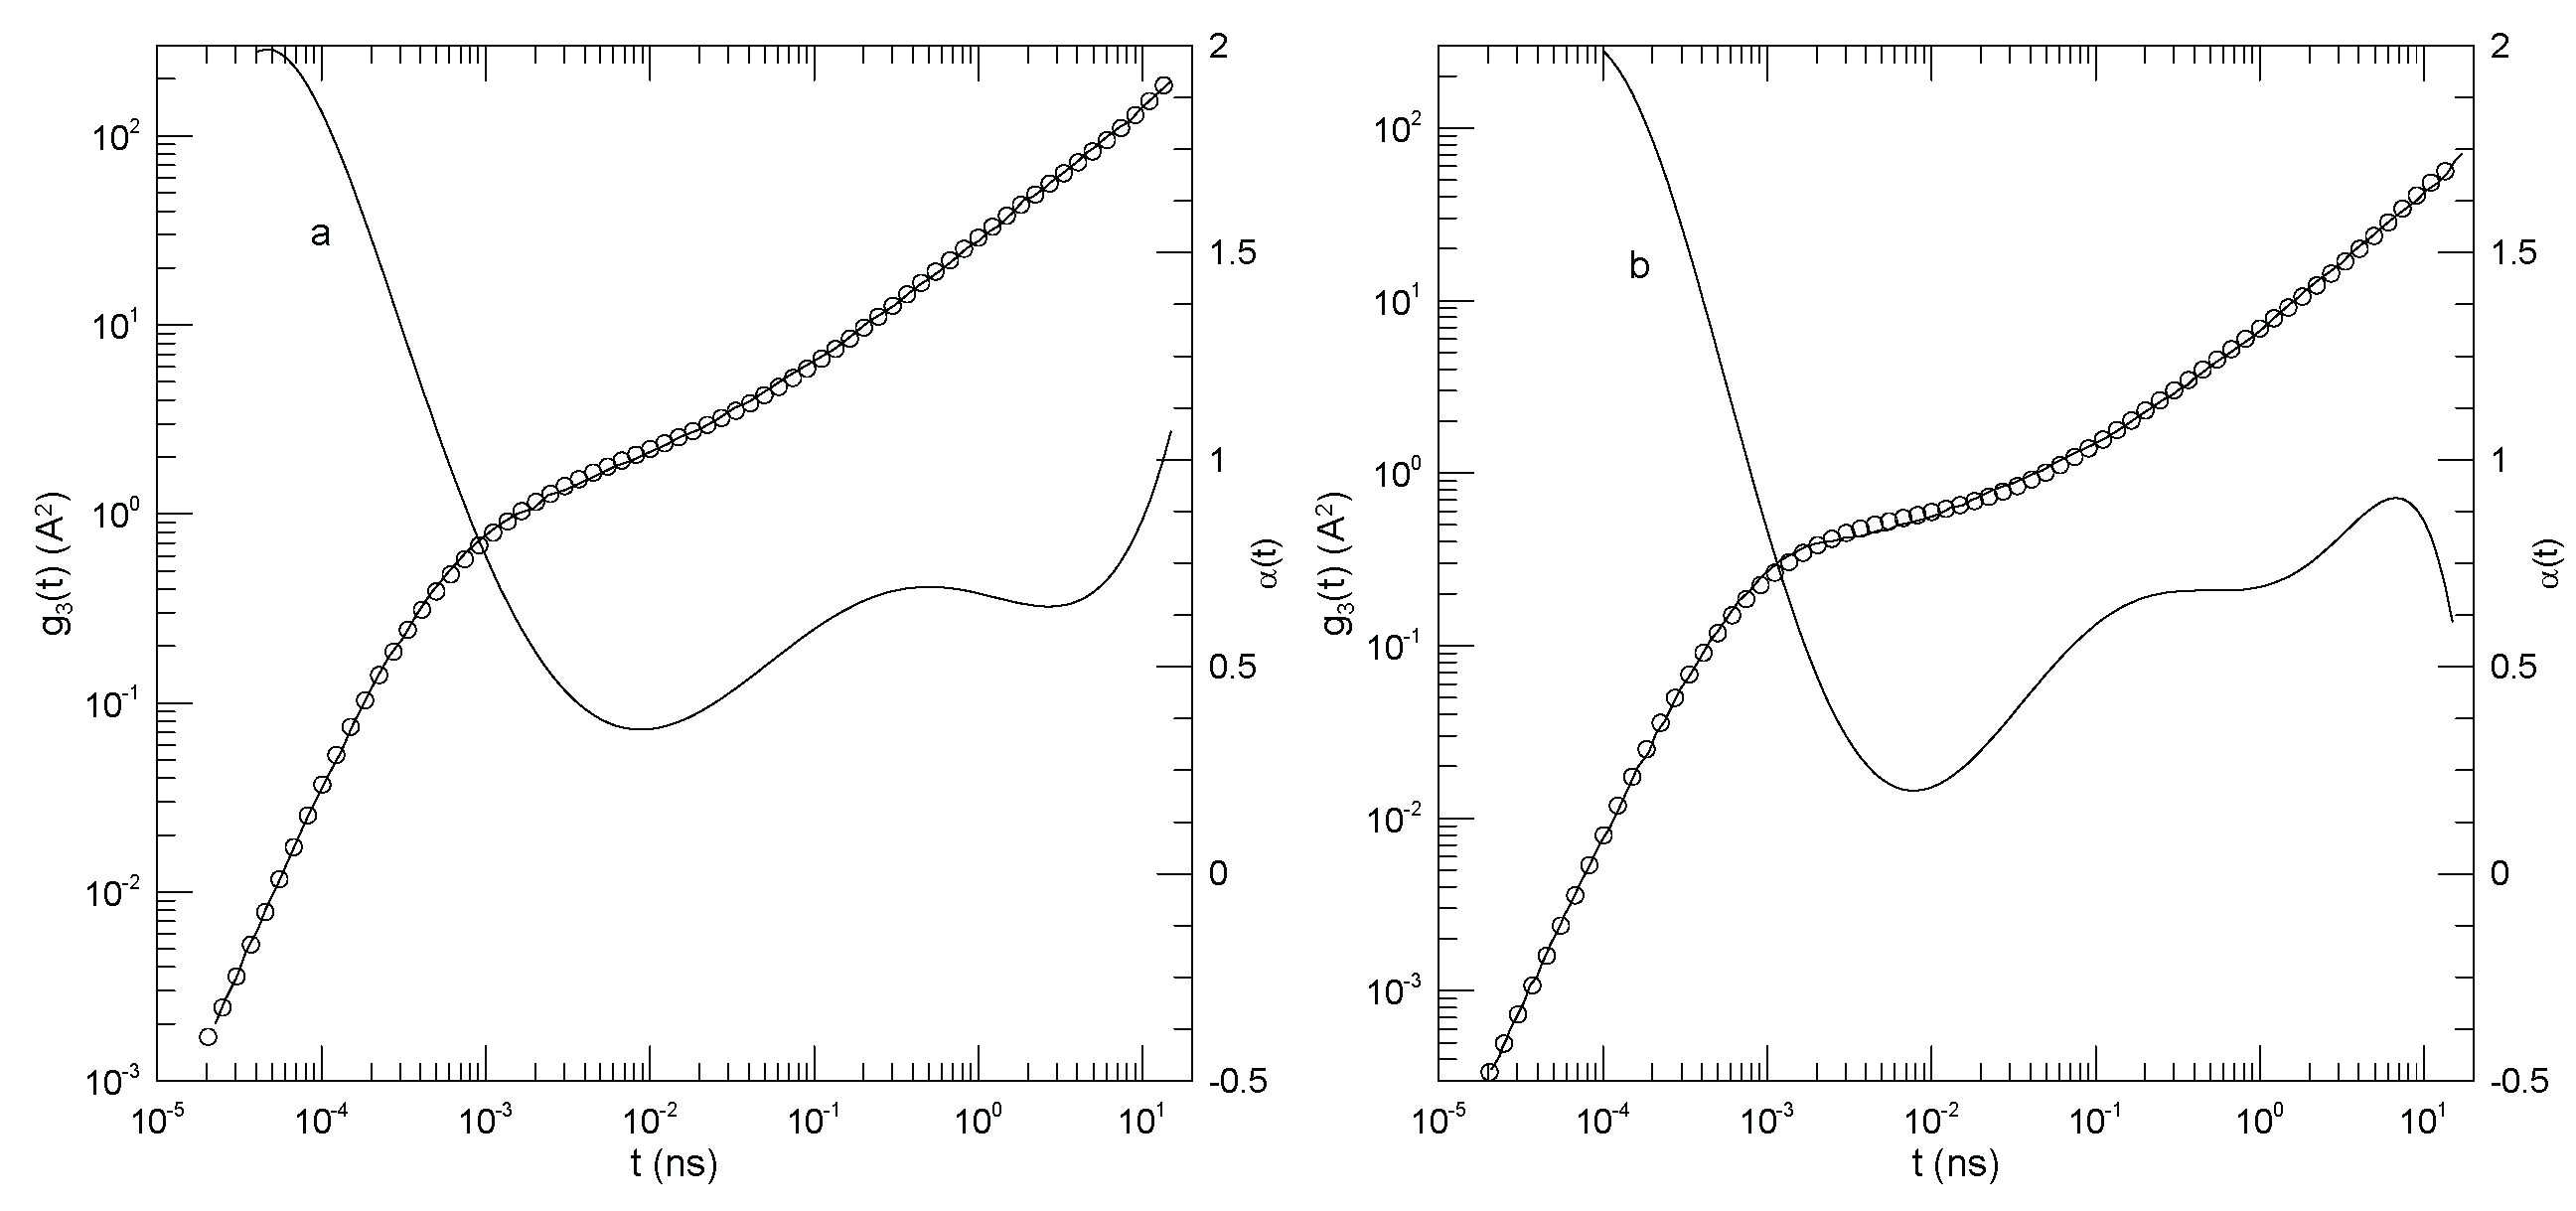
Figure 3.
Mean-square central bead displacements (thick lines) of melts of Kremer-Grest bead-spring chains, based on simulations of Kopf, et al.,[23], together with fits to eighth-order polynomials (circles), and the corresponding first logarithmic derivatives (thin lines). Chains contained (a) 20, (b) 30, (c) 50, or (d) 150 beads.
Figure 3.
Mean-square central bead displacements (thick lines) of melts of Kremer-Grest bead-spring chains, based on simulations of Kopf, et al.,[23], together with fits to eighth-order polynomials (circles), and the corresponding first logarithmic derivatives (thin lines). Chains contained (a) 20, (b) 30, (c) 50, or (d) 150 beads.
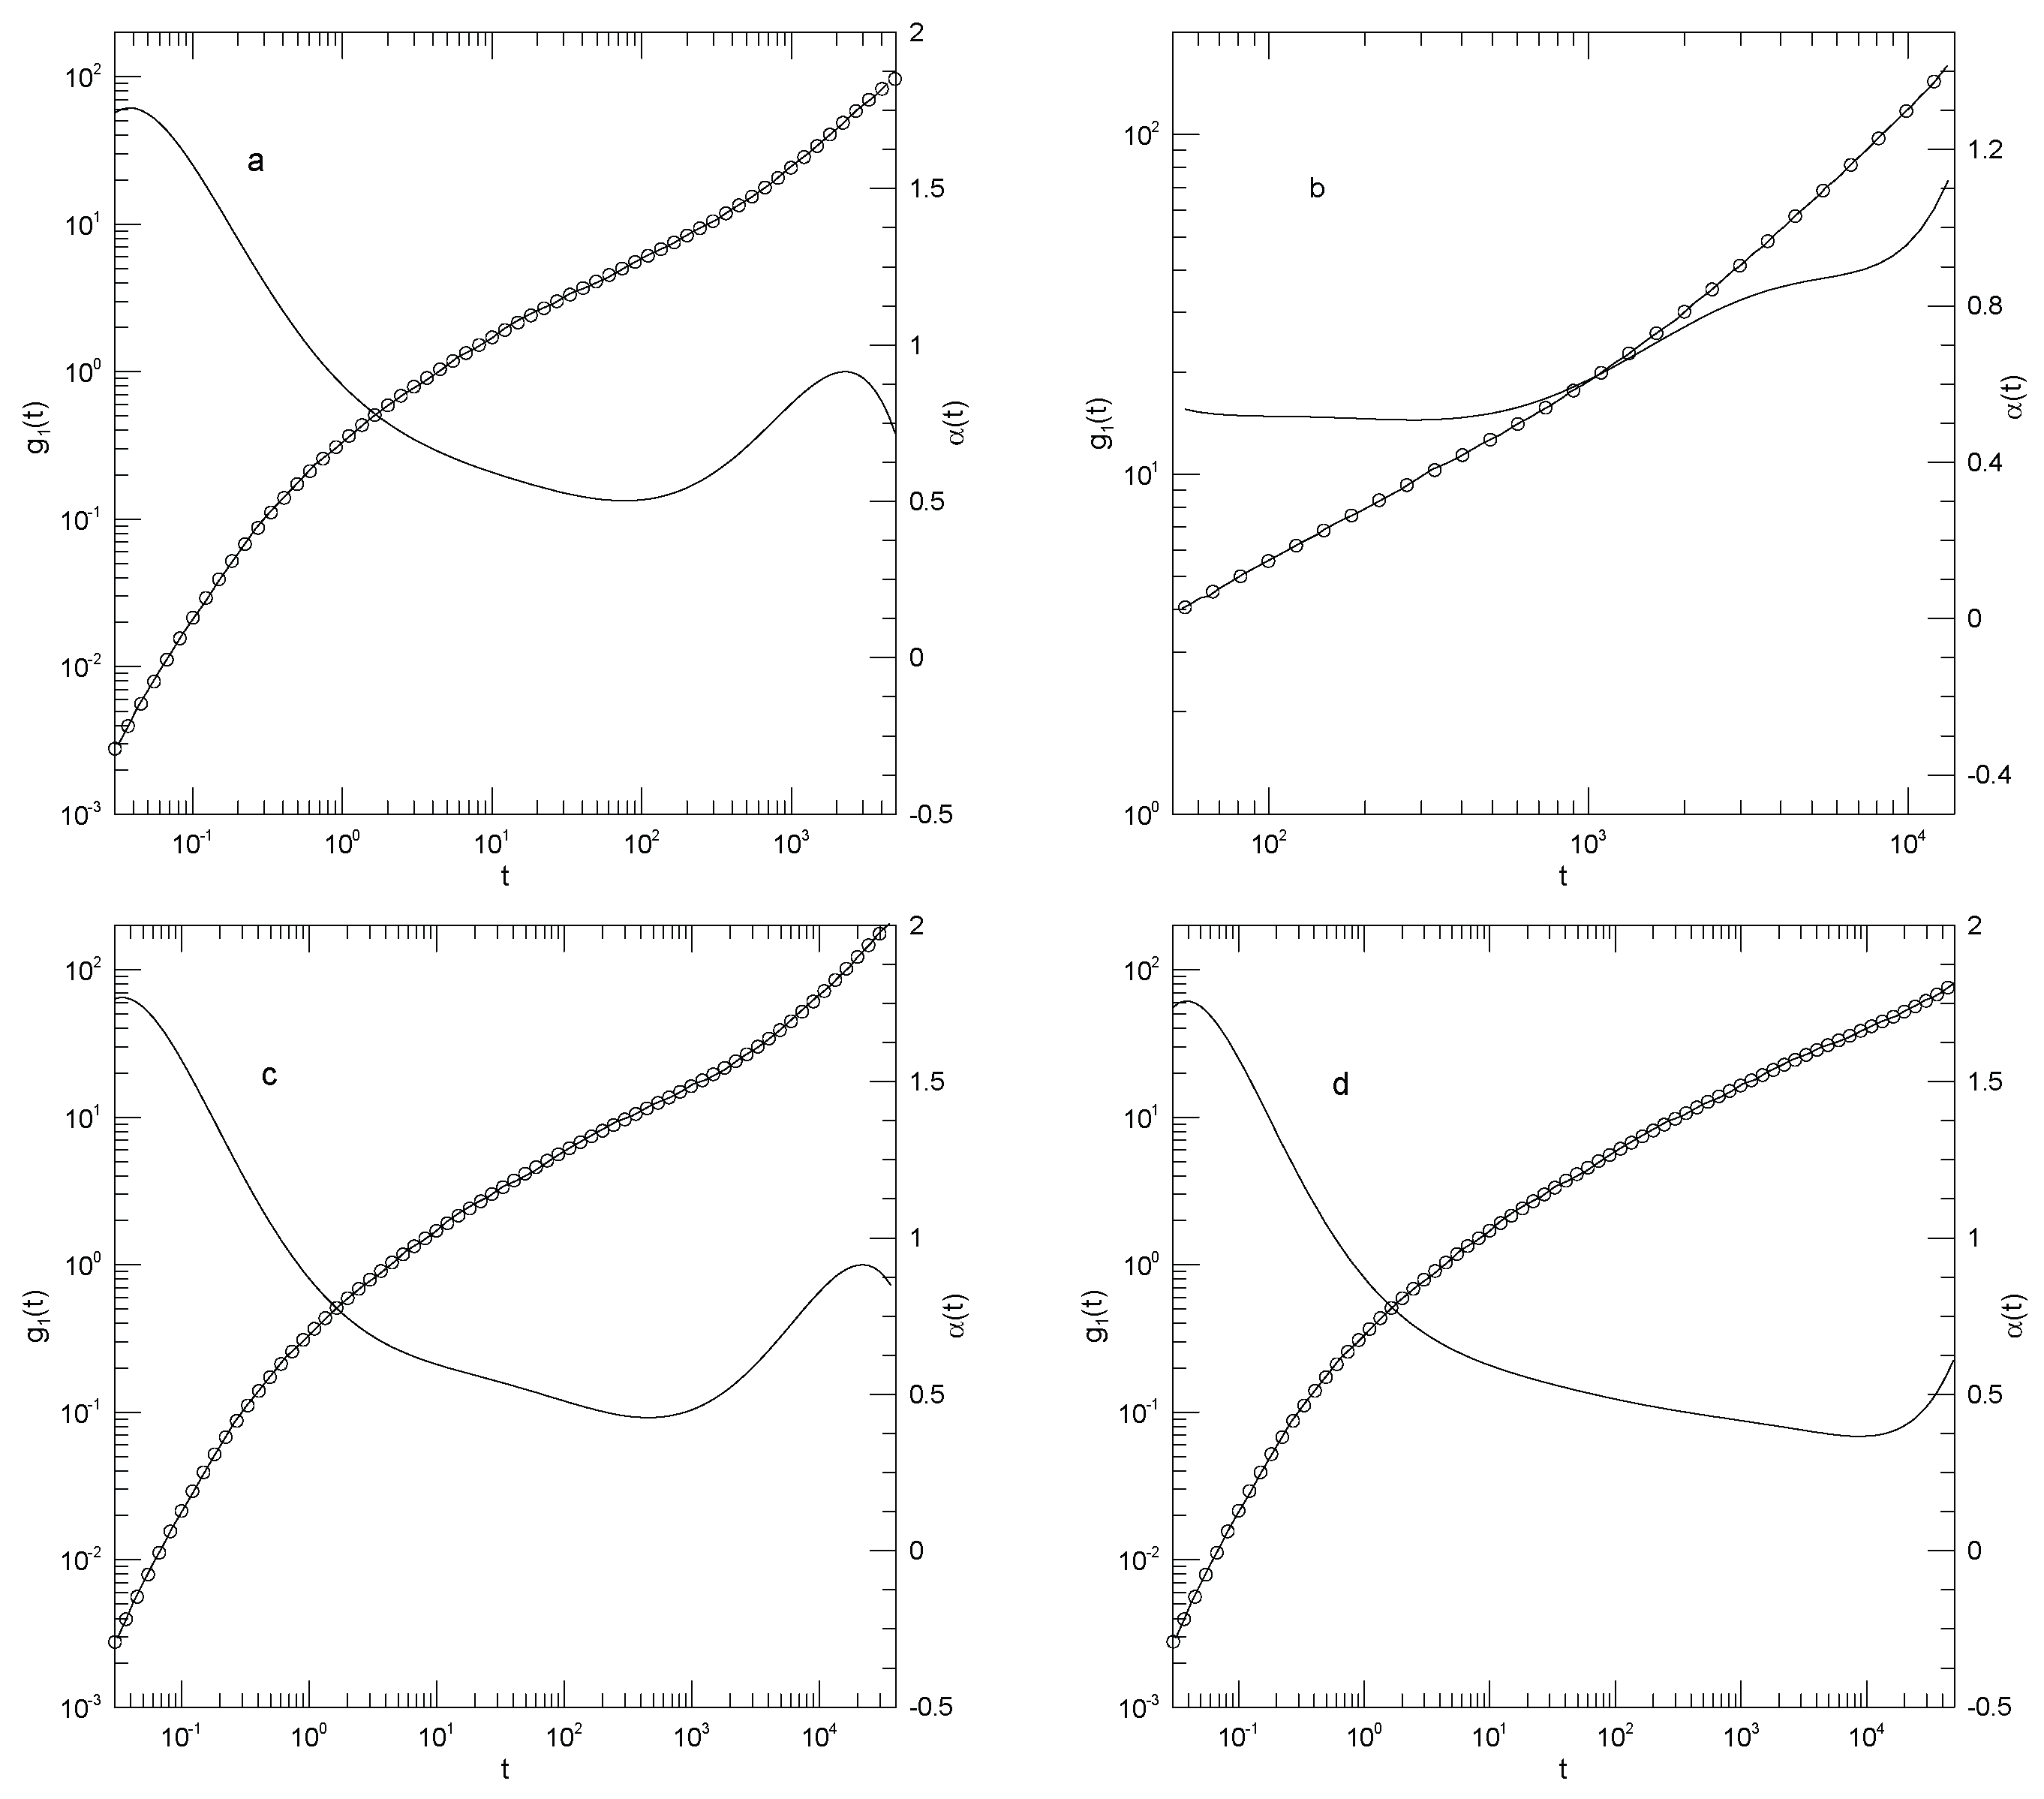
Figure 4.
Mean-square center-of-mass displacements (thick lines) of melts of Kremer-Grest bead-spring chains, based on simulations of Kopf, et al.,[23], together with fits to eighth-order polynomials (circles), and the corresponding first logarithmic derivatives (thin lines). Chains contained (a) 20, (b) 30, (c) 50, or (d) 150 beads.
Figure 4.
Mean-square center-of-mass displacements (thick lines) of melts of Kremer-Grest bead-spring chains, based on simulations of Kopf, et al.,[23], together with fits to eighth-order polynomials (circles), and the corresponding first logarithmic derivatives (thin lines). Chains contained (a) 20, (b) 30, (c) 50, or (d) 150 beads.
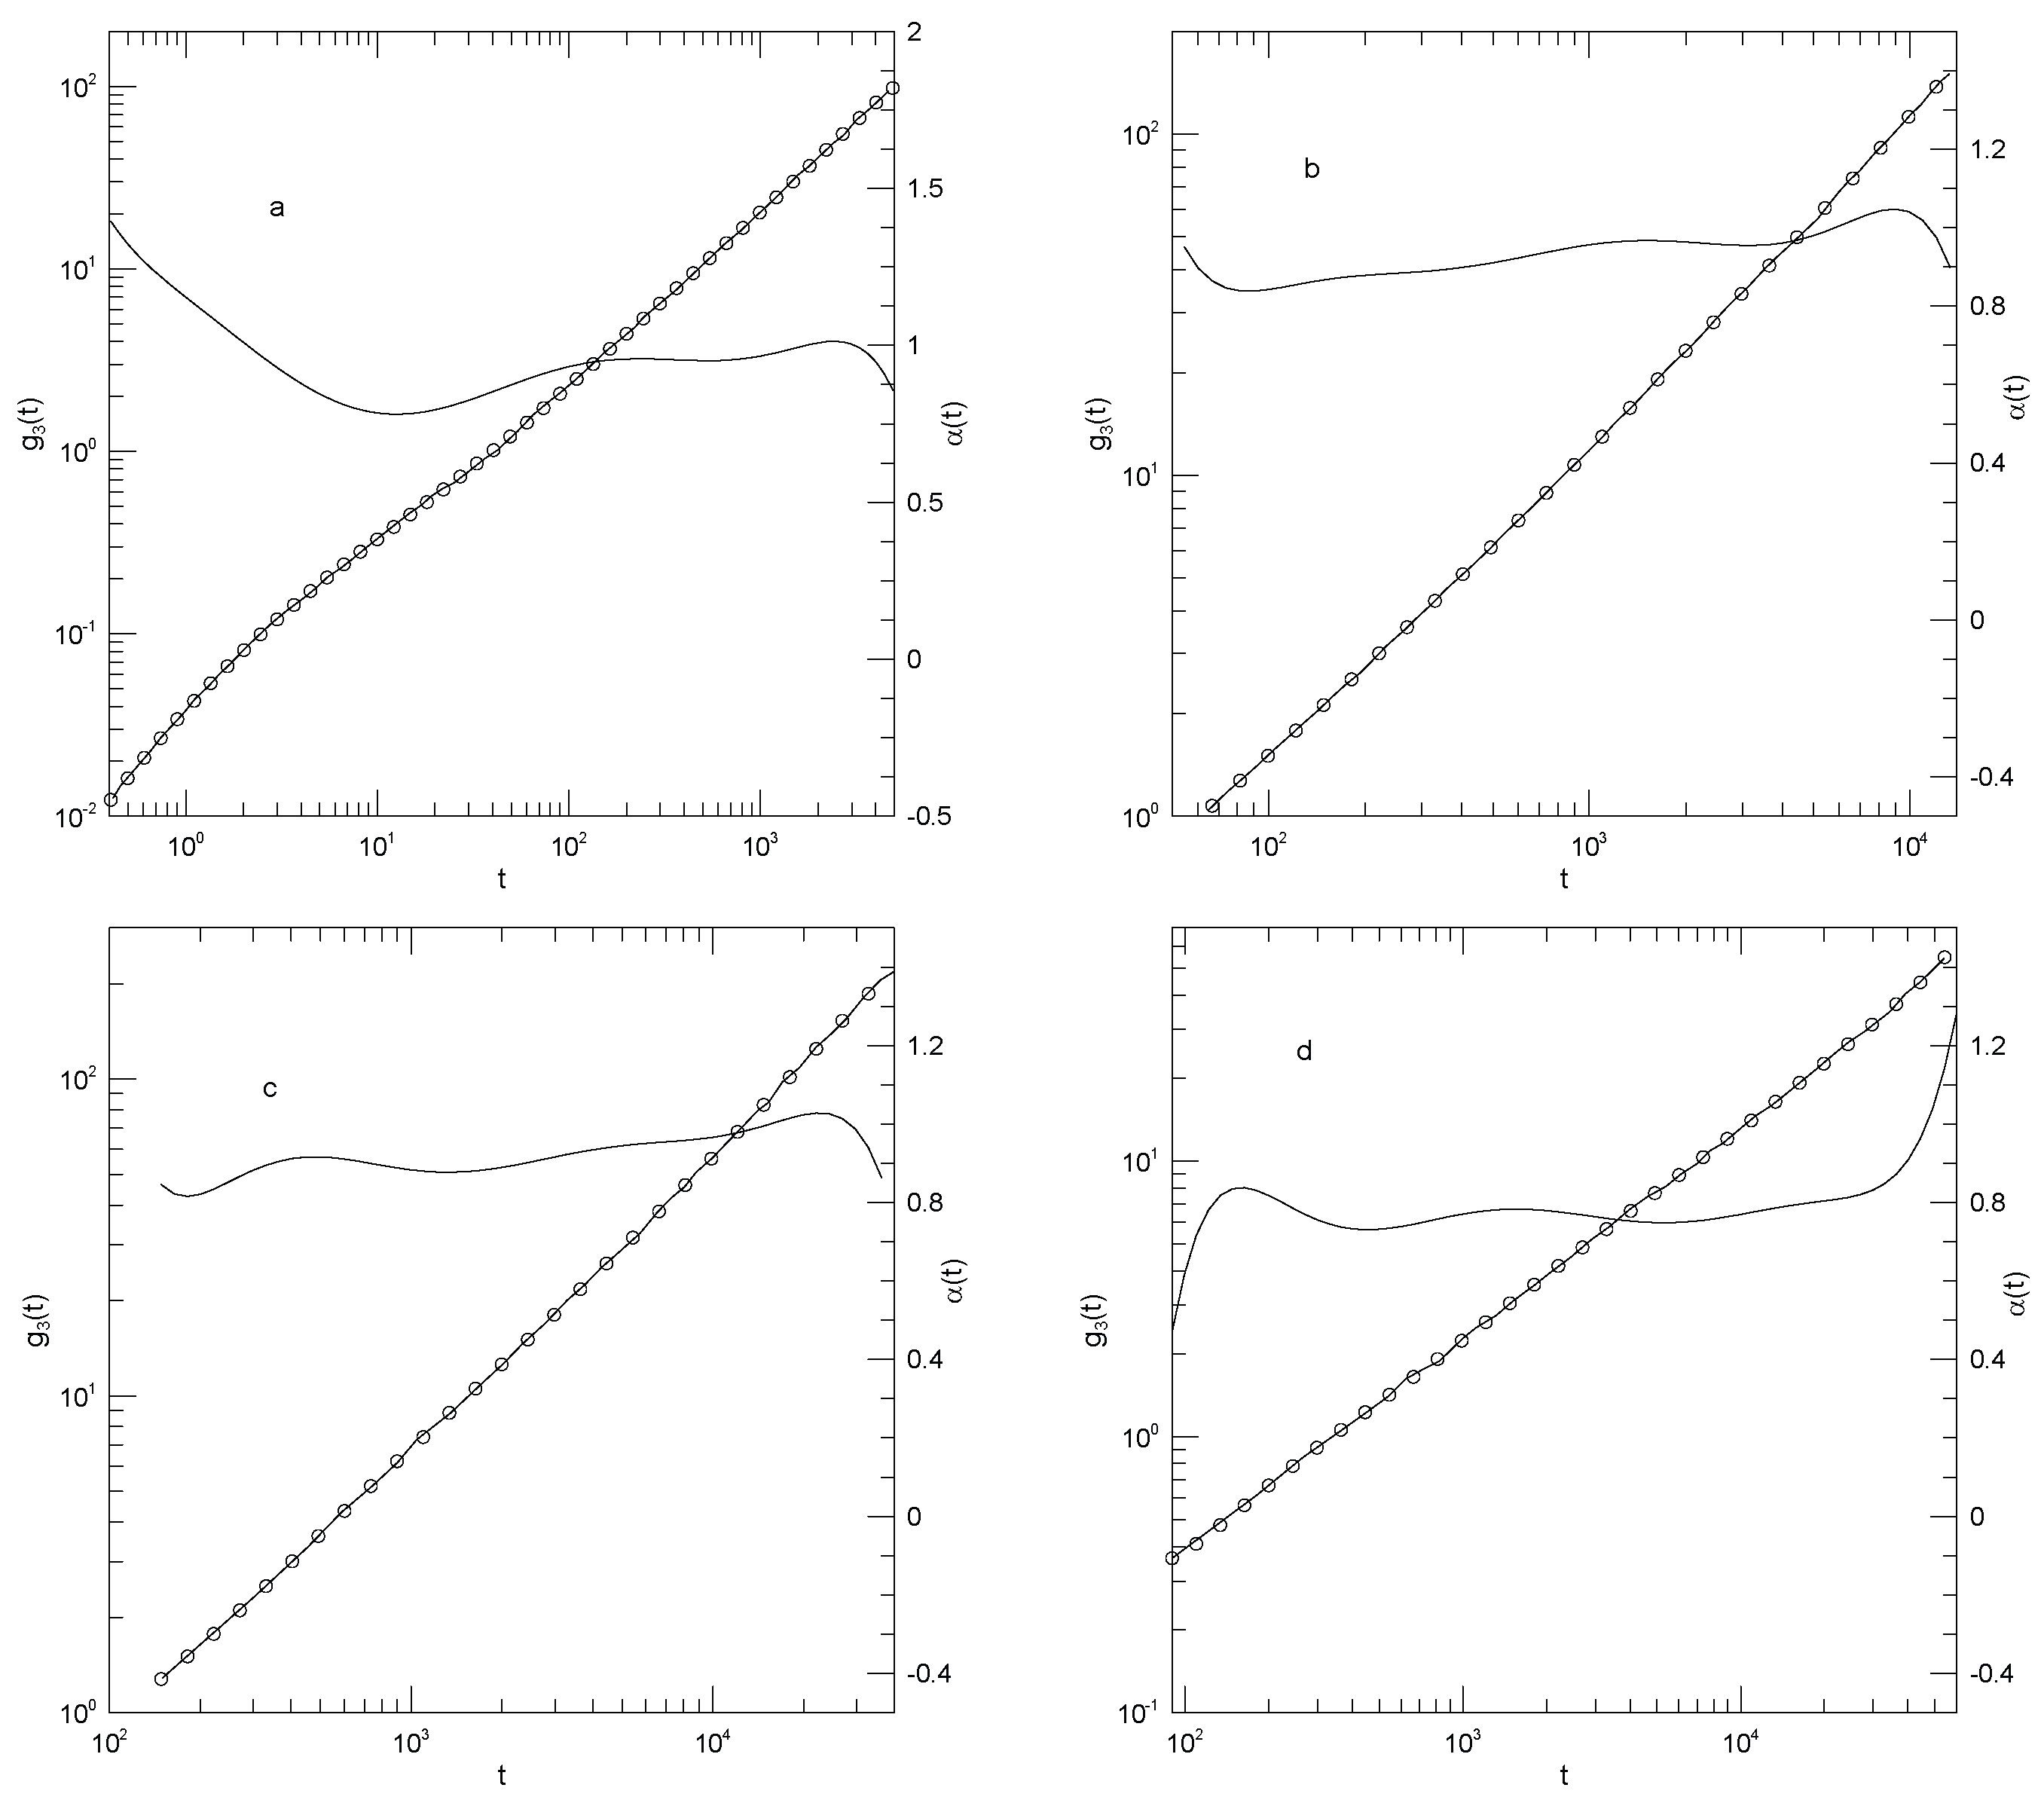
Figure 5.
Mean-square displacements (thick lines) of the light chains in a 50:50 light-heavy polymer blend of Kremer-Grest bead-spring chains, based on simulations of Kopf, et al.,[23], together with fits to eighth-order polynomials (circles), and the corresponding first logarithmic derivatives (thin lines). All chains had ; the light chains had . Figures show (a,c) , (b,d) , (a,b) heavy chains, and (c,d) heavy chains.
Figure 5.
Mean-square displacements (thick lines) of the light chains in a 50:50 light-heavy polymer blend of Kremer-Grest bead-spring chains, based on simulations of Kopf, et al.,[23], together with fits to eighth-order polynomials (circles), and the corresponding first logarithmic derivatives (thin lines). All chains had ; the light chains had . Figures show (a,c) , (b,d) , (a,b) heavy chains, and (c,d) heavy chains.
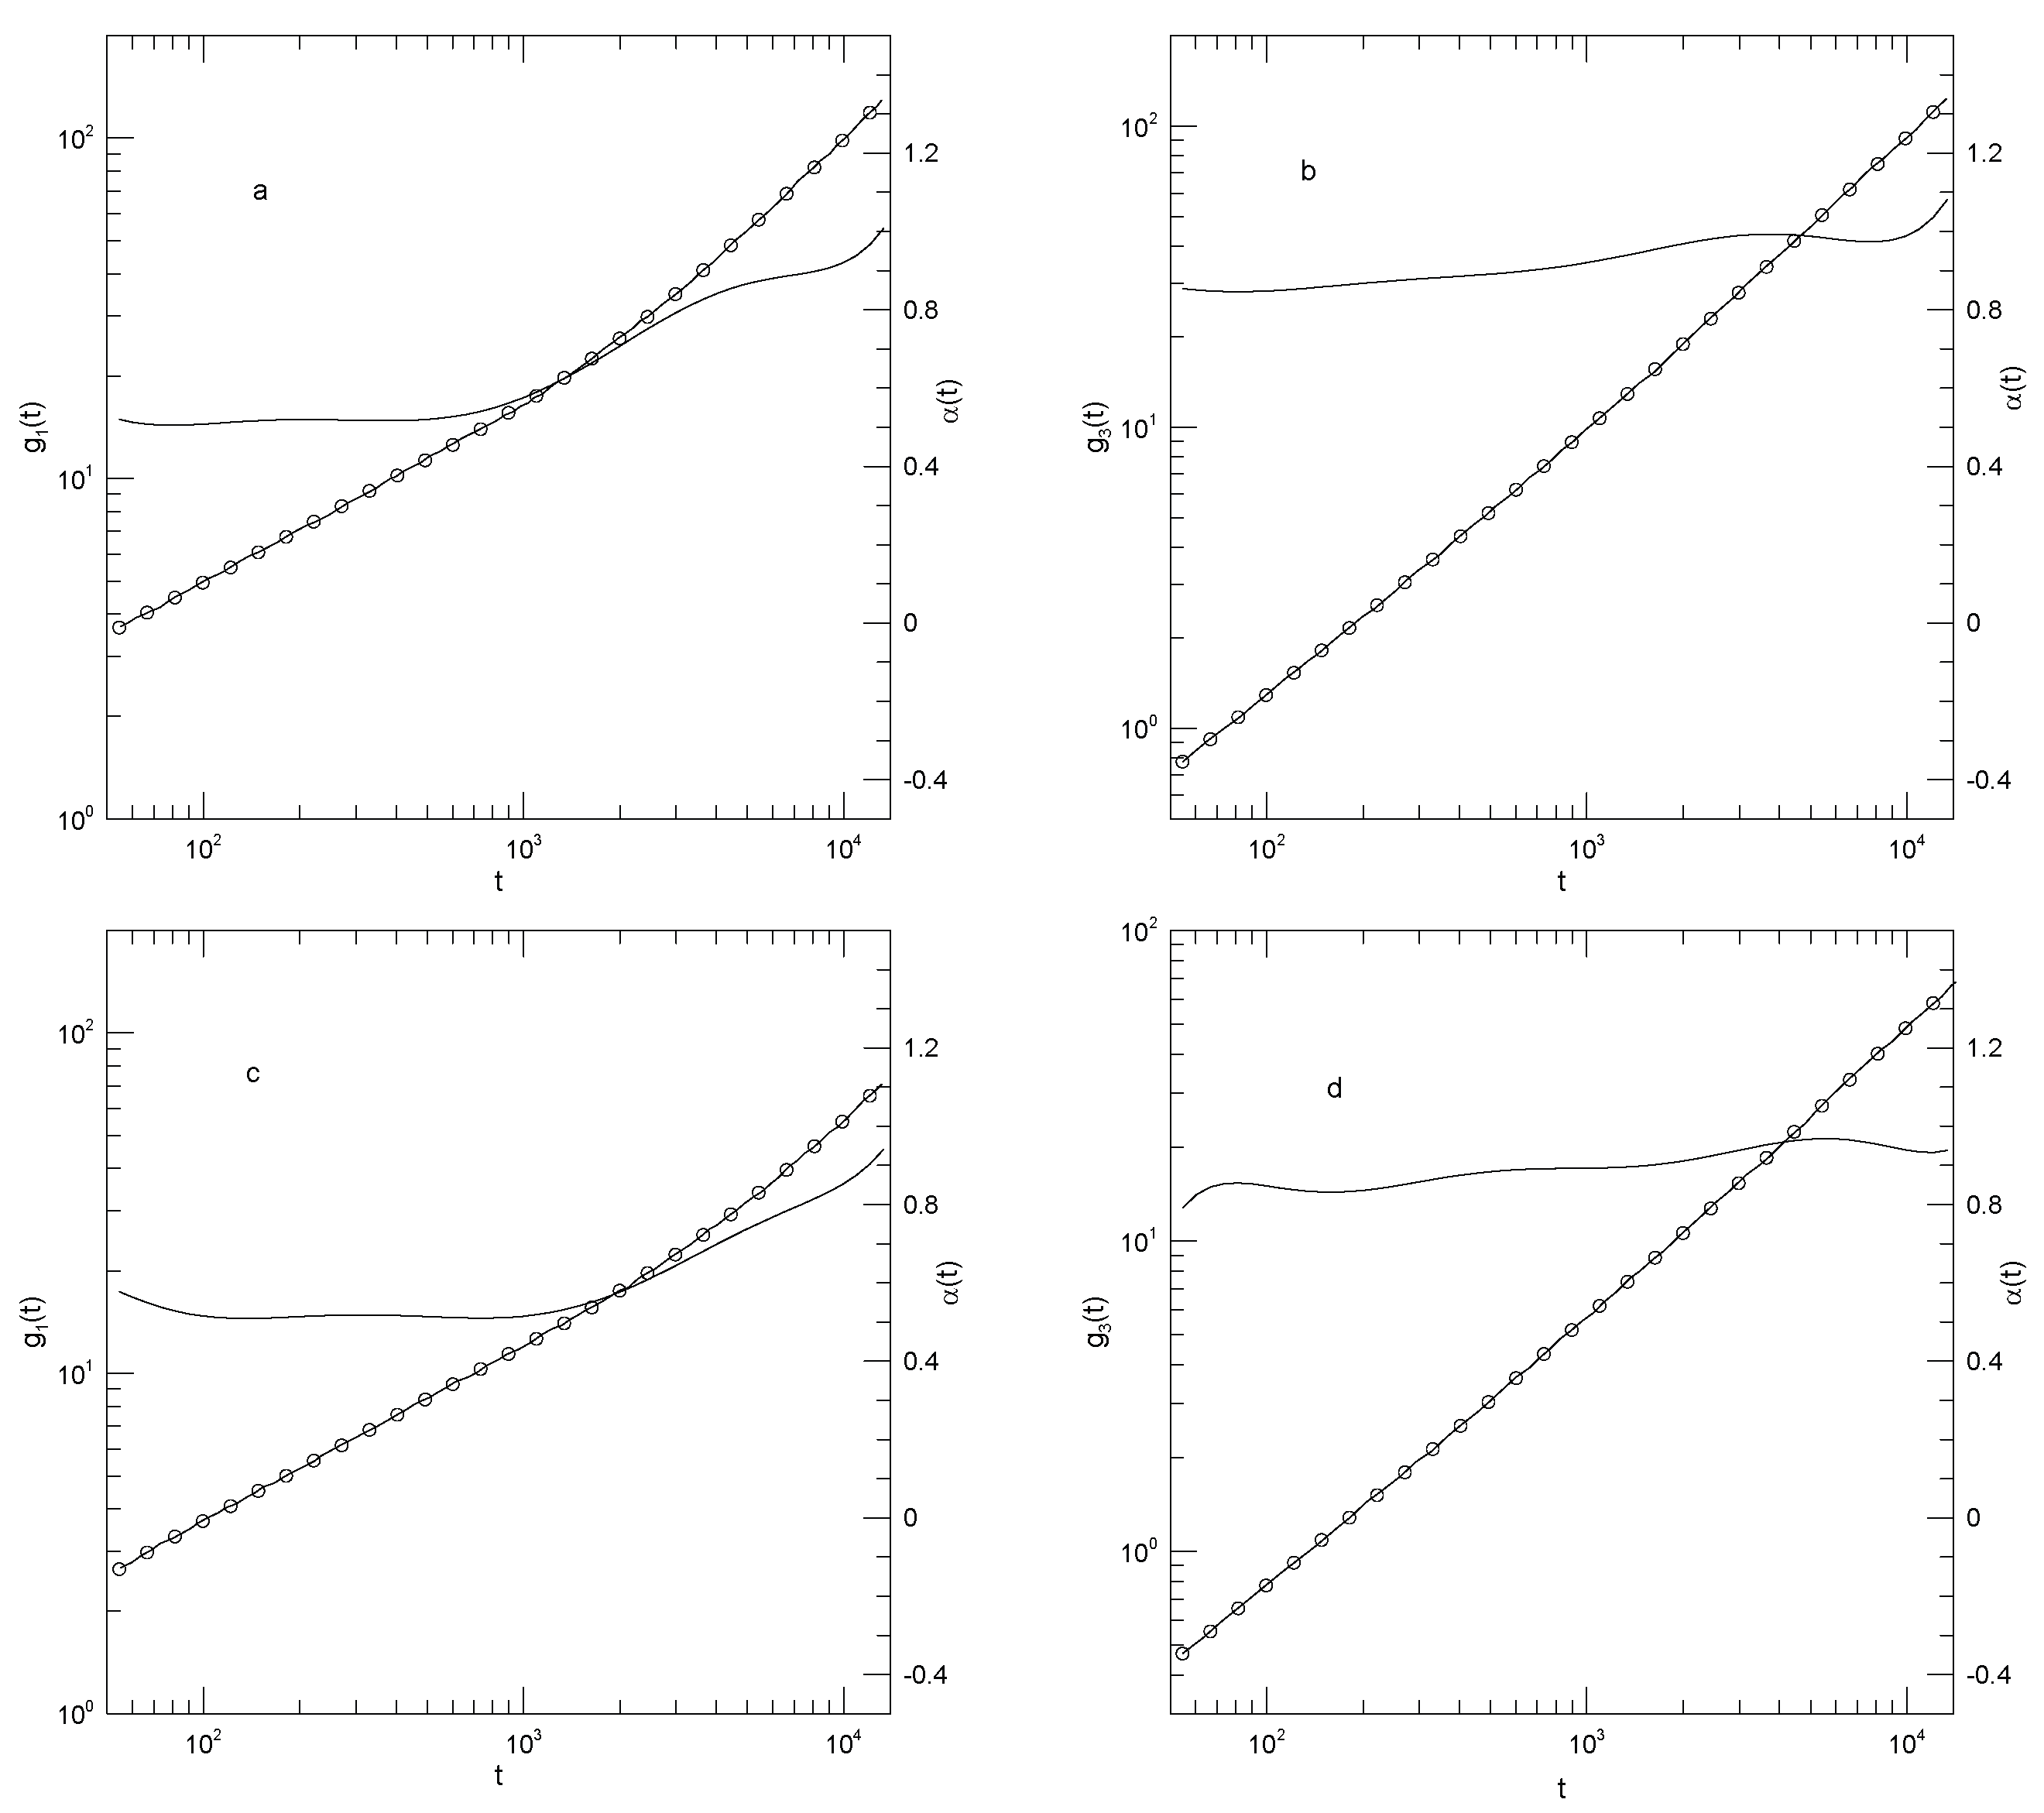
Figure 6.
Mean-square displacements (thick lines) of the heavy chains in a 50:50 light-heavy polymer blend of Kremer-Grest bead-spring chains, based on simulations of Kopf, et al.,[23], together with fits to eighth-order polynomials (circles), and the corresponding first logarithmic derivatives (thin lines). All chains had ; the light chains had . Figures show (a,c) , (b,d) , (a,b) heavy chains, and (c,d) heavy chains.
Figure 6.
Mean-square displacements (thick lines) of the heavy chains in a 50:50 light-heavy polymer blend of Kremer-Grest bead-spring chains, based on simulations of Kopf, et al.,[23], together with fits to eighth-order polynomials (circles), and the corresponding first logarithmic derivatives (thin lines). All chains had ; the light chains had . Figures show (a,c) , (b,d) , (a,b) heavy chains, and (c,d) heavy chains.
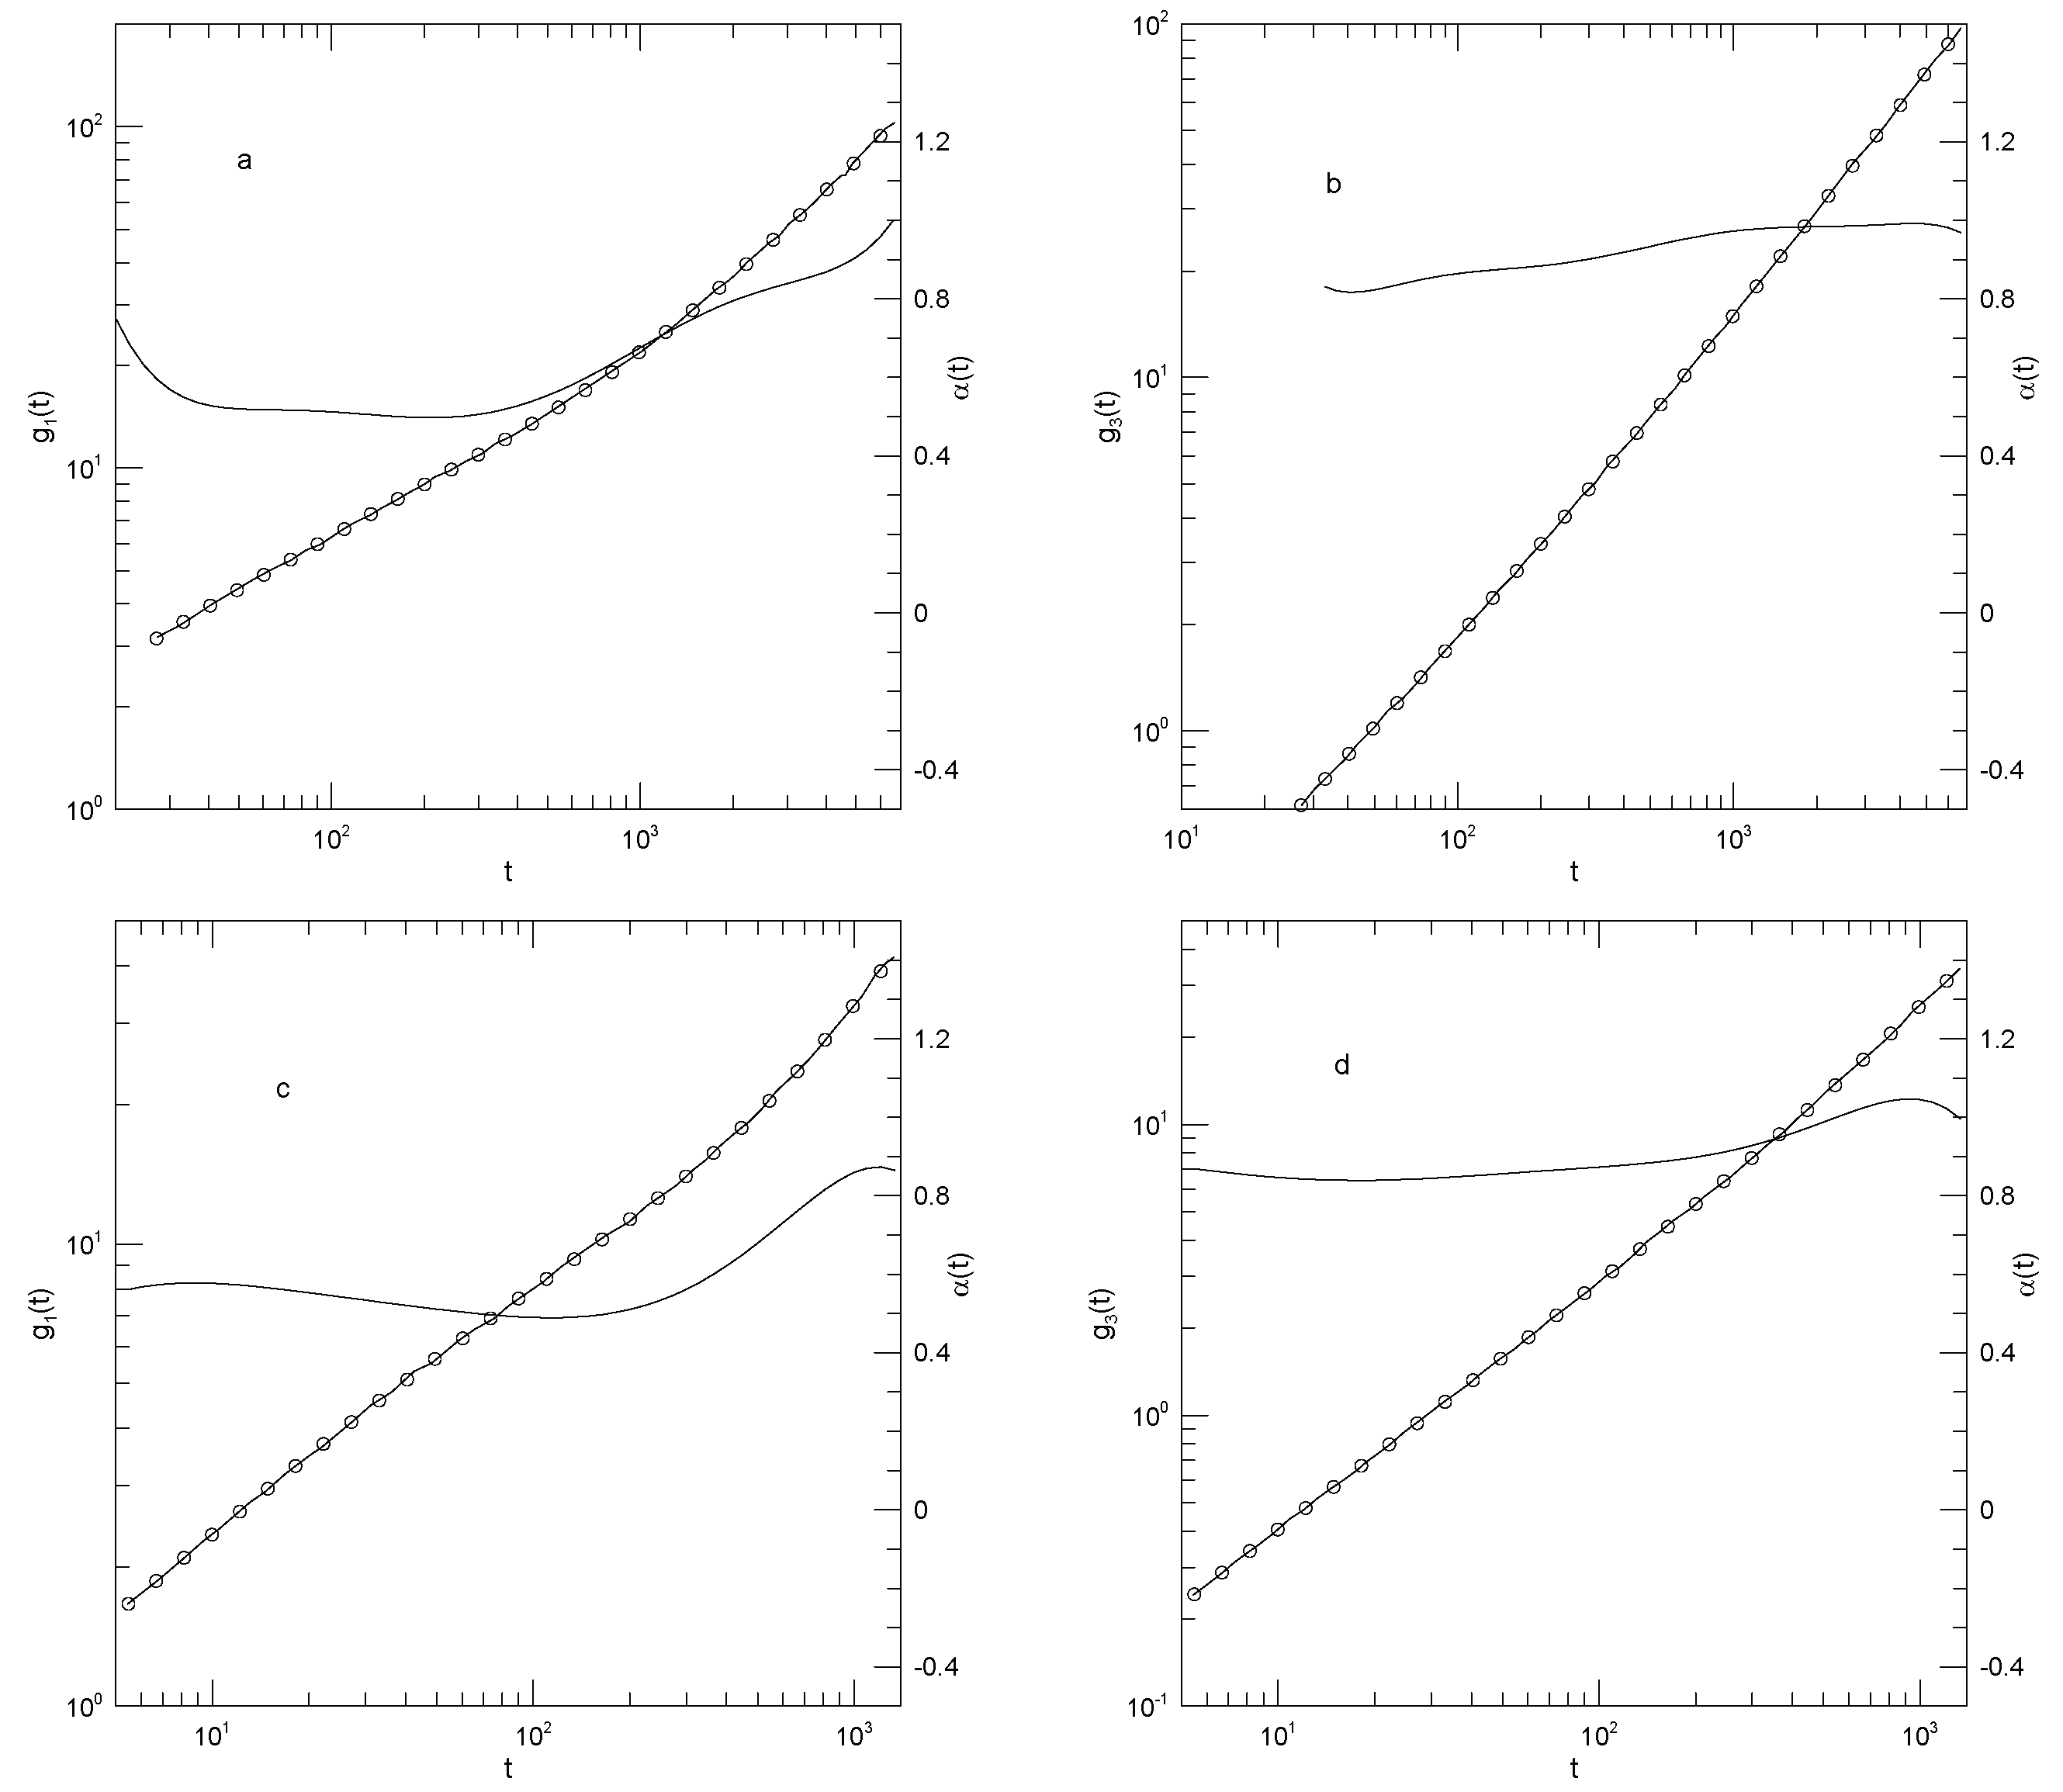
Figure 7.
Mean-square single-bead displacements (thick lines) of 350-bead Kremer-Grest bead-spring chains dissolved in melts of (a) 25-, (b) 50-, (c) 80-, or (d) 160-bead bead-spring polymers, based on simulations of Wang and Larson[24], together with fits to eighth-order polynomials (circles), and the corresponding first logarithmic derivatives (thin lines).
Figure 7.
Mean-square single-bead displacements (thick lines) of 350-bead Kremer-Grest bead-spring chains dissolved in melts of (a) 25-, (b) 50-, (c) 80-, or (d) 160-bead bead-spring polymers, based on simulations of Wang and Larson[24], together with fits to eighth-order polynomials (circles), and the corresponding first logarithmic derivatives (thin lines).
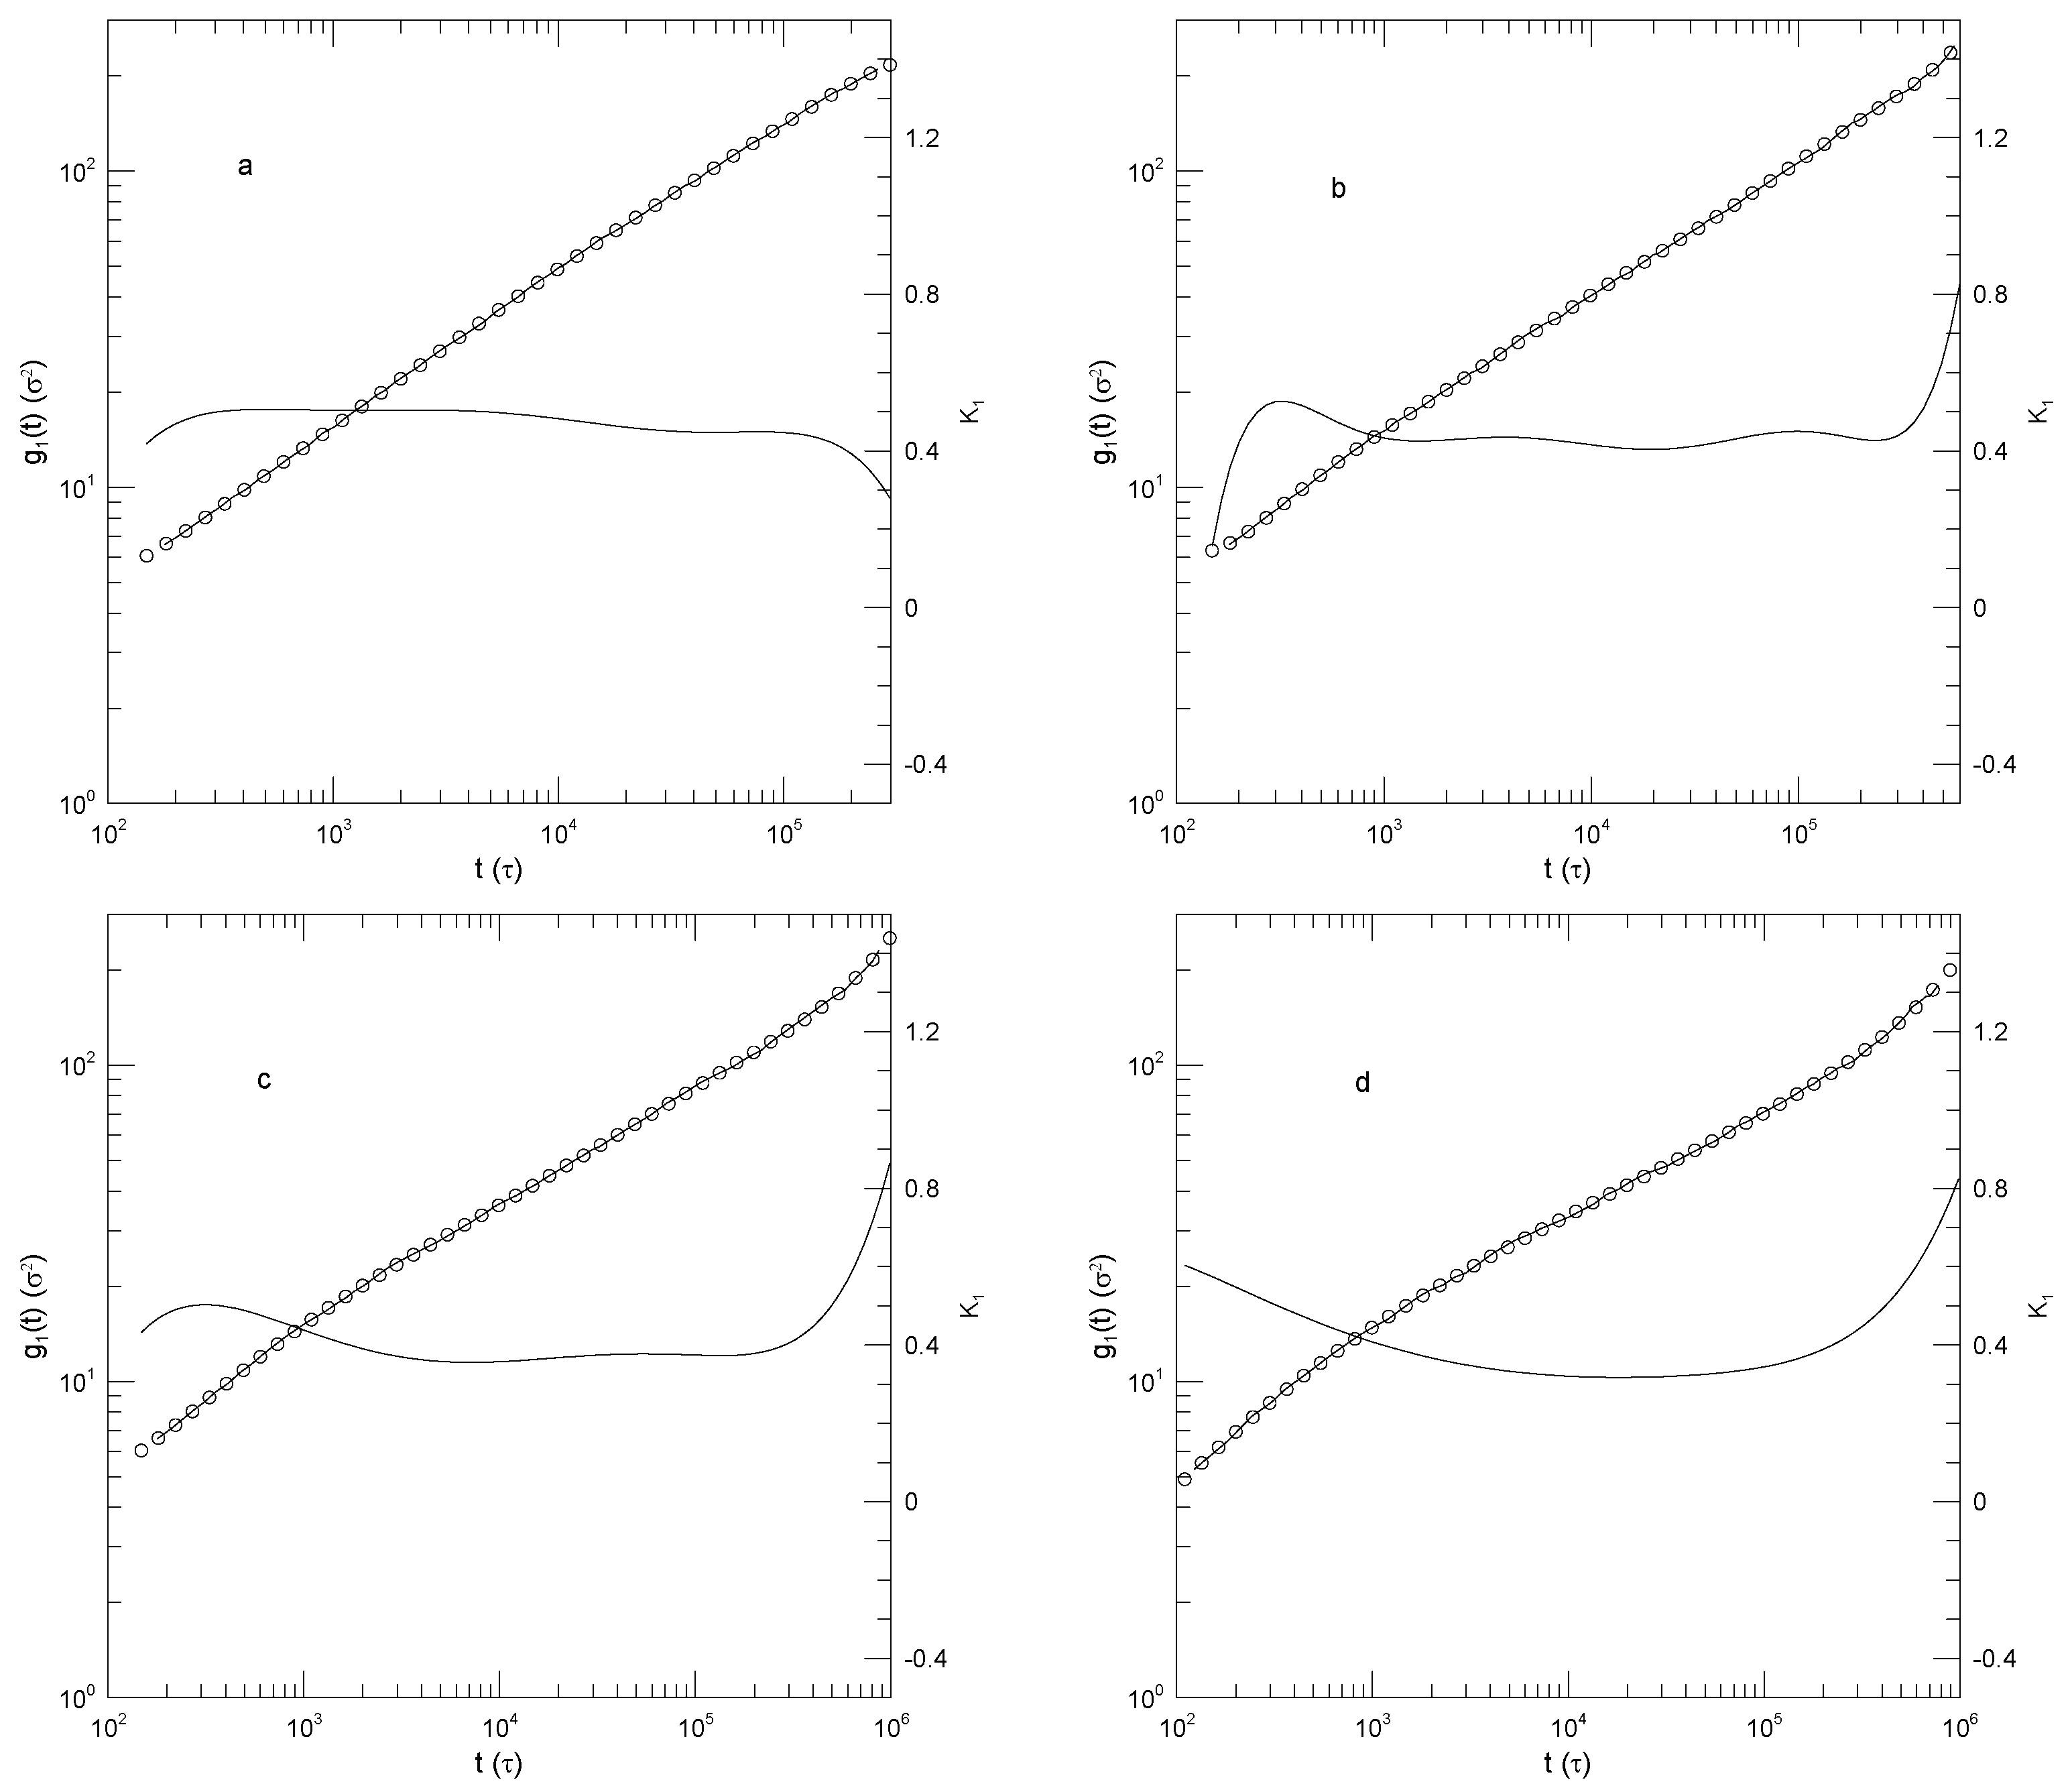
Figure 8.
Mean-square single-bead displacements relative to chain centers of mass (thick lines) of 350-bead Kremer-Grest bead-spring chains dissolved in melts of (a) 25-, (b) 50-, (c) 80-, or (d) 160-bead bead-spring polymers, based on simulations of Wang and Larson[24], together with fits to eighth-order polynomials (circles), and the corresponding first logarithmic derivatives (thin lines).
Figure 8.
Mean-square single-bead displacements relative to chain centers of mass (thick lines) of 350-bead Kremer-Grest bead-spring chains dissolved in melts of (a) 25-, (b) 50-, (c) 80-, or (d) 160-bead bead-spring polymers, based on simulations of Wang and Larson[24], together with fits to eighth-order polynomials (circles), and the corresponding first logarithmic derivatives (thin lines).
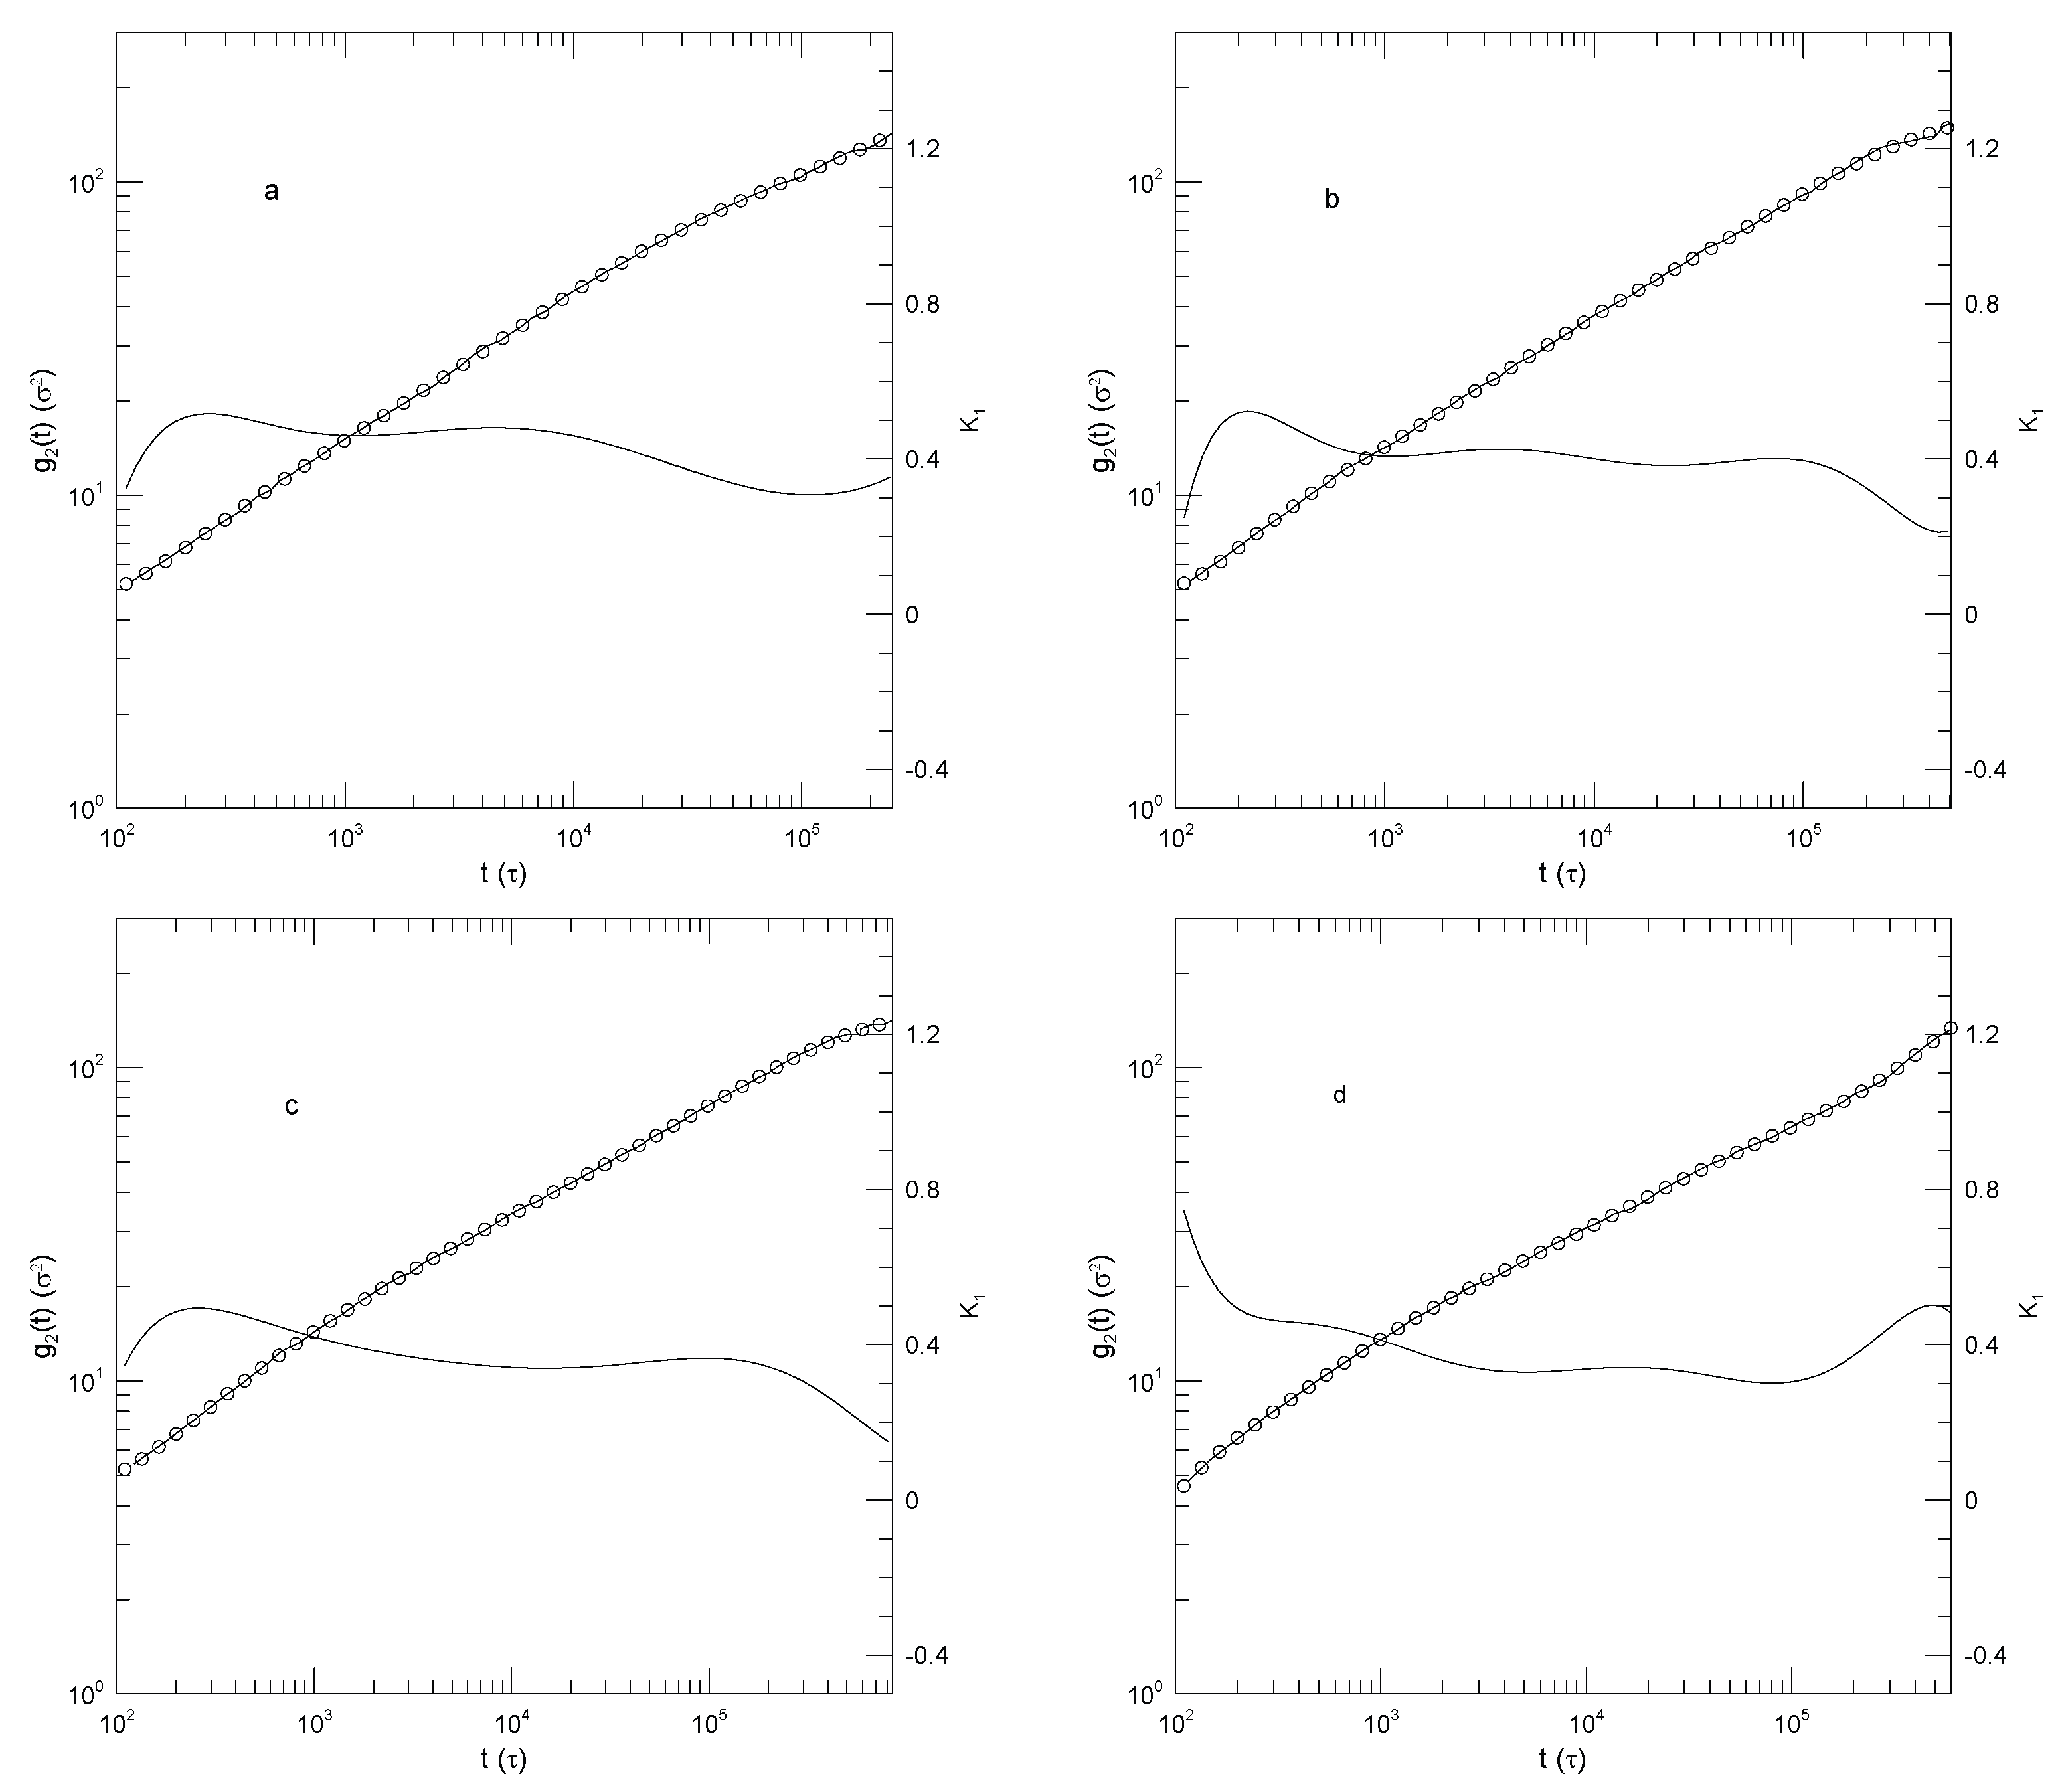
Figure 9.
Mean-square single-bead displacements relative to chain centers of mass (thick lines) of (a) 80-, (b) 50-, and (c) 25-bead bead-spring Kremer-Grest bead-spring polymers in their own melts, each diluted with volume fraction of a 350-bead polymer having the same potential energy parameters, based on simulations of Wang and Larson[24]. The figures also show fits to eighth-order polynomials (circles), and the corresponding first logarithmic derivatives (thin lines).
Figure 9.
Mean-square single-bead displacements relative to chain centers of mass (thick lines) of (a) 80-, (b) 50-, and (c) 25-bead bead-spring Kremer-Grest bead-spring polymers in their own melts, each diluted with volume fraction of a 350-bead polymer having the same potential energy parameters, based on simulations of Wang and Larson[24]. The figures also show fits to eighth-order polynomials (circles), and the corresponding first logarithmic derivatives (thin lines).
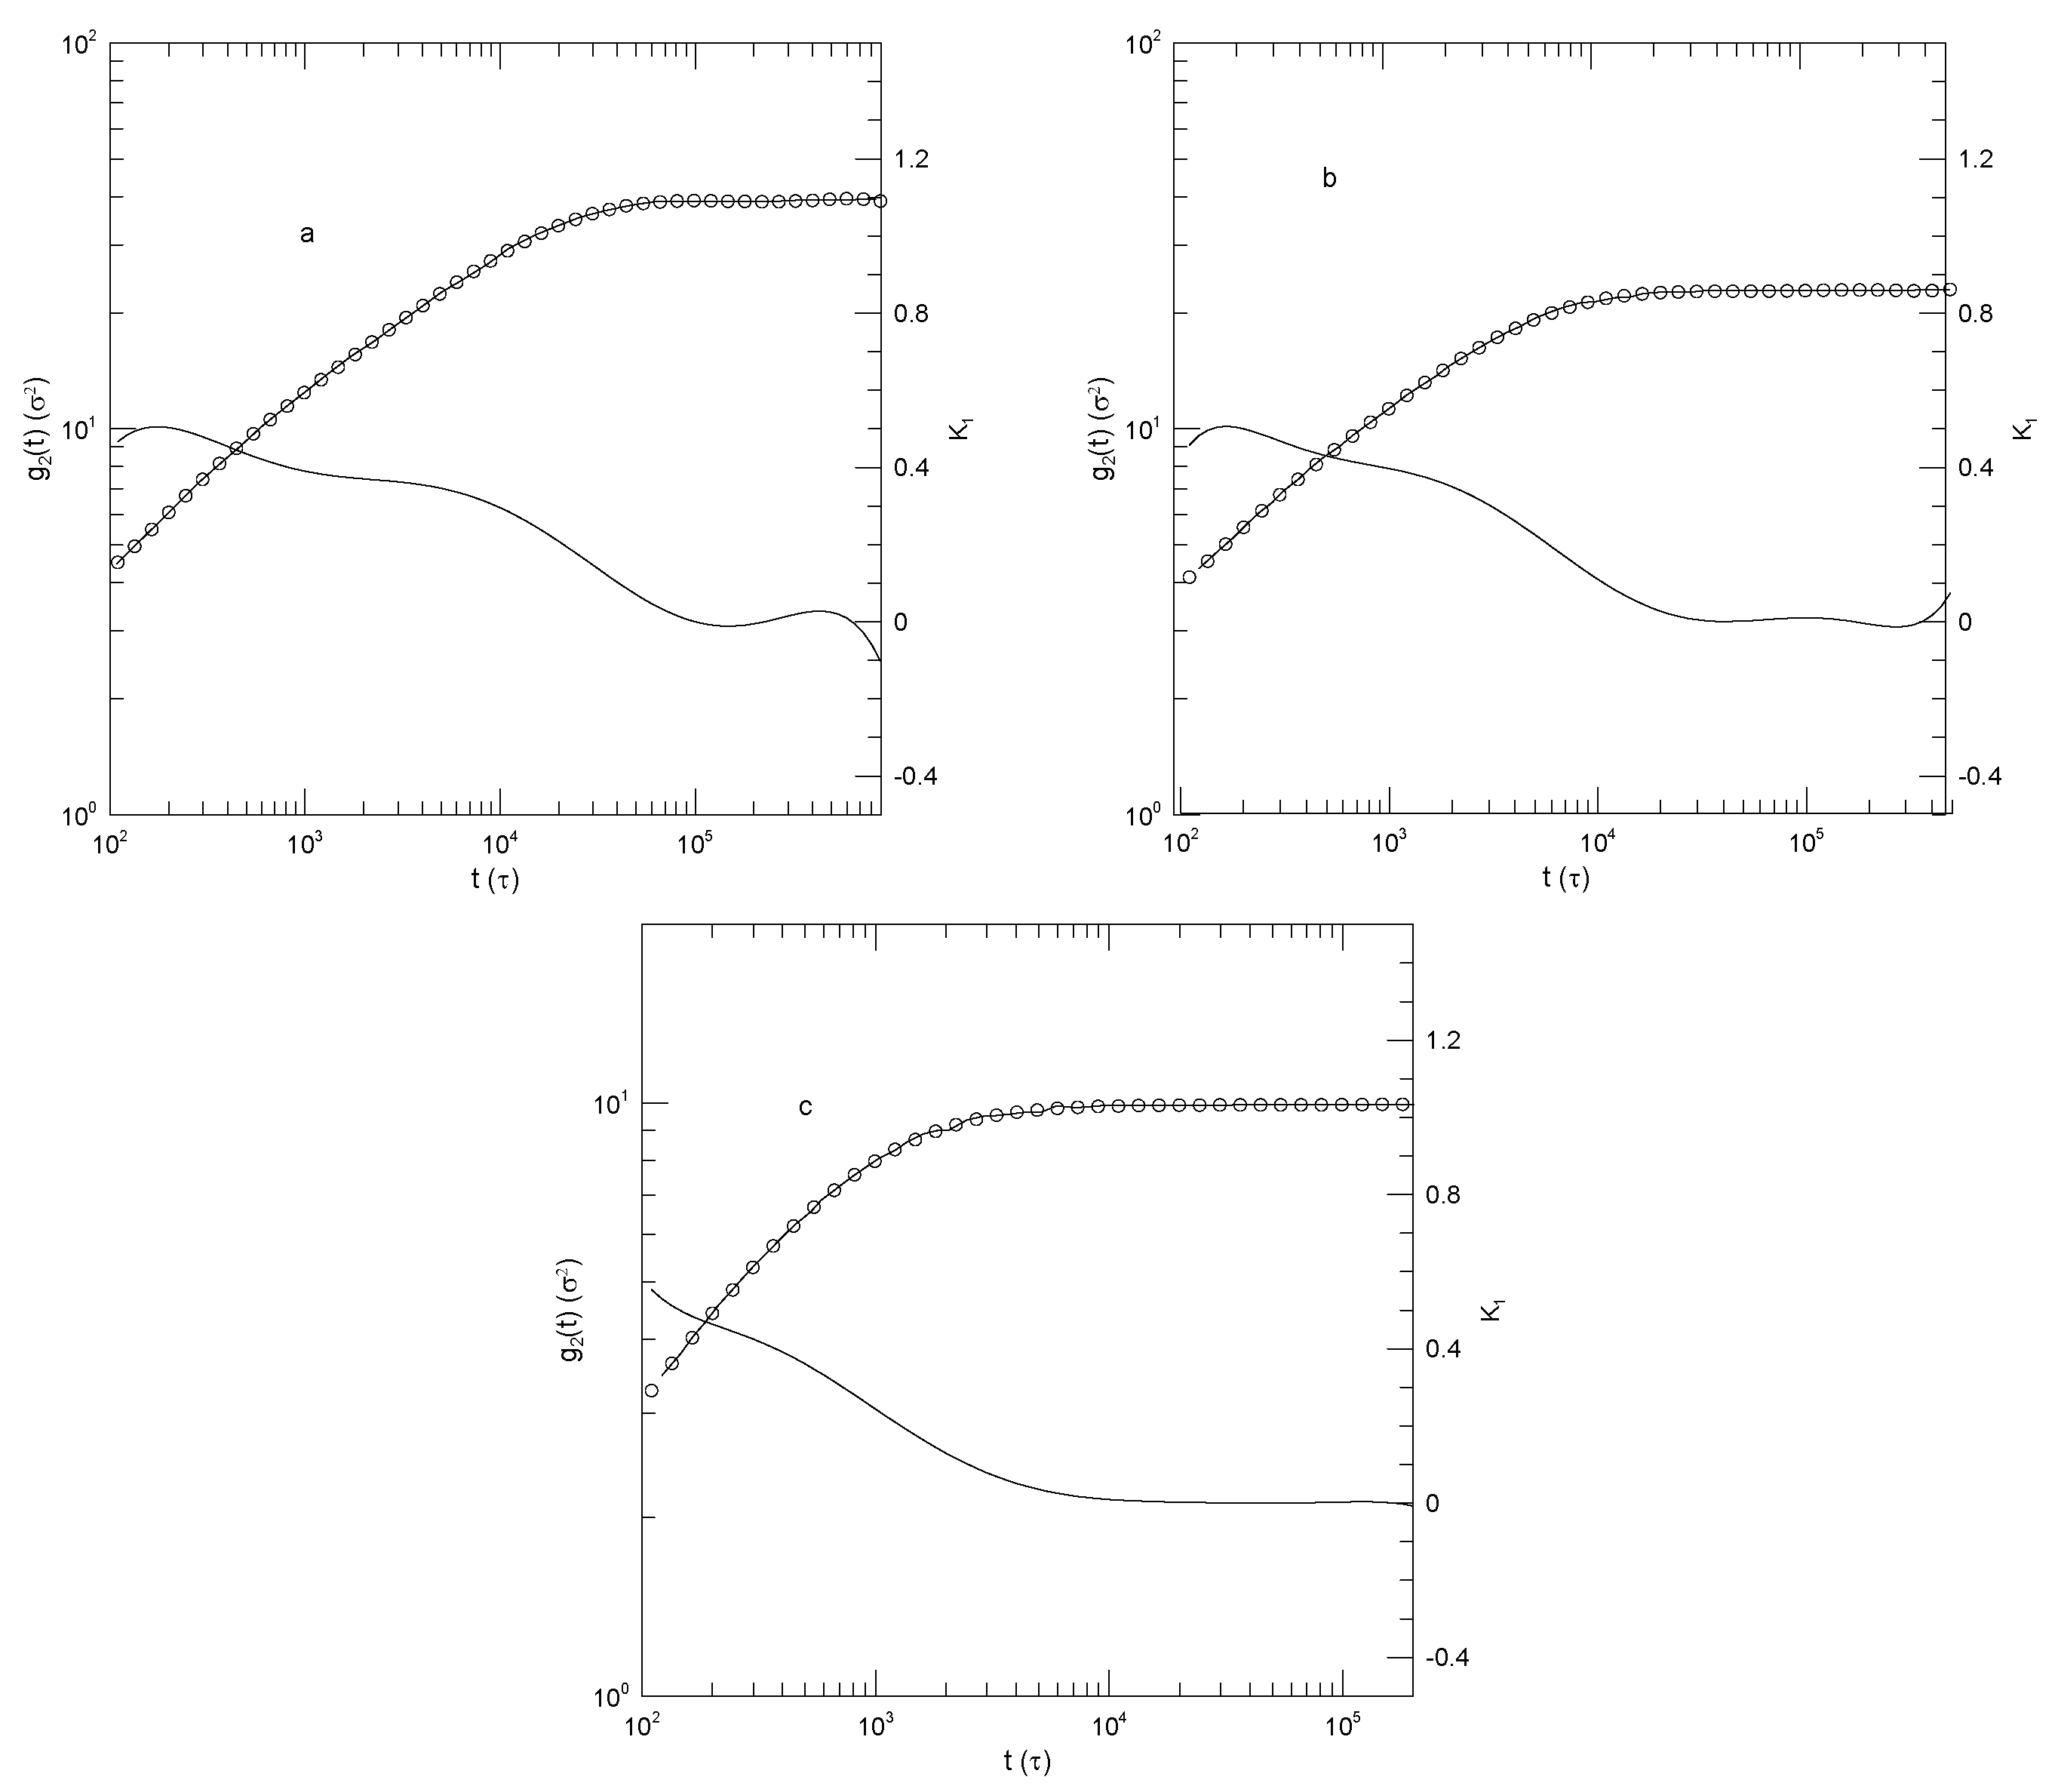
Figure 10.
Mean-square center-of-mass displacements (thick lines) of 350-bead Kremer-Grest bead-spring chains dissolved in melts of (a) 25-, (b) 50-, (c) 80-, or (d) 160-bead bead-spring polymers, based on simulations of Wang and Larson[24], together with fits to eighth-order polynomials (circles), and the corresponding first logarithmic derivatives (thin lines).
Figure 10.
Mean-square center-of-mass displacements (thick lines) of 350-bead Kremer-Grest bead-spring chains dissolved in melts of (a) 25-, (b) 50-, (c) 80-, or (d) 160-bead bead-spring polymers, based on simulations of Wang and Larson[24], together with fits to eighth-order polynomials (circles), and the corresponding first logarithmic derivatives (thin lines).
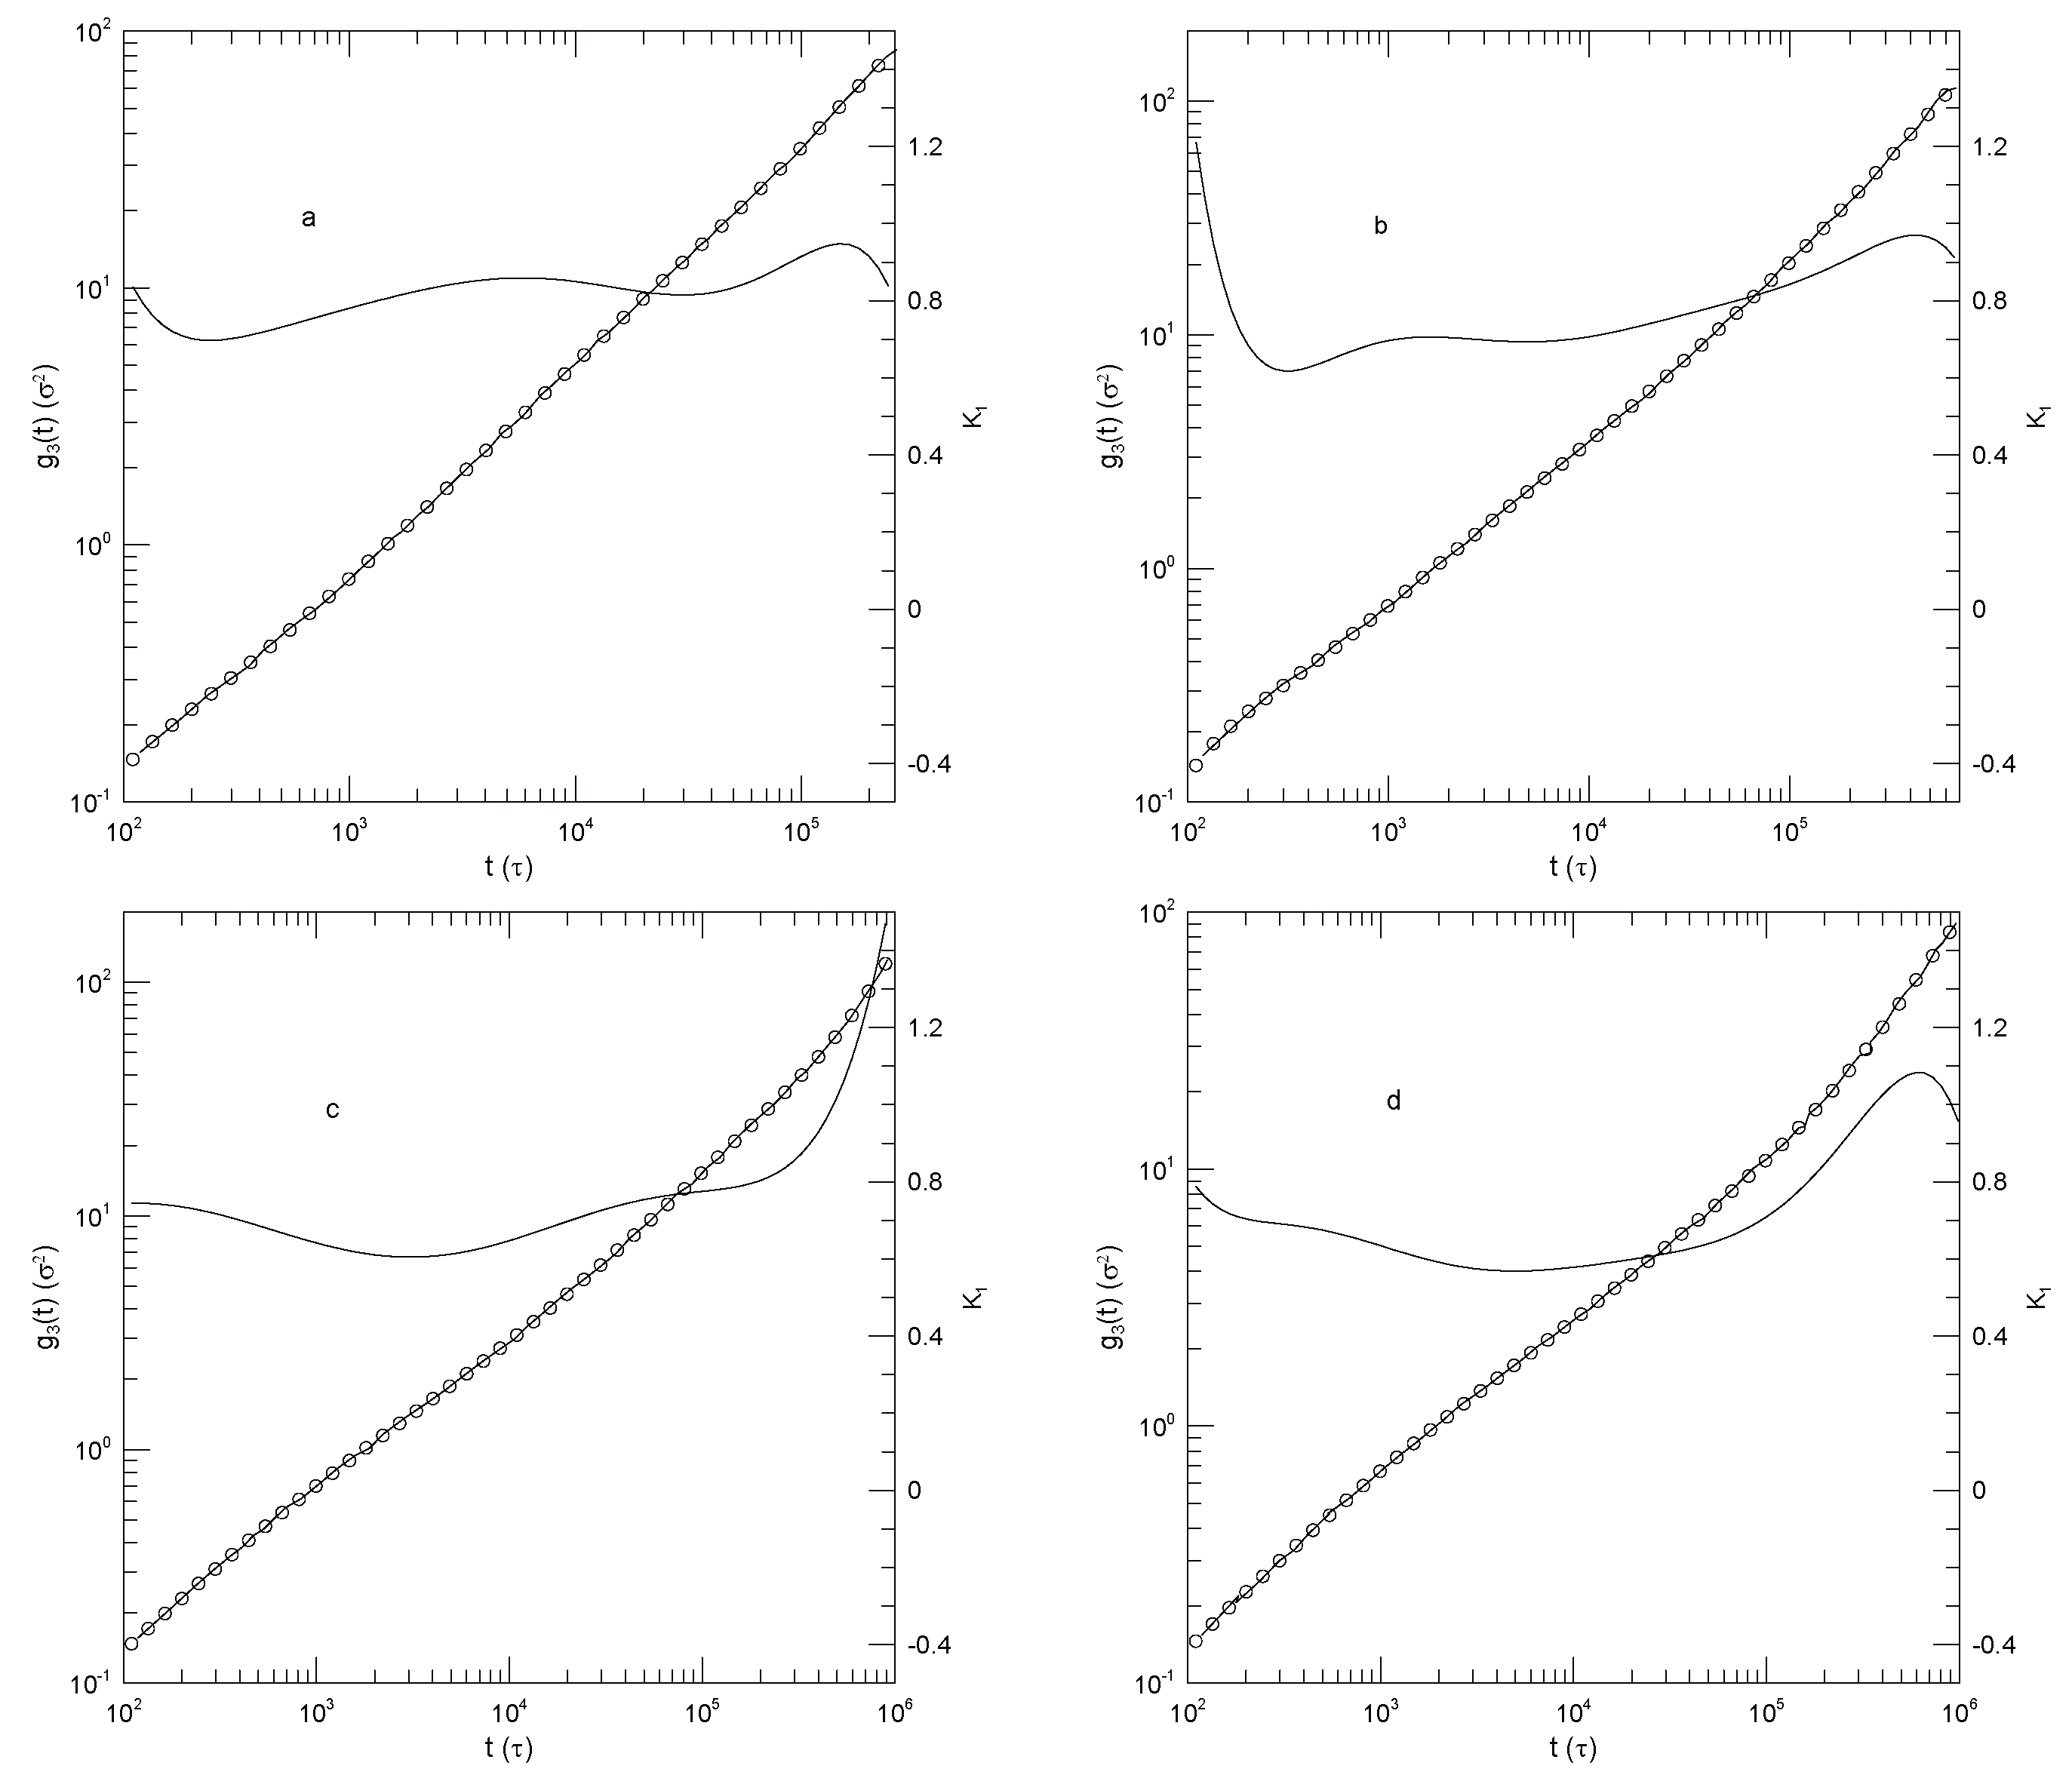
Figure 11.
Mean-square displacements (a) and (b) (thick lines) of monodisperse melts of 350-bead Kremer-Grest bead-spring chains, based on simulations of Wang and Larson[24], together with fits to eighth-order polynomials (circles), and the corresponding first logarithmic derivatives (thin lines).
Figure 11.
Mean-square displacements (a) and (b) (thick lines) of monodisperse melts of 350-bead Kremer-Grest bead-spring chains, based on simulations of Wang and Larson[24], together with fits to eighth-order polynomials (circles), and the corresponding first logarithmic derivatives (thin lines).
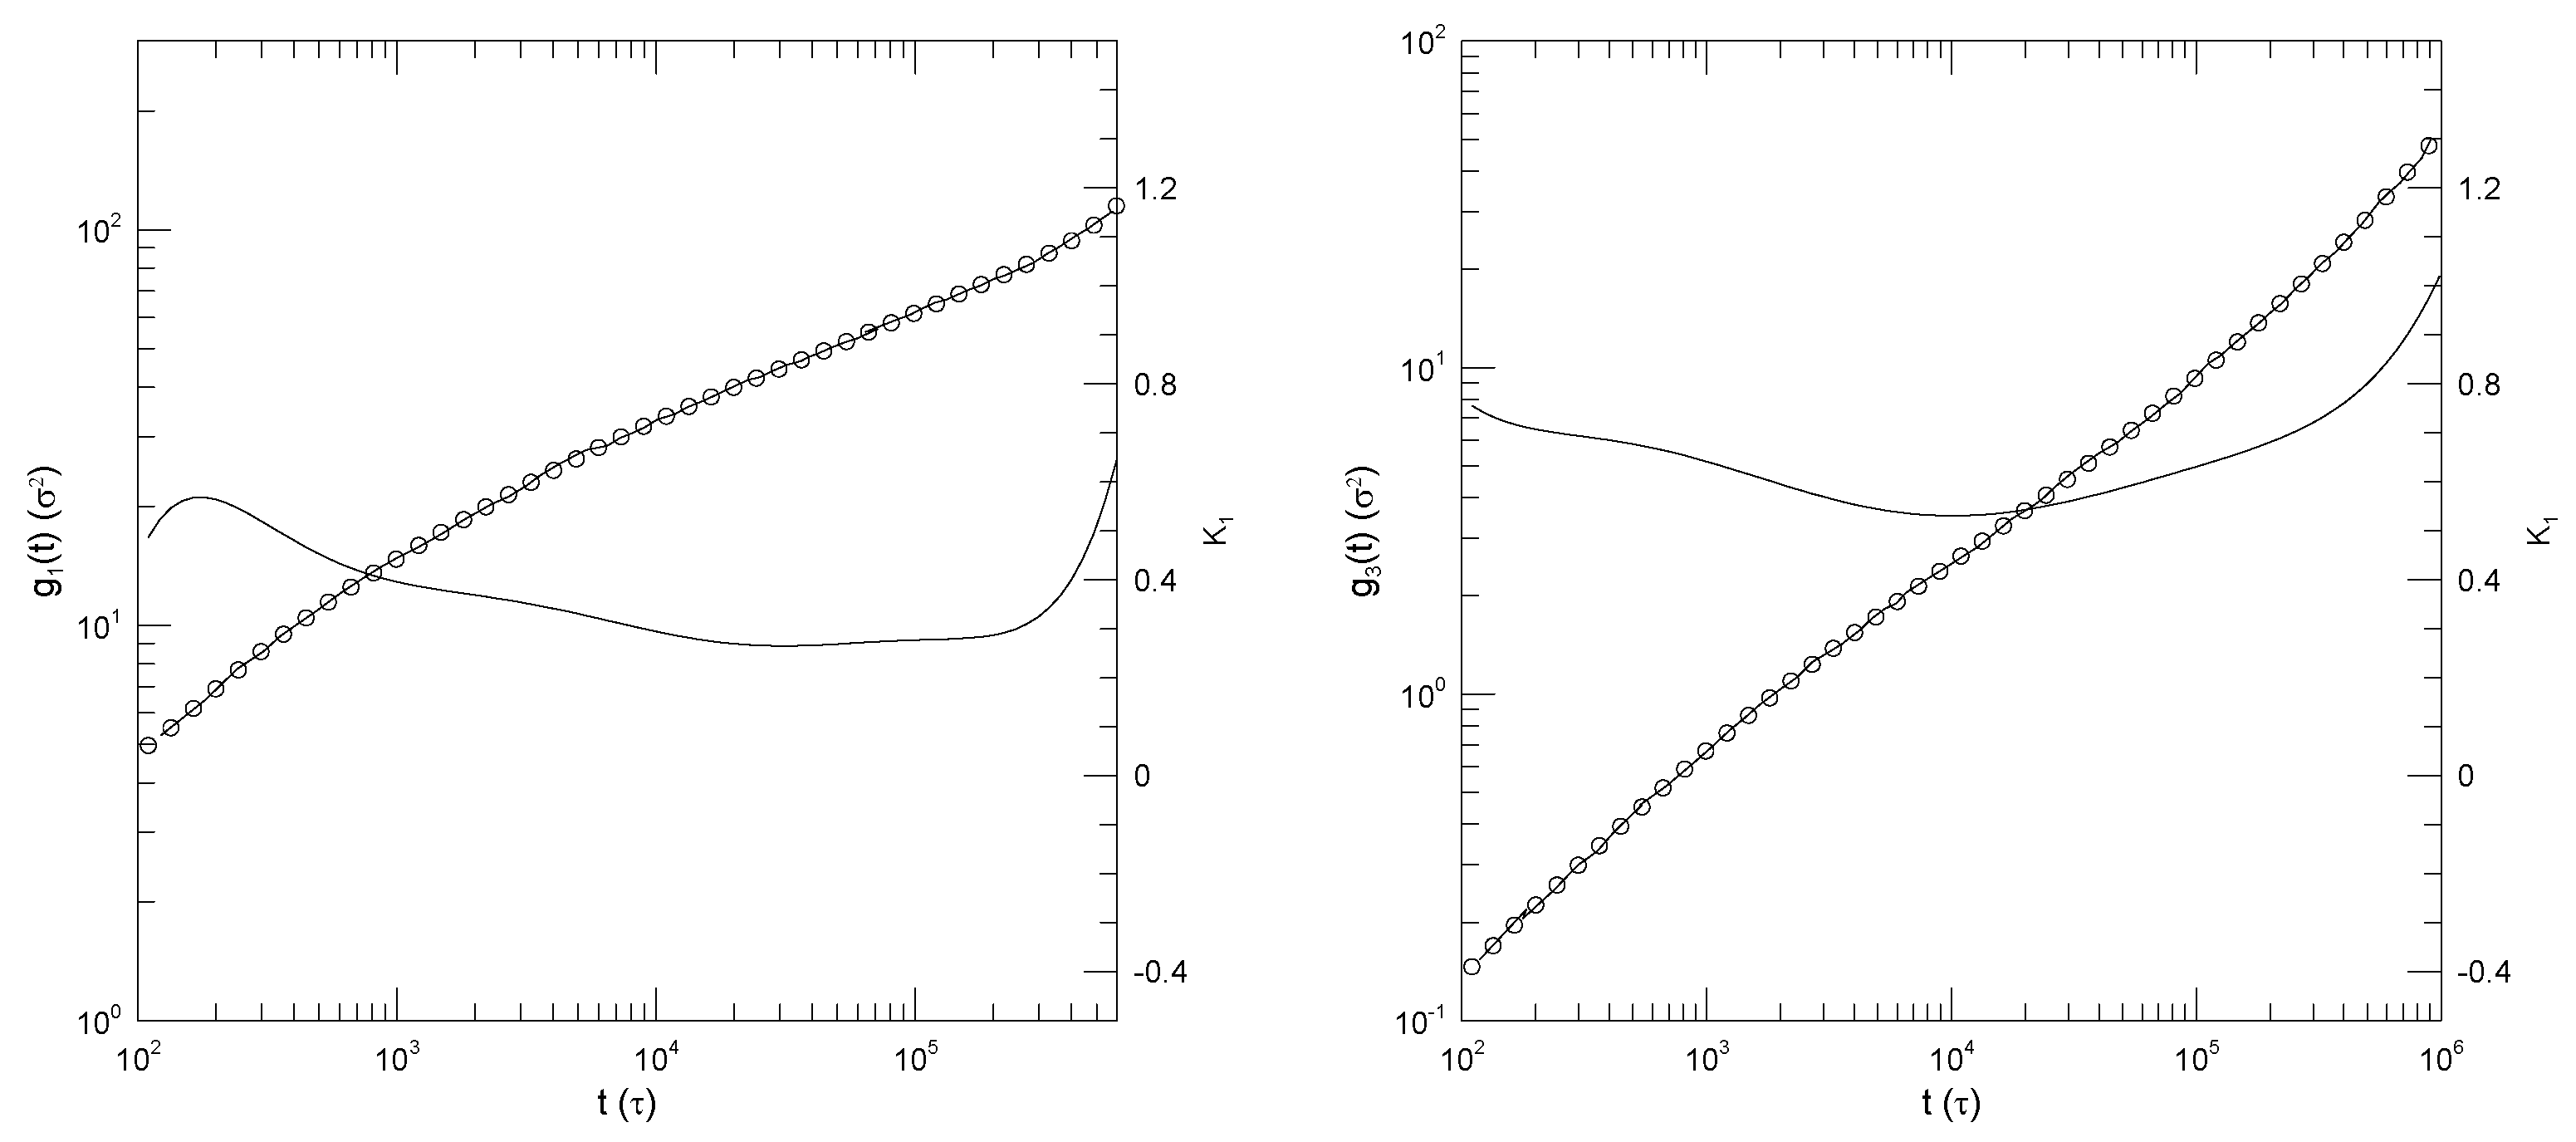
Figure 12.
Mean-square central bead displacements (thick lines) of melts of monodisperse Kremer-Grest bead-spring chains, based on simulations of Adeyemi, et al.,[25], together with fits to eighth-order polynomials (circles) and the corresponding first logarithmic derivatives (thin lines). Chains contained (a) 25, (b) 50, (c) 100, or (d) 350 beads. Note the long-time behavior seen in Figure 12a, namely a decrease in at long times. This behavior is a mathematical artifact. The fitted curve (circles) has been extrapolated beyond the limits of the data.
Figure 12.
Mean-square central bead displacements (thick lines) of melts of monodisperse Kremer-Grest bead-spring chains, based on simulations of Adeyemi, et al.,[25], together with fits to eighth-order polynomials (circles) and the corresponding first logarithmic derivatives (thin lines). Chains contained (a) 25, (b) 50, (c) 100, or (d) 350 beads. Note the long-time behavior seen in Figure 12a, namely a decrease in at long times. This behavior is a mathematical artifact. The fitted curve (circles) has been extrapolated beyond the limits of the data.
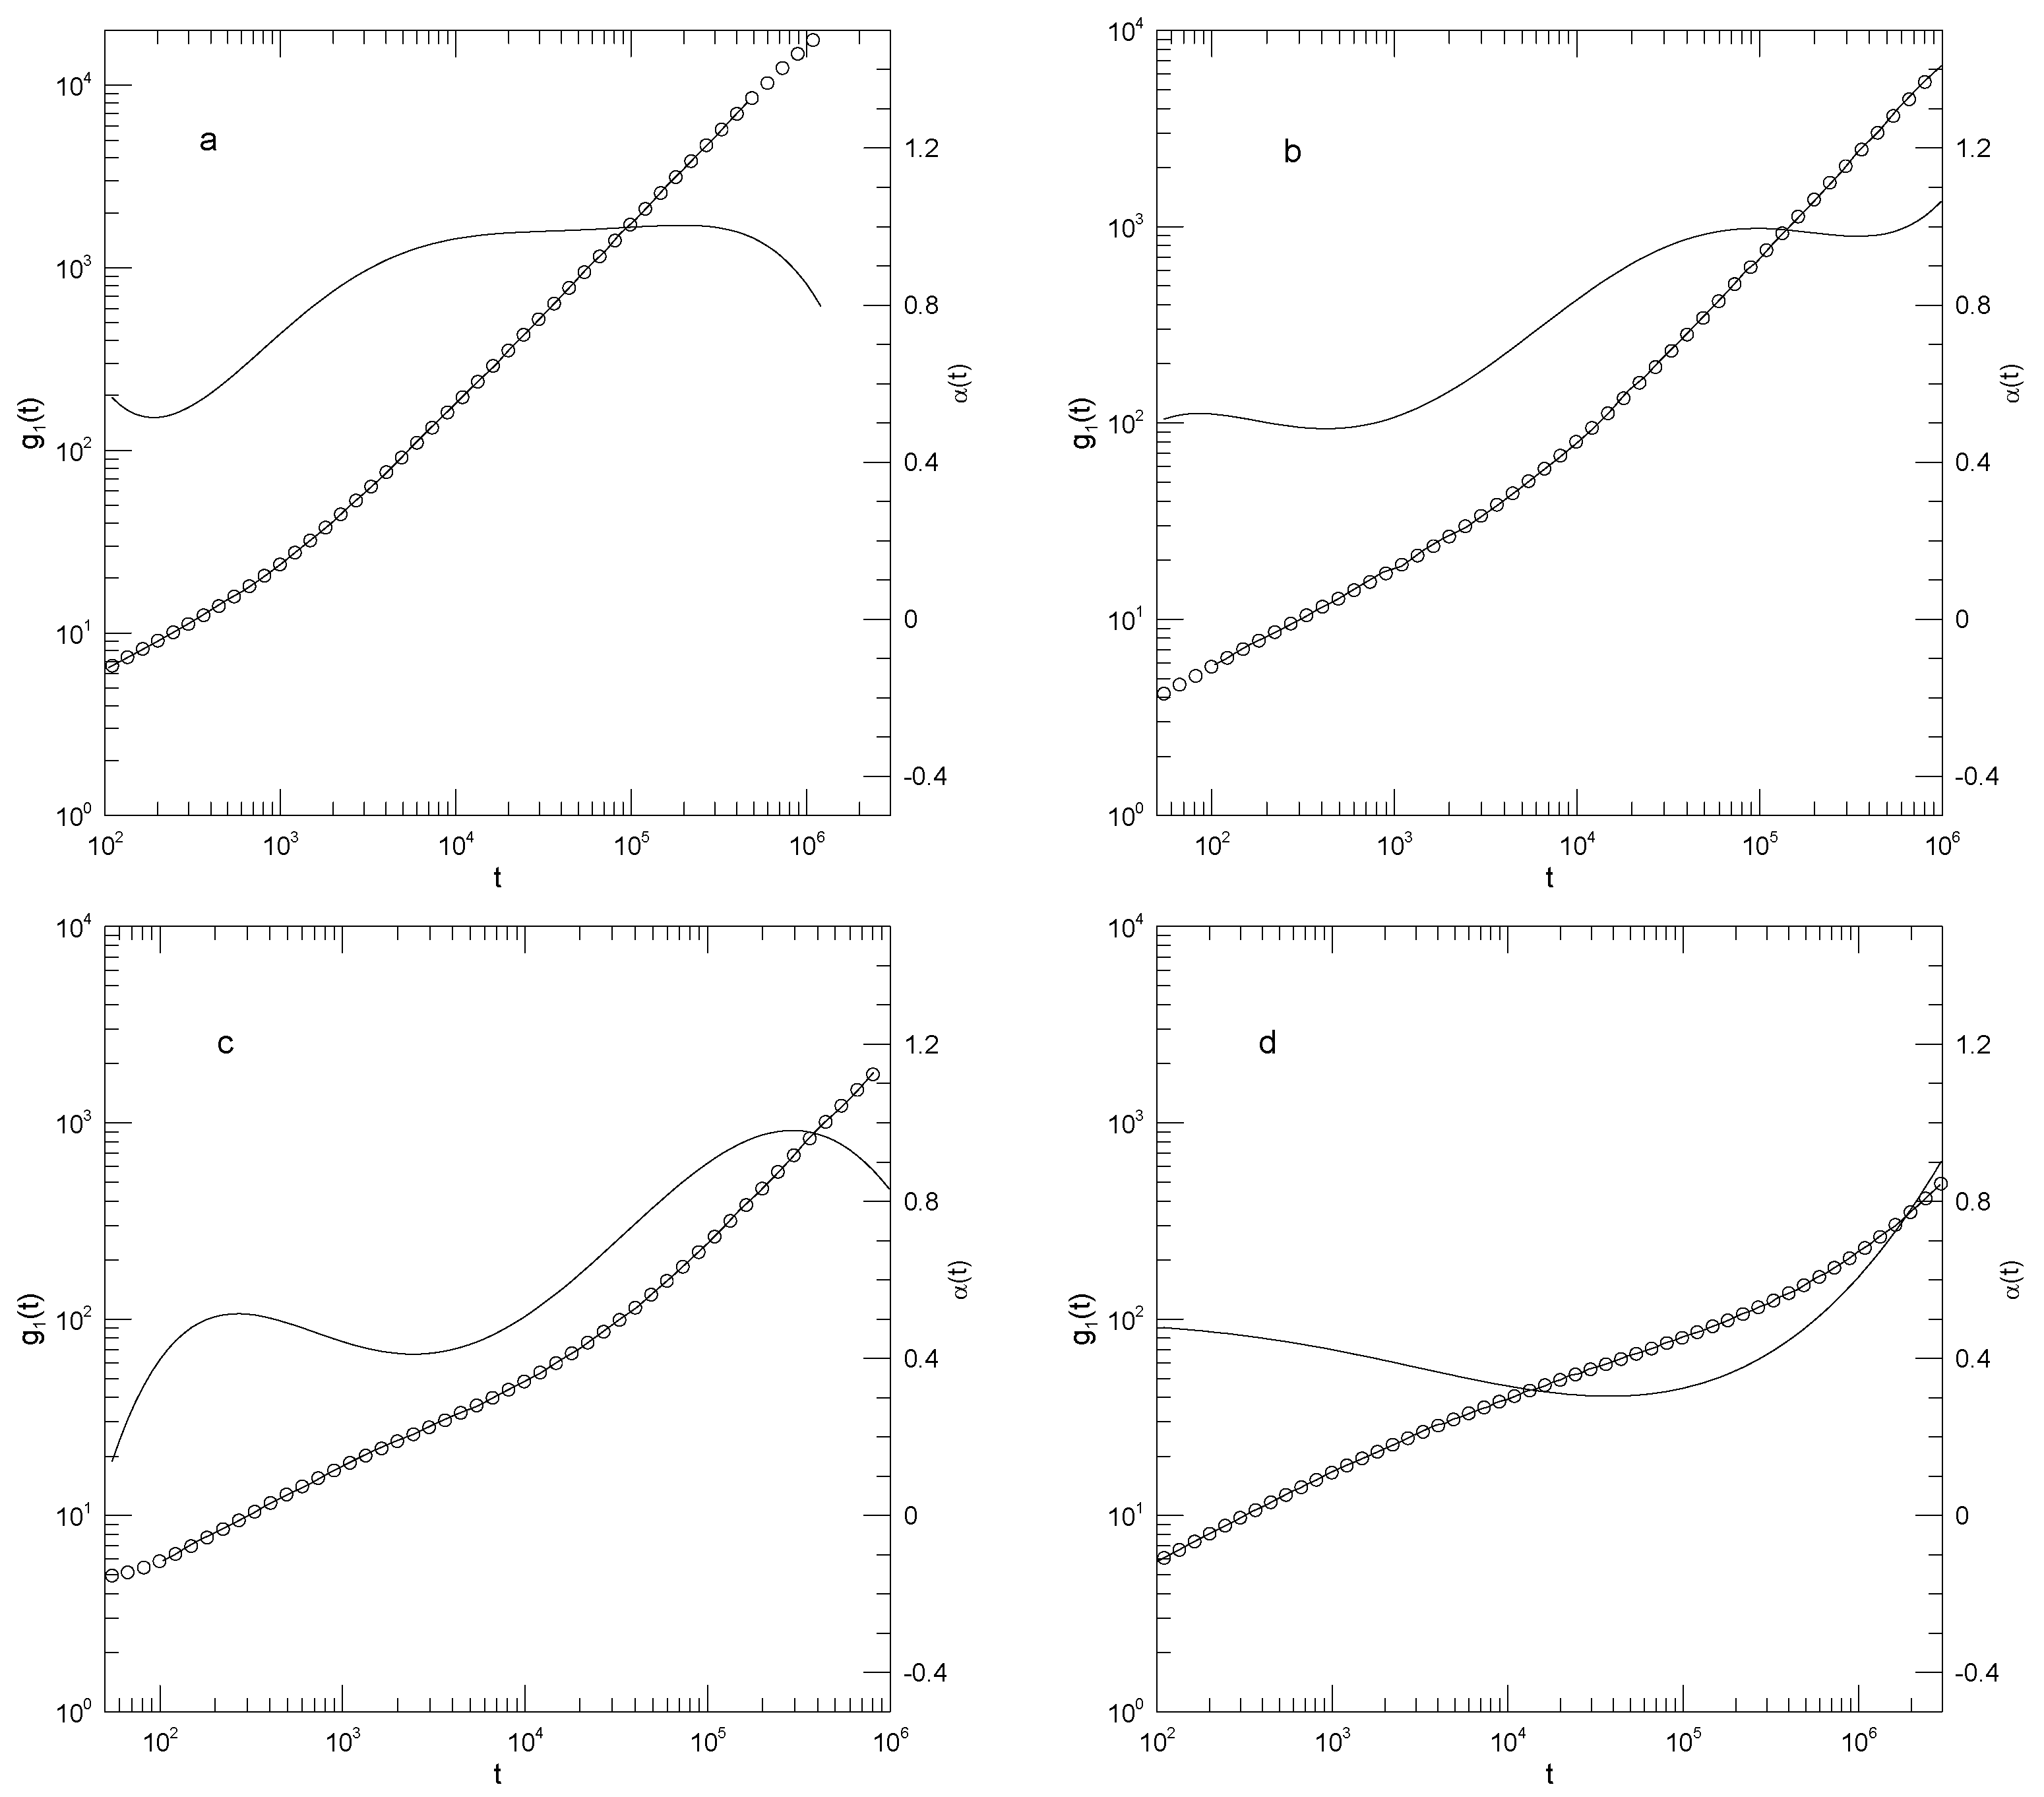
Figure 13.
Mean-square center-of-mass displacements (thick lines) of 350-bead chains in melt and blends of Kremer-Grest bead-spring chains, based on simulations of Adeyemi, et al.,[25], together with fits to eighth-order polynomials (circles), and the corresponding first logarithmic derivatives (thin lines). Figure part (a) refers to a pure 350-bead melt. Figures (b)-(d) refer to blends with 0.7 volume fraction of the 350-bead polymer and 0.3 volume fraction of the (b) 100-bead, (c) 50-bead), and (d) 25-bead polymer.
Figure 13.
Mean-square center-of-mass displacements (thick lines) of 350-bead chains in melt and blends of Kremer-Grest bead-spring chains, based on simulations of Adeyemi, et al.,[25], together with fits to eighth-order polynomials (circles), and the corresponding first logarithmic derivatives (thin lines). Figure part (a) refers to a pure 350-bead melt. Figures (b)-(d) refer to blends with 0.7 volume fraction of the 350-bead polymer and 0.3 volume fraction of the (b) 100-bead, (c) 50-bead), and (d) 25-bead polymer.
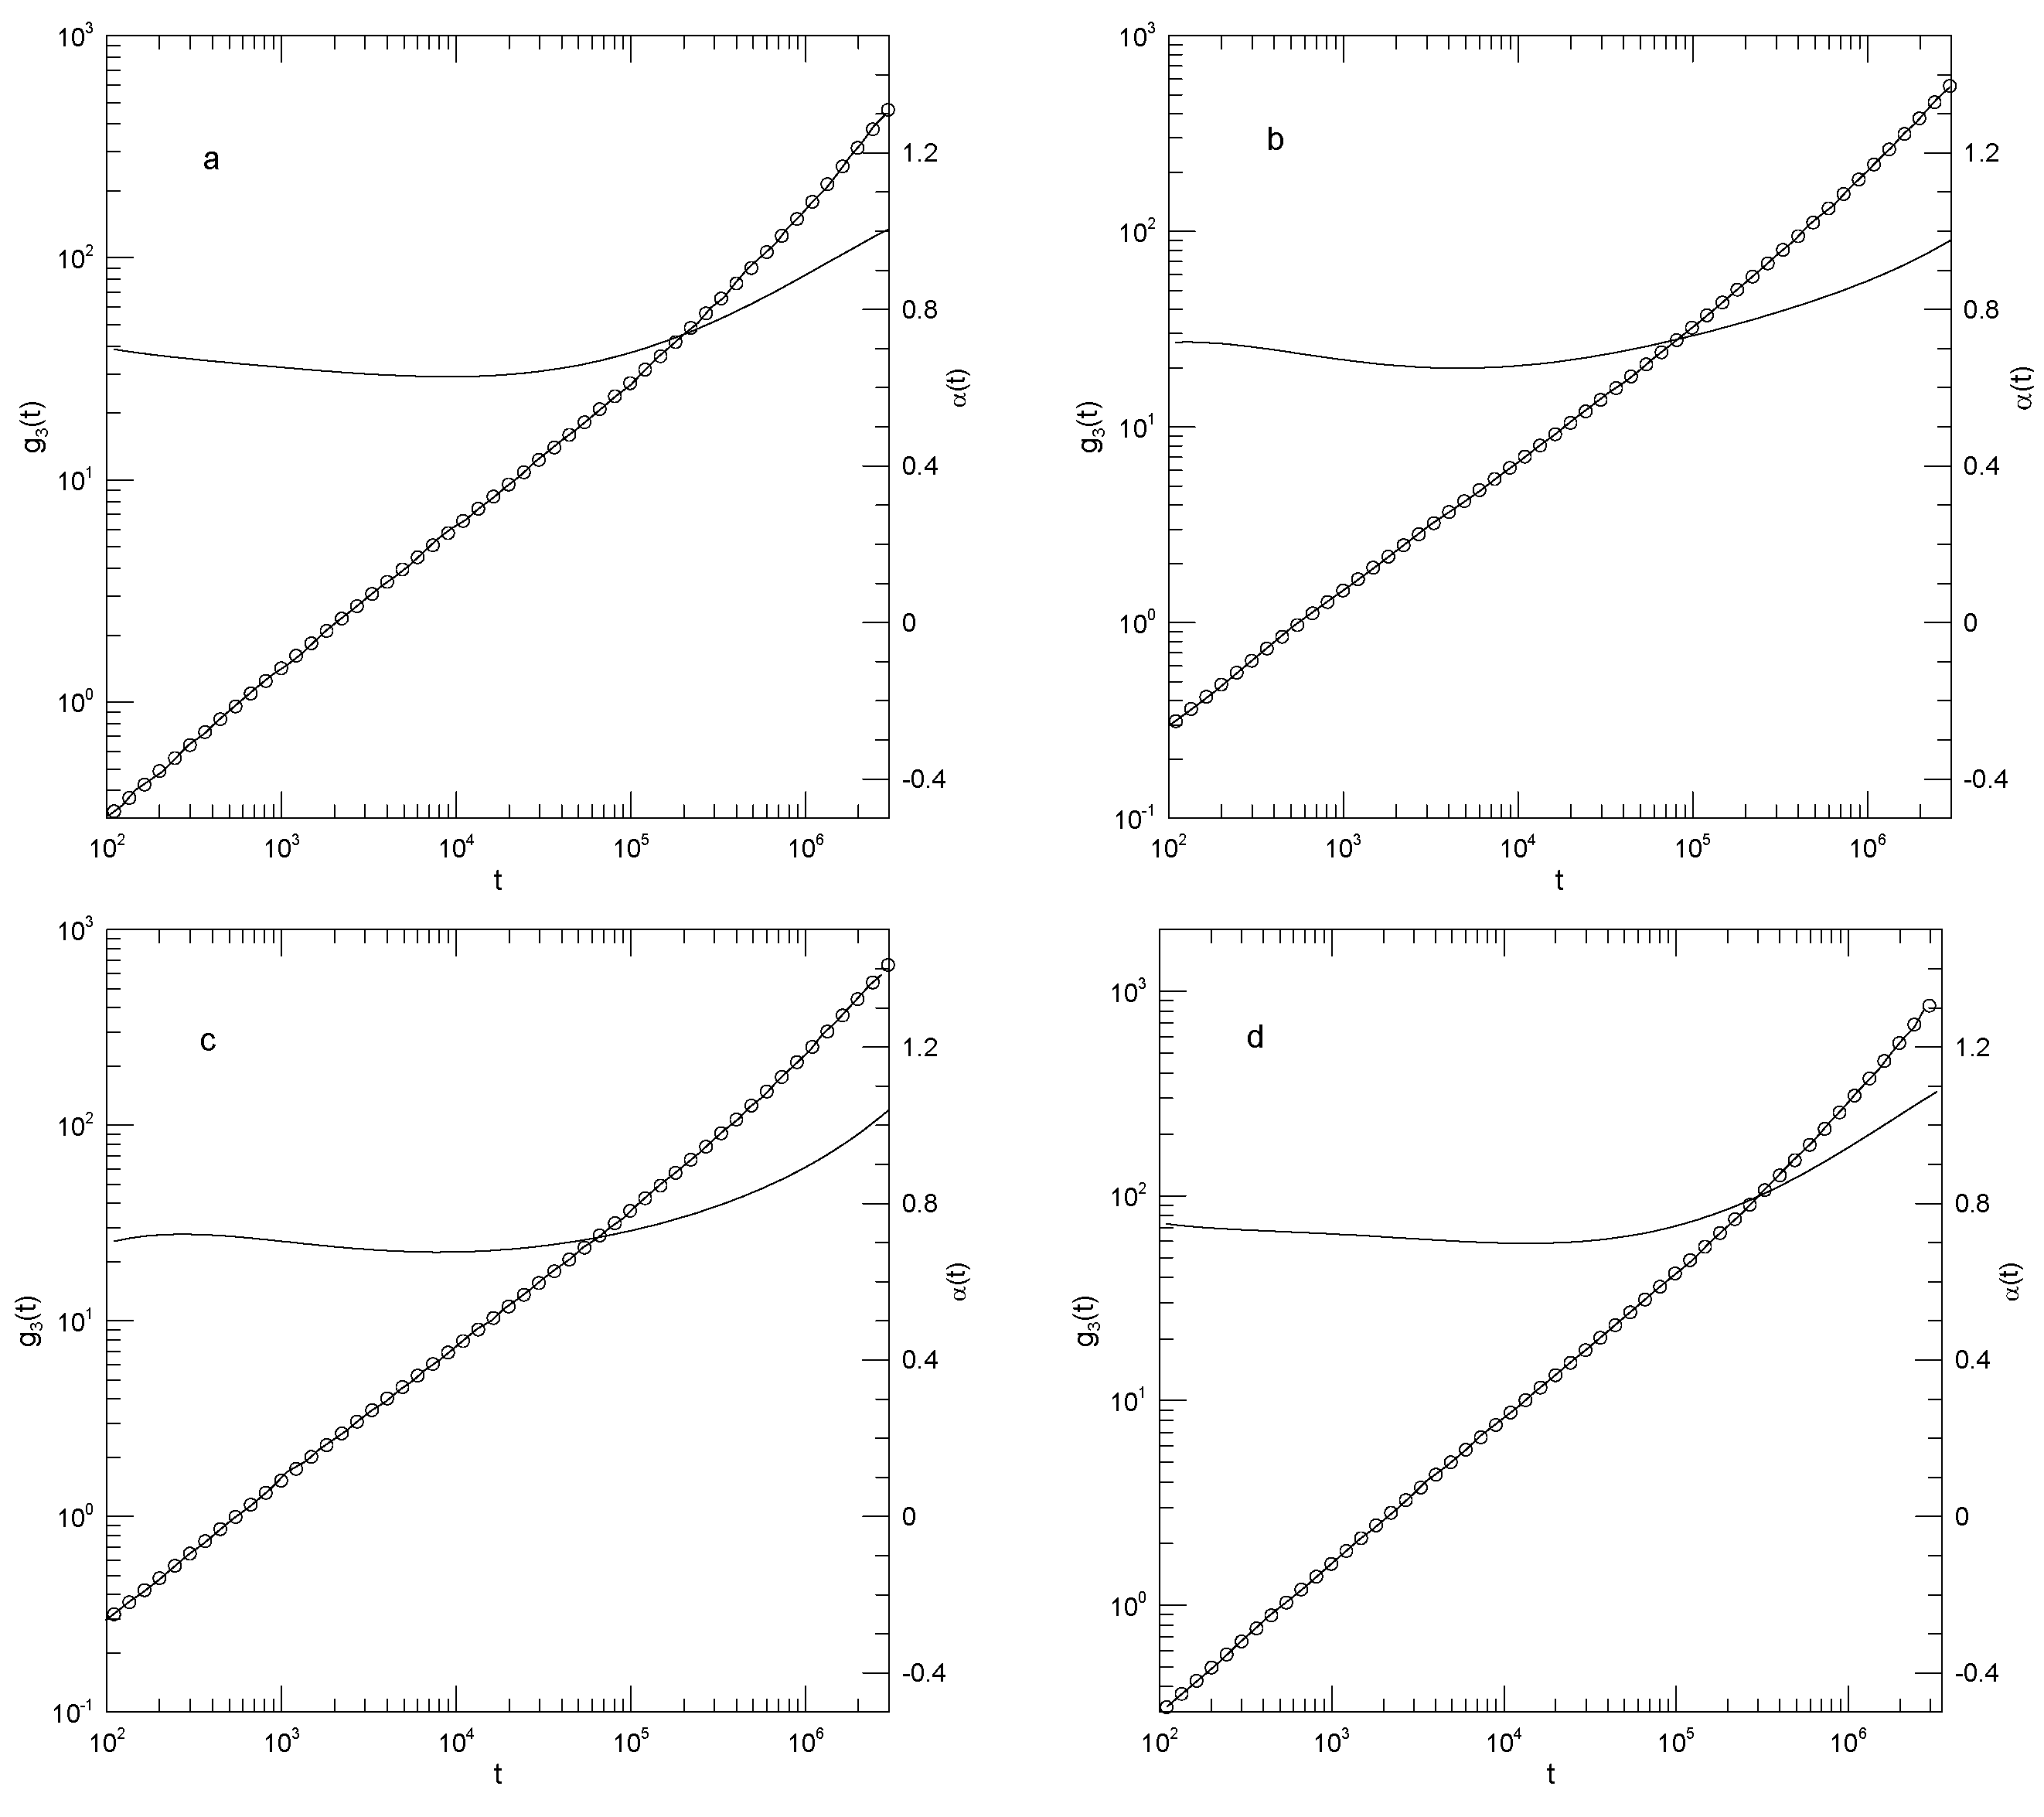
Figure 14.
Mean-square center-of-mass displacements (thick lines) of 350-bead chains in blends of Kremer-Grest bead-spring chains, based on simulations of Adeyemi, et al.,[25], together with fits to eighth-order polynomials (circles), and the corresponding first logarithmic derivatives (thin lines). The figures (a)-(c) refer to blends with 0.3 volume fraction of the 350-bead polymer and 0.7 volume fraction of the (a) 100-bead, (b) 50-bead, and (c) 25-bead polymer.
Figure 14.
Mean-square center-of-mass displacements (thick lines) of 350-bead chains in blends of Kremer-Grest bead-spring chains, based on simulations of Adeyemi, et al.,[25], together with fits to eighth-order polynomials (circles), and the corresponding first logarithmic derivatives (thin lines). The figures (a)-(c) refer to blends with 0.3 volume fraction of the 350-bead polymer and 0.7 volume fraction of the (a) 100-bead, (b) 50-bead, and (c) 25-bead polymer.
Disclaimer/Publisher’s Note: The statements, opinions and data contained in all publications are solely those of the individual author(s) and contributor(s) and not of MDPI and/or the editor(s). MDPI and/or the editor(s) disclaim responsibility for any injury to people or property resulting from any ideas, methods, instructions or products referred to in the content. |
© 2025 by the author. Licensee MDPI, Basel, Switzerland. This article is an open access article distributed under the terms and conditions of the Creative Commons Attribution (CC BY) license (https://creativecommons.org/licenses/by/4.0/).
Copyright: This open access article is published under a Creative Commons CC BY 4.0 license, which permit the free download, distribution, and reuse, provided that the author and preprint are cited in any reuse.


