
Submitted:
30 October 2025
Posted:
31 October 2025
You are already at the latest version
Abstract
Accurate assessment of compacted snow strength is critical for ensuring the safety and performance of snow runways in cold environments. The Russian Snow Penetrometer (RSP) is widely used in snow science and engineering due to its simplicity, portability, and capability for rapid field measurements under extreme conditions. Conversely, the California Bearing Ratio (CBR) test remains the benchmark for evaluating load-bearing capacity of conventional granular materials but is seldom applied to snow because of logistical constraints and the material’s complex mechanical behavior. To address this gap, this study presents side-by-side field measurements of snow pavement strength using RSP and CBR over a 30-hr period at two test section locations. Both methods captured temporal strength increases and spatial variability, with consistently higher values at the second site attributed to extended sintering. A moderate linear correlation (R² = 0.44) between RSP and CBR results confirms RSP’s potential as a proxy for load-bearing capacity in snow-covered terrains. These findings contribute to bridging the gap between traditional pavement testing and snow-specific methods, advancing the development of robust, rapid assessment tools for snow runway design and safety. Ongoing work aims to expand the dataset of paired RSP and CBR measurements to refine this relationship and establish a reliable conversion framework for operational use.
Keywords:
snow pavement
; load-bearing capacity
; Russian Snow Penetrometer
; California Bearing Ratio
; compacted snow runway
; snow strength
1. Introduction
In cold regions and expeditionary engineering, accurately evaluating the strength of compacted snow surfaces is critical for the safe and effective operation of roads, airfields, and construction pads/foundations. Snow pavements, though unconventional, are often used to support logistical and military operations in remote cold environments, where traditional infrastructure is unavailable or impractical [1,2] (pp.231-247; pp. 311-320). In such scenarios, a rapid, field-based strength assessment method to ensure sufficient load-bearing capacity is essential, particularly for aircraft operations where surface failure poses a significant safety risk [3,4].
The California Bearing Ratio (CBR) test has long been recognized as the gold standard for assessing the strength and load-bearing capacity of soils and unbound pavement layers [5] (pp. 249-263). Field CBR testing, which measures material response in-situ, is widely valued for its realistic representation of actual performance. However, despite its reliability, field CBR testing is slow, labor-intensive, and logistically complex, especially in remote extreme environments [6] (pp. 326-335). As a result, very limited CBR data exists for snow, limiting our understanding of how this test applies to snow pavement systems. The Dynamic Cone Penetrometer (DCP) is a simpler, faster, and more portable tool. Originally intended as an index test, the DCP measures penetration resistance and can be empirically correlated to CBR values [7] (pp. 153-173). While DCP-based CBR estimates are routinely used in soil engineering [8,9], several studies have extended this approach to frozen ground and snow, albeit with limited standardization [10,11,12] (pp. 1-6). Still, both CBR and DCP were developed for conventional granular materials, not snow. Snow behaves very differently in that its strength characteristics vary significantly with temperature, density, moisture content, and metamorphic state [2,13,14] (pp. 311-320). These properties make it difficult to apply soil-based correlations with confidence. Even when processed and compacted under controlled conditions, snow roads and airfields fail under traffic loads differently than typical road or airfield construction materials, challenging the applicability of standard interpretation protocols. Therefore, CBR values derived from snow may not correlate at all with traffic-bearing capabilities of conventional pavements, even when measured using accepted standards.
In recognition of these challenges, researchers and military engineers use an alternate method more suited to extreme cold environments. The Russian Snow Penetrometer (RSP) is a hand-driven device that, like the DCP, measures the resistance of snow to penetration. The RSP is simple, rugged, and field-proven under Arctic and Antarctic conditions [15]. Similar to DCP, it requires no hydraulic or electronic components, making it mechanically consistent and reliable in extreme cold environments where snow pavements exist. Although RSP and DCP operate on similar principles, and qualitative comparisons suggest that they track similar trends in snow strength [15], no direct, validated conversion currently exists between RSP and CBR values. In practice, RSP results are sometimes converted to estimated CBR values via a two-step empirical process: first converting RSP readings to equivalent DCP penetration rates (mm/blow) [15], then estimating CBR from DCP via traditional correlations [9,16,17] (pp. 285-293; pp. 439-442). This approach is convenient but introduces compounded uncertainty due to assumptions in each step, especially given that DCP-CBR correlations were developed for soil, not snow.
This lack of a direct, validated RSP-to-CBR relationship presents a critical gap. In operational environments where snow pavements must support aircraft or heavy loads, reliable strength indices are essential for safety, design, and maintenance decisions. Yet current methods are either impractical in the field (i.e., CBR), only approximate (i.e., DCP-based estimation), or are not easily compared to accepted standards for granular material (i.e., RSP). The objective of this study is to address this gap by directly correlating RSP measurements with field CBR values from a compacted snow pavement. By generating paired RSP and CBR data under realistic snow conditions, the project seeks to 1) evaluate the viability of each method in characterizing snow pavement strength and 2) determine whether a direct conversion between RSP and CBR is feasible and reliable. This would reduce dependence on time-consuming or error-prone intermediate steps (e.g., DCP-based conversions). Establishing a validated RSP-to-CBR relationship would enhance the reliability and speed of snow pavement assessments, having significant implications for military and expeditionary engineering, where logistical efficiency and operational safety are critical.
2. Materials and Methods
2.1. Construction of Snow Runway Test Section
To establish a reliable relationship between RSP and CBR, a full-scale snow runway test section was constructed in the Cold Regions Research and Engineering Laboratory (CRREL) Frost Effect Research Facility (FERF) in Hanover, NH. Construction of the snow runway test section began by placing stockpiled snow that had been collected from naturally occurring, undisturbed snow previously accumulated at CRREL. The collected snow was then processed using a skid steer (Caterpillar 299D3 Compact Track Loader, Irving, TX, USA) outfitted with a snowblower attachment (Caterpillar SR321, Irving, TX, USA) and placed within the designated testing area. The snow was placed in successive lifts of 15.24 cm. Between each lift and prior to compaction, a rake was used to manually smooth any smaller uneven areas. Each lift was compacted using a vibratory plate compactor (Wacker Neuson WP1550AW, Munich, Germany), with three compaction passes applied per lift to ensure adequate densification. This process was repeated for a total of three lifts, resulting in a constructed snow pavement section approximately 0.45 m thick. To achieve a smooth final surface, plywood sheets were laid side by side across the top layer and a skid steer was driven over them to level and consolidate the surface. Although there was noticeable contamination from wood chips eroded from the trafficking, testing with both field CBR and RSP were conducted on uncontaminated snow surfaces.
During construction, the temperature of the FERF was approximately -5°C, but was maintained at approximately -7°C for the duration of the study. The constructed snow pavement test section was 12.2 m long and 6.3 m wide (Figure 1). CBR and RSP tests were conducted at STA 1 and STA 2 along the centerline (C/L) of the test section sequentially to monitor snow strength gain within a 30-hr period after initial construction. The snow runway was first tested 12 hr after final construction to allow sufficient hardening to support the CBR test vehicle. This initial test is referred to as Test 0 and serves as the baseline condition for the snow pavement. Due to the inherently lengthy and labor-intensive nature of field CBR testing, as many tests were conducted as possible within the first 30 hr following Test 0. This resulted in CBR and RSP testing at five total time durations (Table 1). The time intervals between replicate tests were naturally dictated by the pace of testing and operational considerations. Early tests (i.e., Test 0 and Test 1) were spaced close to initial construction, while later tests (i.e., Test 2, Test 3, and Test 4) were spaced out over a longer period. This time-staggered approach allowed for the evaluation of both short-term snowpack behavior and longer-term strength gain, extending to nearly 30 hr after Test 0.
2.2. Snow Pavement Test Methods
2.2.1. California Bearing Ratio (CBR)
CBR testing is selected for this purpose because it is the recognized gold standard in pavement subgrade strength evaluation. Despite the unconventional nature of snow as a pavement material, adapting field CBR procedures allows for consistency with military and civil pavement design practices. The use of CBR on snow provides a basis for performance comparison, design validation, and decision-making aligned with established engineering frameworks [6] (pp. 326-335). Field CBR testing was performed in accordance with CRD-C 654 [18]. The field test is especially useful for variable or layered materials where laboratory remolding would not capture natural structure or in-place density [19]. Tests 0–1 were performed using CRREL’s CBR kit, while Tests 2–4 employed a kit from the Geotechnical and Structures Laboratory (GSL). GSL's kit was more streamlined, but did not arrive from Vicksburg, MS until testing had already begun, hence starting with the kit available at CRREL. Both kits adhered to the required standard and yielded comparable CBR results, though differences in apparatus configuration and handling were noted. CRD-C 654 specifies procedures for evaluating in-situ material strength using a static load applied through a circular piston. The standard setup consists of a load frame, a vehicle-mounted reaction beam system, a calibrated proving ring to measure applied force, and dial gauges to record piston penetration [18].
Since snow pavement strength was expected to be low at the start of testing, the CBR equipment was mounted to a four-wheel drive truck to ensure successful navigation to the test location. To further mitigate the risk of the truck becoming immobilized or causing rutting on the test section, wooden platforms were strategically placed along the wheel paths to distribute loads and improve traction over the snow surface out to each test location (i.e., STA 1 and STA 2). The required reaction load (i.e., weight to be added to the bed of the truck) for field CBR testing is determined based on the maximum penetration resistance expected during the test. The reaction load must counteract the maximum penetration resistance during testing. Estimated CBR values based on DCP correlation for snow range from 0 to 20 [10,11,12] (pp. 1-6). Therefore, a target CBR of 30 was used to calculate the expected reaction load. Since CBR is the ratio of the measured load to the standard load (i.e., 1360.8 kg for 2.5-mm penetration and 2041.2 kg for 5.0-mm penetration) [19], the measured load (in this case, the reaction load) can be obtained using CBR = 30 and a maximum standard load of 2041.2 kg. This indicated a required reaction load of at least 612.3 kg. Large concrete ballast was placed in the bed of the truck to achieve this reaction load. After preparing the CBR truck with the appropriate reaction load, the CBR test beam was mounted to the vehicle hitch. The beam was supported on both ends by jacks to stabilize the beam and distribute reaction loads. The jacks rested on base platforms to prevent jack settlement in the snow (Figure 2). A level was used to ensure the CBR apparatus was level in both horizontal and vertical directions.
The CBR test configuration used in this study featured a 76.2-mm diameter penetration piston (the standard size prescribed by CRD-C 654) that was responsible for applying vertical load into the snow surface to assess resistance and determine the bearing ratio. Load measurements were captured using a calibrated proving ring mounted in line with the piston to monitor real-time applied force. Two dial gauges were employed: one to measure deflection in the proving ring and the other to record piston penetration. All components, including the piston, proving ring, and dial gauges, were mounted in precise alignment on a rigid support frame to minimize system deflection, ensure accurate load transfer into the snow pavement, and maintain the integrity of the load-penetration relationship. A standard surcharge plate and associated weights were also used to simulate overburden pressure from the material that will overlie the layer being evaluated. The surcharge plate measured 152 mm in diameter with a thickness of 7.6 mm. A 4.5-kg surcharge weight was applied concentrically to reflect realistic in-service loading conditions. Following surcharge placement, the penetration test was initiated by advancing the piston into the snow at a controlled rate of 1.3 mm per minute. Load was applied using a mechanical actuator, and resistance was continuously recorded using a calibrated proving ring and dual dial gauges. Load and displacement readings were taken at 0.64-mm intervals up to a maximum penetration depth of 12.7 mm unless a peak load was reached earlier. These data were used to construct a load-penetration curve, from which the CBR value was calculated as the ratio of measured pressure to a standard reference pressure at 2.5 mm or 5.0 mm of penetration, whichever resulted in a higher value. The higher the CBR value (i.e., between 0 and 100), the stronger the material. The three most closely related CBR values per station location were used to conduct the data analysis based on CRD-C 654 guidance which requires re-testing in cases of high variability among replicates. CBR data were processed per CRD-C 654 guidelines then analyzed and visualized using Excel.
2.2.2. Russian Snow Penetrometer (RSP)
The RSP is a well-established method for evaluating snow strength in extreme cold environments [7,15] (pp. 153-173). The RSP is a dynamic, point-based instrument designed to evaluate the mechanical strength of highly compacted snow and glacial ice surfaces, such as those found on polar airfields. It operates by measuring the resistance of the snow or ice to penetration by a conical tip under repeated impacts from a controlled mass dropped from a fixed height. The RSP shares a similar operational principle with other penetrometers such as the DCP and the Rammsonde penetrometer described earlier, which vary in their drop mass, cone geometry, and target application. While the RSP is optimized for highly compacted snow and ice, the DCP is better suited for evaluating sub-surface layers below pavement, and the Rammsonde penetrometer is ideal for lower-strength snow on natural or less compacted surfaces. The RSP used in this study was produced in-house at the CRREL machine shop. It consists of a slender vertical rod equipped with a 30-degree conical tip having a maximum diameter of 11.5 mm. A 1.75 kg drop hammer is repeatedly released from a drop height of 50 cm, driving the tip into the snow or ice surface to a maximum penetration depth of 400 mm (Figure 3). For each drop, the depth of penetration is recorded, and the total number of drops required to reach a certain depth can be used to infer snow strength (i.e., RSP index with units of kg) (Equation 1).
Calculating strength with RSP test data:
W is the mass of the drop hammer (kg), h is the height from which the weight was dropped (cm), n is the number of hammer drops or “blows”, L is the penetration depth (read from the markings on the rod) after n blows (cm), and Q is the mass of the penetrometer itself (kg) [7,20] (pp. 153-173; pp. 118-131). DCP tests are conducted identically, however a "fixed" number of blows is applied, and the resulting penetration is recorded, resulting in an index value with units of distance per blow. This method provides a rapid, repeatable means of characterizing snow strength at specific points along a runway or test site. As for DCP, because the measurements are localized, adequate spatial coverage is essential to develop a representative assessment of overall runway strength.
To achieve approximately side-by-side measurements of CBR and RSP, the RSP measurements were collected prior to each CBR replicate as close as possible to the start of CBR. However, since the CBR needed to be out of the way for RSP testing, there was an inherent lag in time between RSP data collection and beginning the associated CBR measurement in the same spot. This lag was longer when using CRREL’s CBR equipment but was greatly reduced when using GSL’s CBR equipment since it was more streamlined. RSP measurements were taken in triplicate for each CBR replicate. To the maximum extent practicable, the three RSP replicate measurements were positioned evenly around the center of the planned CBR collection point to achieve a representative average of the localized area. In general, the three test points formed an evenly spaced triangle placed approximately at the edge of where the CBR surcharge plate was to be positioned. One person performed the RSP test as described above while another recorded the number of hammer blows and resulting depth of penetration. The starting penetration depth ranged from 0 to 25 mm depending on the level of surface disturbance from personnel and equipment traffic prior to testing. Following the experiment in the FERF, the collected RSP and CBR data were imported into R Statistical Software for in-depth analysis, processing, and visualization and to perform the correlation analysis between CBR and RSP [21]. The `tidyverse` package was use for all processing, analysis, and visualization [22] (p. 1686). RSP data was plotted in R to visualize strength index across depth for each RSP replicate. The RSP strength profiles were interpreted by identifying zones with varying RSP index values at different depths. These zones typically correspond to distinct snow layers, each with unique thicknesses and strength properties. This methodology is loosely based on Webster et al. (1994) [23], that outlines how to determine the CBR strength of conventional materials with depth using DCP. This method of interpreting DCP was applied to RSP in this study since RSP is similar in that it is analyzed by interpreting changes in resistance with depth to infer snow strength and layer boundaries.
As described previously, the three most closely related CBR values per testing event (i.e., each station and testing time point) are included in data analysis while the others are excluded (Section 2.2.1). This approach aligns with the procedures outlined in the CBR CRD-C 654 method, which requires re-testing in cases of high variability among replicates. For correlation purposes, any RSP replicate data corresponding to those CBR tests (i.e., RSP tests conducted at the same location and time) that were ultimately re-tested and demonstrated anomalies were excluded from the dataset as well. Additionally, the upper 0 to 25 mm of RSP data was excluded to eliminate potential effects of surface disturbance, consistent with standard practices in DCP data analysis procedure in accordance with ASTM D 6951. To reflect the testing depth of the field CBR, which was conducted at the surface and typically represents the upper 152 mm of the pavement, only RSP data between 25 mm and 200 mm were considered for the correlation analysis. From the remaining data, a single mean RSP strength index was calculated across this depth for STA 1 and STA 2 at Test 0-4. A preliminary linear correlation analysis was then conducted to investigate the relationship between CBR and RSP strength. The dataset consisted of 10 paired observations, each representing a mean CBR measurement and a corresponding mean RSP reading at the aforementioned locations.
3. Results & Discussion
3.1. Snow Pavement Strength
3.1.1. CBR Strength Development
The CBR data demonstrate a general increase in snow pavement strength over time (Figure 4). Despite some scatter, particularly at intermediate time steps, the trend of increasing strength is evident. STA 1 showed a consistent strength gain, starting at a CBR of approximately 9 and reaching a maximum CBR of 15 by the end of the test period. STA 2 also exhibited strength gain but with greater variability. Initial CBR for STA 2 was roughly 8.5 and reached a maximum CBR of 21.5. These CBR values for both stations are in line with findings reported for field CBR direct measurement on snow (i.e., approximately 8 up to 32 for groomed snow) [6] (pp.326-335). Average CBR trends reinforce a similar increasing pattern (Figure 5). At STA 1, the average CBR started at 8.9 and increased to 13.1 by the end of the testing period, reflecting a net gain of 4.2 percentage points (i.e., 47% increase). The standard deviation remained relatively low and consistent, ranging from 1.1% to 2.0%, with COV values between 11.0% and 15.9%. These moderate COV values indicate stable and reasonably uniform strength development at this location. STA 2 exhibited a more substantial strength increase, with CBR rising from 8.4 to 18.1, representing a gain of 9.7 percentage points (i.e., 115% increase). The standard deviation increased over time, reaching a peak of 3.8%, and the COV ranged from 8.6% to 21.2%. The higher variability observed at STA 2, particularly at the 28.8-hr mark, suggests that while snow strength gains were greater, the horizontal uniformity of the snow layer was more variable than at STA 1. Overall, both stations showed clear increases in snow strength over time as measured by field CBR.
Linear regression models were applied to each data set to quantify the rate of strength gain. The slope represents the rate of change in average CBR per hr (Figure 5). Both station trend lines indicate a positive linear relationship between elapsed time and field CBR. STA 2 exhibited a significantly steeper slope of 0.36 compared to STA 1 (i.e., 0.15), indicating a more rapid gain in snow strength over the 30-hr observation period. The intercepts (i.e., 8.39 and 7.43 for STA 1 and STA2, respectively) suggest that, on average, snow pavements begin with an initial CBR near these values shortly after construction (in this case, 12 hr). While STA 1 had a slightly higher initial average CBR value, STA 2 surpassed it within approximately 10 hr and continued to increase at a faster rate. By the 30-hr mark, STA 2 reached an average field CBR of approximately 18.5, while STA 1 reached an average CBR of 13.3. This corresponds to an overall strength increase of 11.1 units at STA 2 and 4.9 units at STA 1. The strong correlation coefficients (i.e., R2 > 0.95) suggest the linear model provides a reliable representation of field strength trends for both stations. However, there is noticeable discrepancy in strength gain between the two stations. This may be attributed to localized differences in snow conditions, compaction effectiveness, local heterogeneity within each test site, and minor inconsistencies in field execution, all factors that are difficult to control in operational environments. These findings emphasize the variability in snow hardening behavior across the test area and highlight the importance of multi-point field verification when evaluating snow-supported surfaces. Importantly, despite the variability observed in the data, the upward trend across the full-time domain reinforces earlier findings that snowpack strength increases measurably over time. The linear regressions support the viability of field CBR testing as a method for monitoring time-dependent strength gain in snow, offering direct, sensitive, and repeatable measurements. While operationally demanding, this approach proves especially valuable in controlled environments where accurate, time-stamped assessments of surface strength are critical for infrastructure performance or aircraft operations.
3.1.1. RSP Strength Development
The RSP data also demonstrate a general increase in snow pavement strength over time (Figure 6). The vertical dashed black lines indicate the average RSP index obtained by visually interpreting the trends in RSP index across depth (Section 2.2.2). Some RSP data showed clear separation in up to 3 layers (e.g., STA 2 during Test 2; Figure 19) while others were fairly uniform across depth (e.g., STA 2 during Test 0; Figure 17). Similar to trends seen in CBR strength development over time, there were some slight decreases in RSP strength index during intermediary time points, but the general trend was upward. While not overly distinctive, many of the replicates (particularly STA 2) show higher RSP index values (i.e., stronger or more compacted snow) at shallower penetration depths as well as near the deepest penetration depth (i.e., near the surface of the underlying soil base layer), with slightly lower strength in the middle. This is expected as the ambient temperature of the FERF freezes the compacted snow from the surface downward, while the cold surface of the underlying soil material freezes from the base of the compacted snow upward.
At Test 0, conducted approximately 12 hr after construction was completed, RSP strength values at both stations exhibited early signs of consistency and uniformity, aligning with initial strength findings reported by Shoop et al. (2019) [6] (pp. 326-335), who observed comparable RSP values in groomed snow. At STA 1, RSP replicates ranged from a minimum of 8 to a maximum of 38, excluding one outlier of 73. Such deviations are expected due to natural heterogeneity within the snowpack or minor inconsistencies in test section preparation. For instance, hard clumps of snow that were not fully processed by the snowblower may have been incorporated into the compacted surface, leading to localized areas of increased strength due to differential freezing and compaction. At STA 2, RSP values ranged from 10 to 38, demonstrating slightly less variability than STA 1. Average RSP strength at STA 1 was 31 from the surface down to a depth of 200 mm, but decreased to 19 between 200 and 400 mm, indicating a notable decline in strength with depth. In contrast, STA 2 exhibited a more uniform strength profile throughout the full 400 mm depth, with an average RSP of approximately 30. These results suggest that despite some localized anomalies, the initial structural integrity of the snow pavement was relatively consistent between stations. In addition, these initial results contribute to the limited body of published data on snow pavement strength and represent one of the first efforts to characterize RSP over time rather than at a single location or time point. The strength values observed during Test 0 provide an important benchmark for understanding the early-stage behavior of snow pavement and suggest that it is capable of achieving an initial RSP strength around 30 within just 12 hr of construction.
Following Test 0, a progressive increase in RSP strength was observed over the subsequent testing periods. During Test 1, strength increased by 18% at STA 1 and 38% at STA 2. In Test 2, RSP strength continued to rise, with additional gains of 15% at STA 1 and 9% at STA 2. By Test 3, however, a divergence in trends emerged: the average RSP strength at STA 1 decreased by 11.8% relative to Test 2, returning to a value of 30, while STA 2 exhibited a further strength increase of 6.7%. At the conclusion of the study, Test 4 results indicated a cumulative strength increase of 28% at STA 1 and 80% at STA 2 over the 30-hr testing period (from Test 0 to Test 4), highlighting ongoing consolidation and strength development under the given conditions. Strength gain of the compacted snow was expected since the compaction activities catalyze the sintering process. Sintering occurs when two snow grains come into contact and water vapor or liquid water migrates across their surfaces, forming small 'necks' that fuse the grains together [24] (pp. 421-424). These bonds strengthen the snow structure over time. Since the temperature in the FERF was kept constant throughout the experiment, there was no significant warming to increase moisture content. This likely limited the achievable level of strength, as a slight temperature rise can enhance sintering by increasing the availability of moisture. In field applications, where natural temperature fluctuations can promote sintering, strength gains may be greater but also introduce the potential for melt and therefore low bearing strength of the snow pavement. Alternatively, water can be manually added to encourage bonding and achieve similar improvements in strength under controlled conditions [13]. Moisture was not manually added during this experiment since the purpose was not to achieve significant strength gain, but to instead evaluate the ability to capture strength development with both CBR and RSP testing.
Obtaining a single average RSP strength index for each station during each test (i.e., Test 0-4) and plotting it over time provides a more direct assessment of strength development and the rate of strength gain over the course of the study (Figure 7). Although there was a decrease at Test 3/STA 1, overall average RSP strength across depth at STA 1 and STA 2 increased from 25 to 32 (i.e., +7) and 30 to 54 (i.e., +24), respectively, demonstrating modest but evident strength gain within the entire testing duration. Linear regression models for each station quantify the rate of strength gain, with the slope representing the rate of change in average RSP per hr. Similar to the trends observed in the CBR strength results, STA 2 also exhibited a significantly steeper slope (0.63) compared to STA 1 (0.20), indicating more rapid strength gain over time. Both regression models also have moderate to strong correlation coefficients (R2 = 0.62 and 0.81 for STA 1 and STA 2, respectively), indicating a reliable representation of RSP strength gain over time. Like the CBR results, RSP measurements of the snow pavement revealed that the strength at STA 2 was consistently greater than at STA 1. STA 1 was tested first following construction completion, whereas STA 2 was evaluated approximately 3 hr later. This temporal difference, especially early after compaction activities where the faster strength gain development is expected, may have allowed for additional sintering and bonding between snow grains at STA 2, resulting in a denser, more cohesive snow structure. By adjusting the STA 1 data to exclude the first time point and instead "begin" 3 hours later, the y-intercepts move closer together between the two stations showing greater consistency between initial RSP index of the snow pavement (i.e., STA 1 = 29.4 and STA 2 = 33.5). The observed increase in strength at STA 2 is therefore likely attributable, at least in part, to this extended sintering period, highlighting the importance of time-dependent processes in the mechanical development of compacted snow surfaces.
3.2. RSP and CBR Correlation
Since trends in snow pavement strength development over time aligned well between CBR and RSP values, correlation between the two was promising. The linear regression analysis produced a coefficient of determination of R² = 0.44, indicating a moderate positive correlation between CBR and RSP values (Figure 8). While the sample size is small (i.e., n = 10), this analysis serves as a starting point for evaluating the potential of using RSP as a proxy or supporting indicator for CBR strength. In other words, these results show potential for using the simple, streamlined RSP test method for field applications in extreme cold conditions then converting the data into well-understood field CBR strength values. This translation is key for evaluating snow pavement strength for infrastructure in cold environments (e.g., roads, airfields, and construction pads/foundations).
To build upon the findings of this study, future work should prioritize expanding the dataset through additional side-by-side CBR and RSP testing to strengthen the correlation between the two methods. This will enable refinement of the RSP–CBR correlation model, ultimately leading to a more efficient, scalable framework for evaluating snow-supported surfaces in operational environments. Specifically, conducting CBR testing with depth, rather than only at the surface, would enable more direct comparisons to the RSP’s full-depth strength profiles. Future testing should also encompass a broader temperature spectrum to evaluate thermal effects on strength gain through fluctuation moisture content. Testing should be replicated across multiple locations and time intervals to improve statistical robustness and account for spatial variability in snow properties. Evaluating test performance under simulated aircraft loading throughout the process would also provide valuable validation of the predictive accuracy of the developing correlation model (i.e., using RSP to estimate CBR for decision-making). Complementary use of additional strength characterization tools, such as the DCP is recommended to enhance cross-validation efforts with previously developed models [9,15,16,17] (pp. 285-293; pp. 439-442).
4. Conclusions
This investigation aimed to determine whether field CBR testing could reliably capture the time-dependent strength gain of compacted snow pavements. In parallel, the study evaluated the potential for correlating results from the RSP, a device traditionally used to assess snow strength, with field CBR measurements. To support this analysis, a 12.2-m by 6.3-m full-scale snow pavement test section was constructed and tested with both methods. Field testing began approximately 12 hr after construction completion (Test 0), allowing for initial snow hardening, and continued for 30 hr. Sequential CBR and RSP tests were performed at two stations to monitor strength development over time. Results from this study showed that snow pavement strength increases measurably over time post-construction, as captured by both CBR and RSP testing. STA 2 consistently exhibited higher strength values than STA 1, likely due to a longer sintering period and improved compaction. Notably, this difference was independently captured by both the CBR and RSP methods, reinforcing the sensitivity of each test to localized strength variations. In addition, CBR and RSP measurements both indicated time-dependent strength gains, validating their utility for monitoring snow surface strength gain development. Lastly, a direct linear correlation was explored using paired CBR and RSP data and despite the limited sample size (n = 10), produced an R² value of 0.44, indicating a moderate yet encouraging relationship that warrants further investigation. Overall, the results suggest potential for using RSP as a proxy for CBR in cold environments, thus establishing the building blocks for snow pavement strength guidance for infrastructure applications in cold environments, particularly in support of military aircraft operations on snow runways.
Author Contributions
Conceptualization, K.D., M.O., and T.M.; methodology, K.D., M.O., and T.M.; software, N/A; validation, K.D. and M.O.; formal analysis, K.D. and M.O.; investigation, K.D., M.O., T.M., and C.C.; resources, K.D., M.O., T.M., and C.C.; data curation, N/A; writing—original draft preparation, K.D. and M.O.; writing—review and editing, K.D., M.O., T.M., and C.C.; visualization, K.D. and M.O.; supervision, T.M.; project administration, K.D., M.O., and T.M.; funding acquisition, T.M. All authors have read and agreed to the published version of the manuscript.
Funding
The author(s) disclosed receipt of the following financial support for the research, authorship, and publication of this article: The tests described, and the resulting data presented in this paper, unless otherwise noted, were obtained from research funded by the U.S. Air Force and performed by the U.S. Army Engineer Research and Development Center.
Institutional Review Board Statement
Not applicable.
Informed Consent Statement
Not applicable.
Data Availability Statement
The data presented in this study are available on request from the corresponding author due to continued research on this topic that is currently in progress. Upon request, the data as well as all code for processing, analysis, and visualization will be made available via a GitHub repository: https://github.com/kld93/ RSPtoCBR_correlation.
Acknowledgments
Thank you to the technicians, Chase Bradley and Lane Mason, from the Geotechnical and Structures Research Lab for assisting with the construction of the snow pavement test section and subsequent CBR testing.
Conflicts of Interest
The authors declare no conflicts of interest. The funders had no role in the design of the study; in the collection, analyses, or interpretation of data; in the writing of the manuscript; or in the decision to publish the results.
Abbreviations
The following abbreviations are used in this manuscript:
| ASTM | American Society for Testing and Materials |
| CBR | California Bearing Ratio |
| CRREL | Cold Regions Research and Engineering Laboratory |
| C/L | Centerline |
| DCP | Dynamic Cone Penetrometer |
| FERF | Frost Effects Research Facility |
| GSL | Geotechnical and Structures Laboratory |
| RSP | Russian Snow Penetrometer |
| STA | Station |
| USACE | United States Army Corps of Engineers |
References
- Russell-Head, D.; Budd, W.; Moore, P. Compacted snow as a pavement material for runway construction. Cold Regions Science and Technology 1984, 9(3), 231–247. [Google Scholar] [CrossRef]
- White, G.; McCallum, A. Review of ice and snow runway pavements. Int J of Pavement Research and Technology 2017, 11(3), 311–320. [Google Scholar] [CrossRef]
- Mellor, M. A Review of Basic Snow Mechanics. Int Association of Hydrological Sciences, 1975. https://iahs.info/uploads/dms/iahs_114_0251.pdf.
- Mellor, M. & Smith, J.H. Strength Studies of Snow. U.S. Army Material Command 1966. CRREL Research Report 168. https://usace.contentdm.oclc.org/digital/collection/p266001coll1/id/5278/.
- Davis, E. H. The California bearing ratio method for the design of flexible roads and runways. Géotechnique 1949, 1(4), 249–263. [Google Scholar] [CrossRef]
- Shoop, S.; Wieder, W.; Elder, B. Mechanical Property Measurements on Various Snow Surfaces. ASCE J of Cold Regions Engineering 2019, 32, 6–335. [Google Scholar]
- Blaisdell, G. L. , Klokov, V., & Diemand, D. Compacted Snow Runway Technology on the Ross Ice Shelf Near Mcmurdo, Antarctica. Contributions to Antarctic Research IV 1995, 67, 153–173. [Google Scholar] [CrossRef]
- Kleyn, E.G. The Use of the Dynamic Cone Penetrometer (DCP). Transvaal Roads Department 1975. Report L2/75. Pretoria, South Africa.
- Webster, S. L., Grau, R. H., & Williams, T. P. Description and Application of Dual Mass DCP for Evaluating the Strength of Soils and Aggregate. U.S. Army Engineer Waterways Experiment Station 1992, Instruction Report GL-92-3.
- Abele, G. Snow Roads and Runways. US Army ERDC-CRREL 1990, Monograph 90-3. www.erdc.usace.army.mil.
- Petrovic, J.J. Review Mechanical properties of ice and snow. J of Materials Science 2003, 38, 1–6. [Google Scholar] [CrossRef]
- Shapiro, L. H., Johnson, J. B., Sturm, M., & Blaisdell, G. L. Snow mechanics: review of the state of knowledge and applications. US Army ERDC-CRREL 1997, 97-3. www.erdc.usace.army.mil.
- Blaisdell, G.L.; Melendy, T.D.; Blaisdell, M.N. Ballistic protection using snow. Int J of Impact Engineering 2021, 155. [Google Scholar] [CrossRef]
- Haynes, D.F. Effect of temperature on the strength of polycrystalline ice. US Army ERDC-CRREL 1978, Technical Report 78-27. www.erdc.usace.army.mil.
- Haehnel, R. B., Blaisdell, G. L., Melendy, T., Shoop, S., & Courville, Z. A Snow Runway for Supporting Wheeled Aircraft. US Army ERDC-CRREL 2019, Technical Report TR-19-4. www.erdc.usace.army.mil.
- Smith, R.B. and Pratt, D.N. A Field Study of In-Situ California Bearing Ratio and Dynamic Cone Penetrometer Testing for Subgrade Investigation. Australian Road Research 1983, 13, 285–293. [Google Scholar]
- Zumrawi, M. M. E. Prediction of In-situ CBR of Subgrade Cohesive Soils from Dynamic Cone Penetrometer and Soil Properties. Int J of Engineering and Technology 2024, 6(5), 439–442. [Google Scholar] [CrossRef]
- USACE (U.S. Army Corps of Engineers). Standard Test Method for CBR of Soils in Place. Designation: CRD-C 654 1997.
- ASTM (American Society for Testing and Materials) International. Standard Test Method for CBR (California Bearing Ratio) of Soils in Place. Designation: D4429-09a 2009. West Conshohocken, PA.
- Zhuang, F. , Lu, P., Li, Z., Han, H., & Li, W. Modified Rammsonde tests in layered compacted snow. Advances in Polar Science 2019, 30(2), 118–131. [Google Scholar] [CrossRef]
- R Core Team. R: A language and environment for statistical computing. R Foundation for Statistical Computing 2021. Vienna, Austria. URL: https://www.R-project.org/.
- Wickham, H. Wickham, H., Averick, M., Bryan, J., Chang, W., McGowan, L., François, R., Grolemund, G., Hayes, A., Henry, L., Hester, J., Kuhn, M., Pedersen, T., Miller, E., Bache, S., Müller, K., Ooms, J., Robinson, D., Seidel, D., Spinu, V., … Yutani, H. Welcome to the Tidyverse. J of Open-Source Software 2019, 4(43), 1686. [Google Scholar] [CrossRef]
- Webster, S.L., R.W. Brown, J.R. Porter. Force Projection Site Evaluation Using the Electronic Cone Penetrometer (ECP) and the Dynamic Cone Penetrometer (DCP). U.S. Army Engineer Waterways Experiment Station 1994, Technical Report GL-94-17.
- Ramseier, R.O.; Keeler, C.M. The Sintering Process in Snow. J of Glaciology 1966, 6(45), 421–424. [Google Scholar] [CrossRef]
Figure 1.
Compacted snow pavement test section schematic showing the two locations where CBR and RSP strength measurements were collected (i.e., STA 1 and STA 2).
Figure 1.
Compacted snow pavement test section schematic showing the two locations where CBR and RSP strength measurements were collected (i.e., STA 1 and STA 2).
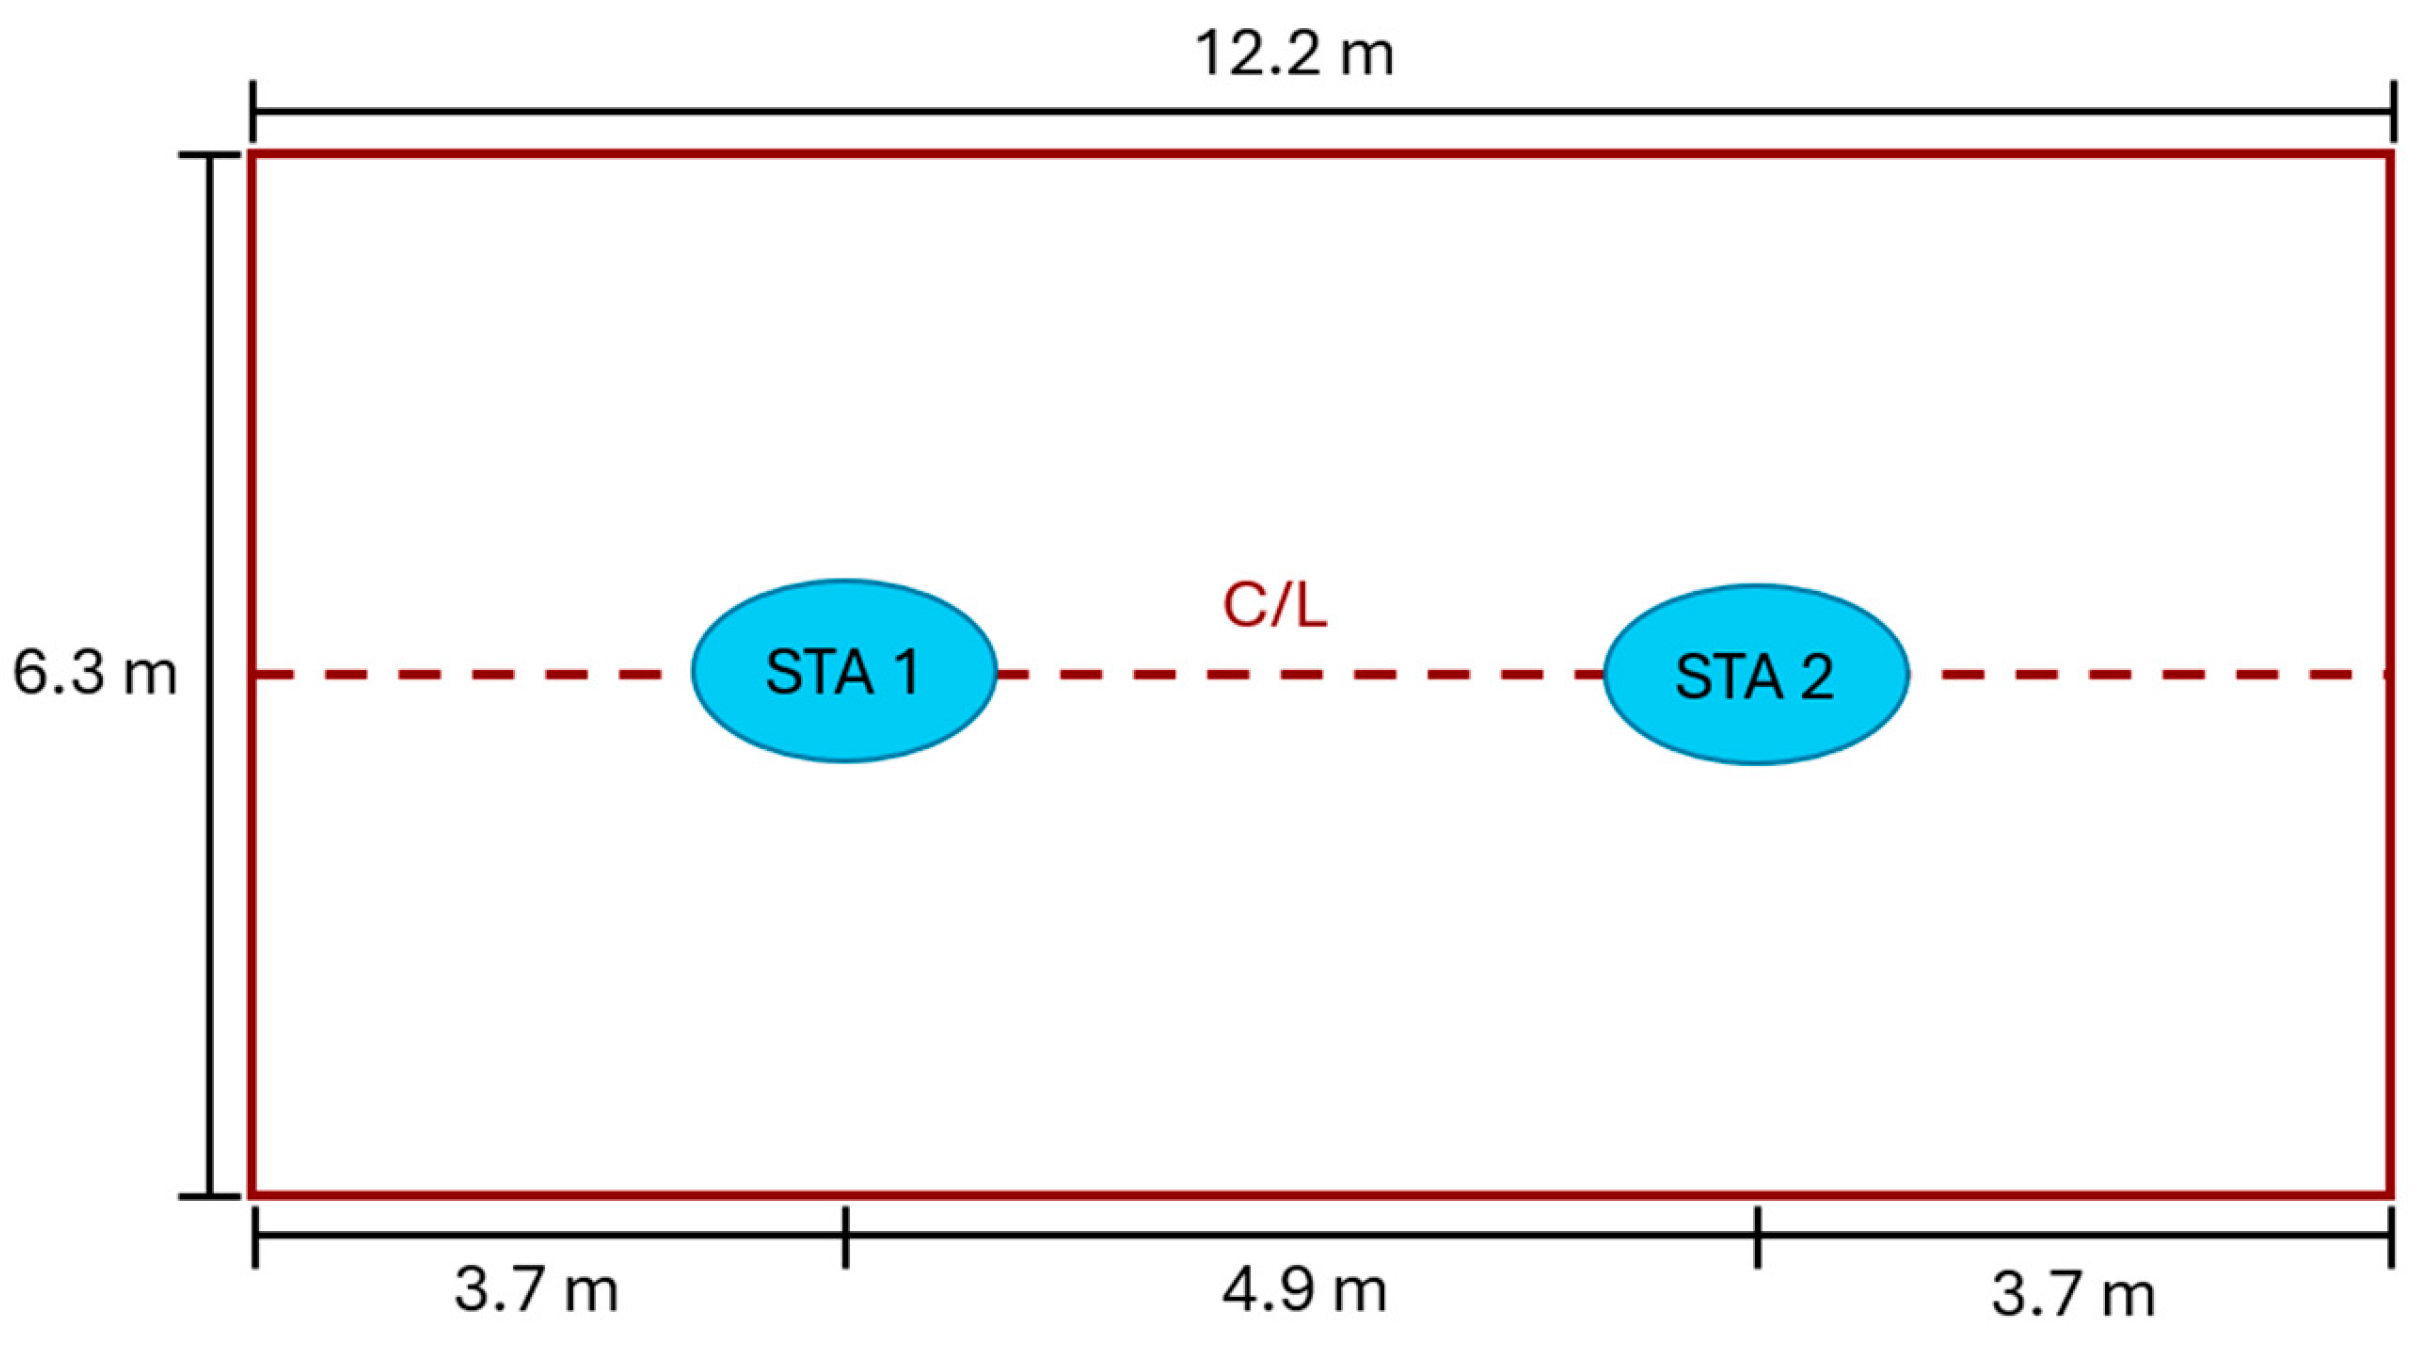
Figure 2.
Field CBR setup including the truck with reaction load in the bed, CBR beam, piston apparatus, jacks, base platforms, and plywood sheets used to avoid localized surface disturbance/rutting from the truck tires.
Figure 2.
Field CBR setup including the truck with reaction load in the bed, CBR beam, piston apparatus, jacks, base platforms, and plywood sheets used to avoid localized surface disturbance/rutting from the truck tires.
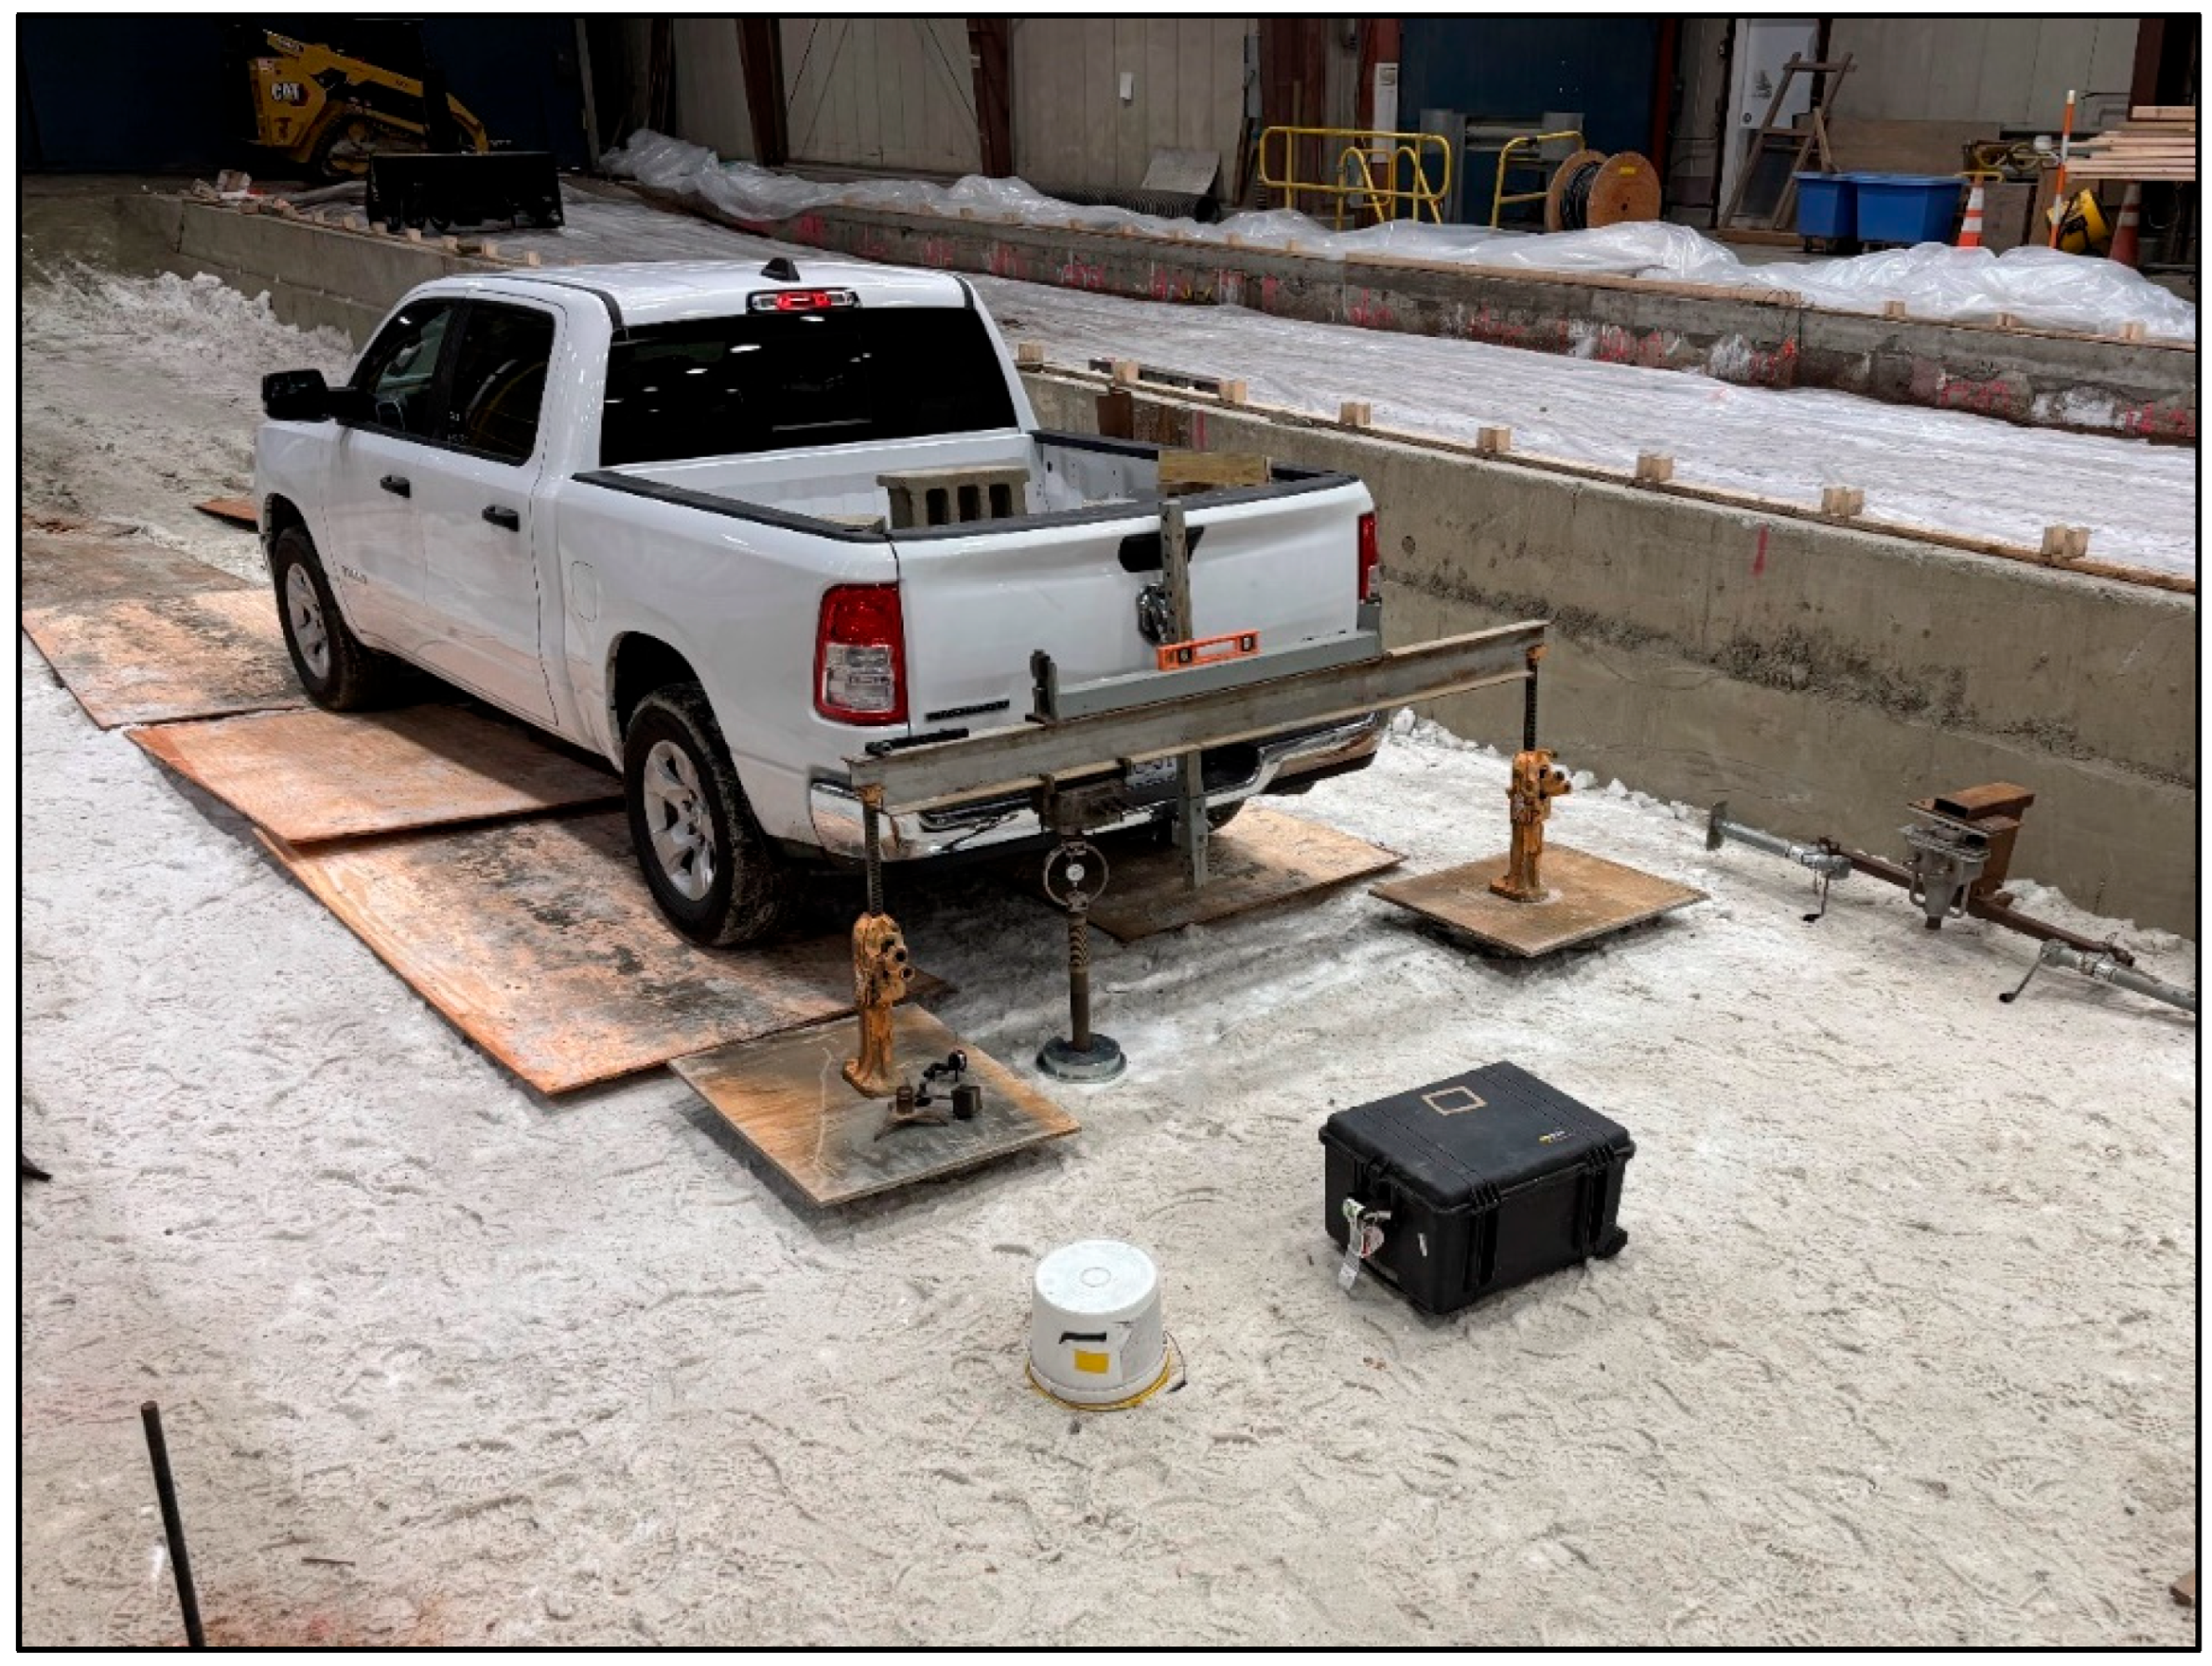
Figure 3.
A researcher performing the RSP method for measuring the strength of the compacted snow pavement test section prior to the corresponding CBR measurement.
Figure 3.
A researcher performing the RSP method for measuring the strength of the compacted snow pavement test section prior to the corresponding CBR measurement.
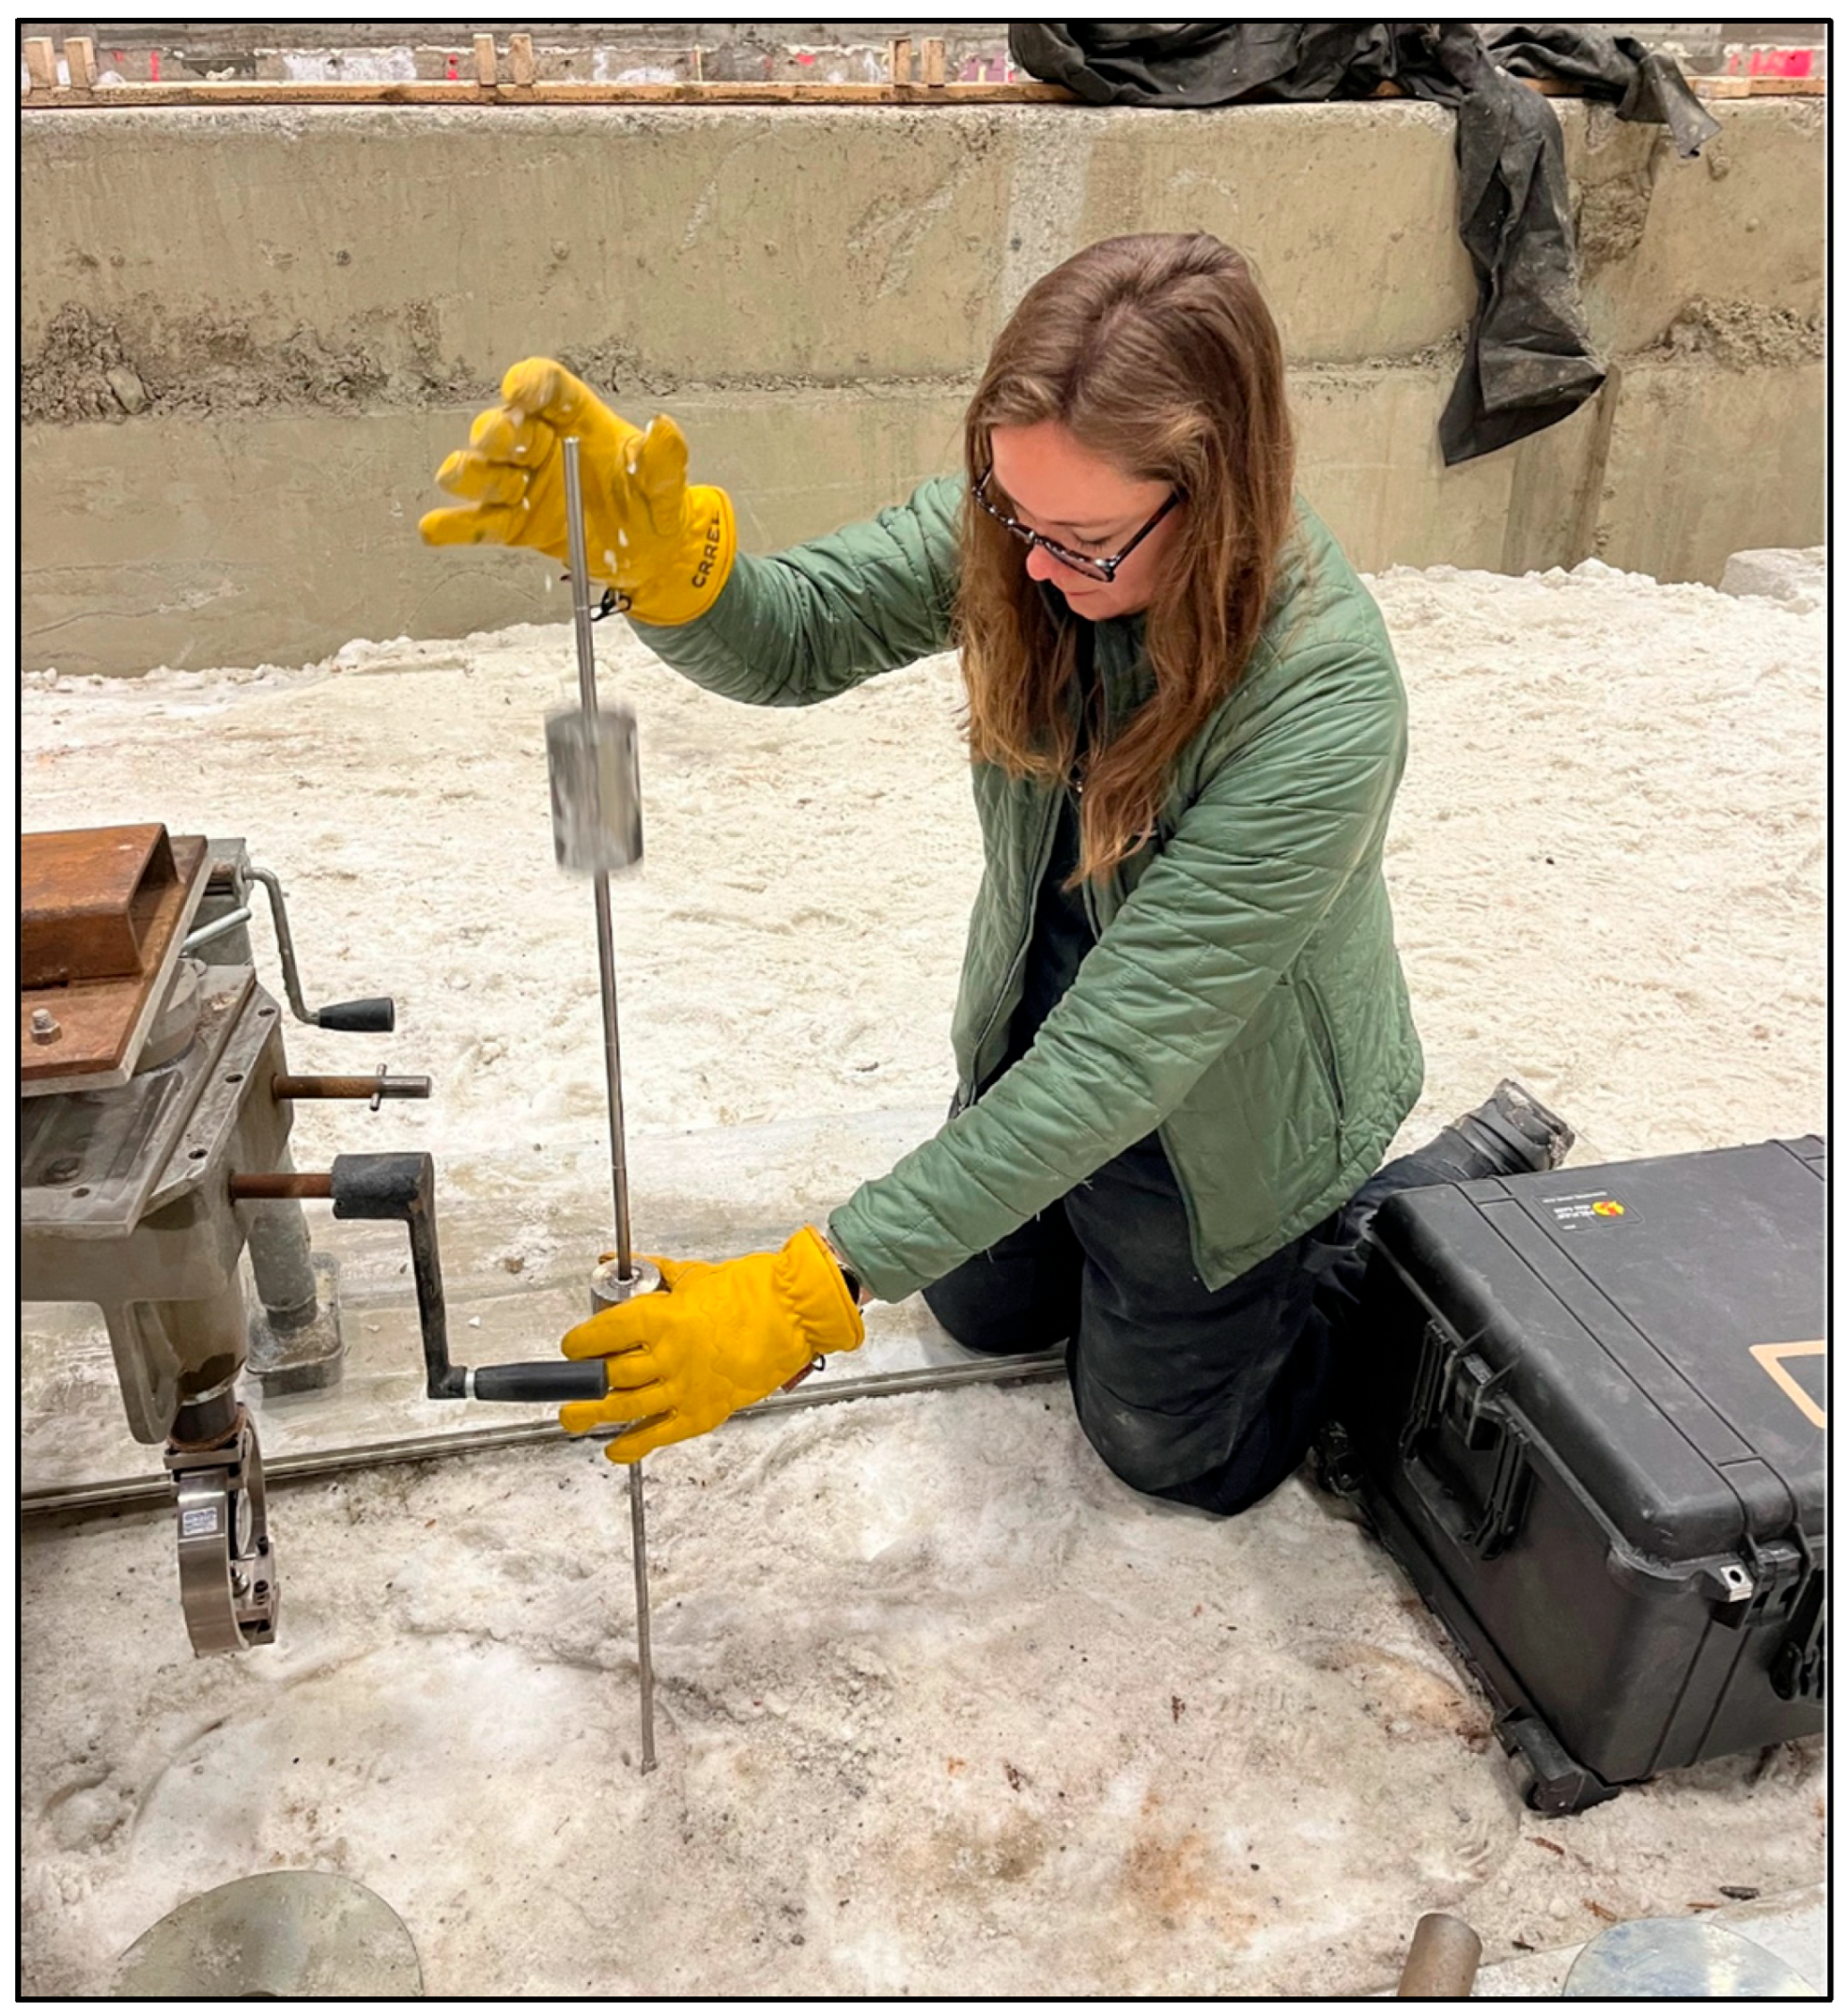
Figure 4.
Strength development over time as measured by field CBR at STA 1 and STA 2.
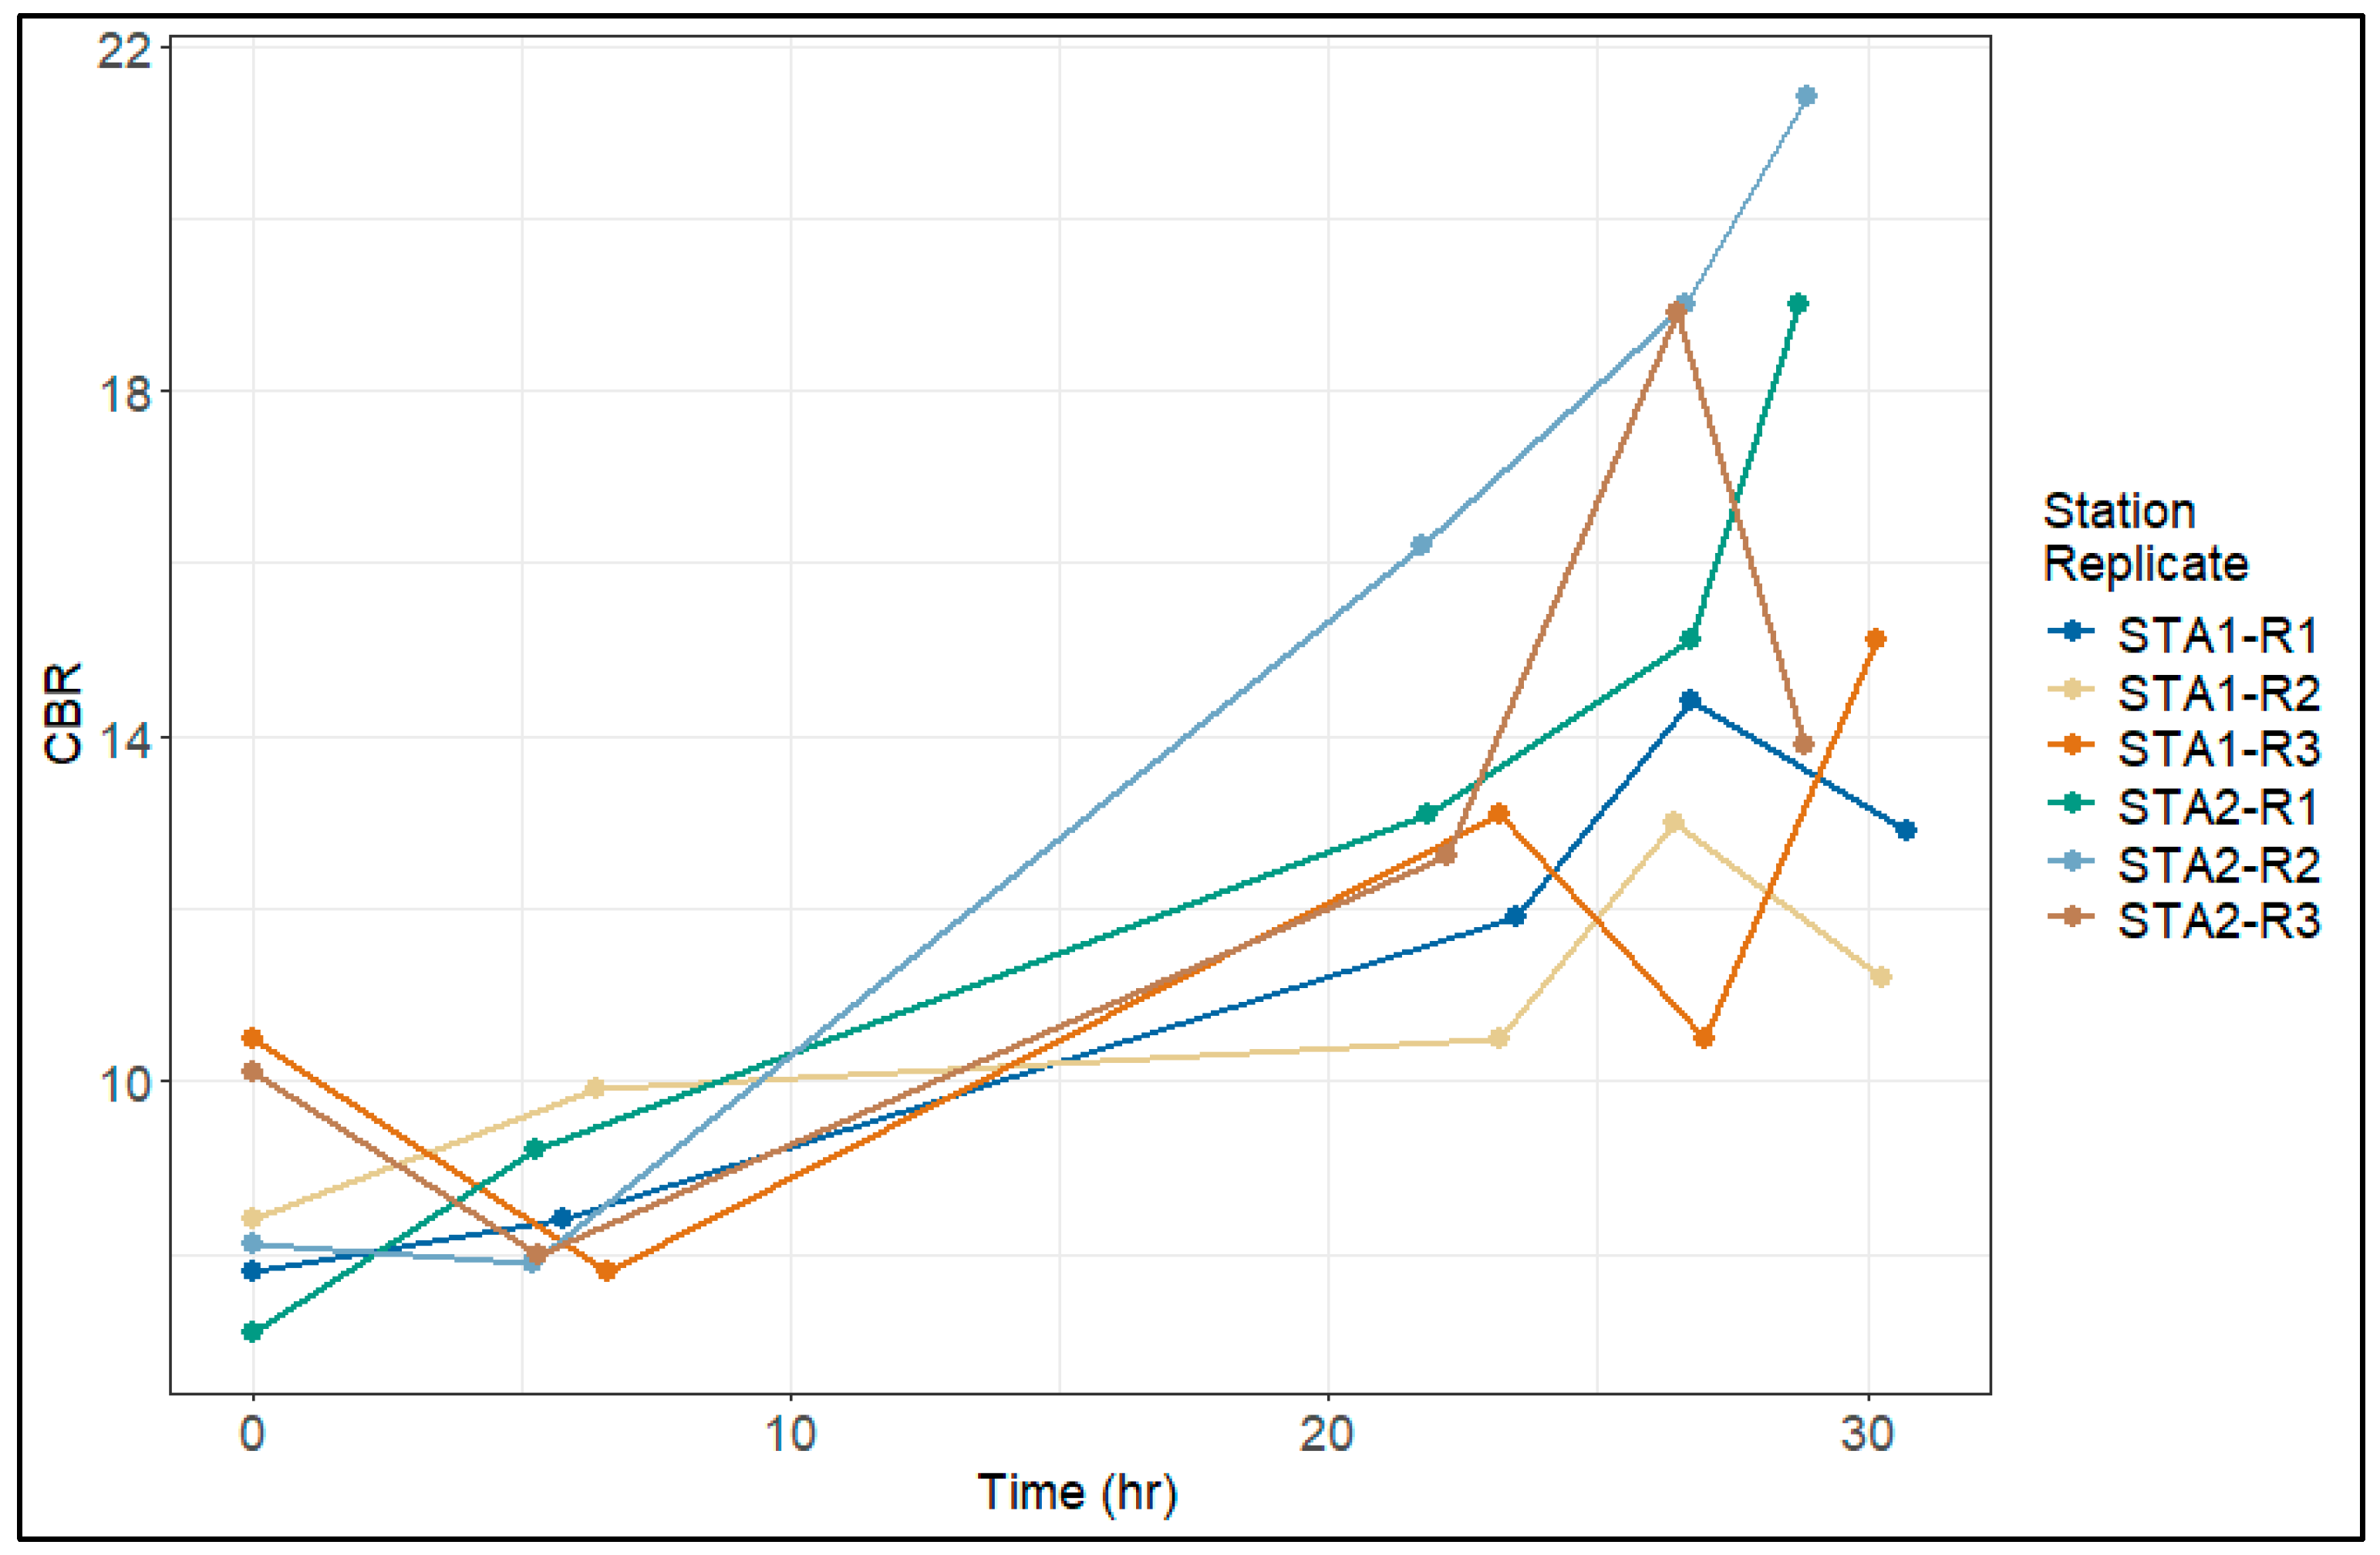
Figure 5.
Average field CBR for STA 1 and STA 2.
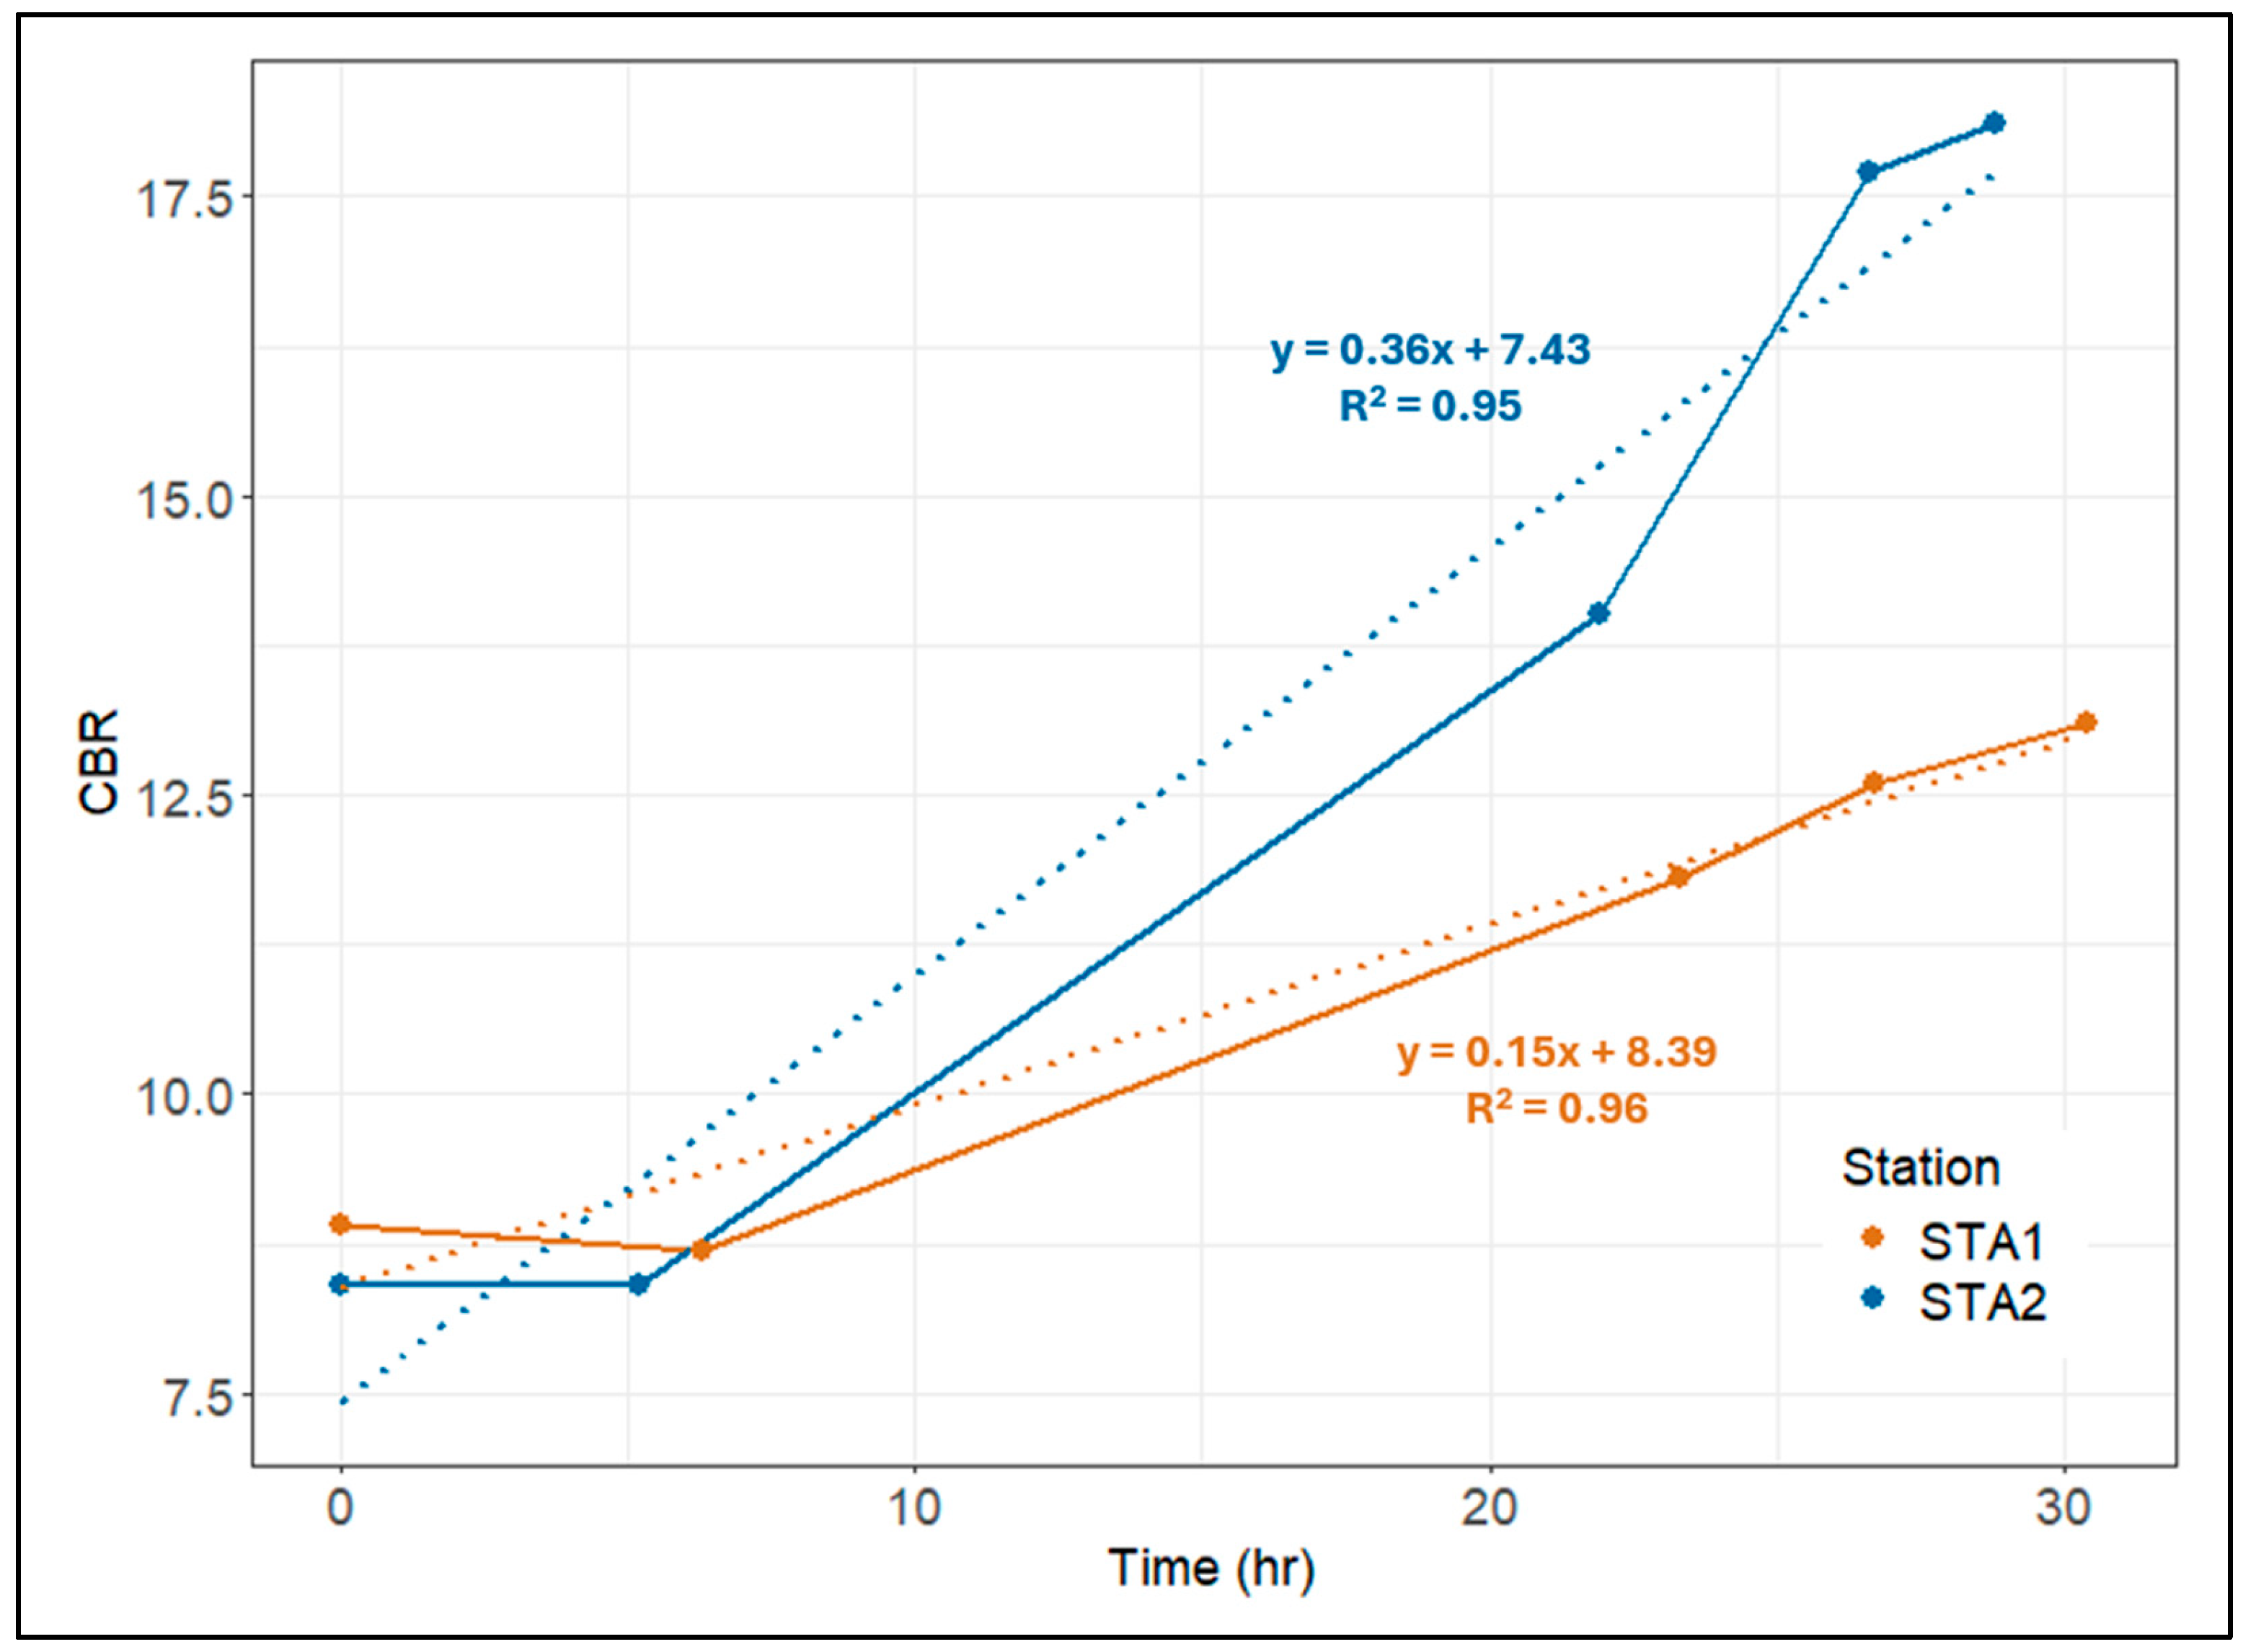
Figure 6.
RSP index across penetration depth (mm) for STA 1 and STA 2 (vertical facet) during Test 0-4 (horizontal facet). Each data series represents a replicate RSP test which are colored to show the CBR replicates (e.g. Test 0, STA 1, Replicate 1) that they each correspond to. Vertical red lines indicate the minimum required RSP strength index to support an aircraft load of 227,000 kg. The vertical dashed black lines indicate average RSP index.
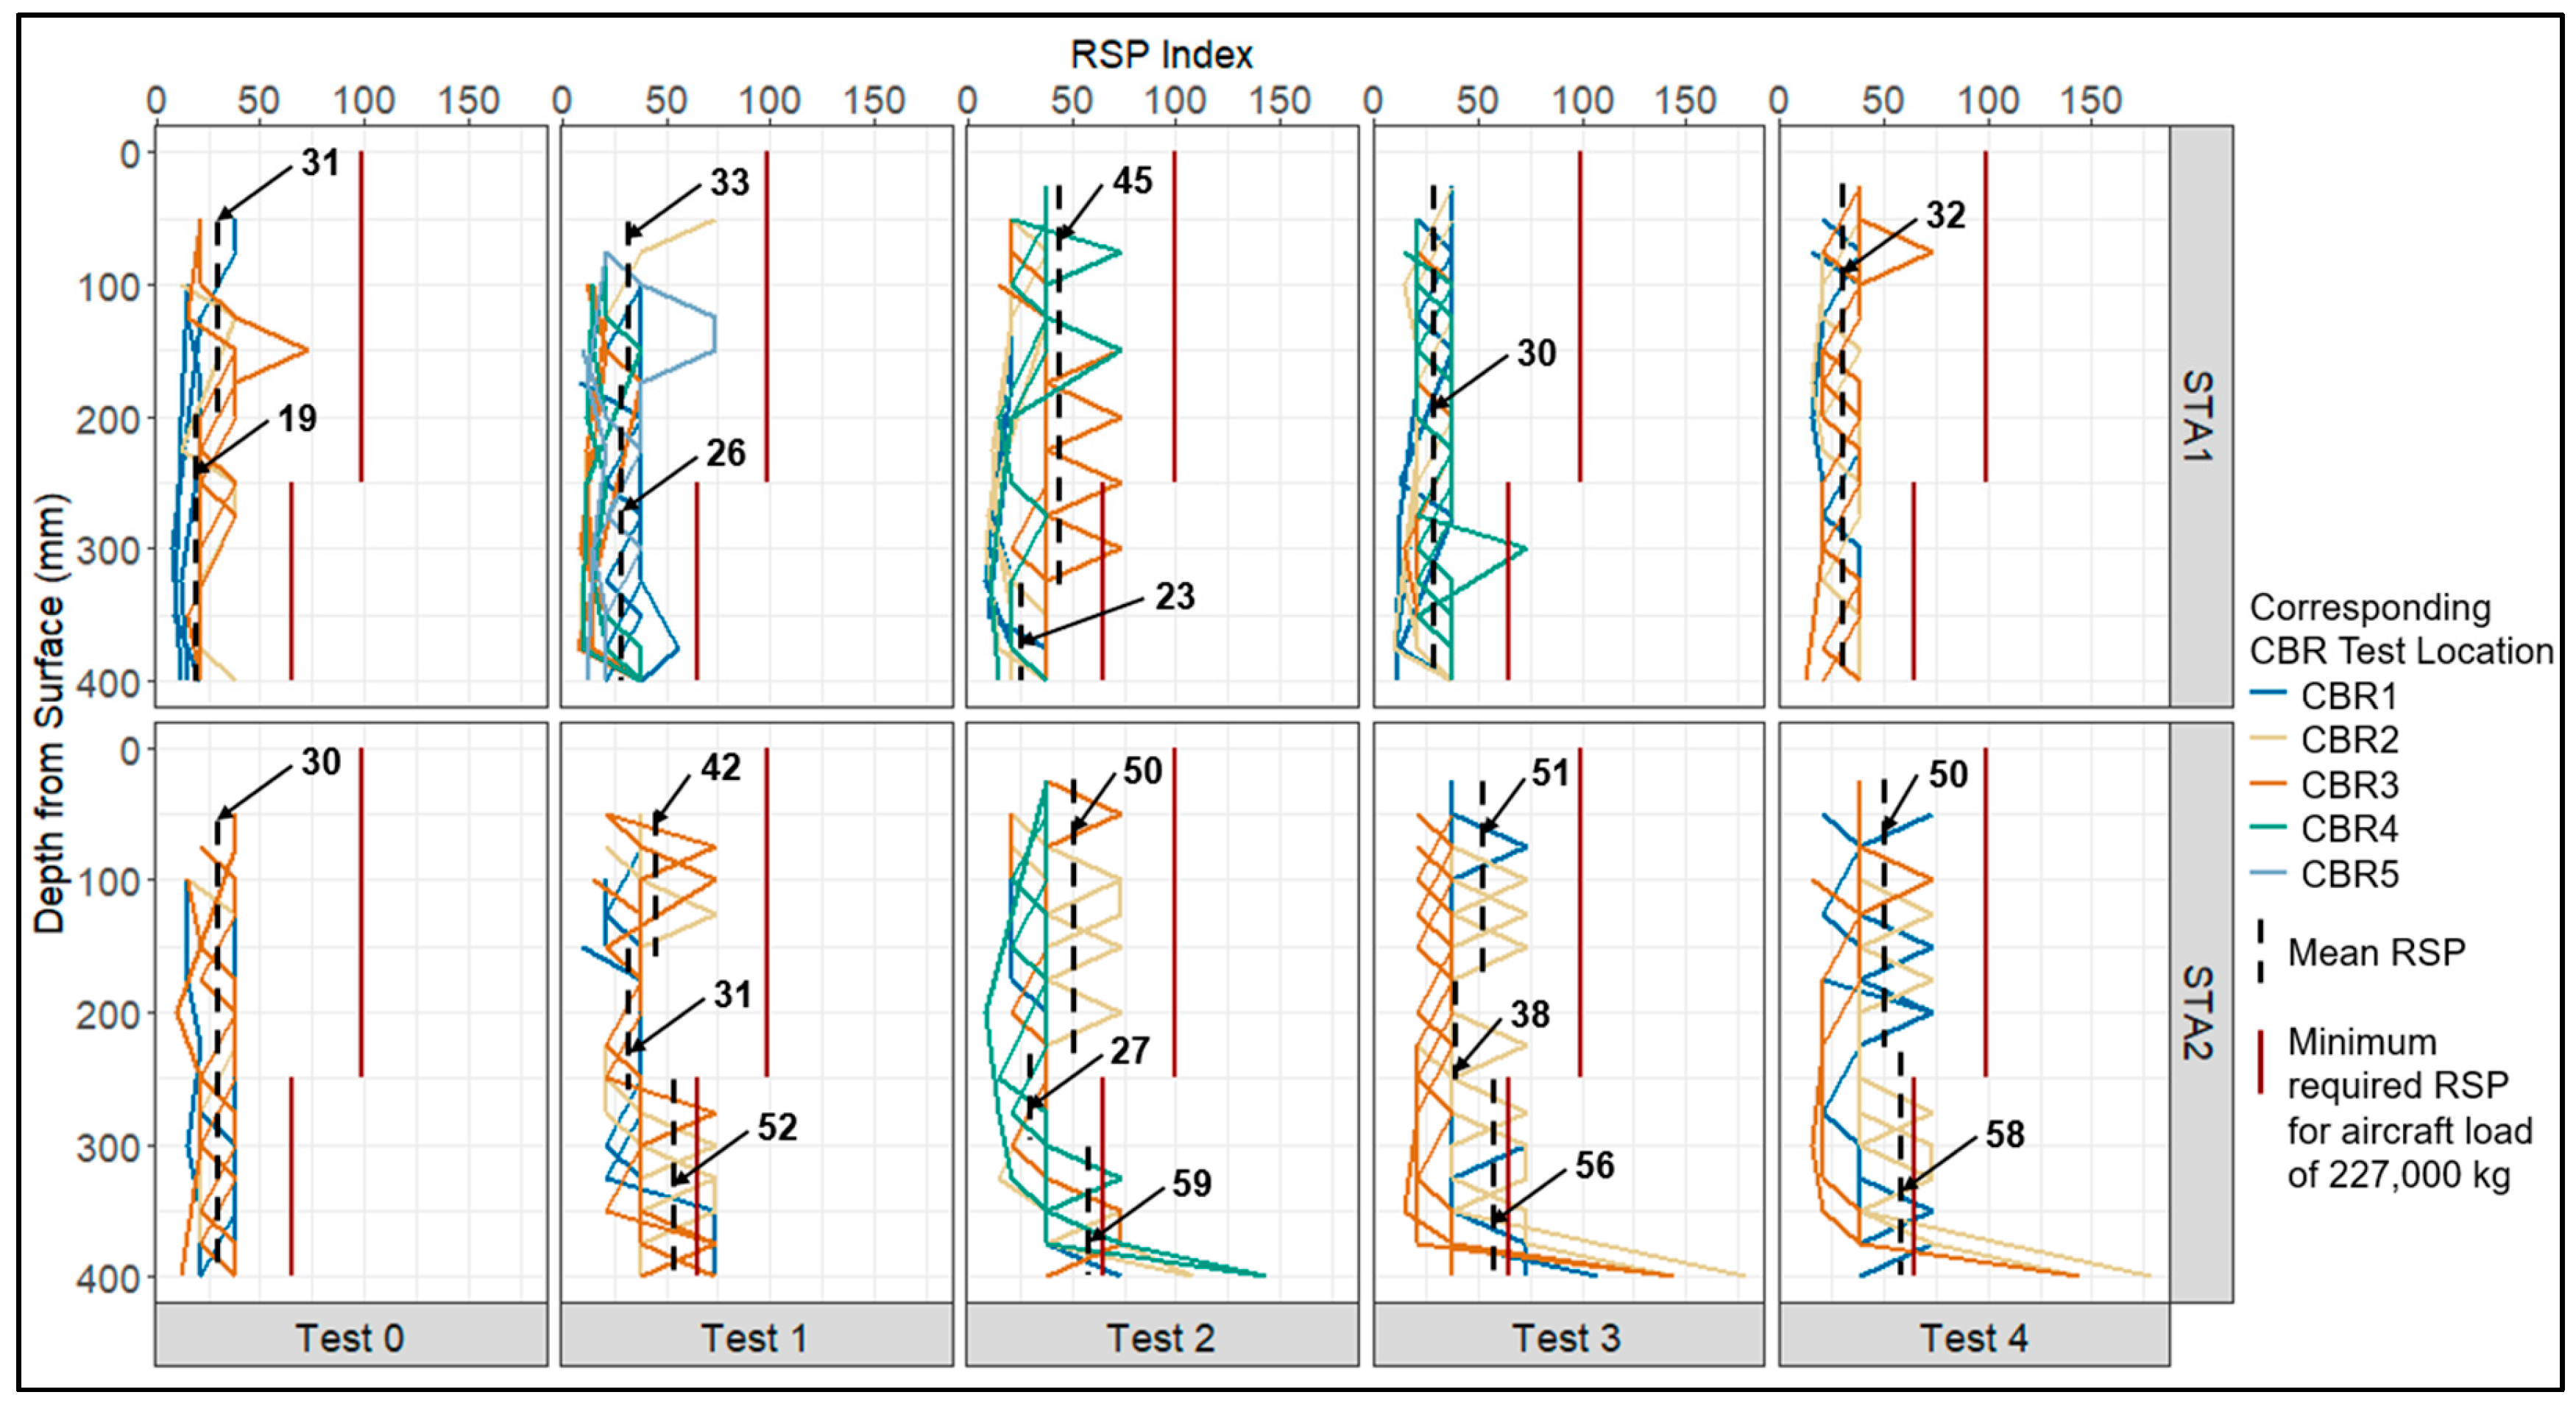
Figure 7.
Average RSP strength over time at Station 1 and Station 2.
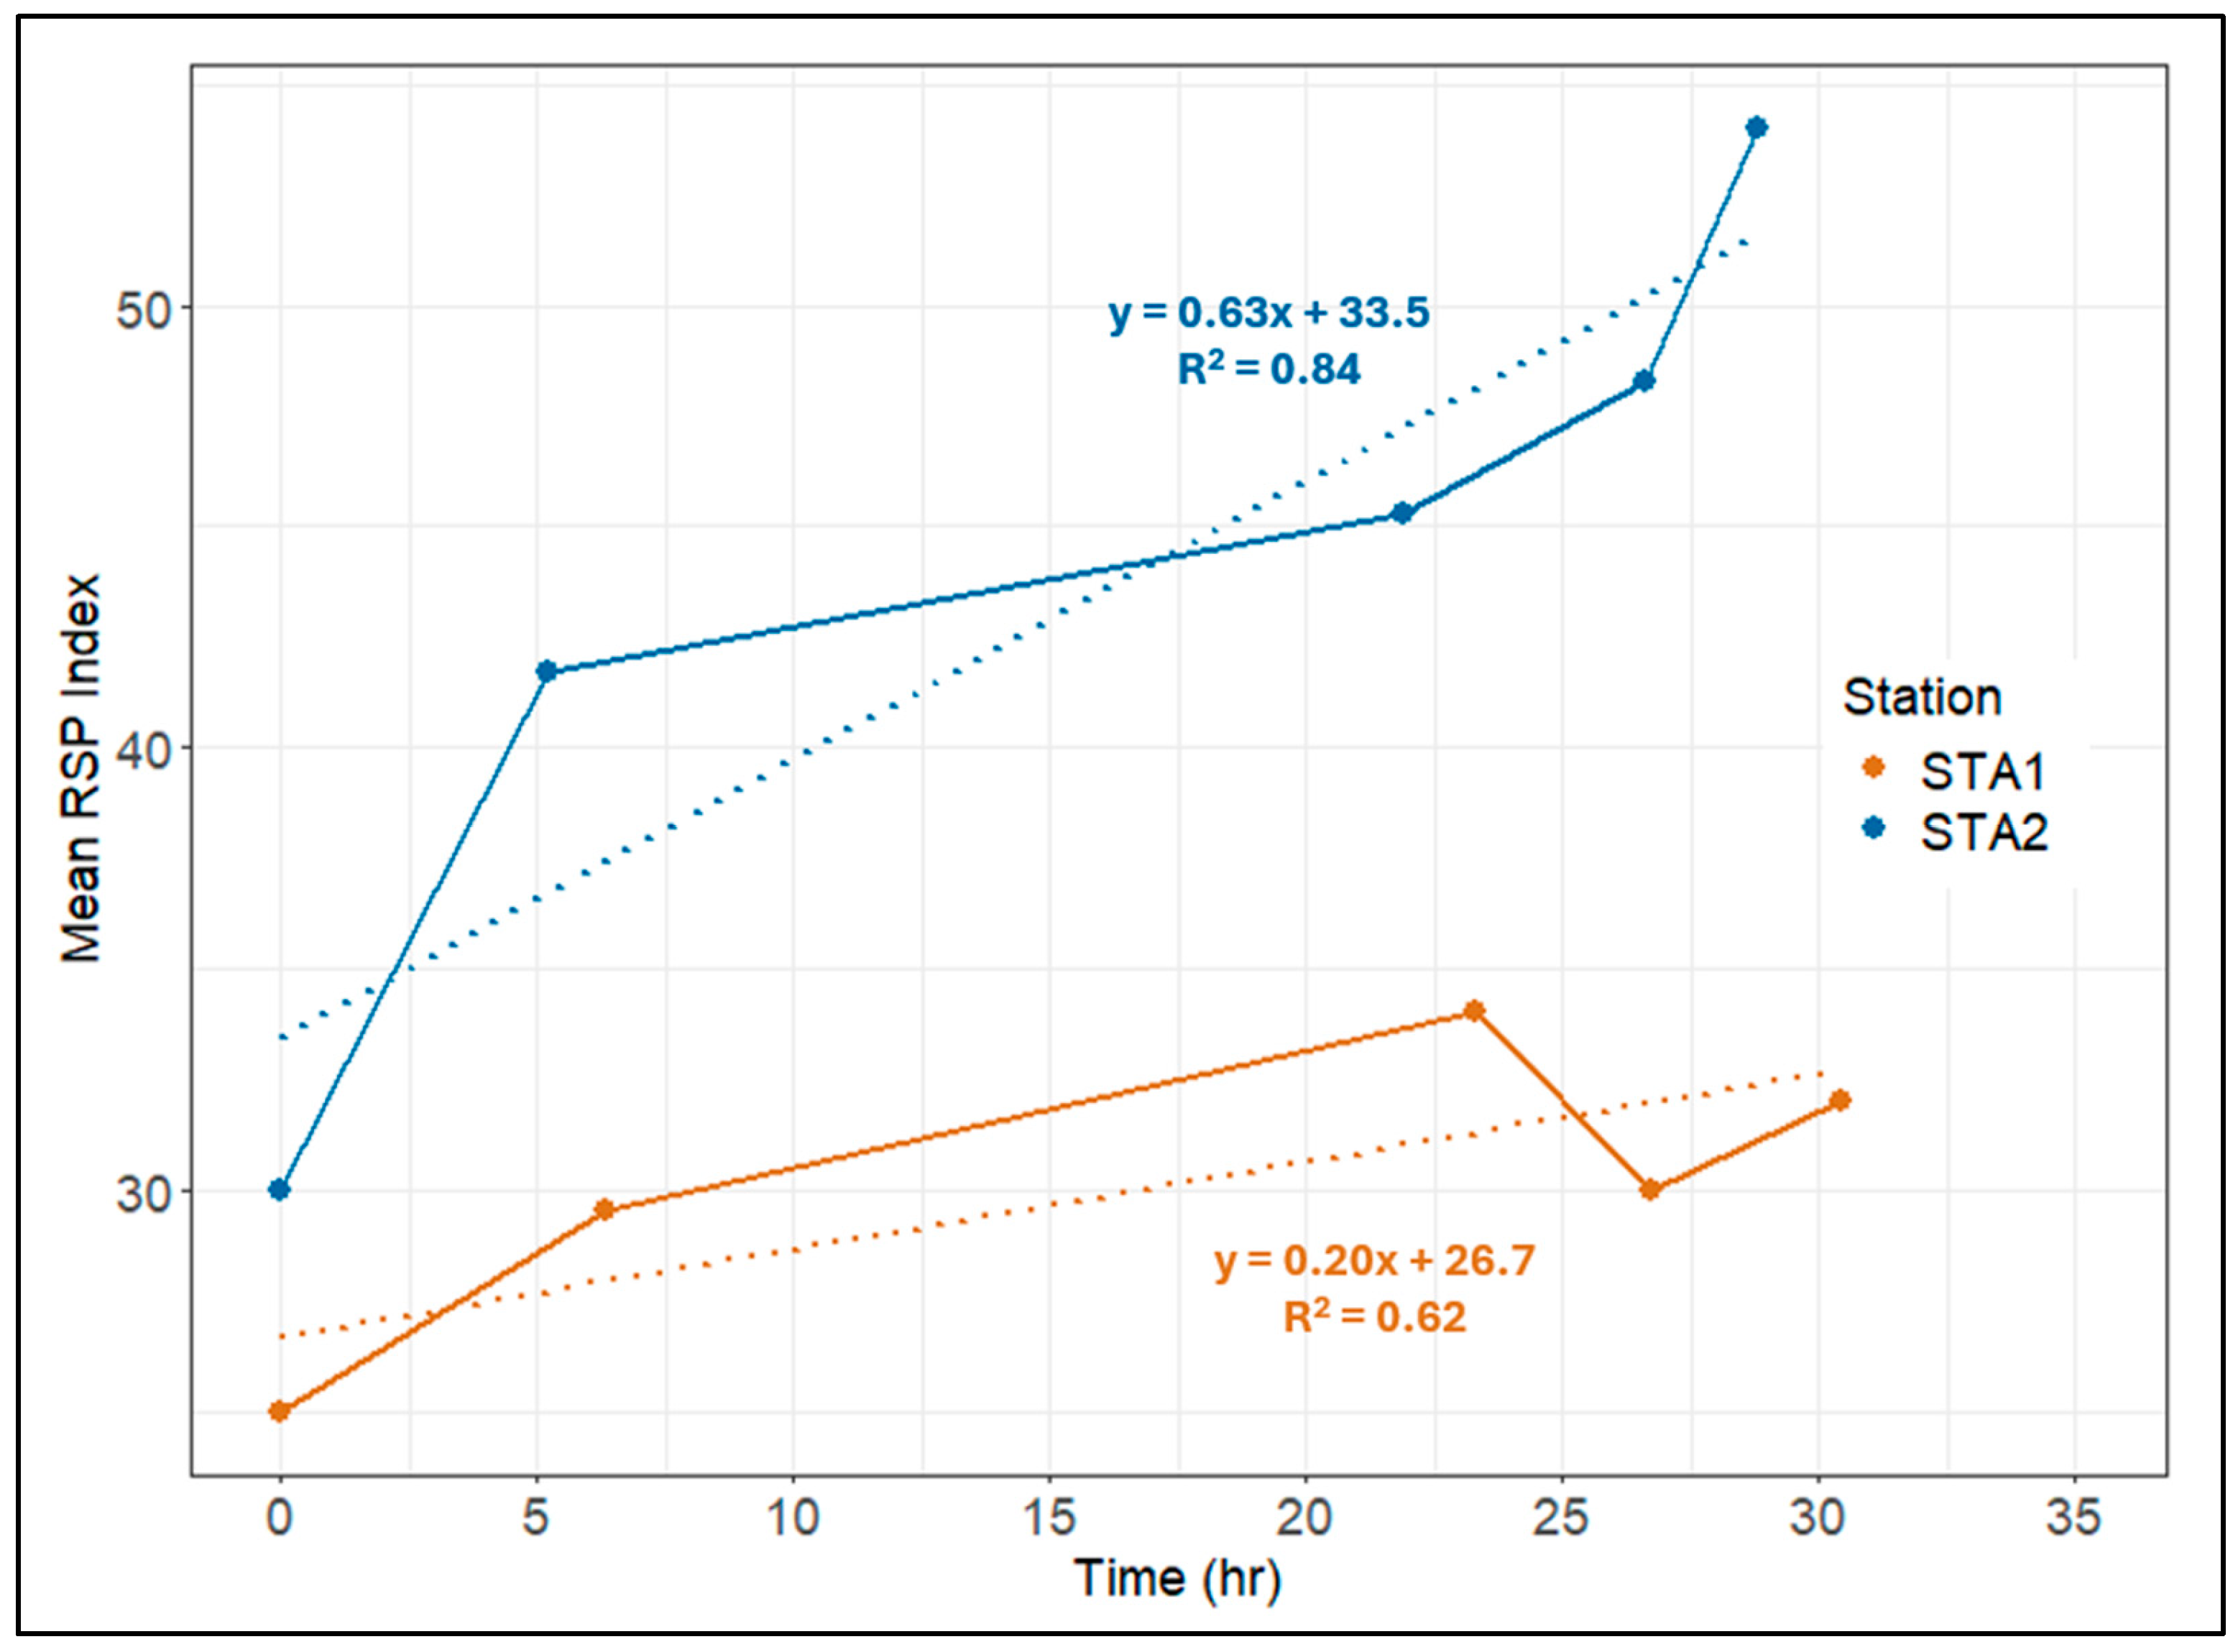
Figure 8.
Linear relationship between snow pavement CBR and RSP strength.
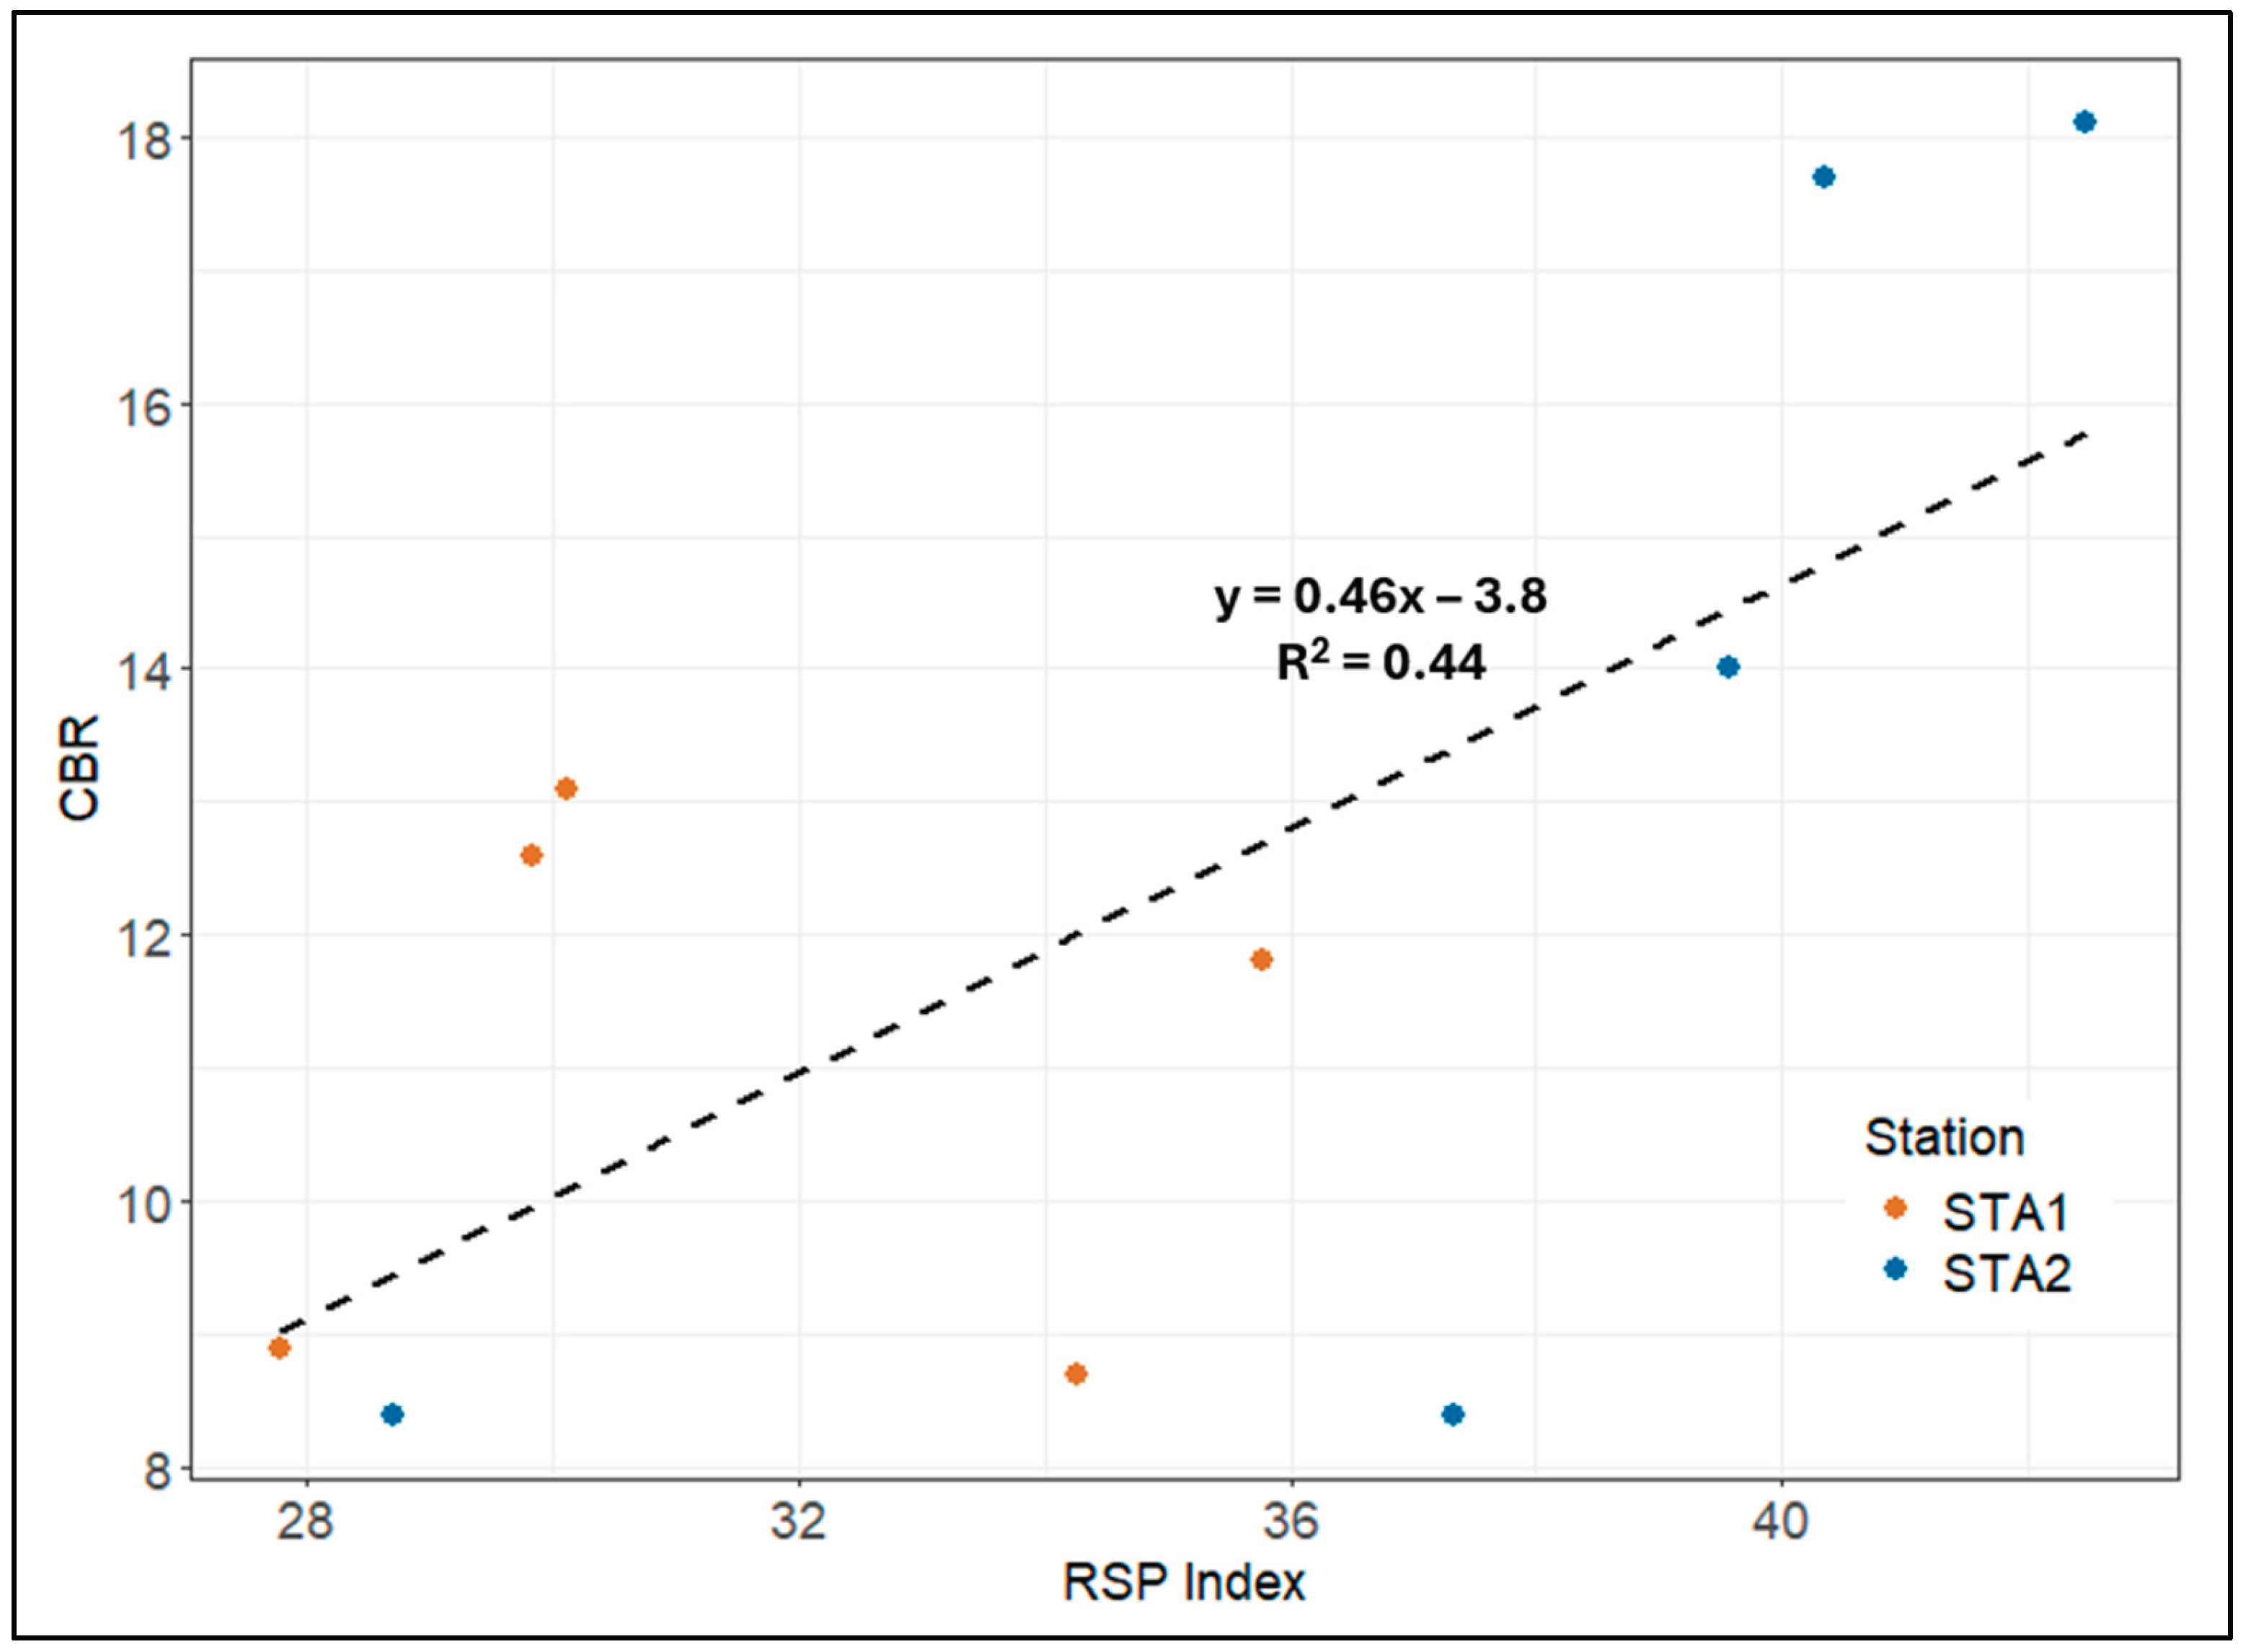

Table 1.
Time points for CBR and RSP strength measurement collection. The snow pavement test section was allowed to harden overnight (i.e., approximately 12 hours) prior to Test 0, but this is considered "time 0" and is therefore referred to as initial snow placement.
Table 1.
Time points for CBR and RSP strength measurement collection. The snow pavement test section was allowed to harden overnight (i.e., approximately 12 hours) prior to Test 0, but this is considered "time 0" and is therefore referred to as initial snow placement.
| Test Number | Time |
| Test 0 | Initial Snow Placement |
| Test 1 | 6 hr post-construction |
| Test 2 | 23 hr post-construction |
| Test 3 | 27 hr post-construction |
| Test 4 | 30 hr post-construction |
Disclaimer/Publisher’s Note: The statements, opinions and data contained in all publications are solely those of the individual author(s) and contributor(s) and not of MDPI and/or the editor(s). MDPI and/or the editor(s) disclaim responsibility for any injury to people or property resulting from any ideas, methods, instructions or products referred to in the content. |
© 2025 by the authors. Licensee MDPI, Basel, Switzerland. This article is an open access article distributed under the terms and conditions of the Creative Commons Attribution (CC BY) license (http://creativecommons.org/licenses/by/4.0/).
Copyright: This open access article is published under a Creative Commons CC BY 4.0 license, which permit the free download, distribution, and reuse, provided that the author and preprint are cited in any reuse.


