1. Introduction
In recent years, there has been a notable increase in reports on self-calibrated biosensors, particularly in context of continuous glucose monitoring (CGM) [
1,
2,
3]. Beyond glucose, wearable systems have been developed for real-time monitoring of pH, concentrations of ions (K
+, Na
+, Cl¯), lactate, uric acid [
4], essential amino acids, and some other analytes in various biological fluids [
5,
6]. One of the primary challenges is permanent requirement for calibration, as the sensor sensitivity tends to decline over time [
7]. Typical periodic calibration of CGM device involves frequent fingertip blood glucose measurements [
8]. However, constant recalibration against a standard would be unnecessary if the sensor autocalibration is enabled. Consequently, several approaches nave been introduced to regulate sensor sensitivity during operation, including the self-calibration algorithms [
9], compensation methods [
10], self-cleaning mechanisms to prevent electrode fouling [
11], and multi-parametric calibration [
1].
Self-calibration can utilize multiple sensors to measure blank current (in the absence of analyte) [
12] or other control signals or parameters such as pH [
13,
14], concentration of electrolytes [
15], dissolved oxygen [
16], and others. Sensors may be equipped with dynamic calibration algorithm such as sparse identification of nonlinear dynamics (SINDy), which provide the model-predicted output for identification and validation of the experiments [
9]. Autorecalibration via dual-mode sensing in optical glucose monitoring systems involves detection of undesirable degradation of the sensing layer using two strongly correlated signals (absorbance and fluorescence), which are used to correct the calibration curve without requiring external calibration [
10]. Self-calibration using pre-stored calibrant solutions embedded in the chip during manufacturing has been demonstrated in microfluidic paper-based device for colorimetric glucose and lactate detection [
17]. An electrochemical CGM sensor developed by Medtronic Ltd. supports a self-calibration algorithm based on electrochemical impedance spectroscopy, due to the relation between double-layer capacitance, charge-transfer resistance, and sensor sensitivity [
2,
18]. Additionally, system combines outputs from multiple dynamic models to provide a final glucose concentration along with a confidence level.
One of the most well-known components of electrochemical enzymatic biosensors is Prussian blue (PB), which was discovered as an electrocatalyst for H
2O
2 reduction in the 1990s [
19]. PB-based biosensors offer reliable detection of sweat glucose for continuous diabetes monitoring [
20], as well as sweat lactate measurement during on-body hypoxia monitoring in sportsmen training [
21]. The correlation between blood and sweat metabolite levels proves the diagnostic value of continuous sweat analysis [
20,
22]. In addition to glucose and lactate, hydrogen peroxide itself is also considered an important biomarker associated with oxidative stress. Conditions such as asthma, chronic obstructive pulmonary disease, lung cancer, and even post-COVID-19 syndrome can be monitored through exhaled breath aerosol analysis using PB-based sensors [
23,
24]. Wearable sensors for real-time hydrogen peroxide detection in exhaled breath are also of particular interest [
25].
Among the major advances of PB-based (bio)sensors over Pt-based ones are their practical insensitivity to reductants able to generate false-positive signals significantly overstating real glucose levels, and their resistivity to poisoning by certain components in biological liquids, like sweat [
26]. However, the solubilization of Prussian blue by hydroxide ions, which are formed during the catalytic cycle [
27], leads to inevitable loss of sensitivity. In order to extend sensor lifetime two main strategies were employed, namely sensor stabilization through protective coatings [
21] or the use of composite materials, such as mixed metal hexacyanoferrates [
28,
29,
30].
Upon continuous monitoring the (bio)sensor lifetime is limited by its operational stability under the hardest conditions possible. Since Prussian Blue is redox electrocatalyst being electroactive itself, its activity onto the electrode surface can be independently evaluated using dynamic voltametric method. Herewith we report that periodic run of square wave voltammograms upon continuous chronoamperometric monitoring by Prussian Blue based (bio)sensors enables their self-recalibration, dramatically prolonging the operation time.
2. Materials and Methods
2.1. Materials
Experiments were carried out with Milli-Q water (18.2 MΩ·cm) at room temperature. The following reagents were used: hydrogen peroxide H2O2 (30% solution), iron (III) hexacyanoferrate K3[Fe(CN)6], potassium chloride KCl, iron (III) chloride FeCl3, chitosan with various molecular weight (Sigma Aldrich, USA), perfluorosulfonated ionomer (PFSI) MF4 SK (Plastpolymer, Russia). All compounds were of analytical grade or chemically pure and used without additional purification. Glucose oxidase (GOx, EC1.1.3.4) from Aspergillus niger was used in the form of a lyophilized protein with a declared activity of 248 U/mg. (Sigma Aldrich, USA) Lactate oxidase (LOx, EC1.1.3.2) from Pediococcus species (Sorachim, Switzerland) was used in the form of a lyophilized protein with a declared activity of 109 U/mg. All compounds were of analytical grade or chemically pure and used without additional purification. Planar screen-printed electrode structures containing carbon working electrode (Ø = 1.8 mm), carbon auxiliary and silver reference electrodes were fabricated by Rusens (Russia).
2.2. Instrumentation
Electrochemical measurements were carried out using a Palmsens potentiostats (PalmSens BV, The Netherlands) with the PSTrace software.
2.3. Methods
2.3.1. Synthesis of Prussian Blue
Sensors were manufactured using interphase synthesis or electrochemical synthesis of Prussian blue (PB) described earlier. Briefly, interfacial modification of planar sensors with PB included casting a droplet of of K3[Fe(CN)6] and FeCl3 mixture in 0.1 M KCl, 0.1 M HCl with further reduction with H2O2. Deposition was initiated with addition of H2O2 and proceeded for 20-45 minutes at room temperature. Following deposition, the mixture was washed off with water. The PB layer was then activated via cyclic voltammetry in a 0.1 M KCl and 0.1 M HCl solution within a potential range of -0.05 V to +0.35 V vs. Ag|AgCl at a scan rate of 40 mV·s−1 until a stable voltammogram was obtained. Finally, the sensors were heated at 100 °C for one hour.
Electrochemical deposition of PB on screen-printed electrodes was conducted by recording cyclic voltammograms in a potential range of +0.40 V to +0.75 V vs. Ag|AgCl. at a scan rate of 20–40 mV·s−1 in an equimolar mixture of K3[Fe(CN)6] and FeCl3 in 0.1 M KCl, 0.1 M HCl. The PB film thickness was controlled by varying the number of cycles. Activation of the coatings was performed utilizing the same protocol as that employed for the interphase synthesis. The surface concentration of electroactive PB (ГPB) was calculated from the peak area on the voltammogram using PS Trace software.
2.3.2. Preparation of Glucose Biosensors
Biosensors were made with suspending glucose oxidase aqueous solution (10 mg/mL) in isopropanol containing perfluorosulfonated ionomer (0.3%). The final concentration of the enzyme was 1.5 mg/mL. The resulting mixture (2 μL) was deposited onto the Prussian Blue modified working electrode and dried at room temperature. After this procedure, the biosensors were kept at 4 ◦C in sealed packaging.
2.3.3. Preparation of Lactate Biosensors
Biosensors were made with suspending lactate oxidase aqueous solution (10 mg/mL) in aqueous solution of chitosan (0.05%). The final concentration of the enzyme was 1.5 mg/mL. The resulting mixture (2 μL) was deposited onto the Prussian Blue modified working electrode and dried at room temperature. After this procedure, the biosensors were kept at 4 ◦C in sealed packaging.
2.4. Electrochemical Measurements
The (bio)sensor response was measured at room temperature using chronoamperometry in batch regime under constant stirring. Measurements were conducted at Edc = 0.0 V vs. Ag|AgCl in a 0.05 M phosphate buffer with 0.1 M KCl at pH 6.0.
For recalibration square-wave voltammograms (SWV) were periodically recorded in the same phosphate buffer within a potential range of -0.05 V to +0.35 V vs. Ag|AgCl, with an amplitude of 10–50 mV, and a frequency of 1–4 Hz. The intervals between these SWV runs, during which chronoamperometry was performed, lasted between 100 and 600 seconds.
3. Results and Discussion
Calibration of Prussian blue-based sensors during continuous monitoring is based on the dependence of sensor response to hydrogen peroxide on the surface concentration of electrocatalyst. Sensors were manufactured using interphase synthesis or electrochemical synthesis of Prussian blue. The last one allows controlling the surface concentration of PB (ГPB) on the working electrode by selecting the number of cycles in cyclic voltammetry. ГPB was calculated from the peak area of the transition “Prussian white”—“Prussian blue” in the CV recorded during sensor activation. Sensors with concentration of PB from 0.02 to 6.67 nmol·cm-2 were obtained.
In average the sensitivity of the sensors was 471 ± 8 mA·M-1·cm-2, the working range was 3 orders of magnitude (1·10-6 to 1·10-3 M), which is in good agreement with the previous studies. However, the stability of peroxide sensors (t90, time of preservation of 90% of the initial response) does not exceed 5 minutes if surface concentration of PB is 1.5–2 nmol·cm-2. As mentioned, Prussian Blue suffers from solubilization by hydroxyl ion produced in course of H2O2 reduction. Hence, for continuous monitoring the sensor and biosensor lifetimes would be limited by the duration of 90% stability in the analyte solutions. Nevertheless, even after 50% loss of sensitivities the (bio)sensors are expected to be suitable for further operation, to prolong the lifetimes it is necessary to carry out calibration keeping the (bio)sensors in the analyzed solution.
3.1. Prussian Blue Surface Concentration Control Using Square Wave Voltammetry
Since Prussian Blue possesses intrinsic electroactivity, such calibration is possible by dynamic voltammetry. Among the latter the square-wave voltammetry seems to be less sensitive to the presence of catalytic reactions. In contrast to cyclic voltammetry catalytic reactions has virtually no effect on SWV [
31], which makes this method suitable for controlling concentration of electrocatalyst in the presence of the analyte. The forward and backward currents of the reversible transition Prussian Blue/Prussian White are recorded during square wave voltammetry. The presence of hydrogen peroxide affects both current components of voltammogram, but their superposition remains stable (
Figure S1). Indeed, the potential and the height of the peak in the SWV less depends on hydrogen peroxide concentration. Furthermore, the peak current on the square wave voltammogram changes within 10-15% upon changing hydrogen peroxide concentration within three orders of magnitude (
Figure S2). Therefore, it can be considered that the peak height on the SWV depends mainly on the remaining surface concentration of PB if recorded during chronoamperometry.
The parameters of the SWV, the frequency and amplitude were optimized.
Figure S3 shows the dependences of the peak height in the SWV on the surface concentration of PB at frequencies of 1 and 4 Hz and an amplitude from 10 to 50 mV. Linear increase in the peak current is observed up to 2–3.5 nmol·cm
-2. Upper limit of the linear range slightly decreases with an increase in frequency, but the sensitivity (the slope of the linear section) and the speed of recording the SWV become significantly higher. For instance, at a frequency of 4 Hz, the I
peak increases by 3-5 times compared to 1 Hz. Moreover, the sensitivity increases with increasing amplitude up to 40 mV, above which it practically does not change. However, it was found that increasing the amplitude above 20 mV is undesirable, since it has a negative effect on the printed reference electrode. Recording the SWV at a frequency of 1 Hz takes about 2 minutes, and at a frequency of 4 Hz—half a minute, which is a significant difference for the long-term monitoring. Hence, the following SWV conditions were chosen for further experiments: frequency 4 Hz, amplitude 20 mV.
3.2. Recording Square Wave Voltammograms During Chronoamperometric Analysis
The idea of sensor calibration during chronoamperometric analysis is based on periodical run of the square wave voltammetry and recalculating the sensor sensitivity using peak current of voltammogram. Accordingly, in course of chronoamperometric analysis the SW voltammograms have been periodically recorded. It was found out, that recording SWV does not affect the stability of the chronoamperometric response. Serial chronoamperograms recorded for a certain period of time (100s) in 1mM H
2O
2 solution and the corresponding square wave voltammograms are presented in (
Figure S4). It is seen that with each repetition current decreases in both chronoamperograms and square wave voltammograms (
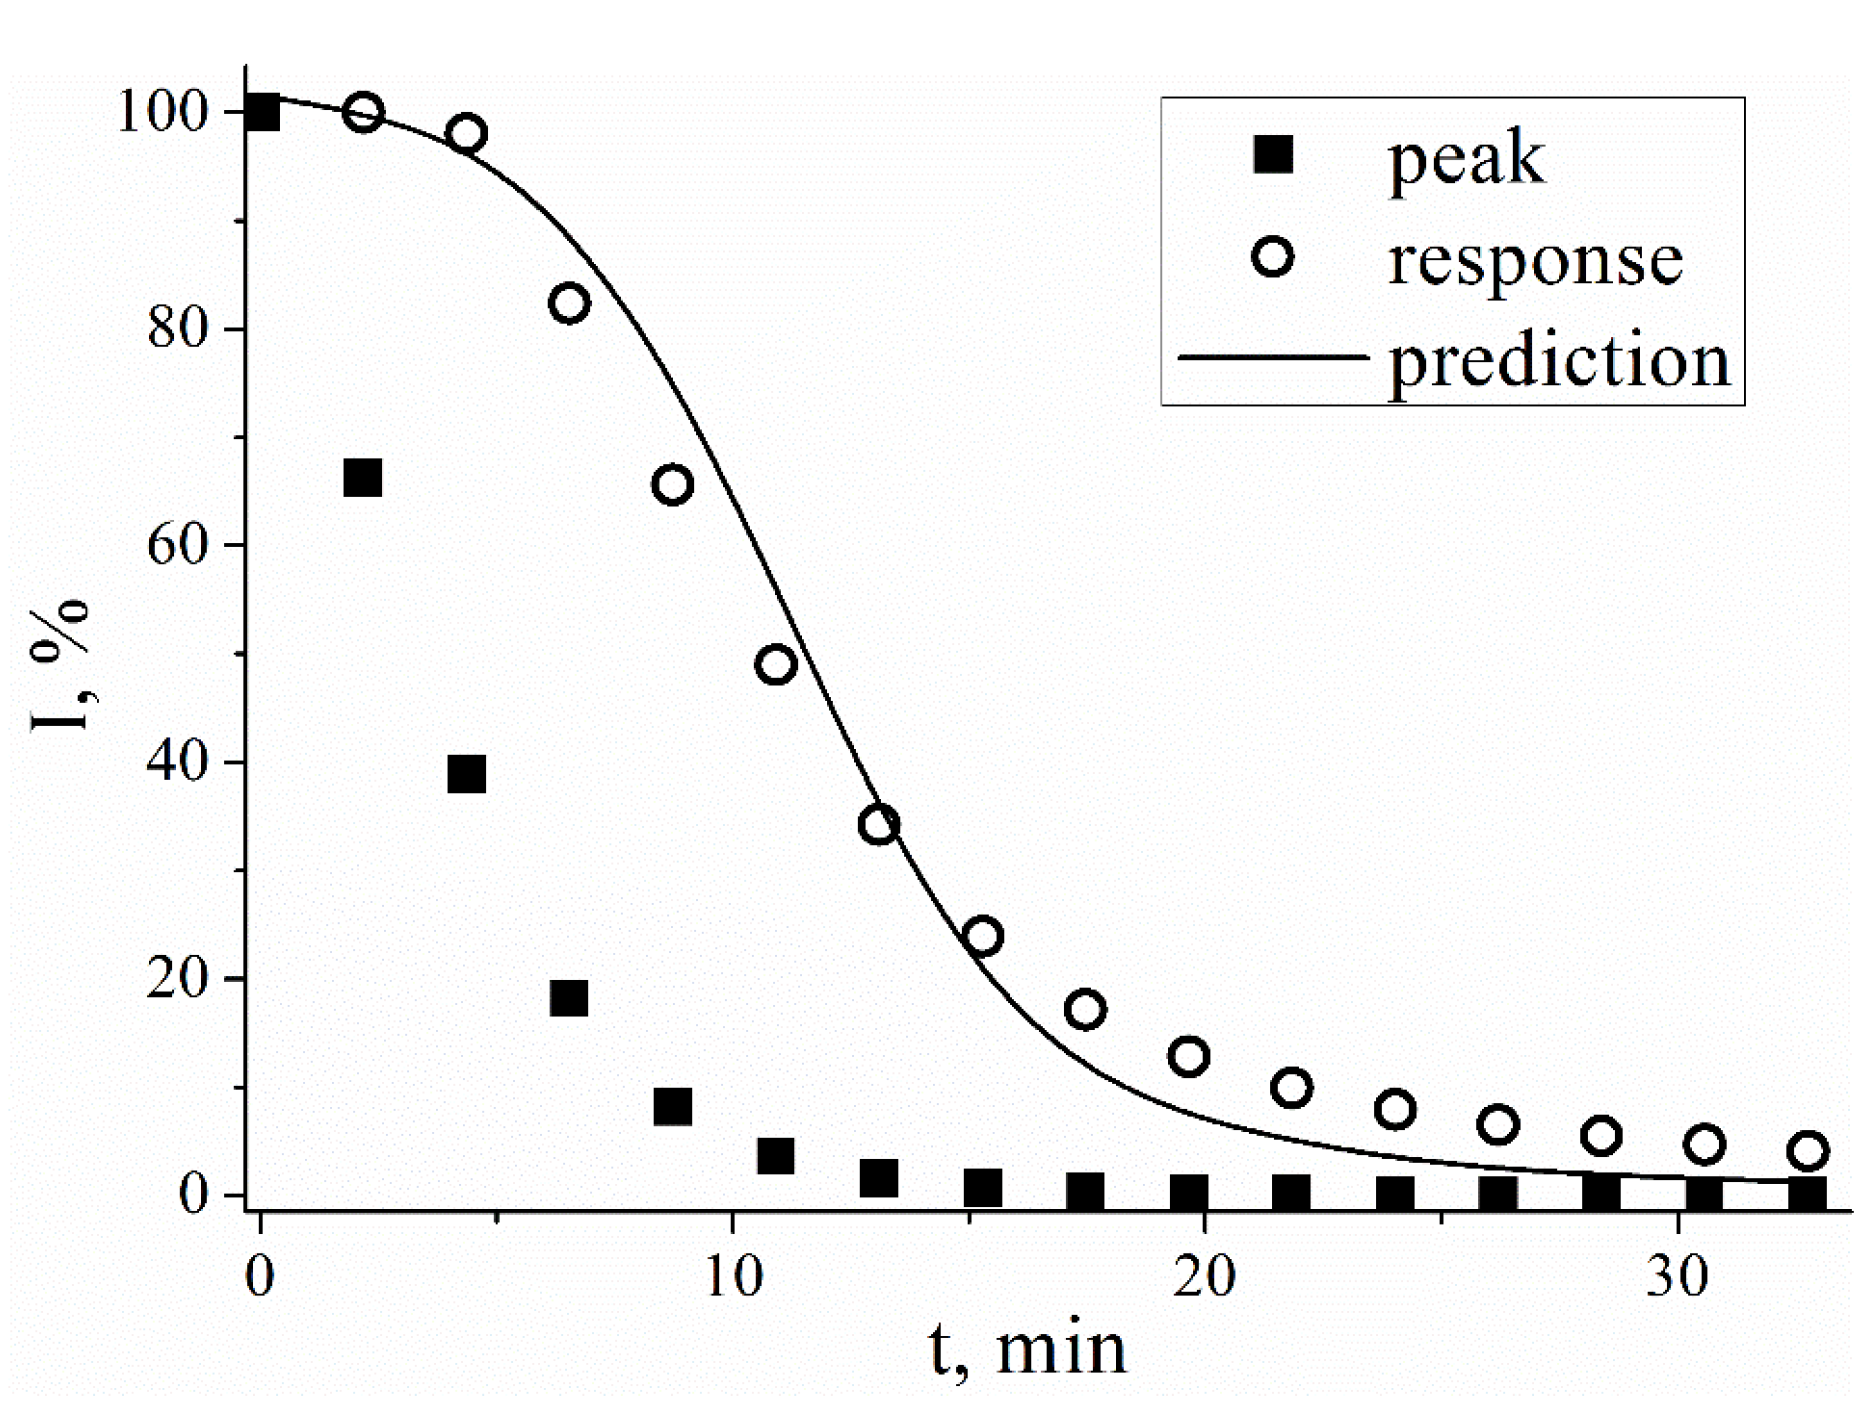
Figure 1).
The current on the SWV starts to decrease immediately in course of the experiment, whereas chronoamperometric response is stable while the peak on the voltammogram decreases by 50-60% (
Figure 1). The 90% of the initial response of sensor is maintained for approximately 5 minutes, which is typical for PB films (1.5 nmol·cm
-2). In contrast to it SWV peak current decreases by 50%. during these 5 minutes. For thicker PB films the 90% of the initial response of sensor is maintained for 20 minutes for a (3.3 nmol·cm
-2). The obtained data on the stability of the sensors is in good agreement with previously reported data, which also indicates the absence of the effect of the SWV measurements on the chronoamperometric stability of the sensor signal. Generally, SWV peak current decreases by 10% in 1–5 minutes and by 50% in 5–15 minutes. This mismatch of time profiles shown in
Figure 1 hampers the direct calculation of sensor response from SWV data.
Figure 1.
Relative values of current measured chronoamperometrically (E = 0.0 V), and peak current in SWV (dE = 20mV, Estep = 3mV, f = 4Hz) for PB-modified electrodes in 1mM H2O2 solution, 0.05M PBS, 0.1M KCl, pH 6.0.
Figure 1.
Relative values of current measured chronoamperometrically (E = 0.0 V), and peak current in SWV (dE = 20mV, Estep = 3mV, f = 4Hz) for PB-modified electrodes in 1mM H2O2 solution, 0.05M PBS, 0.1M KCl, pH 6.0.
3.3. Peroxide Sensors Calibration Model
In a wide range of PB concentrations, the dependence of the peak current in the SWV on the surface concentration of PB may be described by a hyperbolic function (
Figure S5). The limiting peak current in the SWV is achieved at the surface concentration of PB (3-4 nmol·cm
-2). Similarly, the surface concentration of PB on the electrode surface affects the sensor’s amperometric response (
Figure S6). This was demonstrated by measuring the initial response of sensors with different amount of PB in chronoamperometry mode upon adding the same concentration of hydrogen peroxide (1mM). It was found that plotting amperometric response of Prussian Blue-based sensors to hydrogen peroxide vs. the surface concentration of electrocatalyst on the electrode surface results in a curve with a saturation point (
Figure S6). Consequently, surface concentration of PB limits the sensitivity of peroxide sensors, which depends on the concentration of electrocatalyst on the electrode surface in a hyperbolic way.
To describe the obtained dependencies, one can turn to the equation of enzymatic kinetics (Michaelis-Menten) in an excess of enzyme:
where
v is the reaction rate,
[E]0 is the enzyme concentration,
[S]0 is the substrate concentration,
Ks is the equilibrium constant of the reaction of the enzyme-substrate complex formation,
k2 is the rate constant of the irreversible reaction.
k2∙[S]0 is equal to the maximum reaction rate.
Since the measured current is a kinetic parameter, it is possible to transform equation (1) into an electrochemical analogue by replacing the reaction rate with the current:
Response profiles of sensors towards addition of standard solutions of hydrogen peroxide to the final concentration of 0.05–1 mM also depends on the concentration of PB on the electrode surface in a hyperbolic way (
Figure S6). The free term in the denominator of the hyperbolic equation,
K, which was found to be 0.22 ± 0.05 nmol·cm
-2, does not depend on the concentration of H
2O
2.
The plateau may be attributed to complete surface coverage (
Figure S7). It was shown by microscopy and impedance spectroscopy that a uniform coating on the electrode surface is formed if concentration of Prussian blue is above 1.0 nmol·cm
-2 [
32]. Approximating the dependence of response or film continuity (%) on Г
PB with similar hyperbolic functions (
Figure S7) results in the free term in denominator equal to 0.3 ± 0.05 nmol·cm
-2, which coincides within the error with the obtained
K (0.22 ± 0.05 nmol·cm
-2). Consequently, the hyperbolic form of the dependence of the sensor response on the concentration of electroactive material is due to the different surface coverage.
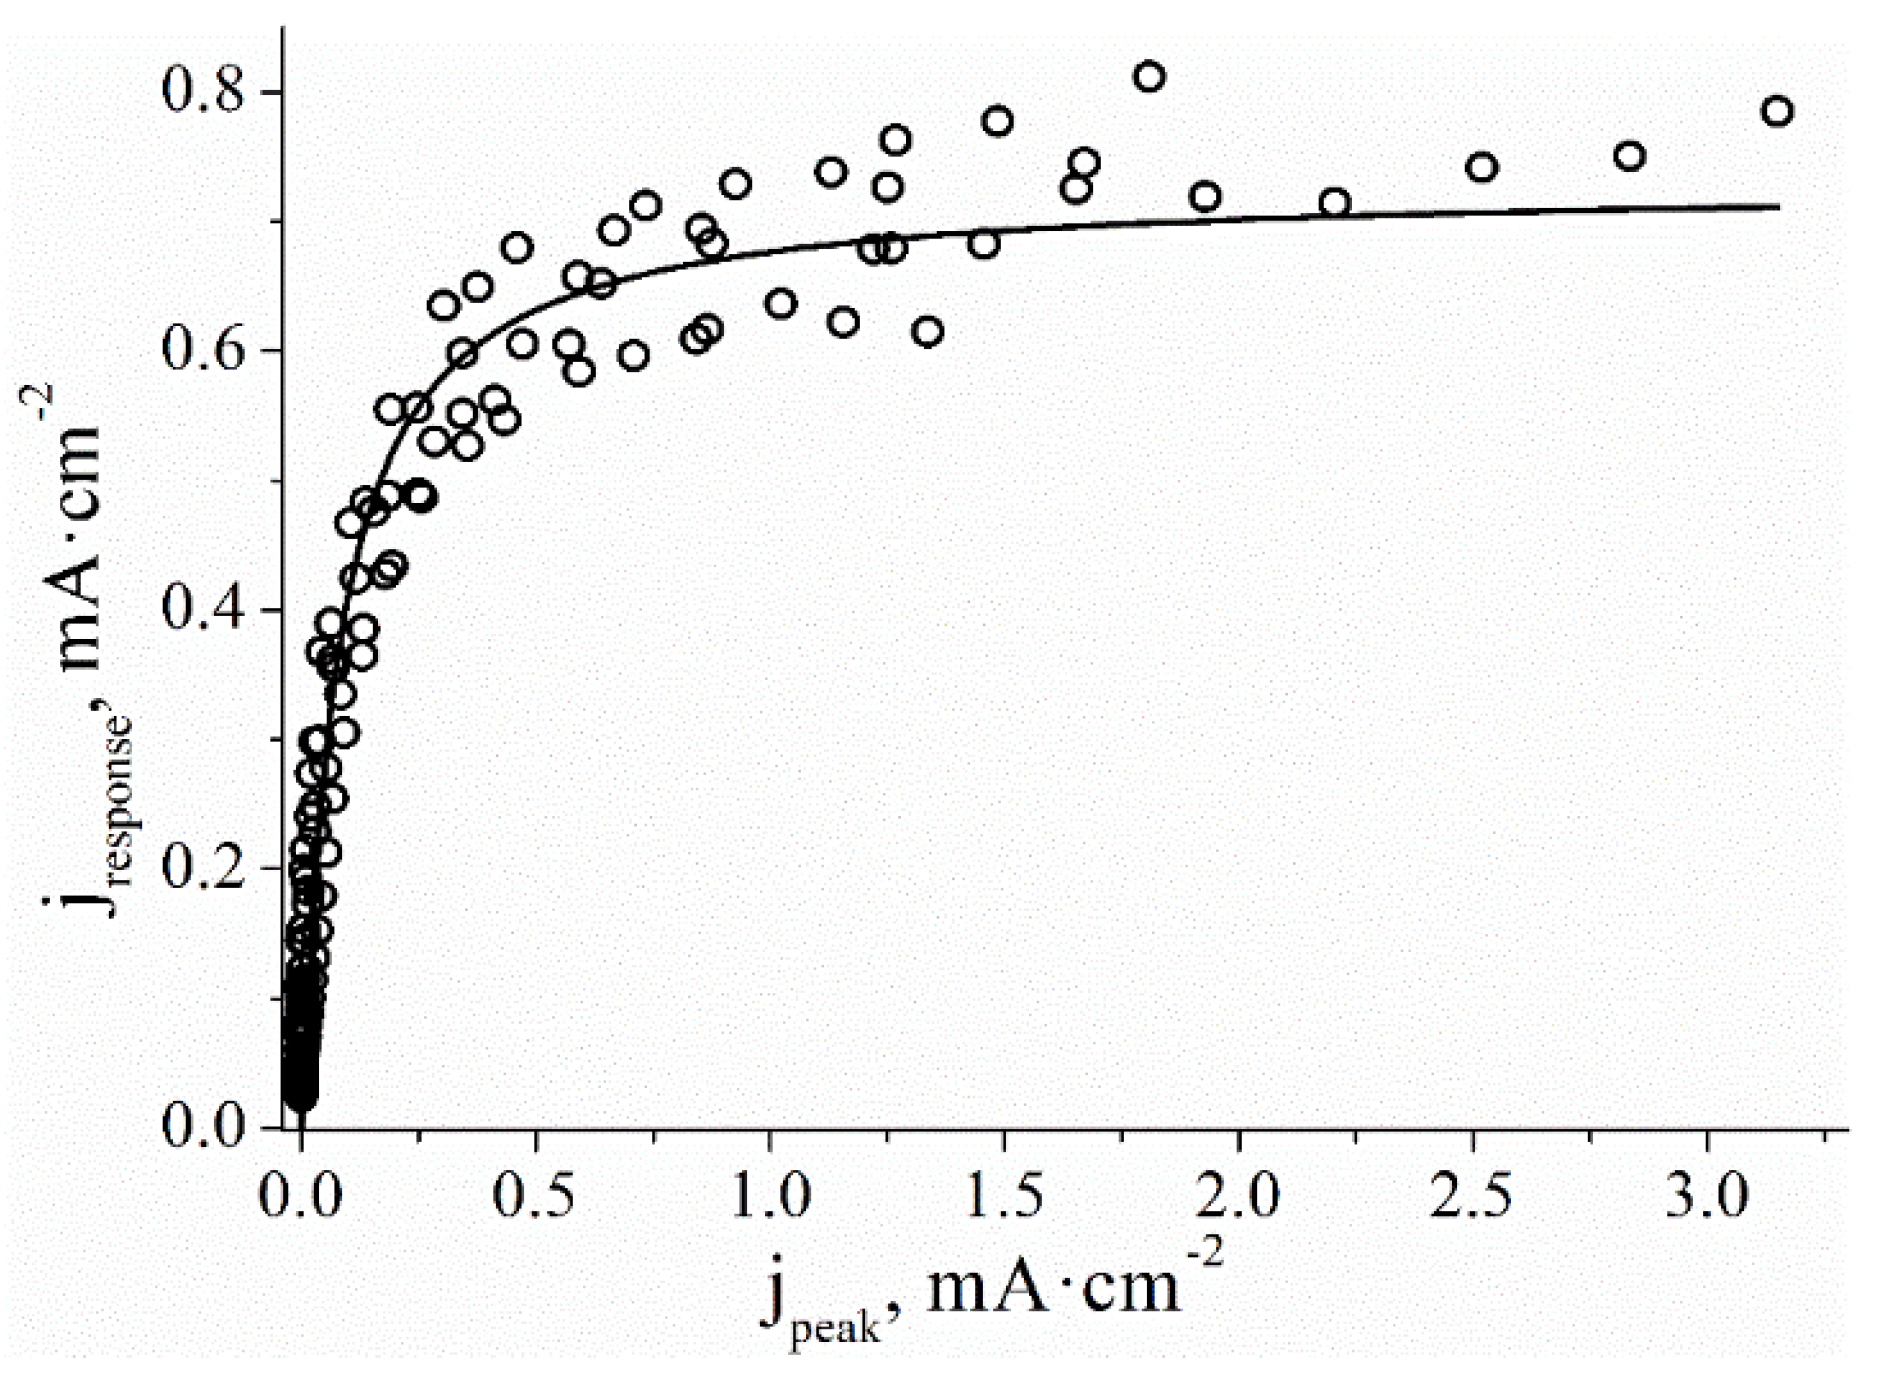
In a wide range of PB concentrations, the dependence of the I
peak in the SWV on the surface concentration of PB may be described by a hyperbolic function (
Figure 2). Since the peak height on the square wave voltammogram is proportional to the surface concentration of Prussian blue the chronoamperometric response was plotted as a function of the corresponding peak current on the SWV. Similarly to above, the hyperbolic function was used for approximation:
where K’ is an empirical parameter in μA∙cm
-2 which includes the proportionality coefficient between the peak height and the surface concentration of PB. Using summarized data points for several sensors it is possible to determine K’= 59 ± 16 μA∙cm
-2. This allows calculating of the theoretical response of the sensor based on the peak current on the SWV (line in
Figure 1). It is seen that the experimental and calculated current values are in good agreement throughout the experiment, however, the error increases in coarse of the response decrease.
Figure 2.
Current response plotted as a function of peak height in SWV, 6 sensors modified with PB (1 to 5 nmol·cm-2) in a solution of 1 mM H2O2, 0.05 M phosphate buffer, 0.1 M KCl, pH 6.0, 0.0 V vs. Ag/AgCl.
Figure 2.
Current response plotted as a function of peak height in SWV, 6 sensors modified with PB (1 to 5 nmol·cm-2) in a solution of 1 mM H2O2, 0.05 M phosphate buffer, 0.1 M KCl, pH 6.0, 0.0 V vs. Ag/AgCl.
Metrological processing of the obtained results has shown that the theoretical calculation of sensor response within the deviation of less than 10% is possible until the sensitivity drops by 70-80% (
Figure S8). Therefore, the stability of peroxide sensors may be extended by recalibrating of the sensor sensitivity during monitoring.
To assess the accuracy of the model, the parameters of the root mean square error of prediction (RMSEP) and Pearson’s R coefficient were calculated. RMSEP was calculated as follows:
where j
response is the current measured during the experiment, j
calc is the current calculated using eq.3 and n is the number of points. For the proposed model the RMSEP was found to be 10 μA∙cm
-2 (5%). Plotting of j
response versus j
calc results in a linear function with the slope of 1.07 ± 0.04 and the Pearson coefficient of 0.992, which proves the accuracy of the model (
Figure S9).
3.4. Application of Calibration Model to Oxidase-Based Biosensors
The achieved success in self-recalibration of the transducer (Prussian Blue) raised an interest in carrying out self-recalibration of the corresponding biosensors. Biosensors usually contain a polymer membrane for enzyme immobilization, so the applicability of the proposed calibration method for glucose and lactate biosensors was checked. Perfluorosulfonated ionomer for glucose oxidase and chitosan for lactate oxidase were used as matrices for enzyme immobilization. It should be noted that the application of membrane does not affect the position and shape of the SWV peak (
Figure S10). Moreover, periodic recording of the SWV does not affect the stability of the chronoamperometric response (
Figure S11).
However, the hyperbolic model suitable for peroxide sensors is less accurate if used for biosensors. To describe the degradation of biosensors, its analogue, the Hill equation with an additional parameter n was introduced:
where K
H and n are empirical parameters.
A comparison of two fitting models revealed that for the hyperbolic model the determination coefficient R
2 is less than 0.985, and for the model based on the Hill equation, it exceeds 0.999 (
Figure S12). Therefore, the Hill equation is preferable to calculate the theoretical response of the biosensors.
For glucose biosensors approximation by the Hill equation results in the average R
2 = 0.998 ± 0.002 (
Figure S13). The free term in the denominator of the Hill equation KH slightly depends on the surface concentration of PB, but the average value of this parameter (0.20 mA∙cm
-2) is 3-fold higher compared to the peroxide sensor. Parameter n characterizes the deviation of the model from the hyperbolic equation. The presence of enzymatic membrane leads to decrease in n values (less than 1.0). This deviation from the hyperbolic model may be attributed to the enzyme inactivation and leaching from the membrane, as well as membrane damage by peroxide or other products of reaction. Despite the parameters n and K
H are dependent on the concentration of PB in biosensors (
Figure S14), it is possible to define them and then use for the sensor recalibration.
Thus, current responses for glucose and lactate biosensors were calculated from corresponding peak currents on SWV using the predetermined parameters n and K
H (
Figure S15). The same accuracy criteria of response calculation were used for biosensors. For glucose biosensors RMSEP was slightly higher, 7% (2.4 μA∙cm
-2), and the Pearson coefficient (0.998) and the slope of the linear dependence (0.97 ± 0.03) of the calculated response on the measured one are satisfactory. The results of approximation by an analogue of the Hill equation obtained for lactate biosensors, are similar to previously obtained criteria of model accuracy (
Figure S16): RMSEP is 7% (3.1 μA∙cm
-2), Pearson’s coefficient is R = 0.994, the slope of the linear dependence of the predicted response on the measured one is 0.97 ± 0.02.
It was shown that the parameters discussed depend on the nature of polymer membrane, used for enzyme immobilization. The molecular weight of chitosan affects the values of n and K
H in the analogue of the Hill equation (
Figure S17). Parameter K
H exceeds 0.20 mA∙cm
-2 if chitosan of higher molecular weight is used. In case of chitosan with low molecular weight the parameter n tends to 1, indicating a negligible effect of polymer membrane on sensor performance. The value of n close to 1 indicates that hyperbolic equation of the Michaelis-Menten type may be used. However, the operational stability of lactate biosensors based on chitosan of medium or high molecular weight is higher.
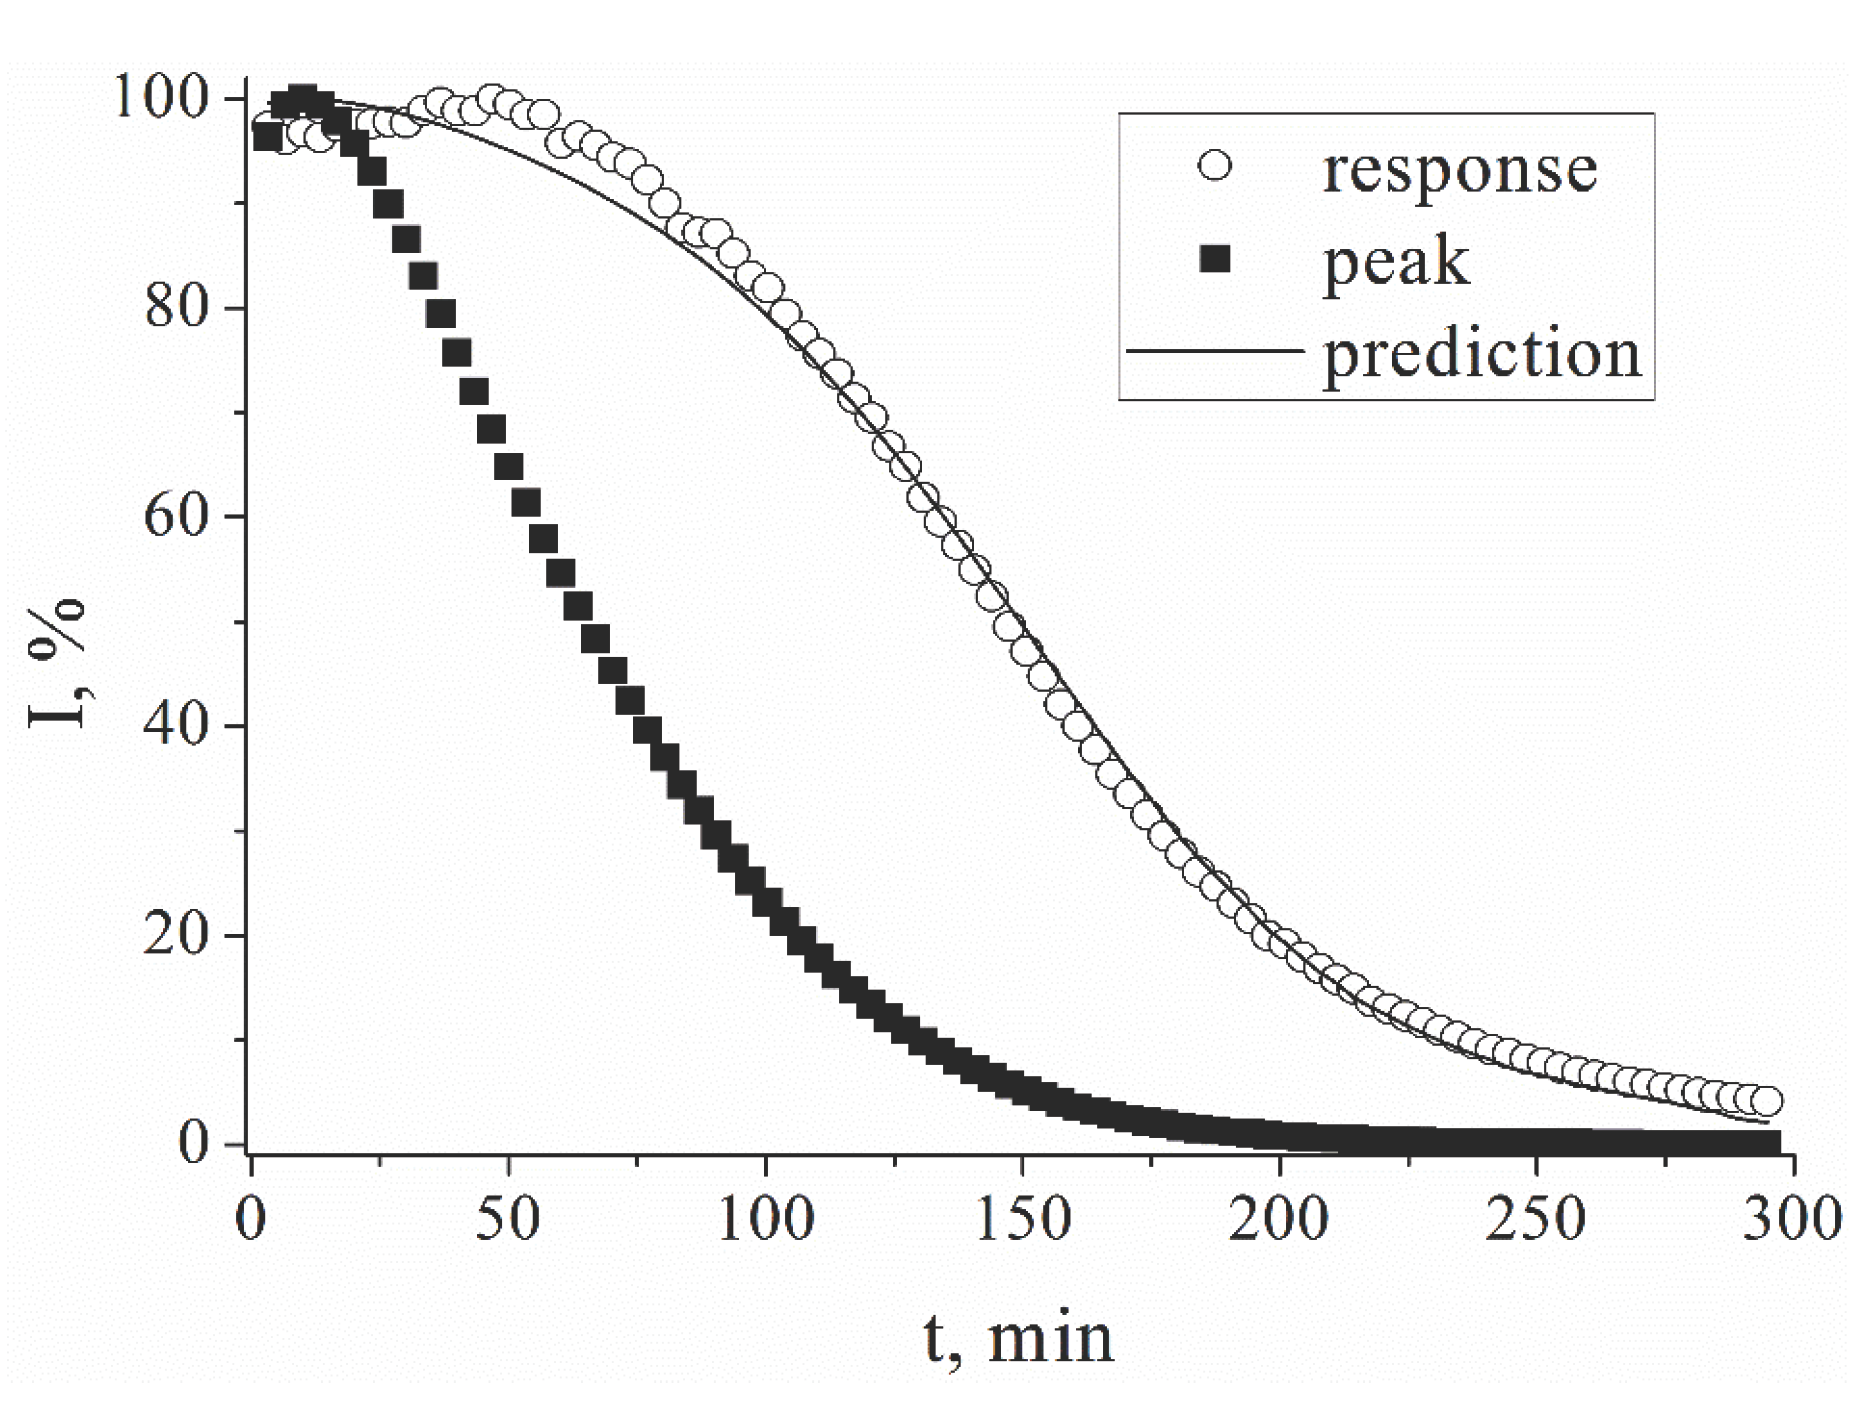
Figure 3.
Relative values of current measured chronoamperometrically (E = 0.0 V), and peak current in SWV (dE = 20 mV, Estep = 3 mV, f = 4 Hz) for lactate biosensor in 1mM lactate solution, 0.05M PBS, 0.1M KCl, pH 6.0.
Figure 3.
Relative values of current measured chronoamperometrically (E = 0.0 V), and peak current in SWV (dE = 20 mV, Estep = 3 mV, f = 4 Hz) for lactate biosensor in 1mM lactate solution, 0.05M PBS, 0.1M KCl, pH 6.0.
The initial response of lactate biosensor based on chitosan is preserved within 90% only for one hour in 1mM lactate solution. Periodic recording of square voltammograms and recalculation of current allows extending the operation time of the biosensor. Using the ratio of the calculated and measured currents for sensitivity correction, the sensor service life can be increased to 3.5 hours.
It is common to investigate biosensor stability in solutions with extremely high concentration of substrate. In such conditions the operational stability of peroxide sensors, glucose and lactate biosensors were improved by 2.5, 5 and 2.7 times correspondingly. In
Table 1 data on the increase of the service life of sensors and biosensors under the most severe conditions is summarized. Since the conditions of analysis can be different, it is more appropriate to estimate the degree of the initial response loss, at which the calculation error does not exceed 10%. It was found that sensors and biosensors can be used until 75-90% of sensitivity is lost, which can provide a service life of several days.
5. Conclusions
By alternating electrochemical techniques and analyzing multiple parameters, a recalibration model for (bio)sensors was developed. We conclude that response correction using PB electroactivity as parameter related to sensor sensitivity provides for the sensor prolonged operation time. In contrast to cyclic voltammetry, square wave voltammetry was proved to be an appropriate additional signaling method avoiding influence of catalysis. The presented approach is universal for electroactive materials, for which loss in sensitivity is due to any degradation of the sensing layer on the electrode surface. The proposed model is useful in continuous monitoring since PB is widely used as enzymatic biosensor basics.
Supplementary Materials
The following supporting information can be downloaded at the website of this paper posted on Preprints.org, Figure S1. Square wave voltammogram (forward, backward and net currents) of the PB-based peroxide sensor in a solution of 0.6 mM H2O2, 0.05 M phosphate buffer, 0.1 M KCl, pH 6.0, 0.0 V vs. Ag/AgCl; Figure S2. Dependence of peak height on SWV on the concentration of H2O2, 0.05 M phosphate buffer, 0.1 M KCl, pH 6.0, 0.0 V vs. Ag/AgCl. Inset: the corresponding SWVs; Figure S3. Dependence of the SWV peak height with different parameters of the method on the surface concentration of PB, 0.05 M phosphate buffer, 0.1 M KCl, pH 6.0, 0.0 V vs. Ag/AgCl; Figure S4. Current responses of the sensor recorded during the experiment in the modes of (a) chronoamperometry and (b) square-wave voltammetry in a solution of 1 mM H2O2, 0.05 M phosphate buffer, 0.1 M KCl, pH 6.0, 0.0 V vs. Ag/AgCl; Figure S5. Dependence of the peak height on the SWV on the surface concentration of PB in 1 mM H2O2 solution, 0.05 M phosphate buffer, 0.1 M KCl, pH 6.0, 0.0 V vs. Ag/AgCl, n = 31 sensors; Figure S6. Current responses of sensors with different surface concentration of PB upon the addition of different concentrations of H2O2, 0.05 M phosphate buffer, 0.1 M KCl, pH 6.0, 0.0 V vs.Ag/AgCl; Figure S7. Surface coverage and current responses of sensors with different surface concentration of PB in 1mM H2O2, 0.05 M phosphate buffer, 0.1 M KCl, pH 6.0, 0.0 V vs. Ag/AgCl; Figure S8. Relative error of calculation of a) sensor and b) biosensor response plotted as a function of the chronoamperometrically measured current (expressed as a percentage of the original value), 1mM H2O2 or 1mM lactate, 0.05 M phosphate buffer, 0.1 M KCl, pH 6.0; Figure S9. Dependence of the calculated current on the measured one for sensors based on PB, 1 mM H2O2, 0.05 M phosphate buffer, 0.1 M KCl, pH 6.0, 0.0 V vs. Ag/AgCl; Figure S10. Comparison of typical square wave voltammograms of sensors with membranes applied for enzyme immobilization with a sensor without a membrane), 1 mM H2O2, 0.05 M phosphate buffer, 0.1 M KCl, pH 6.0; Figure S11. The comparison of chronoamperometry and chronoamperometry with square wave voltammetry for Prussian blue-based lactate biosensor in 1mM lactate, phosphate buffer pH 6.0; Figure S12. Approximation of the dependence of the current response of the biosensor on the peak height on the SWV using the hyperbolic equation (R2 = 0.984) and the Hill equation (R2 = 0.999), 1 мМ H2O2, 0.05 М phosphate buffer, 0.1 М KCl, pH 6.0, 0.0 V vs. Ag/AgCl; Figure S13. Dependences of the current responses on the peak height on SWV of glucose biosensors based on GOx immobilized in a perfluorosulfonated ionomer with different surface concentrations of PB in a solution of 5 mM glucose, 0.05 M phosphate buffer, 0.1 M KCl, pH 6.0, 0.0 V vs. Ag/AgCl; Figure S14. Dependence of the coefficient n and parameter KH of the Hill equation on the surface concentration of PB for glucose biosensors based on PFSI, 5 mM glucose solution, 0.05 M phosphate buffer, 0.1 М KCl, pH 6.0, 0.0 V vs. Ag/AgCl; Figure S15. Measured and calculated dependences of the response on the peak height on the SWV and on time: (a and b)—for a glucose biosensor in 5 mM glucose, (c and d)—for lactate biosensor in 1 mM lactate, 0.05 М PBS, 0.1 М KCl, pH 6.0, 0.0 V vs. Ag/AgCl; Figure S16. Dependences of the current responses and peak height of SWV for lactate sensors based on chitosan in a solution of 1 mM lactate, 0.05 M phosphate buffer, 0.1 M KCl, pH 6.0, 0.0 V relative to Ag/AgCl, approximated by the Hill equation; Figure S17. Comparison of the parameters n and KH of the Hill equation in a 1 mM lactate solution of biosensors based on chitosan of different molecular weights, 0.05 M phosphate buffer, 0.1 M KCl, pH 6.0, 0.0 V relative to Ag/AgCl.
Author Contributions
Conceptualization, A.K.; methodology, A.K. and V.N.; validation, V.P., S.G. and Y.D.; formal analysis, V.N., V.P. and Y.D.; investigation, V.N., V.P., S.G. and Y.D.; resources, A.K.; data curation, V.N., V.P., S.G. and Y.D.; writing—original draft preparation, A.K. and V.N.; visualization, V.N., V.P. and A.K.; supervision, A.K.; project administration, A.K.; funding acquisition, A.K. All authors have read and agreed to the published version of the manuscript.
Institutional Review Board Statement
Not applicable.
Data Availability Statement
Data is contained within the article or supplementary material.
Conflicts of Interest
The authors declare no conflicts of interest.
Abbreviations
The following abbreviations are used in this manuscript:
| PB |
Prussian Blue |
| SWV |
Square-Wave Voltammetry |
| RMSEP |
Root mean square error of prediction |
| CGM |
Continuous glucose monitoring |
References
- Wu, X.; Zhao, X.; Chen, W.; Chen, Q.; Kong, L.; Li, P. A systematic review of continuous glucose monitoring sensors: principles, core technologies and performance evaluation. Sens. Actuators Rep. 2025, 10, 100361. [Google Scholar] [CrossRef]
- Engel, T.; Ajemba, P.; Nishida, J.; Nogueira, K.; Grosman, B.; Tsai, A.; Lu, Y.; Sullivan, A.; Varsavsky, A. Fourth-Generation Glucose Sensor with an Advanced Algorithm Featuring No Calibrations and Optional Calibration Modes of Operation. Diabetes 2018, 67. [Google Scholar] [CrossRef]
- Giménez-Gómez, P.; Rodríguez-Rodríguez, R.; Ríos, J.M.; Pérez-Montero, M.; González, E.; Gutiérrez-Capitán, M.; Plaza, J.A.; Muñoz-Berbel, X.; Jiménez-Jorquera, C. A self-calibrating and multiplexed electrochemical lab-on-a-chip for cell culture analysis and high-resolution imaging. Lab Chip 2020, 20, 823–833. [Google Scholar] [CrossRef] [PubMed]
- Li, Z.; Wang, Y.; Fan, Z.; Sun, Y.; Sun, Y.; Yang, Y.; Zhang, Y.; Ma, J.; Wang, Z.; Zhu, Z. A dual-function wearable electrochemical sensor for uric acid and glucose sensing in sweat. Biosens. 2023, 13, 105. [Google Scholar] [CrossRef]
- Mukherjee, M.D.; Gupta, P.; Kumari, V.; Rana, I.; Jindal, D.; Sagar, N.; Singh, J.; Dhand, C. Wearable biosensors in modern healthcare: Emerging trends and practical applications. Talanta Open 2025, 12, 100486. [Google Scholar] [CrossRef]
- Kim, J.; Campbell, A.S.; de Ávila, B.E.-F.; Wang, J. Wearable biosensors for healthcare monitoring. Nat. Biotechnol. 2019, 37, 389–406. [Google Scholar] [CrossRef]
- Wang, M.; Zheng, J.; Zhang, G.; Lu, S.; Zhou, J. Wearable Electrochemical Glucose Sensors for Fluid Monitoring: Advances and Challenges in Non-Invasive and Minimally Invasive Technologies. Biosens. 2025, 15, 309. [Google Scholar] [CrossRef]
- Mahmoudi, Z.; Johansen, M.D.; Christiansen, J.S.; Hejlesen, O. Comparison between one-point calibration and two-point calibration approaches in a continuous glucose monitoring algorithm. J. Diabetes Sci. Technol. 2014, 8, 709–719. [Google Scholar] [CrossRef]
- Alvarez-Serna, B.E.; Arcos-Santiago, D.A.; Uc-Martín, J.A.; Ramírez-Chavarría, R.G. Electrochemical Sensor With Dynamic Self-Calibration for Acetaminophen Detection in Water. IEEE Sens. Lett. 2025, 9, 1–4. [Google Scholar] [CrossRef]
- Wang, B.; Eden, A.; Chen, Y.; Kim, H.; Queenan, B.N.; Bazan, G.C.; Pennathur, S. Auto recalibration based on dual-mode sensing for robust optical continuous glucose monitoring. Sens. Actuators, B 2024, 418, 136277. [Google Scholar] [CrossRef]
- Song, S.; Zhang, H.; Wan, Y.; Luo, J. 3D Neighborhood Nanostructure Reinforces Biosensing Membrane. Adv. Funct. Mater. 2023, 33, 2303313. [Google Scholar] [CrossRef]
- Li, X.; Zheng, S.; He, M.; Huang, X.; Yang, C.; Mo, J.; Yang, J.; Yang, C.; Chen, H.; Xie, X. Self-calibrating multiplexed microneedle electrode array for continuous mapping of subcutaneous multi-analytes in diabetes. The Innovation 2025, 6, 100781. [Google Scholar] [CrossRef]
- Wiorek, A.; Parrilla, M.; Cuartero, M.; Crespo, G.A. Epidermal Patch with Glucose Biosensor: pH and Temperature Correction toward More Accurate Sweat Analysis during Sport Practice. Anal. Chem. 2020, 92, 10153–10161. [Google Scholar] [CrossRef]
- Yang, D.; An, J.; Qiu, W.; Gao, Y.; Zhang, J.; Pan, W.; Zhao, P.; Liu, Y. Self-calibrating dual-sensing electrochemical sensors for accurate detection of carbon dioxide in blood. Microchim. Acta 2023, 191, 22. [Google Scholar] [CrossRef]
- Pu, Z.; Zhang, X.; Yu, H.; Tu, J.; Chen, H.; Liu, Y.; Su, X.; Wang, R.; Zhang, L.; Li, D. A thermal activated and differential self-calibrated flexible epidermal biomicrofluidic device for wearable accurate blood glucose monitoring. Sci. Adv. 2021, 7, eabd0199. [Google Scholar] [CrossRef] [PubMed]
- Li, J.; Liu, J.; Wu, Z.; Shang, X.; Li, Y.; Huo, W.; Huang, X. Fully printed and self-compensated bioresorbable electrochemical devices based on galvanic coupling for continuous glucose monitoring. Sci. Adv. 2023, 9, eadi3839. [Google Scholar] [CrossRef]
- Kim, S.; Kim, D.; Kim, S. Simultaneous quantification of multiple biomarkers on a self-calibrating microfluidic paper-based analytic device. Anal. Chim. Acta 2020, 1097, 120–126. [Google Scholar] [CrossRef]
- Ghoreishizadeh, S.S.; Zhang, X.; Sharma, S.; Georgiou, P. Study of Electrochemical Impedance of a Continuous Glucose Monitoring Sensor and its Correlation With Sensor Performance. IEEE Sens. Lett. 2018, 2, 1–4. [Google Scholar] [CrossRef]
- Karyakin, A.A.; Gitelmacher, O.V.; Karyakina, E.E. A High-Sensitive Glucose Amperometric Biosensor Based on Prussian Blue Modified Electrodes. Anal. Lett. 1994, 27, 2861–2869. [Google Scholar] [CrossRef]
- Karpova, E.V.; Shcherbacheva, E.V.; Galushin, A.A.; Vokhmyanina, D.V.; Karyakina, E.E.; Karyakin, A.A. Noninvasive Diabetes Monitoring through Continuous Analysis of Sweat Using Flow-Through Glucose Biosensor. Anal. Chem. 2019, 91, 3778–3783. [Google Scholar] [CrossRef]
- Daboss, E.V.; Tikhonov, D.V.; Shcherbacheva, E.V.; Karyakin, A.A. Ultrastable Lactate Biosensor Linearly Responding in Whole Sweat for Noninvasive Monitoring of Hypoxia. Anal. Chem. 2022, 94, 9201–9207. [Google Scholar] [CrossRef]
- Daboss, E.V.; Shcherbacheva, E.V.; Tikhonov, D.V.; Karyakin, A.A. On-body hypoxia monitor based on lactate biosensors with a tunable concentration range. J. Electroanal. Chem. 2023, 935, 117330. [Google Scholar] [CrossRef]
- Andreev, E.A.; Shavokshina, V.A.; Nikitina, V.N.; Pozdnyakova, D.D.; Baranova, I.A.; Chuchalin, A.G.; Karyakin, A.A. Sensor platform for noninvasive evaluation of pulmonary oxidative status. Talanta 2025, 290, 127792. [Google Scholar] [CrossRef]
- Anaev, E.K.; Apyari, V.V.; Puganova, E.A.; Borisova, A.V.; Dmitriyenko, S.G.; Karyakina, E.E.; Vagin, M.Y.; Zolotov, Y.A.; Chuchalin, A.G.; Karyakin, A.A. Pulmonary oxidative status in norma and pathologies on the basis of analysis of exhaled breath condensate. Am. J. Biomed. Sci. 2010, 2, 365–372. [Google Scholar] [CrossRef]
- Maier, D.; Laubender, E.; Basavanna, A.; Schumann, S.; Güder, F.; Urban, G.A.; Dincer, C. Toward Continuous Monitoring of Breath Biochemistry: A Paper-Based Wearable Sensor for Real-Time Hydrogen Peroxide Measurement in Simulated Breath. ACS Sens. 2019, 4, 2945–2951. [Google Scholar] [CrossRef]
- Daboss, E.V.; Komkova, M.A.; Nikitina, V.N.; Andreev, E.A.; Vokhmyanina, D.V.; Karyakin, A.A. Noninvasive Monitoring of Glycemia Level in Diabetic Patients by Wearable Advanced Biosensors. Biosens. 2024, 14, 486. [Google Scholar] [CrossRef]
- Karyakin, A.A.; Karyakina, E.E.; Gorton, L. On the mechanism of H2O2 reduction at prussian blue modified electrodes. Electrochem. Commun. 1999, 1, 78–82. [Google Scholar] [CrossRef]
- Vokhmyanina, D.V.; Sharapova, O.E.; Karyakin, A.A. Ultra-stable biosensor transducer for continuous monitoring. Biosens. Bioelectron. 2025, 286, 117638. [Google Scholar] [CrossRef] [PubMed]
- Karpova, E.V.; Karyakina, E.E.; Karyakin, A.A. Iron–nickel hexacyanoferrate bilayer as an advanced electrocatalyst for H2O2 reduction. RSC Adv. 2016, 6, 103328–103331. [Google Scholar] [CrossRef]
- Sitnikova, N.A.; Mokrushina, A.V.; Karyakin, A.A. Iron triad-mate hexacyanoferrates as Prussian Blue stabilizers: Toward the advanced hydrogen peroxide transducer. Electrochim. Acta 2014, 122, 173–179. [Google Scholar] [CrossRef]
- Mirčeski, V.; Bobrowski, A.; Zarebski, J.; Spasovski, F. Electrocatalysis of the first and second kind: Theoretical and experimental study in conditions of square-wave voltammetry. Electrochim. Acta 2010, 55, 8696–8703. [Google Scholar] [CrossRef]
- Komkova, M.A.; Karpova, E.V.; Sukhorukov, G.A.; Sadovnikov, A.A.; Karyakin, A.A. Estimation of continuity of electroactive inorganic films based on apparent anti-Ohmic trend in their charge transfer resistance. Electrochim. Acta 2016, 219, 588–591. [Google Scholar] [CrossRef]
Table 1.
Prolongation of operation time of various (bio)sensors.
Table 1.
Prolongation of operation time of various (bio)sensors.
| (Bio)sensor |
Analyte,
concentration |
Operation time
prolongation factor |
Acceptable
sensitivity loss, % |
| PB |
H2O2, 1 mM |
2.5 |
75 ± 5 |
| PB | GOx (PFSI) |
glucose, 5 mM |
5 |
90 ± 8 |
| PB | LOx (chitosan) |
lactate, 1 mM |
2.7 |
90 ± 5 |
|
Disclaimer/Publisher’s Note: The statements, opinions and data contained in all publications are solely those of the individual author(s) and contributor(s) and not of MDPI and/or the editor(s). MDPI and/or the editor(s) disclaim responsibility for any injury to people or property resulting from any ideas, methods, instructions or products referred to in the content. |
© 2025 by the authors. Licensee MDPI, Basel, Switzerland. This article is an open access article distributed under the terms and conditions of the Creative Commons Attribution (CC BY) license (https://creativecommons.org/licenses/by/4.0/).