
Submitted:
29 October 2025
Posted:
30 October 2025
You are already at the latest version
Abstract
Air pollution is a significant factor in public health challenges, increasing the rates of respiratory and heart-related illnesses. Accurate forecasting of changes in air quality is essential for raising community awareness and managing pollution effectively in urban areas. This research applies artificial intelligence methodologies for air quality forecasting in Ba Ria - Vung Tau Province, Vietnam. A long short-term memory (LSTM) model was employed, enhanced by a moving average method to mitigate dataset noise. An evaluation of the statistics shows that the air quality in the assessed region is predominantly satisfactory, with concentrations of some primary pollutants, such as NO2, SO2, and suspended particulate matter, remaining below the established regulatory limits. O3 centent frequently exceeded permissible thresholds, exerting a notable influence on VN_AQI. The developed LSTM-MA model demonstrated good predictive accuracy over a 7-day horizon, achieving a value of RMSE within the range of 0.157 - 0.271 and MAPE of 30 – 31%. For extended forecasts spanning 2 weeks to 1 month, the model maintained favorable performance, with RMSE and MAPE values ranging from 0.186 to 0.497 and 46.3 to 84.4, respectively. Additionally, comparative evaluations were conducted against conventional forecasting models, including LSTM and ARIMA. The findings showed that the LSTM-MA model exhibited exemplary performance and holds significant promise for predicting fluctuations in air quality over time.
Keywords:
forecast
; LSTM‐MA
; hybrid model
; air quality
; Ba Ria
; Vung Tau
1. Introduction
The rapid urbanization and industrialization are the main factors that cause air pollution. Air pollution is one of the factors causing many health problems. Consequently, predicting changes in air quality at an early stage assists in alerting the public about pollution levels, which is a crucial task in managing air quality in urban environments. Nowadays, air quality forecasting models can be divided into two approaches: traditional models and statistical models [1]: Traditional models are based on physical and chemical processes in the atmosphere, combined with meteorological factors, pollutant emissions, and mathematical tools to simulate air quality at various scales, such as CMAQ [2,3], WRF-Chem [4], AERMOD [5] and TAPOM [6,7], NAQPMS, etc. Statistical models, in contrast, concern themselves less with the physical and chemical processes behind air pollutants and primarily emphasize the relationship between input data, such as meteorological factors and past pollutant levels, and future concentrations of pollutants [8]. Statistical models for air quality forecasting include: AR, ARMA, ARIMA [9], GWR [10], MLR [11], SVR [12], and hybrid models [13].
Artificial Intelligence (AI) applications for air quality forecasting have been widely conducted in statistical models. Machine learning (ML) is a subfield of AI that enables computers to learn and improve from large datasets without being explicitly programmed. Deep learning (DL) can be viewed as an advancement of machine learning (ML) that employs a multi-layered architecture known as an artificial neural network (ANN). In recent years, research on neural network-based air quality prediction has advanced. Researchers have shown that ANNs can make better predictions than traditional models. According to Mendez M. (2023) [14], many studies have applied ML and DL to develop air quality forecasting models. Long short-term memory (LSTM) is a type of recurrent neural network (RNN) and belongs to DL algorithms. In recent years, LSTM has become an effective model for solving problems in sequential data learning. The ability to predict LSTM has recently shown that LSTM has better statistical properties than traditional RNNs. Specific research indicates that LSTM is a more precise algorithm when compared to various deep learning and regression algorithms [15,16,17]. Therefore, the LSTM method allows us to better predict the trend in air quality. The LSTM model can represent the distribution of air quality changes over time.
All the aforementioned air quality prediction techniques are based on individual models, and the diminished prediction accuracy is a result of various elements like feature space, model scale, and parameter choices. To compensate for the limitations of a single model, hybrid prediction models have become a trend in new studies. Hybrid models are generated by combining techniques with other prediction models and obtaining the final prediction results by aggregating the predicted values of all subseries. Several studies show that hybrid models usually perform better than single models [14,18]. The studies show that hybrid LSTM models give better results than single LSTM models or traditional forecasting models. Therefore, many researchers have also used hybrid LSTM models to predict air quality for different countries or areas of a specific country (Table 1).
The Air Quality Index (AQI) is a measure of air pollution based on the concentrations of various air pollutants in the atmosphere. The primary air pollutants that affect AQI are NO2, SO2, CO, PM2.5, PM10, and O3. The AQI aims to educate the public on the health effects of air pollution. Consequently, AQI monitoring and forecasting have become a crucial tool for sustainable national development. AI air quality forecasting studies based on the AQI indexes are less popular than those for each pollutant.
In Viet Nam, the number of automatic air quality monitoring stations remains low. Nationally, the Vietnam Environment Administration has installed six automatic stations in 6 cities, and the National Centre for Hydro-Meteorological Forecasting has installed 10 in 9 provinces. Besides, some other automatic stations were installed by some provinces [32]. In addition, there are a few automatic air monitoring stations in localities, in addition to semi-automatic air quality monitoring stations. Therefore, in addition to monitoring current air quality, it is necessary to use tools to forecast air quality in localities. To date, studies on AI applications in air quality forecasting in Vietnam have mainly focused on air pollutants such as PM10 and PM2.5, etc [33,34]. There are few studies on forecasting air quality based on AQI, but this is one of the new studies that objectively and accurately forecast air quality at the local level. Therefore, this study will use AQI's hybrid LSTM-MA model for air quality forecasting with data collected from automatic and continuous ambient air monitoring stations in Ba Ria - Vung Tau province, Vietnam.
2. Materials and Methods
2.1. Data of the Study
The air quality monitoring dataset used in this study is the hourly average concentrations of PM2.5, PM10, TSP, CO, NO2, O3, and SO2 measured at the automatic monitoring station of the Department of Natural Resources and Environment of Ba Ria-Vung Tau province (Table 2). The data set period is from January 18, 2020, to December 31, 2022.
The data collected at the KK1, KK2, and KK3 stations (Figure 1) include 25,806 records for each parameter from January 18, 2020, to December 31, 2022. The amount of blank data (no data) is generally not much (from 0.1% - 3.7% for data at KK1; from 0.1% - 7.8% for data at KK2; from 0.1% - 4.8% for data at KK3). The blank data in the collected data set can be due to many objective reasons regarding power sources, measuring equipment, data storage equipment, etc. However, the above blank data rate is relatively small compared to the total collected dataset. The statistical results show that there are still zero values, and the maximum values of most observed parameters are far from the median and mean values. This reflects that the dataset contains a certain amount of outlier data (anomalous data), which shows the need to remove these values if we want to obtain good information from the dataset.
2.2. Methodology
2.2.1. Preprocess Data
Automatic air monitoring data often changed wildly and affected by many natural factors (meteorological) and artificial factors (equipments, etc). First, the monitoring data is checked for missing data using the disappeared data analysis method in SPSS software (missing data). Missing data can be classified into three types: completely random, random, or non-random. Data from automated air monitoring in Vung Tau City is missing due to various subjective factors, such as faulty probes and automatic data input processes. If these values are not processed, they will affect the evaluation results. The method of detecting abnormal values through non-parametric techniques is performed using SPSS software.
Abnormal values are detected, and the causes and rules of the data are reviewed. Abnormal values with values that are too large compared to the general development of the data in the same period, and the cause that cannot be determined will be eliminated. There are many ways to handle missing values and outliers using missing data analysis. A simple approach often used is to ignore missing data, which leads to limited efficiency and bias in the modeling process. The second approach is data reconstruction, which encompasses many mechanisms, ranging from simple (e.g., replacing missing values with zeros, means, and medians) to more complex (e.g., Markov chain Monte Carlo, NIPALS). In this research, the author utilized the method of reconstructing missing information with the aid of multivariate regression and nonlinear iterative partial least squares.

Table 3.
Descriptive statistics of data.
| Station | Obser-vations | Obs. with missing data | Obs. without missing data | Min. | Max. | Mean | Std. deviation |
|---|---|---|---|---|---|---|---|
| KK1 | 1074 | 0 | 1074 | 14.4 | 196.0 | 44.9 | 30.2 |
| KK2 | 1078 | 0 | 1078 | 15.3 | 211.9 | 54.0 | 34.6 |
| KK3 | 1074 | 0 | 1074 | 6.4 | 260.5 | 43.8 | 23.7 |
2.2.2. The Air Quality Index
The Air Quality Index (AQI) is an index that quantitatively describes the air quality status. The pollutants involved in the AQI include PM10, PM2.5, SO2, NO2, CO, and O3. The method for calculating the Vietnam Air Quality Index (VN_AQI) from monitoring data of automatic air quality monitoring stations is issued together with Decision No. 1459/QD-TCMT dated November 12, 2019. The VN_AQI index is calculated with two values: hourly AQI (AQIh) and daily AQI (AQId). The VN_AQI index is divided into six levels: good (0 - 50), moderate (51 - 100), unhealthy for sensitive groups (101 - 150), unhealthy (151 - 200), very unhealthy (201 - 300), and hazardous (301-500) [35].
2.2.3. Moving Average Method
A moving average (MA) is used to smooth a series of numbers that fluctuate erratically, eliminate the influence of random factors, and clearly outline the underlying trend of the data. [1,10]. The process is called the q-level moving average process, Xt ~ MA(q) satisfies the following expression:
where b1, b2,.., bq are the model coefficients, εt is white noise. A time series is white noise if the independent variables are identically distributed with zero mean [36].
2.2.4. LSTM Model
The LSTM model is a recurrent neural network developed by Hochreiter and Schmidhuber in 1997. Mikolov made enhancements to this model in 2019 to boost its performance [37]. In contrast to the recurrent neural network model, the LSTM model features a greater memory capacity and a more intricate design [38]. LSTM models can solve complex problems [37]. The LSTMT network structure is described in Yuan's research (2019) [38]. The LSTM model forecasts air quality for data from 03 stations in Ba Ria - Vung Tau province. As mentioned above, the data's random fluctuations, outliers, and noise factors significantly affect the LSTM model's forecast accuracy. Therefore, the study uses a moving average (MA) filter to smooth data with natural fluctuations over time. Johnston has demonstrated that MA will increase the stability of the forecast model and reduce the forecast error variance by at least 3% when using this filter [39].
Input data: AQI (air quality index) is calculated based on 06 parameters: CO, NO2, O3, SO2, PM2.5, PM10. According to many studies, the training rate is 60-90%, and the remaining data sets are used for model evaluation to limit overfitting. The calculated air quality index will be divided into 2 data sets: training and forecast.
2.2.5. Statistical Method
The study used several statistical methods to explore the characteristics of time series data to support the construction of the VN_AQI index forecasting model, including the Augmented Dickey-Fuller test, Partial autocorrelation, Autocorrelation, and the white test. The statistical values used to evaluate the accuracy of the forecasting model include correlation coefficient R (Regression), root mean square error (RMSE), and mean absolute percentage error (MAPE).
where yi is the actual water quality value ith, is the average value of actual water quality, water quality value from model ith, is the average water quality value from the model and n number of observed samples.
3. Results and Discussion
3.1. Evaluation of the Air Quality Index at Ba Ria Vung Tau Province
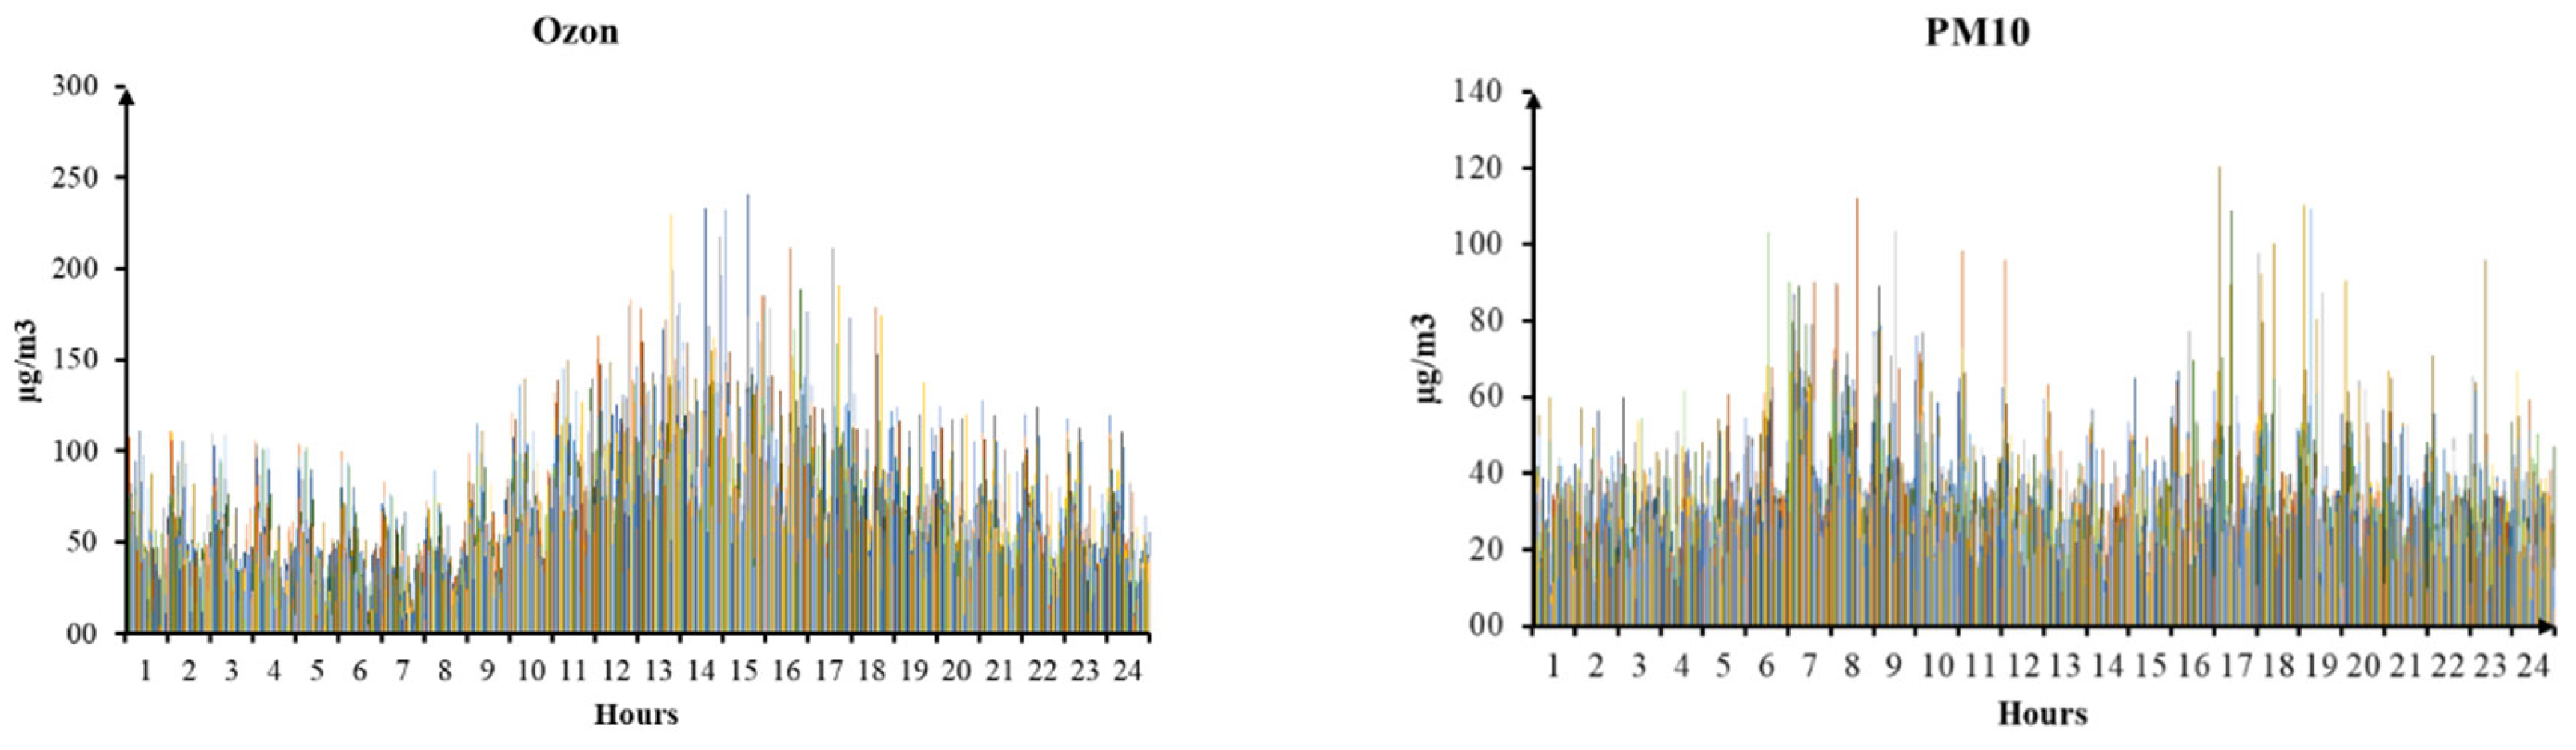
The hourly average CO, NO2, and SO2 values were always within the allowable limits. For hourly average O3, there were 69 times (at KK1), 124 times (at KK2), and 58 times (at KK3) exceeding QCVN 05:2023/BTNMT, with the maximum values occurring from 12 – 2 pm during the day. This is consistent with the rule that ozone will gradually increase in the morning, reach the maximum value at noon, and progressively decrease in the evening. The intensity of solar radiation is the leading cause of fluctuations in surface ozone concentration. For PM10 and PM2.5 at the monitoring stations, the 24-hour average concentrations were generally within the allowable limits. The PM concentration peaked between 7 and 8 am.
Figure 2.
The hourly average values of O3 and PM10.
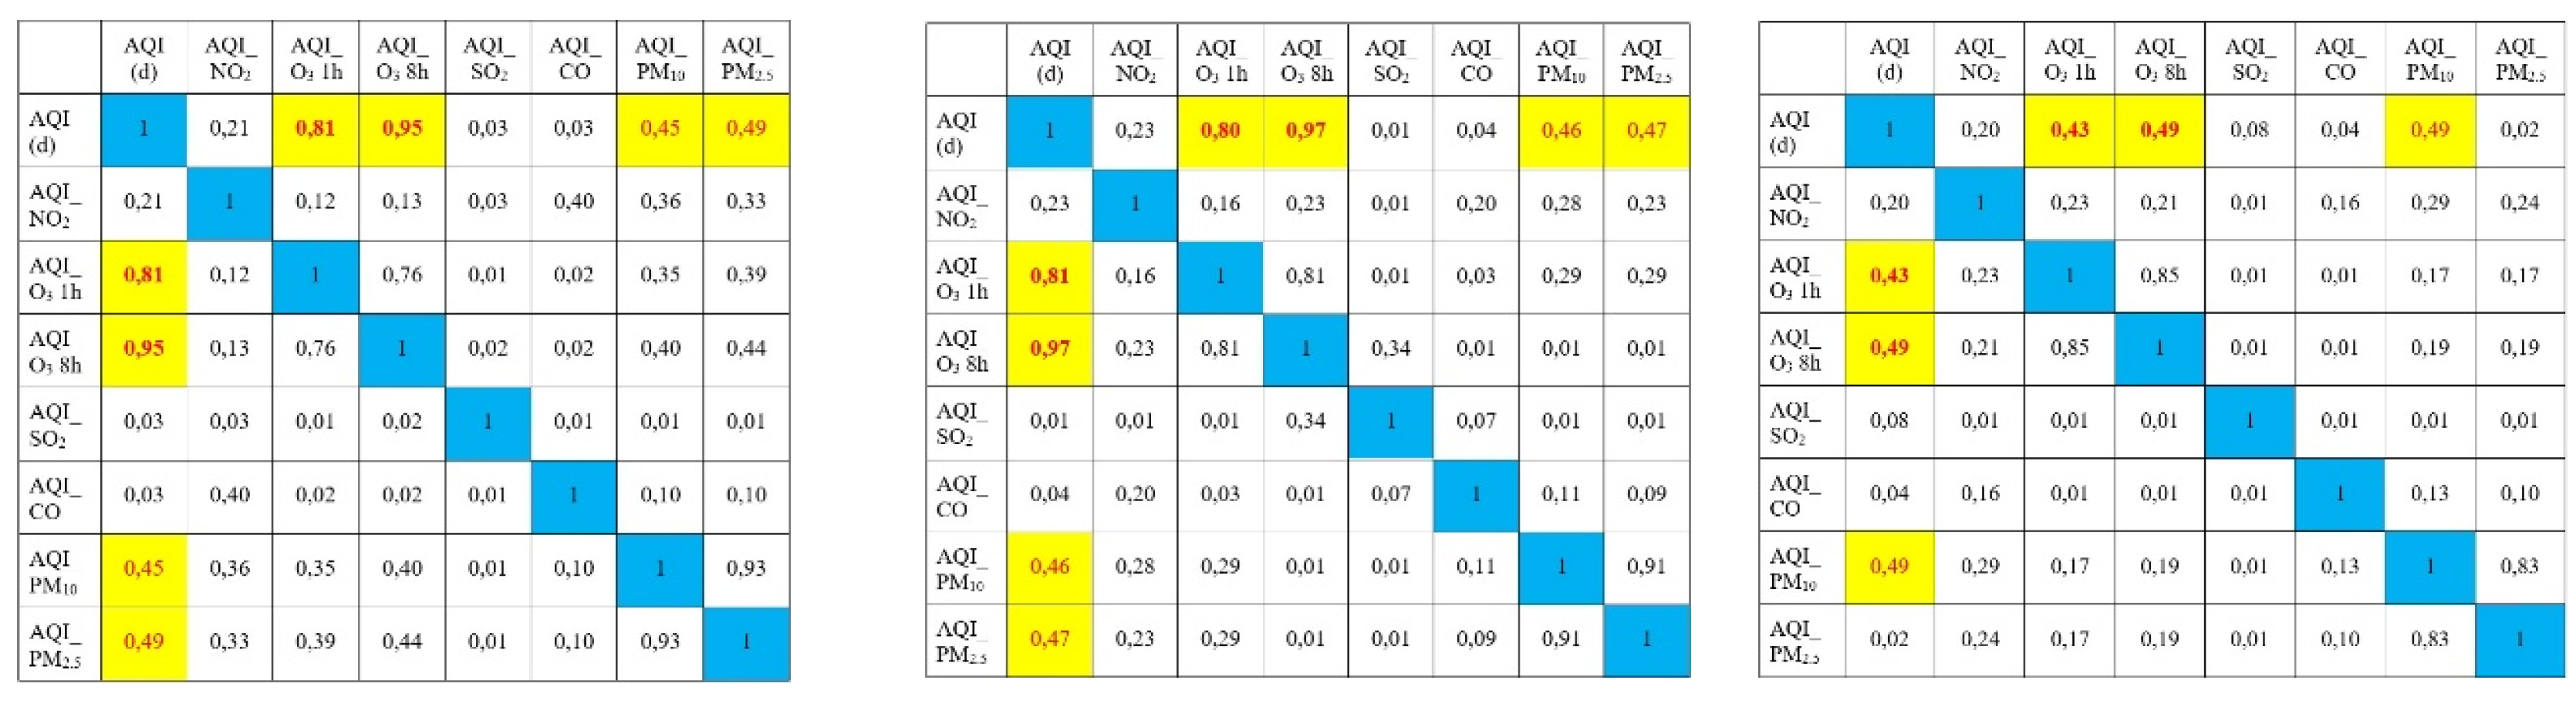
The AQI shows the highest correlation with the 8-hour and 1-hour O3 values, respectively, of 0.95 and 0.81 (at KK1), 0.97 and 0.80 (at KK2), and 0.49 and 0.43 (at KK3). This is also consistent with the fact that the 8-hour and 1-hour O3 values have more exceedances and exceed the allowable limit more often than the remaining parameters. The correlation calculation also shows that CO and SO2 have the least impact on the AQI. In addition, all pollutant values in the dataset are positively correlated with the AQI. This indicates that as pollutant concentration increases, the AQI also rises, reflecting poorer air quality. This highlights the importance of considering these factors in analyzing and predicting air quality changes in the study area. We should select essential factors that have a significant correlation with AQI.
Figure 3.
The correlation between the AQI of each pollutant and AQId (KK1, KK2, KK3).
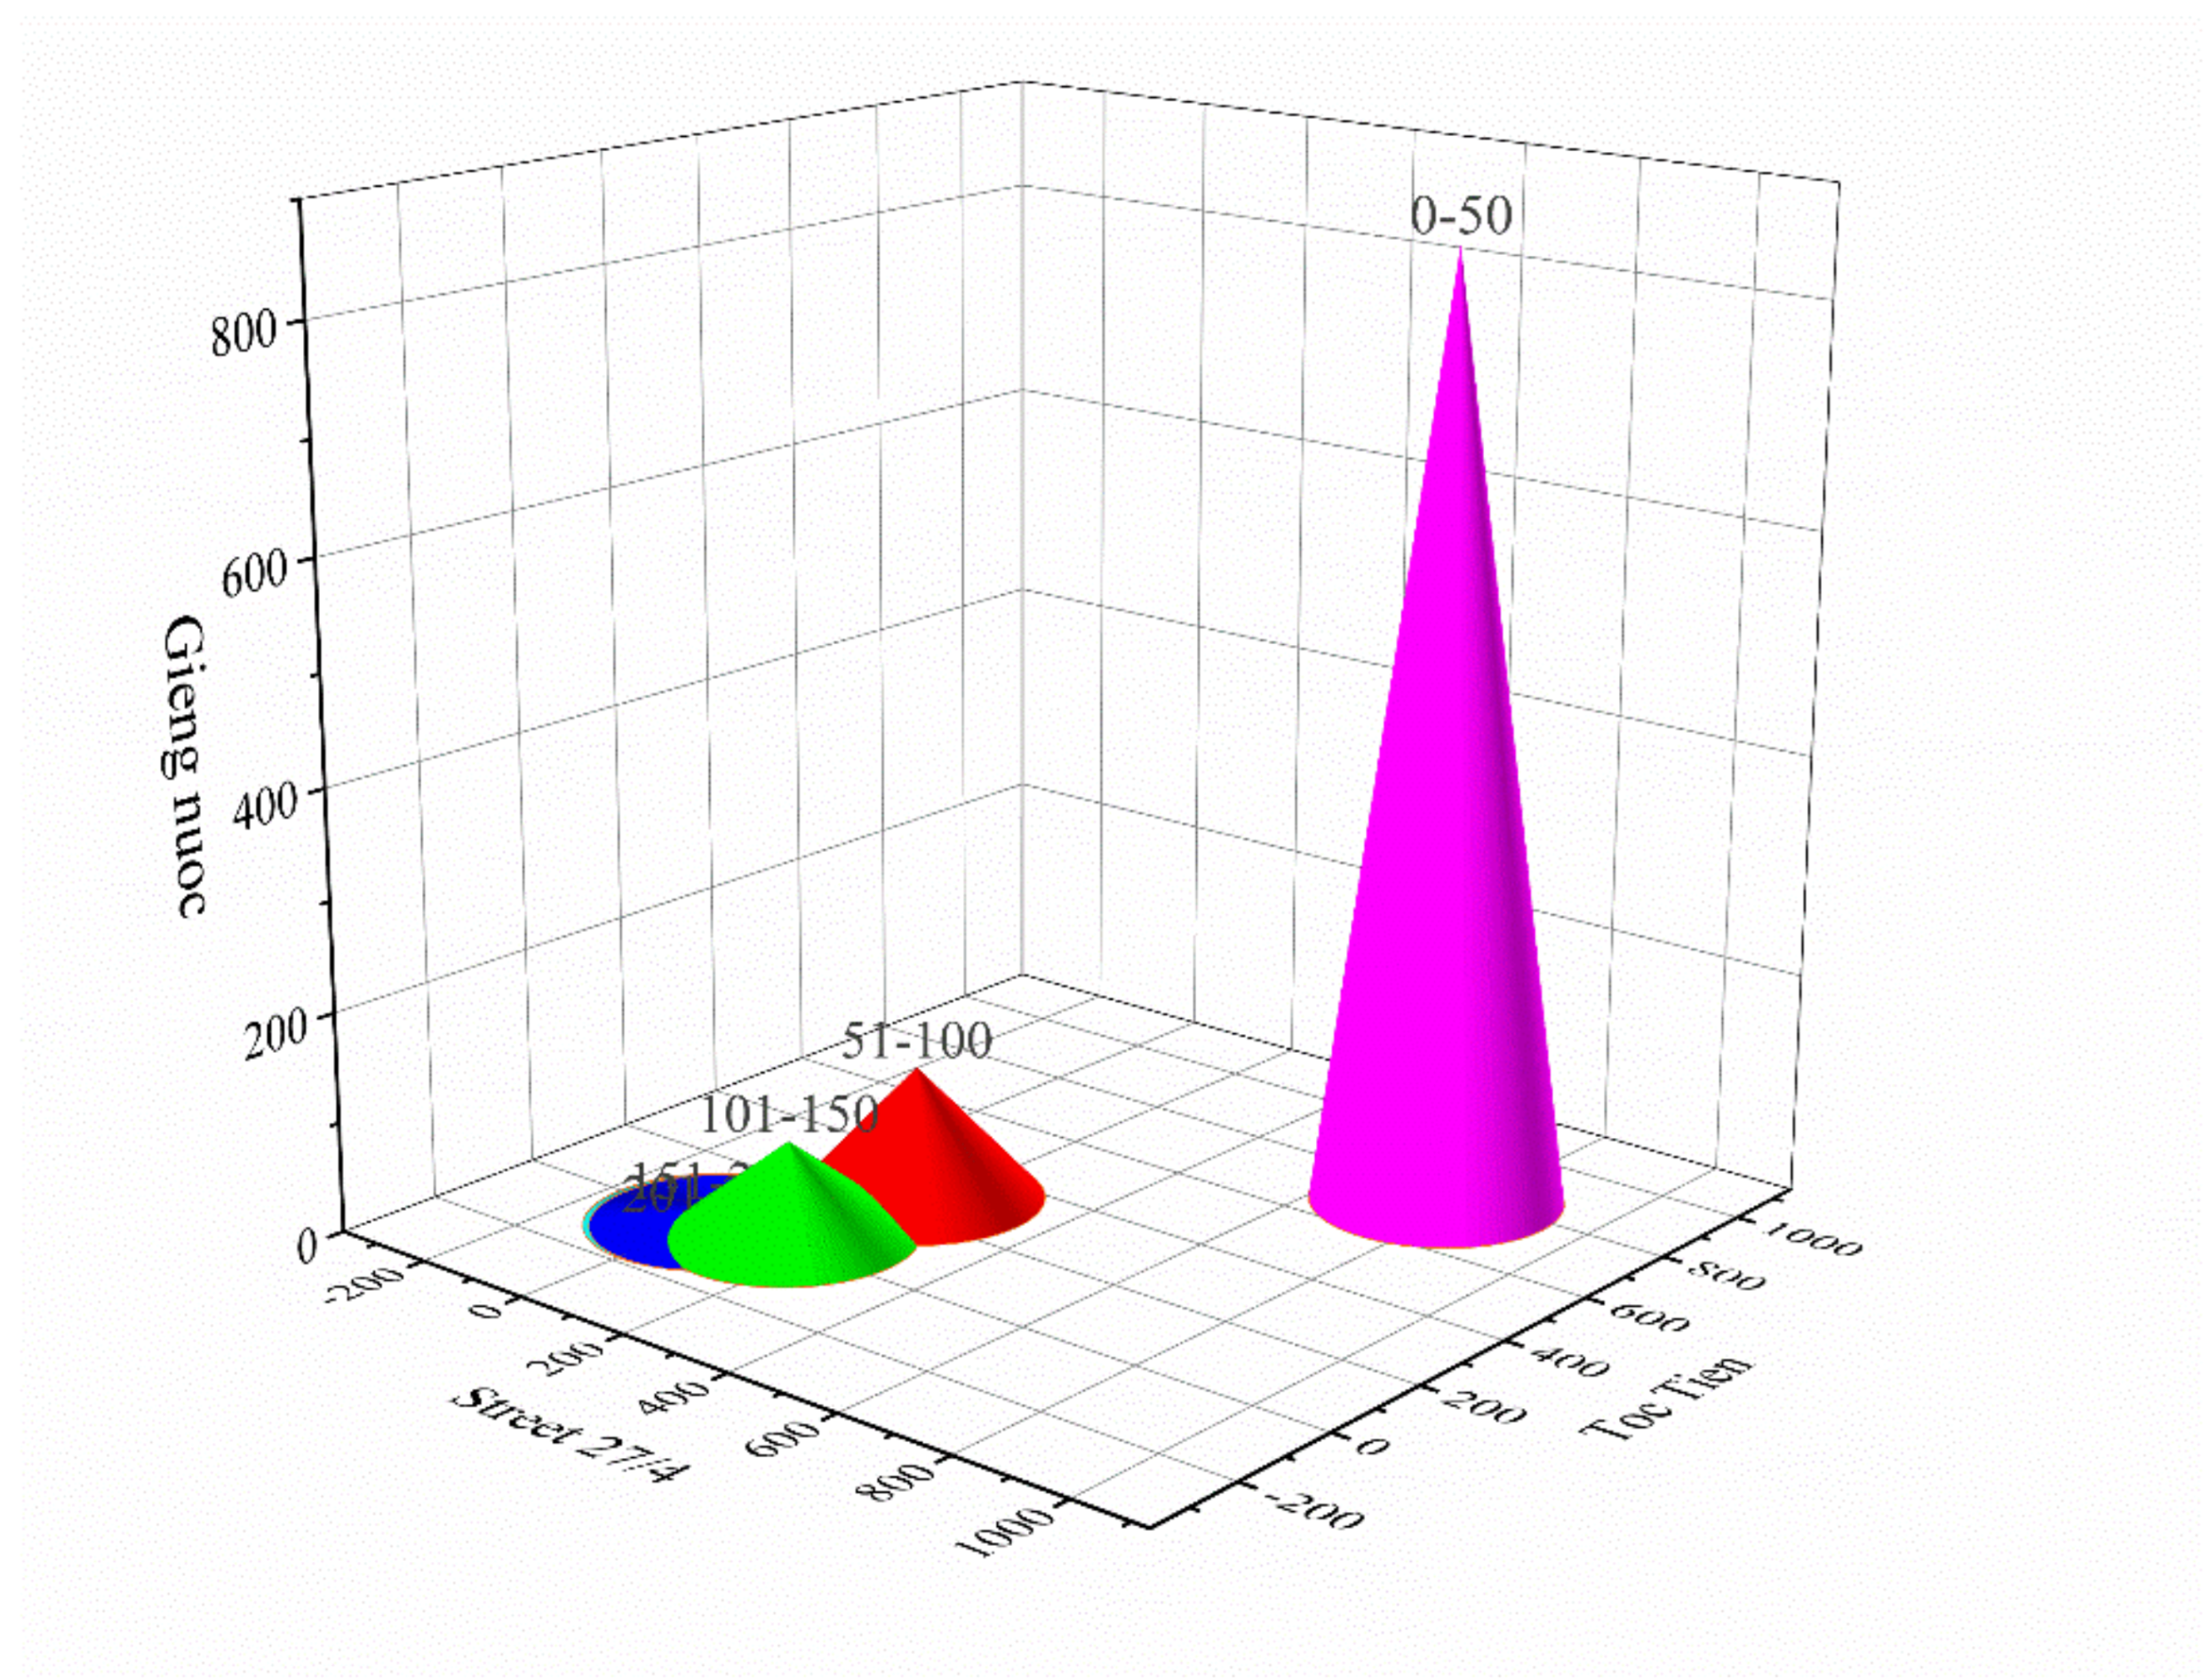
The average AQId value for the period 2020 - 2022 at the three monitoring stations is generally low, as follows: Station KK1 has air quality at good level (0-50) with 79.2%; air quality at an average level (51-100) with 11.4%; air quality at poor level (101-150) with 8.2% and air quality at poor level (151-200) with 1.2%; Station KK2 has at good level with 70.0%; at an average level with 15.8%; at poor level with 12.3% and at Poor level with 1.4%; at very bad level (201-300) with 0.5%; Station KK3 has at good level with 71.4%; at an average level with 25%; at poor level with 2.9% and at poor level with 0.5%; at very bad level with 0.2%. AQId is usually high in the dry season (at the beginning and end of the year, from November to April) and lower in the rainy season (in the middle of the year, from May to October). This shows that air quality in the dry season is more polluted than in the rainy season.
Figure 4.
The sample of AQId in the period 2020 - 2022 at the monitoring stations.
3.2. Air Quality Index Forecasting Model
3.2.1. Survey of Data Stationarity
The analysis of the Augmented Dickey-Fuller (ADF) test conducted at the KK1 location revealed a more significant absolute ADF value of -0.91, compared to the observed ADF value of -5.40, with a p-value of less than 0.0001. This indicates that the AQI series data at the KK2 location is stationary. Similarly, at the KK2 location, the statistical ADF value of -0.91 exceeded the observed ADF value of -5.62, with a p-value of 0.0001, indicating that the AQI data at this location are also stationary. The same conclusion applies to the KK3 monitoring station, which exhibited stationary characteristics (Table 4).
Studying the delay of monitoring points
Furthermore, the investigation of the autocorrelation function (ACF) and partial autocorrelation function (PACF) used to assess the lag structure of the AQI data series for Ba Ria - Vung Tau province showed that the ACF declines rapidly, as illustrated in Figure 5. The analysis indicates that ACF has 30 non-zero lags, with KK3 exhibiting the highest number of statistically significant lags at 30, followed by the KK2 location at 29 significant lags, and the KK1 site, which has the fewest at 26 significant lags. Examination of the PACF results confirmed that the correlation coefficients at the AQI monitoring locations reached statistically substantial levels at lags 1, 2, 3, and 4. The correlations exhibit a sine wave pattern, with significant lags distributed irregularly. Although the KK1 showed a PACF significance at degree 14 with a relatively weak correlation, KK3 recorded significant lags at positions 6-8 and 14, while the KK2 element was significant at lags 10, 14, and 22.
3.2.2. White Noise and Data Distribution Testing
The application of the White test method for air quality monitoring in Ba Ria - Vung Tau province indicates that the AQI index does not conform to the characteristics of white noise. At the KK1 point, the p-values from various tests, including the Jarque-Bera, Box-Pierce, Ljung-Box, and McLeod-Li, are consistently less than 0.0001, indicating significant departures from normality. This finding is corroborated by observations at the KK3 and KK2 stations, as detailed in Table 5. Thus, it can be concluded that the input AQI index data adhere to the requisite criteria for classification as time series data.
3.2.3. Training the LSTM-MA Model
a. Moving average model
Air quality data is highly volatile data. According to Haiyan, environmental data are often unstable [40]. Consequently, AQId index data are processed to remove noise and smooth the data (Table 6, Figure 6, Figure 7 and Figure 8).
b. Training
Determine the number of neurons in the hidden layer
The study used monitoring data from the KK3 station to determine the optimal number of hidden-layer neurons in a neural network. The investigation examined various neuron counts, starting at 10 and increasing until the model identified the optimal value. The following parameters were set for the network training model: the Adam optimization algorithm was employed, with a gradient variation threshold of 1, an initial learning rate of 0.01, and a maximum of 200 iterations.
Table 6.
Variation of RMSE error with the number of neurons in the imprint layer.
| No. | Number of neural | Validation | Forecast |
|---|---|---|---|
| 1.. | 10 | 0.027 | 0.043 |
| 2. | 20 | 0.028 | 0.039 |
| 3. | 30 | 0.0261 | 0.038 |
| 4. | 40 | 0.0256 | 0.038 |
| 5. | 50 | 0.0275 | 0.040 |
| 6. | 60 | 0.0257 | 0.040 |
| 7. | 70 | 0.0275 | 0.040 |
The investigation involved training the neural network with standard model parameters while varying the number of hidden-layer neurons. The analysis determined that the optimal configuration for the LSTM with the MA model was 40 hidden-layer neurons. This particular architecture exhibited superior performance metrics during model training evaluations. Specifically, the RMSE recorded for the evaluation and forecasting datasets was 0.0256 and 0.038, respectively. These values represent the lowest error rates observed among the models assessed. Consequently, the refined training parameters for the LSTM-MA model applied to air quality prediction in Ba Ria -Vung Tau province are established as follows: 40 neurons in the hidden layer, implementation of the Adam optimization algorithm, a gradient variation threshold set to 1, an initial learning rate of 0.01, and a maximum iteration limit of 200 (Table 6).
Evaluating the forecasting performance of LSTM-MA
The LSTM-MA model forecasts all air quality monitoring points using the network training structure described above. Each monitoring point has a forecasting period from k = 7 to k = 30 (Table 7).
Compare the performance of the LSTM-MA to other models
The study developed various forecasting models, including traditional methods and LSTM network models. To assess the reliability of the results, the statistical values of RMSE and MAPE were utilized. The findings revealed that the LSTM-MA model outperformed the LSTM and ARIMA models at most automatic air monitoring points.
At the KK3 point, the RMSE and MAPE values were notably better than those of the LSTM and ARIMA models, recorded at 0.0950 and 30%, respectively. Similar results were observed at KK2 and KK1 points. Among the models compared, the ARIMA model had the highest MAPE, suggesting that traditional time-series forecasting is less effective for predicting air quality indices.
When comparing the LSTM-MA and LSTM models, the LSTM-MA model demonstrates superior predictive performance for the air quality index. However, the difference in forecasting performance between the two models is not significantly pronounced (Table 8).
4. Conclusions
The study achieved the following results from the calculations and experiments: (i) Assessed the current air quality status at three automatic air quality monitoring stations (KK1-KK3) in Ba Ria-Vung Tau province for 2020-2022. The collected data set achieved a completeness level of over 99%. Air quality in the study area is relatively good, with CO, NO2, and SO2 below the allowable limits during the study period, except for PM10 and PM2.5, which exceeded the allowable limits on a few days but not significantly. Ozone is the parameter with the highest number of exceedances of the permissible limit and the parameter with the most significant impact on the AQI index. Air quality tends to vary seasonally, with levels low in the summer months. In particular, air quality in this area is mainly affected by Ozone pollutants in 1 hour and 8 hours; (ii) The LSTM-MA model has been successfully built with the highest forecasting accuracy for the next 7 days with RMSE of 0.157 - 0.271; and MAPE of 30.0 - 31.0. When forecasting a more extended period, corresponding to the next 2 weeks or 1 month, the model produces positive results, with the evaluation indexes RMSE and MAPE ranging from 0.186 to 0.497 and 46.3 to 84.4, respectively. In addition, the study also compared and evaluated several other forecasting models, such as LSTM, ARIMA, etc.
Future Work and Limitations
Using auxiliary data as model input, such as meteorological and socio-economic development data, to significantly improve prediction performance.
Applying the forecasting model from this study to the data set from other automatic air quality monitoring stations to evaluate the applicability of the model more generally.
Applying other data processing methods, such as CEEMDAN and ARIMA, or hybridizing with models such as CNN-LSTM and LSTM-ARIMA, to improve the model's forecasting ability.
Author Contributions
H. M. D. methodology and writing—original draft preparation, and N.H.T. editing. All authors have read and agreed to the published version of the manuscript.
Funding
This research is funded by Vietnam National University, Ho Chi Minh City (VNU-HCM) under grant number C2023-24-02.
Institutional Review Board Statement
Not applicable.
Informed Consent Statement
Not applicable.
Data Availability Statement
The data that support the findings of this study are available from the corresponding author. Interested researchers or readers may request access to the data by contacting the corresponding author directly.
Acknowledgments
We appreciate the effort of an anonymous reviewer and the valuable comments and suggestions for improving the manuscript
Conflicts of Interest
The authors declare no conflicts of interest.”
Abbreviations
The following abbreviations are used in this manuscript:
| BRVT | Ba Ria – Vung Tau |
| LSTM | Long Short-Term Memory |
| MA | Moving Average |
| AQI | Air Quality Index |
References
- Li, X.; et al. Long short-term memory neural network for air pollutant concentration predictions: Method development and evaluation. Environ Pollut 2017, 231, 997–1004. [Google Scholar] [CrossRef]
- Buonocore, J.J.; Dong, X.; Spengler, J.D.; Fu, J.S.; Levy, J.I. Using the Community Multiscale Air Quality (CMAQ) model to estimate public health impacts of PM2.5 from individual power plants. Environment International 2014, 68, 200–208. [Google Scholar] [CrossRef]
- Wang, L.; et al. Source apportionment of PM 2.5 in top polluted cities in Hebei, China using the CMAQ model. Atmospheric Environment 2015, 122, 723–736. [Google Scholar] [CrossRef]
- Saide, P.E.; et al. Forecasting urban PM10 and PM2. 5 pollution episodes in very stable nocturnal conditions and complex terrain using WRF–Chem CO tracer model. Atmospheric Environment 2011, 45, 2769–2780. [Google Scholar]
- Pandey, G.; Venkatram, A.; Arunachalam, S. Evaluating AERMOD with measurements from a major U.S. airport located on a shoreline. Atmospheric Environment 2023, 294. [Google Scholar] [CrossRef]
- Bang, H.Q.; Khue, V.H.N.; Tam, N.T.; Lasko, K. Air pollution emission inventory and air quality modeling for Can Tho City, Mekong Delta, Vietnam. Air Quality, Atmosphere & Health 2017, 11, 35–47. [Google Scholar] [CrossRef]
- Dung, H.M.; Khue, V.H.N. Study on Load-Carrying Capacity Zoning in Atmospheric Environment in Developing Countries — A Case Study of Can Tho City, Vietnam. International Journal of Environmental Science and Development 2021, 12, 193–203. [Google Scholar] [CrossRef]
- Liao, Q.; et al. Deep Learning for Air Quality Forecasts: a Review. Current Pollution Reports 2020, 6, 399–409. [Google Scholar] [CrossRef]
- Kumar, U.; Jain, V.K. ARIMA forecasting of ambient air pollutants (O3, NO, NO2 and CO). Stochastic Environmental Research and Risk Assessment 2010, 24, 751–760. [Google Scholar] [CrossRef]
- Chen, Y.; Cui, S.; Chen, P.; Yuan, Q.; Kang, P.; Zhu, L. An LSTM-based neural network method of particulate pollution forecast in China. Environ. Res. Lett 2021, 16, 044006. [Google Scholar] [CrossRef]
- Vlachogianni, A.; Kassomenos, P.; Karppinen, A.; Karakitsios, S.; Kukkonen, J. Evaluation of a multiple regression model for the forecasting of the concentrations of NOx and PM10 in Athens and Helsinki. Science of The Total Environment 2011, 409, 1559–1571. [Google Scholar] [CrossRef]
- Seng, D.; et al. Spatiotemporal prediction of air quality based on LSTM neural network. Alexandria Engineering Journal 2021, 60, 2021–2032. [Google Scholar] [CrossRef]
- Zhu, S.; Lian, X.; Liu, H.; Hu, J.; Wang, Y.; Che, J. Daily air quality index forecasting with hybrid models: A case in China. Environmental Pollution 2017, 231, 1232–1244. [Google Scholar] [CrossRef]
- Méndez, M.; Merayo, M.G.; Núñez, M. Machine learning algorithms to forecast air quality: a survey. Artificial Intelligence Review 2023, 56, 10031–10066. [Google Scholar] [CrossRef] [PubMed]
- Al-Sadman Chowdhury, M.S.U., Md Rashad Tanjim, Fariha Noor, Rashedur M. Rahman, Application of Data Mining Techniques on Air Pollution of Dhaka City, in Proceedings of 2020 IEEE 10th International Conference on Intelligent Systems. 2020.
- Landi Zhoul, M.C., Qingjian Ni, A hybrid Prophet-LSTM Model for Prediction of Air Quality Index, in 2020 IEEE Symposium Series on Computational Intelligence (SSCI). 2020.
- Jui-Chuan Cheng, H.-C.P. Air Quality Forecast and Evaluation Based on Long Short-Term Memory Network and Fuzzy Algorithm, in 2021 IEEE 4th International Conference on Knowledge Innovation and Invention (ICKII). 2021.
- Subramaniam, S.; Raju, N.; Ganesan, A.; Rajavel, N.; Chenniappan, M.; Prakash, C.; Pramanik, A.; Basak, A.K.; Dixit, S. Artificial Intelligence Technologies for Forecasting Air Pollution and Human Health: A Narrative Review. Sustainability 2022, 14, 9951. [Google Scholar] [CrossRef]
- Bakar, M.A.A.; Ariff, N.M.; Nadzir, M.S.M.; Wen, O.L.; Suris, F.N.A. Prediction of Multivariate Air Quality Time Series Data using Long Short-Term Memory Network. Malaysian Journal of Fundamental and Applied Sciences 2022, 1, 52–59. [Google Scholar] [CrossRef]
- Ho, C.H.; Park, I.; Kim, J.; Lee, J.B. PM(2.5) Forecast in Korea using the Long Short-Term Memory (LSTM) Model. Asia Pac J Atmos Sci 2022, 1–14. [Google Scholar]
- Xu, S.; Li, W.; Zhu, Y.; Xu, A. A novel hybrid model for six main pollutant concentrations forecasting based on improved LSTM neural networks. Sci Rep 2022, 12, 14434. [Google Scholar] [CrossRef]
- Spyrou, E.D.; Tsoulos, I.; Stylios, C. Applying and Comparing LSTM and ARIMA to Predict CO Levels for a Time-Series Measurements in a Port Area. Signals 2022, 3, 235–248. [Google Scholar] [CrossRef]
- Tsokov, S.; Lazarova, M.; Aleksieva-Petrova, A. A Hybrid Spatiotemporal Deep Model Based on CNN and LSTM for Air Pollution Prediction. Sustainability 2022, 14. [Google Scholar] [CrossRef]
- Duan, J.; Gong, Y.; Luo, J.; Zhao, Z. Air-quality prediction based on the ARIMA-CNN-LSTM combination model optimized by dung beetle optimizer. Sci Rep 2023, 13, 12127. [Google Scholar] [CrossRef]
- Drewil, G.I.; Al-Bahadili, R.J. Air pollution prediction using LSTM deep learning and metaheuristics algorithms. Measurement: Sensors, 2022; 24. [Google Scholar]
- Chen, H.; Guan, M.; Li, H. Air Quality Prediction Based on Integrated Dual LSTM Model. IEEE Access 2021, 9, 93285–93297. [Google Scholar] [CrossRef]
- Raheja, S.; Malik, S. Prediction of Air Quality Using LSTM Recurrent Neural Network. International Journal of Software Innovation 2022, 10, 1–16. [Google Scholar] [CrossRef]
- Taoying Li, M.H.; Wu, X. A Hybrid CNN-LSTM Model for Forecasting Particulate Matter (PM2. 5). IEEE Access 2020, 8, 26933–26940. [Google Scholar]
- Pak, U.; Kim, C.; Ryu, U.; Sok, K.; Pak, S. A hybrid model based on convolutional neural networks and long short-term memory for ozone concentration prediction. Air Quality, Atmosphere & Health 2018, 11, 883–895. [Google Scholar] [CrossRef]
- Qi, Y.; Li, Q.; Karimian, H.; Liu, D. A hybrid model for spatiotemporal forecasting of PM2.5 based on graph convolutional neural network and long short-term memory. Science of the Total Environment 2019, 664, 1–10. [Google Scholar] [CrossRef]
- Fan, S.; Hao, D.; Feng, Y.; Xia, K.; Yang, W. A Hybrid Model for Air Quality Prediction Based on Data Decomposition. Information 2021, 12, 210. [Google Scholar] [CrossRef]
- Tran Xuan Vu, L.Q.C. A Review on Current Status of Urban Air Pollution in Ho Chi Minh city and Ha Noi. DTU Journal of Science and Technology 2021, 4, 45–53. [Google Scholar]
- Rakholia, R.; Le, Q.; Vu, K.; Ho, B.Q.; Carbajo, R.S. AI-based air quality PM2.5 forecasting models for developing countries: A case study of Ho Chi Minh City, Vietnam. Urban Climate 2022, 46, 101315. [Google Scholar] [CrossRef]
- Minh, V.T.T.; Tin, T.T.; Hien, T.T. PM2.5 Forecast System by Using Machine Learning and WRF Model, A Case Study: Ho Chi Minh City, Vietnam. Aerosol and Air Quality Research 2021, 21, 210108. [Google Scholar] [CrossRef]
- Administration, V.E. Technical instructions for calculating and publishing Vietnam's air quality index. 2019.
- Duong, L.D. A short - term load forecasting model based on Group method of data handling. The University of Danang - Journal of Science and Technology 2019, 17. [Google Scholar]
- Krishan, M.; et al. Air quality modelling using long short-term memory (LSTM) over NCT-Delhi, India. Air Quality, Atmosphere Health 2019, 12, 899–908. [Google Scholar] [CrossRef]
- Yuan, X.; et al. Deep learning for quality prediction of nonlinear dynamic processes with variable attention-based long short-term memory network. The Canadian Journal of Chemical Engineering 2019, 98, 1377–1389. [Google Scholar] [CrossRef]
- FR Johnston, J.E.B.; Meadows, M.; Shale, E. Some Properties of a Simple Moving Average when Applied to Forecasting a Time Series. The Journal of the Operational Research Society 1999, 50, 1267–1271. [Google Scholar] [CrossRef]
- Haiyan, W. Assessment and prediction of overall environmental quality of Zhuzhou City, Hunan Province, China. Journal of Environmental Management 2002, 66, 329–340. [Google Scholar] [CrossRef]
Figure 1.
Location of air monitoring stations.
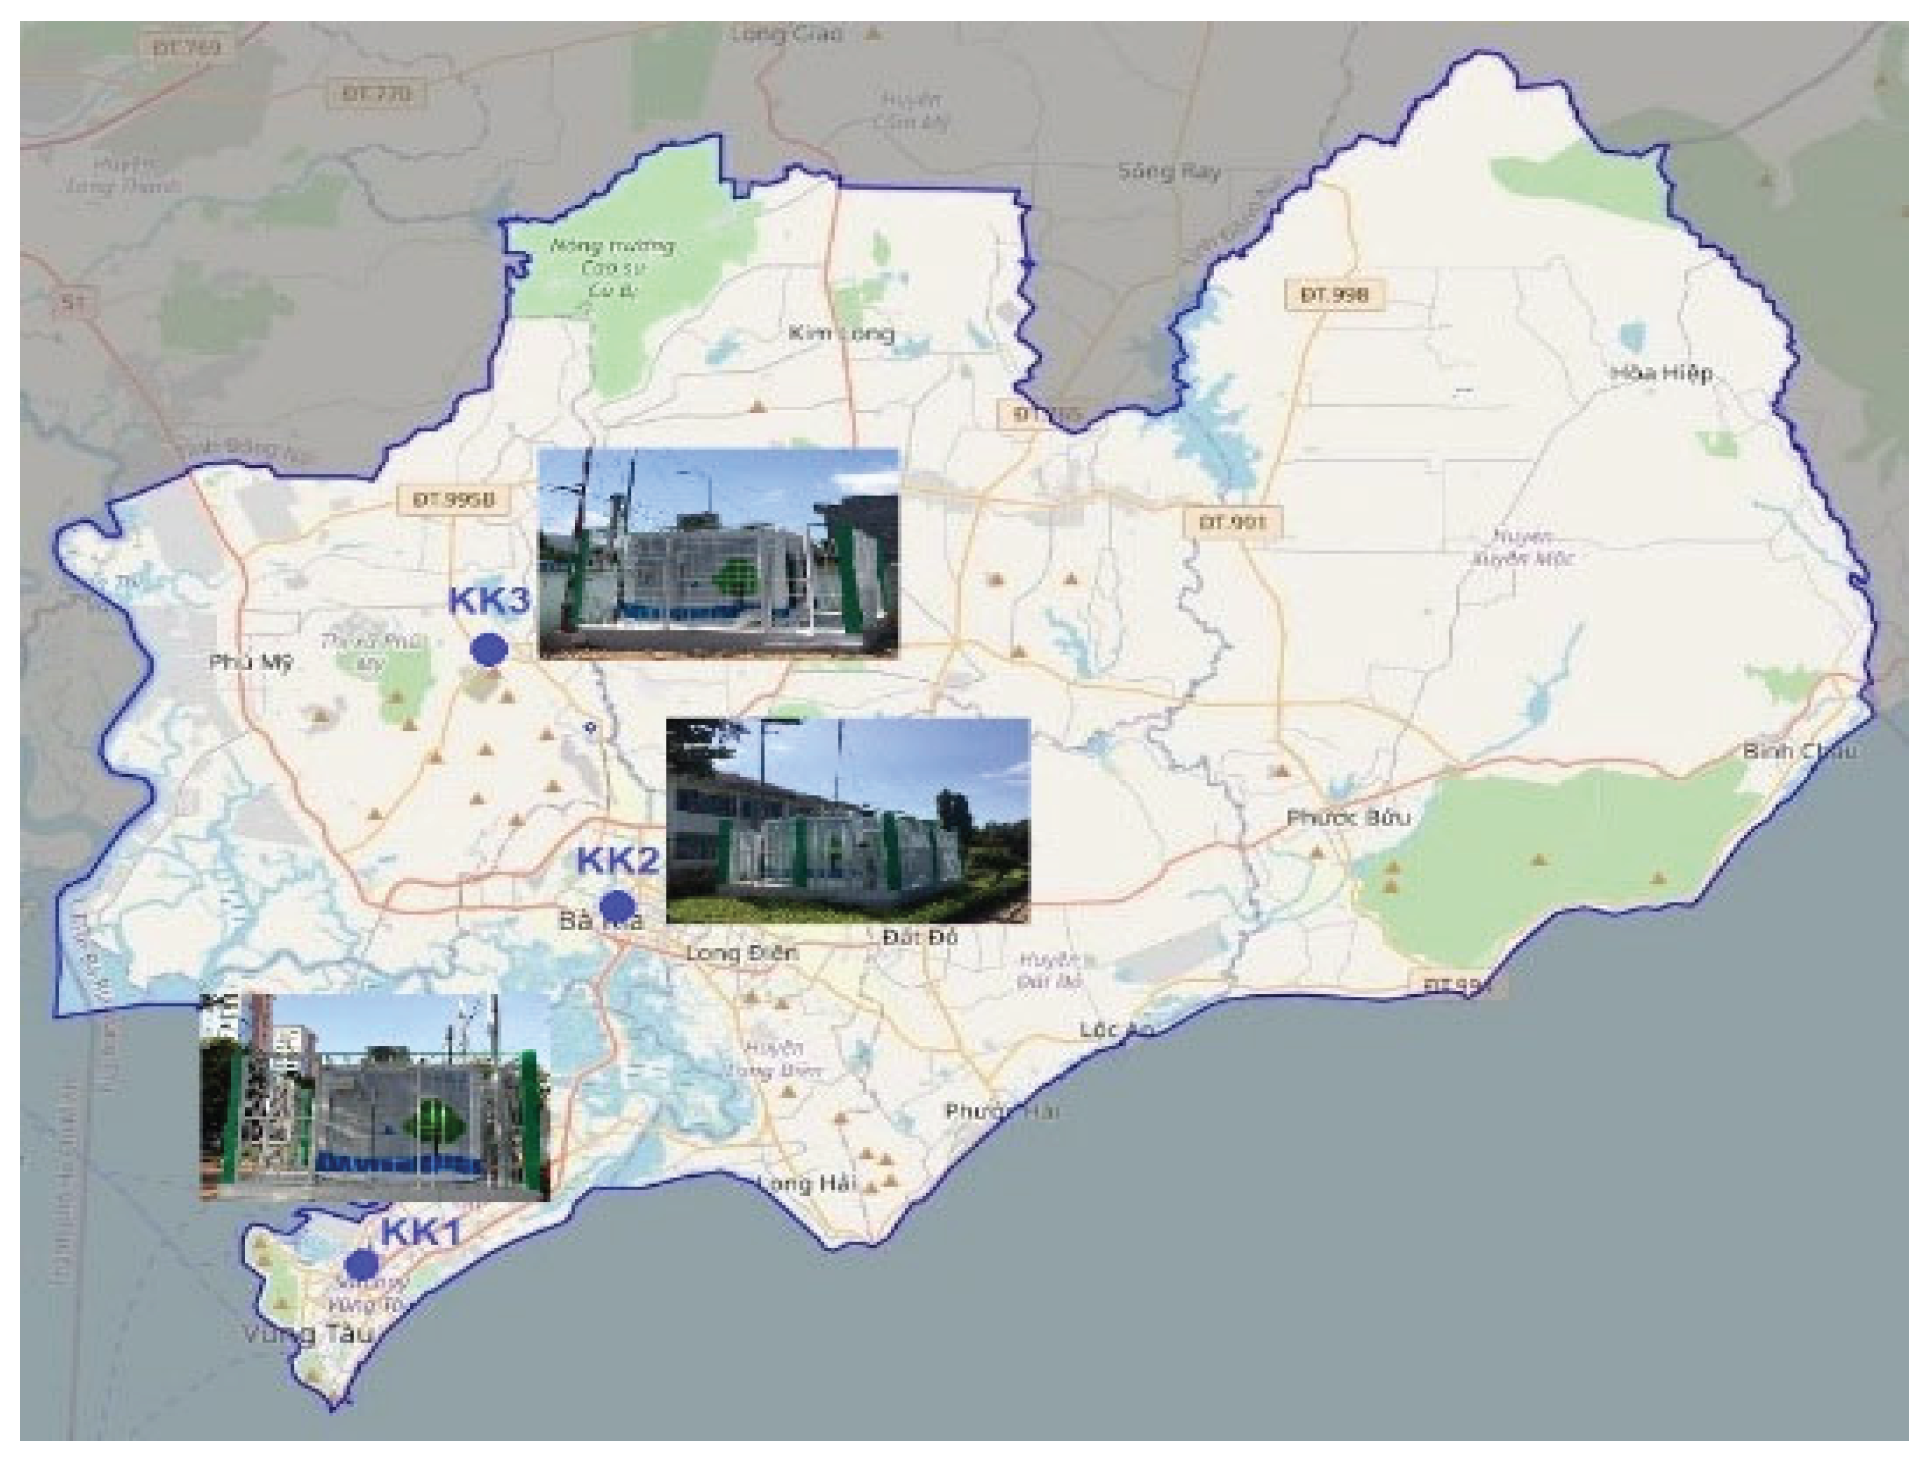
Figure 5.
Total autocorrelation function (ACF) and partial autocorrelation function (PACF): (a and b the KK1; c and d KK3; e and f the KK2).
Figure 5.
Total autocorrelation function (ACF) and partial autocorrelation function (PACF): (a and b the KK1; c and d KK3; e and f the KK2).
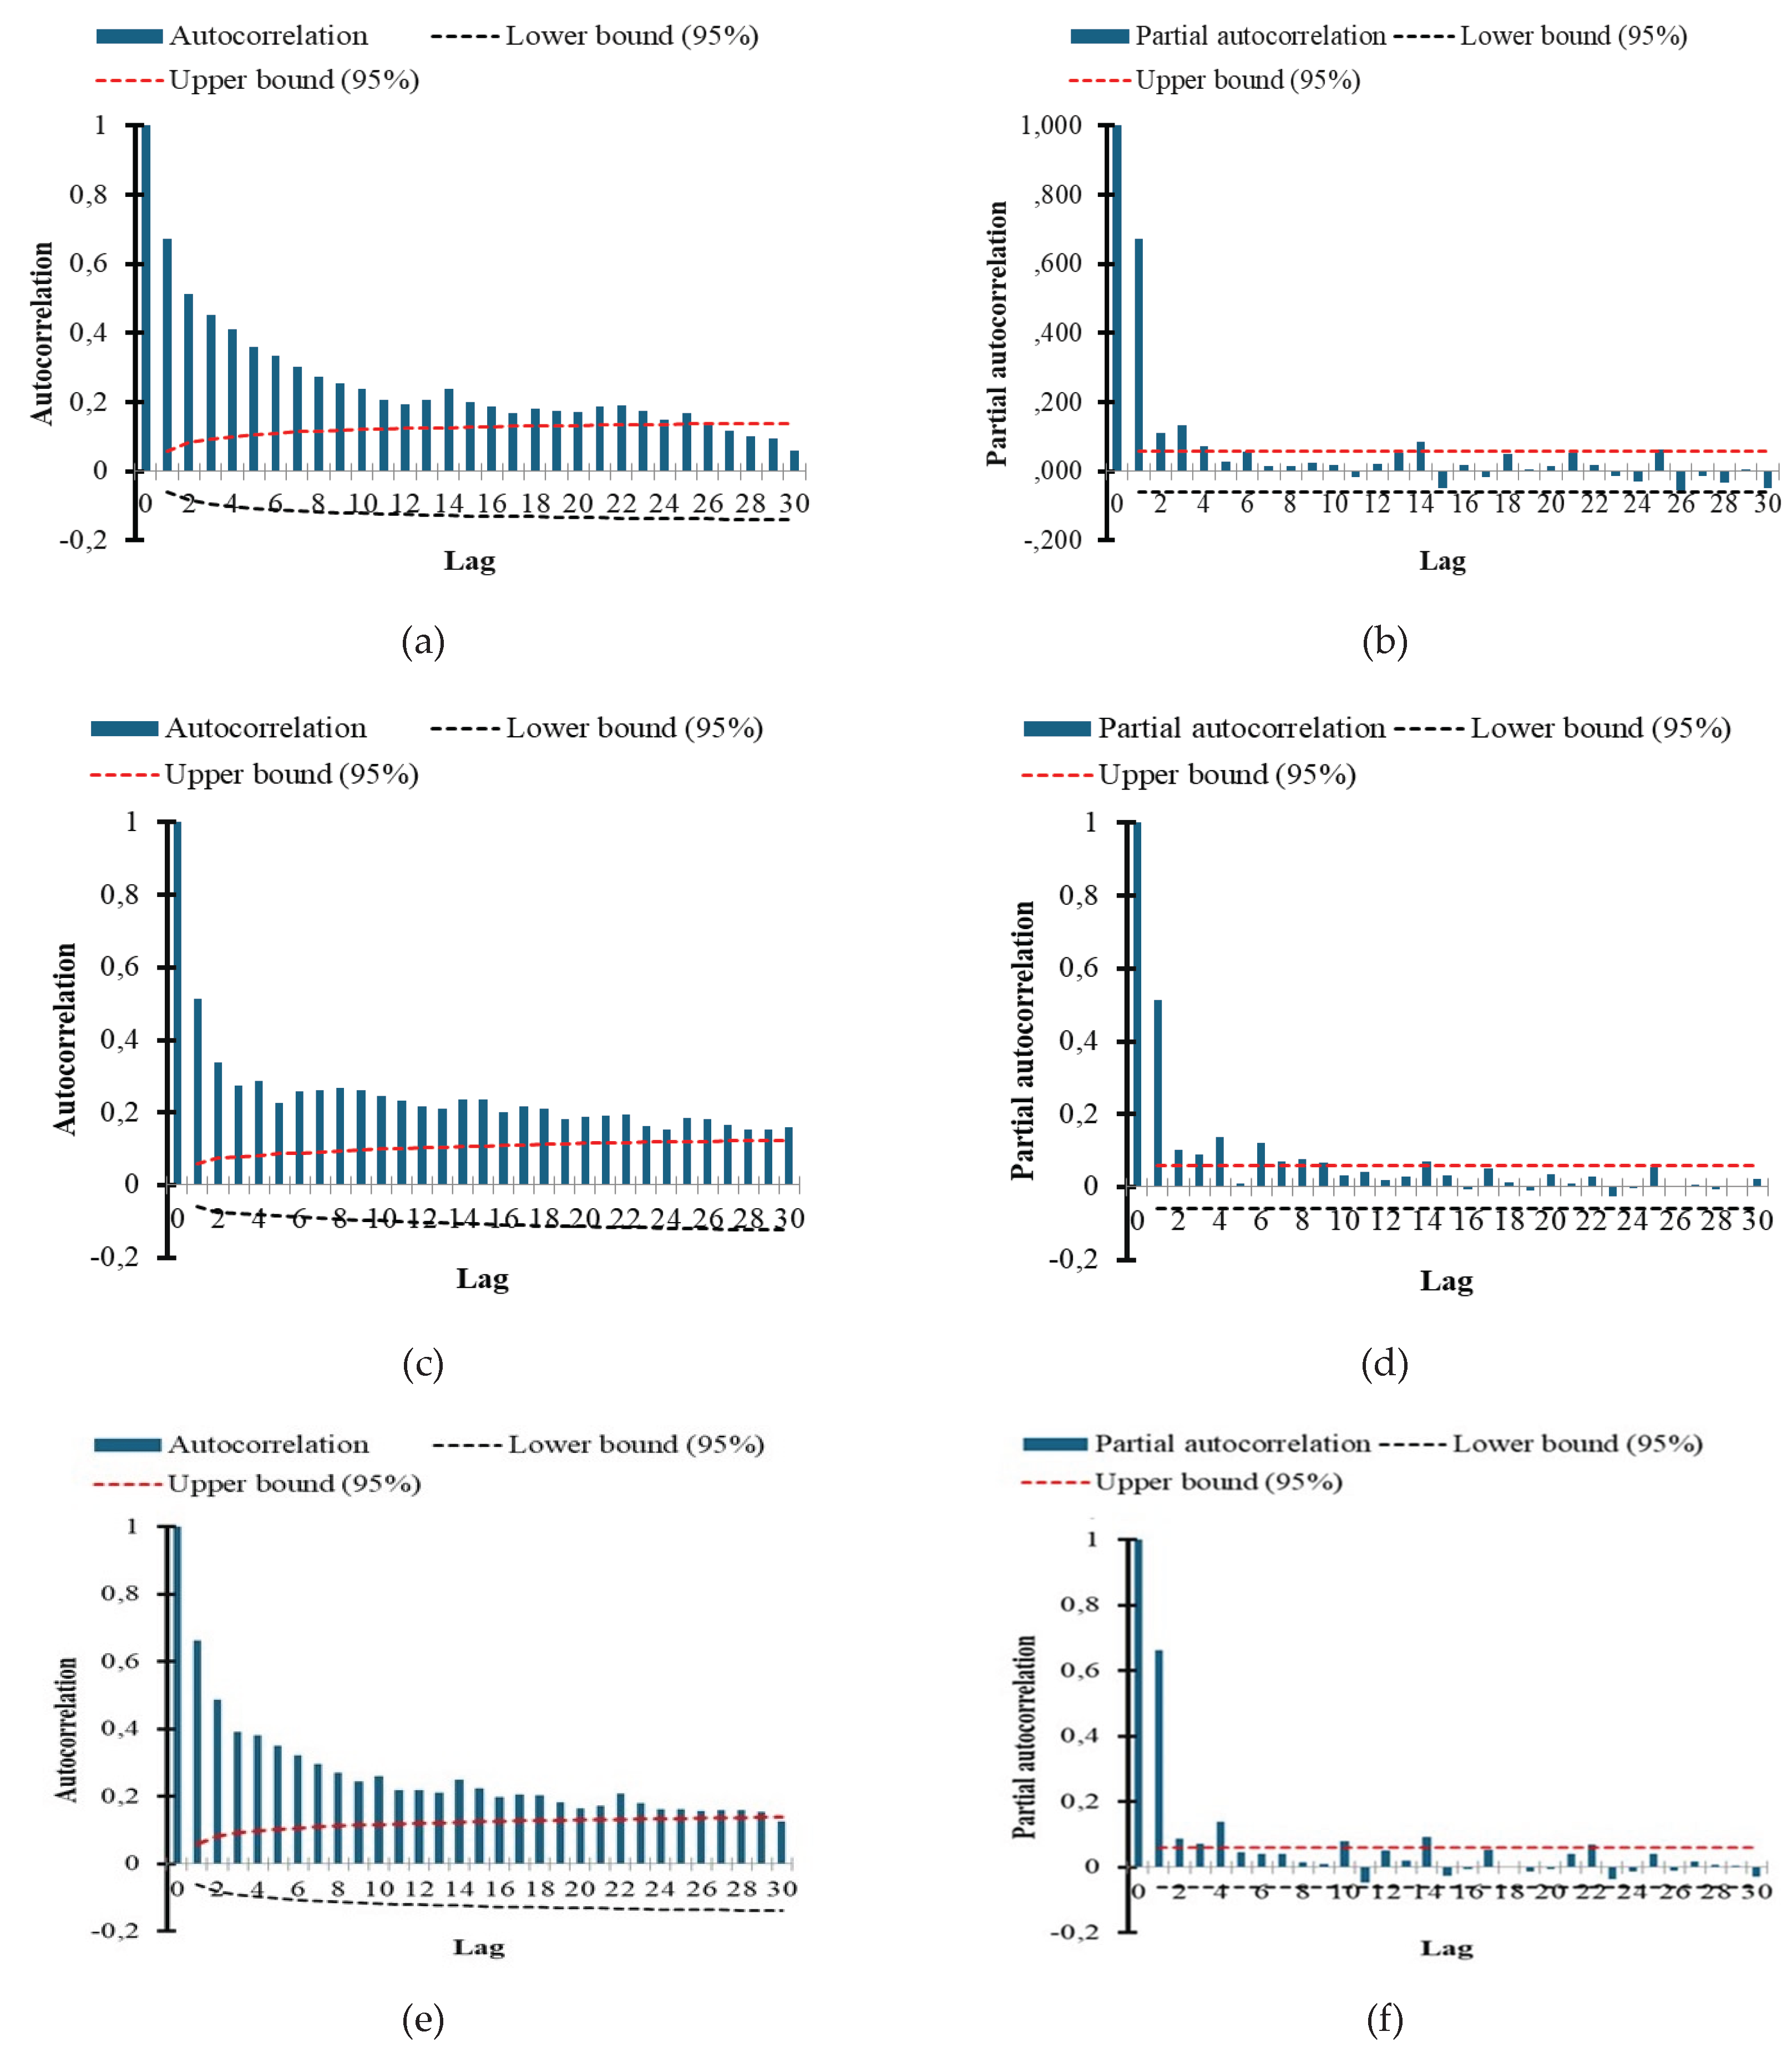
Figure 6.
Actual AQI and MA (AQI) for the KK2.
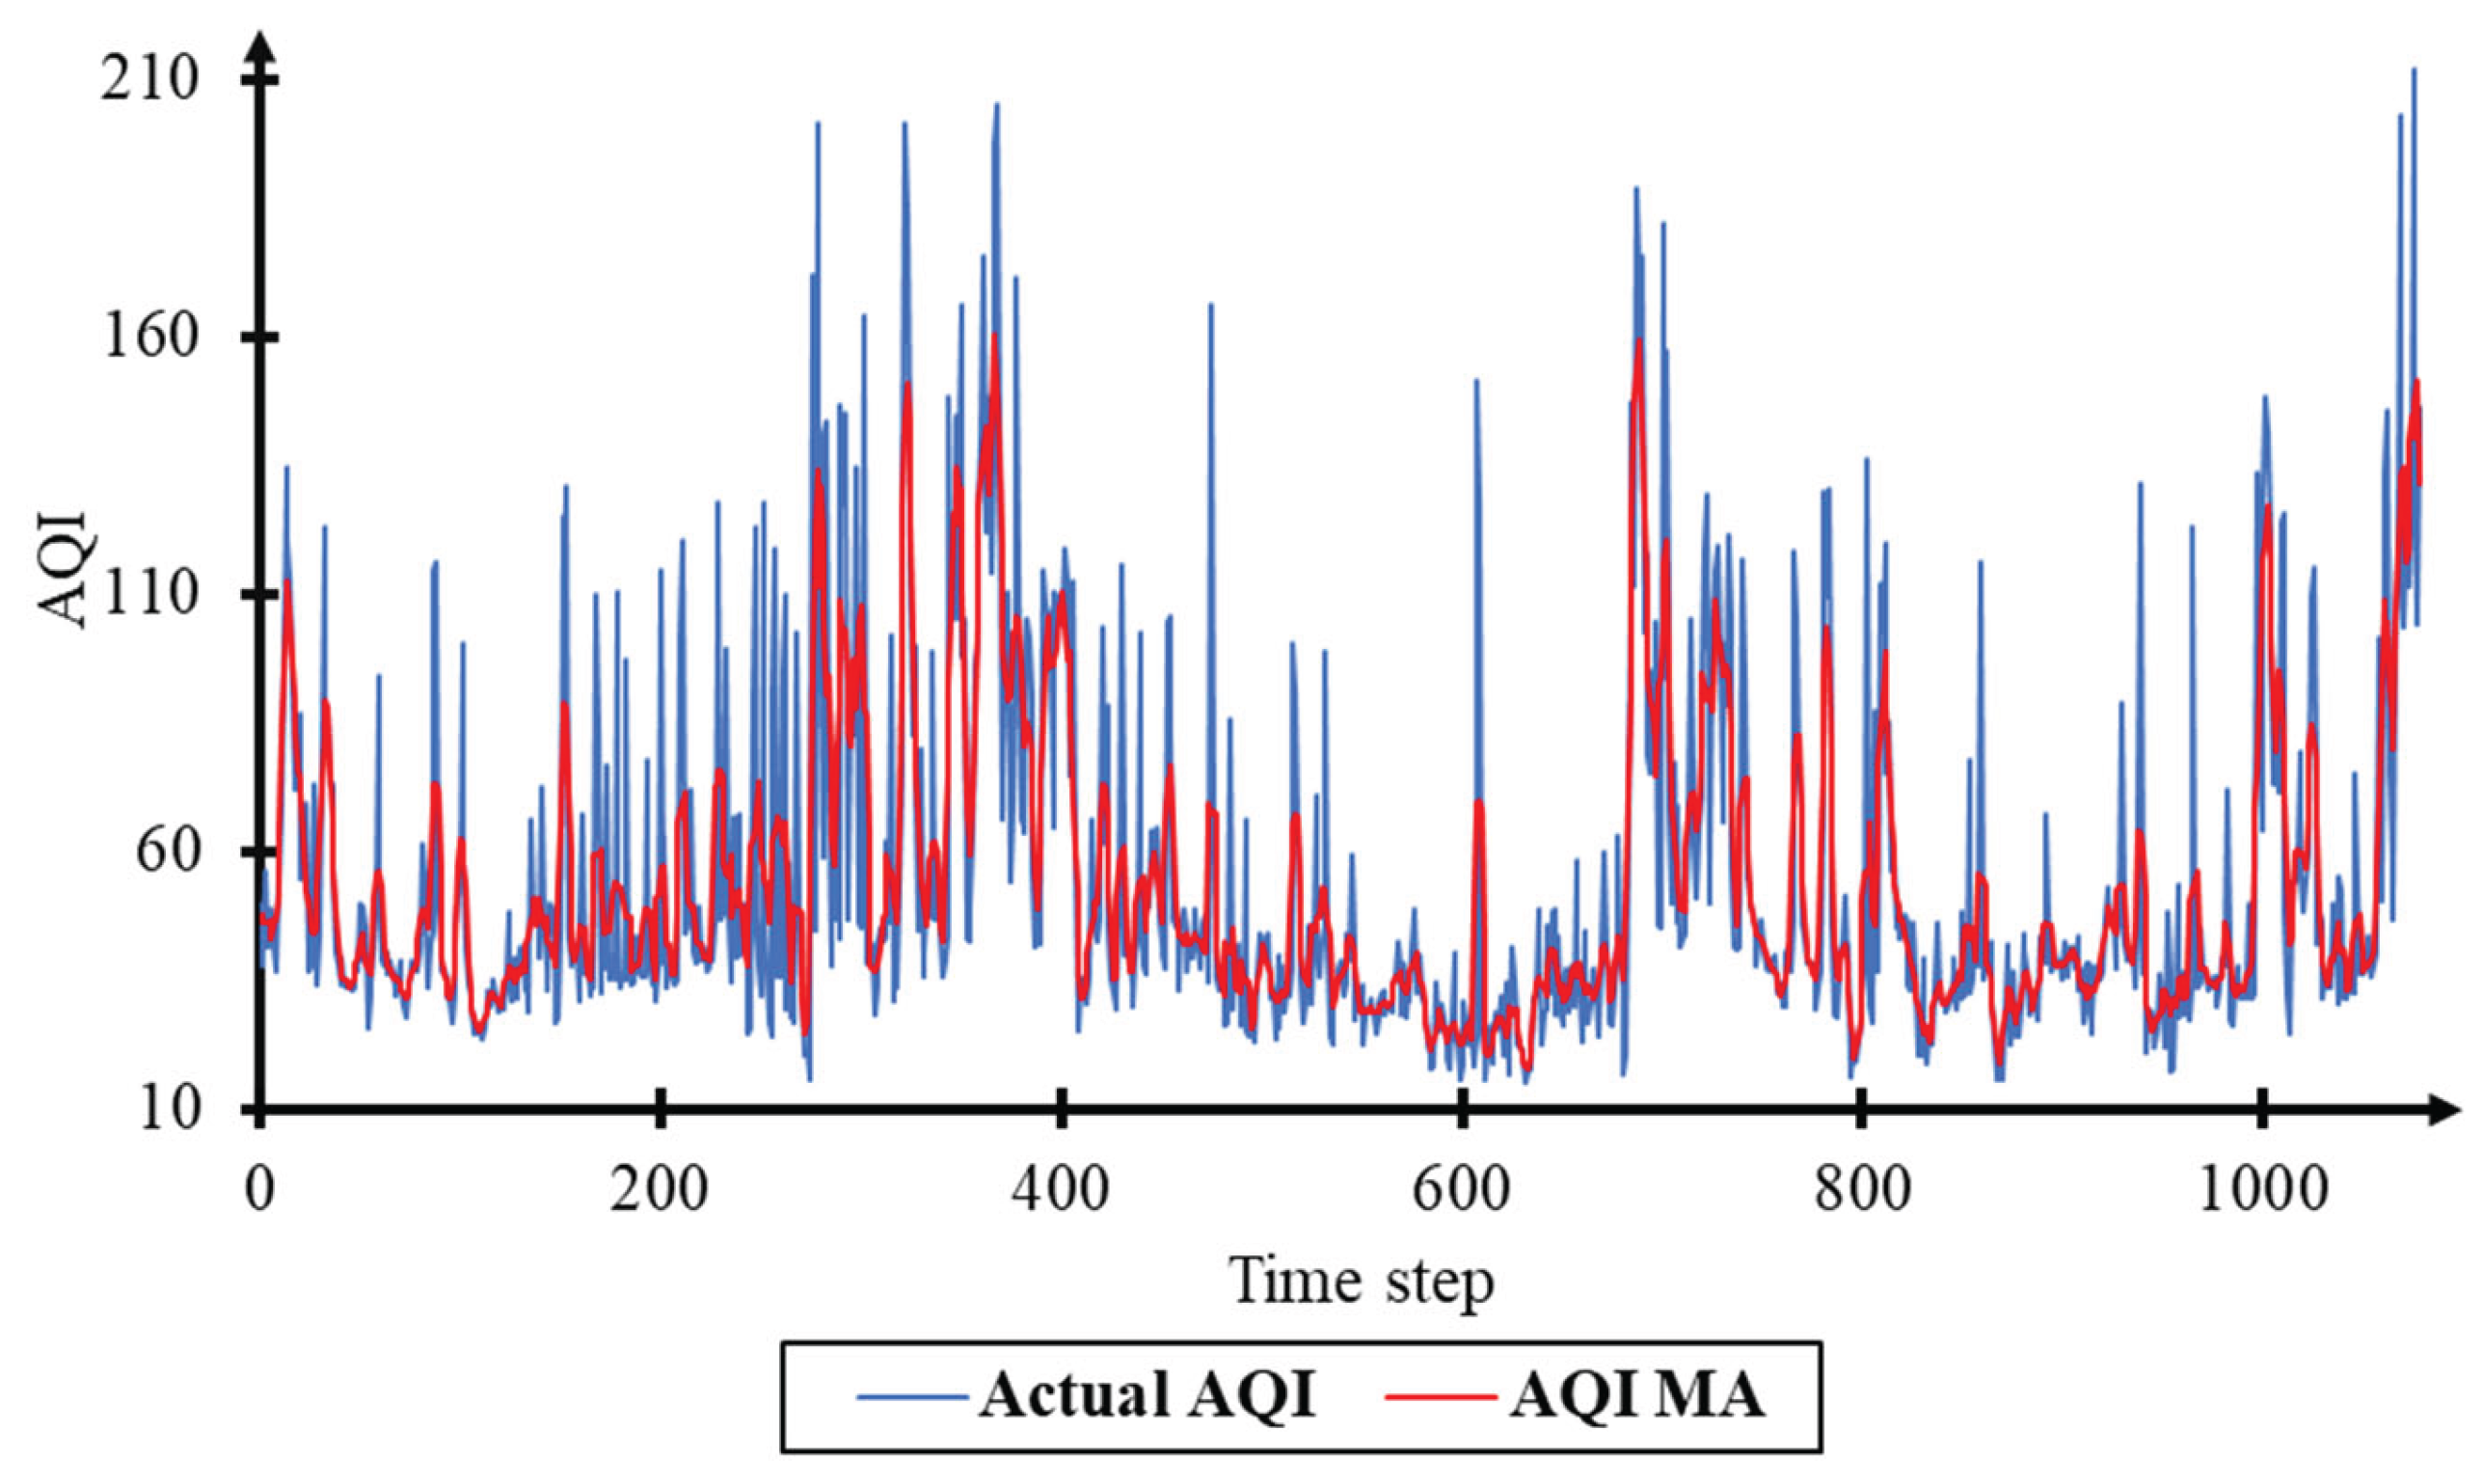
Figure 7.
Actual AQI and MA AQI for the KK1.
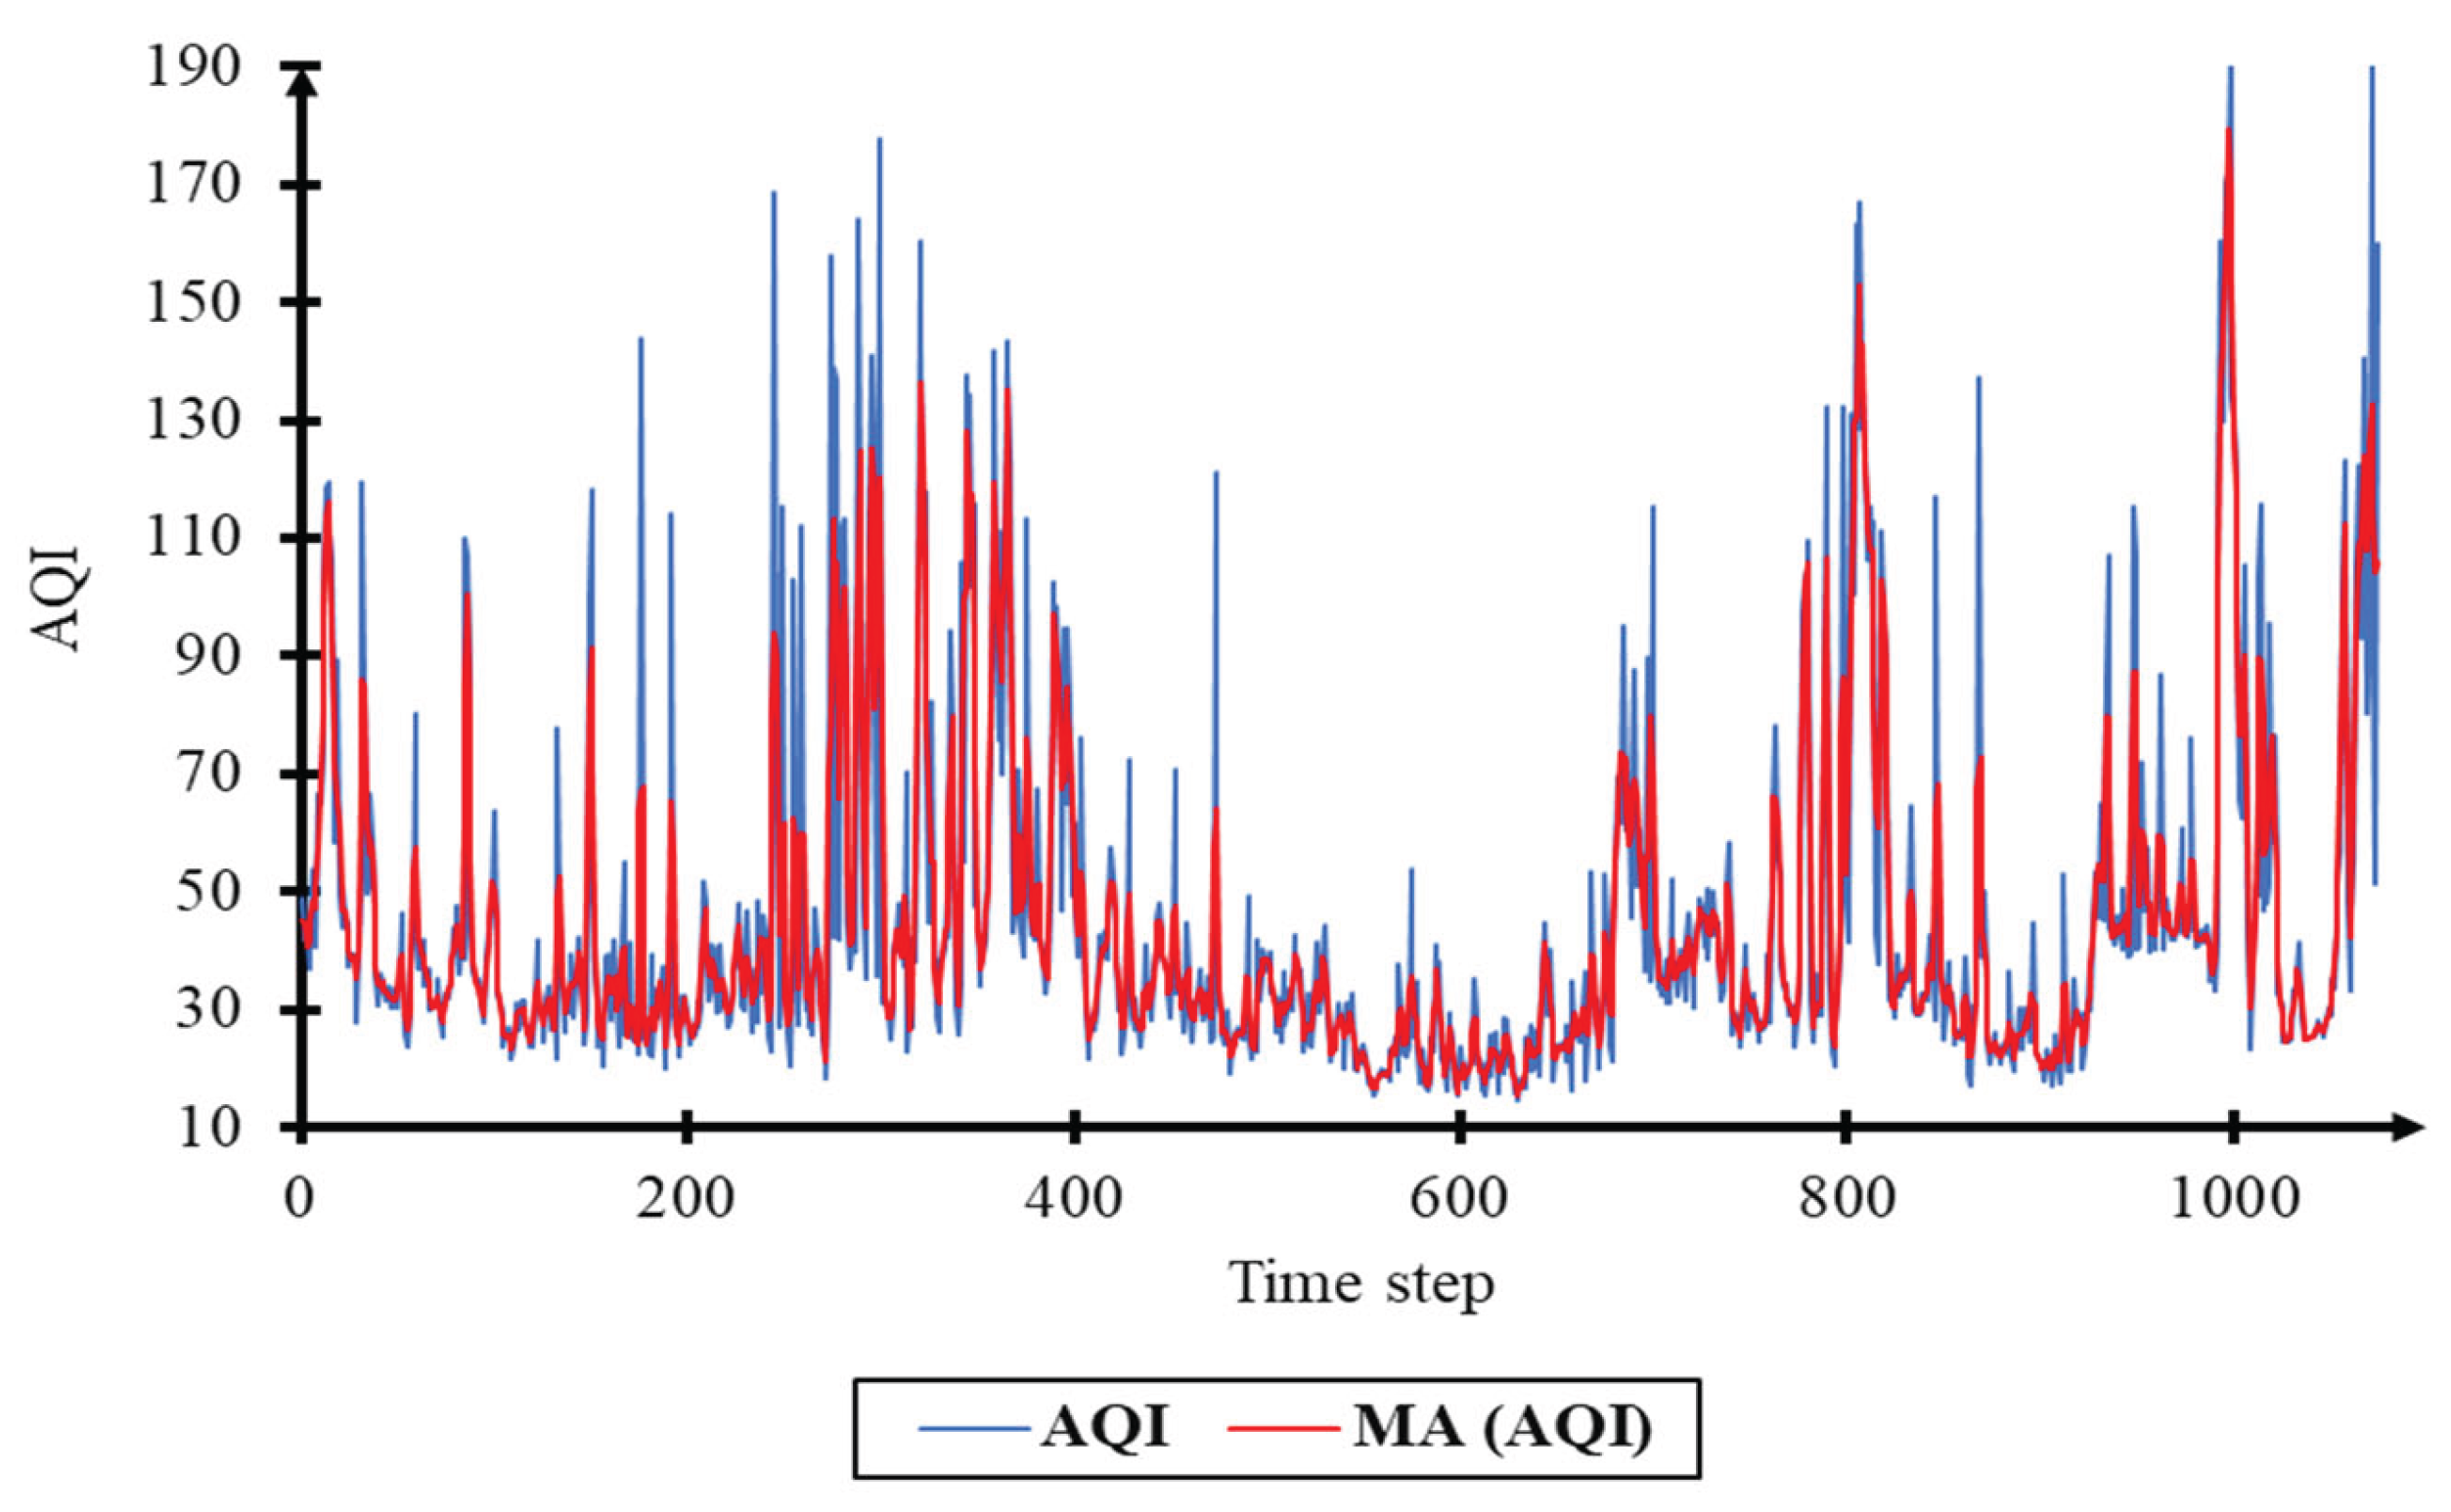
Figure 8.
Actual AQI and MA AQI for the KK3.
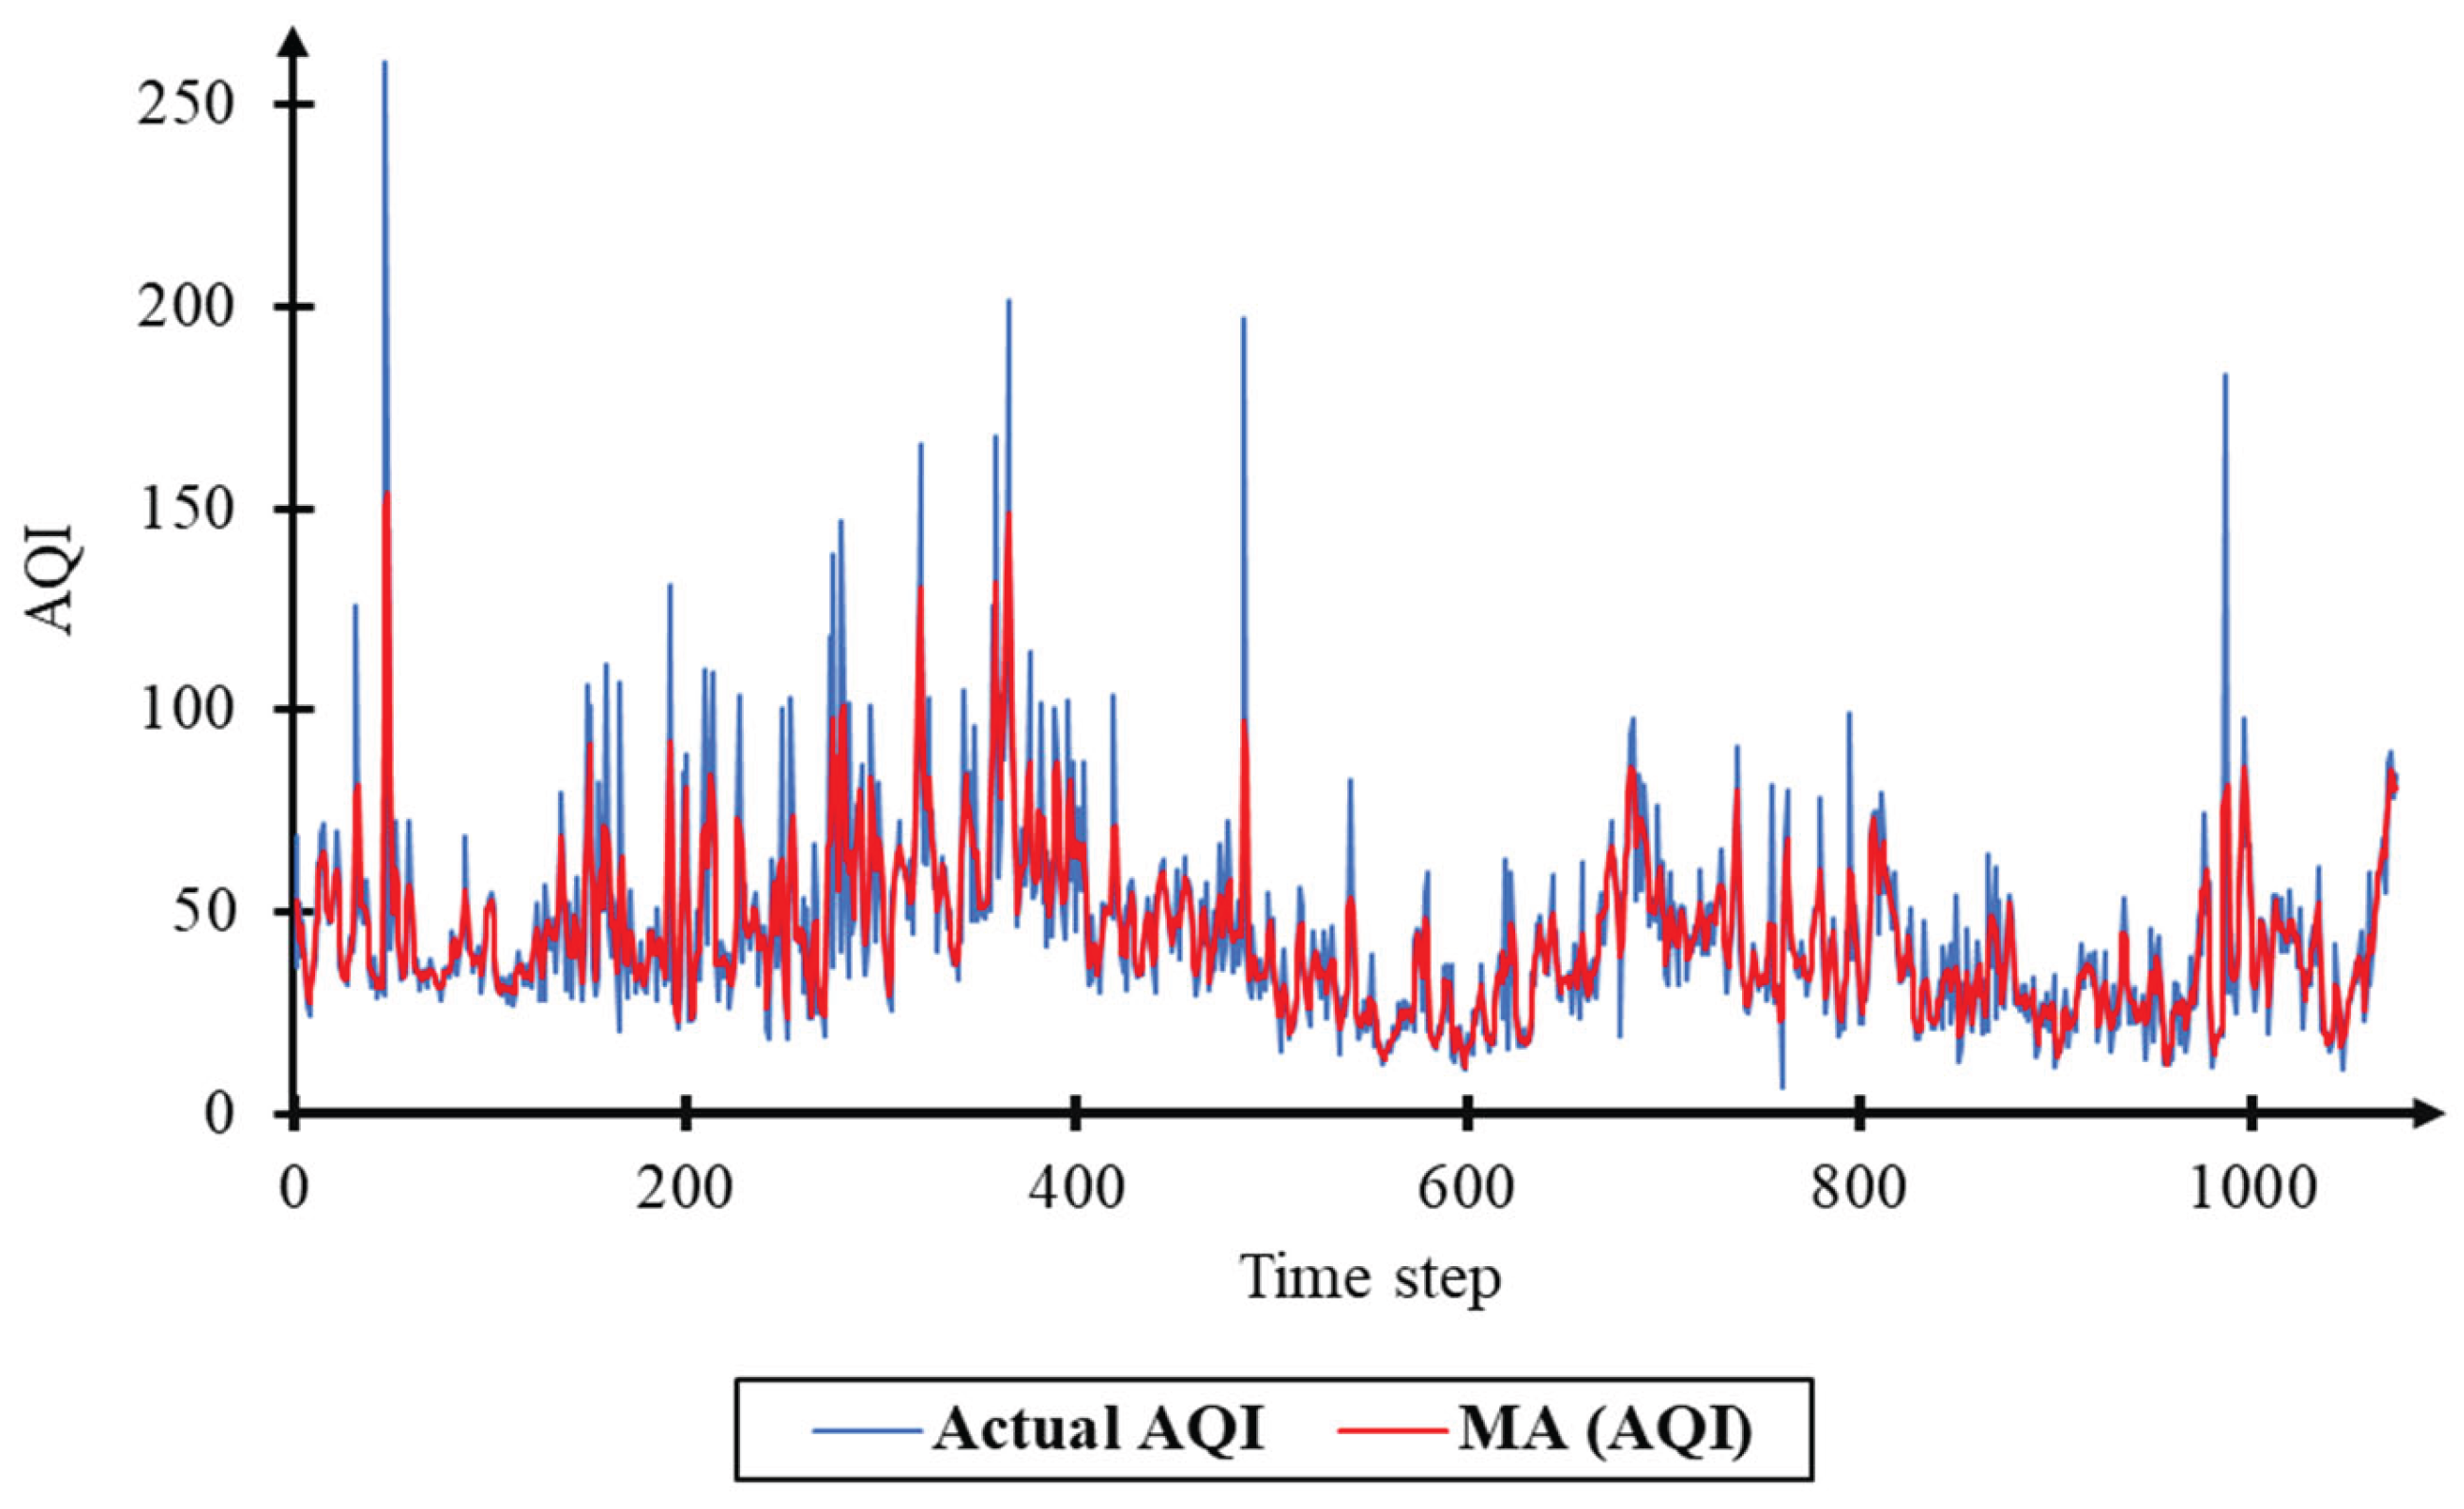
Table 1.
Some studies applied the LSTM models for air quality prediction.
| Study | Pollutants | Country | Period of data | Model used |
|---|---|---|---|---|
| 1. Chen Y., 2021 [10] | PM10 | China | 2015 - 2017 | LSTM |
| 2. Bakar M.A.A., 2022 [19] | PM10 | Malaysia | 7/2017 - 6/2019 | LSTM, ARIMA |
| 3. Ho C. H., 2022 [20] | PM2.5 | Korea | 2015 - 2021 | CMAQ-LSTM |
| 4. Xu S., 2022 [21] | PM2.5, SO2, NO2, CO, O3, PM10 | China | 2016 - 2020 | LSTM, CNN-LSTM, CEEMDAN-CNN-LSTM, |
| 5. Spyrou E.D., 2022 [22] | CO | Greece | - | LSTM, ARIMA |
| 6. Tsokov S., 2022 [23] | PM2.5 | China | 3/2013 - 02/2017 | LSTM, CNN, CNN-LSTN |
| 7. Duan J., 2023 [24] | AQI | China | 01/2015 - 3/2022 | LSTM, ARIMA-CNN-LSTM, CEEMDAN-CNN-LSTM, CEEMDAN-LSTM |
| 8. Li X., 2017 [1] | PM2.5 | China | 01/2014 - 5/2016 | LSTME |
| 9. Seng D., 2021 [12] | PM2.5, SO2, NO2, CO, O3 | China | 01/2016 - 12/2017 | LSTM, MMSL |
| 10. Drewil G.I., 2022 [25] | PM2.5, PM10, CO, NOx | India | 2017 - 2020 | LSTM, GA-LSTM |
| 11. Chen H., 2021 [26] | PM2.5, PM10, NO2, CO, O3 and SO2 | China | 2013 - 2018 | LSTM, Seq2Seq technology, XGBoosting tree |
| 12. Raheja S., 2022 [27] | PM2.5, PM10, CO, O3, NO2, SO2 | India | 2019 | LSTM, A-LSTM |
| 13. Li T., 2020 [28] | PM2.5 | China | 01/2015-12/2027 | CNN-LSTM |
| 14. Pak U., 2018 [29] | O3 | China | - | CNN-LSTM |
| 15. Qi Y., 2019 [30] | PM2.5 | China | 01/2015-04/2016 | GC-LSTM |
| 16. Fan S., 2021 [31] | SO2, NO2, CO, O3, PM10, PM2.5, AQI | China | 05/2018-08/2010 | LSTM, ARMA, CEEMDAN-LSTM, WD-LSTM |
Table 2.
Location of air quality monitoring stations in BR-VT province.
| Station name | Coordinates | |
|---|---|---|
| 1. Intersection of Gieng Nuoc (KK1) | 10°22'04.7"N | 107°05'03.6"E |
| 2. Intersection of Phan Dang Luu Street - 27/4 Street (KK2) | 10°30'08.7"N | 107°10'09.7"E |
| 3. Toc Tien Primary School (KK3) | 10°35'23.1"N | 107°07'54.2"E |
Table 4.
Checking data stationarity at monitoring stations.
| No. | Station | T observe | T statistics | P-Value | Comments |
|---|---|---|---|---|---|
| 1 | KK1 | -5.40 | -0.91 | < 0.0001 | Stationary |
| 2 | KK2 | -5.62 | -0.91 | < 0.0001 | Stationary |
| 3 | KK3 | -5.45 | -0.91 | < 0.0001 | Stationary |
Table 5.
Statistics of white test values.
| Statistical values | DF | Value | p-value |
|---|---|---|---|
| KK1 | |||
| Jarque-Bera | 2 | 1683.8 | < 0.0001 |
| Box-Pierce | 6 | 1427.1 | < 0.0001 |
| Ljung-Box | 6 | 1433.3 | < 0.0001 |
| McLeod-Li | 6 | 1079.0 | < 0.0001 |
| Box-Pierce | 12 | 1825.5 | < 0.0001 |
| Ljung-Box | 12 | 1835.8 | < 0.0001 |
| McLeod-Li | 12 | 1261.5 | < 0.0001 |
| KK2 | |||
| Jarque-Bera | 2 | 935.1 | < 0.0001 |
| Box-Pierce | 6 | 1298.0 | < 0.0001 |
| Ljung-Box | 6 | 1303.6 | < 0.0001 |
| McLeod-Li | 6 | 963.0 | < 0.0001 |
| Box-Pierce | 12 | 1715.7 | < 0.0001 |
| Ljung-Box | 12 | 1725.7 | < 0.0001 |
| McLeod-Li | 12 | 1214.1 | < 0.0001 |
| KK3 | |||
| Jarque-Bera | 2 | 9014.8 | < 0.0001 |
| Box-Pierce | 6 | 703.6 | < 0.0001 |
| Ljung-Box | 6 | 706.6 | < 0.0001 |
| McLeod-Li | 6 | 223.6 | < 0.0001 |
| Box-Pierce | 12 | 1098.5 | < 0.0001 |
| Ljung-Box | 12 | 1105.7 | < 0.0001 |
| McLeod-Li | 12 | 302.0 | < 0.0001 |
Table 6.
MA model for monitoring locations.
| No. | Station | q | RMSE | MAPE | R2 | Evaluation |
|---|---|---|---|---|---|---|
| 1 | KK1 | 1 | 419.0 | 15.0 | 0.8 | Perfect model |
| 2 | KK2 | 1 | 622.0 | 22.8 | 0.7 | Good model |
| 3 | KK3 | 1 | 413.8 | 17.2 | 0.7 | Good model |
Table 7.
VN_AQI forecasting performance of the LSTM-MA model.
| Station | k | RMSE | MAPE (%) |
|---|---|---|---|
| k = 7 | 0.256 | 31.0 | |
| KK1 | k = 15 | 0.376 | 66.6 |
| k = 30 | 0.378 | 84.4 | |
| k = 7 | 0.271 | 30.0 | |
| KK2 | k = 15 | 0.497 | 64.0 |
| k = 30 | 0.458 | 74.1 | |
| k = 7 | 0.157 | 30.0 | |
| KK3 | k = 15 | 0.225 | 46.3 |
| k = 30 | 0.186 | 61.9 |
Table 8.
Comparison of the forecasting performance of LSTM-MA, LSTM, and ARIMA models.
| Station | Models | RMSE | MAPE (%) |
|---|---|---|---|
| LSTM-MA | 0.256 | 31.0 | |
| KK1 | LSTM | 0.3611 | 33.2 |
| ARIMA | 0.1216 | 48.68 | |
| LSTM-MA | 0.271 | 30.0 | |
| KK2 | LSTM | 0.3178 | 33.4 |
| ARIMA | 0.1337 | 80.55 | |
| LSTM-MA | 0.0950 | 30.0 | |
| KK3 | LSTM | 0.0997 | 30.92 |
| ARIMA | 0.0808 | 40.4 |
Disclaimer/Publisher’s Note: The statements, opinions and data contained in all publications are solely those of the individual author(s) and contributor(s) and not of MDPI and/or the editor(s). MDPI and/or the editor(s) disclaim responsibility for any injury to people or property resulting from any ideas, methods, instructions or products referred to in the content. |
© 2025 by the authors. Licensee MDPI, Basel, Switzerland. This article is an open access article distributed under the terms and conditions of the Creative Commons Attribution (CC BY) license (http://creativecommons.org/licenses/by/4.0/).
Copyright: This open access article is published under a Creative Commons CC BY 4.0 license, which permit the free download, distribution, and reuse, provided that the author and preprint are cited in any reuse.


