
Submitted:
28 October 2025
Posted:
29 October 2025
You are already at the latest version
Abstract
This study investigates two genetically engineered Saccharomyces cerevisiae F118 strains, ΔCYB2::LpDLDH and ΔPDC1::LpDLDH, for D-LA (D-LA) production under high-glucose and inhibitor-stress conditions that mimic lignocellulosic hydrolysates. At 150 g/L glucose, ΔCYB2::LpDLDH produced 60 g/L D-LA, whereas ΔPDC1::LpDLDH yielded 80 g/L, corresponding to 40% and 53% of the theoretical yield, respectively. Calcium carbonate (CaCO3) supplementation enhanced glucose consumption and strengthened flocculation in ΔPDC1::LpDLDH. The addition of 5% inhibitory chemical compounds (ICCs) redirected carbon flux in ΔCYB2::LpDLDH toward D-LA formation and reduced ethanol byproduct accumulation. Transcriptomic analysis revealed upregulation of stress-response genes (HOG1, TPS1) and cell wall remodeling genes (CRH1, SCW10) under high-glucose stress. The strongly flocculent F118ΔCYB2::LpDLDH strain exhibited greater tolerance to weak acids and furfural than the weakly flocculent F118ΔPDC1::LpDLDH strain, likely due to physical shielding and cooperative detoxification within flocs. Metabolomic profiling indicated that under inhibitor stress, carbon flux was diverted from the TCA cycle toward lactate synthesis to maintain redox balance. These findings highlight the multifaceted benefits of flocculation in enhancing strain robustness and D-LA productivity under harsh fermentation environments, providing insights for developing resilient yeast platforms for lignocellulosic bioprocessing.
Keywords:
D-lactic acid
; Saccharomyces cerevisiae
; flocculant yeast
; synthetic lignocellulosic hydrolysate medium
; inhibitory chemical compounds
; inhibitor stress
; metabolomics
1. Introduction
The budding yeast Saccharomyces cerevisiae is one of the most well-established microbial hosts in biotechnology. Its natural ability to thrive in high-sugar and high-ethanol environments, combined with its Generally Recognized as Safe (GRAS) status and ease of genetic manipulation, has made it a central platform to produce bioethanol and various value-added chemicals [1]. Despite its robustness, S. cerevisiae encounters multiple challenges during industrial fermentations, including high osmolarity, ethanol accumulation, low pH, and exposure to toxic compounds, all of which constrain productivity and yield. Therefore, developing yeast strains that withstand such stresses is essential for achieving cost-efficient bioprocessing [2].
Lignocellulosic biomass represents a sustainable feedstock for biorefineries, but its pretreatment generates inhibitory chemical compounds (ICCs) that hinder microbial growth and metabolism. These inhibitors include furan aldehydes (furfural and 5-hydroxymethylfurfural), phenolic derivatives (syringaldehyde and vanillin), and weak organic acids (acetic and formic acids) [3]. Such compounds impair S. cerevisiae growth, ethanol production, and cellular integrity, and collectively disrupt fermentation performance [4,5,6]. When combined with high sugar concentrations and ethanol toxicity, these ICCs create complex multistress environments that decrease overall fermentation robustness.
Yeast flocculation—the reversible aggregation of cells into multicellular clusters—is mediated by cell-wall glycoproteins encoded by the flocculin (FLO) gene family. This phenotype is common among wild and industrial S. cerevisiae isolates, although its intensity varies with genotype and environmental conditions [7]. Flocculation has been associated with improved tolerance to environmental stresses. For instance, deletion of FLO1 reduced acetic acid tolerance in the industrial strain SPSC01 [8], whereas strong flocculation increased survival under furfural stress [9]. These protective effects are attributed to the formation of microenvironments within flocs, where outer cells absorb or detoxify inhibitors, thereby shielding inner cells and enhancing collective survival [10]. Moreover, flocculation facilitates cell sedimentation and biomass reuse, offering operational advantages in repeated-batch and continuous fermentations [11]. Consequently, flocculation serves both as an evolutionary survival mechanism and as a valuable industrial trait.
Lactic acid is an important platform chemical with applications in food, pharmaceuticals, and biodegradable polymers such as poly(lactic acid) (PLA) [12]. While lactic acid bacteria remain the primary producers, yeast offers advantages, including higher acid tolerance and immunity to phage contamination. By heterologously expressing lactate dehydrogenase (Ldh), S. cerevisiae can redirect pyruvate flux from ethanol toward D-lactic acid (D-LA). Targeted genomic integration at loci such as PDC1 or CYB2 enables metabolic rerouting, although ethanol formation often remains significant under glucose-rich conditions [13].
The wild-type S. cerevisiae F118 strain has previously demonstrated robustness against lignocellulosic inhibitors [10], making it a suitable host for lactic acid production. In this study, we engineered F118 to express a D-lactate dehydrogenase (LpDLDH) gene at either the CYB2 or PDC1 locus, generating two D-LA-producing strains with distinct flocculation behaviors—one strongly flocculant and the other weakly flocculant. Despite limited genomic modification, both retained ethanol-forming capacity under glucose-rich conditions. We evaluated their performance under stresses relevant to lignocellulosic fermentations, including osmotic stress (10–15% glucose), weak acids, furfural, and low pH, with minimal calcium carbonate neutralization to mimic cost-effective industrial operation.
This study examines how flocculation enhances the robustness of D-LA–producing yeast under stress. Comparing two engineered S. cerevisiae strains with distinct flocculation behaviors reveals that strong flocculation improves tolerance, reduces neutralization needs, and supports biomass recycling for efficient, sustainable lignocellulosic biorefineries. The results offer both fundamental insights into yeast physiology and practical strategies for strain development.
2. Materials and Methods
2.1. Strains and Medium
The wild-type strain used for fermentation in this study was Saccharomyces cerevisiae F118 (NBRC268), a flocculant strain obtained from the National Biological Resource Center (NBRC) culture collection in Tokyo, Japan. The primary strains, F118∆CYB2::LpDLDH and F118∆PDC1::LpDLDH, are derived from S. cerevisiae F118 and were developed in our previous study [13]. Yeast extract peptone dextrose medium (YPD), containing 100 g/L glucose, 10 g/L yeast extract, and 20 g/L peptone, was used to cultivate the yeast. Solid media for S. cerevisiae included 15 g/L agar added to the liquid medium. The medium was treated with the antibiotic geneticin/G418 (Cat. No. ant-gn-1, InvivoGen, San Diego, CA, USA).
2.2. Fermentation
Fermentation was carried out in a 100 mL Erlenmeyer flask containing 12 mL of YPD100 medium (100 g/L glucose) inoculated with a single colony of the yeast strain grown on YPD agar. To prepare the seed culture, cultures were incubated for one to two days at 30 °C with shaking at 150 rpm. Depending on the experiment, the seed was inoculated with 12 mL of YPD containing 50, 100, 150, or 300 g/L of glucose to initiate the primary culture. The effect of an inhibitory chemical compound (ICC) was examined by adding 5% of five chemicals: 15 mM Acetic acid, 10 mM Formic acid, 15 mM Furfural, 1.25 mM Levulinic acid, and 2.5 mM Hydroxymethylfurfural (HMF). One normal sodium hydroxide solution was used as a neutralizer at the start of cultivation until the media pH reached 5-6. The cultures were then grown at 30 °C with shaking at 90 rpm until glucose in the medium was depleted. After harvesting cells from the seed culture, the initial cell concentration was approximately 0.4 g/L of dry cell weight. Studies on calcium carbonate addition were conducted at the start of the primary culture. Each experiment included three biological replicates.
2.3. Measurements of Fermentation Products
Periodically, fermentation samples were collected and centrifuged for 5 min at 4 °C and 14,000x g. After collection, the supernatants were filtered into HPLC vials using a 0.45 µm polytetrafluoroethylene (PTFE) filter (Merck Millipore, Carrigtwohill, Ireland). Fermentation products were analyzed by high-performance liquid chromatography (HPLC) with a refractive index detector (RID-10A, Shimadzu, Kyoto, Japan), which measured various fermentation-related substances, including glucose, D-LA, glycerol, acetic acid, and ethanol. A 5 mM sulfuric acid solution in ultra-pure water served as the eluent in a Coregel-87H column (7.8 mm ID x 300 mm, Transgenomic Inc., New Haven, CT, USA) operated at 80 °C for 40 min at a flow rate of 0.6 mL/min.
2.4. Measurement of Cell Growth
The optical density could not be used to evaluate the flocculent F118 strains. Therefore, dry cell weight was used to measure yeast growth. Following batch fermentation, each sample’s culture was harvested by centrifuging at 14,000 × g for 5 min at 4 °C. The cell pellets were then washed twice with sterile water. After that, the pellets were freeze-dried overnight at -80 °C. The dry cell weight was then measured.
2.5. Cell Morphological Observation
A BIOREVO BZ-9000 digital microscope (Keyence, Osaka, Japan) was used to observe the morphological changes in the cells caused by glucose presence, calcium carbonate (CaCO3) supplementation, and an inhibitory chemical substance in the F118 strain. The objective lens was set at x100 magnification.
2.6. Gene Expression Analysis by Quantitative PCR
Since the cells show their highest metabolic activity during the mid-exponential phase of aerobic fermentation, yeast cells were harvested at this stage. This was achieved by centrifuging 0.5–1 mL of cell suspension at 8,000 x g for 10 min at 4 °C. Before RNA extraction, the pellets were stored at -80 °C after a single wash with cold, sterile water. As recommended by the manufacturer, the NucleoSpin RNA kit (Macherey-Nagel, Duren, Germany) was used for extraction, and rDNase treatment during column digestion minimized DNA contamination. The ReverTra Ace qPCR RT Master Mix with gDNA remover (Toyobo, Osaka, Japan) was used for reverse transcription, and the resulting cDNA served for quantitative PCR (qPCR). Using 10 ng/μL of diluted cDNA and 0.4 μM of each forward and reverse primer, the KOD SYBR qPCR Mix (Toyobo) was employed to measure gene expression levels. A Mx3005P system (Agilent Technologies Ltd., Tokyo, Japan) was used for qPCR. Before the amplification cycles—comprising an initial denaturation at 95 °C for 10 min, followed by 60 cycles of 30 sec at 95 °C, one min at 55 °C, and one min at 72 °C for elongation—the PCR program began with an initial denaturation at 95 °C for 10 min. The final phase involved one cycle of 1 min at 95 °C, followed by 30 sec at 55 °C, and then 30 sec at 95 °C.
Because of its similar Ct values and consistent expression across all samples, the ACT1 gene was used as an internal reference gene. Using calculations with the MxPro QPCR v4.10 (Agilent Technologies Japan, Ltd.), the expression levels of target genes were determined as fold changes with the formula 2-∆∆Ct, where ∆∆Ct = ∆Ct sample – ∆Ct control and ∆Ct sample = Ct sample – Ct ACT1. According to Supplementary Table S1, the primer sequences used in the analysis were designed with the NCBI Primer-BLAST tool (https://www.ncbi.nlm.nih.gov/tools/primer-blast/) with a target product size of approximately 100 bp.
2.7. Extraction of Internal Metabolites
The cells were harvested during each strain’s logarithmic phase, which varies in timing from their fermentation profile. All fermentation cultures were collected by centrifugation at 11,000 x g for 5 min to ensure consistency across experiments, as flocculating cells were difficult to sample. The cells were immediately frozen in liquid nitrogen to stop metabolic activity and then stored at -80 °C until extraction. Metabolites were extracted using 3 mL of preheated 75% ethanol, containing 10 µg/L of ribitol as an internal standard for GC/MS analysis and 20 µg/L (+)-10 camphorsulfonic acid for LC-MS analysis. After thorough vertexing, the mixture was heated to 95 °C for 3 min, then quickly cooled on ice. Cells were centrifuged at 14,000 x g for 3 min to remove cell debris. Subsequently, 500 µL of the supernatant was transferred to a new sterile tube. The lysate was evaporated overnight in a Labconco vacuum-drying machine and stored at -80 °C until ready for the next analysis.
2.8. GC/MS Analysis for Untargeted Metabolites
Untargeted metabolites were analyzed using gas chromatography-mass spectrometry (GC/MS). Derivatization, involving oximation and trimethylsilylation, was performed before GC/MS analysis. The first derivatization involved adding methoxiamine hydrochloride (100 µL of 20 mg/mL in pyridine) and incubating the freeze-dried lysate from the previous step at 30 °C for 90 min. For the second derivatization, MSTFA (N-methyl-N- (trimethylsilyl)trifluoroacetamide) was added at a volume of 50 µL. The mixture was incubated at 37 °C for 30 min before injection into the GC/MS [14]. The Shimadzu GC/MS QP20De20, paired with an AOC-20i autosampler (Kyoto, Japan), features an inert Cap 5 MS/NP column (0.25 mm × 30 m × 0.25 μm) from GL Science Inc. (Tokyo, Japan). A 1 µL sample was analyzed in split mode at an injection temperature of 230 °C. Helium served as the carrier gas at a flow rate of 1.12 mL/min and a linear velocity of 39 cm/s. The column temperature was initially set to 80 °C and maintained for 2 min, then increased at 15 °C/min to 330 °C, where it was held for 6 min. The ion source was maintained at 200 °C, and the transfer line at 250 °C. Electron ionization was set at 0.93 kV. Spectra were recorded at 10,000 scans per second over a mass-to-charge (m/z) range of 85–500. Retention index calibration used a standard mixture of terminal alkanes (C8–C40) to facilitate tentative compound identification. Raw GC/MS data were converted to .abf files with an Abf converter (Reifycs Inc., Tokyo, Japan) and analyzed using MSDIAL (Riken, Kanagawa, Japan). Detected peaks were identified and labeled by matching their retention times and mass spectrometry data against the RIKEN GL-Science database, a publicly available metabolite library.
2.9. LC/MS Analysis for Carbon Central Metabolites
The freeze-dried lysate was dissolved in 50 µL ultrapure water, then centrifuged at 10,000 x g for 20 min to remove the debris. The lysate was then transferred into vials for analysis of carbon central metabolites using liquid chromatography-tandem triple quadrupole mass spectrometry (LC/QqQ/MS). An Agilent 1260 high-performance liquid chromatography coupled with a 6460 Triple Quad MS (Santa Clara, USA) and the Mastro2 column (3 μm particle size, 150 mm × 2.1 mm) from Shimadzu were used. For the mobile phase, 10 mM tributylamine with 15 mM acetate as mobile phase A and methanol as mobile phase B were used. The mobile-phase flow rate was set at 0.2 mL/min, and the temperature was 37 °C. The analysis was performed using a gradient elution program for mobile phase B. The gradient started at 0% for 1 min, then increased at 10%/min to 15%, 7%/min to 50%, and 5%/min to 100%. The system was held at 100% for 1 min before being re-equilibrated by a rapid decrease to 0% in 30 sec. A 3 μL sample was injected. Instrument parameters were set to DL temperature at 250 °C, heat block at 40 °C, drying gas flow at 15 L/min, and nebulizer gas flow at 2 L/min [15]. Intracellular metabolites were detected in negative ion mode. Raw LC/QqQ/MS data were converted to .abf files using an Abf converter and analyzed with MRMPROBS (Riken, Kanagawa, Japan).
2.10. Multivariate Analysis
Multivariate analysis was performed using MetaboAnalyst 6.0 (https://www.metaboanalyst.ca) to conduct Principal Component Analysis (PCA) without data transformation. This method aimed to emphasize both differences and similarities within the dataset. The relative metabolite intensities were normalized with internal standards, ribitol for GC/MS and (+)-10 camphorsulfonic acid for LC/QqQ/MS, which served as explanatory variables. To minimize the masking effect caused by variability among metabolites, the data were automatically rescaled.
3. Results
3.1. D-LA Production at Different Glucose Levels
We initially assessed the potential of two genetically modified yeast strains, S. cerevisiae F118ΔCYB2::LpDLDH and F118ΔPDC1::LpDLDH, for D-LA (D-LA) production under high glucose levels (150 g/L and 300 g/L). As shown in Figure 1, at 150 g/L glucose, D-LA production reached 41 g/L for F118ΔCYB2::LpDLDH and 80 g/L for F118ΔPDC1::LpDLDH, corresponding to 40% and 53% of the theoretical yield, respectively. Conversely, at 300 g/L glucose, both strains exhibited poor substrate utilization, with F118ΔCYB2::LpDLDH consuming only about half of the available glucose, and F118ΔPDC1::LpDLDH consuming even less. These results suggest that very high glucose levels induce significant osmotic and metabolic stress, which limits glucose uptake and fermentation efficiency.
The PDC1-disrupted strain showed increased D-LA yield, likely due to decreased ethanol production and greater carbon flux into pyruvate breakdown. In contrast, the CYB2-disrupted strain produced less D-LA and more ethanol, but was more efficient at consuming glucose, suggesting a greater tolerance to osmotic stress. These results highlight a trade-off between product yield and physiological resilience, which is strongly influenced by the location of the LpDLDH expression cassette. To explore this further, both strains were tested across a broader range of glucose levels (50–150 g/L) to assess their tolerance to increasing osmotic stress [16].
At moderate glucose levels, the F118ΔCYB2::LpDLDH strain showed a significant increase in D-LA productivity (Figure 2a). The D-LA yield nearly doubled as glucose increased from 50 g/L to 150 g/L, demonstrating that this strain can tolerate osmotic stress up to 150 g/L without major growth inhibition. In contrast, the F118ΔPDC1::LpDLDH strain had lower efficiency, producing only 31.81 g/L D-LA with a 39% yield under 150 g/L glucose conditions (Figure 2b), which is much lower than the 80 g/L observed in the previous batch at the same sugar level. Therefore, subsequent gene expression studies focused on the more resilient F118ΔCYB2::LpDLDH strain.
To identify genes responding to high-glucose stress, quantitative PCR was performed during fermentation, focusing on pathways involved in lactate production, ethanol metabolism, and stress adaptation. The genes examined included those involved in lactate formation (LpDLDH), ethanol synthesis (PDC1), cell-wall remodelling (CRH1, SCW10, SCW11, DSE2), cell-wall integrity and resistance (SED1, HSP150, YGP1, TOS6), flocculation (FLO5), osmotic-stress regulation (HOG1, SSK1), stress protection (TPS1), and iron homeostasis (AFT1). As shown in Figure 3, the transcriptional profiles demonstrated significant upregulation of stress-related genes at higher glucose concentrations. The TPS1 gene, which controls trehalose synthesis and overall stress resistance, was activated under both 100 g/L and 150 g/L glucose conditions. At the same time, HOG1, a key kinase in the high-osmolarity glycerol (HOG) pathway, was upregulated only at 150 g/L. Similarly, cell-wall remodelling genes CRH1 and SCW10 increased at 150 g/L, indicating reinforcement of cell-wall strength under osmotic stress. These responses correlated with decreased culture turbidity at high-glucose levels (Figure 2a), suggesting reduced flocculation and cell aggregation.
In contrast, the F118ΔPDC1::LpDLDH strain, which has reduced flocculation due to the downregulation of FLO5 [13], showed no noticeable change in aggregation as glucose concentrations increased. This supports a mechanistic link between flocculation behavior and osmotic-stress tolerance. Measurements of dry-cell weight across the three glucose levels showed no significant differences (Supplementary Figure S1), indicating that the variations in D-LA production are mainly metabolic rather than growth-related. Although the study examined a limited set of genes, these results establish an initial connection between metabolic output and stress-response regulation under high-glucose conditions. The upregulation of HOG1, TPS1, and cell-wall genes suggests that osmotic stress triggers adaptive responses that may improve flocculation stability and D-LA productivity in the robust F118ΔCYB2::LpDLDH strain. Future research should expand these findings by conducting transcriptome-wide analyses, targeted overexpression of protective genes, and adaptive evolution experiments to further enhance osmotic tolerance and D-LA production. Combining these strategies with rational genetic design will be key to optimizing yeast cell factories for lignocellulosic bioprocesses [16].
3.2. Calcium Carbonate Supplementation Effect on D-LA Production
To reduce the growth inhibition observed in S. cerevisiae F118∆PDC1::LpDLDH, caused by LpDLDH disruption that limits ethanol production and cell growth [13], CaCO₃ was added at the start of fermentation as a neutralizer. In industrial D-LA production, adding excess CaCO₃ is a common method to prevent the pH from dropping too much during lactic acid buildup. During fermentation, CaCO₃ reacts with lactic acid to produce calcium lactate and carbonic acid, which then breaks down into water and carbon dioxide. This buffering reaction keeps the fermentation broth around pH 5.0, providing a more stable environment for yeast metabolism. CaCO₃ addition maintained a slightly higher final pH in both strains (Supplementary Figures S2 and S3).
As shown in Figure 4a, the fermentation performance of F118∆CYB2::LpDLDH was not significantly affected by CaCO₃ supplementation. Conversely, for F118∆PDC1::LpDLDH, the D-LA yield did not increase, but complete glucose consumption was achieved after about 48 hours of fermentation (Figure 4b). This suggests that CaCO₃ improved metabolic stability and glucose utilization, although it did not directly enhance D-LA productivity. Interestingly, in the F118∆PDC1::LpDLDH strain, where disrupting the pyruvate decarboxylase pathway limits ethanol production and cell growth, the presence of CaCO₃ significantly reduced growth inhibition and increased overall lactic acid accumulation. This indicates that CaCO₃ not only prevents medium acidification but also indirectly helps maintain intracellular pH balance. At the transcriptional level, adding CaCO₃ significantly elevated LpDLDH expression in F118∆CYB2::LpDLDH by 983-fold, while most other genes remained unchanged (Figure 5). Among the few upregulated genes were YGP1, FLO5, and LpDLDH, which are associated with cell wall integrity and flocculation. Under these conditions, increased cell aggregation and turbidity were clearly visible, demonstrating that CaCO₃ supplementation enhanced flocculation behavior not only in the naturally strong-flocculant F118∆CYB2::LpDLDH but also in the initially weak-flocculant F118∆PDC1::LpDLDH, as shown in Figure 4.
The relationship between CaCO₃ addition, cell wall stability, and flocculation aligns with previous findings in S. cerevisiae, where FLO1, FLO5, and FLO11 govern cell–cell adhesion and aggregation [17,18]. Specifically, FLO5 has been recognized as a key determinant of flocculation [19] and of cell wall assembly and organization [20], particularly in wine yeast strains.
Overall, while CaCO₃ supplementation did not increase D-LA yield, it promoted complete substrate utilization and enhanced cell flocculation, likely through the combined effects of pH stabilization, upregulation of FLO5 and YGP1, and improved cell wall integrity. These findings suggest that mild buffering can influence cell physiology, support strong aggregation, and sustain metabolic activity under acidic fermentation conditions.
3.3. Effect of Inhibitory Chemical Compounds on D-LA Production
To evaluate the effect of lignocellulosic-derived inhibitors on D-LA (D-LA) production, 5% of an inhibitory chemical compound mixture (ICCs) was added to the fermentation medium. This concentration was selected based on preliminary trials showing severe growth inhibition at 10–20% ICCs (data not shown). Furfural, the most toxic component among ICCs, is known to impair S. cerevisiae growth, metabolism, ethanol production, and cell morphology by inducing oxidative and membrane damage [4,6,21]. To mitigate medium acidification and enhance strain performance, sodium hydroxide was added at the start of fermentation to maintain the initial pH between 5.0 and 6.0. In previous studies, the parental F118 recombinant strain producing L-LA could tolerate up to 20% ICCs without pH control, although LA productivity declined markedly [22].
At ICCs below 5%, the engineered strain F118ΔCYB2::LpDLDH maintained a moderate fermentation profile (Figure 6a). Glucose was almost completely consumed within 48 h, and the D-LA titer increased from 20.42 g/L to 32.82 g/L compared with the control (without ICCs). In contrast, the F118ΔPDC1::LpDLDH strain showed markedly impaired glucose utilization, indicating strong growth inhibition by ICCs (Figure 6b). Supplementation with 3 g/L CaCO₃ substantially improved this strain’s performance, enabling full glucose consumption within 48 h and increasing the D-LA titer from 20.31 g/L to 42.36 g/L (Figure 6c). This enhancement demonstrates the buffering and detoxification effects of CaCO₃ under weak-acid and aldehyde stress. Microscopic images (Figure 6, bottom panels) depict cellular morphology and flocculation behavior after 72 h of fermentation. The ΔCYB2 strain exhibited strong cell aggregation and compact floc structures, whereas the ΔPDC1 strain showed mostly dispersed cells with reduced adhesion. CaCO₃ buffering enhanced cell integrity and aggregation, indicating a stabilizing effect against ICC-induced acid stress and supporting sustained D-LA production.
Carbon flux analysis revealed that F118ΔCYB2::LpDLDH redirected pyruvate toward D-LA rather than biomass or ethanol production (Figure 7a), as reflected by reduced biomass yield and ethanol formation. This metabolic shift, coupled with higher ICCs tolerance, suggests that F118ΔCYB2::LpDLDH can efficiently reallocate carbon resources under stress, while F118ΔPDC1::LpDLDH relies on external neutralization to sustain productivity. Despite its growth limitation, CaCO₃-supplemented F118ΔPDC1::LpDLDH achieved the highest D-LA titer among all tested conditions (Figure 7b).
To further elucidate transcriptional responses to ICCs, genes associated with carbon metabolism, stress adaptation, and energy regulation were analyzed by qPCR in cells cultured in YPD100 medium, with or without 5% ICCs. The target genes included those involved in glycolysis and ethanol metabolism (HXK1, PFK1, ENO1, ADH1, LpDLDH), lactic acid formation (LpDLDH), lactate transport (JEN1), stress and cell-wall remodeling (SLT2, RLM1, SCW11, HSP150, YGP1), and mitochondrial energy metabolism (NDI1). As illustrated in Figure 8, several genes were significantly upregulated in the presence of ICCs, including PFK1 and ENO1 (glycolysis), ADH1 (ethanol metabolism), LpDLDH (lactate production), and JEN1 (lactate export). Stress-related genes (SLT2, RLM1, YGP1, SCW11) also showed increased expression, indicating activation of the cell wall integrity (CWI) and general stress response pathways. Notably, NDI1 expression was markedly induced in F118ΔCYB2::LpDLDH, suggesting enhanced mitochondrial NADH oxidation and energy turnover, which may contribute to increased stress tolerance. In F118ΔPDC1::LpDLDH, strong LpDLDH induction under CaCO₃ supplementation indicated partial recovery of lactate flux, compensating for the loss of pyruvate decarboxylase activity and growth inhibition.
To further elucidate the molecular responses of engineered S. cerevisiae strains to inhibitory chemical compounds (ICCs), we examined transcriptional and metabolomic alterations during fermentation. Genes associated with glycolysis, ethanol metabolism, D-LA production, stress adaptation, and mitochondrial energy regulation were analyzed via quantitative PCR in cells cultivated in YPD100 medium, with or without 5% ICCs. The genes selected for analysis included HXK1, PFK1, ENO1, ADH1, and PDC1 (carbon metabolism); LpDLDH (D-LA production); JEN1 (lactate transport); SLT2, RLM1, SCW11, HSP150, and YGP1 (cell-wall integrity and stress response); and NDI1 (mitochondrial energy metabolism).
As depicted in Figure 8, several glycolytic genes (PFK1, ENO1) and ethanol-related genes (ADH1) were significantly upregulated under ICC exposure, indicating an enhanced flux through upper glycolysis and redox rebalancing. The strong induction of LpDLDH and JEN1 suggested that the lactate synthesis and export system remained active even under inhibitor stress, supporting continued D-LA accumulation. Stress-responsive genes (SLT2, RLM1, YGP1, SCW11) were also markedly upregulated, reflecting the activation of the cell wall integrity (CWI) and general stress response pathways.
Notably, NDI1 expression was strongly induced in F118ΔCYB2::LpDLDH, suggesting reinforcement of mitochondrial NADH oxidation to sustain ATP generation and mitigate redox imbalance. Conversely, F118ΔPDC1::LpDLDH exhibited enhanced LpDLDH expression, particularly under CaCO₃ supplementation, indicating a partial recovery of lactate flux that compensated for the loss of pyruvate decarboxylase activity and associated growth inhibition.
Given the tight coupling between transcriptional and metabolic networks, metabolomic profiling was performed to assess differential metabolite accumulation in response to ICC exposure. As shown in Figure 9 and Figure 10, F118ΔCYB2::LpDLDH exhibited a larger number of significantly altered metabolites, while F118ΔPDC1::LpDLDH displayed fewer but more specific changes, consistent with its lower metabolic turnover rate.
In F118ΔCYB2::LpDLDH, several amino acids (aspartic acid, histidine, serine, threonine, glycine) were significantly elevated, suggesting enhanced nitrogen assimilation and stress-driven amino acid turnover. Increased levels of adenine, nicotinamide, and tricarboxylic acid (TCA) cycle intermediates (citric, isocitric, and fumaric acids) indicate activation of nucleotide biosynthesis and reinforcement of oxidative metabolism to maintain redox balance. In contrast, decreases in glucose, mannose, ribose, and trehalose indicated glycolytic suppression and a diversion of carbon toward maintenance metabolism and osmolyte production—strategies commonly employed to withstand weak-acid and aldehyde stress.
In F118ΔPDC1::LpDLDH, the metabolomic profile showed accumulation of succinic acid and its anhydride derivative, pointing to a redirection of pyruvate metabolism through mitochondrial pyruvate carrier (MPC) as a gate transporter toward reductive branches of the TCA cycle. Simultaneous increases in citric and isocitric acids, coupled with declines in sugar alcohols (meso-erythritol, galactitol), suggest a shift from carbohydrate storage toward energy-generating intermediates. These results imply that in the absence of PDC1, the strain compensates for the blocked ethanol pathway by enhancing TCA cycle flux and maintaining NAD⁺/NADH homeostasis under ICC-induced oxidative stress.
An observed increase in sedoheptulose-7-phosphate (S7P) under +ICC conditions further supports the activation of the pentose phosphate pathway (PPP). This change indicates enhanced NADPH production, which is vital for detoxifying furfural and other aldehyde inhibitors through reductive conversion mechanisms [23]. By strengthening both the PPP and the TCA cycle, the cells maintain sufficient reducing equivalents (NADH/NADPH) to reduce oxidative stress and preserve metabolic function during inhibitory fermentation.
The transcriptional and metabolomic data elucidate a complex adaptive response to ICC stress. The upregulation of glycolytic and stress-protection genes, in conjunction with the activation of PPP- and TCA-associated redox balancing, illustrates a coordinated reprogramming of central metabolism. This integrative mechanism enables engineered S. cerevisiae strains to maintain D-LA production under conditions that mimic lignocellulosic hydrolysate by balancing energy generation, redox homeostasis, and stress defense pathways.
To evaluate how pH buffering by CaCO₃ influences metabolic flux during D-LA fermentation, intracellular metabolites in S. cerevisiae F118ΔPDC1::LpDLDH were quantified under cultures with (+CaCO₃) and without (−CaCO₃) supplementation (Figure 11). The metabolomic map revealed that CaCO₃ markedly modulated carbon flow through glycolysis, the pentose phosphate pathway (PPP), and the tricarboxylic acid (TCA) cycle.
CaCO₃ buffering increased the intracellular levels of key glycolytic intermediates, including glucose-6-phosphate, fructose-1,6-bisphosphate, and phosphoenolpyruvate, suggesting enhanced glycolytic throughput under stabilized pH conditions. The elevated levels of glucose-6-phosphate (G6P) and 6-phosphogluconate (6-PGL) in the PPP indicate activation of NADPH-producing reactions that support antioxidant defense and biosynthetic reduction potential. This effect is consistent with the neutralizing role of CaCO₃ in mitigating intracellular acidification, thereby relieving feedback inhibition on glycolytic enzymes and allowing continued ATP production.
Under conditions of +CaCO₃, a consistent increase in acetyl-CoA, citrate, and succinate was observed, indicating stimulation of the TCA cycle. The rise in oxaloacetate and malate further suggests that buffering maintains metabolic continuity between glycolysis and the TCA cycle through the pyruvate-to-acetyl-CoA node. These increases imply that CaCO₃ supplementation facilitates smoother energy generation and NADH reoxidation, counteracting the acid stress that otherwise restricts oxidative metabolism during unbuffered fermentation. In the absence of buffering (−CaCO₃), the accumulation of acidic end products, such as D-LA, lowers intracellular pH and limits enzyme activity in both glycolysis and the TCA cycle. The observed metabolite restoration under +CaCO₃ thus reflects improved redox homeostasis, as the buffering system prevents proton overload and promotes continuous NADH oxidation through the TCA cycle. This redox balancing effect aligns with the previously observed transcriptional upregulation of NDI1 and LpDLDH under buffered conditions, highlighting a synergistic link between pH control and metabolic adaptation. Collectively, these results demonstrate that CaCO₃ supplementation stabilizes intracellular pH, sustains glycolytic flux, enhances PPP-derived NADPH generation, and strengthens TCA-cycle activity. This integrated response maintains energy production and redox balance, thereby supporting robust D-LA fermentation even under high-acid conditions. The metabolic stabilization provided by CaCO₃ complements the genetic modifications in PDC1-deficient strains, enabling improved tolerance and productivity in lignocellulosic hydrolysate–based bioprocesses.
4. Discussion
The overall performance of the engineered S. cerevisiae strains under ICC stress conditions demonstrates multifaceted adaptation, including cell wall remodeling, redox regulation, and dynamic rerouting of central carbon metabolism. The integration of physiological, transcriptional, and metabolomic data offers a comprehensive understanding of how these processes collectively sustain D-LA productivity in inhibitory and acidic environments. At the cellular level, the pronounced flocculation phenotype observed in F118ΔCYB2::LpDLDH significantly enhances tolerance against ICC-derived inhibitors. Flocculated cell aggregates limit the diffusion of weak acids and aldehydes across the plasma membrane, thereby maintaining intracellular homeostasis and mitigating oxidative stress [8,9]. The upregulation of FLO5, YGP1, and SCW11 in response to ICC exposure supports activation of the cell wall integrity (CWI) pathway, leading to β-glucan and mannoprotein cross-linking that reinforces the outer cell wall. This structural adaptation minimizes osmotic and oxidative damage while fostering microenvironmental buffering and cooperative nutrient exchange among aggregated cells. These findings are consistent with recent studies in other yeast systems. Sae-Tang et al. [24] demonstrated that introducing ScFLO1 into Pichia pastoris significantly enhanced tolerance to lactic acid stress, resulting in a 1.6-fold increase in specific growth rate and a 2.6-fold increase in D-LA titer compared to non-flocculent controls. Transcriptomic analysis further revealed upregulation of lactate transporter and iron homeostasis genes, indicating that flocculation not only forms a physical barrier but also triggers adaptive transcriptional programs that facilitate metabolite export and redox balance. Similarly, Stewart et al. [25] highlighted that flocculation is not merely a sedimentation trait but a dynamic, stress-responsive process influenced by calcium-dependent lectin–mannose interactions and cell-surface charge regulation, which can enhance survival under acid, ethanol, or osmotic stress. These parallels support the notion that flocculation represents an evolutionarily conserved protective mechanism that can be rationally exploited to improve organic acid fermentation performance. At the metabolic level, ICC exposure induced extensive reprogramming of carbon flux. In F118ΔCYB2::LpDLDH, the depletion of hexose sugars coupled with the accumulation of tricarboxylic-acid (TCA) intermediates—citric, isocitric, and fumaric acids—indicates partial TCA-cycle inhibition and redirection of pyruvate toward D-LA formation. This metabolic shift facilitates cytosolic NADH reoxidation while reducing mitochondrial ROS generation, consistent with the observed induction of NDI1, which encodes the alternative NADH dehydrogenase. Concurrent activation of amino acid biosynthesis and the pentose phosphate pathway (PPP) provides NADPH for antioxidant defense and macromolecular repair, thereby representing a dual mechanism for maintaining redox and biosynthetic balance.
In contrast, the deletion of LpDLDH in F118ΔPDC1::LpDLDH eliminated the primary decarboxylation pathway from pyruvate to acetaldehyde, thereby redirecting carbon flux through the reductive branch of the TCA cycle. The significant accumulation of succinic and isocitric acids suggests compensatory NADH oxidation via this reductive pathway. This metabolic reconfiguration, coupled with robust LpDLDH expression, ensures continuous NAD⁺ regeneration and supports D-LA synthesis even under elevated inhibitor stress. However, the lack of intrinsic pH control rendered this strain more vulnerable to acidification, a limitation that was mitigated by CaCO₃ supplementation. CaCO₃ not only neutralized excess protons but also sequestered furfural and related aldehydes through carbonate adduct formation, thereby restoring both metabolic activity and D-LA yield.
These findings reveal an integrative tolerance mechanism wherein (i) flocculation establishes a protective physical barrier and localized buffering microenvironment, (ii) CaCO₃ supplementation maintains extracellular pH stability and chemically detoxifies inhibitory aldehydes, and (iii) metabolic rerouting through D-LA synthesis and PPP activation regenerates NADH/NADPH pools essential for redox homeostasis and antioxidant defense. The convergence of these processes enables S. cerevisiae F118 derivatives to sustain ATP generation, preserve intracellular redox balance, and protect macromolecular integrity during the fermentation of lignocellulosic hydrolysates. This coordinated stress-response network mirrors principles observed in P. pastoris [24] and native brewing yeasts [25], highlighting the universal value of flocculation-based tolerance strategies. Comparable physiological outcomes were also reported by [26], who achieved neutralizer-free lactic acid production in S. cerevisiae through adaptive evolution and multiplexed redox-pathway optimization, underscoring that efficient proton management and NADH recycling are central to acid tolerance.
Collectively, these insights suggest that future strain-engineering strategies should integrate flocculation control, exporter enhancement, metal-ion and redox regulation, and self-buffering capacity to minimize reliance on external neutralizers. Such a holistic design approach represents a forward-looking framework for constructing next-generation, self-neutralizing yeast biocatalysts capable of high-titer, high-tolerance D-LA production from lignocellulosic biomass under industrially relevant inhibitory conditions.
Supplementary Materials
The following supporting information can be downloaded at: Preprints.org. Figure S1: Dry cell weight of the strain; Figure S2: Final pH value of the fermentation from F118 ∆CYB2::LpDLDH; Figure S3: Final pH value of the fermentation from F118∆PDC1::LpDLDH; Table S1: List of primers used in qPCR procedures.
Author Contributions
Conceptualization, D.R. and P.K.; methodology, D.R., P.K., F.J.N.P.; validation, D.R., P.K. and C.O.; formal analysis, D.R., P.K., F.J.N.P.; investigation, D.R. and P.K.; resources, P.K. and C.O.; data curation, D.R., P.K. and F.J.N.P.; writing—original draft preparation, D.R. and P.K.; writing—review and editing, D.R., P.K., F.J.N.P. and C.O.; visualization, D.R. and P.K; supervision, P.K., and C.O.; project administration, P.K. and C.O.; funding acquisition, P.K. and C.O. All authors have read and agreed to the published version of the manuscript.
Funding
This work was supported by the Research and Development of Technologies to Promote Biomanufacturing (GX) Project of the New Energy and Industrial Technology Development Organization (NEDO), Japan (To P.K.). This study was also partially supported by the Science and Technology Research Partnership for Sustainable Development (SATREPS) program of the Japan Science and Technology Agency (JST) and the Japan International Cooperation Agency (JICA), Japan (To C.O.).
Institutional Review Board Statement
Not applicable.
Informed Consent Statement
Not applicable.
Data Availability Statement
The original contributions presented in the study are included in the article/supplementary material; further inquiries can be directed to the corresponding authors.
Conflicts of Interest
The authors declare no conflicts of interest.
Abbreviations
The following abbreviations are used in this manuscript:
| LA | Lactic acid |
| D-LDH | D-lactate dehydrogenase |
| Lp | Leuconostoc pseumesenteroides |
| CYB2 | Cytochrome b2 |
| PDC1 | Pyruvate decarboxylase 1 |
| ICC | Inhibitory Chemical Compounds |
| NADH | Nicotinamide Adenine Dinucleotide |
| NADPH | Nicotinamide Adenine Dinucleotide Phosphate |
| GAP | Glyceraldehyde 3-phosphate |
| DHAP | Dihydroxyacetone phosphate |
| G3P | Glycerol 3-phosphate |
| Ct | Threshold cycle |
| Log2 FC | Log fold change |
| GC/MS | Gas Chromatography-Mass Spectrometry |
| LC/MS | Liquid Chromatography/Mass Spectrometry |
References
- Kavšček, M.; Stražar, M.; Curk, T.; Natter, K.; Petrovič, U. Yeast as a Cell Factory: Current State and Perspectives. Microb Cell Fact 2015, 14, 94. [Google Scholar] [CrossRef]
- Walker, G.M.; Basso, T.O. Mitigating Stress in Industrial Yeasts. Fungal Biology 2020, 124, 387–397. [Google Scholar] [CrossRef] [PubMed]
- Baig, K.S.; Wu, J.; Turcotte, G. Future Prospects of Delignification Pretreatments for the Lignocellulosic Materials to Produce Second Generation Bioethanol. Int J Energy Res 2019, 43, 1411–1427. [Google Scholar] [CrossRef]
- Allen, S.A.; Clark, W.; McCaffery, J.M.; Cai, Z.; Lanctot, A.; Slininger, P.J.; Liu, Z.L.; Gorsich, S.W. Furfural Induces Reactive Oxygen Species Accumulation and Cellular Damage in Saccharomyces Cerevisiae. Biotechnol Biofuels 2010, 3, 2. [Google Scholar] [CrossRef]
- Deparis, Q.; Claes, A.; Foulquié-Moreno, M.R.; Thevelein, J.M. Engineering Tolerance to Industrially Relevant Stress Factors in Yeast Cell Factories. FEMS Yeast Research 2017, 17. [Google Scholar] [CrossRef]
- He, M.; Wu, B.; Shui, Z.; Hu, Q.; Wang, W.; Tan, F.; Tang, X.; Zhu, Q.; Pan, K.; Li, Q.; et al. Transcriptome Profiling of Zymomonas Mobilis under Furfural Stress. Appl Microbiol Biotechnol 2012, 95, 189–199. [Google Scholar] [CrossRef] [PubMed]
- Soares, E.V. Flocculation in Saccharomyces Cerevisiae: A Review: Yeast Flocculation: A Review. Journal of Applied Microbiology 2011, 110, 1–18. [Google Scholar] [CrossRef]
- Ye, P.-L.; Wang, X.-Q.; Yuan, B.; Liu, C.-G.; Zhao, X.-Q. Manipulating Cell Flocculation-Associated Protein Kinases in Saccharomyces Cerevisiae Enables Improved Stress Tolerance and Efficient Cellulosic Ethanol Production. Bioresource Technology 2022, 348, 126758. [Google Scholar] [CrossRef] [PubMed]
- Westman, J.O.; Mapelli, V.; Taherzadeh, M.J.; Franzén, C.J. Flocculation Causes Inhibitor Tolerance in Saccharomyces Cerevisiae for Second-Generation Bioethanol Production. Appl Environ Microbiol 2014, 80, 6908–6918. [Google Scholar] [CrossRef]
- Kahar, P.; Itomi, A.; Tsuboi, H.; Ishizaki, M.; Yasuda, M.; Kihira, C.; Otsuka, H.; Azmi, N.B.; Matsumoto, H.; Ogino, C.; et al. The Flocculant Saccharomyces Cerevisiae Strain Gains Robustness via Alteration of the Cell Wall Hydrophobicity. Metabolic Engineering 2022, 72, 82–96. [Google Scholar] [CrossRef]
- Wijaya, H.; Sasaki, K.; Kahar, P.; Yopi; Kawaguchi, H.; Sazuka, T.; Ogino, C.; Prasetya, B.; Kondo, A. Repeated Ethanol Fermentation from Membrane-Concentrated Sweet Sorghum Juice Using the Flocculating Yeast Saccharomyces Cerevisiae F118 Strain. Bioresource Technology 2018, 265, 542–547. [Google Scholar] [CrossRef]
- Swetha, T.A.; Ananthi, V.; Bora, A.; Sengottuvelan, N.; Ponnuchamy, K.; Muthusamy, G.; Arun, A. A Review on Biodegradable Polylactic Acid (PLA) Production from Fermentative Food Waste - Its Applications and Degradation. International Journal of Biological Macromolecules 2023, 234, 123703. [Google Scholar] [CrossRef]
- Rahmasari, D.; Kahar, P.; De Oliveira, A.V.; Putra, F.J.N.; Kondo, A.; Ogino, C. Factors Affecting D-LA Production by Flocculant Saccharomyces Cerevisiae Under Non-Neutralizing Conditions. Microorganisms 2025, 13, 618. [Google Scholar] [CrossRef]
- Nusantara Putra, F.J.; Putri, S.P.; Fukusaki, E. Metabolomics-Based Profiling of Three Terminal Alkene-Producing Jeotgalicoccus Spp. during Different Growth Phase. Journal of Bioscience and Bioengineering 2019, 127, 52–58. [Google Scholar] [CrossRef]
- Chen, A.; Qu, T.; Smith, J.R.; Li, J.; Du, G.; Chen, J. Osmotic Tolerance in Saccharomyces Cerevisiae: Implications for Food and Bioethanol Industries. Food Bioscience 2024, 60, 104451. [Google Scholar] [CrossRef]
- Tofalo, R.; Perpetuini, G.; Di Gianvito, P.; Arfelli, G.; Schirone, M.; Corsetti, A.; Suzzi, G. Characterization of Specialized Flocculent Yeasts to Improve Sparkling Wine Fermentation. J Appl Microbiol 2016, 120, 1574–1584. [Google Scholar] [CrossRef]
- Zara, S.; Bakalinsky, A.T.; Zara, G.; Pirino, G.; Demontis, M.A.; Budroni, M. FLO11 -Based Model for Air-Liquid Interfacial Biofilm Formation by Saccharomyces Cerevisiae. Appl Environ Microbiol 2005, 71, 2934–2939. [Google Scholar] [CrossRef] [PubMed]
- Di Gianvito, P.; Tesnière, C.; Suzzi, G.; Blondin, B.; Tofalo, R. FLO5 Gene Controls Flocculation Phenotype and Adhesive Properties in a Saccharomyces Cerevisiae Sparkling Wine Strain. Sci Rep 2017, 7, 10786. [Google Scholar] [CrossRef] [PubMed]
- Di Gianvito, P.; Tesnière, C.; Suzzi, G.; Blondin, B.; Tofalo, R. Different Genetic Responses to Oenological Conditions between a Flocculent Wine Yeast and Its FLO5 Deleted Strain: Insights from the Transcriptome. Food Research International 2018, 114, 178–186. [Google Scholar] [CrossRef] [PubMed]
- Zheng, Y.; Kong, S.; Luo, S.; Chen, C.; Cui, Z.; Sun, X.; Chen, T.; Wang, Z. Improving Furfural Tolerance of Escherichia Coli by Integrating Adaptive Laboratory Evolution with CRISPR-Enabled Trackable Genome Engineering (CREATE). ACS Sustainable Chem. Eng. 2022, 10, 2318–2330. [Google Scholar] [CrossRef]
- He, M.; Wu, B.; Shui, Z.; Hu, Q.; Wang, W.; Tan, F.; Tang, X.; Zhu, Q.; Pan, K.; Li, Q.; et al. Transcriptome Profiling of Zymomonas Mobilis under Furfural Stress. Appl Microbiol Biotechnol 2012, 95, 189–199. [Google Scholar] [CrossRef] [PubMed]
- Pangestu, R.; Kahar, P.; Ogino, C.; Kondo, A. Comparative Responses of Flocculating and Nonflocculating Yeasts to Cell Density and Chemical Stress in Lactic Acid Fermentation. Yeast 2024, 41, 192–206. [Google Scholar] [CrossRef] [PubMed]
- Liu, T.; Sun, L.; Zhang, C.; Liu, Y.; Li, J.; Du, G.; Lv, X.; Liu, L. Combinatorial Metabolic Engineering and Process Optimization Enables Highly Efficient Production of L-Lactic Acid by Acid-Tolerant Saccharomyces Cerevisiae. Bioresource Technology 2023, 379, 129023. [Google Scholar] [CrossRef]
- Sae-Tang, K.; Bumrungtham, P.; Mhuantong, W.; Champreda, V.; Tanapongpipat, S.; Zhao, X.-Q.; Liu, C.-G.; Runguphan, W. Engineering Flocculation for Improved Tolerance and Production of D-LA in Pichia Pastoris. JoF 2023, 9, 409. [Google Scholar] [CrossRef]
- Stewart, G. Yeast Flocculation—Sedimentation and Flotation. Fermentation 2018, 4, 28. [Google Scholar] [CrossRef]
- Guo, B.; Yu, W.; Xu, X.; Liu, Y.; Liu, Y.; Du, G.; Liu, L.; Lv, X. Adaptively Evolved and Multiplexed Engineered Saccharomyces Cerevisiae for Neutralizer-Free Production of l -Lactic Acid. J. Agric. Food Chem. 2025, 73, 9009–9018. [Google Scholar] [CrossRef] [PubMed]
Figure 1.
D-Lactic acid (D-LA) production from 150 and 300 g/L glucose of F118∆CYB2::LpDLDH (a) and (b), F118 ∆PDC1::LpDLDH (c) and (d), respectively.
Figure 1.
D-Lactic acid (D-LA) production from 150 and 300 g/L glucose of F118∆CYB2::LpDLDH (a) and (b), F118 ∆PDC1::LpDLDH (c) and (d), respectively.
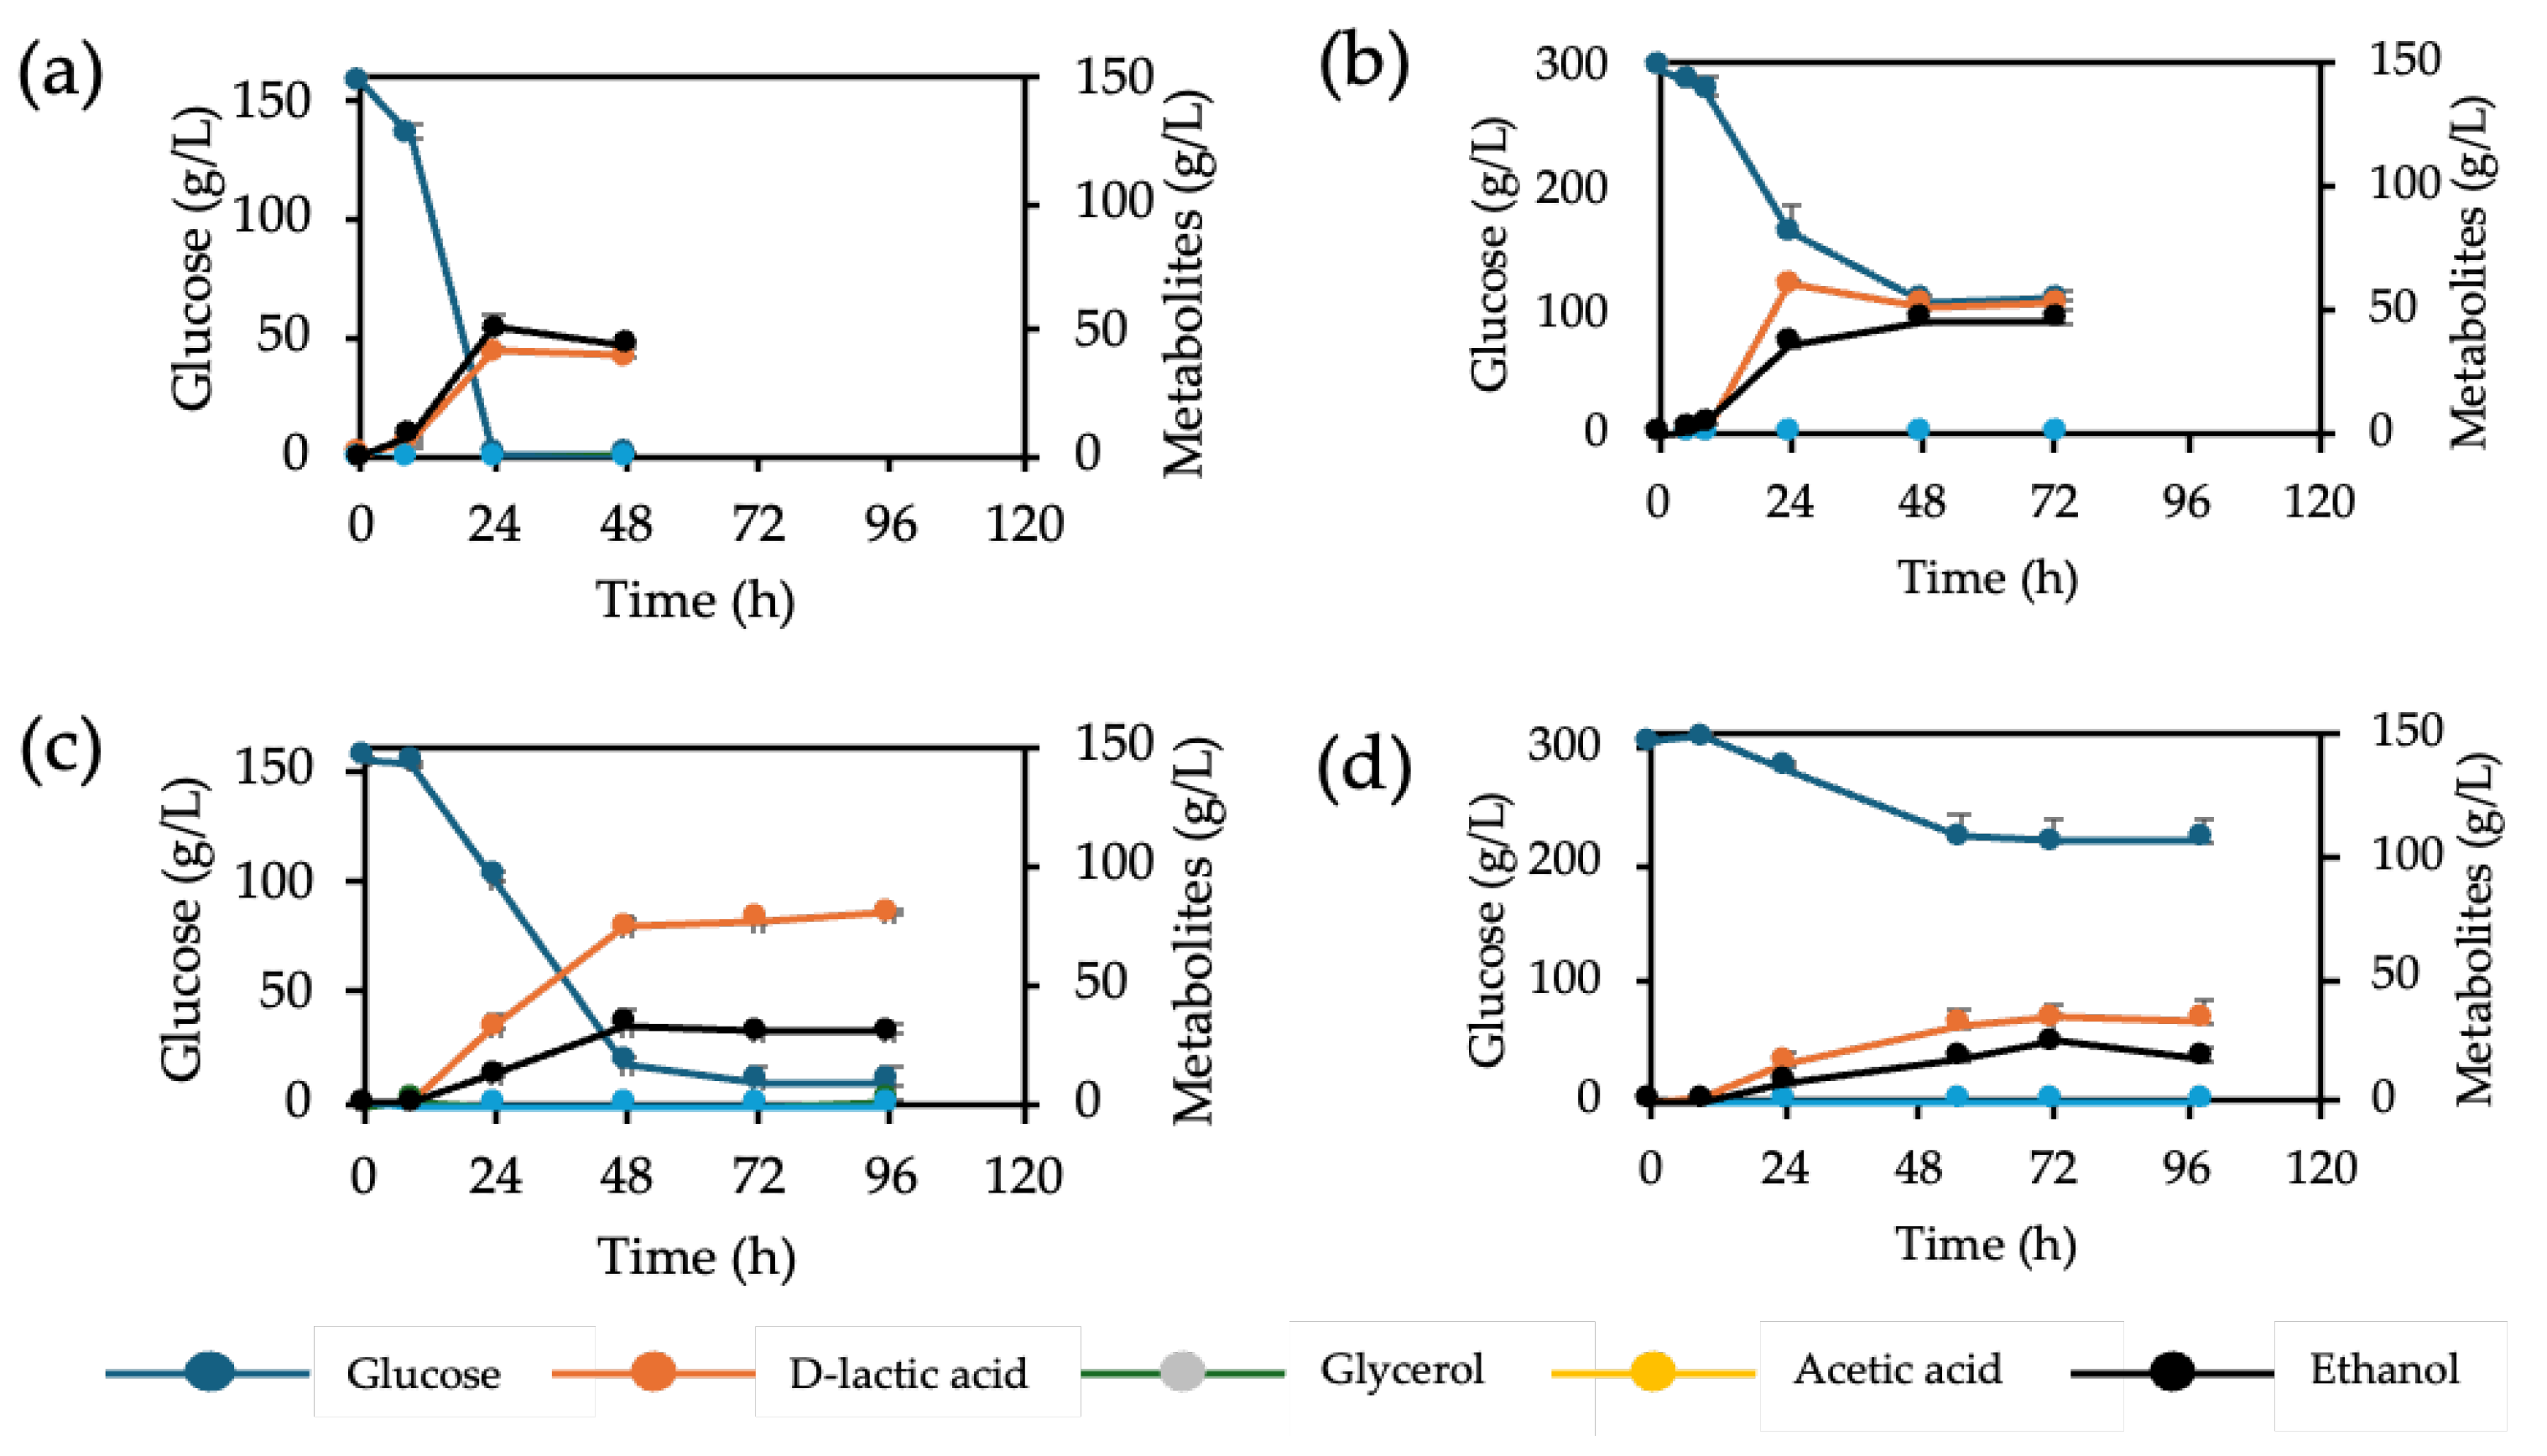
Figure 2.
D-LA production in different glucose levels from F118∆CYB2::LpDLDH (a) and (b) F118∆PDC1::LpDLDH and their culture appearance (c) and (d), respectively.
Figure 2.
D-LA production in different glucose levels from F118∆CYB2::LpDLDH (a) and (b) F118∆PDC1::LpDLDH and their culture appearance (c) and (d), respectively.
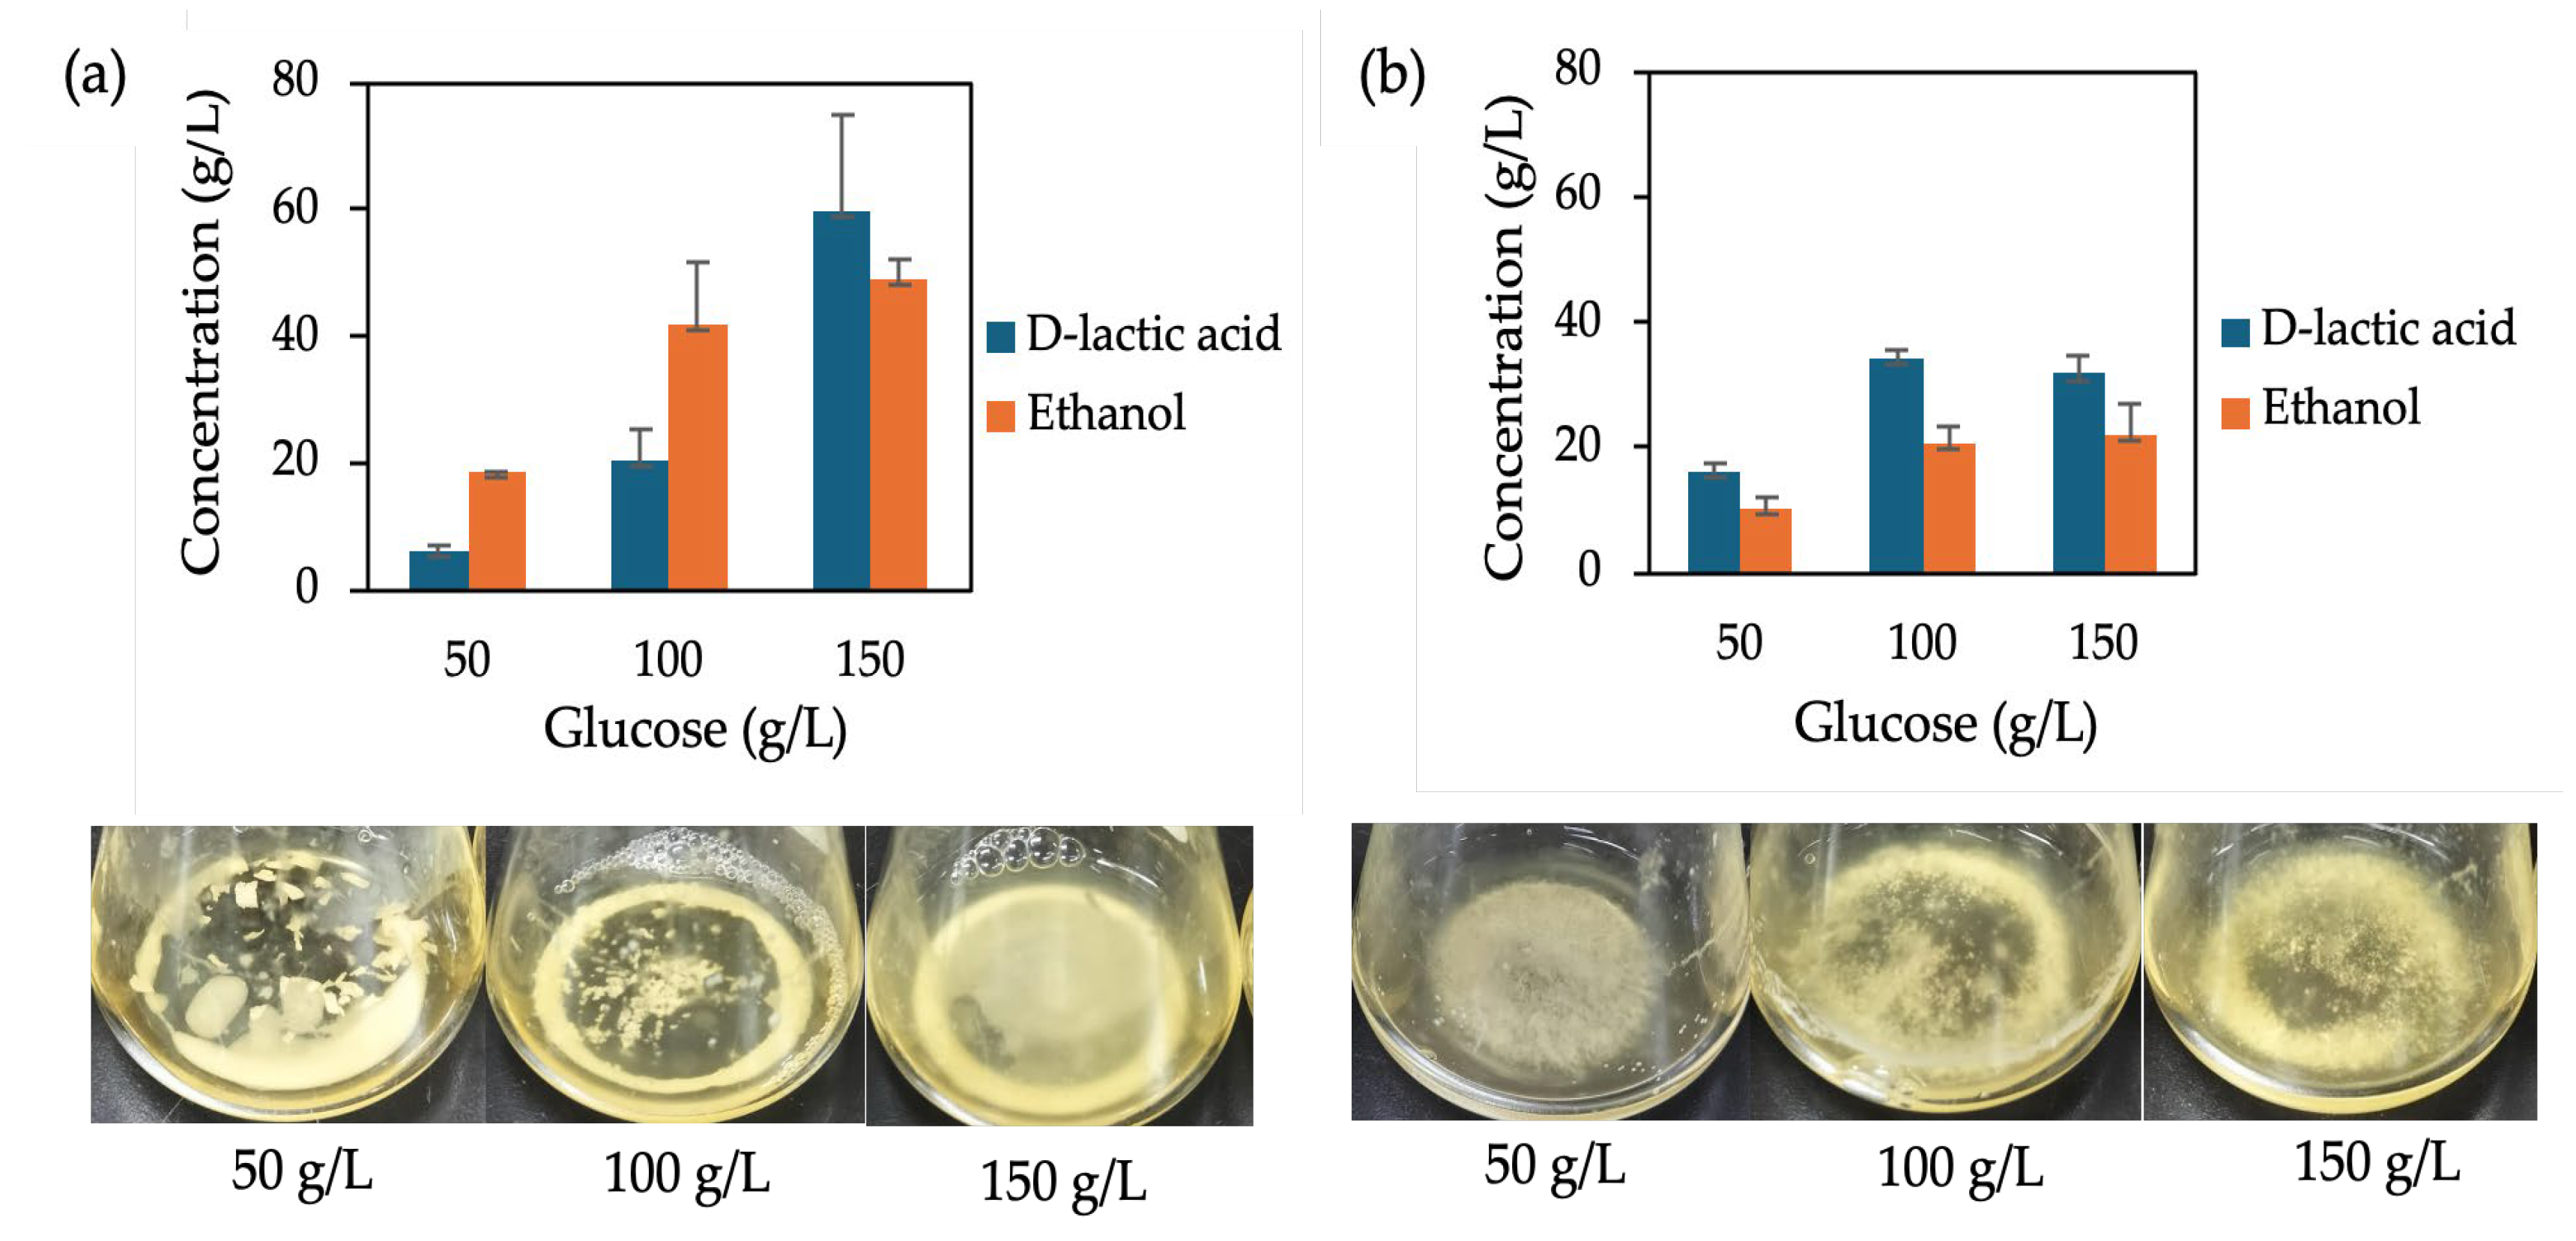
Figure 3.
Transcriptional comparison of S. cerevisiae F118ΔPDC1::LpDLDH cultivated in YPD100 and YPD150 media. Relative expression levels (log₂ FC) of genes associated with stress response (AFT1, TPS1, SSK1, HOG1), cell-wall remodeling (DSE2, TOS6, YGP1, SED1, SCW10, SCW11, CRH1), flocculation (FLO5), and lactic acid production (LpDLDH, PDC1) were quantified by qPCR. Values represent log₂ fold change (Log₂FC) relative to the control condition. Upregulated and downregulated genes are indicated on the right and left sides of the zero axis, respectively.
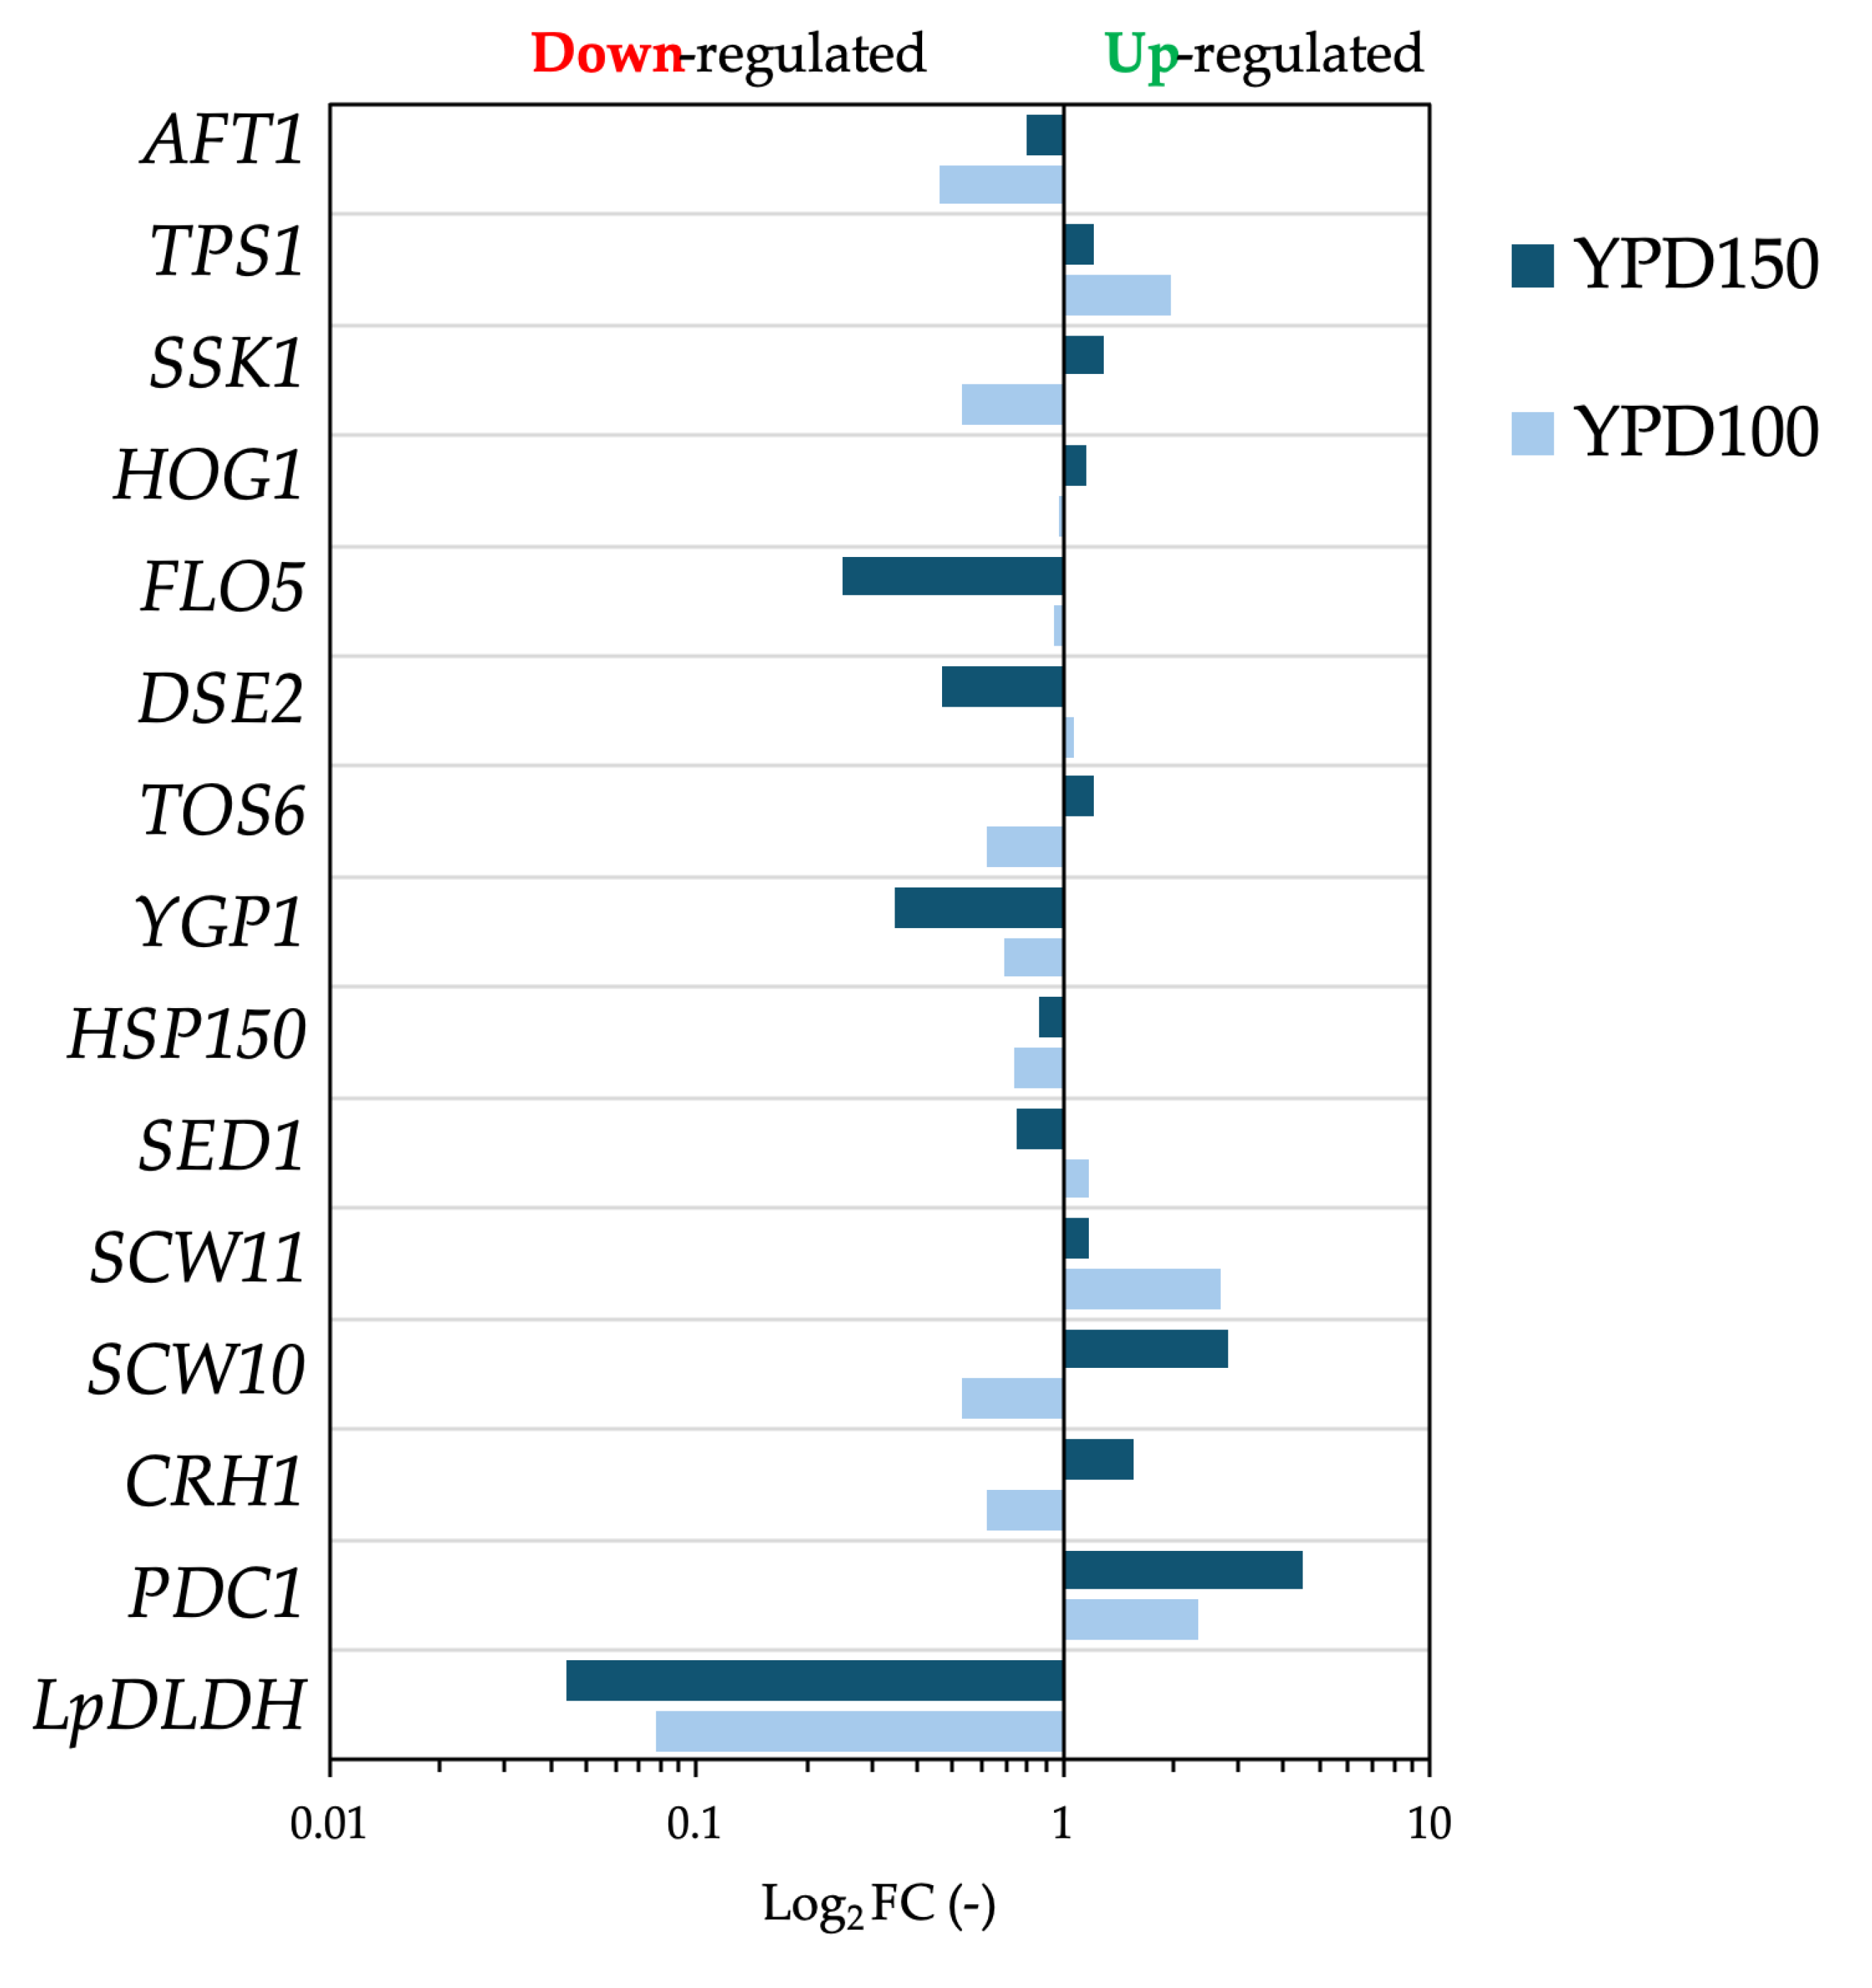
Figure 4.
D-LA production with calcium carbonate supplementation and without supplementation of F118∆CYB2::LpDLDH (a) and (b) F118∆PDC1::LpDLDH and their culture appearance (c) and (d), respectively.
Figure 4.
D-LA production with calcium carbonate supplementation and without supplementation of F118∆CYB2::LpDLDH (a) and (b) F118∆PDC1::LpDLDH and their culture appearance (c) and (d), respectively.
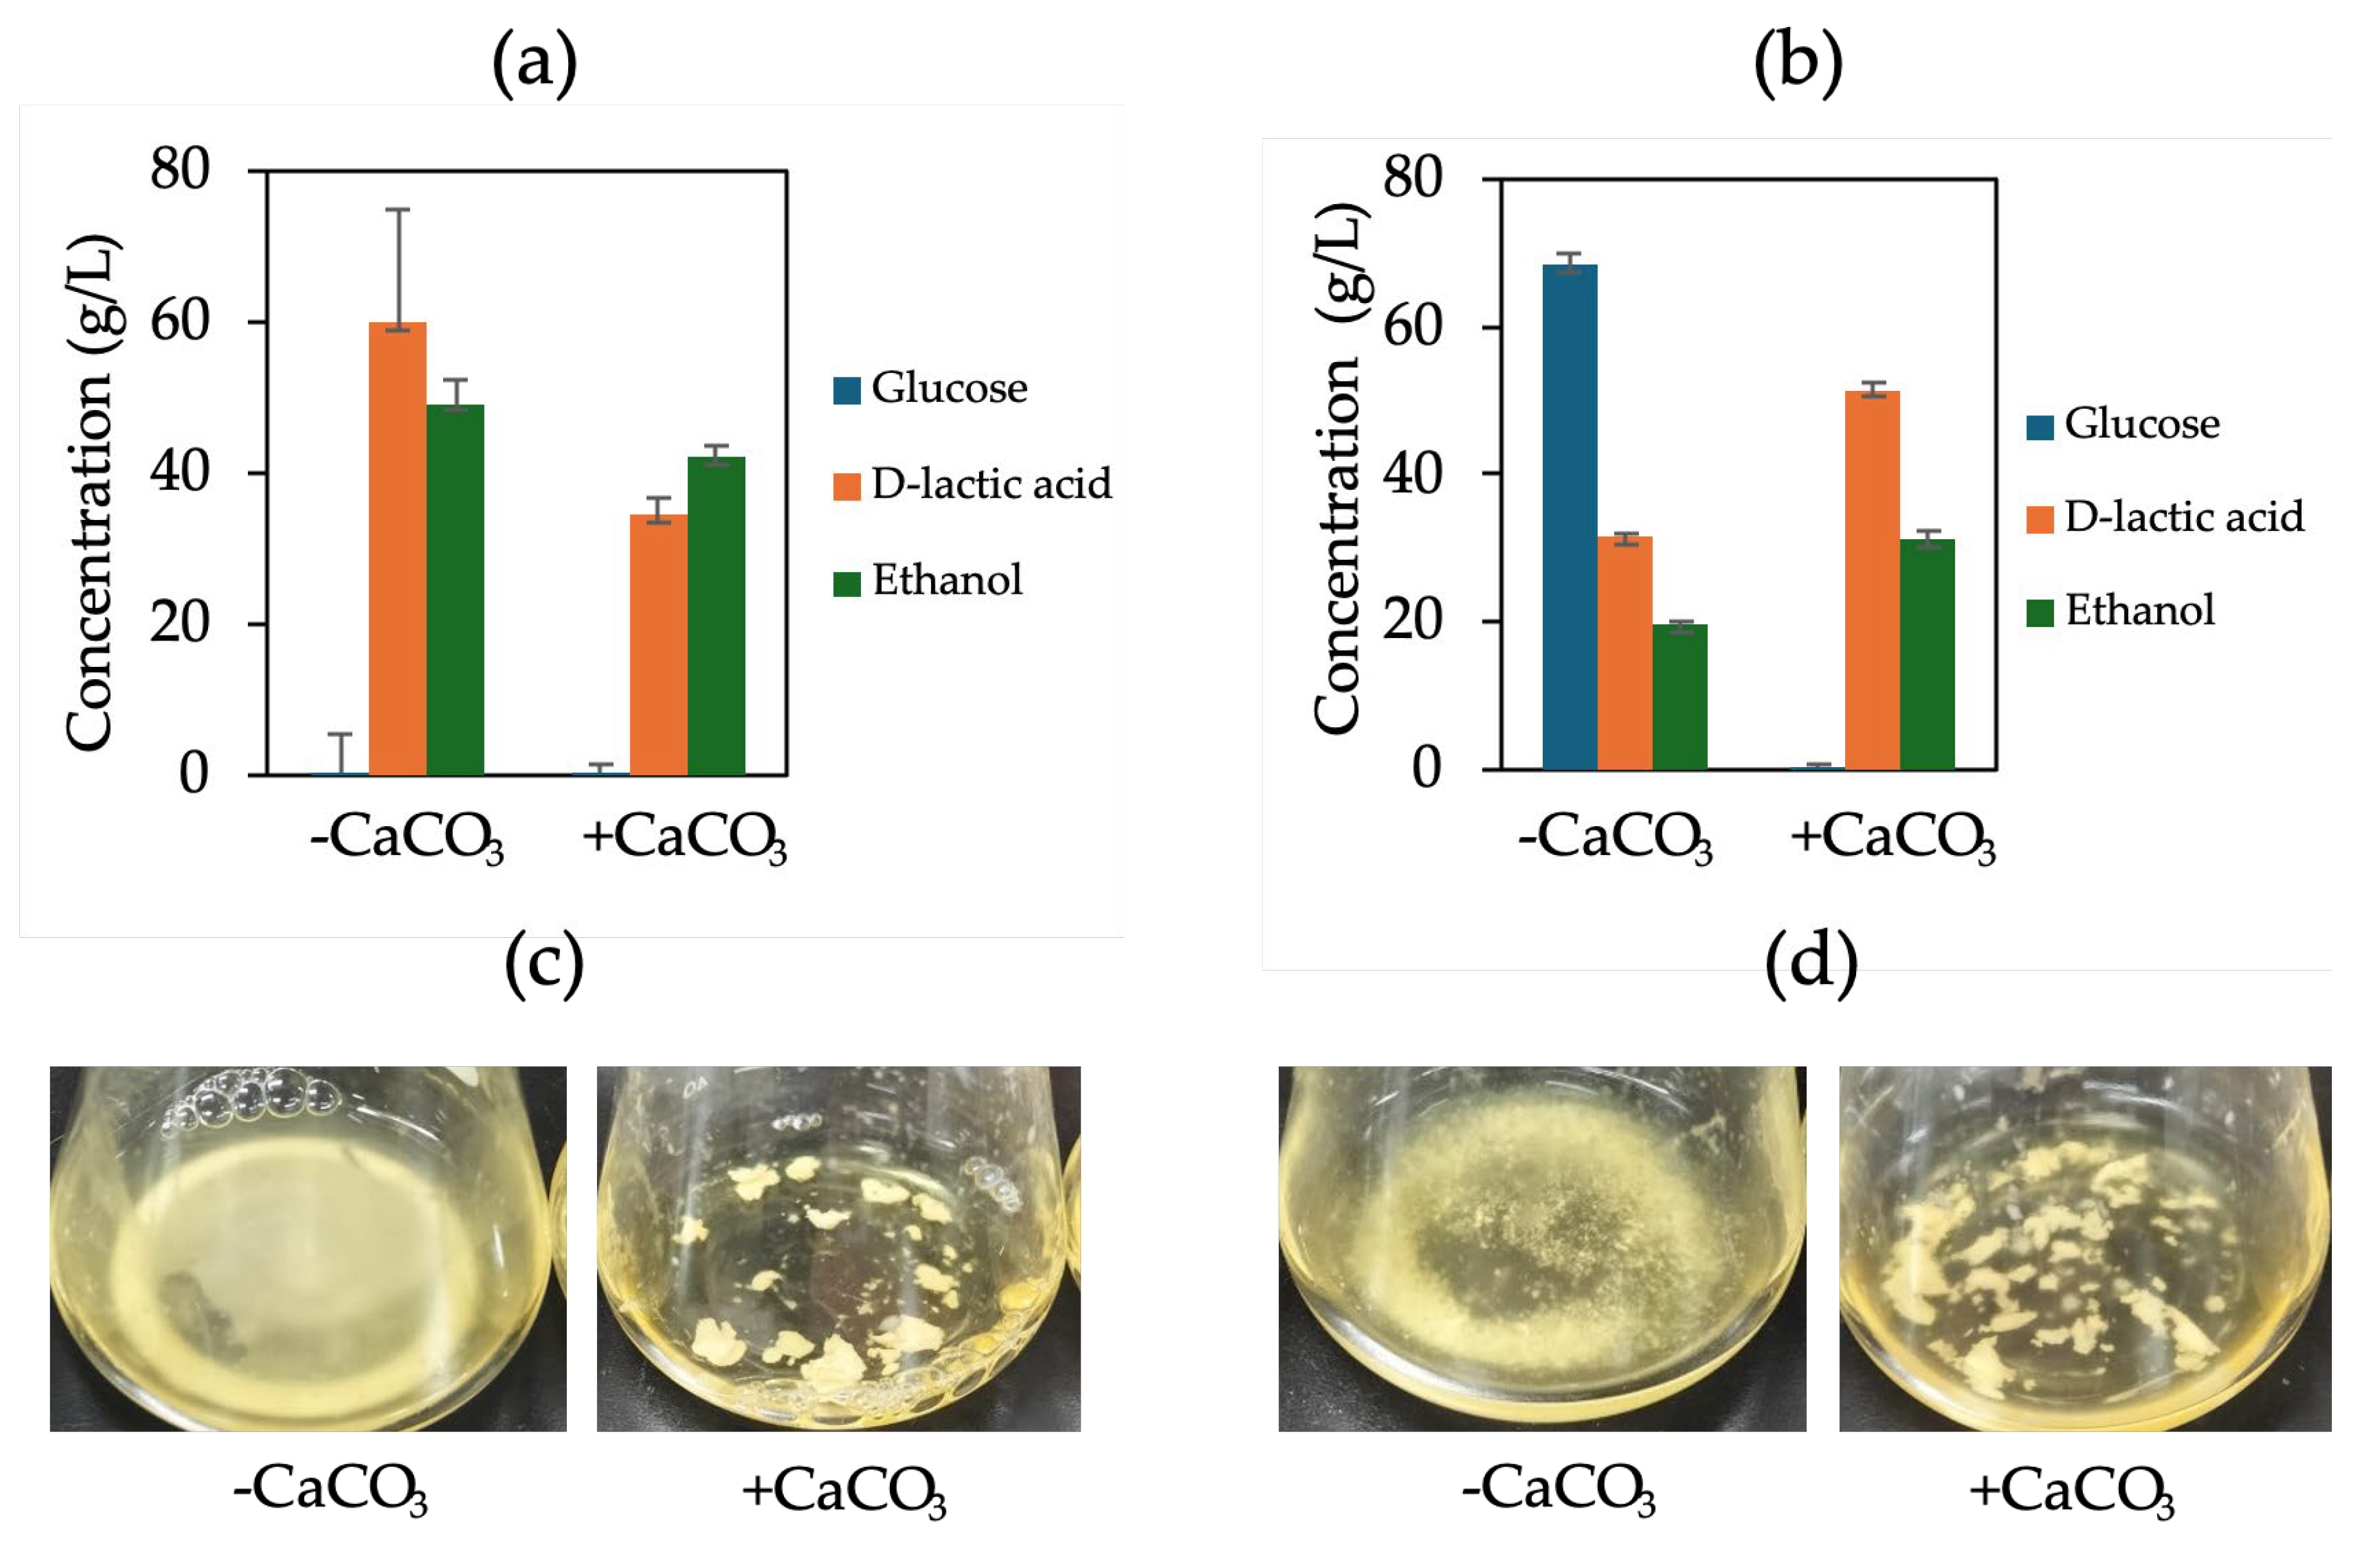
Figure 5.
Transcriptional response of S. cerevisiae F118ΔCYB2::LpDLDH under CaCO₃-supplemented fermentation conditions. Relative expression levels (log2 fold-change) of selected genes involved in cell-wall remodeling (CRH1, TOS6, SUN4, SED1), stress signaling (HOG1, AFT1), and protein stabilization (HSP150), as well as genes associated with adhesion and flocculation (FLO5), and D-LA production (LpDLDH), were quantified by qPCR. Upregulated and downregulated genes are indicated on the right and left sides of the zero axis, respectively. CaCO₃ addition markedly upregulated HSP150, YGP1, and LpDLDH, indicating activation of cell wall integrity and protein quality control pathways that contribute to enhanced acid tolerance and sustained D-LA productivity under buffered conditions.
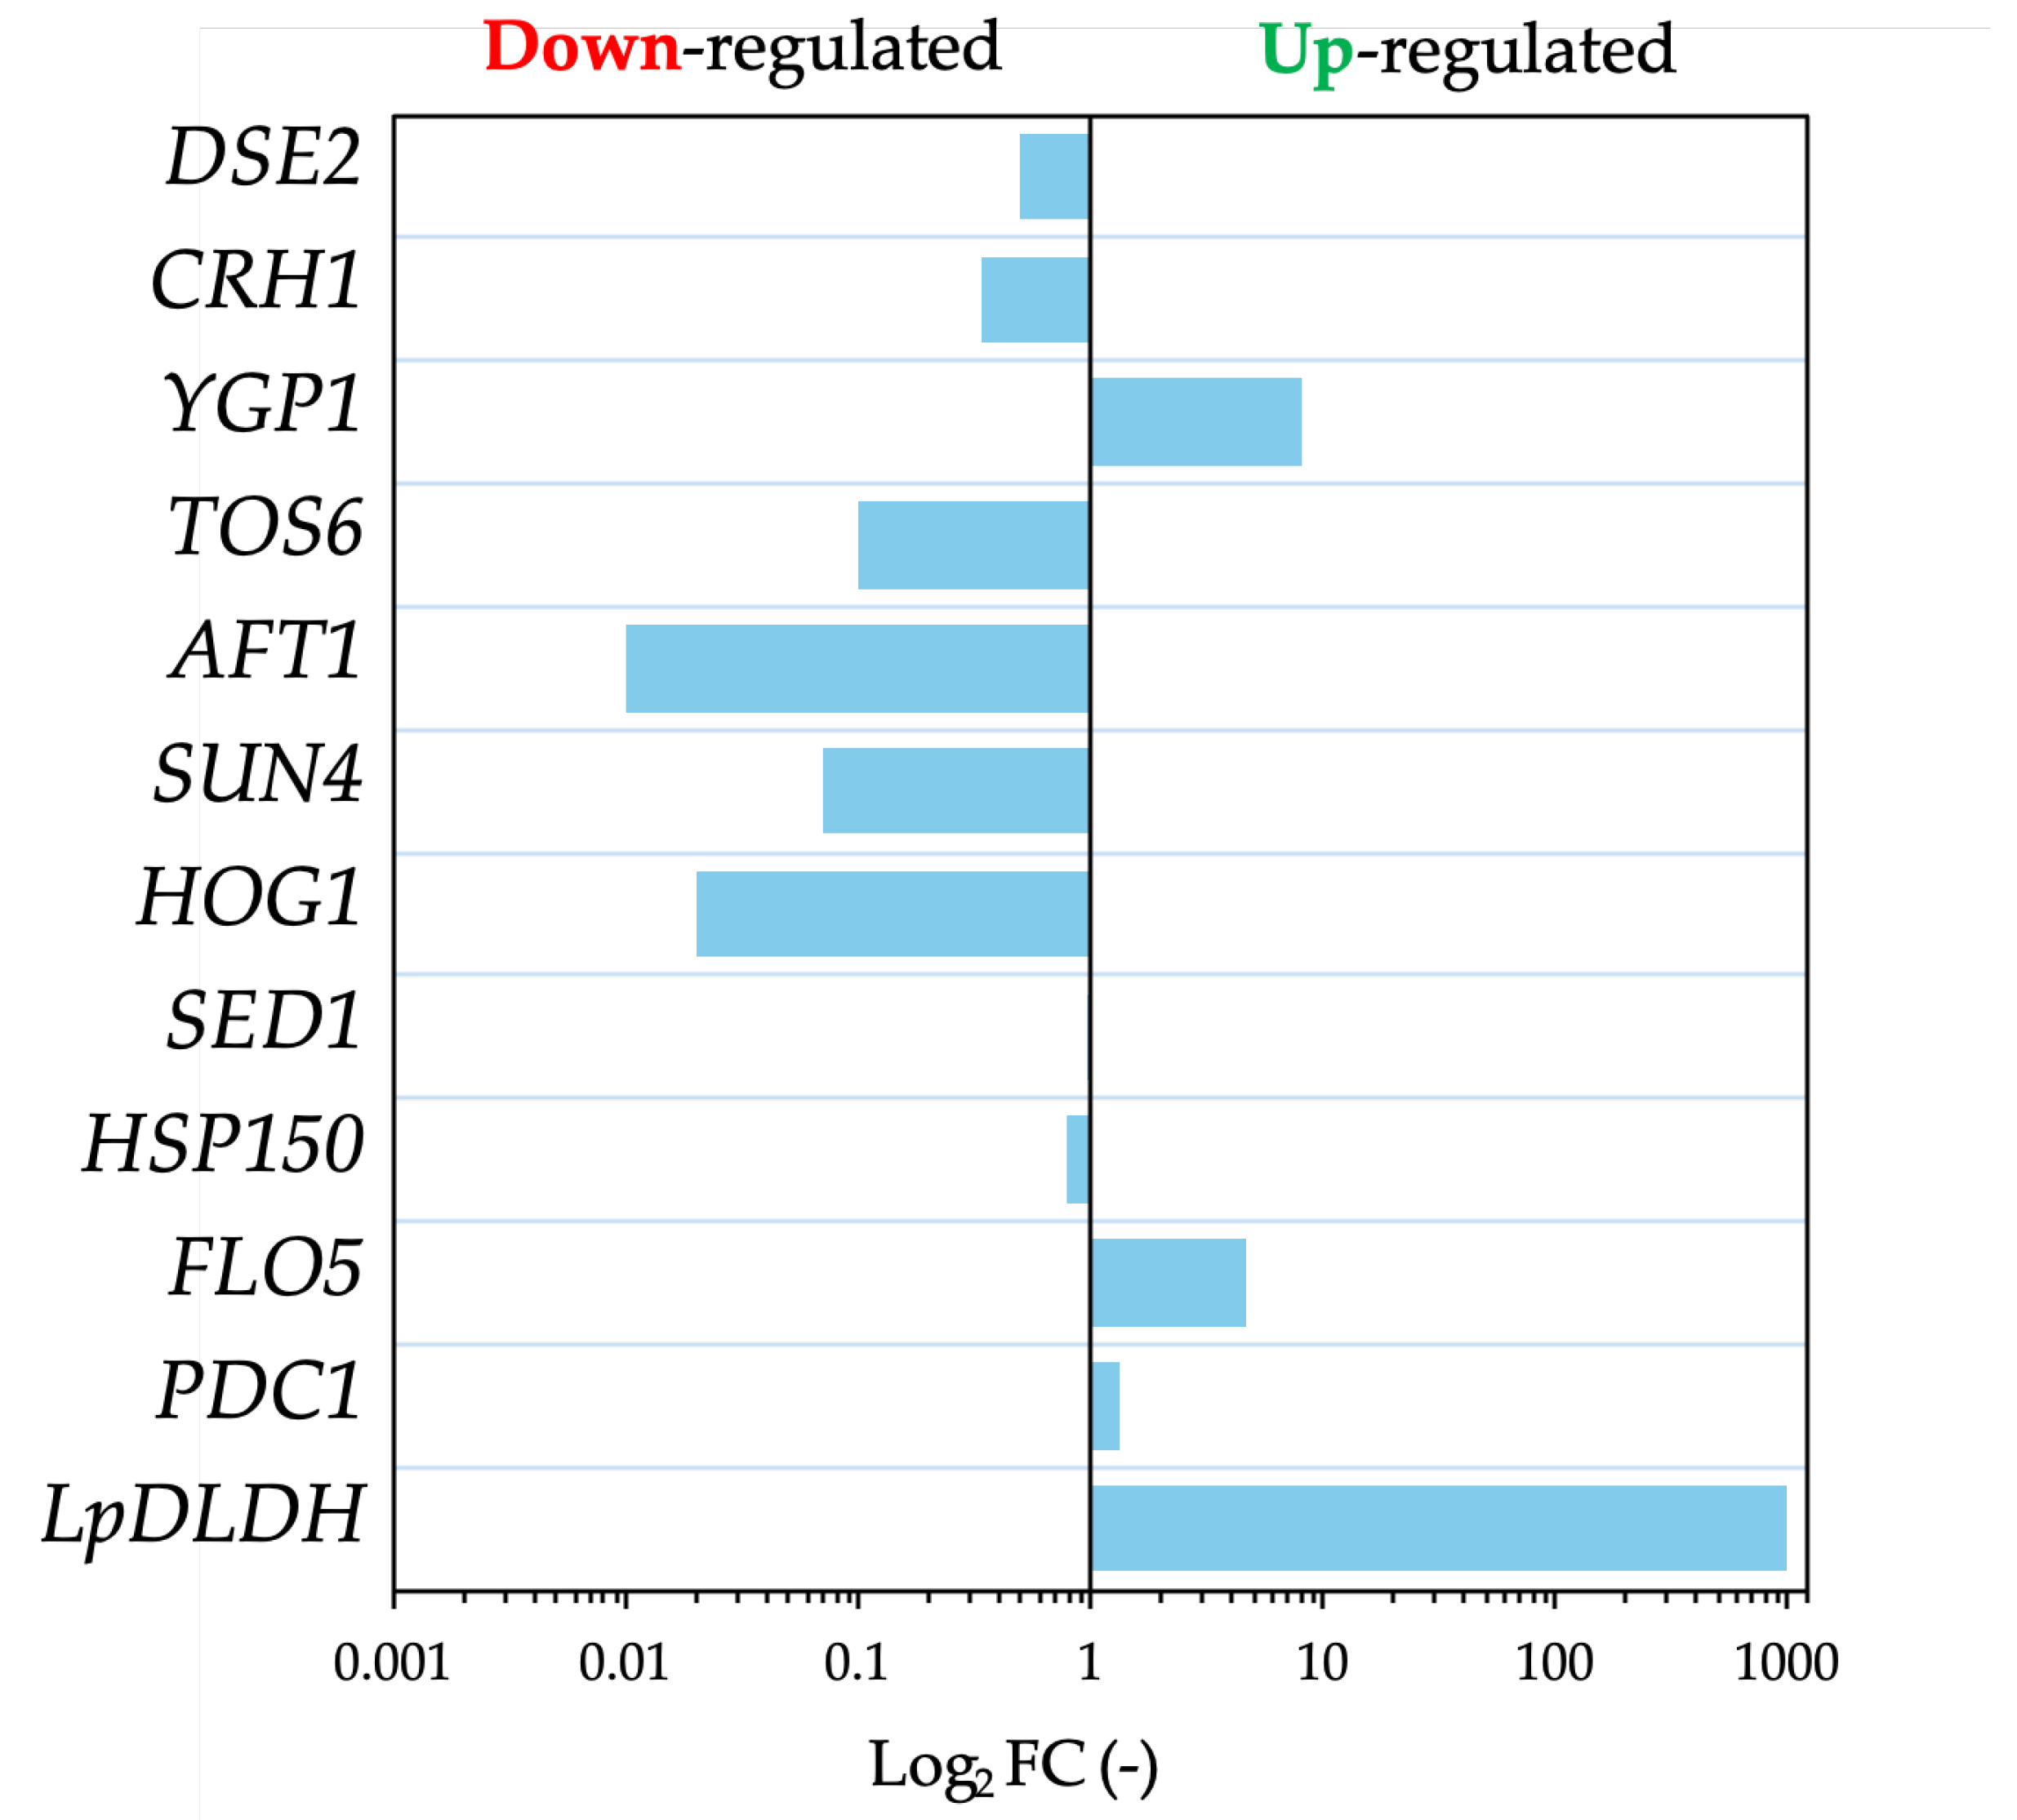
Figure 6.
D-lactic acid (D-LA) production and cell morphology of engineered S. cerevisiae strains under inhibitory chemical compound (ICC) stress and CaCO₃ supplementation. (a) Fermentation profile and microscopic observation of F118ΔCYB2::LpDLDH, (b) F118ΔPDC1::LpDLDH, and (c) F118ΔCYB2::LpDLDH cultured with CaCO₃ supplementation. Glucose consumption and metabolite accumulation (glycerol, acetic acid, and ethanol) were monitored over time. Microscopic images (bottom panels) show cell morphology and flocculation behavior after 72 h of fermentation. Scale bar = 10 μm.
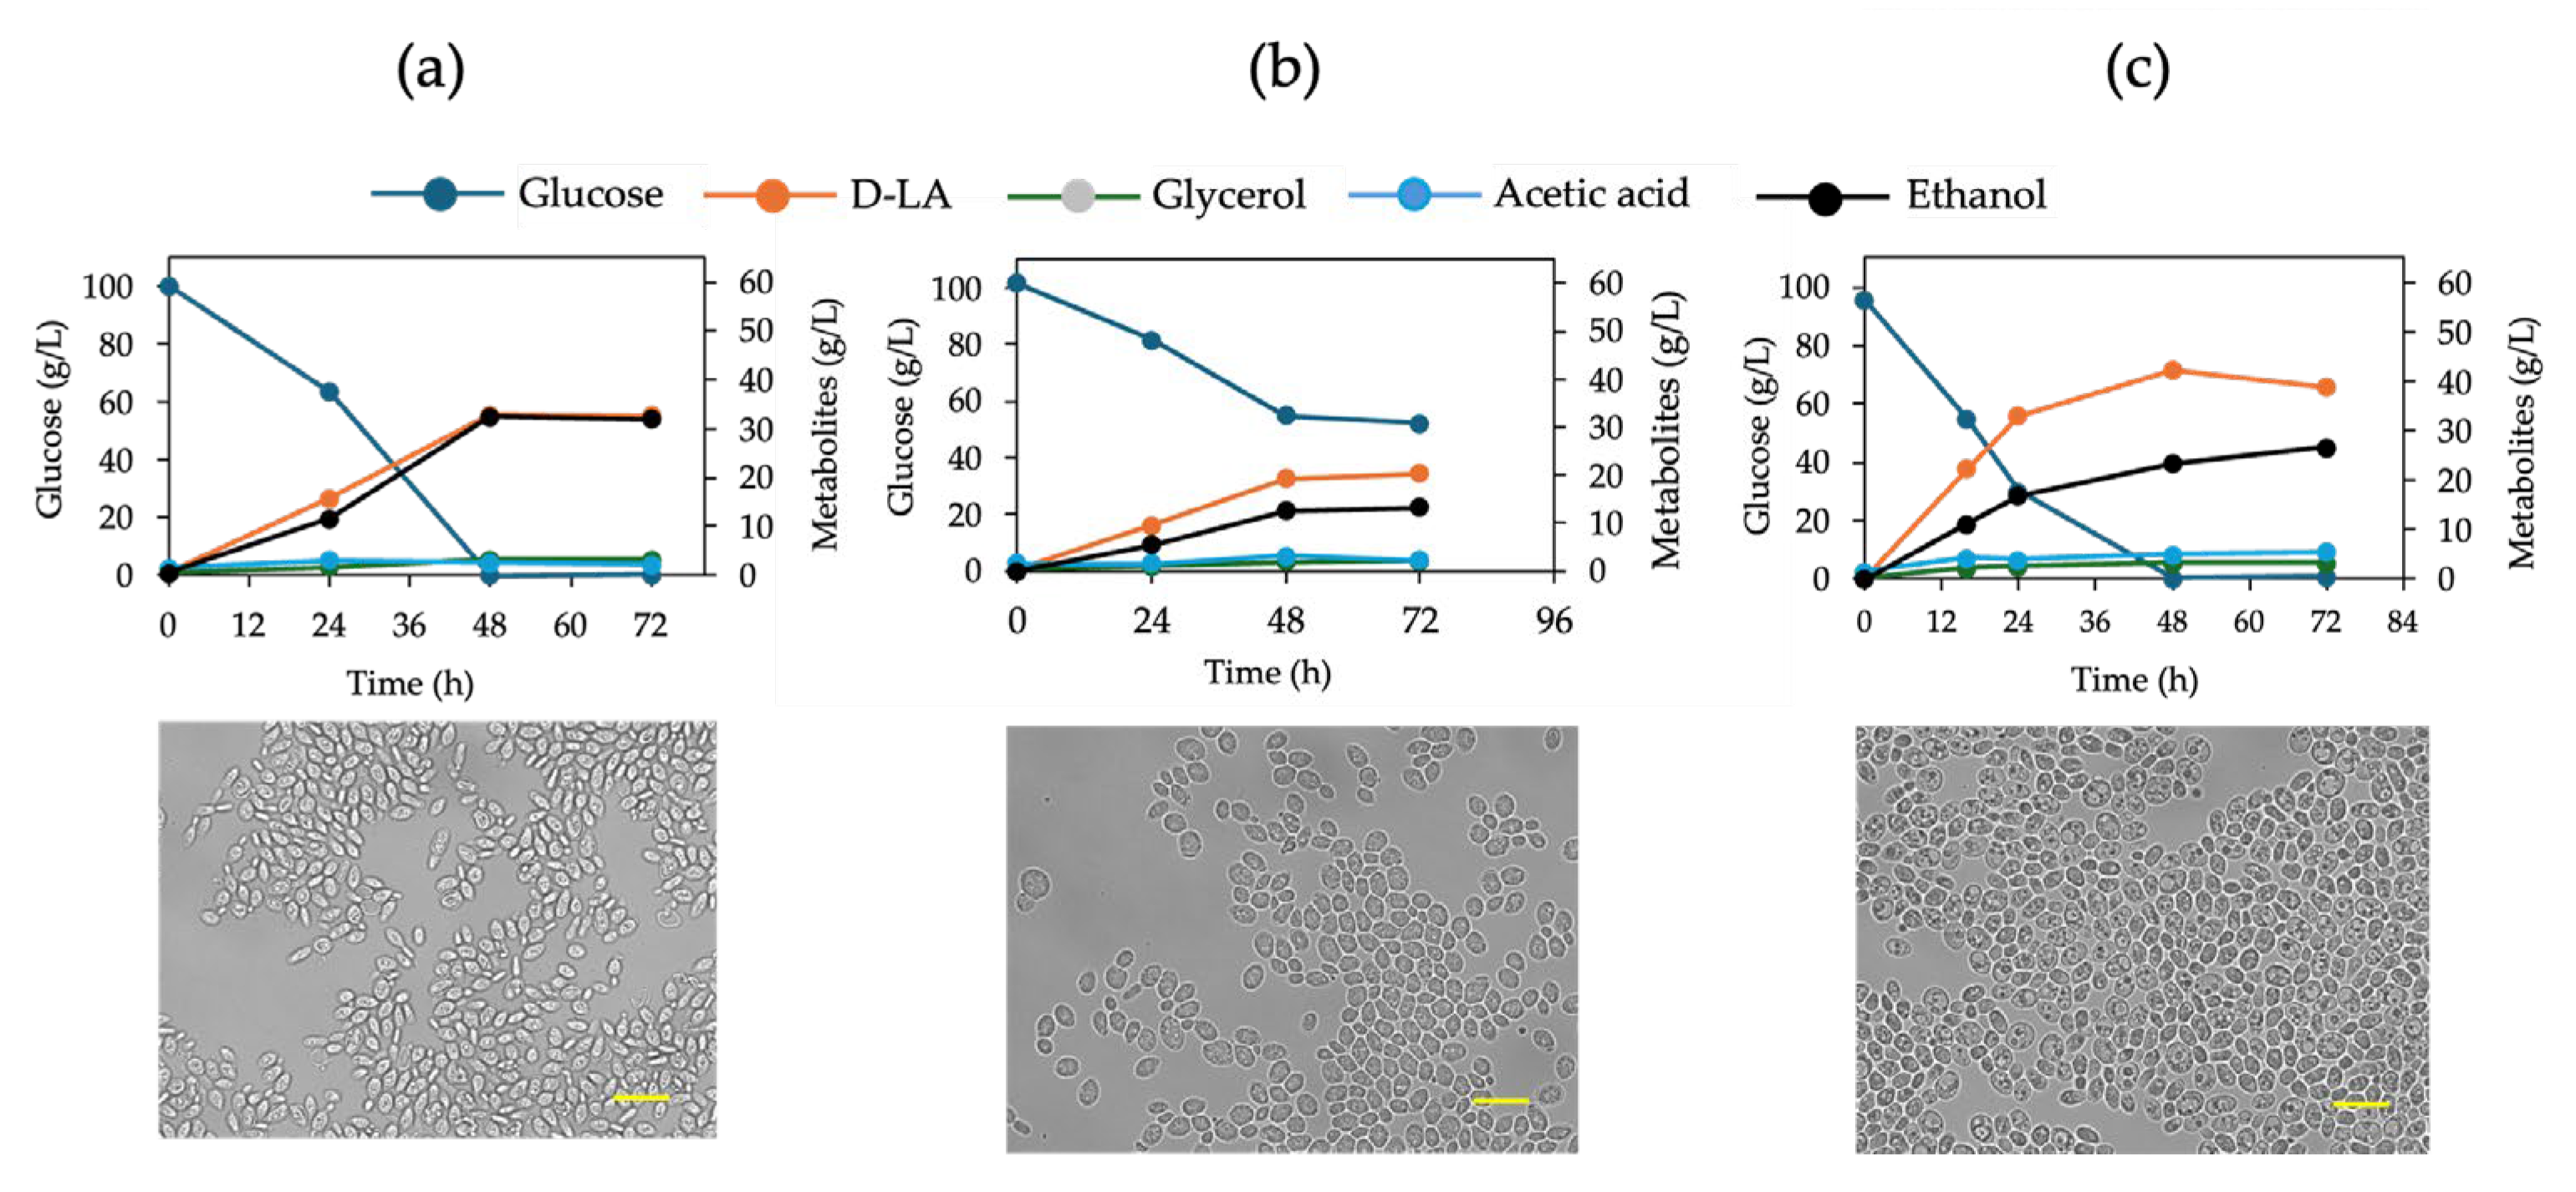
Figure 7.
Products/glucose consumed of both strains in YPD100 medium supplemented with/out ICCs of F118∆CYB2::LpDLDH (a) and F118∆PDC1::LpDLDH (b).
Figure 7.
Products/glucose consumed of both strains in YPD100 medium supplemented with/out ICCs of F118∆CYB2::LpDLDH (a) and F118∆PDC1::LpDLDH (b).
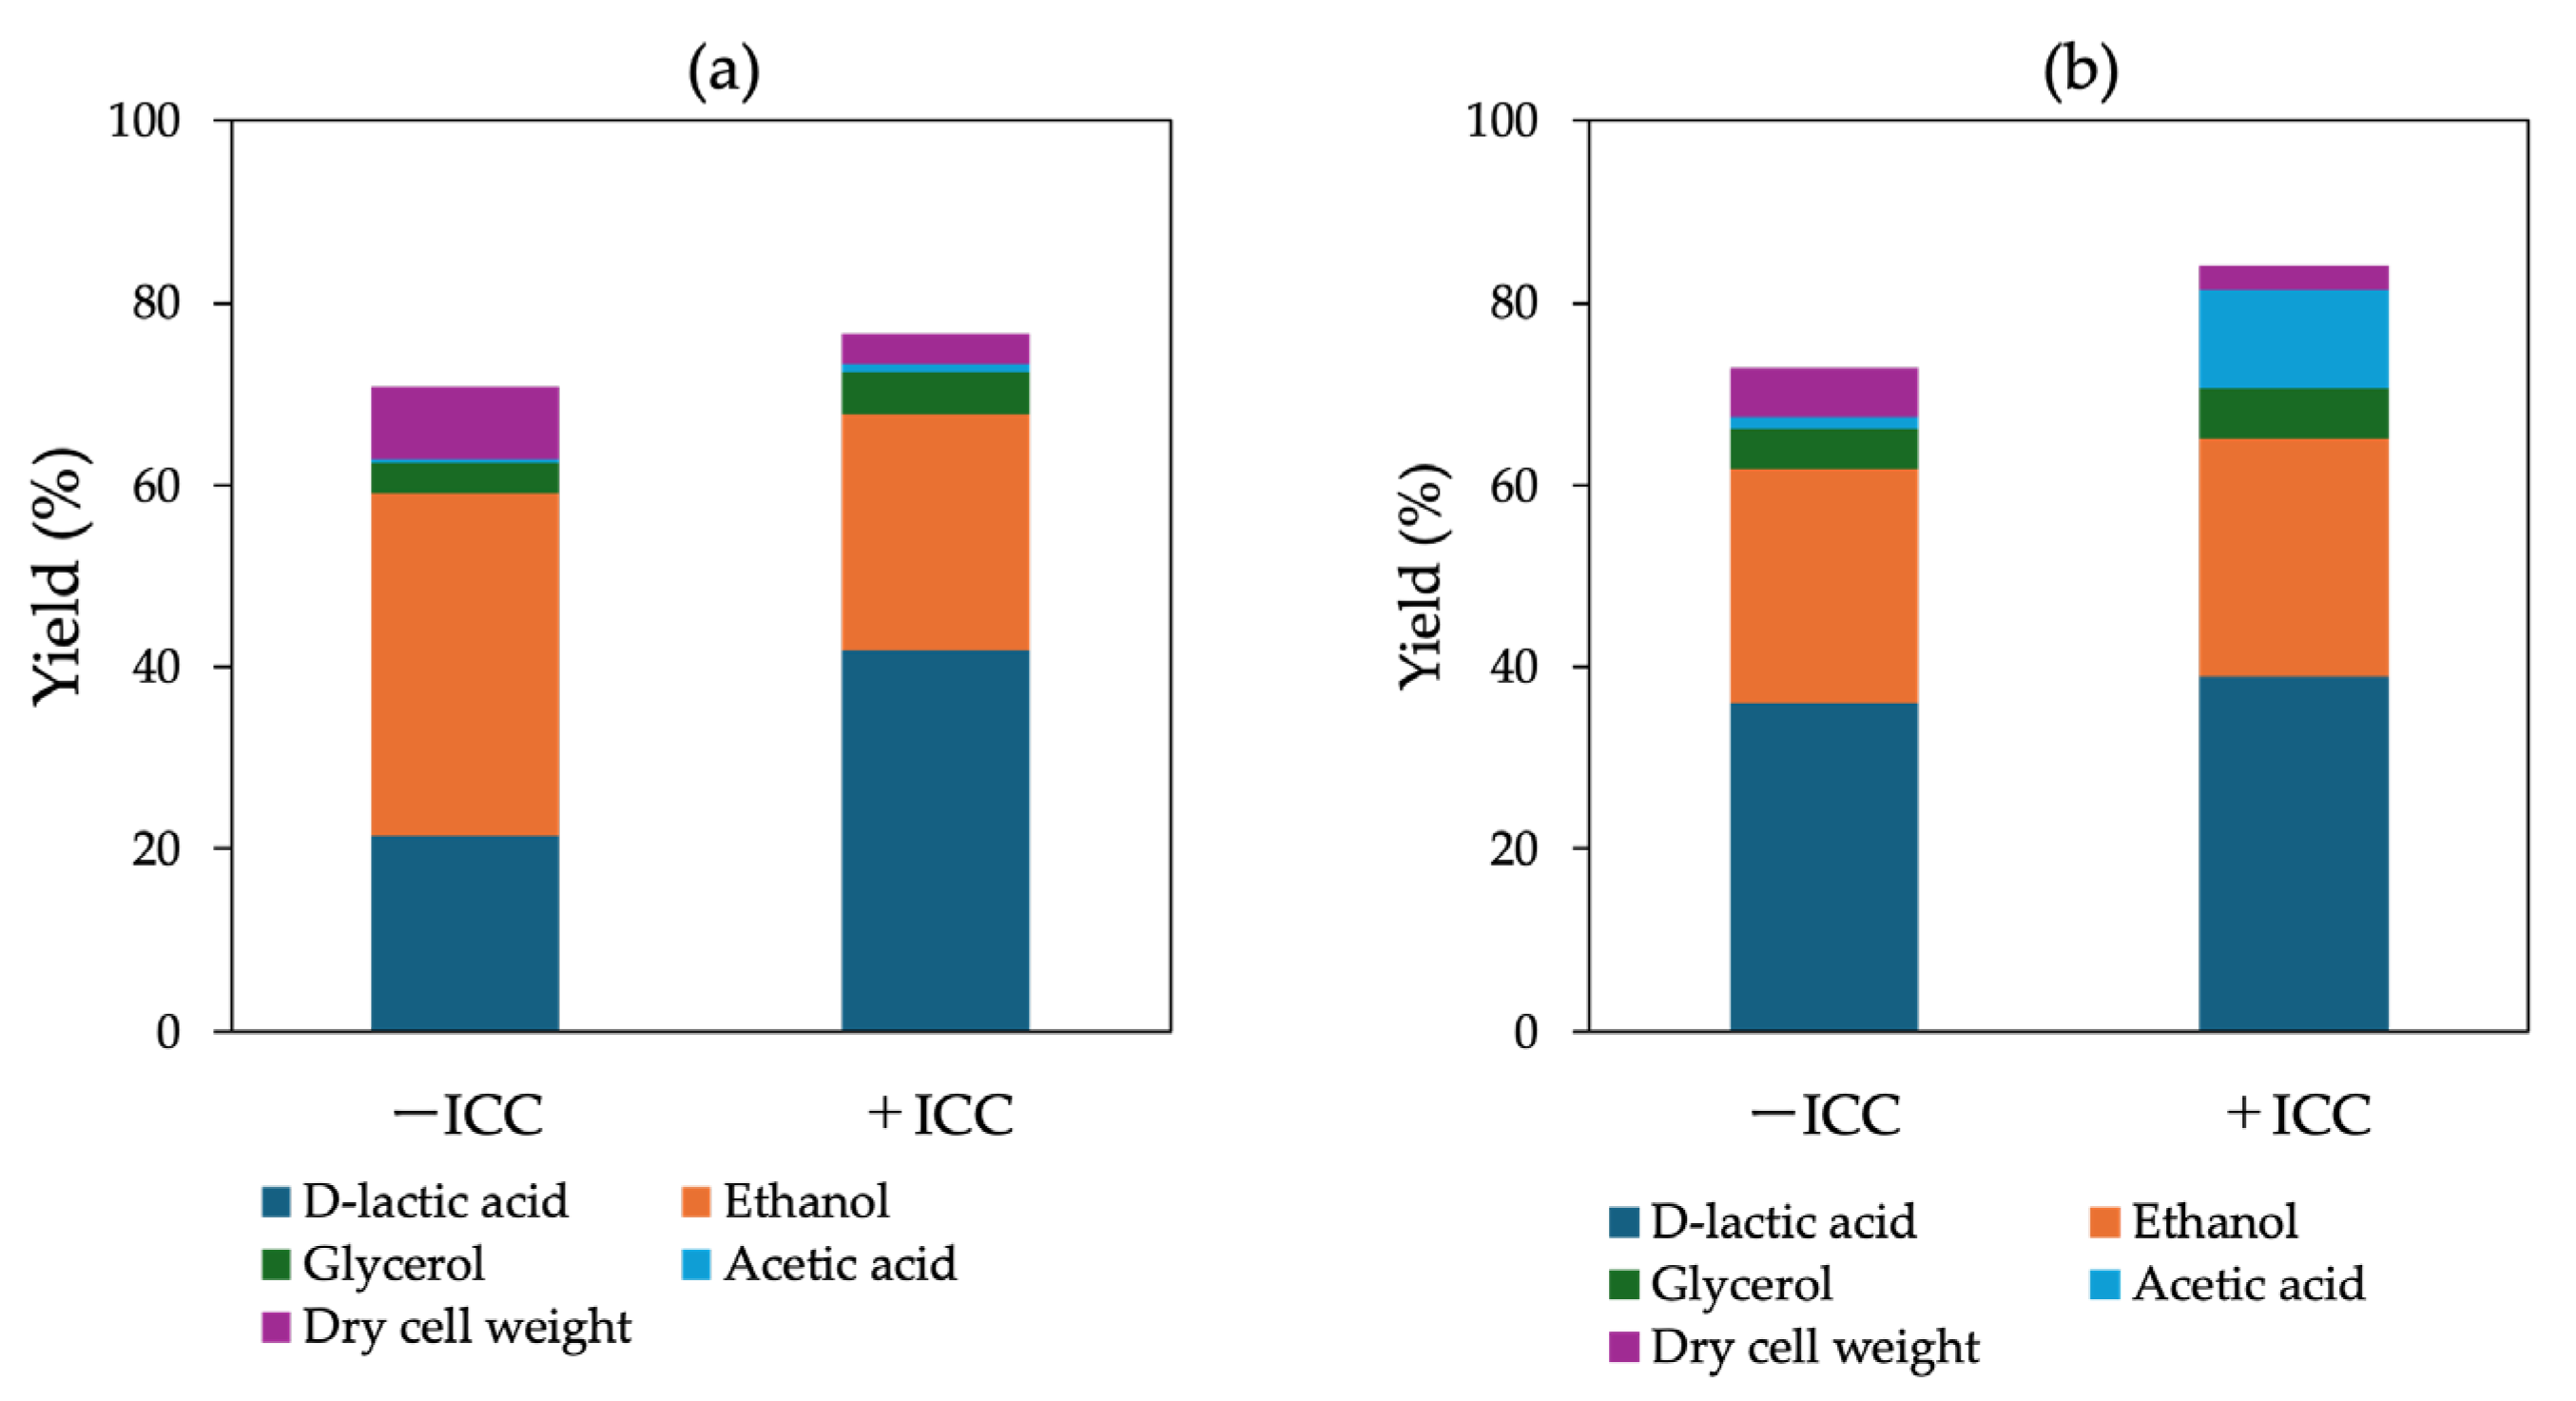
Figure 8.
Transcriptional responses of metabolism- and stress-related genes in engineered S. cerevisiae strains under inhibitory compound (ICC) and buffering conditions. Relative expression levels (log₂ FC) of key genes involved in glycolysis (HXK1, PFK1, ENO1, ADH1), D-LA production (LpDLDH), lactate transport (JEN1), stress adaptation (SLT2, RLM1, YGP1, SCW11, HSP150), and mitochondrial respiration (NDI1) were determined by quantitative PCR. Upregulated and downregulated genes are indicated on the right and left sides of the zero axis, respectively. CaCO₃ addition markedly enhanced LpDLDH and JEN1 expression while stabilizing stress-responsive transcripts, indicating improved pH homeostasis and redox regulation during D-LA fermentation.
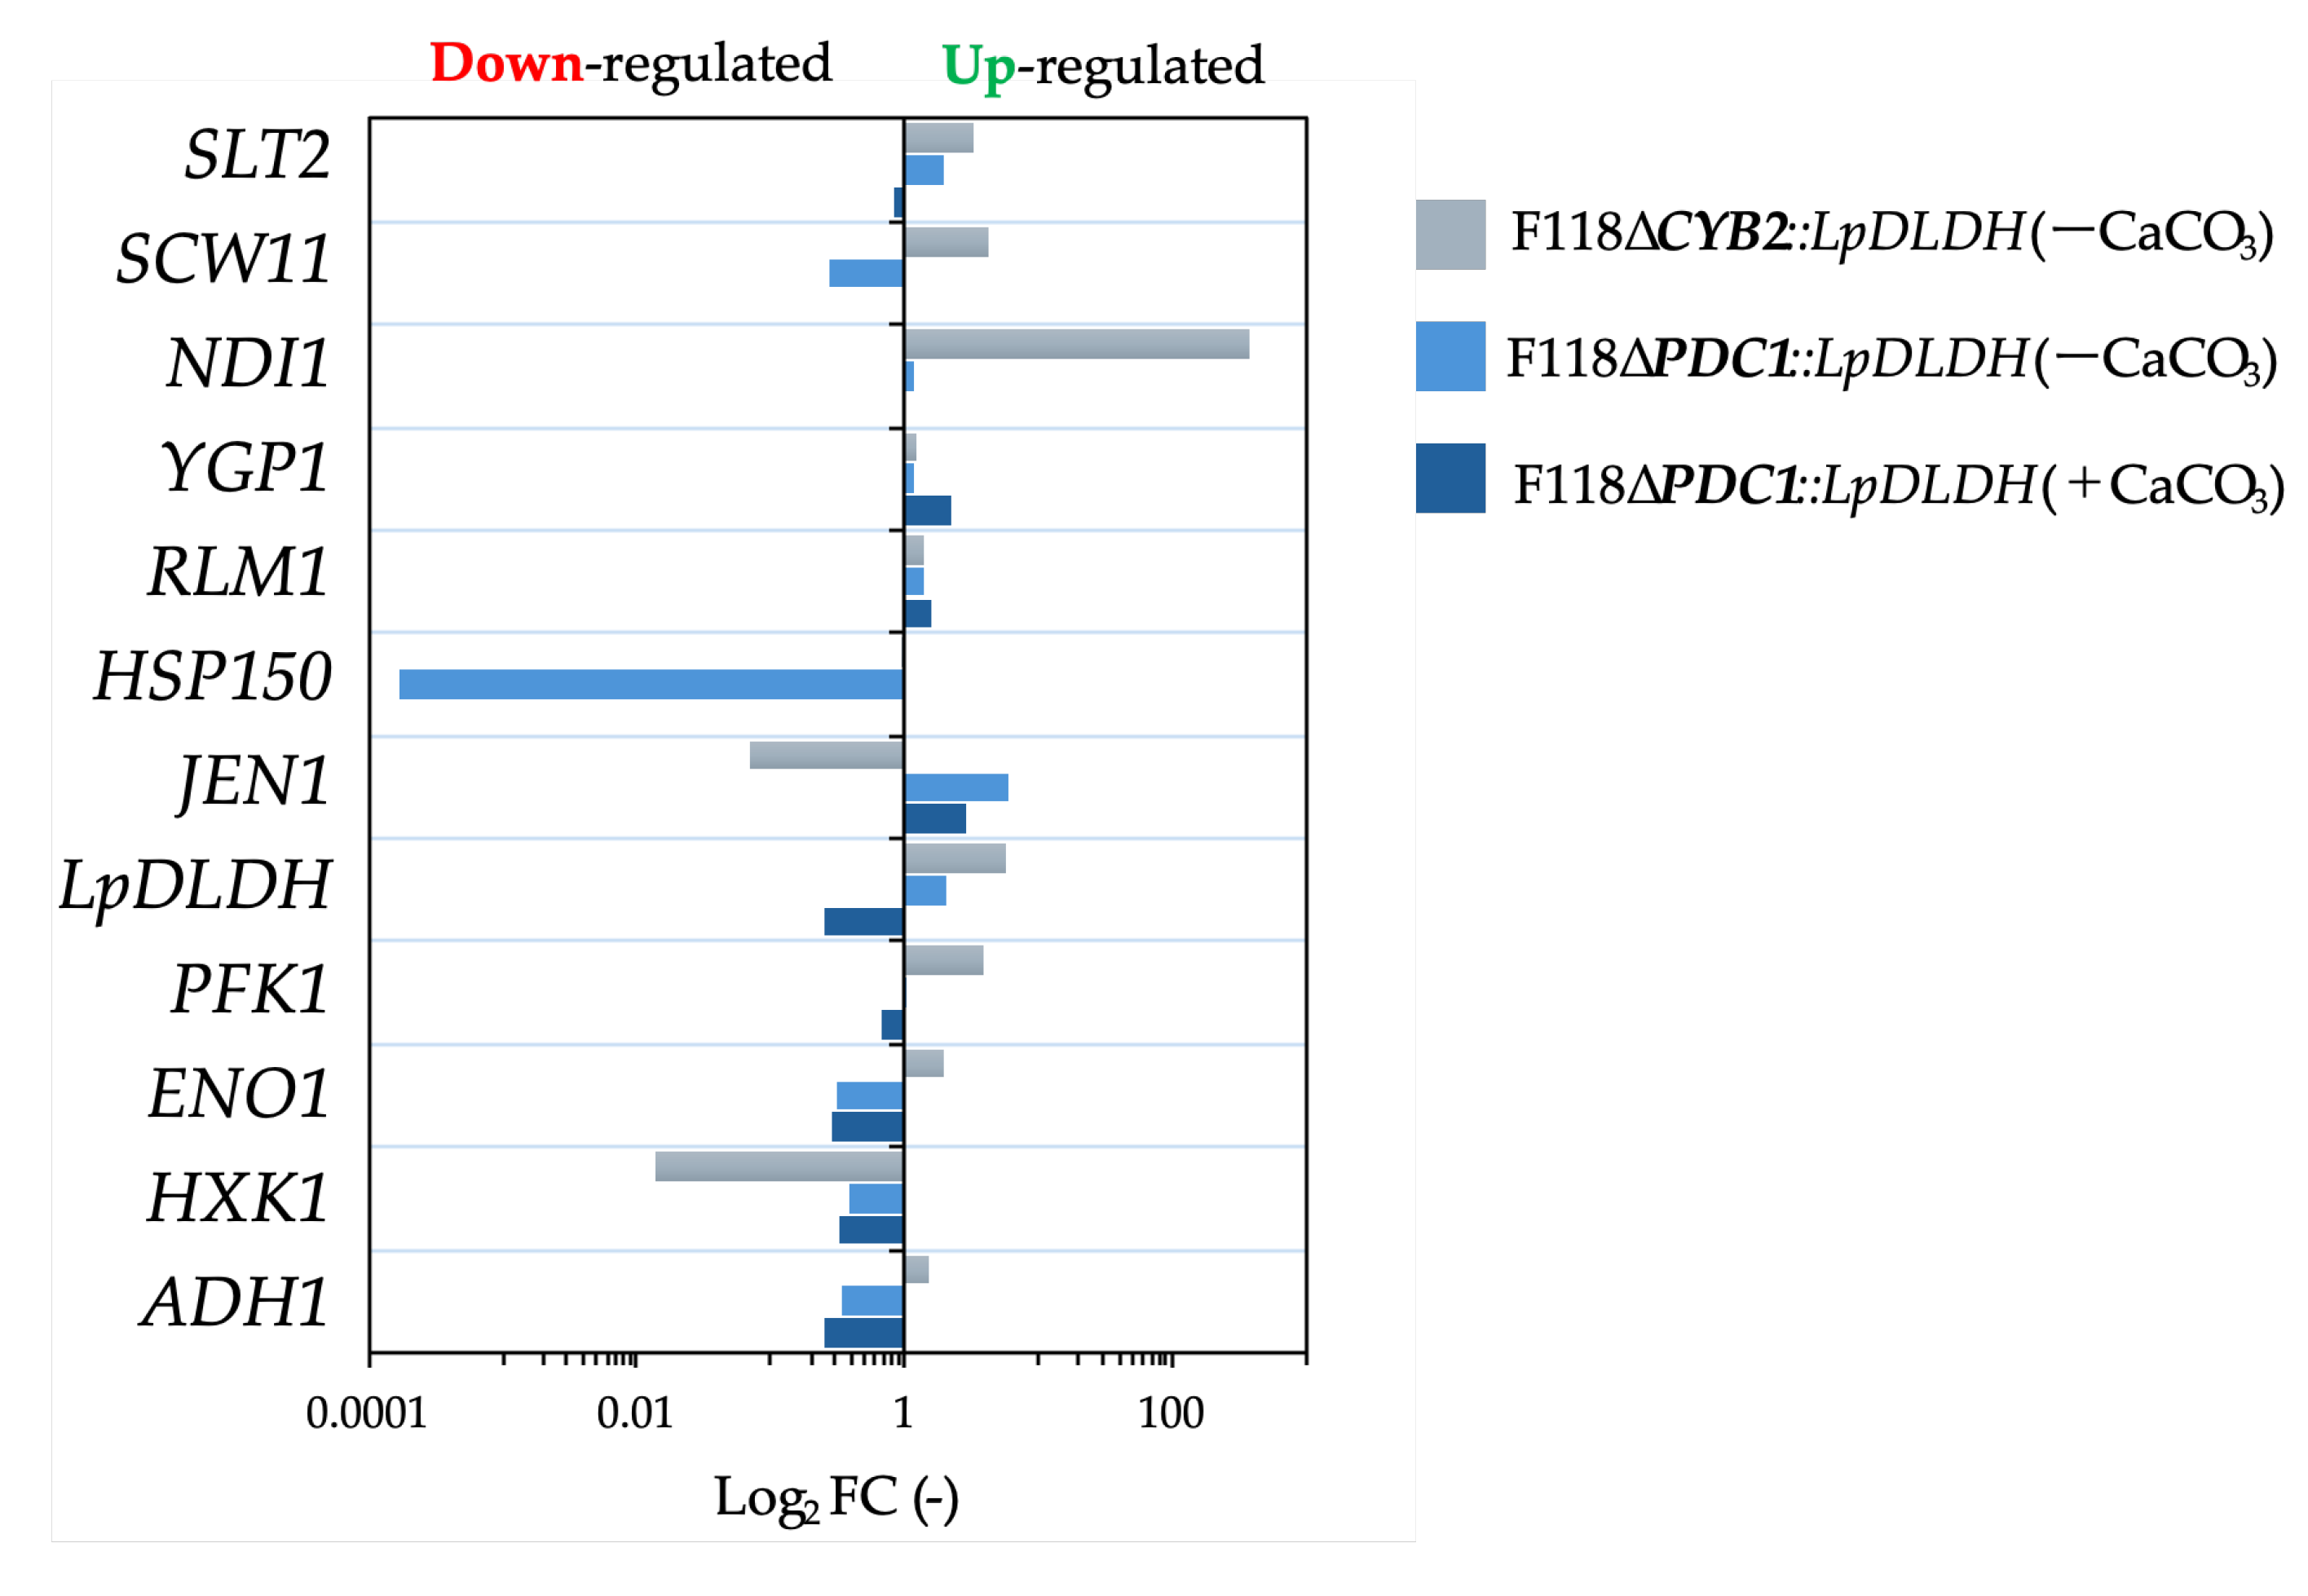
Figure 9.
Volcano plots showing differential metabolite abundance in F118∆CYB2::LpDLDH (a) and F118∆PDC1::LpDLDH (b) strains under ICCs supplementation. Log2 fold-change (ICCs vs. control) is plotted against –log10 p-value. Each point represents a metabolite detected by GC-MS. Red points indicate significantly increased metabolites, blue points indicate significantly decreased metabolites, and gray points indicate non-significant changes.
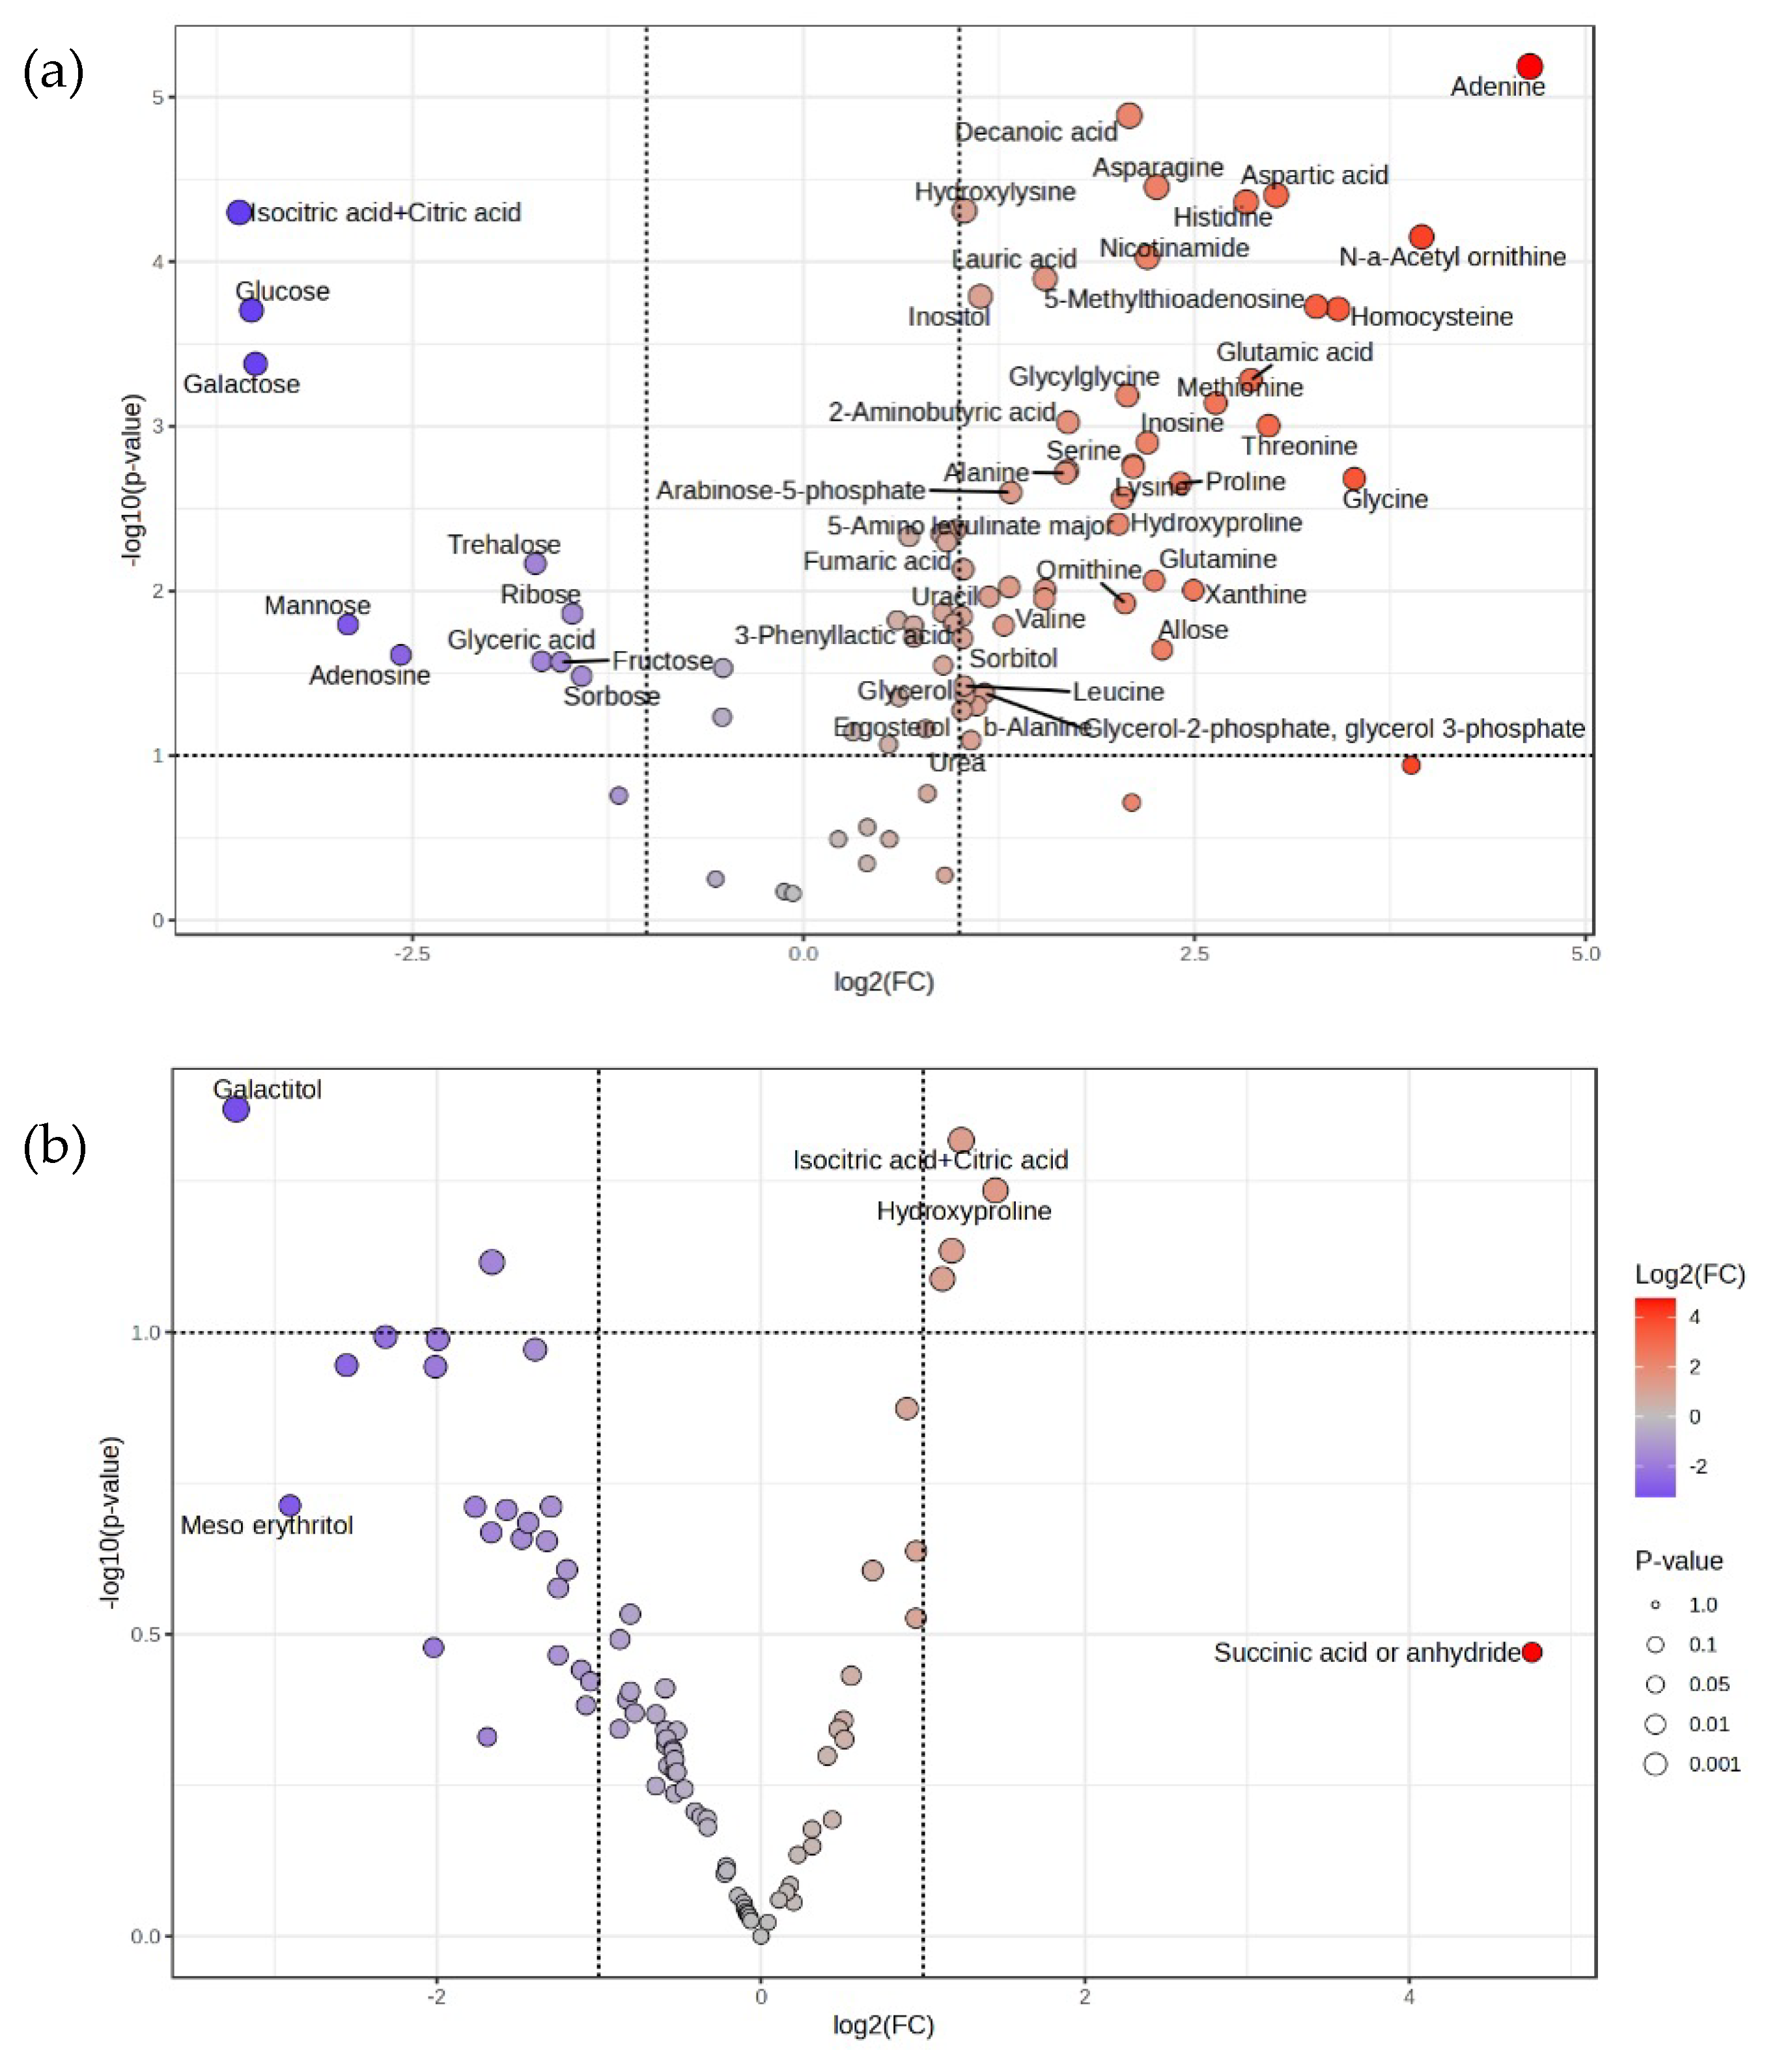
Figure 10.
Comparative intracellular metabolite profiles of S. cerevisiae F118ΔCYB2::LpDLDH and ΔPDC1::LpDLDH under inhibitory chemical-compound (ICC) stress. Relative abundances of key intermediates in the glycolysis, pentose-phosphate, and tricarboxylic-acid (TCA) cycles are presented as bar graphs for each strain grown with (+ICC) or without (–ICC) supplementation. Data represent mean ± SD of three independent fermentations. The results indicate that ICC-induced rerouting of carbon flux from glycolysis toward the TCA cycle and the acetyl-CoA node supports enhanced redox balance and D-LA production in the engineered strains.
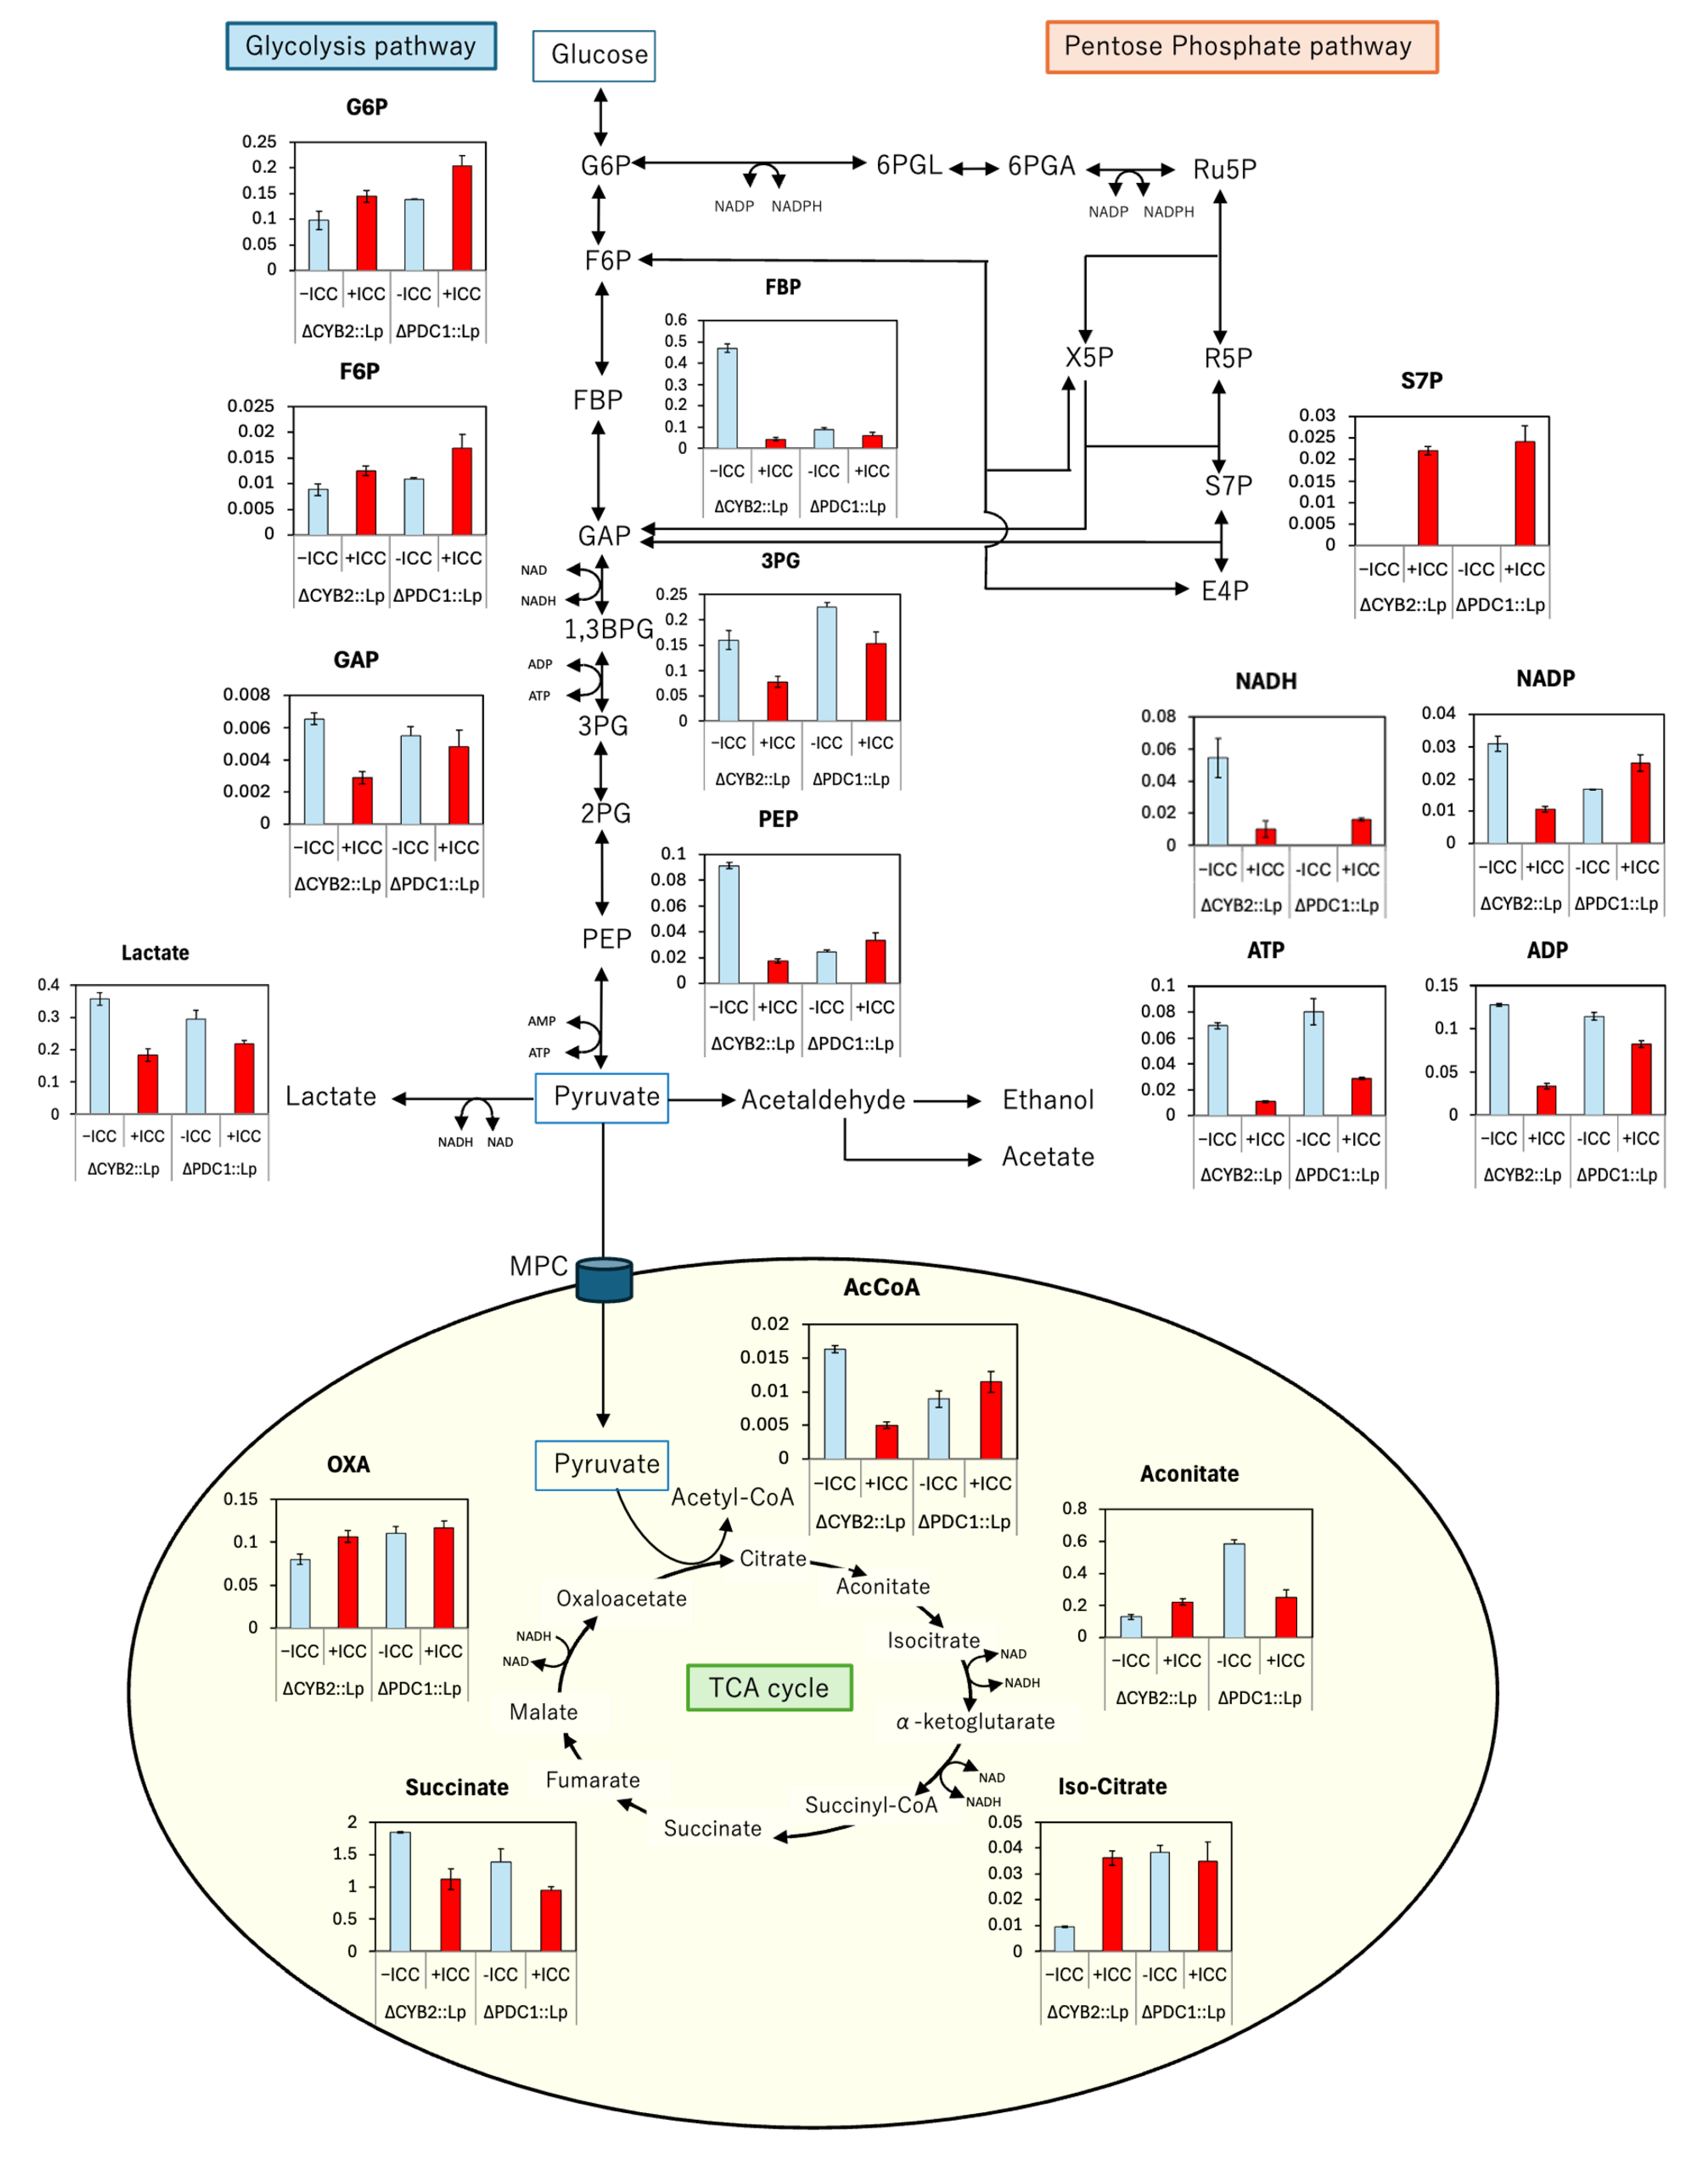
Figure 11.
Intracellular metabolite profiling of S. cerevisiae F118ΔPDC1::LpDLDH under buffered (+CaCO₃) and unbuffered (−CaCO₃) fermentation conditions. Relative metabolite abundances in the glycolysis, the pentose phosphate pathway (PPP), and the tricarboxylic acid (TCA) cycle are shown as bar graphs. Each bar represents the mean ± SD of three biological replicates. CaCO₃ supplementation increased the levels of glycolytic intermediates (glucose-6-phosphate, fructose-1,6-bisphosphate), PPP metabolites (6-phosphogluconate, ribulose-5-phosphate), and TCA-cycle intermediates (acetyl-CoA, citrate, succinate), indicating enhanced carbon flux, redox balance, and metabolic stability under buffered conditions during D-LA fermentation.

Disclaimer/Publisher’s Note: The statements, opinions and data contained in all publications are solely those of the individual author(s) and contributor(s) and not of MDPI and/or the editor(s). MDPI and/or the editor(s) disclaim responsibility for any injury to people or property resulting from any ideas, methods, instructions or products referred to in the content. |
© 2025 by the authors. Licensee MDPI, Basel, Switzerland. This article is an open access article distributed under the terms and conditions of the Creative Commons Attribution (CC BY) license (http://creativecommons.org/licenses/by/4.0/).
Copyright: This open access article is published under a Creative Commons CC BY 4.0 license, which permit the free download, distribution, and reuse, provided that the author and preprint are cited in any reuse.


